1H 2021 FINANCIAL REPORT
175
FINANCIAL REPORT 1H 2021
Transcript of 1H 2021 FINANCIAL REPORT

FINANCIAL REPORT
1H 2021

0303
04
06
09
1. Financials 1.1. Financial Highlights
1.2. Proportionate1 Financial Results
1.3. Capital Management
2. Legal Statements
Appendix A: Supplementary Financial Information
Appendix B: 1H 2021 Interim Financial Statements
10
15
1H 2021 FINANCIAL REPORT2 1H 2021 FINANCIAL REPORT2

1.1. FINANCIAL HIGHLIGHTS
1. FINANCIALS
Revenue
$192 million 6% CAGR
181.5171.1
191.6
1H 20211H 20201H 2019
1H 2021 revenue increase of $10 million was mainly a result of $5 million revenue contribution from 3 newly commissioned assets in 1H 2021 and projects placed into service in 1H 2020 which generated a full 6-month results in 1H 2021, $4 million increase from favorable effects of foreign exchange effects and $1 million increase from operational factors.
EBITDA for 1H 2021 was US$143 million, an increase of $4 million from 1H 2020 of which $3m was contributed by the net results of new assets commissioned in 1H 2021 and projects placed into service in 1H 2020 which generated a full 6-month results and $3 million attributable to favourable effects of foreign exchange, and offset by higher operating costs for preventive maintenance.
EBITDA
$143 million 6% CAGR
138.2126.6
142.6
1H 20211H 20201H 2019
1H 2021 FINANCIAL REPORT 3

1.2. PROPORTIONATE1 FINANCIAL RESULTS
Operating Performance
(USD in millions except margin data) For six-month period ended
30 Jun 2021 30 Jun 2020
Total Revenue 191.6 181.5
Operating expenses (49.0) (43.3)
EBITDA 142.6 138.2
Depreciation and amortisation (80.8) (75.5)
EBIT 61.8 62.7
Net interest costs (44.0) (41.8)
Other finance gain (charge) (7.7) 0.5
Other expenses (3.3) (6.9)
Development expenses (1.8) (1.5)
Tax (11.7) (9.1)
Net Income (6.7) 3.9
EBITDA margin (%) 74% 76%
Capitalisation
(USD in millions) As at
30 Jun 2021 31 Dec 2020
Euro Medium Term Note2 500.0 325.0
Foreign currency effect of cross currency swaps3 (“CCS FX”) (0.5) 23.3
Euro Medium Term Note (including CCS FX) 499.5 348.3
Corporate term loans - 142.7
Corporate RCF2 23.1 179.1
Project finance debt 1,758.3 1,701.7
Bank overdrafts 15.2 14.7
Total bank borrowings 2,296.1 2,386.5
Equity 3,525.1 3,664.8
Total Capitalisation 5,821.2 6,051.3
1H 2021 FINANCIAL REPORT4

Other Financial Data
For last twelve months ended
30 Jun 2021 31 Dec 2020
Funds from Operational Assets4 150.4 161.3
For six-month period ended
30 Jun 2021 30 Jun 2020
Capital expenditures 377.6 205.8
1 Financial results are prepared based on the proportionate accounting method where like items of assets, liabilities, income and expenses of subsidiaries and equity-accounted investees are proportionally aggregated based on Vena Energy’s economic share and adjusted to remove the accounting effects of International Financial Reporting Interpretations Committee 12 – Service Concession Arrangements. Reconciliation of key items between the Condensed Combined Interim Financial Statements and Proportionate financial results are included in Appendix A.
2 Expressed Pro-Forma to EMTN bond issuance of $175 million, priced on 30 June 2021 and settled on 8 July 2021. Bond tap proceeds of $175 million were fully utilised to repay the corporate RCF by 15 July 2021.
3 The $325 million EMTN were swapped to JPY via cross currency swaps. Foreign currency effect of cross currency swaps (CCS) is determined using the difference of the JPY notional of the CCS translated to USD at the prevailing FX rate as of the reporting date and the USD notional of the Green Bond.
4 Refer to Appendix A for the definition of Funds from Operational Assets (“FFOA”) and breakdown of FFOA by jurisdiction.
1H 2021 FINANCIAL REPORT 5

1.3. CAPITAL MANAGEMENT
PROJECT FINANCE DEBT
EURO MTN
EQUITY
CORPORATE RCF $5.8B
$1,758M
$500M2
$3,525M
$23M2
Euro Medium Term Note ( $152 million vs Dec 2020)In June 2021, Vena Energy priced a $175 million tap of its 3.133% fixed rate senior unsecured Green Notes maturing in February 2025 (“Green Notes”), achieving a benchmark size of $500 million. The settlement of the $175 million tap occurred on 8 July 2021. The Green Notes, rated BBB- by S&P Global Ratings and A- by the Japan Credit Rating Agency, are issued under the Vena Energy’s US$1 billion Euro Medium-Term Note Programme (“EMTN”) established in November 2019.
The proceeds of the $175 million tap issuance were fully utilised to repay the outstanding corporate RCF for the development, construction and operation of Eligible Green Projects in accordance with Vena Energy’s Green Financing Framework.
Corporate RCF ( $156 million vs Dec 2020)In May 2021, Vena Energy amended and restated the terms of its committed corporate revolving credit facility (“RCF”) and introduced sustainability-linked features in the facility. The size of the JPY denominated RCF was expanded from JPY 33.4 billion (~$301 million) to JPY 52.8 billion (~$476 million) and its tenor was extended by 17 months to June 2024. The margin of the RCF was also reduced from 125 basis points to 95 basis points, with the potential to accomplish a further margin reduction if certain sustainability-related key performance indicators (“KPIs”) are jointly achieved, or a margin increase in case all the KPIs are jointly missed.
The decrease in drawn Corporate RCF of $156 million is attributable to its repayment in July 2021 using the proceeds of the $175 million EMTN tap issuance. Following the repayment, the available commitments of the corporate RCF stand at JPY 49.4 billion (~$445 million).
Project Finance Debt ( $56m vs Dec 2020)Vena Energy’s projects are financed through non-recourse project finance debt, and generally amortising over time with long-term maturities and sculpted repayment profiles based on the projects’ long-term contracted cashflows. In 1H 2021, excluding the effects of foreign exchange of $68 million, Vena Energy has drawn approximately $200 million project finance debt across various projects in its portfolio in Australia, India, Japan and Taiwan, and repaid approximately $76m of scheduled amortisation.
CAPITAL STRUCTURE
1H 2021 FINANCIAL REPORT6

(USD in millions except margin data)
30 Jun 2021 31 Dec 2020
Funds from Operational Assets (“FFOA”)5 150.4 161.3
Euro Medium Term Note2 500 325.0
Foreign currency effect of cross currency swaps3 (“CCS FX”) (0.5) 23.3
Euro Medium Term Note (including CCS FX) 499.5 348.3
Corporate term loans - 142.7
Corporate RCF2 23.1 179.1
Corporate Gross Debt 522.6 670.1
Less: Corporate Cash & Cash Equivalents (100.1) (83.2)
Less: Contribution from Equity Holders6 - (350.0)
Corporate Net Debt 422.5 236.9
Corporate Net Debt to FFOA 2.8x 1.5x
Leverage Ratio
5 FFOA is presented as last twelve months ended the relevant period. 6 The capital contribution was approved by equity holders in December 2020, and received by Vena Energy in February 2021.
Diversified Funds from Operational Assets
Taiwan
Austalia
Japan
Indonesia
Thailand
India
Philippines
FY2020 LTM JUN-2021
$161m $150m40%
11%
11%
40%
7%6%
10%
7%
32%29%
<1% 1%2% 2%
Vena Energy generated an FFOA of $150 million for the last twelve months ended 30 Jun 2021, diversified across 7 geographies and 61 individual operating assets.
LTM Jun 2021 FFOA of $150m represents a 7% reduction compared to FY2020 mainly due to:
• performance of the Indian portfolio resulting in 4% reduction in FFOA; and• non-recurring business interruptions in Japan due to weather and connection disruptions resulting in 3% decrease in FFOA.
These business interruptions are undergoing insurance claims and are potentially recoverable, subject to claims approval.
1H 2021 FINANCIAL REPORT 7

(USD in millions) As at
30 Jun 2021 31 Dec 2020
Available Corporate RCF7 445.4 130.9
Corporate Cash & Cash Equivalents 100.1 83.2
Contribution from Equity Holders5 - 350.0
Liquidity 545.5 564.1
Liquidity Position
7 Expressed pro-forma to repayment of corporate RCF in July 2021 using the EMTN tap issuance proceeds of $175million which was priced on 30 June 2021 and settled on 8 July 2021.
Our liquidity position remains robust, with over $500 million of total available liquidity, including the committed corporate RCF.
1H 2021 FINANCIAL REPORT8

2. LEGAL STATEMENTSBy their nature, forward-looking statements involve risks and uncertainties because they relate to events and depend on circumstances that may or may not occur in the future. These forward-looking statements speak only as at the date as of which they are made, and Vena Energy expressly disclaims any responsibility, and undertakes no obligation, to update or revise any forward-looking statements contained herein to reflect any change in Vena Energy’s expectations with regard thereto or any change in events, conditions or circumstances on which any such statements are based. Forward-looking statements contained in this report regarding past trends or activities should not be taken as a representation that such trends or activities will continue in the future.
Neither Vena Energy, nor any of their respective agents, employees or advisers intends or has any responsibility, duty or obligation to supplement, amend, update or revise any of the forward-looking statements contained in this report.
This report includes measures of financial performance which are not a measure of financial performance under International Financial Reporting Standards (“IFRS”), such as “EBITDA”, “LCOE”, “Proportionate EBITDA”, “Proportionate EBITDA Margins”, “Net Debt” and “Funds from Operational Assets” (together, the “Non-IFRS Measures”). These Non-IFRS Measures are presented because Vena Energy believes they are useful measures to reflect its financial condition and historical ability to provide investment returns. The Non-IFRS Measures and other measures of financial performance presented in this report are supplemental financial measures, and should not be considered as an alternative to cash flows from operating activities, a measure of liquidity or an alternative to net profit or indicators of Vena Energy’s operating performance on any other measure of performance derived in accordance with IFRS. Because the Non-IFRS Measures are not IFRS measures they may not be comparable to similarly titled measures presented by other companies.
The information contained in this report is provided as at the date of this document and is subject to change without notice.
This report is for information purposes only and may contain data sourced from and the views of independent third parties. In replicating such data in this report, Vena Energy has not independently verified any of such data and there can be no assurance as to the accuracy or completeness of such data. Accordingly, Vena Energy makes no representation (whether express or implied) as to, and no reliance should be placed on, the accuracy or completeness of such data, information or opinions contained in this report. The replication of any views in this report should be not treated as an indication that Vena Energy agrees with or concurs with such views. It is not Vena Energy’s intention to provide, and you may not rely on these materials as providing, a complete or comprehensive analysis of Vena Energy’s financial or trading position or prospects.
This report does not constitute or form part of and should not be construed as, an offer to sell or issue or the solicitation of an offer to buy or acquire securities of Vena Energy Capital Pte. Ltd., Vena Energy Holdings Ltd., Vena Energy (Taiwan) Holdings Ltd., Zenith Japan Holdings Ltd. (together, “Vena Energy”) or any of their respective subsidiaries or affiliates in any jurisdiction or an inducement to enter into investment activity. Any decision to purchase securities in the context of a proposed offering to be undertaken in the future by Vena Energy, if any, should be made on the basis of information contained in the offering document published in relation to such an offering. No part of this document, nor the fact of its distribution, should form the basis of, or be relied on in connection with, any contract or commitment or investment decision whatsoever. No representation, warranty or undertaking, express or implied, is made as to, and no reliance should be placed on, the fairness, accuracy, completeness or correctness of the information or the opinions contained herein. None of Vena Energy or any of their affiliates, advisers or representatives shall have any liability whatsoever (in negligence or otherwise) for any loss howsoever arising from any use of this document or its contents or otherwise arising in connection with the document. This report contains “forward-looking statements”, which include all statements other than statements of historical facts, including, without limitation, any statements preceded by, followed by or that include forward-looking terms such as “targets”, “believes”, “expects”, “plans”, “intends”, “anticipates”, “projects”, “aims”, “seeks”, “may”, “will”, “would”, “should”, “could” or similar expressions or the negative thereof. However, these words are not exclusive means of identifying forward-looking statements. Such forward-looking statements involve known and unknown risks, uncertainties and other important factors beyond Vena Energy’s control that could cause the actual results, performance or achievements of Vena Energy to be materially different from any future results, performance or achievements expressed or implied by such forward-looking statements, including, among others, financial forecasts, profit projections, the achievement of anticipated levels of profitability, growth, cost and synergy of recent acquisitions, the impact of competitive pricing, the ability to obtain necessary regulatory approvals and licenses, the impact of developments in the economic, political and legal environment of Singapore and other jurisdictions in which Vena Energy operates, volatility in stock markets or in the price of Vena Energy’s securities, financial risk management and the impact of general business and global economic conditions. You are cautioned not to place any reliance on these forward-looking statements.
Such forward-looking statements are based on numerous assumptions regarding Vena Energy’s present and future business strategies and the environment in which Vena Energy will operate in the future. Any opinions expressed in this report are subject to change without notice and may differ, or be contrary to, opinions expressed by other business areas or groups of Vena Energy as a result of using different assumptions and criterion.
1H 2021 FINANCIAL REPORT 9

as Vena Energy believes they are useful supplements to its financial data presented under IFRS, as measures of Vena Energy’s financial and operating performance as well as measures of its assets’ ability to generate cash from operations. In particular, as assets located in the Philippines are defined as associates under IFRS, among other things, revenues from these renewable energy generation assets and project finance debt are not consolidated but are instead accounted for using the equity method of accounting under “share of net profit/(loss) of equity-accounted investees” in the Condensed Combined Interim Financial Statements. Accordingly, the Condensed Combined Interim Financial Statements does not reflect the revenue and debt of these equity-accounted investees, which are however included in the non-IFRS financial and other operating data.
The following non-IFRS financial and other operating data should be read in conjunction with the Condensed Combined Interim Financial Statements and the Interim Financial Statements included in Appendix B.
The non-IFRS financial and other operating data set out in “Key Non-IFRS Financial Data” section which has been derived from the Condensed Combined Interim Financial Statements and the Interim Financial Statements1 of Vena Energy Holdings Ltd, Vena Energy (Taiwan) Holdings Ltd and Zenith Japan Holdings Trust (each a “Vena Entity” and together, the “Vena Entities”), and management schedules, where applicable, are supplemental financial measures and are not presented in accordance with International Financial Reporting Standards (“IFRS”) or generally accepted accounting principles in other countries, including the United States. Accordingly, these data should not be considered in isolation from, or as a substitute for, the analysis of the financial condition or results of operations of Vena Energy, as reported under IFRS.
The following non-IFRS financial data, namely Proportionate Revenue, Proportionate EBITDA, Proportionate EBITDA Margin, Corporate Net Debt, Funds from Operational Assets (“FFOA”) and Corporate Net Debt to FFOA, as well as other operating data, are presented below
1 “Interim Financial Statements” is defined as the condensed interim financial statements of Vena Energy Holdings Ltd and its subsidiaries, the condensed interim financial statements of Vena Energy (Taiwan) Holdings Ltd and its subsidiaries and the condensed interim financial statements of Zenith Japan Holdings Trust and its subsidiaries for the six months period ended 30 June 2021. The Interim Financial Statements for the six month period ended 30 June 2021 were prepared in accordance with International Accounting Standard 34 Interim Financial Reporting issued by the International Accounting Standards Board and reviewed by an independent auditor in accordance with the International Standards on Review Engagements.
APPENDIX A: SUPPLEMENTARY FINANCIAL INFORMATION
1H 2021 FINANCIAL REPORT10

Key Non-IFRS Financial Data
(USD in millions except margin data) Six Months Ended
30 Jun 2021 31 Dec 2020
Proportionate Revenue(a) 191.6 181.5
Proportionate EBITDA(b) 142.6 138.2
Proportionate EBITDA Margin(c) 74% 76%
As of
30 Jun 2021 31 Dec 2020
Corporate Net Debt(d) 422.5 236.9
Funds from Operational Assets (“FFOA”)(e) 150.4 161.3
Corporate Net Debt to FFOA(f) 2.8x 1.5x
(a) Proportionate Revenue is a non-IFRS financial measure and represents total income plus proportionate total income from equity-accounted investees less service concession income and total income attributable to non-controlling interests.
(b) Proportionate EBITDA is a non-IFRS financial measure and represents Adjusted EBITDA less Adjusted EBITDA of non-controlling interest and share of results of equity-accounted investees, and plus EBITDA of equity-accounted investees. Adjusted EBITDA is a non-IFRS financial measure and represents operating profits before development costs, depreciation and amortisation expense, net finance costs, tax expense and other exceptional items (as itemised in the ‘Reconciliation of Profit/(Loss) for the Period to Adjusted EBITDA and Proportionate EBITDA’ table).
(c) Proportionate EBITDA Margin is a non-IFRS financial measure and represents Proportionate EBITDA for the relevant period divided by Proportionate Revenue for the same relevant period.
(d) Corporate Net Debt is a non-IFRS financial measure and represents the aggregate third party debt of Vena Entities on a unconsolidated or standalone basis less the aggregated cash & cash equivalents of Vena Entities on a unconsolidated or standalone basis less the aggregated amount due from Unitholders of Vena Entities on a unconsolidated or standalone basis.
(e) FFOA is presented as last twelve months ended the relevant period.(f) Corporate Net Debt to FFOA is a non-IFRS financial measure and represents an indicator of the ability of the Vena Entities to cover their outstanding Corporate Net
Debt from the funds generated by the Operational Assets. Corporate Net Debt to FFOA is calculated by dividing Corporate Net Debt over FFOA.
1H 2021 FINANCIAL REPORT 11

Reconciliation of Profit/(Loss) for the Period to Adjusted EBITDA and Proportionate EBITDA
(USD in millions) Six Months Ended
30 Jun 2021 30 Jun 2020
Profit/(Loss) for the Period (1.2) 9.1
Less: Service concession income − (1.1)
Add: Cost of service concession income − 1.1
Add: Development costs 1.4 1.0
Add: Depreciation and amortisation expense 64.6 60.0
Add: Net finance costs 45.8 34.6
Add: Acquisition costs 1.1 5.9
Add: Loss on disposals or write-off of assets 2.2 1.0
Less: Share of net profit of equity-accounted investees, net of tax (11.3) (5.6)
Add: Tax expense 11.6 9.1
Adjusted EBITDA 114.2 115.1
Less: Adjusted EBITDA attributable to non-controlling interest (6.8) (6.7)
Add: Adjusted EBITDA of equity-accounted investees 35.2 29.8
Proportionate EBITDA 142.6 138.2
Reconciliation of Gross Revenue to Proportionate Revenue
(USD in millions except margin data) Six Months Ended
30 Jun 2021 30 Jun 2020
Revenue 153.5 150.9
Other income 5.3 1.9
Total income 158.8 152.8
Less: Service concession income - (1.1)
Less: Total income attributable to non-controlling interest (7.1) (7.2)
Add: Total income of equity-accounted investees 39.9 37.0
Proportionate Revenue 191.6 181.5
Reconciliation of Combined Financial Results to Proportionate Financial Results
1H 2021 FINANCIAL REPORT12

attributable to Vena Energy plus cash flows received from proportionate interest income and after deducting cash flows to (a) repay any proportionate scheduled principal amounts under any debt or financing arrangement of the Operational Assets, (b) pay any proportionate interest or any other financing expense on any debt or financing arrangement of the Operational Assets, (c) pay any proportionate obligations in connection with the hedging arrangements for the debt or financing arrangement, (d) pay any lease liabilities obligations and (e) pay any proportionate corporate income taxes.
In compiling the Funds from Operational Assets, selected items of income, expenses and cash flows of each Operational Asset within the same geography were aggregated and presented in the following tables.
The following tables present the Funds from Operational Assets of Vena Energy for the last twelve months ended 30 June 2021 and 31 December 2020.
Funds from Operational Assets represents an indicator of recurring funds generated by the Operational Assets that can be used for servicing the corporate net debt, committed and discretionary capital expenditure, development costs and working capital. “Operational Asset” means a subsidiary or equity-accounted investee of Vena Energy which holds the legal and economic interest in a renewable generation facility that is commissioned and capable of generating electricity.
Funds from Operational Assets is a non-IFRS financial measure and represents proportionate results from Operational Assets
Funds from Operational Assets
(USD in millions) Australia India Indonesia Japan Philippines Taiwan Thailand Total
LAST TWELVE MONTHS ENDED 30 JUNE 2021
Revenue 13.9 88.9 36.2 98.4 87.2 17.3 47.3 389.3
Less: Operating Expenses
- Operation and maintenance costs (1.2) (10.5) (2.2) (6.4) (4.4) (1.0) (1.3) (27.0)
- Asset management & shared service fees
(0.3) (3.7) (2.1) (3.7) (2.1) (3.1) (1.1) (16.1)
- Business related taxes - (0.1) (0.1) (6.6) (3.8) - - (10.7)
- Land rent and occupancy costs - (0.1) (0.4) (0.4) (0.2) (0.1) - (1.2)
- General and administrative expenses
(0.6) (5.5) (3.3) (4.1) (4.9) (1.3) (1.5) (21.2)
Results from Operational Assets(a) 11.8 69.0 28.1 77.2 71.8 11.8 43.4 313.1
Less: Share of economic interest attributable to other shareholder(b) - - - - (0.9) - (13.1) (14.0)
Proportionate results from Operational Assets
11.8 69.0 28.1 77.2 70.9 11.8 30.3 299.1
Add: Interest income received(c) - 2.6 - - 0.1 - - 2.7
Less: Debt service(d) and tax payments
(10.5) (61.0) (17.1) (16.6) (22.8) (8.8) (14.6) (151.4)
Funds from Operational Assets(e) 1.3 10.6 11.0 60.6 48.2 3.0 15.7 150.4
1H 2021 FINANCIAL REPORT 13

(a) “Results from Operational Assets” is defined as revenue (which includes other income but excludes service concession income, if any) less operating expenses but excludes cost of service concession income, depreciation and amortisation expense, finance income, finance costs, change in fair value of financial derivates, foreign exchange gain or loss, impairment loss, loss on disposal of property plant and equipment and tax expense of all Operational Assets. Results from Operational Assets excludes the major income statement items: (1) service concession income, (2), cost of service concession income, (3) depreciation and amortisation expense, (4) finance income and finance costs, (5) change in fair value of financial derivatives, (6) foreign exchange gain/(loss) and (7) tax expense.
(b) Share of economic interest attributable to other shareholder represents the results from Operational Assets attributable to the other equity holder(s) who is unrelated to Vena Energy based on its effective economic interest in the relevant subsidiaries or associates of Vena Energy.
(c) Interest income received represents the Vena Entities’ proportionate economic share of cash received by the Operational Assets from interest income. Such interest income comprises mainly interest income from bank deposits and/or mutual funds placements.
(d) Debt service payments represents the Vena Entities’ proportionate economic share of cash paid by the Operational Assets for interest expense of project finance debt, any obligations in connection with the hedging arrangements related to project finance debt and repayment of scheduled amortisation of project finance debt. Cash paid in connection with prepayment of project finance debt for refinancing purposes and one-off transaction costs related to project finance debt are excluded.
(e) Funds from Operational Assets has been compiled based on the group reporting package of each Operational Asset (as defined above) used for the purposes of preparing the Interim Financial Statements, or management schedules, where applicable. Funds from Operational Assets excludes the following major cash flow items: (1) changes in working capital, (2) cash prepayment of project finance debt which was refinanced or restructured, (3) proceeds from drawdown of project finance debt, (4) transaction costs related to project finance debt and (5) contribution from and distribution to equity holders.
(USD in millions) Australia India Indonesia Japan Philippines Taiwan Thailand Total
YEAR ENDED 31 DECEMBER 2020
Revenue 12.6 85.1 35.5 98.2 86.2 15.4 47.4 380.4
Less: Operating Expenses
- Operation and maintenance costs (1.1) (10.1) (2.1) (5.8) (5.1) (0.9) (1.3) (26.4)
- Asset management & shared service fees
(0.3) (3.4) (2.1) (4.0) (3.1) (3.2) (1.1) (17.2)
- Business related taxes - - (0.1) (5.6) (3.8) - - (9.5)
- Land rent and occupancy costs - (0.1) (0.4) (0.3) (0.1) (0.1) - (1.0)
- General and administrative expenses
(1.3) (4.8) (3.3) (3.8) (4.3) (1.4) (1.5) (20.4)
Results from Operational Assets(a) 9.9 66.7 27.5 78.7 69.8 9.8 43.5 305.9
Less: Share of economic interest attributable to other shareholder(b) - - - - (0.8) - (13.1) (13.9)
Proportionate results from Operational Assets
9.9 66.7 27.5 78.7 69.0 9.8 30.4 292.0
Add: Interest income received(c) - 2.2 - - 0.4 - - 2.6
Less: Debt service(d) and tax payments
(9.6) (50.8) (17.4) (14.2) (22.1) (6.0) (13.2) (133.3)
Funds from Operational Assets(e) 0.3 18.1 10.1 64.5 47.3 3.8 17.2 161.3
1H 2021 FINANCIAL REPORT14

APPENDIX B: 1H 2021 INTERIM FINANCIAL STATEMENTS
the International Accounting Standards Board and included in this document. Readers of the Condensed Combined Interim Financial Statements who are not familiar with International Financial Reporting Standards are urged to consult with their own professional advisers. The Condensed Combined Interim Financial Statements reflects certain estimates, assumptions and judgements made by Vena Energy. These estimates, assumptions and judgements affect the reported amounts of assets and liabilities as of the dates presented as well as revenue and expenses reported for the periods presented. As a result, the Condensed Combined Interim Financial Statements is not necessarily indicative of what Vena Energy’s actual results of operations, financial position and cash flow would have been on or as of such dates, nor does it purport to project Vena Energy’s results of operations, financial position or cash flows for any future period or date.
The Condensed Combined Interim Financial Statements has been prepared for illustrative purposes only and does not represent Vena Energy’s actual consolidated financial condition or results of operations, and is not intended to be indicative of Vena Energy’s future financial condition and results of operations, and is not intended to be indicative of Vena Energy’s future financial condition and results of operations. The adjustments set forth in the Condensed Combined Interim Financial Statements are based upon available information and assumptions that Vena Energy’s management believes to be reasonable.
The Condensed Combined Interim Financial Statements (as defined herein) included in this document has been prepared in order to present the (a) combined statements of financial position of Vena Entities as at 30 Jun 2021, (b) combined statements of comprehensive income of Vena Entities for the six-month period ended 30 June 2021, and (c) combined statements of cash flows of Vena Entities for the six-month period ended 30 June 2021 (together with the notes comprising a summary of significant accounting policies and other explanatory information, the “Condensed Combined Interim Financial Statements”). The Condensed Combined Interim Financial Statements has been prepared to fulfil our obligations under paragraph 5(b) under the “Terms and Conditions of the Notes” pursuant to our US$1,000,000,000 Guaranteed Euro Medium Term Note Programme and our obligations under Rule 323 of the Listing Manual of the Singapore Exchange Securities Trading Limited.
The Condensed Combined Interim Financial Statements is intended to supplement, and should be read in conjunction with, the Interim Financial Statements of Vena Energy Holdings Ltd and its subsidiaries, consolidated financial statements of Vena Energy (Taiwan) Holdings Ltd and its subsidiaries and the consolidated financial statements of Zenith Japan Holdings Trust and its subsidiaries for the six-month ended 30 June 2021, which were prepared in accordance with International Accounting Standard 34 Interim Financial Reporting issued by
1H 2021 FINANCIAL REPORT 15

KPMG LLP (Registration No. T08LL1267L), an accounting limited liability partnership registered in Singapore under the Limited Liability Partnership Act (Chapter 163A) and a member firm of the KPMG global organization of independent member firms affiliated with KPMG International Limited, a private English company limited by guarantee.
Vena Energy Holdings Ltd and its subsidiaries Vena Energy (Taiwan) Holdings Ltd and its subsidiaries
Zenith Japan Holdings Trust and its subsidiaries
Condensed Combined Interim Financial Statements
For the six months ended 30 June 2021

KPMG LLP
16 Raffles Quay #22-00
Hong Leong Building
Singapore 048581
Telephone +65 6213 3388
Fax +65 6225 0984
Internet www.kpmg.com.sg
1
KPMG LLP (Registration No. T08LL1267L), an accounting limited liability partnership registered in Singapore under the Limited Liability Partnership Act (Chapter 163A) and a member firm of the KPMG global organization of independent member firms affiliated with KPMG International Limited, a private English company limited by guarantee.
Independent auditors’ report
Board of Directors
Vena Energy Pte Ltd
Report on review of Condensed Combined Interim Financial Statements
Introduction
We have reviewed the accompanying Condensed Combined Interim Financial Statements of
Vena Energy Holdings Ltd, Vena Energy (Taiwan) Holdings Ltd and Zenith Japan Holdings Trust
and their subsidiaries (“Vena Energy Group”), the condensed combined statement of financial
position as at 30 June 2021 and the condensed combined statements of profit or loss and other
comprehensive income, changes in equity and cash flows for the six month period then ended,
and significant accounting policies and other explanatory notes (the Condensed Combined
Interim Financial Statements). Management of Vena Energy Pte Ltd is responsible for the
preparation and presentation of the Condensed Combined Interim Financial Statements in
accordance with the basis of preparation set out in Note 3 of the Condensed Combined Interim
Financial Statements (the “Basis of Preparation”). Our responsibility is to express a conclusion on
the Condensed Combined Interim Financial Statements based on our review.
Scope of review
We conducted our review in accordance with International Standard on Review Engagements
2410 Review of Interim Financial Information Performed by the Independent Auditor of the
Entity. A review of interim financial statements consists of making inquiries, primarily of persons
responsible for financial and accounting matters, and applying analytical and other review
procedures. A review is substantially less in scope than an audit conducted in accordance with
International Standards on Auditing and consequently does not enable us to obtain assurance that
we would become aware of all significant matters that might be identified in an audit.
Accordingly, we do not express an audit opinion.
Conclusion
Based on our review, nothing has come to our attention that causes us to believe that the
accompanying Condensed Combined Interim Financial Statements as at and for the six months
ended 30 June 2021 are not prepared, in all material respects, in accordance with the Basis of
Preparation.


Vena Energy Holdings Ltd and its subsidiaries
Vena Energy (Taiwan) Holdings Ltd and its subsidiaries
Zenith Japan Holdings Trust and its subsidiaries
Condensed Combined Interim Financial Statements
For the six months ended 30 June 2021
FS1
The accompanying notes form an integral part of the condensed combined interim financial statements.
Condensed combined statement of financial position As at 30 June 2021
Note30 June
2021 31 December
2020 US$’000 US$’000
Assets Property, plant and equipment 7 2,184,941 1,954,001 Right-of-use assets 8 334,611 326,729 Intangible assets 9 2,343,002 2,475,047 Equity-accounted investees 10 504,966 493,918 Other investments 6,405 2,433 Deferred tax assets 8,949 9,197 Loans receivables 11 27,559 40,594 Derivative assets 13 166,238 176,353 Prepayments and other assets 14 27,798 16,108 Trade and other receivables 15 46,613 31,210
Non-current assets 5,651,082 5,525,590
Loans receivables 11 19,469 20,152 Trade and other receivables 15 154,972 487,700 Prepayments and other assets 14 16,094 17,711 Derivative assets 13 8,394 7,379 Cash and cash equivalents 12 332,358 340,469
Current assets 531,287 873,411
Total assets 6,182,369 6,399,001
Equity Equity contribution and units in issue 3,404,399 3,404,399 Retained earnings 58,881 65,565 Reserves 28 61,824 194,818
Equity attributable to owners of the Holding Companies 3,525,104 3,664,782 Non-controlling interests 83,122 84,593
Total equity 3,608,226 3,749,375
LiabilitiesLoans and borrowings 16 1,909,899 1,951,458 Lease liabilities 16 318,249 306,626 Employee benefits 695 716 Trade and other payables 17 1,916 2,082 Derivative liabilities 13 25,743 41,865 Asset retirement obligation 35,650 37,486 Deferred tax liabilities 23,524 17,613
Non-current liabilities 2,315,676 2,357,846
Loans and borrowings 16 111,276 150,889 Lease liabilities 16 13,307 11,014 Derivative liabilities 13 3,049 6,957 Trade and other payables 17 130,165 121,078 Current tax liabilities 670 1,842
Current liabilities 258,467 291,780
Total liabilities 2,574,143 2,649,626
Total equity and liabilities 6,182,369 6,399,001
___________________________Nitin Srinivas Apte Director, Vena Energy Pte Ltd
__________________________Rupert Charles Collinson Hall Director, Vena Energy Pte Ltd

Vena Energy Holdings Ltd and its subsidiaries
Vena Energy (Taiwan) Holdings Ltd and its subsidiaries
Zenith Japan Holdings Trust and its subsidiaries
Condensed Combined Interim Financial Statements
For the six months ended 30 June 2021
FS2
The accompanying notes form an integral part of the condensed combined interim financial statements.
Condensed combined statements of profit or loss and other comprehensive income For the six months ended 30 June 2021
Six months period ended
Note 30 June
2021 30 June
2020 US$’000 US$’000
Sale of energy 153,468 145,545 Service concession income – 1,119 Fee income 3,937 4,249
Total revenue 18 157,405 150,913
Other income 19 1,399 1,872
Cost of service concession income – (1,119) Operating costs 20 (25,843) (21,622) Shared services costs 21 (18,761) (14,976) Development costs 22 (1,440) (963) Depreciation expense 7,8 (36,968) (34,104) Amortisation expense 9 (27,576) (25,897)
Results from operating activities (110,588) (98,681)
Finance income 23 6,763 6,483 Finance costs 23 (44,993) (40,780) Change in fair value of financial derivatives 24 (16,063) 15,630 Foreign exchange gain/(loss) 8,461 (15,902)
Net finance costs (45,832) (34,569)
Acquisition costs (1,131) (5,938) Loss on disposal of investments – (443) Loss on disposal of interest in equity-accounted investee – (435) Write-off of project costs previously capitalised (1,992) – Write-off of property, plant and equipment – (95) Gain on disposal of property, plant and equipment 5 – Impairment loss on financial assets (181) (30) Share of net profit of equity-accounted investees, net of tax 10 11,342 5,638
Profit before tax 25 10,427 18,232 Tax expense (11,616) (9,122)
(Loss)/Profit for the period (1,189) 9,110
(Loss)/Profit attributable to:Owners of the Holding Companies (6,684) 3,917 Non-controlling interests 5,495 5,193
(1,189) 9,110
Other comprehensive (loss)/income
Items that are or may be reclassified subsequently to profit or loss
Remeasurement of defined benefit plan (19) – Foreign currency translation differences (151,871) 22,442 Effective portion of hedge of net investment in foreign operation 23,780 (11,653) Equity-accounted investees – share of OCI 10 (7,757) 6,709
Other comprehensive (loss)/income for the period (135,867) 17,498
Total comprehensive (loss)/income for the period (137,056) 26,608
Total comprehensive (loss)/income attributable to: Owners of the Holding Companies (139,678) 23,012 Non-controlling interests 2,622 3,596
(137,056) 26,608

Ven
a E
nerg
y H
old
ing
s L
td a
nd
its
su
bsid
iari
es
Ven
a E
ne
rgy (
Ta
iwan
) H
old
ing
s L
td a
nd
its
su
bsid
iari
es
Zen
ith
Jap
an
Ho
ldin
gs T
rust
an
d i
ts s
ub
sid
iari
es
Conde
nse
d C
om
bin
ed I
nte
rim
Fin
ancia
l S
tate
ments
For
the s
ix m
onth
s e
nded 3
0 J
une 2
021
FS
3
The
acco
mpa
nyin
g n
ote
s fo
rm a
n in
tegra
l part
of
the c
onden
se
d c
om
bin
ed inte
rim
fin
ancia
l sta
tem
ents
.
Co
nd
en
sed
co
mb
ined
sta
tem
en
t o
f c
ha
ng
es
in
eq
uit
y
Fo
r th
e s
ix m
on
ths
en
de
d 3
0 J
un
e 2
02
1
Att
rib
uta
ble
to
ow
ne
rs o
f th
e H
old
ing
Co
mp
an
ies
Eq
uit
y
co
ntr
ibu
tio
n
an
d u
nit
s i
n
iss
ue
Ca
pit
al
rese
rve
s
Reta
ine
d
ea
rnin
gs
Tra
ns
lati
on
re
se
rve
s
Oth
er
re
se
rve
s
To
tal
No
n-
co
ntr
oll
ing
in
tere
st
To
tal
eq
uit
y
US
$’0
00
US
$’0
00
US
$’0
00
US
$’0
00
US
$’0
00
US
$’0
00
US
$’0
00
US
$’0
00
At
1 J
an
ua
ry 2
02
1
3,4
04
,39
9
50
,000
65
,565
14
4,8
45
(27
) 3
,66
4,7
82
84
,593
3
,74
9,3
75
To
tal
co
mp
reh
en
siv
e (
los
s)/
inc
om
e f
or
the p
eri
od
(Loss
)/P
rofit
fo
r th
e p
erio
d
–
–
(6,6
84
) –
–
(6,6
84
) 5,4
95
(1
,189
)
Oth
er
co
mp
reh
en
siv
e (
los
s)/
inc
om
e
Fo
reig
n c
urr
ency tra
nsla
tion
diff
ere
nce
s –
–
–
(14
8,9
98
) –
(1
48
,99
8)
(2,8
73
) (1
51,8
71
) E
qu
ity-a
cco
un
ted inve
ste
es –
sh
are
of
OC
I –
–
–
(7,7
57
) –
(7
,75
7)
–
(7,7
57
) R
em
easu
rem
ent
of d
efin
ed
ben
efit p
lan
–
–
–
–
(19
) (1
9)
–
(19)
Eff
ective
port
ion
of
hed
ge o
f ne
t in
vestm
en
t in
fo
reig
n o
pe
ratio
n
–
–
–
23
,780
–
23
,780
–
23
,780
To
tal
co
mp
reh
en
siv
e (
los
s)/
inc
om
e f
or
the p
eri
od
–
–
(6,6
84
) (1
32
,97
5)
(19
) (1
39
,67
8)
2,6
22
(1
37,0
56
)
Tra
nsa
cti
on
s w
ith
ow
ne
rs,
rec
og
nis
ed
d
ire
ctl
y in
eq
uit
y
Re
pu
rcha
se
of sh
are
s –
–
–
–
–
–
(4,0
93)
(4,0
93
)
To
tal
tra
ns
ac
tio
ns
wit
h o
wn
ers
–
–
–
–
–
–
(4,0
93)
(4,0
93
)
At
30
Ju
ne
202
1
3,4
04
,39
9
50
,000
58
,881
11
,870
(46
) 3
,52
5,1
04
83
,122
3
,60
8,2
26
Ven
a E
nerg
y H
old
ing
s L
td a
nd
its
su
bsid
iari
es
Ven
a E
ne
rgy (
Ta
iwan
) H
old
ing
s L
td a
nd
its
su
bsid
iari
es
Zen
ith
Jap
an
Ho
ldin
gs T
rust
an
d i
ts s
ub
sid
iari
es
Conde
nse
d C
om
bin
ed I
nte
rim
Fin
ancia
l S
tate
ments
For
the s
ix m
onth
s e
nded 3
0 J
une 2
021
FS
4
The
acco
mpa
nyin
g n
ote
s fo
rm a
n in
tegra
l part
of
the c
onden
se
d c
om
bin
ed inte
rim
fin
ancia
l sta
tem
ents
.
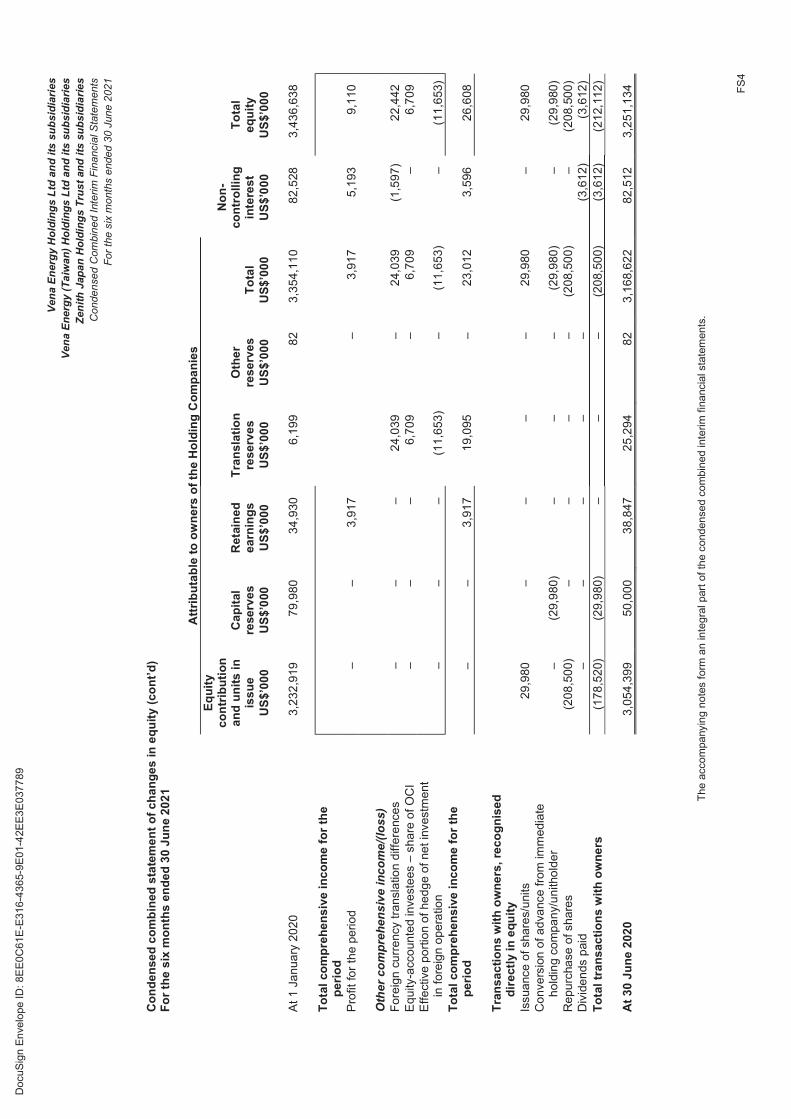
Co
nd
en
se
d c
om
bin
ed
sta
tem
en
t o
f c
ha
ng
es
in
eq
uit
y (
co
nt’
d)
Fo
r th
e s
ix m
on
ths
en
de
d 3
0 J
un
e 2
02
1
Att
rib
uta
ble
to
ow
ne
rs o
f th
e H
old
ing
Co
mp
an
ies
Eq
uit
y
co
ntr
ibu
tio
n
an
d u
nit
s i
n
iss
ue
Ca
pit
al
rese
rve
s
Reta
ine
d
ea
rnin
gs
Tra
ns
lati
on
re
se
rve
s
Oth
er
re
se
rve
s
To
tal
No
n-
co
ntr
oll
ing
in
tere
st
To
tal
eq
uit
y
US
$’0
00
US
$’0
00
US
$’0
00
US
$’0
00
US
$’0
00
US
$’0
00
US
$’0
00
US
$’0
00
At
1 J
an
ua
ry 2
02
0
3,2
32
,91
9
79
,980
34
,930
6,1
99
82
3,3
54
,11
0
82
,528
3
,43
6,6
38
To
tal
co
mp
reh
en
siv
e i
nc
om
e f
or
the
p
eri
od
Pro
fit
for
the p
erio
d
–
–
3,9
17
–
3,9
17
5,1
93
9
,11
0
Oth
er
co
mp
reh
en
siv
e i
nc
om
e/(
los
s)
Fo
reig
n c
urr
ency tra
nsla
tion
diff
ere
nce
s –
–
–
24
,039
–
24
,039
(1,5
97
) 2
2,4
42
Eq
uity
-acc
oun
ted inve
ste
es –
sh
are
of
OC
I –
–
–
6,7
09
–
6,7
09
–
6,7
09
Eff
ective
po
rtio
n o
f he
dg
e o
f ne
t in
vestm
en
t in
fo
reig
n o
pe
ratio
n
–
–
–
(11
,653
) –
(1
1,6
53
) –
(1
1,6
53)
To
tal
co
mp
reh
en
siv
e i
nc
om
e f
or
the
p
eri
od
–
–
3,9
17
19
,095
–
23
,012
3,5
96
2
6,6
08
Tra
ns
ac
tio
ns
wit
h o
wn
ers
, re
co
gn
ise
d
dir
ectl
y in
eq
uit
y
Issua
nce
of sha
res/u
nits
29
,980
–
–
–
–
29
,980
–
29
,980
Co
nve
rsio
n o
f a
dva
nce
fro
m im
med
iate
h
old
ing
com
pa
ny/
un
itho
lde
r
–
(29,9
80)
–
–
–
(29
,980
) –
(2
9,9
80)
Re
pu
rcha
se
of sh
are
s
(20
8,5
00)
–
–
–
–
(20
8,5
00
) –
(2
08,5
00
) D
ivid
en
ds p
aid
–
–
–
–
–
(3,6
12)
(3,6
12
)
To
tal
tra
ns
ac
tio
ns
wit
h o
wn
ers
(1
78
,52
0)
(29,9
80)
–
–
–
(20
8,5
00
) (3
,61
2)
(21
2,1
12
)
At
30
Ju
ne
202
0
3,0
54
,39
9
50
,000
38
,847
25
,294
82
3,1
68
,62
2
82
,512
3
,25
1,1
34

Vena Energy Holdings Ltd and its subsidiaries
Vena Energy (Taiwan) Holdings Ltd and its subsidiaries
Zenith Japan Holdings Trust and its subsidiaries
Condensed Combined Interim Financial Statements
For the six months ended 30 June 2021
FS5The accompanying notes form an integral part of the condensed combined interim financial information.
FS5
Condensed combined statement of cash flows For the six months ended 30 June 2021
For the six months ended
Note30 June
202130 June
2020US$’000 US$’000
Cash flows from operating activitiesProfit before tax 10,427 18,232 Adjustments for: Depreciation expense 7,8 36,968 34,104
Amortisation expense 9 27,576 25,897 Gain on disposal of property, plant and equipment 5 95 Write off of project costs previously capitalised 1,992 –
Impairment losses on financial assets 181 30 Loss on disposal of interest in equity-accounted investee 10 – 435
Finance income 23 (6,763) (6,483)
Finance costs 23 44,993 40,780 Net changes in fair value of financial instruments 24 16,063 (15,630)
Unrealised foreign exchange (gain)/loss (14,541) 15,867
Share of net profit of equity-accounted investees, net of tax 10 (11,342) (5,637)
105,559 107,690
Changes in: - Trade and other receivables (31,729) (1,748)
- Prepayments and other assets (9,905) 10,128 - Trade and other payables 8,944 (39,980)
Cash generated from operating activities 72,869 76,090
Tax paid (6,705) (3,397)
Net cash generated from operating activities 66,164 72,693
Cash flows from investing activitiesAcquisition of subsidiaries, net of cash acquired – (36,264)
Acquisition of interest in equity-accounted investees (12,385) (7,357)
Drawdown of loan by equity-accounted investees – (4,900)
Repayment of loan from equity-accounted investees 13,770 2,179 Distributions from equity-accounted investees 10 4,923 8,088
Proceeds from disposal of equity-accounted investees – 300
Purchase of property, plant and equipment 7 (358,691) (123,437)
Additions of project-related agreements and licences 9 (1,962) (5,648)Proceeds from disposal of property, plant and equipment 5 211 Purchase of financial instruments (1,995) – Disposal of financial instruments (3,455) –
Proceeds from disposal of financial assets – 1,800
Proceeds from maturity of fixed deposit – 10,400
Interest received 2,619 1,545 Purchase of other investments (4,340) –
Net cash used in investing activities (361,511) (153,083)

Vena Energy Holdings Ltd and its subsidiaries
Vena Energy (Taiwan) Holdings Ltd and its subsidiaries
Zenith Japan Holdings Trust and its subsidiaries
Condensed Combined Interim Financial Statements
For the six months ended 30 June 2021
FS6The accompanying notes form an integral part of the condensed combined interim financial information.
FS6
Condensed combined statement of cash flows For the six months ended 30 June 2021
For the six months ended
Note30 June
202130 June
2020
US$’000 US$’000
Cash flows from financing activitiesProceeds from issuance of units 350,000 –
Repurchase of ordinary shares and units – (208,500)
Proceeds from issuance of Euro Medium Term Note 16 – 325,000 Proceeds from drawdown of project finance debts 185,171 296,597
Proceeds from drawdown of revolving credit facility 161,548 326,749
Proceeds from drawdown of working capital loans 16,493 –
Repayment of project finance debts (97,385) (62,588)
Repayment of revolving credit facility (263,157) (408,700)Repayment of working capital loans (15,899) –
Repayment of corporate term loan (7,510) (328,797)
Payment of lease liabilities (10,950) (3,088)Transaction costs related to project finance debts (6,156) (4,465)Transaction costs related to refinancing of revolving credit
facility (2,737) – Transaction costs related to issuance of Euro Medium Term
Note – (4,003)
Interest paid on project finance debts (30,539) (31,435)Interest paid on Term loan and revolving credit facility (3,112) (2,605)
Interest paid on Euro Medium Term Note (5,091) –
Net interest received for derivatives 2,881 – Dividends paid to non-controlling interest (4,093) (3,612)
Deposits (pledged)/unpledged (18,012) 310,348
Net cash generated from financing activities 251,452 200,901
Net (decrease)/increase in cash and cash equivalents (43,895) 120,511
Cash and cash equivalents at 1 January 12 260,369 263,090
Effect of exchange rate fluctuations on cash held 17,978 12,559
Cash and cash equivalents at 30 June 12 234,452 396,160

Vena Energy Holdings Ltd and its subsidiaries
Vena Energy (Taiwan) Holdings Ltd and its subsidiaries
Zenith Japan Holdings Trust and its subsidiaries
Condensed Combined Interim Financial Statements
For the six months ended 30 June 2021
FS7
Notes to the condensed combined interim financial information
1 Domicile and activities
Reporting entity Incorporation/
Establishment date
Place of incorporation/ Establishment Registered address
Vena Energy Holdings Ltd 13 October 2017 Cayman Islands Maples Corporate Services Limited, PO
Box 309, Ugland House, Grand
Cayman, KY1-1104, Cayman Islands
Vena Energy (Taiwan) Holdings Ltd
13 October 2017 Cayman Islands
Zenith Japan Holdings Trust * 18 October 2017 Island of
Guernsey N/A
* Zenith Japan Holdings Ltd, a company incorporated under the laws of Guernsey who registered office is at 1st Floor, Les Echelons Court, Les Echelons, St Peter Port, Guernsey GY1 6JB, is appointed as Trustee of the Zenith Japan Holdings Trust.
Vena Energy Holdings Ltd, Vena Energy (Taiwan) Holdings Ltd and Zenith Japan Holdings Trust are each known as a “Holding Company” and collectively the “Holding Companies”. The Holding Companies along with their subsidiaries are collectively known as the “Combined Group”. The Combined Group is not an existing legal entity for period presented in the unaudited condensed combined interim financial statements (“Condensed Combined Interim Financial Statements”).
The principal activity of the Combined Group is that of developer, owner and operator of renewable energy assets in the Asia-Pacific region.
Vena Energy Holdings Ltd. together with Vena Energy (Taiwan) Holdings Ltd and Zenith Japan Holdings Ltd (as trustee for Zenith Japan Holdings Trust) (collectively called “Guarantors”) act as guarantors on a joint and several basis for notes listed on the Singapore Exchange Securities Trading Limited (“SGX-ST”) under a $1 billion Global Medium Term Note Programme (the ”Notes”) by Vena Energy Capital Pte Ltd, a subsidiary of Vena Energy Holdings Ltd.
On 19 January 2018, the Holding Companies acquired a portfolio of renewable energy assets from Equis Pte Ltd and its affiliates for a total consideration of US$5.0 billion (including assumed liabilities of US$1.3 billion), (the “Acquisition”). As part of the Acquisition, Vena Energy Holdings Ltd acquired, economic interests in renewable energy assets in Australia, India, Indonesia, Philippines and Thailand, as well as the asset management capabilities of Equis Energy. Zenith Japan Holdings Trust acquired economic interests in renewable energy assets in Japan and Vena Energy (Taiwan) Holdings Ltd acquired economic interests in renewable energy assets in the Philippines and Taiwan.
Vena Energy Holdings Ltd and Vena Energy (Taiwan) Holdings Ltd have identical board of directors through the periods presented in the condensed combined interim financial statements, but the two entities did not form a legal group during any period presented. Zenith Japan Holdings Ltd (as trustee of Zenith Japan Holdings Trust) is the beneficiary of Zenith Japan Trust acting by its trustee of Zenith Japan Ltd, which has entered into numerous tokumei kumiai arrangements that gives Zenith Japan Trust an economic interest in the Combined Group’s assets in Japan (the “Japanese Assets”). The Japanese Assets have entered into asset management agreements with certain Japanese companies owned by Vena Energy Holdings Ltd.
2 Basis of combination
The condensed combined interim financial statements consists of the historical condensed interim financial statements of Vena Energy Holdings Ltd and its subsidiaries, Vena Energy (Taiwan) Holdings Ltd and its subsidiaries and Zenith Japan Holdings Trust and its subsidiaries for the six months period then ended 30 June 2021 on a combined basis.

Vena Energy Holdings Ltd and its subsidiaries
Vena Energy (Taiwan) Holdings Ltd and its subsidiaries
Zenith Japan Holdings Trust and its subsidiaries
Condensed Combined Interim Financial Statements
For the six months ended 30 June 2021
FS8
2 Basis of combination (cont’d)
The condensed combined interim financial statements have been derived from the aggregation of the consolidated assets, consolidated liabilities, consolidated income, consolidated expenses and consolidated cash flows of Vena Energy Holdings Ltd and its subsidiaries, Vena Energy (Taiwan) Holdings Ltd and its subsidiaries and Zenith Japan Holdings Trust and its subsidiaries, and prepared in accordance with the Combined Group’s accounting policies as set out in Note 5. All balances, income, expenses and unrealised gains and losses arising from transactions between entities of the combining entities were eliminated when preparing the combined financial statements.
3 Basis of preparation
The condensed combined interim financial statements have been prepared in accordance with accounting policy of the Combined Group as set out in Note 5 below.
The purpose of the combined interim financial statements is to show the condensed combined financial position, financial performance, changes in equity and cash flows of the Combined Group as a single performance unit as at and for the six months period then ended 30 June 2021.
4 Seasonality in operations
Seasonality in operations for the Interim period results are not necessarily indicative of results of operations or cash flows for an annual period. The Combined Group’s operating results are impacted by external factors, such as resource availability. For example, the amount of electricity that solar plants produce is dependent on the irradiation of a given project location and wind plants are impacted by wind conditions which vary across seasons.
5 Significant accounting policies
The Combined Group has applied the same accounting policies and methods of computation in the condensed combined interim financial statements for the current reporting period as that of the last annual financial information for the year ended 31 December 2020, including the policies described below.
Financial Instruments
Derivative Financial Instruments and Hedge Accounting
Derivatives are initially measured at fair value and any directly attributable transaction costs are recognised in profit or loss as incurred. Subsequent to initial recognition, derivatives are measured at fair value, and changes therein are generally recognised in profit or loss.
The Combined Group designates certain derivatives as hedging instruments in qualifying hedging relationships. At inception of designated hedging relationships, the Combined Group documents the risk management objective and strategy for undertaking the hedge. The Combined Group also documents the economic relationship between the hedged item and the hedging instrument, including whether the changes in cash flows of the hedged item and hedging instrument are expected to offset each other.
Net Investment hedges
The Combined Group designates certain derivatives as hedges of foreign exchange risk on a net investment in a foreign operation.
When a derivative instrument is designated as the hedging instrument in a hedge of a net investment in a foreign operation, the effective portion of the changes in the fair value of the hedging instrument is recognised in OCI and presented in the translation reserve within equity. Any ineffective portion of the changes in the fair value of the derivative is recognised immediately in profit or loss. The amount recognised in OCI is reclassified to profit or loss as a reclassification adjustment on disposal of the foreign operation.

Vena Energy Holdings Ltd and its subsidiaries
Vena Energy (Taiwan) Holdings Ltd and its subsidiaries
Zenith Japan Holdings Trust and its subsidiaries
Condensed Combined Interim Financial Statements
For the six months ended 30 June 2021
FS9
6 Use of judgements and estimates
The preparation of the combined financial statements in conformity with Combined Group’s accounting policies requires management to make judgements, estimates and assumptions that affect the application of accounting policies and the reported amounts of assets, liabilities, income and expenses. Actual results may differ from these estimates.
Estimates and underlying assumptions are reviewed on an ongoing basis. Revisions to accounting estimates are recognised in the period in which the estimates are revised and in any future periods affected.
Management applied critical judgement in assessing if Power Purchase Agreements (‘PPAs’) entered into by The Combined Group falls within the scope of Combined Group accounting policy on Service Concession Arrangements, including:
whether the counterparty of the PPA controls or regulates what services the Combined Group Entity must provide with the infrastructure, to whom it must provide them, and at what price; and
whether the counterparty of the PPA controls — through ownership, beneficial entitlement or otherwise - any significant residual interest in the infrastructure at the end of the term of the PPA.
Information about critical estimates in applying accounting policies that have the most significant effect on the amounts recognised in the financial statements is included in the following notes:
Measurement of fair values
A number of the Combined Group’s accounting policies and disclosures require the measurement of fair values, for both financial and non-financial assets and liabilities.
When measuring the fair value of an asset or a liability, the Combined Group uses observable market data as far as possible. Fair values are categorised into different levels in a fair value hierarchy based on the inputs used in the valuation techniques as follows:
Level 1: quoted prices (unadjusted) in active markets for identical assets or liabilities.
Level 2: inputs other than quoted prices included in Level 1 that are observable for the asset or liability, either directly (i.e. as prices) or indirectly (i.e. derived from prices).
Level 3: inputs for the asset or liability that are not based on observable market data (unobservable inputs).
If the inputs used to measure the fair value of an asset or a liability fall into different levels of the fair value hierarchy, then the fair value measurement is categorised in its entirety in the same level of the fair value hierarchy as the lowest level input that is significant to the entire measurement (with Level 3 being the lowest).
The Combined Group recognises transfers between levels of the fair value hierarchy as of the end of the reporting period during which the change has occurred.
Further information about the assumptions made in measuring fair values is included in Note 26 Financial instruments.

Ven
a E
nerg
y H
old
ing
s L
td a
nd
its
su
bsid
iari
es
Ven
a E
nerg
y (
Ta
iwan
) H
old
ing
s L
td a
nd
its
su
bsid
iari
es
Zen
ith
Jap
an
Ho
ldin
gs T
rust
an
d i
ts s
ub
sid
iari
es
Conde
nsed C
om
bin
ed
Inte
rim
Fin
an
cia
l S
tate
men
ts
For
the s
ix m
on
ths e
nde
d 3
0 J
une 2
021
FS
10
7
Pro
pe
rty,
pla
nt
an
d e
qu
ipm
en
t
La
nd
Bu
ild
ing
an
d
lea
se
ho
ld
imp
rovem
en
ts
Ele
ctr
ic
ge
ne
rato
r
eq
uip
me
nt
Ve
hic
les
Co
mp
ute
r,
fitt
ing
an
d
fix
ture
an
d
off
ice
eq
uip
me
nt
As
se
ts u
nd
er
co
ns
tru
cti
on
T
ota
l
US
$’0
00
US
$’0
00
US
$’0
00
US
$’0
00
US
$’0
00
US
$’0
00
U
S$
’00
0
Co
st
At
1 J
an
ua
ry 2
02
0
67
,508
20
,208
1,2
90
,94
9
29
6
4,0
90
267
,84
3
1,6
50,8
94
Acq
uis
itio
n th
roug
h b
usi
ness
co
mb
ination
s
–
–
55
,220
–
–
–
55
,220
Acq
uis
itio
n th
roug
h a
sse
t acq
uis
itio
n o
f
su
bsid
iari
es
–
–
–
–
–
42
,280
42
,280
Ad
ditio
ns
8,4
42
1,7
76
11
,077
16
7
1,2
55
306
,86
6
32
9,5
83
Dis
posal/w
rite
-off
52
–
(32
4)
–
(22
) (1
,09
7)
(1,3
91
)
Re
cla
ssi
fica
tion
–
–
16
6,0
14
–
–
(19
2,4
02
) (2
6,3
88)
Re
cla
ssi
fica
tion
fro
m r
ight-
of-
use
asse
ts
–
–
–
–
–
5,2
28
5,2
28
Eff
ect o
f exch
ange
rate
ch
an
ge
s
3,1
96
78
1
36
,733
15
13
3
21
,470
62
,328
At
31
Dece
mb
er
20
20
79
,198
22
,765
1,5
59
,66
9
47
8
5,4
56
450
,18
8
2,1
17,7
54
At
1 J
an
ua
ry 2
02
17
9,1
98
22
,765
1,5
59
,66
9
47
8
5,4
56
45
0,1
88
2,1
17,7
54
Ad
ditio
ns
99
81
16
1,2
46
56
18
03
56
,095
35
8,6
91
Dis
posal/w
rite
-off
(21
) –
(1
44
)–
(1
3)
(1,6
51
)(1
,82
9)
Re
cla
ssi
fica
tion
1,8
91
–
67
,321
–
7(6
9,2
19)
–
Re
cla
ssi
fica
tion
fro
m r
ight-
of-
use
asse
ts
–
–
–
–
–
4,2
00
4,2
00
Re
cla
ssi
fica
tion
to
in
tan
gib
le a
ssets
–
–
–
–
–
(1,8
04
) (1
,80
4)
Eff
ect o
f exch
ange
rate
ch
an
ge
s
(4,4
52
)(1
,256
)(5
8,7
94
)(2
3)
(18
9)
(41
,329
)(1
06
,04
3)
At
30
Ju
ne 2
021
77
,614
21
,625
1,5
69
,29
85
11
5,4
41
69
6,4
80
2,3
70
,96
9

Ven
a E
nerg
y H
old
ing
s L
td a
nd
its
su
bsid
iari
es
Ven
a E
nerg
y (
Ta
iwan
) H
old
ing
s L
td a
nd
its
su
bsid
iari
es
Zen
ith
Jap
an
Ho
ldin
gs T
rust
an
d i
ts s
ub
sid
iari
es
Conde
nsed C
om
bin
ed
Inte
rim
Fin
an
cia
l S
tate
men
ts
For
the s
ix m
on
ths e
nde
d 3
0 J
une 2
021
FS
11
7
Pro
pe
rty,
pla
nt
an
d e
qu
ipm
en
t (c
on
t’d
)
La
nd
Bu
ild
ing
an
d
lea
se
ho
ld
imp
rovem
en
ts
Ele
ctr
ic
ge
ne
rato
r
eq
uip
me
nt
Ve
hic
les
Co
mp
ute
r,
fitt
ing
an
d
fix
ture
an
d
off
ice
eq
uip
me
nt
As
se
ts u
nd
er
co
ns
tru
cti
on
T
ota
l
US
$’0
00
US
$’0
00
US
$’0
00
US
$’0
00
US
$’0
00
US
$’0
00
US
$’0
00
Ac
cu
mu
late
d d
ep
rec
iati
on
At
1 J
an
ua
ry 2
02
0
–
(2,1
76)
(94
,861
) (8
8)
(1,8
15
) –
(98
,940)
De
pre
cia
tio
n c
ha
rge
fo
r th
e y
ea
r –
(8
27)
(59
,339
) (6
9)
(1,1
09
) –
(6
1,3
44)
Imp
air
men
t lo
ss
–
–
(59
3)
–
–
–
(593
)
Dis
posal/w
rite
-off
–
–
79
–
12
–
91
Eff
ect o
f exch
ange
rate
ch
an
ge
s
–
(341
) (2
,55
1)
(9)
(66
) –
(2,9
67
)
At
31
Dece
mb
er
20
20
–
(3,3
44
) (1
57,2
65
) (1
66
) (2
,97
8)
–
(163
,75
3)
At
1 J
an
ua
ry 2
02
1–
(3
,34
4)
(15
7,2
65
) (1
66
) (2
,97
8)
–
(163
,75
3)
De
pre
cia
tio
n c
ha
rge
fo
r th
e p
eri
od
–
(88
3)
(30
,765
)(2
7)
(58
0)
–
(32
,255)
Dis
posal/w
rite
-off
–
–
14
4–
1
3–
1
57
E
ffe
ct o
f exch
ange
rate
ch
an
ge
s
–
38
69
,26
81
71
52
–
9,8
23
At
30
Ju
ne 2
021
–
(3,8
41
)(1
78
,61
8)
(17
6)
(3,3
93)
–
(18
6,0
28
)
Ca
rry
ing
am
ou
nts
At
1 J
an
ua
ry 2
02
0
67
,508
18
,032
1,1
96
,08
8
20
8
2,2
75
267
,84
3
1,5
51,9
54
At
31
Dece
mb
er
20
20
79
,198
19
,421
1,4
02
,40
4
31
2
2,4
78
450
,18
8
1,9
54,0
01
At
30
Ju
ne 2
021
77
,614
17
,784
1,3
90
,68
03
35
2,0
48
69
6,4
80
2,1
84
,94
1
As a
t re
po
rtin
g d
ate
, som
e p
rop
ert
y, p
lan
t an
d e
qu
ipm
en
t o
f th
e C
om
bin
ed G
roup
we
re p
ledge
d a
s c
olla
tera
l to
se
cure
pro
ject
fin
ance
de
bts
(se
e n
ote
16).
At 3
1 D
ecem
be
r 2
020
, th
e C
om
bin
ed
Gro
up
reco
gn
ise
d a
n im
pa
irm
ent lo
ss o
f U
S$
59
3,0
00
with r
espe
ct to
ele
ctr
ic g
en
era
tor
eq
uip
men
t. T
he
se r
ela
tes to
sola
r p
an
els
whic
h
we
re d
am
age
d d
uri
ng a
flo
od in
Th
aila
nd
and
the
se s
ola
r pan
els
we
re im
pa
ired
to
re
flect its r
eco
vera
ble
am
oun
t b
ased
on
an
exte
rna
l ven
do
r q
uo
tation.

Vena Energy Holdings Ltd and its subsidiaries
Vena Energy (Taiwan) Holdings Ltd and its subsidiaries
Zenith Japan Holdings Trust and its subsidiaries
Condensed Combined Interim Financial Statements
For the six months ended 30 June 2021
FS12
8 Right-of-use assets
Land and buildings Office lease Others Total
$’000 $’000 $’000 $’000CostAt 1 January 2020 163,878 8,077 765 172,720 Acquisition through business
combinations 14,349 – – 14,349 Acquisition through asset
acquisition of subsidiaries 4,554 – – 4,554 Additions 128,209 11,711 865 140,785 Disposal/write-off – (3,200) (91) (3,291)Effect of exchange rate changes 17,635 967 267 18,869 At 31 December 2020 328,625 17,555 1,806 347,986
At 1 January 2021 328,625 17,555 1,806 347,986 Additions 32,252 2,060 282 34,594 Effect of exchange rate changes (18,959) (1,575) 240 (20,294)At 30 June 2021 341,918 18,040 2,328 362,286
Accumulated depreciation
At 1 January 2020 (4,919) (2,761) (255) (7,935)
Depreciation expense (4,283) (4,602) (748) (9,633)
Reclassification to property, plant and equipment (5,228) – – (5,228)
Disposal/write-off – 2,851 28 2,879
Effect of exchange rate changes (551) (643) (146) (1,340)
At 31 December 2020 (14,981) (5,155) (1,121) (21,257)
At 1 January 2021 (14,981) (5,155) (1,121) (21,257)
Depreciation expense (2,266) (1,926) (521) (4,713)
Reclassification to property, plant and equipment (4,200) – – (4,200)
Effect of exchange rate changes 877 1,185 433 2,495
At 30 June 2021 (20,570) (5,896) (1,209) (27,675)
Carrying amounts
At 1 January 2020 158,959 5,316 510 164,785
At 31 December 2020 313,644 12,400 685 326,729
At 30 June 2021 321,348 12,144 1,119 334,611
As at reporting date, some right-of-use assets of the Combined Group were pledged as collateral to secure project finance debts (see note 16).

Vena Energy Holdings Ltd and its subsidiaries
Vena Energy (Taiwan) Holdings Ltd and its subsidiaries
Zenith Japan Holdings Trust and its subsidiaries
Condensed Combined Interim Financial Statements
For the six months ended 30 June 2021
FS13
9 Intangible assets
Goodwill
Project-related
agreements &
licences
Service
concession
intangible
assets Total
US$’000 US$’000 US$’000 US$’000
Cost At 1 January 2020 776,841 1,453,331 174,368 2,404,540
Acquisitions through business
combination 8,677 14,366 – 23,043
Acquisition through asset
acquisition of subsidiaries – 65,756 – 65,756
Additions – 21,308 303 21,611
Effect of exchange rate changes 35,585 55,986 – 91,571
At 31 December 2020 821,103 1,610,747 174,671 2,606,521
At 1 January 2021 821,103 1,610,747 174,671 2,606,521
Additions – 1,962 – 1,962
Reclassification from property,
plant and equipment – 1,804 – 1,804
Write off – (341) – (341)
Effect of exchange rate changes (23,548) (80,712) (1,365) (105,625)
At 30 June 2021 797,555 1,533,460 173,306 2,504,321
Accumulated amortisation
At 1 January 2020 – (69,280) (4,715) (73,995)
Amortisation expense – (47,871) (7,060) (54,931)
Effect of exchange rate changes – (2,548) – (2,548)
At 31 December 2020 – (119,699) (11,775) (131,474)
At 1 January 2021 – (119,699) (11,775) (131,474)
Amortisation expense – (24,258) (3,318) (27,576)Effect of exchange rate changes – (2,671) 402 (2,269)
At 30 June 2021 – (146,628) (14,691) (161,319)
Carrying amounts
At 1 January 2020 776,841 1,384,051 169,653 2,330,545
At 31 December 2020 821,103 1,491,048 162,896 2,475,047
At 30 June 2021 797,555 1,386,832 158,615 2,343,002
Amortisation of project related agreements and licences and service concession intangible assets begins on the commercial operation date of the renewable asset as defined in the respective power purchase agreements.
As at reporting date, Service concession intangible assets of the Combined Group were pledged as collateral to secure project finance debts (Note 16).

Vena Energy Holdings Ltd and its subsidiaries
Vena Energy (Taiwan) Holdings Ltd and its subsidiaries
Zenith Japan Holdings Trust and its subsidiaries
Condensed Combined Interim Financial Statements
For the six months ended 30 June 2021
FS14
10 Equity-accounted investees
30 June 2021
31 December 2020
US$’000 US$’000
Interests in joint venture 53,045 46,147 Interests in associates 451,921 447,771
Total interests in equity-accounted investees 504,966 493,918
Investment in joint venture
During the six months period ended 30 June 2021, the Combined Group acquired 49% economic interest in Wind Power Energy Co., Ltd. (“WPE”). The remaining economic interest is substantially owned by a third party, Prominet Power K.K. and decisions in relation to key relevant activities of WPE require unanimous consent. The Combined Group has assessed that it has joint control over WPE, and that its investment in WPE meets the definition of a joint venture (as defined by the Combined Group’s accounting policy). WPE is based in Japan, and principally engaged in development and operation of renewable energy assets
The following summarises the financial information of the Combined Group’s joint venture based on the financial statements prepared in accordance with the Combined Group’s accounting policy:
Nanao KK Kyudenko WPE 30 June 2021 US$’000 US$’000 US$’000
Statement of financial position
Property, plant and equipment 41,399 44,849 34,166 Right-of-use assets 15,862 52,660 11,619 Intangible assets 1,433 38,126 – Prepayments and other assets 1,786 197 – Trade and other receivables 198 – –
Non-current assets 60,678 135,832 45,785
Prepayments and other assets – 144 3 Trade and other receivables – 32,755 3 Cash and cash equivalents 2,886 5,865 8,666
Current assets 2,886 38,764 8,672
Total assets 63,564 174,596 54,457
Loans and borrowings 31,645 77,228 15,707 Lease liabilities 6,199 57,321 11,202 Derivative liabilities 378 2,623 –
Non-current liabilities 38,222 137,172 26,909
Loans and borrowings – – 57 Lease liabilities 380 225 409 Trade and other payables 7 2 2,663
Current liabilities 387 227 3,129
Total liabilities 38,609 137,399 30,038
Net assets 24,955 37,197 24,419

Vena Energy Holdings Ltd and its subsidiaries
Vena Energy (Taiwan) Holdings Ltd and its subsidiaries
Zenith Japan Holdings Trust and its subsidiaries
Condensed Combined Interim Financial Statements
For the six months ended 30 June 2021
FS15
10 Equity-accounted investees (cont’d)
Investment in joint venture (cont’d)
The following summarises the financial information of the Combined Group’s joint venture based on the financial statements prepared in accordance with the Combined Group’s accounting policy:
Nanao KK Kyudenko WPE
30 June 2021 US$’000 US$’000 US$’000
Statement of comprehensive income
Other income – 1 1
Operating expenses (10) (91) (16)
Change in fair value of financial derivatives 1,214 (701) –
Profit/(loss) before tax 1,204 (791) (15) Tax expense (1) – –
Profit/(loss) for the period 1,203 (791) (15) Foreign currency translation differences (1,435) (2,783) (1)
Total comprehensive losses for the period (232) (3,574) (16)
Nanao KK Kyudenko
31 December 2020 US$’000 US$’000
Statement of financial position
Property, plant and equipment 43,658 16,131
Intangible asset 1,538 40,920 Right-of-use assets 17,393 57,921
Prepayments and other assets 1,917 97
Non-current assets 64,506 115,069
Prepayments and other assets – 246 Trade and other receivables 221 33,177
Cash and cash equivalents 3,792 10,513
Current assets 4,013 43,936
Total assets 68,519 159,005
Loans and borrowings 33,684 48,699
Lease liabilities 7,129 61,578 Derivative liabilities 1,709 2,063
Non-current liabilities 42,522 112,340
Loans and borrowings – –
Lease liabilities 405 56
Trade and other payables 100 5,837
Current liabilities 505 5,893
Total liabilities 43,027 118,233
Net assets 25,492 40,772

Vena Energy Holdings Ltd and its subsidiaries
Vena Energy (Taiwan) Holdings Ltd and its subsidiaries
Zenith Japan Holdings Trust and its subsidiaries
Condensed Combined Interim Financial Statements
For the six months ended 30 June 2021
FS16
10 Equity-accounted investees (cont’d)
Investment in joint venture (cont’d)
Nanao KK Kyudenko 30 June 2020 US$’000 US$’000
Statement of comprehensive income
Other income – –
Operating expenses (993) (72)
Finance costs – –
Loss before tax (993) (72) Tax expense – –
Loss for the period (993) (72) Foreign currency translation differences 495 51
Total comprehensive losses for the period (498) (21)
Nanao KK Kyudenko WPE TotalUS$’000 US$’000 US$’000 US$’000
30 June 2021
Carrying amount of interest in joint venture at 1 January 2021 17,378 28,769 – 46,147
Combined Group's acquisition of share capital during the period – – 9,565 9,565
Share of profit/(loss) of joint venture 800 (555) – 245
Share of other comprehensive income of joint ventures (991) (1,921) – (2,912)
Carrying amount of interest in joint venture at 30 June 2021 17,187 26,293 9,565 53,045
31 December 2020
Carrying amount of interest in joint venture at 1 January 2020 28,151 – 28,151
Combined Group's acquisition of share capital during the year 18,156 – – 18,156
Share of losses of joint venture (1,204) (966) – (2,170) Share of other comprehensive
income of joint venture 426 1,584 – 2,010 Carrying amount of interest in
joint venture at 31 December 2020 17,378 28,769 – 46,147

Ven
a E
nerg
y H
old
ing
s L
td a
nd
its
su
bs
idia
ries
Ven
a E
nerg
y (
Ta
iwan
) H
old
ing
s L
td a
nd
its
su
bsid
iari
es
Zen
ith
Jap
an
Ho
ldin
gs T
rus
t an
d i
ts s
ub
sid
iari
es
Conde
nsed C
om
bin
ed
Inte
rim
Fin
an
cia
l S
tate
ments
Fo
r th
e s
ix m
on
ths e
nded 3
0 J
une 2
021
FS
17
10
E
qu
ity
-acco
un
ted
in
ves
tee
s (
co
nt’
d)
Inte
res
ts i
n a
sso
cia
tes
Th
e C
om
bin
ed
Gro
up
has
6 (
20
20
: 6
) m
ate
rial
asso
cia
tes a
nd
11
(20
20
: 11
) im
ma
teri
al
asso
cia
tes w
hic
h a
re e
qu
ity a
ccou
nte
d f
or.
The
fo
llow
ing
are
th
e m
ate
rial
asso
cia
tes:
Associa
te e
ntity
nam
e
Han
gin
ng
Am
ihan
H
old
ing
s, In
c.
an
d its
su
bsid
iari
es
(“H
AN
GIN
”)
Ven
a E
nerg
y W
ind
(P
hil)
Ho
ldin
gs In
c
(“V
EW
PH
I”)
Heli
os
So
lar
En
erg
y
Ho
ldin
gs In
c.
an
d i
ts s
ub
sid
iari
es
(“H
SE
HI”
)
Fir
st
So
leq
Ho
ldin
gs
P
hil
ipp
ines I
nc.
(“F
SH
PI”
)
On
e B
ukid
no
n P
roje
ct
Ho
ldin
gs In
c.
(“O
BP
HI”
)
RA
So
lar
En
erg
y
Ho
ldin
gs In
c. a
nd
its
su
bsid
iari
es
(“
RS
EH
I”)
Natu
re o
f A
ssocia
te
Invest
ment
hold
ings
entity
for
Altern
erg
y
Win
d O
ne
Corp
ora
tion
(“P
roje
ct P
ililia
”)
Inve
stm
ent
hold
ings
entity
for
Alte
rnerg
y W
ind O
ne C
orp
ora
tion
(“
Pro
ject
Pili
lia”)
Investm
ent
hold
ings
entity
for
Helio
s S
ola
r E
ne
rgy C
orp
.
(“P
roje
ct
Pollo
”)
Investm
en
t h
old
ing
entity
for
First S
ole
q
Ene
rgy C
orp
.
(“P
roje
ct Ir
onm
an”)
Investm
ent
hold
ing
en
tity
for
Asia
n G
reen
ene
rgy C
orp
.
(“P
roje
ct Z
orr
o”)
Invest
ment
ho
ldin
g
en
tity
for
Mirae A
sia
E
nerg
y C
orp
. (“
Pro
ject
Garc
ia”)
Secto
r 5
4.0
MW
win
d
54.0
MW
win
d
132.5
MW
sola
r 30.4
MW
sola
r 10.5
MW
sola
r 2
0.1
MW
sola
r
Prin
cip
al p
lace o
f busin
ess
/ C
oun
try
of
incorp
ora
tion
P
hili
pp
ines
Phili
ppin
es
Ph
ilippin
es
Phili
pp
ines
Phili
ppin
es
Ph
ilippin
es
Direct
econ
om
ic inte
rest
held
in
associa
te b
y th
e C
om
bin
ed G
roup
(%)
99
.84%
10
0%
99
.56%
99
.82%
99
.86%
99.9
1%
Eff
ect
ive e
co
nom
ic inte
rest held
on
the u
nde
rlyin
g p
roje
ct (
%)
55
.03%
13
9.9
7%
19
9.5
6%
99
.82%
99
.86%
99.9
7%
Direct V
oting r
igh
ts h
eld
in th
e
associa
te b
y th
e C
om
bin
ed G
roup
(%)
38
.51%
37
.29%
22
.16%
21
.62%
23
.76%
40%
1H
AN
GIN
he
ld 5
5.2
% a
nd
VE
WP
HI h
eld
39
.8%
dir
ect
vo
ting
rig
hts
in P
roje
ct P
ililia
. T
hro
ug
h th
e in
ve
stm
ent i
n H
AN
GIN
& V
EW
PH
I, th
e C
om
bin
ed
Gro
up
ag
gre
gate
e
co
no
mic
inte
rest in
Pro
ject
Pili
lia (
54M
w W
ind
) is
94
.91%
.

Ven
a E
nerg
y H
old
ing
s L
td a
nd
its
su
bs
idia
ries
Ven
a E
nerg
y (
Ta
iwan
) H
old
ing
s L
td a
nd
its
su
bsid
iari
es
Zen
ith
Jap
an
Ho
ldin
gs T
rus
t an
d i
ts s
ub
sid
iari
es
Conde
nsed C
om
bin
ed
Inte
rim
Fin
an
cia
l S
tate
ments
Fo
r th
e s
ix m
on
ths e
nded 3
0 J
une 2
021
FS
18
10
E
qu
ity
-acco
un
ted
in
ves
tee
s (
co
nt’
d)
Inte
res
ts i
n a
sso
cia
tes (
co
nt’
d)
Th
e follo
win
g s
um
ma
rises th
e fin
ancia
l in
form
atio
n o
f th
e C
om
bin
ed G
roup
’s m
ate
ria
l associ
ate
s p
repa
red in
acco
rda
nce w
ith
the
Com
bin
ed G
rou
p’s
acc
oun
tin
g p
olic
y:
30
Ju
ne
202
1P
ilil
iaP
ilil
iaP
oll
oIr
on
ma
nZ
orr
oG
arc
iaH
AN
GIN
VE
WP
HI
HS
EH
IF
SH
PI
OB
PH
IR
SE
HI
US
$’0
00
US
$’0
00
US
$’0
00
US
$’0
00
US
$’0
00
US
$’0
00
Sta
tem
en
t o
f fi
na
ncia
l p
osit
ion
Pro
pe
rty,
pla
nt a
nd
eq
uip
me
nt
89
,234
–
14
5,2
16
31,6
21
12
,087
27
,009
Inta
ngib
le a
ssets
7
30
–
–
–
–
–
Eq
uity
-acc
oun
ted inve
ste
es
–
14
,941
–
–
–
4,9
25
Oth
er
rece
iva
ble
s 2
,34
5
65
13
8
3,7
72
110
28
0
Rig
ht-
of-
use a
sse
ts
14
1
–
64
1
23
0
16
3
23
0
Pre
pa
ym
ent
and
oth
er
asse
ts
36
–
89
13
0
33
35
No
n-c
urr
en
t as
se
ts9
2,4
86
15
,006
14
6,0
84
35
,753
12
,393
32
,479
Tra
de a
nd
oth
er
rece
iva
ble
s 13
,70
1
–
20
,979
5,4
09
2,6
97
3,8
64
Pre
pa
ym
ent
and
oth
er
asse
ts
28
6
–
63
5
10
2
18
76
Ca
sh
an
d c
ash
equ
iva
len
ts
13
,101
40
11
,957
1,0
13
98
4
98
0
Cu
rre
nt
as
se
ts2
7,0
88
40
33
,571
6,5
24
3,6
99
4,9
20
To
tal
as
se
ts1
19,5
74
15
,046
17
9,6
55
42
,277
16
,092
37
,399
Lo
ans a
nd
bo
rro
win
gs
68
,340
–
10
8,8
35
13
,058
8,4
33
15
,740
Em
plo
ye
e b
ene
fits
3
9
–
–
–
–
Ass
et re
tire
men
t ob
liga
tion
3,3
00
–
1,1
09
26
1
88
18
4
De
ferr
ed
ta
x lia
bili
ties
17
7
–
27
1
–
22
10
5
No
n-c
urr
en
t lia
bil
itie
s7
1,8
56
–
11
0,2
15
13
,319
8,5
43
16
,029
Lo
ans a
nd
bo
rro
win
gs
4,5
85
–
5,4
94
3,4
81
58
9
2,3
38
Tra
de
an
d o
the
r p
aya
ble
s 1,9
75
3
96
2
1,4
45
1,7
19
82
2
Cu
rre
nt
lia
bilit
ies
6,5
60
3
6,4
56
4,9
26
2,3
08
3,1
60
To
tal
lia
bil
itie
s7
8,4
16
3
11
6,6
71
18
,245
10
,851
19
,189
Net
Ass
ets
41
,158
15
,043
62
,984
24
,032
5,2
41
18
,210

Ven
a E
nerg
y H
old
ing
s L
td a
nd
its
su
bs
idia
ries
Ven
a E
nerg
y (
Ta
iwan
) H
old
ing
s L
td a
nd
its
su
bsid
iari
es
Zen
ith
Jap
an
Ho
ldin
gs T
rus
t an
d i
ts s
ub
sid
iari
es
Conde
nsed C
om
bin
ed
Inte
rim
Fin
an
cia
l S
tate
ments
Fo
r th
e s
ix m
on
ths e
nded 3
0 J
une 2
021
FS
19
10
E
qu
ity
-acco
un
ted
in
ves
tee
s (
co
nt’
d)
Inte
res
ts i
n a
sso
cia
tes (
co
nt’
d)
Th
e follo
win
g s
um
ma
rises th
e fin
ancia
l in
form
atio
n o
f th
e C
om
bin
ed G
roup
’s m
ate
ria
l associ
ate
s p
repa
red in
acco
rda
nce w
ith
the
Com
bin
ed G
rou
p’s
acc
oun
tin
g p
olic
y:
30
Ju
ne
202
1
Pil
ilia
P
ilil
iaP
oll
oIr
on
ma
nZ
orr
oG
arc
ia
HA
NG
IN
VE
WP
HI
HS
EH
I F
SH
PI
OB
PH
I R
SE
HI
US
$’0
00
US
$’0
00
US
$’0
00
US
$’0
00
US
$’0
00
US
$’0
00
Sta
tem
en
t o
f c
om
pre
hen
siv
e i
nc
om
e
Sa
le o
f e
ne
rgy
12
,676
–
18
,606
4,0
95
1,4
16
3,7
33
Oth
er
inco
me
–
–
2,0
44
–
–
63
7
Re
ve
nu
e
12
,676
–
20
,650
4,0
95
1,4
16
4,3
70
Op
era
ting
co
sts
(2,0
00
) (3
) (2
,38
5)
(60
2)
(47
0)
(569
) S
ha
red
se
rvic
es
costs
(5
38
) –
(1
38
) (3
4)
(11
) (2
6)
De
pre
cia
tion
exp
en
se
(2,3
45
) –
(3
,77
0)
(95
6)
(35
4)
(793
) (4
,883
) (3
) (6
,29
3)
(1,5
92
) (8
35
) (1
,38
8)
Fin
ance
in
com
e
73
–
10
4
32
9
16
Fin
ance
costs
(2
,19
0)
–
(3,7
01
) (4
50
) (2
83
) (4
93
) N
et
fore
ign
exch
ang
e g
ain
/(lo
ss)
(9)
–
10
(24
0)
1
(62
) (2
,12
6)
–
(3,5
87
) (6
58
) (2
73
) (5
39
)
Sh
are
of n
et p
rofit
s o
f asso
cia
te
–
2,2
61
–
–
–
–
Pro
fit
be
fore
ta
x
5,6
67
2,2
58
10
,770
1,8
45
308
2,4
43
Incom
e ta
x e
xpe
nse
–
–
–
–
–
–
Pro
fit
fro
m c
on
tin
uin
g o
pe
rati
on
s
5,6
67
2,2
58
10
,770
1,8
45
308
2,4
43
Oth
er
co
mp
reh
en
siv
e i
nc
om
e
Fo
reig
n o
pe
ratio
ns -
fo
reig
n c
urr
en
cy
tra
nsl
atio
n d
iffe
ren
ces
(17
6)
(12
7)
(83
9)
(324
) (7
0)
(17
3)
To
tal
co
mp
reh
en
siv
e i
nc
om
e
5,4
91
2,1
31
9,9
31
1,5
21
23
8
2,2
70

Ven
a E
nerg
y H
old
ing
s L
td a
nd
its
su
bs
idia
ries
Ven
a E
nerg
y (
Ta
iwan
) H
old
ing
s L
td a
nd
its
su
bsid
iari
es
Zen
ith
Jap
an
Ho
ldin
gs T
rus
t an
d i
ts s
ub
sid
iari
es
Conde
nsed C
om
bin
ed
Inte
rim
Fin
an
cia
l S
tate
ments
Fo
r th
e s
ix m
on
ths e
nded 3
0 J
une 2
021
FS
20
10
E
qu
ity
-acco
un
ted
in
ves
tee
s (
co
nt’
d)
Inte
res
ts i
n a
sso
cia
tes (
co
nt’
d)
Th
e follo
win
g s
um
ma
rises th
e fin
ancia
l in
form
atio
n o
f th
e C
om
bin
ed G
roup
’s m
ate
ria
l associ
ate
s p
repa
red in
acco
rda
nce w
ith
the
Com
bin
ed G
rou
p’s
acc
oun
tin
g p
olic
y:
31
De
cem
be
r 20
20
Pil
ilia
Pil
ilia
Po
llo
Iro
nm
an
Zo
rro
Ga
rcia
HA
NG
INV
EW
PH
IH
SE
HI
FS
HP
IO
BP
HI
RS
EH
IU
S$
’000
US
$’0
00
US
$’0
00
US
$’0
00
US
$’0
00
US
$’0
00
Sta
tem
en
t o
f fi
na
nc
ial
po
sit
ion
Pro
pe
rty, p
lan
t an
d e
qu
ipm
en
t9
2,8
26
–
15
1,0
06
33
,011
12,6
03
28
,171
Inta
ngib
le a
ssets
74
0
–
–
–
–
–
Equ
ity-a
cco
un
ted
inve
ste
es
–
12
,681
–
–
–
4,4
33
Oth
er
receiv
able
s1,6
49
64
12
5
3,7
64
93
22
7
Rig
ht-
of-
use
asse
ts2
–
5
2
4
3
P
repaym
en
tsa
nd
oth
er
ass
ets
37
–
90
10
2
34
12
7
No
n-c
urr
en
t a
ss
ets
95
,254
12
,745
15
1,2
26
36
,879
12
,734
32
,961
Tra
de
and
oth
er
receiv
able
s1
3,0
74
–
14
,711
4,4
58
2,5
01
2,9
60
Pre
paym
en
tsa
nd
oth
er
ass
ets
64
6
–
1,0
61
20
9
57
14
4
Ca
sh
and
cash e
qu
iva
lents
12
,03
6
45
24
,753
1,1
14
1,1
02
98
9
Cu
rre
nt
as
se
ts2
5,7
56
45
40
,525
5,7
81
3,6
60
4,0
93
To
tal a
sse
ts1
21
,01
0
12
,790
19
1,7
51
42
,660
16
,394
37
,054
Loa
ns a
nd
bo
rro
win
gs
72
,002
–
12
5,4
03
14
,602
8,7
02
14
,955
Em
plo
yee
be
ne
fits
40
–
–
–
–
–
Asse
t re
tire
men
t ob
liga
tion
3,2
90
–
1,1
24
26
5
90
18
7
De
ferr
ed ta
x lia
bili
ties
17
9
–
27
5
–
22
10
6
No
n-c
urr
en
t lia
bilit
ies
75
,511
–
12
6,8
02
14
,867
8,8
14
15
,248
Loa
ns a
nd
bo
rro
win
gs
4,5
70
–
5,8
36
3,3
65
579
4,7
84
Tra
de
and
oth
er
paya
ble
s4,8
92
4
1,5
11
1,9
14
1,7
57
1,0
72
Cu
rre
nt
tax lia
bili
ties
–
–
–
2
21
10
Cu
rre
nt
lia
bil
itie
s9,4
62
4
7,3
47
5,2
81
2,3
57
5,8
66
To
tal
lia
bilit
ies
84
,973
4
13
4,1
49
20
,148
11,1
71
21
,114
Ne
t A
sse
ts3
6,0
37
12
,786
57
,602
22
,512
5,2
23
15
,940

Ven
a E
nerg
y H
old
ing
s L
td a
nd
its
su
bs
idia
ries
Ven
a E
nerg
y (
Ta
iwan
) H
old
ing
s L
td a
nd
its
su
bsid
iari
es
Zen
ith
Jap
an
Ho
ldin
gs T
rus
t an
d i
ts s
ub
sid
iari
es
Conde
nsed C
om
bin
ed
Inte
rim
Fin
an
cia
l S
tate
ments
Fo
r th
e s
ix m
on
ths e
nded 3
0 J
une 2
021
FS
21
10
E
qu
ity
-acco
un
ted
in
ves
tee
s (
co
nt’
d)
Inte
res
ts i
n a
sso
cia
tes (
co
nt’
d)
Th
e follo
win
g s
um
ma
rises th
e fin
ancia
l in
form
atio
n o
f th
e C
om
bin
ed G
roup
’s m
ate
ria
l associ
ate
s p
repa
red in
acco
rda
nce w
ith
the
Com
bin
ed G
rou
p’s
acc
oun
tin
g p
olic
y:
30
Ju
ne
2020
Pil
ilia
Pil
ilia
Po
llo
Iro
nm
an
Zo
rro
Ga
rcia
HA
NG
INV
EW
PH
IH
SE
HI
FS
HP
IO
BP
HI
RS
EH
IU
S$
’000
US
$’0
00
US
$’0
00
US
$’0
00
US
$’0
00
US
$’0
00
Sa
le o
f e
ne
rgy
10
,199
–
18
,018
3,9
35
1,3
71
3
,19
1
Oth
er
inco
me
–
–
2,6
27
–
–
15
5
Re
ve
nu
e1
0,1
99
–
20
,645
3,9
35
1,3
71
3
,34
6
Op
era
ting c
osts
(2
,33
8)
(3)
(2,2
89
) (4
69
) (4
16)
(51
8)
Sha
red
se
rvic
es c
osts
(5
68
) –
(5
69
) (2
12
) (1
76
) (2
46
) D
ep
reci
atio
n e
xp
en
ses
(2,2
58
) –
(3
,60
4)
(90
6)
(34
0)
(76
0)
(5,1
64
) (3
) (6
,46
2)
(1,5
87
) (9
32
) (1
,52
4)
Fin
ance
in
com
e
61
–
19
7
3
–
59
Fin
ance
costs
(2
,16
9)
–
(5,0
17
) (5
32
) (2
86
) (6
01
) F
ore
ign
excha
nge
gain
/(lo
ss)
4
–
(31
) 3
09
16
46
5
Ne
t fi
na
nce
in
co
me
/(c
os
ts)
(2,1
04
) –
(4
,85
1)
(220
) (2
70
) (7
7)
Sh
are
of pro
fits
of
asso
cia
te
–
1,1
80
–
–
–
–
Pro
fit
befo
re t
ax
2,9
31
1,1
77
9,3
32
2,1
28
16
9
1,7
45
Incom
e ta
x e
xpe
nse
s –
–
–
–
–
(4
) P
rofi
t fr
om
co
nti
nu
ing
op
era
tio
ns
2,9
31
1,1
77
9,3
32
2,1
28
16
9
1,7
41
Oth
er
co
mp
reh
en
siv
e i
nc
om
eF
ore
ign
ope
ratio
ns -
fo
reig
n c
urr
en
cy t
ran
sla
tion
d
iffe
ren
ces
27
6
3
81
6
32
9
73
–
To
tal
co
mp
reh
en
siv
e i
nc
om
e3,2
07
1,1
80
10
,148
2,4
57
24
2
1,7
41

Ven
a E
nerg
y H
old
ing
s L
td a
nd
its
su
bs
idia
ries
Ven
a E
nerg
y (
Ta
iwan
) H
old
ing
s L
td a
nd
its
su
bsid
iari
es
Zen
ith
Jap
an
Ho
ldin
gs T
rus
t an
d i
ts s
ub
sid
iari
es
Conde
nsed C
om
bin
ed
Inte
rim
Fin
an
cia
l S
tate
ments
Fo
r th
e s
ix m
on
ths e
nded 3
0 J
une 2
021
FS
22
10
E
qu
ity
-acco
un
ted
in
ves
tee
s (
co
nt’
d)
Inte
res
ts i
n a
sso
cia
tes (
co
nt’
d)
Th
e follo
win
g s
um
ma
rises th
e fin
ancia
l in
form
atio
n o
f th
e C
om
bin
ed G
roup
’s m
ate
ria
l associ
ate
s p
repa
red in
acco
rda
nce w
ith
the
Com
bin
ed G
rou
p’s
acc
oun
tin
g p
olic
y:
30
Ju
ne
202
1P
ilil
ia
HA
NG
INP
ilil
ia
VE
WP
HI
Po
llo
H
SE
HI
Iro
nm
an
F
SH
PI
Zo
rro
O
BP
HI
Ga
rcia
R
SE
HI
Imm
ate
ria
l a
ss
oc
iate
sT
ota
l as
so
cia
tes
US
$’0
00
US
$’0
00
US
$’0
00
US
$’0
00
US
$’0
00
US
$’0
00
US
$’0
00
US
$’0
00
Ca
rry
ing
am
ou
nt
of
inte
res
t in
a
ss
oc
iate
s a
t s
tart
of
pe
rio
d5
9,0
63
42
,839
21
9,1
09
45
,794
11
,792
63
,975
5,1
99
44
7,7
71
Co
mb
ine
d G
rou
p’s
sh
are
of
am
ort
isa
tion
of
inta
ngib
le a
sse
t a
cqu
ire
d t
hro
ug
h
bu
sin
ess
co
mb
ina
tion
s (1
,45
7)
(1,0
50
)(4
,47
6)
(78
6)
(16
6)
(1,5
67
)–
(9,5
02
)C
om
bin
ed
Gro
up
’s s
ha
re o
f p
rofit/
(loss)
fr
om
co
ntin
uin
g o
pe
ration
s
3,1
28
2,2
58
10
,749
1,8
42
30
8
2,4
42
(12
7)
20
,600
Eff
ect o
f exch
an
ge
ra
te c
ha
nge
s f
rom
pro
ject-
rela
ted
ag
ree
me
nts
& li
ce
nces
(55
3)
(39
9)
(1,8
76
)(3
06
)(6
9)
(64
6)
(1)
(3,8
50
)C
om
bin
ed
Gro
up
’s s
ha
re o
f o
the
r co
mp
reh
en
siv
e (
inco
me
)/lo
ss
(17
6)
(12
7)
426
(3
23
)(7
0)
(16
0)
(56
5)
(99
5)
Co
mb
ine
d G
rou
p’s
sh
are
of
tota
l co
mp
reh
en
siv
e in
co
me
/(lo
ss)
94
26
82
4,8
23
42
73
6
9(6
93
)6
,25
3C
om
bin
ed
Gro
up
’s c
on
trib
ution
du
rin
g
the
pe
rio
d
––
–
––
–
2,8
20
2,8
20
Dis
trib
utio
n d
uri
ng t
he p
erio
d
––
(4,7
56
)–
(16
7)
––
(4,9
23
)C
arr
yin
g a
mo
un
t o
f in
tere
st
in
as
so
cia
tes a
te
nd
of
the
pe
rio
d6
0,0
05
43
,521
21
9,1
76
46
,221
11
,628
64
,044
7,3
26
45
1,9
21

Ven
a E
nerg
y H
old
ing
s L
td a
nd
its
su
bs
idia
ries
Ven
a E
nerg
y (
Ta
iwan
) H
old
ing
s L
td a
nd
its
su
bsid
iari
es
Zen
ith
Jap
an
Ho
ldin
gs T
rus
t an
d i
ts s
ub
sid
iari
es
Conde
nsed C
om
bin
ed
Inte
rim
Fin
an
cia
l S
tate
ments
Fo
r th
e s
ix m
on
ths e
nded 3
0 J
une 2
021
FS
23
10
E
qu
ity
-acco
un
ted
in
ves
tee
s (
co
nt’
d)
Inte
res
ts i
n a
sso
cia
tes (
co
nt’
d)
Th
e follo
win
g s
um
ma
rises th
e fin
ancia
l in
form
atio
n o
f th
e C
om
bin
ed G
roup
’s m
ate
ria
l associ
ate
s p
repa
red in
acco
rda
nce w
ith
the
Com
bin
ed G
rou
p’s
acc
oun
tin
g p
olic
y:
31
De
cem
be
r 20
20
Pil
ilia
P
ilil
iaW
aw
a
Po
llo
Iro
nm
an
Zo
rro
Ga
rcia
Imm
ate
ria
lT
ota
l H
AN
GIN
V
EW
PH
I H
PH
PI
HS
EH
I F
SH
PI
OB
PH
I R
SE
HI
as
so
cia
tes
as
so
cia
tes
US
$’0
00
US
$’0
00
US
$’0
00
US
$’0
00
US
$’0
00
US
$’0
00
US
$’0
00
U
S$
’00
0U
S$
’00
0
Ca
rry
ing
am
ou
nt
of
inte
res
t in
a
ss
oc
iate
s a
t s
tart
of
the y
ea
r 5
5,3
81
40
,176
7,6
38
21
2,7
87
42
,542
11
,029
59,1
03
5,0
86
43
3,7
42
Co
mb
ine
d G
rou
p’s
sh
are
of
am
ort
isatio
n o
f in
tan
gib
le a
sset
acq
uir
ed
th
rou
gh
bu
sin
ess
co
mb
ination
s (2
,82
4)
(2,0
36
) –
(8
,78
2)
(1,5
24
) (3
22
) (3
,05
7)
–
(18
,545
) C
om
bin
ed
Gro
up
's s
ha
re o
f p
rofit/
(loss)
fro
m c
ontinu
ing
op
era
tio
ns
3,6
60
2,6
47
(3
0)
19
,737
6,3
61
8
78
4
,31
1
(55
9)
37
,005
Eff
ect o
f exch
an
ge
ra
te c
ha
nge
s
from
pro
ject-
rela
ted
ag
reem
ents
& lic
en
ce
s2
,28
4
1,6
47
–
7
,82
8
1,2
62
2
83
2,6
77
–
1
5,9
81
Co
mb
ine
d G
rou
p's
sh
are
of o
the
r co
mp
reh
en
siv
e inco
me
56
2
40
5
97
2,9
54
1,2
10
2
69
9
41
(71
) 6
,36
7
Co
mb
ine
d G
rou
p's
sh
are
of
tota
l co
mp
reh
en
siv
e incom
e
3,6
82
2,6
63
67
21
,737
7,3
09
1,1
08
4,8
72
(63
0)
40
,808
Co
mb
ine
d G
rou
p’s
co
ntr
ibu
tion
d
uri
ng t
he y
ea
r –
–
–
–
–
–
–
7
43
74
3
Dis
trib
utio
n d
uri
ng t
he y
ea
r –
–
–
(15
,415
) (4
,05
7)
(34
5)
–
–
(19
,817
) D
isp
osa
l of
inte
rests
in a
ssocia
te
–
–
(7,7
05)
–
–
–
–
–
(7,7
05
)
Ca
rry
ing
am
ou
nt
of
inte
res
t in
a
ss
oc
iate
s a
t e
nd
of
the y
ear
59
,063
42
,839
–
21
9,1
09
4
5,7
94
1
1,7
92
6
3,9
75
5,1
99
44
7,7
71

Vena Energy Holdings Ltd and its subsidiaries
Vena Energy (Taiwan) Holdings Ltd and its subsidiaries
Zenith Japan Holdings Trust and its subsidiaries
Condensed interim financial statements
For the six months ended 30 June 2021
FS24
11 Loans receivables
30 June 2021
31 December 2020
US$’000 US$’000 Non-current Loan receivables from: - Equity-accounted investees 16,175 29,016 - Other third parties 3,611 3,550 Promissory note receivables 7,910 8,329
27,696 40,895 Less: Impairment loss on loans receivables (137) (301) Total non-current loans receivables 27,559 40,594
CurrentInterest receivables from: - Equity-accounted investees 698 644 - Promissory note 465 441 - Cross currency swap 3,705 3,677 - Other third parties 1,169 1,194 Loan receivables from:- Equity-accounted investees 6,575 7,503 - Other third parties 6,860 6,860
19,472 20,319 Less: Impairment loss on loans receivables (3) (167)
Total current loans receivables 19,469 20,152
47,028 60,746
Terms and conditions of loan receivables are as follows:
Currency Maturity date Principal amount Interest rate 2021 $’000
2020 $’000
2021 %
2020 %
Equity-accounted investees (a) USD 2021 to 2026 22,749 36,519 3 - 5 3 - 5 Other third parties (b) USD 2021 6,860 6,860 17 17 Other third parties (c) USD On demand 827 1,206 1.5 1.5 Other third parties (c) USD On demand 1,880 1,894 4.62 4.62 Other third parties (c) USD On demand 450 450 5.5 5.5 Promissory notes receivable (d) THB 2027 7,910 8,329 – –
40,676 55,258
(a) Loan receivables from equity-accounted investees are unsecured, with 3-5% (2020: 3-5%) interest and repayable quarterly with maturity dates from 2021 to 2026.
(b) The loan receivables of US$6,860,000 (2020: US$6,860,000) from San Lorenzo Ruiz Builders & Developers Group Inc. are secured, with 17% (2020: 17%) interest and repayable within 4 to 6 months.
(c) The Combined Group does not intend to demand these unsecured loans for repayment in the next 12 months.
(d) Promissory notes receivable are zero coupon, non-transferable and redeemable, with maturity date of 3 August 2027. At redemption date, the Combined Group is entitled to receive a redemption amount equal to 1% of the principal amount plus accrued redemption fee per annum.
As at reporting date, some loan receivables of the Combined Group were pledged as collateral to secure project finance debts (see note 16).

Vena Energy Holdings Ltd and its subsidiaries
Vena Energy (Taiwan) Holdings Ltd and its subsidiaries
Zenith Japan Holdings Trust and its subsidiaries
Condensed interim financial statements
For the six months ended 30 June 2021
FS25
12 Cash and cash equivalents
Note30 June
202131 December
2020US$’000 US$’000
Bank balances 312,143 286,689 Short term deposits 20,433 53,817 Less: Impairment loss (218) (37)
Cash and cash equivalents in the statement of financial position 332,358 340,469
Restricted bank balances and deposits (a) (97,906) (80,100)
Cash and cash equivalents in the statement of cash flows 234,452 260,369
(a) As at reporting date, some cash and cash equivalents were pledged as collateral to secure project finance debts (see note 16). Included US$79 million (2020: US$78 million) of the Combined Group’s cash and cash equivalents were held under debt service reserve accounts which represents a reserve account used for debt service of project finance debt when cash flow available for debt services is inadequate to service the project finance debt. The remaining US$19 million (2020: Nil) were deposits pledged to secure bank loans.
13 Derivative assets and liabilities
Note 30 June
2021 31 December
2020 US$’000 US$’000
Derivative assets
Non-current Electricity derivative 153,379 176,353 Interest rate swaps 926 – Cross currency swaps (a) 11,933 –
166,238 176,353
Current Interest rate swaps 252 – Forward exchange contract 937 1,350 Electricity derivative 7,205 6,029
8,394 7,379
Total derivative assets 174,632 183,732
Derivative liabilities
Non-currentInterest rate swaps 25,743 30,664 Cross currency swaps (a) – 11,201
25,743 41,865
Current Forward exchange contract 33 3,718 Interest rate swaps 3,016 3,239
3,049 6,957
Total derivative liabilities 28,792 48,822

Vena Energy Holdings Ltd and its subsidiaries
Vena Energy (Taiwan) Holdings Ltd and its subsidiaries
Zenith Japan Holdings Trust and its subsidiaries
Condensed interim financial statements
For the six months ended 30 June 2021
FS26
13 Derivative assets and liabilities (cont’d)
(a) During the financial year ended 31 December 2020, the Combined Group entered into cross currency swaps which matures in 2025 and with an aggregate notional amount of JPY 36.0 billion, whereby the Combined Group is required to make semi-annual interest payments calculated at fixed interest rates between 1.215% to 1.265%.
These cross currency swaps are designated as hedging instruments for giving effect to hedge accounting applied at the Combined Group level. The Combined Group’s accounting policy for this hedge is set out in Note 5 and the hedge effectiveness is illustrated in Note 27.
14 Prepayments and other assets
30 June 2021
31 December 2020
US$’000 US$’000 Non-currentOther prepayments 4,720 4,730 Other assets 23,078 11,378
27,798 16,108
CurrentPrepaid insurance 493 689 Other prepayments 12,401 13,706 Other assets 3,200 3,316
16,094 17,711
Total prepayments and other assets 43,892 33,819
As at reporting date, some prepayments and other assets of the Combined Group were pledged as collateral to secure project finance debts (see note 16).
15 Trade and other receivables
Note 30 June
202131 December
2020US$’000 US$’000
Non-currentDeposits 549 582 Tax receivables (a) 44,600 29,006 Others (e) 1,464 1,622 Total non-current other receivables 46,613 31,210
CurrentTrade receivables 78,070 72,942 Contract assets 31,136 20,357 Total trade receivables and contract assets 109,206 93,299

Vena Energy Holdings Ltd and its subsidiaries
Vena Energy (Taiwan) Holdings Ltd and its subsidiaries
Zenith Japan Holdings Trust and its subsidiaries
Condensed interim financial statements
For the six months ended 30 June 2021
FS27
15 Trade and other receivables (cont’d)
Note 30 June 2021
31 December 2020
US$’000 US$’000 Amount due from: - Unitholder (b) – 350,000 - Equity-accounted investees (c) 1,720 2,652 - Other third parties (d) 16,053 15,944 Deposits 26,626 15,724 Tax receivables (a) 12,013 19,566 Others (e) 396 1,299
Total current other receivables 56,808 405,185
Less: Impairment loss - Trade receivables and contract assets (4,052) (3,820)
- Other receivables (6,990) (6,964)
Total current trade and other receivables 154,972 487,700
(a) Non-current other tax receivables of US$44 million (2020: US$29 million) relate to value-added tax receivables which will be refunded upon completion of construction of the projects while current other tax receivables relate to value-added tax receivables that are expected to be refunded within the next one year.
(b) Amount due from unitholder is unsecured, non-trade in nature, non-interest bearing and repayable on demand. This amount was subsequently received in February 2021.
(c) The amount due from equity-accounted investees of US$1.7 million (2020: US$2.6 million) is non-trade, unsecured, non-interest bearing and repayable on demand.
(d) Included in the amounts due from other third parties are proceeds from sale of interest in equity accounted associate (Project Wawa) of US$6.7 million due from San Lorenzo Ruiz Builders & Developers Group Inc. The Combined Group made a provision for impairment loss amounting to 100% of such receivables.
(e) Included in non-current and current other receivables are delayed liquidated damages receivable from EPC contractors in Indonesia of US$1.8 million (2020: US$2.9 million).
Disaggregation of trade receivables
A summary of the Combined Group’s exposure to credit risk for trade receivables by geographic region is as follows:
30 June 2021
31 December 2020
US$’000 US$’000
India 70,183 66,901 Indonesia 3,458 1,603 Thailand 4,424 4,391 Others 5 47
78,070 72,942
As at reporting date, some trade and other receivables were pledged as collateral to secure project finance debts (see note 16).

Vena Energy Holdings Ltd and its subsidiaries
Vena Energy (Taiwan) Holdings Ltd and its subsidiaries
Zenith Japan Holdings Trust and its subsidiaries
Condensed interim financial statements
For the six months ended 30 June 2021
FS28
16 Loans and borrowings and lease liabilities
Note 30 June
2021 31 December
2020 US$’000 US$’000
Non-current
Loans and borrowings: - Project finance debt 1,392,544 1,308,264 - Corporate Term loan 125,949 142,689 - Revolving credit facility 69,568 179,090 - Euro Medium term note (a) 321,838 321,415
1,909,899 1,951,458
Lease liabilities 318,249 306,626
Current
Loans and borrowings: - Project finance debt 87,626 126,918 - External party loan 2,480 2,479 - Working capital loans 15,163 14,740 - Interest payable 6,007 6,752
111,276 150,889
Lease liabilities 13,307 11,014
2,352,731 2,419,987
(a) On 27 February 2020, a related party, Vena Energy Capital Pte. Ltd. (“Euro Medium Term Note Issuer”) US$325,000,000 3.133% per annum notes due in 2025 listed on Singapore Exchange Securities Trading Limited (“SGX-ST”) under the $1 billion Global Medium Term Note Programme (the “Notes”). The Notes bear interest at the rate of 3.133% per annum from and including 26 February 2020, and interest will be payable semi-annually in arrears on 26 February and 26 August in each year, commencing on 26 August 2020. The Notes will mature on 26 February 2025.
The Holding Companies jointly and severally act as guarantors for Vena Energy Capital Pte. Ltd. for this bond issuance. The due and punctual payment of all sums payable by Vena Energy Capital Pte. Ltd. from time to time in respect of the bond will be unconditionally and irrevocably guaranteed on a joint and several basis by the guarantors.
The below table show the notional amount of outstanding loans and borrowings not including transaction costs.
Gross debt
30 June 2021
31 December 2020
US$’000 US$’000 Non-current
Project finance debt 1,412,935 1,329,040 Corporate Term loan 125,949 142,689 Revolving credit facility 72,157 179,090 Euro Medium Term Note 325,000 325,000
1,936,041 1,975,819
Current
Project finance debt 89,615 128,486 External party loan 2,480 2,479 Bank overdrafts 15,163 14,740
107,258 145,705
2,043,299 2,121,524

Vena Energy Holdings Ltd and its subsidiaries
Vena Energy (Taiwan) Holdings Ltd and its subsidiaries
Zenith Japan Holdings Trust and its subsidiaries
Condensed interim financial statements
For the six months ended 30 June 2021
FS29
16 Loans and borrowings and lease liabilities (cont’d)
Terms and conditions of loans and borrowings are as follows:
Currency Maturity date
Principal amount Interest rate 2021
US$’0002020
US$’0002021
%2020
%
Project finance debt AUD 2021-2044 123,066 126,554 BBSY+1.2 BBSY+1.65 Project finance debt AUD 2025 68,503 18,300 BBSY+0.1765 BBSY + 0.1765Project finance debt INR 2035 98,104 98,401 10.25 10.25 Project finance debt INR 2033 16,775 17,454 9.55 9.55 Project finance debt INR 2033 20,262 21,473 9.50 9.5 Project finance debt INR 2028 11,316 11,972 10.90 10.9 Project finance debt INR 2033 45,548 47,865 10.05 - 10.09 10.05-10.09 Project finance debt INR 2033 11,908 11,908 MCLR+1.5 MCLR +1.5% Project finance debt INR 2035 61,068 63,176 9.25 10.75 Project finance debt INR 2035 27,170 28,384 10.20 10.2 Project finance debt INR 2035 71,555 74,149 10.22 10.22 Project finance debt INR 2035 61,636 35,504 7.39 7.39 Project finance debt THB 2027 77,873 92,636 4.2 & MLR-2.8 4.2 & MLR-2.8 Project finance debt USD 2037 104,896 107,298 3.9 - 5.721 3.9 - 5.721 Project finance debt USD 2037 12,238 12,654 3 - 5.7060 3 - 5.7060 Project finance debt USD 2037 6,253 6,466 1.1 - 5.7060 1.1 - 5.7060 Project finance debt USD 2037 16,934 17,510 1.5 - 5.7060 1.5 - 5.7060 Project finance debt NTD 2033 to 2038 96,192 92,352 TAIBOR+1.5 TAIBOR+1.5
Project finance debt JPY 2035 - 2039 570,455 573,470 1-month to 6-
month of TIBOR + 0.5% to 1.0%
3-month TIBOR + 0.62 to 0.70 &
LIBOR + 0.62% to 0.7%
External party loan USD 2021 2,480 2,479 Interest free Interest free Term loan JPY 2024 15,163 142,689 10.9-11.45% LIBOR+1.75 Revolving credit facility JPY 2024 198,106 179,090 LIBOR+1.25 LIBOR+1.25 Euro Medium term note JPY 2025 325,000 325,000 3.133 3.133%
2,042,501 2,106,784
Debt covenant
The loans and borrowings contain debt covenants which are tested on a regular basis. A future breach of these covenants may require the Combined Group to repay the loans and borrowings earlier than indicated in the table above.
The Combined Group has a secured bank loan with a carrying amount of US$4.7 million as at 30 June 2021 (2020: US$4.8 million). This loan is repayable in tranches within 5 years. However, the loan contains a covenant stating that at the end of each quarter, the debt to equity ratio shall be less than 4 times and the ratio of the aggregate of all of the Combined Group’s liabilities to the Combined Group’s liabilities paid in capital does not exceed the ratio of 82:18 at any time throughout the duration of the agreement, otherwise the loan will be repayable on demand.
The Combined Group exceeded its maximum leverage threshold as at 30 June 2021. The Combined Group had obtained a waiver letter in August 2021 from the bank and this bank loan has been reclassified from non-current to current as at 30 June 2021.

Vena Energy Holdings Ltd and its subsidiaries
Vena Energy (Taiwan) Holdings Ltd and its subsidiaries
Zenith Japan Holdings Trust and its subsidiaries
Condensed interim financial statements
For the six months ended 30 June 2021
FS30
16 Loans and borrowings and lease liabilities (cont’d)
Leverage ratio
Pursuant to the amendment and restatement agreement dated 21 May 2021 relating to the existing facilities agreement between Vena Energy Holdings Ltd., Vena Energy (Taiwan) Holdings Ltd. (“VETHL”), Zenith Japan Holdings Trust (“ZJHT”) and Credit Agricole Corporate and Investment Bank acting as agent and issuing bank (the “RCF Facility Agreement”), Vena Energy Holdings Ltd. has complied with all covenants as at 30 June 2021.
Pledges for facilities agreements
The Combined Group has entered into several Facilities agreements with various financial institutions. Under these agreements, these financial institutions provide project financing debts of US$1,503 million (2020: US$1,458 million) to the Combined Group on a combination of fixed and floating rates.
The obligations of the Combined Group to the banks are collateralised by the pledges of all the shares of the project entities and liens on and security interests in substantially all of the project entities’ assets, its rights under various agreements, all of the project entities’ revenues and all insurance proceeds payable to the project entities and require the project entities to comply with various administrative requirements.
As at 30 June 2021 and 31 December 2020, the assets of the project entities pledged in relation to the facilities agreements are as follows:
30 June 2021
31 December 2020
US$’000 US$’000
Property, plant and equipment 1,524,037 1,444,885 Right-of-use assets 98,495 111,208 Intangible assets 176,083 180,522 Prepayments and other assets 5,915 6,989 Trade and other receivables 205,348 180,276 Deferred tax assets 1,954 4,933 Cash and cash equivalents 178,209 208,783
Loan receivables 58,090 61,782
Other investment 204 205
2,248,335 2,199,583

Vena Energy Holdings Ltd and its subsidiaries
Vena Energy (Taiwan) Holdings Ltd and its subsidiaries
Zenith Japan Holdings Trust and its subsidiaries
Condensed interim financial statements
For the six months ended 30 June 2021
FS31
17 Trade and other payables
Note 30 June
2021 31 December
2020 US$’000 US$’000
Non-currentDeferred income (a) 1,916 2,082
CurrentTrade payables 9,508 10,124 Payables to EPC contractors 28,549 19,257 Accrued operating expenses 60,268 56,446 Accrued staff costs 1,988 1,793 Deferred income (b) 6,111 5,912 Other tax payable 7,474 12,254 Amount due to:
- Equity-accounted investees (c) 141 351 - Other third parties (d) 16,126 14,941
130,165 121,078
(a) Non-current deferred income relates to advanced mobilization payments received from non-related parties, amortised over period with regards to operations and maintenance agreements.
(b) Included in current deferred income is contract liabilities of US$0.8 million (2020: US$0.3 million) which relates to advances received from customers for services yet to be fulfilled, US$4.7 million (2020: US$4.9 million) which relates to government grants on project, amortized over PPA period of 25 years, US$0.2 million (2020: US$0.2 million) which relates to government grants on bond issuance, amortized over bond life of 5 years.
(c) The amount due to equity-accounted investees of US$141,000 (2020: US$351,000) is non-trade, unsecured, non-interest bearing and repayable on demand.
(d) Included in amounts due to other third parties are due to seller of a subsidiary of Zenith Japan Holdings Trust upon acquisition of US$6 million (2020: US$6 million).
18 Revenue
The Combined Group’s revenue comprises:
Six months period ended30 June
202130 June
2020
US$’000 US$’000
Sale of energy 153,468 145,545 Service concession income – 1,119 Fee income - Shared services fee income from equity-accounted investees 3,937 4,249
157,405 150,913

Vena Energy Holdings Ltd and its subsidiaries
Vena Energy (Taiwan) Holdings Ltd and its subsidiaries
Zenith Japan Holdings Trust and its subsidiaries
Condensed interim financial statements
For the six months ended 30 June 2021
FS32
18 Revenue (cont’d)
Sale of energy
The following table provides information about the nature and timing of the satisfaction of performance obligations in contracts with customers, including significant payment terms, and the related revenue recognition policies.
Nature of goods or services Sale of renewable energy
When revenue is recognised Revenue from sale of electricity is recognised in profit or loss when the electricity generated is dispatched to the customer.
Revenue is determined based on the units of sales delivered at the applicable tariff rates.
Payment terms 15 – 90 days
Disaggregation of revenue from contracts with customers
In the following table, revenue from contracts with customers is disaggregated by primary geographical markets.
Six months period ended30 June
202130 June
2020 US$’000 US$’000
Japan 52,394 51,379 Taiwan 8,626 7,467 Thailand 24,334 24,478 India 46,834 42,700 Australia 7,040 5,766 Indonesia 14,240 13,755
Total Revenue 153,468 145,545
Contract balances
Please refer to note 15 for contract assets primarily relating to the Combined Group’s right to consideration for sale of renewable energy but not billed at the reporting date. The contract assets are transferred to trade receivables when the rights become unconditional. This usually occurs when the Combined Group invoices the customer.
Please refer to note 17 for contract liabilities primarily relating to advance consideration received from customers for performance of service contracts.
19 Other income Six months period ended 30 June
202130 June
2020
US$’000 US$’000
Insurance claim 148 1,412 Government grants 199 197 Others 1,052 263
1,399 1,872

Vena Energy Holdings Ltd and its subsidiaries
Vena Energy (Taiwan) Holdings Ltd and its subsidiaries
Zenith Japan Holdings Trust and its subsidiaries
Condensed interim financial statements
For the six months ended 30 June 2021
FS33
20 Operating costs Six months period ended30 June
202130 June
2020
US$’000 US$’000
Operations and maintenance costs 14,034 11,790 Utilities and transmission costs 2,090 2,606 Asset related insurance 2,368 1,777 Professional fees 2,212 1,898 Rental - land & site office 347 203 IT expenses 4 4 Asset related tax and levies 3,614 2,391 Other general and administrative costs 1,174 953
25,843 21,622
Staff costs of US$2.4 million (2020: US$2.3 million) is included within operations and maintenance costs.
21 Shared services costs Six months period ended30 June
2021 30 June
2020
US$’000 US$’000
Staff costs 26,204 20,651 Directors and Investment Committee members fee 351 320 Occupancy costs 536 576 IT expenses 1,002 902 Professional fees 3,356 2,352 Secondment fee – 161 Insurance 306 220 Travel and entertainment expenses 906 796 Other general and administrative costs 1,240 1,955
33,901 27,933 Less: shared service costs capitalised (15,140) (12,957)
18,761 14,976
22 Development costs Six months period ended30 June
202130 June
2020
US$’000 US$’000
Staff costs 2 1 Professional fees 693 300 Travel and entertainment expenses 91 127 Occupancy costs 40 110 Other general and administrative costs 614 425
1,440 963
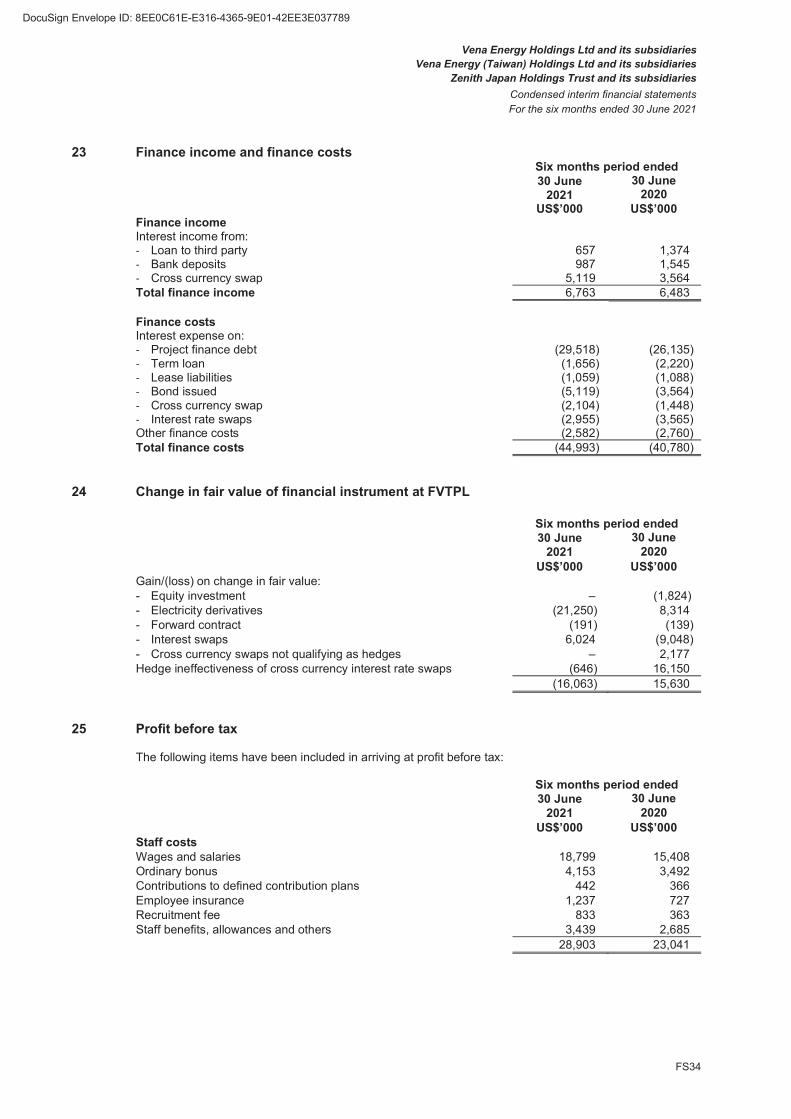
Vena Energy Holdings Ltd and its subsidiaries
Vena Energy (Taiwan) Holdings Ltd and its subsidiaries
Zenith Japan Holdings Trust and its subsidiaries
Condensed interim financial statements
For the six months ended 30 June 2021
FS34
23 Finance income and finance costs Six months period ended30 June
202130 June
2020 US$’000 US$’000
Finance incomeInterest income from: - Loan to third party 657 1,374 - Bank deposits 987 1,545 - Cross currency swap 5,119 3,564 Total finance income 6,763 6,483
Finance costsInterest expense on: - Project finance debt (29,518) (26,135) - Term loan (1,656) (2,220) - Lease liabilities (1,059) (1,088) - Bond issued (5,119) (3,564) - Cross currency swap (2,104) (1,448) - Interest rate swaps (2,955) (3,565) Other finance costs (2,582) (2,760) Total finance costs (44,993) (40,780)
24 Change in fair value of financial instrument at FVTPL
Six months period ended30 June
2021 30 June
2020
US$’000 US$’000 Gain/(loss) on change in fair value: - Equity investment – (1,824) - Electricity derivatives (21,250) 8,314 - Forward contract (191) (139) - Interest swaps 6,024 (9,048) - Cross currency swaps not qualifying as hedges – 2,177 Hedge ineffectiveness of cross currency interest rate swaps (646) 16,150
(16,063) 15,630
25 Profit before tax
The following items have been included in arriving at profit before tax:
Six months period ended30 June
2021 30 June
2020
US$’000 US$’000 Staff costsWages and salaries 18,799 15,408 Ordinary bonus 4,153 3,492 Contributions to defined contribution plans 442 366 Employee insurance 1,237 727 Recruitment fee 833 363 Staff benefits, allowances and others 3,439 2,685
28,903 23,041

Vena Energy Holdings Ltd and its subsidiaries
Vena Energy (Taiwan) Holdings Ltd and its subsidiaries
Zenith Japan Holdings Trust and its subsidiaries
Condensed interim financial statements
For the six months ended 30 June 2021
FS35
26 Fair value of financial instruments
Fair value measurement
Fair value is the price that would be received to sell an asset or paid to transfer a liability in an orderly transaction between market participants at the measurement date in the principal or, in its absence, the most advantageous market to which the Combined Group has access at that date. The fair value of a liability reflects its non-performance risk.
When available, the Combined Group measures the fair value of an instrument using the quoted price in an active market for that instrument. A market is regarded as active if transactions for the asset or liability take place with sufficient frequency and volume to provide pricing information on an ongoing basis. The Combined Group measures instruments quoted in an active market at mid-price.
If there is no quoted price in an active market, then the Combined Group uses valuation techniques that maximise the use of relevant observable inputs and minimise the use of unobservable inputs. The chosen valuation technique incorporates all of the factors that market participants would take into account in pricing a transaction.
The Combined Group recognises transfers between levels of the fair value hierarchy as at the end of the reporting period during which the change has occurred.
The Combined Group measures fair values using the following fair value hierarchy that reflects the significance of the inputs used in making the measurements.
Level 1: Inputs that are quoted market prices (unadjusted) in active markets for identical instruments.
Level 2: Inputs other than quoted prices included within Level 1 that are observable either directly (i.e. as prices) or indirectly (i.e. derived from prices). This category includes instruments valued using: quoted market prices in active markets for similar instruments; quoted prices for identical or similar instruments in markets that are considered less than active; or other valuation techniques in which all significant inputs are directly or indirectly observable from market data.
Level 3: Inputs that are unobservable. This category includes all instruments for which the valuation technique includes inputs not based on observable data and the unobservable inputs have a significant effect on the instrument’s valuation. This category includes instruments that are valued based on quoted prices for similar instruments but for which significant unobservable adjustments or assumptions are required to reflect differences between the instruments.

Ven
a E
nerg
y H
old
ing
s L
td a
nd
its
su
bsid
iari
es
Ven
a E
nerg
y (
Ta
iwan
) H
old
ing
s L
td a
nd
its
su
bsid
iari
es
Zen
ith
Jap
an
Ho
ldin
gs T
rust
an
d i
ts s
ub
sid
iari
es
Conde
nsed inte
rim
fin
an
cia
l sta
tem
ents
For
the s
ix m
onth
s e
nded 3
0 J
une 2
021
FS
36
26
F
air
valu
e o
f fi
na
nc
ial in
str
um
en
ts (
co
nt’
d)
Acc
ou
nti
ng
cla
ss
ific
ati
on
an
d f
air
valu
e
Th
e t
ab
le b
elo
w s
um
ma
rises th
e c
lassi
fica
tion
of
the
fin
an
cia
l a
sse
ts a
nd
liab
ilities o
f th
e C
om
bin
ed
Gro
up.
It d
oes n
ot
incl
ud
e f
air
va
lue
in
form
atio
n f
or
fin
ancia
l asse
ts
an
d f
inan
cia
l lia
bili
ties
no
t m
ea
sure
d a
t fa
ir v
alu
e if
the c
arr
yin
g a
mo
un
t is
a r
ea
so
na
ble
ap
pro
xim
ation
of
fair
va
lue
. A
t th
e r
ep
ort
ing
da
te,
the
fa
ir v
alu
es o
f tr
ad
e a
nd
oth
er
rece
iva
ble
s,
cash
an
d c
ash
eq
uiv
ale
nts
an
d t
rade
an
d o
the
r p
aya
ble
s a
re e
qu
iva
len
t to
th
e c
arr
yin
g a
mo
un
ts s
ho
wn
in t
he s
tate
me
nt
of
fina
nci
al po
siti
on d
ue
to
the
sh
ort
-te
rm m
atu
rity
of
the
se f
ina
nci
al i
nstr
um
en
ts
Carr
yin
g a
mo
un
tF
air
va
lue
Ma
nd
ato
rily
a
t F
VT
PL
Am
ort
ise
d
co
st
Oth
er
fin
an
cia
l li
ab
ilit
ies
To
tal
Le
ve
l 1
Le
ve
l 2
Le
ve
l 3
To
tal
US
$’0
00
US
$’0
00
US
$’0
00
US
$’0
00
US
$’0
00
US
$’0
00
US
$’0
00
US
$’0
00
30
Ju
ne
202
1T
rade
an
d o
the
r re
ceiv
ab
les*
–
13
7,5
35
–
13
7,5
35
–
–
–
–
Ca
sh
an
d c
ash
equ
iva
len
ts
–
33
2,3
58
–
33
2,3
58
–
–
–
–
Oth
er
inve
stm
en
ts
6,4
05
–
–
6,4
05
–
–
6,4
05
6,4
05
De
riva
tive
asse
ts
17
4,6
32
–
–
17
4,6
32
–
–
17
4,6
32
17
4,6
32
Lo
ans r
ece
iva
ble
s–
4
7,0
28
–
47
,028
–
45
,564
–
45
,564
Lo
ans a
nd
bo
rro
win
gs
–
–
(2,0
21
,17
5)
(2,0
21
,17
5)
–
(2,0
49,3
06
) –
(2
,04
9,3
06
) D
eri
va
tive
lia
bili
ties
(28
,792
) –
–
(2
8,7
92
) –
(2
8,7
92
) –
(2
8,7
92
) T
rade
an
d o
the
r pa
yab
les*
–
–
(11
6,5
80
) (
11
6,5
80
) –
–
–
–
1
52
,24
5
516
,92
1
(2,1
37
,75
5)
(1,4
68
,58
9)
* E
xcl
udes
non-f
inanci
al a
ssets
and li
abili
ties

Ven
a E
nerg
y H
old
ing
s L
td a
nd
its
su
bsid
iari
es
Ven
a E
nerg
y (
Ta
iwan
) H
old
ing
s L
td a
nd
its
su
bsid
iari
es
Zen
ith
Jap
an
Ho
ldin
gs T
rust
an
d i
ts s
ub
sid
iari
es
Conde
nsed inte
rim
fin
an
cia
l sta
tem
ents
For
the s
ix m
onth
s e
nded 3
0 J
une 2
021
FS
37
26
F
air
valu
e o
f fi
na
nc
ial in
str
um
en
ts (
co
nt’
d)
Acc
ou
nti
ng
cla
ss
ific
ati
on
an
d f
air
valu
e (
co
nt’
d)
Th
e t
ab
le b
elo
w s
um
ma
rises th
e c
lassi
fica
tion
of
the
fin
an
cia
l a
sse
ts a
nd
liab
ilities o
f th
e C
om
bin
ed
Gro
up.
It d
oes n
ot
incl
ud
e f
air
va
lue
in
form
atio
n f
or
fin
ancia
l asse
ts
an
d f
inan
cia
l lia
bili
ties
no
t m
ea
sure
d a
t fa
ir v
alu
e if
the c
arr
yin
g a
mo
un
t is
a r
ea
so
na
ble
ap
pro
xim
ation
of
fair
va
lue
. A
t th
e r
ep
ort
ing
da
te,
the
fa
ir v
alu
es o
f tr
ad
e a
nd
oth
er
rece
iva
ble
s,
cash
an
d c
ash
eq
uiv
ale
nts
an
d t
rade
an
d o
the
r p
aya
ble
s a
re e
qu
iva
len
t to
th
e c
arr
yin
g a
mo
un
ts s
ho
wn
in t
he s
tate
me
nt
of
fina
nci
al po
siti
on d
ue
to
the
sh
ort
-te
rm m
atu
rity
of
the
se f
ina
nci
al i
nstr
um
en
ts
Ca
rry
ing
am
ou
nt
Fa
ir v
alu
eM
an
da
tori
ly
at
FV
TP
LA
mo
rtis
ed
c
os
tO
the
r fi
na
nc
ial
liab
ilit
ies
To
tal
Le
vel
1L
ev
el 2
Le
ve
l 3
To
tal
US
$’0
00
US
$’0
00
US
$’0
0U
S$
’000
US
$’0
00
US
$’0
00
US
$’0
00
US
$’0
00
31
De
cem
be
r 20
20
Tra
de
an
d o
the
r re
ce
iva
ble
s –
470
,338
–
4
70
,33
8
–
–
–
–C
ash
an
d c
ash
equ
iva
len
ts
–3
40
,46
9
–
34
0,4
69
–
–
–
–O
the
r in
ve
stm
en
ts
2,4
33
–
–
2,4
33
–
–
2,4
33
2,4
33
De
riva
tive
asse
ts
18
3,7
32
–
–
18
3,7
32
–
1,3
50
18
2,3
82
18
3,7
32
Lo
an
re
ceiv
ab
les
–6
0,7
46
–
60
,746
–
61
,214
–
61
,214
De
riva
tive
lia
bili
ties
(48
,822
)–
–
(4
8,8
22
)–
(4
8,8
22
)–
(4
8,8
22
)L
oa
ns a
nd
bo
rro
win
gs
––
(2
,102
,34
7)
(2,1
02
,347
)–
(2
,12
8,2
76
)–
(2
,12
8,2
76)
Tra
de a
nd
oth
er
paya
ble
s*
––
(1
00
,83
0)
(10
0,8
30
)–
–
–
–
13
7,3
43
87
1,5
53
(2,2
03
,17
7)
(1,1
94
,28
1)
* E
xcl
udes
non-f
inanci
al a
ssets
and li
abili
ties

Vena Energy Holdings Ltd and its subsidiaries
Vena Energy (Taiwan) Holdings Ltd and its subsidiaries
Zenith Japan Holdings Trust and its subsidiaries
Condensed Combined Interim Financial Statements
For the six months ended 30 June 2021
FS38
26 Fair value of financial instruments (cont’d)
Valuation techniques and significant unobservable inputs
The following tables show the valuation techniques used in measuring Level 2 and Level 3 fair values, as well as the significant unobservable inputs used.
Financial instruments measured at fair value
Type Valuation techniqueSignificant unobservable inputs
Inter-relationship between key unobservable inputs and fair value measurement
Other investments: Equity investments – at FVTPL
Discounted cash flows: The valuation model considers the present value of expected cash flows from the projects, discounted using a risk-adjusted discount rate.
Discount rate The estimated fair value would increase (decrease) if the discount rates was lower (higher).
Other investments: Debt investments – at FVTPL
Market comparison: The fair value is estimated considering current or recent quoted prices for identical securities in markets that are not active.
Not applicable. Not applicable.
Electricity derivative Discounted cash flows: The valuation model considers the present value of expected payment, discounted using a risk-adjusted discount rate. The expected payment is determined by considering the expectation of spot rates for the duration of the contract.
Electricity spot rates
Discount rate
The estimated fair value would increase (decrease) if: The electricity spot rate
was lower (higher); The discount rate was
lower (higher).
Interest rate swaps Swap models: The fair value is calculated as the present value of the estimated future cash flows. Estimates of future floating-rate cash flows are based on quoted swap rates, futures prices and interbank borrowing rates. Estimated cash flows are discounted using a yield curve constructed from similar sources and which reflects the relevant benchmark interbank rate used by market participants for this purpose when pricing interest rate swaps.
Not applicable. Not applicable.
Forward exchange contracts
Forward pricing: The fair value is determined using quoted forward rates at the reporting date and present value calculations based on yield curves in respective currencies.
Not applicable. Not applicable.

Vena Energy Holdings Ltd and its subsidiaries
Vena Energy (Taiwan) Holdings Ltd and its subsidiaries
Zenith Japan Holdings Trust and its subsidiaries
Condensed Combined Interim Financial Statements
For the six months ended 30 June 2021
FS39
26 Fair value of financial instruments (cont’d)
Valuation techniques and significant unobservable inputs (cont’d)
Financial instruments measured at fair value (cont’d)
Type Valuation techniqueSignificant unobservable inputs
Inter-relationship between key unobservable inputs and fair value measurement
Cross currency swaps Swap models: Cross currency swaps are measured using quoted forward exchange rates and yield curves from quoted interest rates of the respective currencies, matching maturities of the swaps.
Not applicable. Not applicable.
Financial instruments not measured at fair value
Type Valuation techniqueLoans and borrowings / Loans receivables
Discounted cash flows: The valuation model considers the present value of expected payment, discounted using a risk-adjusted discount rate.
Level 3 fair values
The following table shows a reconciliation from the opening balances to the ending balances for Level 3 fair values:
30 June 2021 31 December 2020 Equity
investments – at FVTPL
Electricity derivative
Equity investments –
at FVTPL Electricity derivative
US$’000 US$’000 US$’000 US$’000
Beginning balance 2,433 182,382 3,262 117,992 Purchases 4,870 – – – Total unrealised gains and losses
recognised in profit or loss – (20,872) (829) 48,101 Foreign currency translation
recognised in OCI (898) (926) – 16,289
Ending balance 6,405 160,584 2,433 182,382

Vena Energy Holdings Ltd and its subsidiaries
Vena Energy (Taiwan) Holdings Ltd and its subsidiaries
Zenith Japan Holdings Trust and its subsidiaries
Condensed Combined Interim Financial Statements
For the six months ended 30 June 2021
FS40
27 Hedge Accounting
Net investment hedges
A foreign currency exposure arises from the Combined Group’s net investment in its Japan subsidiaries that has a JPY functional currency. The risk arises from the fluctuation in spot exchange rates between the JPY and the USD, which causes the amount of the net investment to vary.
The hedged risk in the net investment hedge is the risk of a weakening JPY against the USD that will result in a reduction in the carrying amount of the Combined Group’s net investment in the Japan subsidiaries.
Part of the Combined Group’s net investment in its Japan subsidiaries is hedged by a derivative instrument which is the JPY/USD cross currency interest rate swap, which mitigates the foreign currency risk arising from the subsidiaries’ net assets. The derivative instrument is designated as a hedging instrument for the changes in the value of the net investment that is attributable to changes in the USD/JPY spot rate.
To assess hedge effectiveness, the Combined Group determines the economic relationship between the hedging instrument and the hedged item by comparing changes in the notional amount of the cross currency interest rate swap that is attributable to a change in the spot rate with changes in the investment in the foreign operation due to movements in the spot rate (the offset method).

Ven
a E
nerg
y H
old
ing
s L
td a
nd
its
su
bsid
iari
es
Ven
a E
nerg
y (
Taiw
an
) H
old
ing
s L
tdan
d i
ts s
ub
sid
iari
es
Zen
ith
Jap
an
Ho
ldin
gs T
rus
t an
d i
ts s
ub
sid
iari
es
Conde
nsed C
om
bin
ed
Inte
rim
Fin
an
cia
l S
tate
ments
For
the s
ix m
onth
s e
nded 3
0 J
une 2
021
FS
41
27
Hed
ge A
cco
un
tin
g (
co
nt’
d)
Ne
t in
ves
tme
nt
he
dg
es
(co
nt’
d)
Th
e a
mo
unts
re
late
d to
ite
ms d
esig
na
ted
as h
ed
gin
g in
stru
me
nts
we
re a
s fo
llow
s.
30 J
un
e 2
021
Du
rin
g t
he
six
mo
nth
s e
nd
ed
30 J
un
e 2
02
1
No
min
al
am
ou
nt
Carr
yin
g
am
ou
nt
–as
sets
Carr
yin
g
am
ou
nt
–
liab
ilit
ies
Lin
e i
tem
in
th
e
sta
tem
en
t o
f fi
nan
cia
l p
os
itio
n w
here
the h
ed
gin
g
instr
um
en
t is
in
clu
de
d
Ch
an
ge in
va
lue u
sed
fo
r c
alc
ula
tin
g
hed
ge
in
eff
ecti
ven
ess
for
20
21
Ch
an
ge in
va
lue
of
hed
gin
g
instr
um
en
t re
co
gn
ise
d
in O
CI
Hed
ge
in
eff
ecti
ve
ness
reco
gn
ise
d i
n
pro
fit
or
loss
Lin
e ite
m i
n
pro
fit
or
loss
that
inclu
de
s
hed
ge
ineff
ecti
ve
ness
Am
ou
nt
recla
ssif
ied
fr
om
hed
gin
g
reserv
e t
o
pro
fit
or
loss
Lin
e ite
m
aff
ecte
d i
n p
rofi
t o
r lo
ss b
ec
au
se
o
f th
e
recla
ssif
icati
on
$’0
00
$’0
00
$’0
00
$’0
00
$’0
00
$’0
00
$’0
00
Cro
ss C
urr
en
cy Inte
rest R
ate
S
wap
35
,978
,150
23
,134
–D
erivativ
e
assets
(23
,780)
23
,780
–
Chang
e in f
air
valu
e o
f financia
l in
str
um
ent
at
FV
TP
L–
Not
applic
able
31
Decem
ber
2020
Du
rin
g t
he
yea
r en
ded
31 D
ecem
be
r 2020
No
min
al
am
ou
nt
Carr
yin
g
am
ou
nt
–as
sets
Carr
yin
g
am
ou
nt
–
liab
ilit
ies
Lin
e i
tem
in
th
e
sta
tem
en
t o
f fi
nan
cia
l p
os
itio
n
wh
ere
th
e
he
dg
ing
in
str
um
en
t is
in
clu
de
d
Ch
an
ge in
va
lue u
sed
fo
r c
alc
ula
tin
g
hed
ge
in
eff
ecti
ven
ess
for
20
20
Ch
an
ge in
va
lue
of
hed
gin
g
instr
um
en
t re
co
gn
ise
d
in O
CI
Hed
ge
in
eff
ecti
ve
ness
reco
gn
ise
d i
n
pro
fit
or
loss
Lin
e ite
m i
n
pro
fit
or
loss
that
inclu
de
s
hed
ge
ineff
ecti
ve
ness
Am
ou
nt
recla
ssif
ied
fr
om
hed
gin
g
res
erv
e t
o
pro
fit
or
loss
Lin
e ite
m
aff
ecte
d i
n p
rofi
t o
r lo
ss b
ec
au
se
o
f th
e
recla
ssif
icati
on
$’0
00
$’0
00
$’0
00
$’0
00
$’0
00
$’0
00
$’0
00
Cro
ss C
urr
en
cy Inte
rest R
ate
S
wap
35
,978
,150
(11,2
01)
Derivativ
e
liabili
ties
23,2
88
(23,2
88)
–
Chang
e in f
air
valu
e o
f financia
l in
str
um
ent
at
FV
TP
L–
Not
applic
able

Ven
a E
nerg
y H
old
ing
s L
td a
nd
its
su
bsid
iari
es
Ven
a E
nerg
y (
Taiw
an
) H
old
ing
s L
tdan
d i
ts s
ub
sid
iari
es
Zen
ith
Jap
an
Ho
ldin
gs T
rus
t an
d i
ts s
ub
sid
iari
es
Conde
nsed C
om
bin
ed
Inte
rim
Fin
an
cia
l S
tate
ments
For
the s
ix m
onth
s e
nded 3
0 J
une 2
021
FS
42
27
Hed
ge A
cco
un
tin
g (
co
nt’
d)
The
am
oun
ts r
ela
ted
to
ite
ms d
esig
na
ted
as h
ed
ge
d ite
ms w
ere
as f
ollo
ws.
30
Ju
ne
20
21
Du
rin
g t
he
six
mo
nth
s e
nd
ed
30
Ju
ne
20
21
Ch
an
ge
in
va
lue u
se
d f
or
c
alc
ula
tin
g
he
dg
e in
eff
ec
tiv
en
es
s
Fo
reig
n c
urr
en
cy
tr
an
sla
tio
n
res
erv
e
Ba
lan
ces
re
main
ing
in
th
e
fore
ign
cu
rren
cy
tr
an
sla
tio
n r
es
erv
e f
rom
h
ed
gin
g r
ela
tio
nsh
ips
fo
r w
hic
h
he
dg
e a
cc
ou
nti
ng
is
no
lo
ng
er
ap
pli
ed
$’0
00
$’0
00
$’0
00
JP
Y n
et in
ve
stm
en
t (2
3,7
80
) 2
3,7
80
No
t a
pplic
able
31
De
cem
be
r 20
20
Du
rin
g t
he
ye
ar
en
de
d 3
1 D
ec
em
ber
20
20
Ch
an
ge
in
va
lue u
se
d f
or
c
alc
ula
tin
g
he
dg
e in
eff
ec
tiv
en
es
s
Fo
reig
n c
urr
en
cy
tr
an
sla
tio
n
res
erv
e
Ba
lan
ces
re
main
ing
in
th
e
fore
ign
cu
rren
cy
tr
an
sla
tio
n r
es
erv
e f
rom
h
ed
gin
g r
ela
tio
nsh
ips
fo
r w
hic
h
he
dg
e a
cc
ou
nti
ng
is
no
lo
ng
er
ap
pli
ed
$’0
00
$’0
00
$’0
00
JP
Y n
et in
ve
stm
en
t 2
3,2
88
(23
,288
) N
ot
ap
plic
ab
le

Vena Energy Holdings Ltd and its subsidiaries
Vena Energy (Taiwan) Holdings Ltd and its subsidiaries
Zenith Japan Holdings Trust and its subsidiaries
Condensed Combined Interim Financial Statements
For the six months ended 30 June 2021
FS43
28 Reserves
The reserves of the Combined Group comprises the following balances:
30 June 2021
31 December 2020
US$’000 US$’000
Capital reserve 50,000 50,000 Translation reserve 11,870 144,845 Defined benefit reserve (46) (27)
61,824 194,818
Capital reserve
The capital reserves comprise equity injections by shareholders for which ordinary shares have yet to be issued.
Translation reserve
The translation reserve comprises all foreign currency differences arising from the translation of the financial statements of foreign operations.
Defined benefit reserve
The defined benefit reserve comprises actuarial gains and losses and the return on plan assets (excluding interest).
29 Commitments
Acquisition
On April 2020, the Combined Group entered into a share purchase agreement to acquire 100% of Yokji. As part of the purchase consideration, the Combined Group has committed to contingent payments upon achieving of the project milestones.
In May 2021, the Combined Group made the contingent payment amounting to KRW2,200 million upon the execution of the grid connection agreement, and is recognised as part of the Combined Group's project-related agreements and licenses in Note 9 Intangible assets.
The Combined Group commits to pay the remaining contingent payment, amounting to KRW5,000 million, upon the submission of final and effective notice of the commencement of construction work to the competent Governmental Authority in relation to the project.
30 Related parties
During the period, other than those disclosed elsewhere in the combined financial statements, there were no other significant transactions with related parties.

Vena Energy Holdings Ltd and its subsidiaries
Vena Energy (Taiwan) Holdings Ltd and its subsidiaries
Zenith Japan Holdings Trust and its subsidiaries
Condensed Combined Interim Financial Statements
For the six months ended 30 June 2021
FS44
31 Contingent liability
Stand-by letter of credit
As at 30 June 2021, the stand-by letter of credit (“SBLC”) totalled to USD 8.1 million and expires over the period from September 2021 to April 2022. The SBLC bears an interest of LIBOR + 0.95% per annum (2020: LIBOR + 1.25% per annum).
32 Subsequent events
Bonds issuance
On 8 July 2021, a direct subsidiary, Vena Energy Capital Pte. Ltd. (“Euro Medium Term Note Issuer”), issued US$175,000,000 3.133% per annum notes due in 2025 listed on Singapore Exchange Securities Trading Limited (“SGX-ST”) under the US$1,000,000,000 Global Medium Term Note Programme (the ”Notes”). The Notes is to be consolidated and form a single series with the US$325,000,000 3.133% per annum notes issued on 26 February 2020. The Notes bear interest at the rate of 3.133% per annum from and including 26 February 2021, and interest will be payable semi-annually in arrears on 26 February and 26 August in each year, commencing on 26 August 2021. The Notes will mature on 26 February 2025.
The bond proceeds were allocated to the Vena Energy Holdings Ltd, Vena Energy (Taiwan) Holdings Ltd and Zenith Japan Holdings Ltd (as trustee for Zenith Japan Holdings Trust) through intercompany loans.
Vena Energy Holdings Ltd together with Vena Energy (Taiwan) Holdings Ltd and Zenith Japan Holdings Ltd (as trustee for Zenith Japan Holdings Trust) jointly and severally act as guarantors for Vena Energy Capital Pte. Ltd for this bond issuance. The due and punctual payment of all sums payable by Vena Energy Capital Pte. Ltd from time to time in respect of the bond will be unconditionally and irrevocably guaranteed on a joint and several basis by the guarantors.

KPMG LLP (Registration No. T08LL1267L), an accounting limited liability partnership registered in Singapore under the Limited Liability Partnership Act (Chapter 163A) and a member firm of the KPMG global organization of independent member firms affiliated with KPMG International Limited, a private English company limited by guarantee.
Vena Energy Holdings Ltd and its subsidiaries
Condensed Interim Financial Statements
For the six months ended 30 June 2021

Vena Energy Holdings Ltd and its subsidiaries
Statement by DirectorsFor the six months ended 30 June 2021
1
Statement by Directors
In our opinion:
(a) the accompanying condensed interim financial statements set out on pages FS1 to FS44 comprising the condensed statements of financial position of the Group and the Company as at 30 June 2021, the condensed statements of profit or loss and other comprehensive income, changes in equity and cash flows for the Group and for the Company for the six months period then ended, and notes to the condensed interim financial statements, including significant accounting policies as set out on pages FS1 to FS44, are prepared, in all material respects, in accordance with the International Accounting Standard (“IAS”) 34 Interim Financial Reporting; and
(b) at the date of this statement, there are reasonable grounds to believe that the Group will be able to pay its debts as and when they fall due.
The Board of Directors has, on the date of this statement, authorised the condensed interim financial statements for issue.
On behalf of the Board of Directors,
Director
8 September 2021

KPMG LLP
16 Raffles Quay #22-00
Hong Leong Building
Singapore 048581
Telephone +65 6213 3388
Fax +65 6225 0984
Internet www.kpmg.com.sg
2
KPMG LLP (Registration No. T08LL1267L), an accounting limited liability partnership registered in Singapore under the Limited Liability Partnership Act (Chapter 163A) and a member firm of the KPMG global organization of independent member firms affiliated with KPMG International Limited, a private English company limited by guarantee.
Independent auditors’ report
Member of the Company
Vena Energy Holdings Ltd
Report on review of Condensed Interim Financial Statements
Introduction
We have reviewed the accompanying Condensed Interim Financial Statements of Vena Energy
Holdings Ltd (“the Company”) and its Subsidiaries (collectively the “Group”), which comprise
the condensed statement of financial position of the Group and of the Company as at 30 June
2021, the condensed statements of profit or loss and other comprehensive income, changes in
equity and cash flows for the Group and for the Company for the six months period then ended,
and significant accounting policies and other explanatory notes (the Condensed Interim Financial
Statements). Management is responsible for the preparation and presentation of the Condensed
Interim Financial Statements in accordance with International Accounting Standard (“IAS”) 34
Interim Financial Reporting. Our responsibility is to express a conclusion on the Condensed
Interim Financial Statements based on our review.
Scope of review
We conducted our review in accordance with the International Standard on Review Engagements
2410 Review of Interim Financial Information Performed by the Independent Auditor of the
Entity. A review of interim financial statements consists of making inquiries, primarily of persons
responsible for financial and accounting matters, and applying analytical and other review
procedures. A review is substantially less in scope than an audit conducted in accordance with
International Standards on Auditing and consequently does not enable us to obtain assurance that
we would become aware of all significant matters that might be identified in an audit.
Accordingly, we do not express an audit opinion.
Conclusion
Based on our review, nothing has come to our attention that causes us to believe that the
accompanying Condensed Interim Financial Statements as at and for the six months ended 30
June 2021 are not prepared, in all material respects, in accordance with IAS 34 Interim Financial
Reporting.


Vena Energy Holdings Ltd and its subsidiaries
Condensed Interim Financial StatementsFor the six months ended 30 June 2021
FS1
The accompanying notes form an integral part of the condensed interim financial statements.
Condensed statements of financial position As at 30 June 2021
Group Company
Note30 June
202131 December
202030 June
202131 December
2020US$’000 US$’000 US$’000 US$’000
AssetsProperty, plant and equipment 6 888,426 832,765 – – Right-of-use assets 7 48,476 34,834 – – Intangible assets 8 1,060,007 1,089,835 – – Investment in subsidiaries 9 – – 1,873,132 1,857,956 Equity-accounted investees 10 387,878 383,796 – – Other investments 11 30,872 26,340 – – Deferred tax assets 7,882 8,508 – – Loans receivables 12 280,517 419,908 94,473 213,098 Derivative assets 13 166,238 176,353 – – Trade and other receivables 14 1,464 1,622 – – Prepayments and other assets 15 27,900 16,200 – – Non-current assets 2,899,660 2,990,161 1,967,605 2,071,054
Loans receivables 12 21,449 23,167 1,394 2,224 Trade and other receivables 14 161,195 157,336 3,517 2,287 Prepayments and other assets 15 8,486 7,817 2 5 Derivative assets 13 8,394 7,379 937 1,350 Cash and cash equivalents 16 227,326 208,841 98,149 75,603 Current assets 426,850 404,540 103,999 81,469
Total assets 3,326,510 3,394,701 2,071,604 2,152,523
Equity Equity contribution 17 1,566,719 1,566,719 1,566,719 1,566,719 Accumulated profits 61,854 63,718 31,580 5,358 Reserves 18 44,967 67,050 50,000 50,000 Equity attributable to owner
of the Company 1,673,540 1,697,487 1,648,299 1,622,077 Non-controlling interests 79,054 81,020 – – Total equity 1,752,594 1,778,507 1,648,299 1,622,077
LiabilitiesLoans and borrowings 19 1,320,690 1,367,218 401,826 502,075 Employee benefits 700 716 – – Derivative liabilities 13 11,071 28,342 – – Lease Liabilities 19 37,425 24,462 – – Asset retirement obligation 9,766 9,883 – – Trade and other payables 20 3,006 3,223 – – Deferred tax liabilities 22,668 17,186 – – Non-current liabilities 1,405,326 1,451,030 401,826 502,075
Loans and borrowings 19 81,648 78,362 13,274 18,227 Derivative liabilities 13 3,049 6,957 33 3,718 Lease Liabilities 19 5,273 4,132 – – Trade and other payables 20 78,476 75,223 8,172 6,426 Current tax liabilities 144 490 – – Current liabilities 168,590 165,164 21,479 28,371
Total liabilities 1,573,916 1,616,194 423,305 530,446
Total equity and liabilities 3,326,510 3,394,701 2,071,604 2,152,523

Vena Energy Holdings Ltd and its subsidiaries
Condensed Interim Financial StatementsFor the six months ended 30 June 2021
FS2
The accompanying notes form an integral part of the condensed interim financial statements.
Condensed statements of profit or loss and other comprehensive incomeFor the six months ended 30 June 2021
Group Company
NoteSix months
ended Six months
ended Six months
ended Six months
ended 30 June 2021 30 June 2020 30 June 2021 30 June 2020
US$’000 US$’000 US$’000 US$’000
Dividend income – – 9,214 9,916 Sale of energy 92,448 86,699 – – Service concession income – 1,119 – – Fee income 27,676 26,043 – –
Total revenue 21 120,124 113,861 9,214 9,916
Other income 22 1,404 1,071 – –
Cost of service concession income – (1,119) – –
Operating costs 23 (19,095) (16,374) – – Shared services costs 24 (33,131) (27,354) (143) (304) Development costs 25 (301) (199) – – Depreciation expense 6,7 (20,819) (18,894) – – Amortisation expense 8 (14,361) (14,235) – –
Results from operating activities (87,707) (78,175) (143) (304)
Finance income 26 8,955 8,419 898 1,213 Finance costs 26 (40,328) (36,893) (3,783) (3,716) Change in fair value of
financial instruments at FVTPL 27 9,627 8,151 (191) (140)
Net foreign exchange (loss)/ gain (11,751) (10,481) 20,227 (3,745)
Net finance (costs)/income (33,497) (30,804) 17,151 (6,388)
Write off of property, plant and equipment – (1) – –
Writeback of impairment loss on financial assets 77 917 – 1,662
Gain on disposal of property, plant and equipment 5 – – –
Expenses relating to acquisition of subsidiaries – (442) – –
Loss on disposal of interest in equity-accounted investees 10 – (435) – –
Share of net profit of equity-accounted investees, net of tax 10 10,223 6,469 – –
Profit before tax 28 10,629 12,461 26,222 4,886 Tax expense (7,615) (7,875) – –
Profit for the period 3,014 4,586 26,222 4,886
Profit attributable to: Owner of the Company (1,864) (204) Non-controlling interests 4,878 4,790
3,014 4,586

Vena Energy Holdings Ltd and its subsidiaries
Condensed Interim Financial StatementsFor the six months ended 30 June 2021
FS3
The accompanying notes form an integral part of the condensed interim financial statements.
Condensed statements of profit or loss and other comprehensive income (cont’d) For the six months ended 30 June 2021
Group Company
Six months ended
30 June 2021
Six months ended
30 June 2020
Six months ended
30 June 2021
Six months ended
30 June 2020 US$’000 US$’000 US$’000 US$’000
Other comprehensive income
Items that will not be reclassified to profit/(loss)
Remeasurement of defined benefit plan (3) – – –
(3) – – –
Items that are or may be reclassified subsequently to profit/(loss)
Foreign currency translation differences (21,473) (17,477) – –
Equity-accounted investees – share of OCI (3,503) 5,244 – –
Foreign currency translation differences on disposal of equity-accounted investees reclassified to profit/(loss) – 27 – –
Other comprehensive loss for the period (24,979) (12,206) – –
Total comprehensive (loss)/income for the period (21,965) (7,620) 26,222 4,886
Total comprehensive (loss)/income attributable to:
Owner of the Company (23,947) (11,228)Non-controlling interests 1,982 3,608
(21,965) (7,620)

Ven
a E
nerg
y H
old
ing
s L
td
an
d i
ts s
ub
sid
iari
es
Conde
nsed In
terim
Fin
ancia
l S
tate
ments
For
the s
ix m
on
ths e
nded 3
0 J
une 2
021
FS
4
The
acco
mpa
nyin
g n
ote
s fo
rm a
n in
tegra
l part
of
the c
on
densed inte
rim
fin
ancia
l sta
tem
en
ts.
Co
nd
en
sed
co
nso
lid
ate
d s
tate
me
nt
of
ch
an
ge
s in
eq
uit
yF
or
the
six
mo
nth
s e
nd
ed
30 J
un
e 2
02
1
Att
rib
uta
ble
to
ow
ne
r o
f th
e C
om
pa
ny
Eq
uit
y
co
ntr
ibu
tio
nA
cc
um
ula
ted
p
rofi
tsT
ran
sla
tio
n
res
erv
es
Oth
er
res
erv
es
To
tal
No
n-
co
ntr
oll
ing
in
tere
st
To
tal
eq
uit
yU
S$’0
00
US
$’0
00
US
$’0
00
US
$’0
00
US
$’0
00
US
$’0
00
US
$’0
00
At
1 J
an
ua
ry 2
02
1
1,5
66
,71
9
63
,718
17
,077
49
,973
1,6
97
,48
7
81
,020
1,7
78
,50
7
To
tal
co
mp
reh
en
siv
e i
nc
om
e f
or
the
pe
rio
dP
rofit
/(Lo
ss)
for
the p
erio
d
–
(1,8
64
)–
–
(1
,86
4)
4,8
78
3,0
14
Oth
er
co
mp
reh
en
siv
e i
nc
om
e/(
los
s)
Fo
reig
n c
urr
ency tra
nsla
tion
diff
ere
nce
s –
–
(1
8,5
77
)–
(1
8,5
77
)(2
,89
6)
(21
,473)
Eq
uity
-acc
oun
ted inve
ste
es –
sh
are
of
OC
I –
–
(3
,50
3)
–
(3,5
03
)–
(3
,503
)D
efin
ed b
ene
fit p
lan
rem
easu
rem
ents
–
–
–
(3
)(3
)–
(3
)T
ota
l co
mp
reh
en
siv
e i
nc
om
e/(
los
s)
for
the
pe
rio
d–
(1
,86
4)
(22
,080
)(3
)(2
3,9
47
)1,9
82
(21
,965)
Tra
nsa
cti
on
s w
ith
ow
ne
r, r
eco
gn
ise
d d
irec
tly
in
eq
uit
yC
on
trib
uti
on
s b
y a
nd
dis
trib
uti
on
s t
o o
wn
er
Div
ide
nds d
ecla
red
–
–
–
–
–
(3,9
48)
(3,9
48
)T
ota
l c
on
trib
uti
on
s b
y a
nd
dis
trib
uti
on
s t
o o
wn
er
–
–
–
–
–
(3,9
48)
(3,9
48
)
At
30
Ju
ne
202
11,5
66
,71
9
61
,854
(5,0
03
)4
9,9
70
1,6
73
,54
0
79,0
54
1,7
52
,59
4

Ven
a E
nerg
y H
old
ing
s L
td
an
d i
ts s
ub
sid
iari
es
Conde
nsed In
terim
Fin
ancia
l S
tate
ments
For
the s
ix m
on
ths e
nded 3
0 J
une 2
021
FS
5
The
acco
mpa
nyin
g n
ote
s fo
rm a
n in
tegra
l part
of
the c
on
densed inte
rim
fin
ancia
l sta
tem
en
ts.
Co
nd
en
sed
co
nso
lid
ate
d s
tate
me
nt
of
ch
an
ge
s in
eq
uit
y (
co
nt’
d)
Fo
r th
e s
ix m
on
ths e
nd
ed
30 J
un
e 2
02
0
Att
rib
uta
ble
to
ow
ne
r o
f th
e C
om
pa
ny
No
teE
qu
ity
co
ntr
ibu
tio
nA
cc
um
ula
ted
p
rofi
tsT
ran
sla
tio
n
res
erv
es
Oth
er
res
erv
es
To
tal
No
n-
co
ntr
oll
ing
in
tere
st
To
tal
eq
uit
yU
S$’0
00
US
$’0
00
US
$’0
00
US
$’0
00
US
$’0
00
US
$’0
00
US
$’0
00
At
1 J
an
ua
ry 2
02
0
1,6
90
,24
5
17
,343
(35
,772
)6
5,7
56
1,7
37,5
72
7
9,6
20
1,8
17
,19
2
To
tal
co
mp
reh
en
siv
ein
co
me
fo
r th
e p
eri
od
Pro
fit/(
Lo
ss)
for
the p
erio
d
–
(20
4)
–
–
(20
4)
4,7
90
4,5
86
Oth
er
co
mp
reh
en
siv
e i
nc
om
e/(
los
s)
Fo
reig
n c
urr
ency tra
nsla
tion
diff
ere
nce
s –
–
(1
6,2
95
)–
(1
6,2
95
)(1
,18
2)
(17
,477)
Eq
uity
-acc
oun
ted inve
ste
es –
sh
are
of
OC
I –
–
5
,24
4
–
5,2
44
–
5,2
44
Fo
reig
n c
urr
ency tra
nsla
tion
diff
ere
nce
s o
n d
isp
osa
l of
eq
uity
-a
cco
un
ted
investe
es r
ecla
ssifi
ed
to
pro
fit/(
loss)
–
–
27
–
27
–
27
To
tal
co
mp
reh
en
siv
e i
nc
om
e/(
los
s)
for
the
pe
rio
d–
(2
04
)(1
1,0
24
) –
(1
1,2
28
) 3,6
08
(7,6
20
)
Tra
ns
ac
tio
ns
wit
h o
wn
er,
rec
og
nis
ed
dir
ec
tly
in
eq
uit
yC
on
trib
uti
on
s b
y a
nd
dis
trib
uti
on
s t
o o
wn
er
Issu
an
ce o
f sha
res
17
15
,674
–
–
–
15
,674
–
15
,674
Co
nve
rsio
n o
f a
dva
nce
fro
m im
med
iate
hold
ing
co
mp
any
17
–
–
–
(15
,674
)(1
5,6
74
)–
(1
5,6
74)
Re
pu
rcha
se
of sh
are
s 1
7
(13
9,2
00
)–
–
–
(1
39
,20
0)
–
(139
,20
0)
Div
ide
nds d
ecla
red
–
–
–
–
–
(3,6
12)
(3,6
12
)T
ota
l c
on
trib
uti
on
s b
y a
nd
dis
trib
uti
on
s t
o o
wn
er
(12
3,5
26
)–
–
(1
5,6
74
)(1
39
,20
0)
(3,6
12)
(142
,81
2)
At
30
Ju
ne
202
01,5
66
,71
9
17
,139
(46
,796
)5
0,0
82
1,5
87
,14
4
79,6
16
1,6
66
,76
0

Vena Energy Holdings Ltd and its subsidiaries
Condensed Interim Financial StatementsFor the six months ended 30 June 2021
FS6
The accompanying notes form an integral part of the condensed interim financial statements.
Condensed company statement of changes in equityFor the six months ended 30 June 2021
NoteEquity
contributionOther
reserves Accumulated
profits Total US$’000 US$’000 US$’000 US$’000
At 1 January 2021 1,566,719 50,000 5,358 1,622,077
Total comprehensive income for the period
Profit for the period – – 26,222 26,222
At 30 June 2021 1,566,719 50,000 31,580 1,648,299
At 1 January 2020 1,690,245 65,674 (2,084) 1,753,835
Total comprehensive income for the period
Profit for the period – – 4,886 4,886
Transactions with owner, recogniseddirectly in equity
Distributions to owner Issuance of shares 17 15,674 – – 15,674 Conversion of advance from immediate
holding company 17 – (15,674) – (15,674) Repurchase of shares 17 (139,200) – – (139,200)
Total distributions to owner/Total transactions with owner (123,526) (15,674) – (139,200)
At 30 June 2020 1,566,719 50,000 2,802 1,619,521

Vena Energy Holdings Ltd and its subsidiaries
Condensed Interim Financial StatementsFor the six months ended 30 June 2021
FS7
The accompanying notes form an integral part of the condensed interim financial statements.
Condensed consolidated statement of cash flows For the six months ended 30 June 2021
Note
Six months ended
30 June 2021
Six months ended
30 June 2020Group US$’000 US$’000
Cash flows from operating activitiesProfit before tax 10,629 12,461 Adjustments for:Depreciation expense 6,7 20,819 18,894 Amortisation expense 8 14,361 14,235 Finance income 26 (8,955) (8,419) Finance costs 26 40,328 36,893 Change in fair value of financial instruments at FVTPL 27 (9,627) (8,151) Unrealised foreign exchange loss 4,105 1,895 Property, plant and equipment written off 6 – 1 Gain on disposal of property, plant and equipment 6 (5) – Writeback of impairment loss on financial assets (77) (917) Loss on disposal of interest in equity-accounted investees – 435 Share of net profit of equity-accounted investees, net of tax 10 (10,223) (6,469)
61,355 60,858 Changes in: - Trade and other receivables 1,152 (11,815) - Prepayments and other assets (11,678) (3,646) - Trade and other payables 1,141 (23,691) - Provisions and employee benefits – 4 Cash generated from operating activities 51,970 21,710 Tax paid (1,790) (2,007) Net cash generated from operating activities 50,180 19,703
Cash flows from investing activitiesPurchase of property, plant and equipment (97,931) (25,442) Proceeds from sale of property, plant and equipment 5 – Acquisition of interest in equity-accounted investees 10 (2,820) (857) Proceeds from disposal of interest in equity-accounted
investees – 300 Additions of project-related agreements and licences 8 (1,952) (516) Purchase of equity investments (4,353) (241) Disposal of debt instruments – 1,800 Disposal of financial instruments (3,455) – Purchase of financial instruments (1,995) – Proceeds from repayment of loans receivables from related
parties 291,011 609,535 Disbursement of loans to related parties (185,415) (379,398) Proceeds from repayment of loans receivables from equity-
accounted investees 13,770 2,179 Distributions from equity-accounted investees 10 4,923 8,088 Interest received 4,444 2,953 Net cash generated from investing activities 16,232 218,401

Vena Energy Holdings Ltd and its subsidiaries
Condensed Interim Financial StatementsFor the six months ended 30 June 2021
FS8
The accompanying notes form an integral part of the condensed interim financial statements.
Condensed consolidated statement of cash flows (cont’d) For the six months ended 30 June 2021
Six months ended
30 June 2021
Six months ended
30 June 2020Group Note US$’000 US$’000
Cash flows from financing activitiesRepurchase of ordinary shares – (139,200) Proceeds from drawdown of loans and borrowings - Revolving credit facility 161,548 326,749 - Project finance debt 84,854 21,047 - Working capital loans 16,493 – - Intercompany loans 38,234 – Proceeds from issuance of Euro Medium Term Note 19 – 325,000 Repayment of loans and borrowings - Revolving credit facility (263,157) (408,700) - Corporate term loan (7,510) (328,797) - Project finance debt (34,042) (18,021) - Working capital loans (15,899) – Payment of transaction costs - Project finance debt (3,838) (1,894) - Revolving credit facility (2,737) –
Payment of transaction costs related to Euro Medium Term Note – (4,003)
Payment of lease liabilities (8,199) (2,343) Interest paid on - Revolving credit facility (846) (299) - Corporate term loan (1,483) (2,306) - Project finance debt (26,822) (26,888) - Working capital loans (783) – - Euro Medium Term Note (5,091) –
Net interest received for derivatives 2,881 – Dividends paid to non-controlling interests (3,948) (3,612) Deposits pledged 16 (769) (2,218)Net cash used in financing activities (71,114) (265,485)
Net decrease in cash and cash equivalents (4,702) (27,381) Cash and cash equivalents at 1 January 16 146,705 154,029 Effect of exchange rate fluctuations on cash held 22,423 9,916 Cash and cash equivalents at 30 June 16 164,426 136,564
Significant non-cash transaction
On 21 May 2021, the corporate term loan amounted to USD $129 million is deemed repaid and converted to revolving credit facilities of the same amount.

Vena Energy Holdings Ltd and its subsidiaries
Condensed Interim Financial StatementsFor the six months ended 30 June 2021
FS9
The accompanying notes form an integral part of these condensed interim financial statements.
Condensed company statement of cash flows For the six months ended 30 June 2021
Note
Six months ended
30 June 2021
Six months ended
30 June 2020Company US$’000 US$’000
Cash flows from operating activitiesProfit before tax 26,222 4,886 Adjustments for: Finance income 26 (898) (1,213) Dividend income (9,214) (9,916) Finance costs 26 3,783 3,716 Change in fair value of financial derivatives 191 140 Writeback of impairment loss on financial assets – (1,662) Unrealised foreign exchange (gain)/loss (19,739) 10,185
345 6,136 Changes in: - Trade and other receivables (1,227) (3,855) - Trade and other payables 169 (48) Net cash (used in)/generated from operating activities (713) 2,233
Cash flows from investing activitiesCapital injection on subsidiaries (35,574) (22,489) Distribution from subsidiaries - Dividend received 9,214 9,916 - Return of capital 20,398 15,158 Proceeds from repayment of loans receivables from related
parties 291,011 639,478 Disbursement of loans to related parties (181,015) (251,396) Disposal of financial instruments (3,461) 161 Interest received 1,644 32 Net cash generated from investing activities 102,217 390,860
Cash flows from financing activitiesRepurchase of ordinary shares – (139,200) Proceeds from drawdown of loan and borrowings - Revolving credit facility 161,548 326,749 - Intercompany loans 43,232 171,705 Repayment of loan and borrowings - Revolving credit facility (263,157) (408,700) - Corporate term loan (7,510) (328,797) - Intercompany loans (7,656) – Payment of transaction costs related to loans and borrowings (3,305) (2,436) Interest paid on - Revolving credit facility (846) (994) - Corporate term loan (1,483) (1,599) - Intercompany loans (1,271) – Net cash used in financing activities (80,448) (383,272)
Net increase in cash and cash equivalents 21,056 9,821 Cash and cash equivalents at 1 January 16 75,603 23,318 Effect of exchange rate fluctuations on cash held 1,490 216 Cash and cash equivalents at 30 June 16 98,149 33,355

Vena Energy Holdings Ltd and its subsidiaries
Condensed Interim Financial StatementsFor the six months ended 30 June 2021
FS10
Notes to the condensed interim financial statements
1 Domicile and activities
Vena Energy Holdings Ltd (the ‘Company’) is incorporated in the Cayman Islands and has its registered office at Maples Corporate Services Limited, PO Box 309, Ugland House, Grand Cayman, KY1-1104, Cayman Islands.
The condensed interim financial statements of the Group as at and for the six months ended 30 June 2021 comprised the Company and its subsidiaries (together referred to as the ‘Group’ and individually as ‘Group entities’) and the Group’s interest in equity-accounted investees.
The principal activity of the Group is that of developer, owner and operator of renewable energy assets in Asia Pacific region.
The immediate holding company and ultimate controlling company of the Group as at 30 June 2021 are GIP Zenith Ltd and Global Infrastructure Investors III, LLC respectively, of which the former is incorporated in the Cayman Islands and the latter is incorporated in Delaware, U.S.A.
2 Basis of preparation
2.1 Purpose of the condensed interim financial statements
The condensed interim financial statements were drawn up for the purpose of a potential bond issuance and reporting to external counterparties for existing bonds issued.
2.2 Statement of compliance
These condensed interim financial statements have been prepared in accordance with International Accounting Standard IAS 34 Interim Financial Reporting, and should be read in conjunction with the last annual financial statements as at and for the year ended 31 December 2020. They do not include all of the information required for a complete set of International Financial Reporting Standards (‘IFRS’) financial statements.
3 Seasonality in operations
Seasonality in operations for the Interim period results are not necessarily indicative of results of operations or cash flows for an annual period. The Group’s operating results are impacted by external factors, such as resource availability. For example, the amount of electricity that solar plants produce is dependent on the irradiation of a given project location and wind plants are impacted by wind conditions which vary across seasons.
4 Significant accounting polices
New standards and amendments
The Group has applied the following amendments to and interpretations of the Group accounting policies for the first time for the period beginning on 1 January 2021:
Covid-19-Related Rent Concessions (Amendment to IFRS 16)
Interest Rate Benchmark Reform – Phase 2 (Amendments to IFRS 9, IAS 39, IFRS 7, IFRS 4 and IFRS 16)
The application of these amendments to standards and interpretations does not have a material effect on the financial statements.

Vena Energy Holdings Ltd and its subsidiaries
Condensed Interim Financial StatementsFor the six months ended 30 June 2021
FS11
5 Use of judgements and estimates
The preparation of the financial statements in conformity with IFRS requires management to make judgements, estimates and assumptions that affect the application of accounting policies and the reported amounts of assets, liabilities, income and expenses. Actual results may differ from these estimates.
Estimates and underlying assumptions are reviewed on an ongoing basis. Revisions to accounting estimates are recognised in the period in which the estimates are revised and in any future periods affected.
Management applied critical judgement in assessing if Power Purchase Agreements (“PPAs”) entered into by Group Entities falls within the scope of IFRIC 12 – Service Concession Arrangements, including:
whether the counterparty of the PPA controls or regulates what services the Group Entity must provide with the infrastructure, to whom it must provide them, and at what price; and
whether the counterparty of the PPA controls — through ownership, beneficial entitlement or otherwise—any significant residual interest in the infrastructure at the end of the term of the PPA.
Information about critical estimates in applying accounting policies that have the most significant effect on the amounts recognised in the financial statements is included in the following notes:
Measurement of fair values
A number of the Group’s accounting policies and disclosures require the measurement of fair values, for both financial and non-financial assets and liabilities.
When measuring the fair value of an asset or a liability, the Group uses observable market data as far as possible. Fair values are categorised into different levels in a fair value hierarchy based on the inputs used in the valuation techniques as follows:
Level 1: quoted prices (unadjusted) in active markets for identical assets or liabilities.
Level 2: inputs other than quoted prices included in Level 1 that are observable for the asset or liability, either directly (i.e. as prices) or indirectly (i.e. derived from prices).
Level 3: inputs for the asset or liability that are not based on observable market data (unobservable inputs).
If the inputs used to measure the fair value of an asset or a liability fall into different levels of the fair value hierarchy, then the fair value measurement is categorised in its entirety in the same level of the fair value hierarchy as the lowest level input that is significant to the entire measurement (with Level 3 being the lowest).
The Group recognises transfers between levels of the fair value hierarchy as of the end of the reporting period during which the change has occurred.
Further information about the assumptions made in measuring fair values is included in Note 29 Fair value of Financial instruments.

Ven
a E
ne
rgy H
old
ing
s L
td
an
d i
ts s
ub
sid
iari
es
Conde
nsed I
nte
rim
Fin
an
cia
l S
tate
men
tsF
or
the s
ix m
onth
s e
nded 3
0 J
une 2
021
FS
12
6
Pro
pe
rty,
pla
nt
an
d e
qu
ipm
en
t
La
nd
Bu
ild
ing
an
d
lea
seh
old
im
pro
vem
en
ts
Ele
ctr
ic
ge
ne
rato
r e
qu
ipm
en
tV
eh
icle
s
Co
mp
ute
rs,
fitt
ing
s a
nd
fi
xtu
re a
nd
o
ffic
e
eq
uip
me
nt
As
se
ts u
nd
er
co
ns
tru
cti
on
To
tal
US
$’0
00
US
$’0
00
US
$’0
00
US
$’0
00
US
$’0
00
US
$’0
00
US
$’0
00
Gro
up
Co
st
At
1 J
an
uary
20
20
21
,308
20
,149
77
2,4
03
29
6
3,9
45
11
,836
82
9,9
37
Ad
ditio
ns
23
,359
1,7
72
8,3
58
82
1,2
28
58
,555
93
,354
Dis
posa
ls/w
rite
-offs
(82
) –
(1
41
) –
(2
2)
–
(245
) R
ecla
ssi
fica
tion
–
–
32
,697
–
–
(32
,697
) –
E
ffe
ct o
f exch
an
ge
ra
te c
ha
nge
s1
,01
7
77
4
(3,2
51
) 1
4
12
4
1,7
91
46
9
At
31 D
ece
mb
er
20
20
45
,602
22
,695
81
0,0
66
39
2
5,2
75
39
,485
92
3,5
15
At
1 J
an
uary
20
21
45
,602
22
,695
81
0,0
66
39
2
5,2
75
39
,485
92
3,5
15
Ad
ditio
ns
4,1
13
11
5
1,0
65
15
18
0
92
,443
97
,931
Dis
posa
ls/w
rite
-offs
–
–
(14
4)
–
(13
) –
(1
57
) R
ecla
ssi
fica
tion
1,8
91
–
34
,375
–
7
(36
,273
) –
R
ecla
ssi
fica
tion
fro
m r
igh
t-o
f-use
asse
ts–
–
–
–
–
4
3
43
Eff
ect o
f exch
an
ge
ra
te c
ha
nge
s
(2,2
85)
(1,2
55
) (1
6,0
04
) (2
3)
(20
2)
(9,5
48)
(29,3
17)
At
30
Ju
ne 2
021
49
,321
21
,555
82
9,3
58
38
4
5,2
47
86
,150
99
2,0
15

Ven
a E
ne
rgy H
old
ing
s L
td
an
d i
ts s
ub
sid
iari
es
Conde
nsed I
nte
rim
Fin
an
cia
l S
tate
men
tsF
or
the s
ix m
onth
s e
nded 3
0 J
une 2
021
FS
13
6
Pro
pe
rty,
pla
nt
an
d e
qu
ipm
en
t (c
on
t’d
)
La
nd
Bu
ild
ing
an
d
lea
seh
old
im
pro
vem
en
ts
Ele
ctr
ic
ge
ne
rato
r e
qu
ipm
en
tV
eh
icle
s
Co
mp
ute
rs,
fitt
ing
s a
nd
fi
xtu
re a
nd
o
ffic
e
eq
uip
me
nt
As
se
ts u
nd
er
co
ns
tru
cti
on
To
tal
US
$’0
00
US
$’0
00
US
$’0
00
US
$’0
00
US
$’0
00
US
$’0
00
US
$’0
00
Gro
up
Acc
um
ula
ted
de
pre
cia
tio
n
At
1 J
an
uary
20
20
–
2,1
44
53
,668
88
1,7
93
–
57
,693
De
pre
cia
tion
ch
arg
e f
or
the
yea
r –
9
75
31
,047
66
1,0
70
–
33
,158
Imp
air
men
t lo
ss
–
–
59
3
–
–
–
59
3
Dis
posa
ls/w
rite
-offs
–
–
(64
) –
(1
2)
–
(76
) E
ffe
ct o
f exch
an
ge
ra
te c
ha
nge
s
–
18
8
(87
9)
9
64
–
(618
) A
t 3
1 D
ece
mb
er
20
20
–
3,3
07
84
,365
16
3
2,9
15
–
90
,750
At
1 J
an
uary
20
21
–
3,3
07
84
,365
16
3
2,9
15
–
90
,750
De
pre
ciatio
n c
ha
rge
fo
r th
e p
eri
od
–
88
3
16
,470
16
57
0
–
17
,939
Dis
posa
ls/w
rite
-offs
–
–
(14
4)
–
(13
) –
(1
57
) E
ffe
ct o
f exch
an
ge
ra
te c
ha
nge
s
–
(386
) (4
,38
9)
(17
) (1
51
) –
(4
,94
3)
At
30
Ju
ne 2
021
–
3,8
04
96
,302
16
2
3,3
21
–
10
3,5
89
Ca
rry
ing
am
ou
nts
At 1
Jan
uary
20
20
2
1,3
08
18
,005
71
8,7
35
20
8
2,1
52
1
1,8
36
7
72
,24
4
At
31 D
ece
mb
er
20
20
45
,602
19
,388
72
5,7
01
22
9
2,3
60
39
,485
83
2,7
65
At
30
Ju
ne 2
021
49
,321
17
,751
73
3,0
56
22
2
1,9
26
86
,150
88
8,4
26
As
at
rep
ort
ing
da
te,
som
e p
rop
ert
y, p
lan
t an
d e
qu
ipm
en
t o
f th
e w
ere
ple
dg
ed a
s c
olla
tera
l to
secu
re p
roje
ct fina
nce
deb
ts (
se
e n
ote
19
).
At 3
1 D
ece
mb
er
202
0, th
e G
rou
p r
ecog
nis
ed a
n im
pa
irm
en
t lo
ss o
f U
S$
59
3,0
00 w
ith r
esp
ect to
ele
ctr
ic g
ene
rato
r eq
uip
me
nt. T
hese r
ela
tes to
so
lar
pa
ne
ls w
hic
h w
ere
d
am
ag
ed
duri
ng a
flo
od
in T
haila
nd
and
th
ese
so
lar
pa
ne
ls w
ere
im
pa
ired
to
re
fle
ct its
recove
rable
am
ou
nt
ba
sed
on
an
exte
rna
l ve
ndo
r q
uo
tatio
n.

Vena Energy Holdings Ltd and its subsidiaries
Condensed Interim Financial StatementsFor the six months ended 30 June 2021
FS14
7 Right-of-use assets
Land and buildings
Office lease Others Total
Group US$’000 US$’000 US$’000 US$’000
CostAt 1 January 2020 22,213 8,077 765 31,055Additions 80 11,711 865 12,656 Lease modification – (3,200) (91) (3,291) Effect of exchange rate changes 1,290 967 267 2,524 At 31 December 2020 23,583 17,555 1,806 42,944
At 1 January 2021 23,583 17,555 1,806 42,944 Additions 17,959 2,060 282 20,301 Effect of exchange rate changes (3,355) (1,725) (122) (5,202) At 30 June 2021 38,187 17,890 1,966 58,043
Accumulated depreciation
At 1 January 2020 845 2,761 255 3,861 Depreciation expense 915 4,602 748 6,265 Lease modification – (2,851) (26) (2,877) Effect of exchange rate changes 73 643 145 861 At 31 December 2020 1,833 5,155 1,122 8,110
At 1 January 2021 1,833 5,155 1,122 8,110 Depreciation expense 433 1,926 521 2,880 Reclassification to property, plant
and equipment 43 – – 43 Effect of exchange rate changes (105) (977) (384) (1,466) At 30 June 2021 2,204 6,104 1,259 9,567
Carrying amounts
At 1 January 2020 21,368 5,316 510 27,194
At 31 December 2020 21,750 12,400 684 34,834
At 30 June 2021 35,983 11,786 707 48,476
As at reporting date, some right-of-use assets were pledged as collateral to secure project finance debts (see note 19).
8 Intangible assets
Goodwill
Project-related
agreements &
licences
Service
concession
intangible
assets Total
Group US$’000 US$’000 US$’000 US$’000
CostAt 1 January 2020 488,284 485,457 174,368 1,148,109 Additions – 569 303 872
Effect of exchange rate changes 17,868 (3,432) – 14,436
At 31 December 2020 506,152 482,594 174,671 1,163,417
At 1 January 2021 506,152 482,594 174,671 1,163,417 Addition – 1,952 – 1,952 Effect of exchange rate changes (4,848) (14,631) (992) (20,471) At 30 June 2021 501,304 469,915 173,679 1,144,898

Vena Energy Holdings Ltd and its subsidiaries
Condensed Interim Financial StatementsFor the six months ended 30 June 2021
FS15
8 Intangible assets (cont’d)
Goodwill
Project-related
agreements &
licences
Service
concession
intangible
assets Total
Group US$’000 US$’000 US$’000 US$’000
Accumulated amortisation
At 1 January 2020 – 40,661 4,715 45,376 Amortisation expense – 21,128 7,060 28,188 Effect of exchange rate changes – 18 – 18 At 31 December 2020 – 61,807 11,775 73,582
At 1 January 2021 – 61,807 11,775 73,582 Amortisation expense – 11,043 3,318 14,361 Effect of exchange rate changes – (3,023) (29) (3,052) At 30 June 2021 – 69,827 15,064 84,891
Carrying amounts
At 1 January 2020 488,284 444,796 169,653 1,102,733
At 31 December 2020 506,152 420,787 162,896 1,089,835
At 30 June 2021 501,304 400,088 158,615 1,060,007
Amortisation of project related agreements and licences and service concession intangible assets begins on the commercial operation date of the renewable asset as defined in the respective power purchase agreements.
As at reporting date, Service concession intangible assets were pledged as collateral to secure project finance debts (see note 19).
9 Investment in subsidiaries
Company30 June
2021 31 December
2020 US$’000 US$’000
Equity investment, at cost 1,873,132 1,857,956
The table below provides a reconciliation of the movement in investment in subsidiaries:
30 June 2021
31 December 2020
US$’000 US$’000
Balance at start of period 1,857,956 1,906,256 Reduction in share premium (18,394) (122,892) Reduction in par value (2,004) – Capital injection into subsidiaries 35,574 74,592
Balance at end of period 1,873,132 1,857,956
10 Equity-accounted investees
Interests in associates
Group 30 June
2021 31 December
2020 US$’000 US$’000
Interests in associates 387,878 383,796

Ven
a E
ne
rgy H
old
ing
s L
td
an
d i
ts s
ub
sid
iari
es
Conde
nsed I
nte
rim
Fin
an
cia
l S
tate
men
tsF
or
the s
ix m
onth
s e
nded 3
0 J
une 2
021
FS
16
10
E
qu
ity-a
cco
un
ted
in
ves
tee
s (
co
nt’
d)
Inte
res
ts i
n a
ss
oc
iate
s (
co
nt’
d)
Th
e G
rou
p h
as
5 (
20
20:
5)
mate
ria
l a
ssocia
tes a
nd
11
imm
ate
ria
l a
sso
cia
tes
whic
h a
re e
quity
accou
nte
d.
The
follo
win
g a
re t
he
ma
teri
al associa
tes:
Associa
te e
ntity
nam
e
Ha
ng
in n
g A
mih
an
H
old
ing
s, In
c. a
nd
its
s
ub
sid
iari
es
(‘H
AN
GIN
’)
Ve
na E
nerg
y W
ind
P
hil
. H
old
ing
s I
nc
(‘
VE
WP
HI’)
He
lio
s S
ola
r E
ne
rgy
Ho
ldin
gs In
c. a
nd
its
s
ub
sid
iari
es (
‘HS
EH
I’)
Fir
st
So
leq
Ho
ldin
gs
P
hil
ipp
ine
s I
nc
. (‘
FS
HP
I’)
On
e B
uk
idn
on
Pro
ject
Ho
ldin
gs
In
c.
(‘
OB
PH
I’)
Natu
re o
f A
sso
cia
te
Investm
en
t h
old
ings e
ntity
fo
r A
lte
rne
rgy W
ind O
ne
Co
rpo
ratio
n (
“Pro
ject
Pili
lia”)
Investm
en
t h
old
ings e
ntity
fo
r A
ltern
erg
y
Win
d O
ne
Co
rpo
ration
(“
Pro
ject
Pili
lia”)
Investm
en
t h
old
ings
en
tity
fo
r H
elio
s S
ola
r E
ne
rgy
Co
rp.
(“P
roje
ct
Po
llo”)
Investm
en
t h
old
ing
en
tity
fo
r F
irst
So
leq
E
ne
rgy
Co
rp.
(“P
roje
ct
Iro
nm
an
”)
Investm
en
t h
old
ing
en
tity
fo
r A
sia
n G
reen
en
erg
y C
orp
. (“
Pro
ject
Zo
rro
”)
Se
cto
r 5
4.0
MW
win
d
54
.0 M
W w
ind
13
2.5
MW
so
lar
30
.4 M
W s
ola
r 1
0.5
MW
so
lar
Pri
ncip
al p
lace
of
bu
sin
ess/
Co
un
try
of
inco
rpo
ration
Phili
pp
ine
s P
hili
ppin
es
Phili
pp
ine
s
Ph
ilip
pin
es
Phili
pp
ine
s
Dir
ect e
con
om
ic in
tere
st h
eld
in
asso
cia
te b
y th
e G
roup
(%
) 9
9.8
4%
1
00
%
99
.56%
9
9.8
2%
9
9.8
6%
Eff
ective e
con
om
ic in
tere
st
held
on
the
und
erlyin
g p
roje
ct
(%)
55
.03%
3
9.9
7%
9
9.5
6%
9
9.8
2%
9
9.8
6%
Dir
ect
Vo
ting
rig
hts
he
ld in
th
e
asso
cia
te b
y th
e G
roup
(%
) 3
8.5
1%
3
7.2
9%
2
2.1
6%
2
1.6
2%
2
3.7
6%
HA
NG
IN h
eld
55
.2%
an
d V
EW
PH
I he
ld 3
9.8
% d
irect
vo
tin
g r
igh
ts in
Pro
ject
Pili
lia.
Th
rou
gh in
vestm
en
t in
HA
NG
IN &
VE
WP
HI,
th
e G
rou
p a
gg
rega
te e
co
nom
ic in
tere
st
in P
roje
ct
Pili
lia (
54M
w W
ind
) is
94
.91
%.

Ven
a E
ne
rgy H
old
ing
s L
td
an
d i
ts s
ub
sid
iari
es
Conde
nsed I
nte
rim
Fin
an
cia
l S
tate
men
tsF
or
the s
ix m
onth
s e
nded 3
0 J
une 2
021
FS
17
10
E
qu
ity-a
cco
un
ted
in
ves
tee
s (
co
nt’
d)
Inte
res
ts i
n a
ss
oc
iate
s (
co
nt’
d)
Th
e f
ollo
win
g s
um
ma
rises th
e fin
ancia
l st
ate
me
nts
of
the
Gro
up
’s m
ate
rial asso
cia
tes b
ased
on
th
e fin
ancia
l sta
tem
ents
pre
pa
red in
acco
rda
nce
with I
FR
S:
30
Ju
ne
2021
Pil
ilia
Pil
ilia
Po
llo
Iro
nm
an
Zo
rro
HA
NG
INV
EW
PH
IH
SE
HI
FS
HP
IO
BP
HI
US
$’0
00
US
$’0
00
US
$’0
00
US
$’0
00
US
$’0
00
Sta
tem
en
t o
f fi
na
nc
ial
po
sit
ion
Pro
pe
rty,
pla
nt a
nd
equ
ipm
en
t 89
,234
–
14
5,2
16
31
,621
12
,087
Inta
ngib
le a
ssets
7
30
–
–
–
–
Equ
ity-a
cco
un
ted inve
ste
es
–
14
,941
–
–
–
Oth
er
rece
iva
ble
s 2
,34
5
65
13
8
3,7
72
11
0
Rig
ht-
of-
use
ass
ets
14
1
–
64
1
23
0
16
3
Pre
pa
ym
ents
an
d o
the
r a
sse
ts
36
–
89
13
0
33
No
n-c
urr
en
t as
se
ts9
2,4
86
15
,006
14
6,0
84
35
,753
12
,393
Tra
de
an
d o
the
r re
ce
iva
ble
s 1
3,7
01
–
20,9
79
5,4
09
2,6
97
Pre
pa
ym
ents
an
d o
the
r a
sse
ts
28
6
–
63
5
10
2
18
Ca
sh
an
d c
ash
equ
iva
len
ts
13
,101
40
11
,957
1,0
13
98
4
Cu
rre
nt
as
se
ts2
7,0
88
40
33
,571
6,5
24
3,6
99
To
tal
as
se
ts1
19
,57
4
15
,046
17
9,6
55
42,2
77
16
,092
Lo
ans a
nd
bo
rro
win
gs
68
,340
–
10
8,8
35
13
,058
8,4
33
Em
plo
ye
e b
ene
fits
3
9
–
–
–
–
Ass
et re
tire
men
t ob
liga
tion
3,3
00
–
1,1
09
26
1
88
De
ferr
ed
ta
x lia
bili
ties
17
7
–
27
1
–
22
N
on
-cu
rre
nt
lia
bil
itie
s7
1,8
56
–
11
0,2
15
13
,319
8,5
43
Lo
ans a
nd
bo
rro
win
gs
4,5
85
–
5,4
94
3,4
81
58
9
Tra
de
an
d o
the
r p
aya
ble
s 1
,97
5
3
96
2
1,4
45
1,7
19
Cu
rre
nt
lia
bilit
ies
6,5
60
3
6,4
56
4,9
26
2,3
08
To
tal
lia
bil
itie
s7
8,4
16
3
11
6,6
71
18
,245
10
,851
Ne
t A
ss
ets
41
,158
15
,043
62
,984
24
,032
5,2
41

Ven
a E
ne
rgy H
old
ing
s L
td
an
d i
ts s
ub
sid
iari
es
Conde
nsed I
nte
rim
Fin
an
cia
l S
tate
men
tsF
or
the s
ix m
onth
s e
nded 3
0 J
une 2
021
FS
18
10
E
qu
ity-a
cco
un
ted
in
ves
tee
s (
co
nt’
d)
Inte
res
ts i
n a
ss
oc
iate
s (
co
nt’
d)
Th
e f
ollo
win
g s
um
ma
rises th
e fin
ancia
l st
ate
me
nts
of
the
Gro
up
’s m
ate
rial asso
cia
tes b
ased
on
th
e fin
ancia
l sta
tem
ents
pre
pa
red in
acco
rda
nce
with I
FR
S:
30
Ju
ne
2021
Pil
ilia
Pil
ilia
Po
llo
Iro
nm
an
Zo
rro
HA
NG
INV
EW
PH
IH
SE
HI
FS
HP
IO
BP
HI
US
$’0
00
US
$’0
00
US
$’0
00
US
$’0
00
US
$’0
00
Sta
tem
en
t o
f c
om
pre
he
nsiv
e i
nc
om
eS
ale
of e
ne
rgy
12,6
76
–
18
,606
4,0
95
1,4
16
Oth
er
inco
me
–
–
2,0
44
–
–
Re
ve
nu
e1
2,6
76
–
20
,650
4,0
95
1,4
16
Op
era
ting
costs
(2,0
00
) (3
) (2
,38
5)
(60
2)
(47
0)
Sha
red
se
rvic
es c
osts
cha
rged
by a
su
bsi
dia
ry
(53
8)
–
(13
8)
(34)
(11
) D
eve
lop
me
nt co
sts
–
–
–
–
–
De
pre
cia
tio
n e
xp
en
se
(2,3
45
) –
(3
,770
) (9
56
) (3
54
) (4
,88
3)
(3)
(6,2
93
) (1
,59
2)
(83
5)
Fin
ance
in
com
e
73
–
10
4
32
9
Fin
ance
costs
(2
,19
0)
–
(3,7
01
) (4
50
) (2
83
) N
et
fore
ign
exc
ha
ng
e g
ain
/(lo
ss)
(9)
–
10
(24
0)
1
(2,1
26
) –
(3
,58
7)
(658
) (2
73
)
Sh
are
of n
et p
rofit
s o
f asso
cia
te
–
2,2
61
–
–
–
Pro
fit
befo
re t
ax
5,6
67
2,2
58
10
,770
1,8
45
30
8
Incom
e ta
x e
xpe
nse
–
–
–
–
–
P
rofi
t fr
om
co
nti
nu
ing
op
era
tio
ns
5,6
67
2,2
58
10
,770
1,8
45
30
8
Oth
er
co
mp
reh
en
siv
e i
nc
om
eF
ore
ign
ope
ratio
ns -
fo
reig
n c
urr
en
cy t
ran
sla
tion
diffe
ren
ces
(17
6)
(12
7)
(83
9)
(32
4)
(70
) T
ota
l c
om
pre
he
ns
ive
in
co
me
5,4
91
2,1
31
9,9
31
1,5
21
23
8

Ven
a E
ne
rgy H
old
ing
s L
td
an
d i
ts s
ub
sid
iari
es
Conde
nsed I
nte
rim
Fin
an
cia
l S
tate
men
tsF
or
the s
ix m
onth
s e
nded 3
0 J
une 2
021
FS
19
10
E
qu
ity-a
cco
un
ted
in
ves
tee
s (
co
nt’
d)
Inte
res
ts i
n a
ss
oc
iate
s (
co
nt’
d)
Th
e f
ollo
win
g s
um
ma
rises th
e fin
ancia
l in
form
atio
n o
f th
e G
roup
’s a
ssocia
tes b
ase
d o
n t
he
fin
ancia
l sta
tem
en
ts p
rep
are
d in
acco
rda
nce
with I
FR
S:
31
De
cem
be
r 20
20
Pil
ilia
Pil
ilia
Po
llo
Iro
nm
an
Zo
rro
HA
NG
INV
EW
PH
IH
SE
HI
FS
HP
IO
BP
HI
US
$’0
00
US
$’0
00
US
$’0
00
US
$’0
00
US
$’0
00
Sta
tem
en
t o
f fi
na
nc
ial
po
sit
ion
Pro
pe
rty,
pla
nt a
nd
equ
ipm
en
t 92
,826
–
15
1,0
06
33
,011
12
,603
Inta
ngib
le a
ssets
7
40
–
–
–
–
Equ
ity-a
cco
un
ted inve
ste
es
–
12
,681
–
–
–
Oth
er
rece
iva
ble
s 1
,64
9
64
12
5
3,7
64
93
Rig
ht-
of-
use a
sse
ts
2
–
5
2
4
Pre
pa
ym
ents
an
d o
the
r a
sse
ts
37
–
90
10
2
34
No
n-c
urr
en
t as
se
ts9
5,2
54
12
,745
15
1,2
26
36
,879
12
,734
Tra
de
an
d o
the
r re
ce
iva
ble
s 1
3,0
74
–
14,7
11
4,4
58
2,5
01
Pre
pa
ym
ents
an
d o
the
r a
sse
ts
64
6
–
1,0
61
20
9
57
Ca
sh
an
d c
ash
equ
iva
len
ts
12
,036
45
24
,753
1,1
14
1,1
02
Cu
rre
nt
as
se
ts2
5,7
56
45
40
,525
5,7
81
3,6
60
To
tal
as
se
ts1
21
,01
0
12
,790
19
1,7
51
42,6
60
16
,394
Lo
ans a
nd
bo
rro
win
gs
72
,002
–
12
5,4
03
14
,602
8,7
02
Em
plo
ye
e b
ene
fits
4
0
–
–
–
–
Ass
et re
tire
men
t ob
liga
tion
3,2
90
–
1,1
24
26
5
90
De
ferr
ed
ta
x lia
bili
ties
17
9
–
27
5
–
22
N
on
-cu
rre
nt
lia
bil
itie
s7
5,5
11
–
12
6,8
02
14
,867
8,8
14
Lo
ans a
nd
bo
rro
win
gs
4,5
70
–
5,8
36
3,3
65
57
9
Tra
de
an
d o
the
r p
aya
ble
s 4
,89
2
4
1,5
11
1,9
14
1,7
57
Cu
rre
nt
tax li
abili
ties
–
–
–
2
21
Cu
rre
nt
lia
bilit
ies
9,4
62
4
7,3
47
5,2
81
2,3
57
To
tal
lia
bil
itie
s8
4,9
73
4
13
4,1
49
20
,148
11
,171
Ne
t A
ss
ets
36
,037
12
,786
57
,602
22
,512
5,2
23

Ven
a E
ne
rgy H
old
ing
s L
td
an
d i
ts s
ub
sid
iari
es
Conde
nsed I
nte
rim
Fin
an
cia
l S
tate
men
tsF
or
the s
ix m
onth
s e
nded 3
0 J
une 2
021
FS
20
10
E
qu
ity-a
cco
un
ted
in
ves
tee
s (
co
nt’
d)
Inte
res
ts i
n a
ss
oc
iate
s (
co
nt’
d)
Th
e f
ollo
win
g s
um
ma
rises th
e fin
ancia
l st
ate
me
nts
of
the
Gro
up
’s m
ate
rial asso
cia
tes b
ased
on
th
e fin
ancia
l sta
tem
ents
pre
pa
red in
acco
rda
nce
with I
FR
S:
30
Ju
ne
202
0P
ilil
iaP
ilil
iaP
oll
oIr
on
ma
nZ
orr
oH
AN
GIN
VE
WP
HI
HS
EH
IF
SH
PI
OB
PH
IU
S$
’00
0U
S$
’00
0U
S$
’00
0U
S$
’00
0U
S$’0
00
Sta
tem
en
t o
f c
om
pre
he
nsiv
e i
nc
om
eS
ale
of e
ne
rgy
10
,199
–
18
,018
3,9
35
1,3
71
Oth
er
inco
me
–
–
2,6
27
–
–
Re
ve
nu
e1
0,1
99
–
20
,645
3,9
35
1,3
71
Op
era
ting c
osts
(2,3
38
) (3
) (2
,28
9)
(46
9)
(416
) S
ha
red
se
rvic
es c
osts
cha
rged
by a
su
bsi
dia
ry
(56
8)
–
(56
9)
(21
2)
(17
6)
De
pre
cia
tio
n e
xp
en
ses
(2,2
58
) –
(3
,60
4)
(90
6)
(34
0)
(5,1
64
) (3
) (6
,46
2)
(1,5
87)
(93
2)
Fin
ance
in
com
e
61
–
19
7
3
–
Fin
ance
costs
(2
,169
) –
(5
,01
7)
(53
2)
(28
6)
Ne
t fo
reig
n e
xch
ang
e g
ain
/(lo
ss)
4
–
(31
) 3
09
16
Ne
t fina
nce
incom
e/(
co
sts)
(2,1
04
) –
(4
,85
1)
(22
0)
(27
0)
Sha
re o
f p
rofit
s of
associa
te
–
1,1
80
–
–
–
Pro
fit
befo
re t
ax
2,9
31
1,1
77
9,3
32
2,1
28
16
9
Incom
e ta
x e
xpe
nse
–
–
–
–
–
P
rofi
t fr
om
co
nti
nu
ing
op
era
tio
ns
2,9
31
1,1
77
9,3
32
2,1
28
16
9
Oth
er
co
mp
reh
en
siv
e i
nc
om
eF
ore
ign
ope
ration
s –
fo
reig
n c
urr
en
cy t
ran
sla
tion
diffe
ren
ces
276
3
81
6
32
9
73
To
tal
co
mp
reh
en
siv
e i
nc
om
e3
,20
7
1,1
80
10
,148
2,4
57
24
2

Ven
a E
ne
rgy H
old
ing
s L
td
an
d i
ts s
ub
sid
iari
es
Conde
nsed I
nte
rim
Fin
an
cia
l S
tate
men
tsF
or
the s
ix m
onth
s e
nded 3
0 J
une 2
021
FS
21
10
E
qu
ity-a
cco
un
ted
in
ves
tee
s (
co
nt’
d)
Inte
res
ts i
n a
ss
oc
iate
s (
co
nt’
d)
Th
e f
ollo
win
g s
um
ma
rises th
e fin
ancia
l sta
tem
ents
of
the
Gro
up
’s a
ssocia
tes
ba
sed
on
th
e fin
ancia
l st
ate
me
nts
pre
pa
red
in
acc
ord
an
ce w
ith I
FR
S:
30
Ju
ne
202
1P
ilil
ia
HA
NG
INP
ilil
ia
VE
WP
HI
Po
llo
H
SE
HI
Iro
nm
an
F
SH
PI
Zo
rro
O
BP
HI
Imm
ate
rial
ass
oc
iate
sT
ota
l a
ss
oc
iate
sU
S$
’00
0U
S$’0
00
US
$’0
00
US
$’0
00
US
$’0
00
US
$’0
00
US
$’0
00
Ca
rry
ing
am
ou
nt
of
inte
rest
in a
sso
cia
tes
at
s
tart
of
pe
rio
d5
9,0
63
42
,839
21
9,1
09
45
,794
11
,742
5,2
49
38
3,7
96
Gro
up
’s s
ha
re o
f a
mo
rtis
atio
n o
f in
tan
gib
le a
sse
t
acq
uir
ed
th
roug
h b
usi
ness
com
bin
ation
s
(1,4
57)
(1,0
50
) (4
,47
6)
(78
6)
(16
6)
–
(7,9
35
) G
rou
p’s
sha
re o
f p
rofit/
(loss)
fro
m c
on
tinu
ing
op
era
tions
3,1
28
2,2
58
10
,749
1,8
42
30
8
(12
7)
18
,158
Eff
ect o
f exch
an
ge
ra
te c
ha
nge
s f
rom
pro
ject-
rela
ted
ag
reem
en
ts &
lice
nce
s(5
53)
(39
9)
(1,8
76
) (3
06
) (6
9)
–
(3,2
03
) G
rou
p’s
sha
re o
f o
the
r co
mp
reh
en
sive
loss
(17
6)
(12
7)
42
6
(32
3)
(70
) (5
65
) (8
35
) G
rou
p’s
sha
re o
f to
tal c
om
pre
he
nsiv
e incom
e/(
loss
) 9
42
6
82
4,8
23
42
7
3
(692
) 6
,18
5
Gro
up
’s c
on
trib
ution
duri
ng t
he
pe
rio
d
–
–
–
–
–
2,8
20
2,8
20
Dis
trib
utio
n d
uri
ng
th
e p
eri
od
–
–
(4
,75
6)
–
(16
7)
–
(4,9
23
) C
arr
yin
g a
mo
un
t o
f in
tere
st
in a
ss
ocia
tes
at
en
d o
f th
e p
eri
od
60,0
05
43
,521
21
9,1
76
46
,221
11
,578
7,3
77
38
7,8
78

Ven
a E
ne
rgy H
old
ing
s L
td
an
d i
ts s
ub
sid
iari
es
Conde
nsed I
nte
rim
Fin
an
cia
l S
tate
men
tsF
or
the s
ix m
onth
s e
nded 3
0 J
une 2
021
FS
22
10
E
qu
ity-a
cco
un
ted
in
ves
tee
s (
co
nt’
d)
Inte
res
ts i
n a
ss
oc
iate
s (
co
nt’
d)
Th
e f
ollo
win
g s
um
ma
rises th
e fin
ancia
l in
form
atio
n o
f th
e G
roup
’s a
ssocia
tes b
ase
d o
n t
he
fin
ancia
l sta
tem
en
ts p
rep
are
d in
acco
rda
nce
with I
FR
S:
31
De
cem
be
r 20
20
Pil
ilia
H
AN
GIN
Pil
ilia
V
EW
PH
IW
aw
a
HP
HP
IP
oll
o
HS
EH
IIr
on
ma
n
FS
HP
IZ
orr
o
OB
PH
IIm
ma
teri
al
ass
oc
iate
sT
ota
l a
ss
oc
iate
sU
S$
’000
US
$’0
00
US
$’0
00
US
$’0
00
US
$’0
00
US
$’0
00
US
$’0
00
US
$’0
00
Ca
rry
ing
am
ou
nt
of
inte
rest
in a
sso
cia
tes
at
s
tart
of
ye
ar
55
,381
40
,176
7,6
38
21
2,7
87
42
,542
11
,029
5,1
00
37
4,6
53
Gro
up
’s s
ha
re o
f a
mo
rtis
atio
n o
f in
tan
gib
le a
sse
t
acq
uir
ed
th
roug
h b
usi
ness
com
bin
ation
s
(2,8
24
) (2
,03
6)
–
(8,7
82
) (1
,52
4)
(32
2)
–
(15
,488
) G
rou
p’s
sha
re o
f p
rofit
fro
m c
on
tin
uin
g o
pe
ration
s
3,6
60
2,6
47
(30
) 1
9,7
37
6,3
61
87
8
(55
8)
32
,695
Eff
ect o
f exch
an
ge
ra
te c
ha
nge
s f
rom
pro
ject-
rela
ted
ag
reem
en
ts &
lic
en
ces
2,2
84
1,6
47
–
7,8
28
1,2
62
28
3
–
13
,304
Gro
up
’s s
ha
re o
f o
the
r co
mp
reh
en
sive
incom
e/(
loss)
5
62
40
5
97
2,9
54
1
,21
0
26
9
(86
) 5
,41
1
Gro
up
’s s
ha
re o
f to
tal c
om
pre
he
nsiv
e
incom
e/(
loss)
3
,68
2
2,6
63
67
21,7
37
7,3
09
1,1
08
(64
4)
35
,922
Gro
up
’s c
on
trib
ution
duri
ng t
he
yea
r –
–
–
–
–
–
79
3
79
3
Dis
trib
ution
du
rin
g t
he y
ea
r –
–
–
(1
5,4
15
) (4
,05
7)
(39
5)
–
(19
,867
) D
isp
osa
l of
inte
rests
in a
ssocia
te
–
–
(7,7
05
) –
–
–
–
(7
,70
5)
Ca
rry
ing
am
ou
nt
of
inte
res
t in
ass
ocia
tes
at
en
d o
f th
e y
ea
r5
9,0
63
4
2,8
39
–
21
9,1
09
45
,794
11
,74
2
5,2
49
38
3,7
96
In 2
01
9, th
e G
rou
p c
om
me
nces t
he
ne
go
tia
tion p
rocess
of
its s
ale
of in
tere
st in
Pro
ject W
aw
a a
nd h
as
rece
ive
d a
ca
sh c
on
sid
era
tion in a
dvan
ce a
mo
un
ted
to
US
$0
.3
mill
ion. O
n 3
0 J
une
20
20, th
e G
rou
p c
om
ple
ted
its
sale
of in
tere
st in
Pro
ject W
aw
a fo
r U
S$7.3
mill
ion
and
recog
nis
ed
a lo
ss o
n d
ispo
sal o
f U
S$0
.4 m
illio
n. O
f th
e to
tal
sa
les
con
sid
era
tion,
the G
rou
p r
ece
ive
d U
S$
0.3
mill
ion
in c
ash
in
20
20 in
ad
ditio
n t
o th
e a
dva
nce o
f U
S$
0.3
mill
ion r
ece
ived
in 2
01
9. T
he r
em
ain
ing U
S$6
.7 m
illio
n o
f th
e s
ale
s c
onsid
era
tion
rem
ain
un
paid
an
d is
cla
ssi
fied
as o
the
r re
ceiv
ab
le (
No
te 1
4).

Vena Energy Holdings Ltdand its subsidiaries
Condensed interim financial statementsFor the six months ended 30 June 2021
FS23
11 Other investments
Group Company30 June
202131 December
202030 June
202131 December
2020US$’000 US$’000 US$’000 US$’000
Equity investment – mandatorily at FVTPL 30,872 26,340 – –
Equity investment at FVTPL comprise the Group’s interests in Tokumei Kumiai investments in renewable energy assets in Japan.
As at reporting date, some other investments were pledged as collateral to secure project finance debts (see note 19).
12 Loans receivables
Group Company30 June
202131 December
202030 June
202131 December
2020US$’000 US$’000 US$’000 US$’000
Non-currentLoans receivables from: - Related parties 254,464 380,349 94,473 213,098 - Equity-accounted investees 16,174 29,016 – – - Other third parties 3,157 3,550 – – Other loans receivables 316 339 – – Promissory note receivables 7,910 8,328 – –
282,021 421,582 94,473 213,098 Less: Impairment loss (1,504) (1,674) – – Total non-current loans receivables 280,517 419,908 94,473 213,098
CurrentInterest receivables from: - Related parties 2,157 3,067 1,394 2,224 - Equity-accounted investees 558 504 – – - Other loans receivables 11 11 – – - Promissory note receivables 465 441 – – - Cross currency swaps 3,705 3,677 – – - Other third parties 1,169 1,193 – – Loan receivables from: - Equity-accounted investees 6,575 7,503 – – - Other third parties 6,860 6,860 – –
21,500 23,256 1,394 2,224 Less: Impairment loss (51) (89) – – Total current loans receivables 21,449 23,167 1,394 2,224

Vena Energy Holdings Ltdand its subsidiaries
Condensed interim financial statementsFor the six months ended 30 June 2021
FS24
12 Loans receivables (cont’d)
The below table show the notional amount of the outstanding loans receivables not including transaction costs.
Gross loans receivables
Group Company30 June
202131 December
202030 June
202131 December
2020US$’000 US$’000 US$’000 US$’000
Non-currentLoans receivables from: - Related parties 255,832 381,903 94,473 213,098 - Equity-accounted investees 16,174 29,016 – – - Other third parties 3,157 3,550 – – Other loans receivables 316 339 – – Promissory note receivables 7,910 8,328 – –
283,389 423,136 94,473 213,098
CurrentLoan receivables from: - Equity-accounted investees 6,575 7,503 – – - Other third parties (e) 6,860 6,860 – –
13,435 14,363 – – Total loans receivables 296,824 437,499 94,473 213,098
Terms and conditions of loan receivables are as follows:
CurrencyMaturity
date Principal amount Interest rate 30 June
2021 31 December
2020 30 June
2021 31 December
2020 %
$’000 $’000 % % Group
Related parties (a) JPY On demand 94,473 213,098 1.35 1.35 - 1.375Related parties (b) JPY 2025 155,137 166,506 1.372 1.372Subsidiaries of related
parties (c) JPY 2033 to 2035 1,645 2,299 0.75636 0.75636Subsidiaries of related
parties (a) JPY On demand 4,577 – 0.587 –Equity-accounted
investees (d) USD 2021 to 2026 22,749 36,519 3 - 5 3 - 5Other third parties (e) USD 2021 6,860 6,860 17 17 Other third parties (a) USD On demand 827 1,206 1.5 1.5Other third parties (a) USD On demand 1,880 1,894 4.62 4.62Other third parties (a) USD On demand 450 450 5.5 5.5 Promissory notes
receivable (f) THB 2027 7,910 8,328 – – Other loans receivables (a) JPY On demand 316 339 1 1
296,824 437,499
Company
Related parties (a) JPY On demand 94,473 213,098 1.35 1.35-1.375

Vena Energy Holdings Ltdand its subsidiaries
Condensed interim financial statementsFor the six months ended 30 June 2021
FS25
12 Loans receivables (cont’d)
(a) The Group and the Company does not intend to demand these unsecured loans for repayment in the next 12 months.
(b) Loan receivables from related parties to Euro Medium Term Note Issuer are unsecured, with 1.372% per annum interest and repayable biannually.
(c) Repayable within 20 years in equal and consecutive instalments of 33.33% with the first payment due 17 years from the date of origination and the same amount on the same day every year thereafter, or earlier at the demand of the Company. The Group does not intend to demand for repayment for the loans in the next 12 months.
(d) Loan receivables from equity-accounted investees are unsecured, with 3-5% per annum (2020: 3-5%) interest and repayable quarterly with maturity dates from 2022 to 2026.
(e) The loan receivables of US$6,860,000 (2020: US$6,860,000) from San Lorenzo Ruiz Builders & Developers Group Inc. are secured, with 17% (2020: 17%) interest and repayable within 4 to 6 months.
(f) Promissory notes receivables are zero coupon, non-transferable and redeemable, with maturity date on 3 August 2027. At redemption date, the Group is entitled to receive a redemption amount equal to 1% of the principal amount plus accrued redemption fee per annum.
As at reporting date, some loan receivables were pledged as collateral to secure project finance debts (see note 19).
13 Derivative assets and liabilities
Group Company30 June
202131 December
202030 June
202131 December
2020US$’000 US$’000 US$’000 US$’000
Derivative assets
Non-currentElectricity derivative 153,379 176,353 – – Interest rate swaps 926 – – – Cross currency swaps 11,933 – – –
166,238 176,353 – – CurrentElectricity derivative 7,205 6,029 – – Interest rate swaps 252 – – – Forward exchange contracts 937 1,350 937 1,350
8,394 7,379 937 1,350 Total derivative assets 174,632 183,732 937 1,350

Vena Energy Holdings Ltdand its subsidiaries
Condensed interim financial statementsFor the six months ended 30 June 2021
FS26
13 Derivative assets and liabilities (cont’d)
Group Company30 June
202131 December
202030 June
202131 December
2020US$’000 US$’000 US$’000 US$’000
Derivative liabilities
Non-currentCross currency swaps – 11,201 – – Interest rate swaps 11,071 17,141 – –
11,071 28,342 – –
CurrentForward exchange contracts 33 3,718 33 3,718 Interest rate swaps 3,016 3,239 – –
3,049 6,957 33 3,718 Total derivative liabilities 14,120 35,299 33 3,718
During the financial year ended 31 December 2020, the Group entered into cross currency swaps which matures in 2025 and with an aggregate notional amount of JPY 36.0 billion, whereby the Group is required to make semi-annual interest payments calculated at fixed interest rates between 1.215% to 1.265%.
14 Trade and other receivables
Group Company
Note30 June
202131 December
202030 June
202131 December
2020US$’000 US$’000 US$’000 US$’000
Non-currentOther receivables (e) 1,464 1,622 – –
CurrentTrade receivables (f) 78,070 72,905 – – Contract assets 19,199 14,242 – – Total trade receivables and
contract assets 97,269 87,147 – –
Amounts due from: - Indirect subsidiaries (a) – – 3,517 2,287 - Equity-accounted investees (b) 1,720 2,568 – – - Related parties (c) 39,379 43,912 – – - Other third parties (d) 17,105 15,947 – – Deposits 11,109 10,071 – – Other tax receivables 5,483 7,293 – – Other receivables (e) 330 1,301 – – Total other receivables 75,126 81,092 3,517 2,287

Vena Energy Holdings Ltdand its subsidiaries
Condensed interim financial statementsFor the six months ended 30 June 2021
FS27
14 Trade and other receivables (cont’d)
Group Company30 June
202131 December
202030 June
202131 December
2020US$’000 US$’000 US$’000 US$’000
Current (cont’d)Less: Impairment loss - Trade receivables and contract
assets (4,146) (3,956) – – - Other receivables (7,054) (6,947) – – Total current trade and other
receivables 161,195 157,336 3,517 2,287 Total trade and other receivables 162,659 158,958 3,517 2,287
(a) The amount due from indirect subsidiaries of US$3.5 million (2020: US$2.3 million) is non-trade, unsecured and non-interest bearing and repayable on demand.
(b) The amount due from equity-accounted investees of US$1.7 million (2020: US$2.6 million) is non-trade, unsecured, non-interest bearing and repayable on demand.
(c) The amount due from related parties are intercompany advances, asset management fees and operation and maintenance service charges charged to subsidiaries of Zenith Japan Holdings Trust, and shared service charges charged to subsidiaries of Vena Energy (Taiwan) Holdings Ltd.
(d) Included in the amounts due from other third parties are proceeds from sale of interest in equity accounted associate (Project Wawa) of US$6.7 million (2020: US$6.7 million) due from San Lorenzo Ruiz Builders & Developers Group Inc. The Group made a provision for impairment loss amounting to 100% of such receivables.
(e) Included in non-current and current other receivables are delay liquidated damages receivable from EPC contractors in Indonesia of US$ 1.8 million (2020: US$2.9 million).
(f) During the period, there were no trade receivables amounts being written off (2020: US$4.9 million).
As at reporting date, some trade and other receivables were pledged as collateral to secure project finance debts (see note 19).
Disaggregation of trade receivables
A summary of the Group’s exposure to credit risk for trade receivables by geographic region is as follows:
30 June 2021
31 December 2020
US$’000 US$’000
India 70,183 66,901 Indonesia 3,458 1,603 Thailand 4,424 4,391 Others 5 10
78,070 72,905
15 Prepayments and other assets Group Company
30 June 2021
31 December 2020
30 June 2021
31 December 2020
US$’000 US$’000 US$’000 US$’000Non-currentOther prepayments 4,678 4,727 – – Other assets 23,222 11,473 – –
27,900 16,200 – –

Vena Energy Holdings Ltdand its subsidiaries
Condensed interim financial statementsFor the six months ended 30 June 2021
FS28
15 Prepayments and other assets (cont’d)
Group Company30 June
202131 December
202030 June
202131 December
2020US$’000 US$’000 US$’000 US$’000
CurrentOther prepayments 6,449 5,708 2 5 Other assets 2,037 2,109 – –
8,486 7,817 2 5
Total prepayments and other assets 36,386 24,017 2 5
As at reporting date, some prepayments and other assets were pledged as collateral to secure project finance debts (see note 19).
16 Cash and cash equivalents
Group Company
Note30 June
202131 December
202030 June
202131 December
2020US$’000 US$’000 US$’000 US$’000
Bank balances 208,910 157,036 98,149 75,603 Short term deposits 18,421 51,805 – – Less: Impairment loss (5) – – – Cash and cash equivalents in the
statement of financial position 227,326 208,841 98,149 75,603 Restricted bank balances and
deposits (a) (62,905) (62,136) – – Add: Impairment loss 5 – – – Cash and cash equivalents in the
statement of cash flows 164,426 146,705 98,149 75,603
(a) As at 30 June 2021, US$62.9 million (2020: US$62.1 million) of the Group’s cash and cash equivalents were held under debt service reserve accounts which represents a reserve account used for debt service of project finance debt when cash flow available for debt services is inadequate to service the project finance debt.
As at reporting date, some cash and cash equivalents were pledged as collateral to secure project finance debts (see note 19).
17 Equity contribution 30 June
202131 December
2020US$’000 US$’000
Group and CompanyEquity contributionShare capital at US$0.01 per share 15,667 15,667 Share premium 1,551,052 1,551,052
1,566,719 1,566,719
30 June 2021
31 December 2020
NoteNo. of shares
(‘000)No. of shares
(‘000)Group and CompanyIssued and fully paidAt beginning of the period/year 1,566,719 1,690,245 Issued during the period/year (a) – 15,674 Repurchase of shares (b) – (139,200) At end of the period/year 1,566,719 1,566,719

Vena Energy Holdings Ltdand its subsidiaries
Condensed interim financial statementsFor the six months ended 30 June 2021
FS29
17 Equity contribution (cont’d)
(a) In 2019, the Group received an advance from the immediate holding company amounted to US$15,674,240 for which shares were yet to be issued. The advance was classified as capital reserve. On 20 April 2020 15,674,240 shares at a par value of US$0.01 each and share premium of US$15,517,497 were issued against the capital reserve.
(b) During the financial year ended 31 December 2020, the Company repurchased a total of 139,200,000 shares with a par value US$0.01 and share premium of US$137,808,000 for a consideration of US$139,200,000 from its immediate holding company. The shares were issued and fully paid.
The holders of ordinary shares are entitled to one vote per share at meetings of the Company.
18 Reserves
The reserves of the Group and the Company comprise the following balances:
Group Company30 June
202131 December
202030 June
202131 December
2020$’000 $’000 $’000 $’000
Capital reserve 50,000 50,000 50,000 50,000 Translation reserve (5,003) 17,077 – – Defined benefit reserve (30) (27) – –
44,967 67,050 50,000 50,000
Capital reserve
The capital reserves comprise equity injections by shareholders for which ordinary shares have yet to be issued.
Translation reserve
The translation reserve comprises all foreign currency differences arising from the translation of the financial statements of foreign operations.
Defined benefit reserve
The defined benefit reserve comprises actuarial gains and losses and the return on plan assets (excluding interest).
19 Loans and borrowings and lease liabilities
Group Company
Note30 June
202131 December
202030 June
202131 December
2020US$’000 US$’000 US$’000 US$’000
Non-currentProject finance debt (a) 765,094 724,024 – – Corporate term loan – 142,689 – 142,689 Revolving credit facility 195,517 179,090 195,518 179,090 Loan from a related party (d) 38,234 – 38,234 Euro Medium Term Note (a) 321,845 321,415 – – Loan from Euro Medium
Term Note Issuer (b) – – 168,074 180,296 1,320,690 1,367,218 401,826 502,075
Lease liabilities 37,425 24,462 – –

Vena Energy Holdings Ltdand its subsidiaries
Condensed interim financial statementsFor the six months ended 30 June 2021
FS30
19 Loans and borrowings and lease liabilities (cont’d)
Group Company
Note30 June
202131 December
202030 June
202131 December
2020US$’000 US$’000 US$’000 US$’000
CurrentProject finance debt 58,238 54,611 – – Working capital loan 15,163 14,740 – – Loan from direct subsidiary (c) – – 12,470 16,714 External party loan 2,480 2,479 – – Interest payable 5,767 6,532 804 1,513
81,648 78,362 13,274 18,227
Lease liabilities 5,273 4,132 – –
Total loans and borrowings and lease liabilities 1,445,036 1,474,174 415,100 520,302
(a) On 27 February 2020, a direct subsidiary, Vena Energy Capital Pte. Ltd. (“Euro Medium Term Note Issuer”), issued US$325,000,000 3.133% per annum notes due in 2025 listed on Singapore Exchange Securities Trading Limited (“SGX-ST”) under a $1 billion Global Medium Term Note Programme (the ”Notes”). The Notes bear interest at the rate of 3.133% per annum from and including 26 February 2020, and interest will be payable semi-annually in arrears on 26 February and 26 August in each year, commencing on 26 August 2020. The Notes will mature on 26 February 2025.
The EMTN proceeds were allocated to the Company, Vena Energy (Taiwan) Holdings Ltd and Zenith Japan Holdings Ltd (as trustee for Zenith Japan Holdings Trust) through intercompany loans.
The Company together with Vena Energy (Taiwan) Holdings Ltd and Zenith Japan Holdings Ltd (as trustee for Zenith Japan Holdings Trust) jointly and severally act as guarantors for Vena Energy Capital Pte. Ltd. for this bond issuance. The due and punctual payment of all sums payable by Vena Energy Capital Pte. Ltd. from time to time in respect of the bond will be unconditionally and irrevocably guaranteed on a joint and several basis by the guarantors.
(b) The loan from Euro Medium Term Note issuer is a 5-year loan denominated in Japanese Yen (‘JPY’) with the contractual interest rate at 1.372% payable on a semi-annual basis.
(c) The loan from direct subsidiary is a 12-month interest free, unsecured and repayable on demand.
(d) The loan from a related party bears an interest rate of 1.375%, unsecured and repayable in 35 months.
Project finance debt are entered with reputable financial institutions by respective Group entities and are repayable on a quarterly basis with maturity date from 2022 to 2037 (2020: 2021 to 2037). The interest rates on these borrowings consist of fixed rates and floating rates.
The project finance debt contains debt covenants which are tested on a regular basis. A future breach of these covenants may require the Group to repay the loans and borrowings earlier than its year of maturity. The Group has not breached any debt covenants in the six months period ended 30 June 2021 and 30 June 2020.
Project finance debts are secured over the assets of the Group (see note 19).

Vena Energy Holdings Ltdand its subsidiaries
Condensed interim financial statementsFor the six months ended 30 June 2021
FS31
19 Loans and borrowings and lease liabilities (cont’d)
The below table show the notional amount of outstanding loans and borrowings not including transaction costs.
Gross debt
Group Company 30 June
2021 31 December
2020 30 June
2021 31 December
2020 US$’000 US$’000 US$’000 US$’000
Non-currentProject finance debt 778,433 736,411 – – Corporate term loan – 142,689 – 142,689 Revolving credit facility 198,106 179,090 198,106 179,090 Loan from a related party 38,234 – 38,234 – Euro Medium Term Note 325,000 325,000 – – Loan from Euro Medium Term
Note Issuer – – 169,568 181,994
1,339,773 1,383,190 405,908 503,773
CurrentProject finance debt 56,672 55,293 – – Working capital loan 15,163 14,740 – – Loan from direct subsidiary – – 12,470 16,714 External party loan 2,480 2,479 – –
74,315 72,512 12,470 16,714
1,414,088 1,455,702 418,378 520,487
Terms and conditions of loans and borrowings are as follows:
CurrencyMaturity
date Principal amount Interest rate 30 June
202131 December
202030 June
202131 December
2020US$’000 US$’000 % %
Group
Project finance debt AUD 2022-2044 123,066 126,554 BBSY+1.2 BBSY+1.65Project finance debt AUD 2025 68,503 18,300 BBSY+0.1765 BBSY+0.1765 Project finance debt INR 2035 98,104 98,401 10.25 10.25Project finance debt INR 2033 16,775 17,454 9.55 9.55 Project finance debt INR 2033 20,262 21,473 9.50 9.50Project finance debt INR 2028 11,316 11,972 10.90 10.90 Project finance debt INR 2033 45,548 47,865 10.05 - 10.09 10.05 - 10.09Project finance debt INR 2033 11,908 11,908 MCLR+1.5 MCLR+1.5Project finance debt INR 2037 61,068 63,176 9.25 9.25 Project finance debt INR 2035 27,170 28,384 10.20 10.20Project finance debt INR 2033 71,555 74,149 10.22 10.22 Project finance debt INR 2025 61,636 35,504 7.39 7.39Project finance debt THB 2027 77,873 92,636 4.2 & MLR-2.8 4.2 & MLR-2.8 Project finance debt USD 2037 104,896 107,298 3.9 - 5.721 3.9 - 5.721Project finance debt USD 2037 12,238 12,654 3 - 5.7060 3 - 5.7060 Project finance debt USD 2037 6,253 6,466 1.1 - 5.7060 1.1 - 5.7060Project finance debt USD 2037 16,934 17,510 1.5 - 5.7060 1.5 - 5.7060 External party loan USD 2021 2,480 2,479 Interest free Interest freeTerm loan JPY 2024 – 142,689 – LIBOR+1.75Working capital loan INR 2022 15,163 14,740 10.9-11.45% 10.9-11.45% Revolving credit facility JPY 2024 198,106 179,090 LIBOR+1.25 LIBOR+1.25Loan from a related
party JPYOn
demand 38,234 – 1.375 –Euro Medium Term
Note USD 2025 325,000 325,000 3.133 3.1331,414,088 1,455,702

Vena Energy Holdings Ltdand its subsidiaries
Condensed interim financial statementsFor the six months ended 30 June 2021
FS32
19 Loans and borrowings and lease liabilities (cont’d)
Gross debt (cont’d)
CurrencyMaturity
date Principal amount Interest rate 30 June
202131 December
202030 June
202131 December
2020US$’000 US$’000 % %
Company
Term loan JPY 2024 – 142,689 – LIBOR+1.75Revolving credit facility JPY 2024 198,106 179,090 LIBOR+0.95 LIBOR+1.25 Loan from a related
party JPY On
demand 38,234 – 1.375 – Loan from direct
subsidiary AUD On
demand 12,470 16,714 Interest free Interest free Loan from Euro
Medium Term Note Issuer JPY 2025 169,568 181,994 1.372 1.372
418,378 520,487
The loans and borrowings contain debt covenants which are tested on a regular basis. A future breach of these covenants may require the Group to repay the loans and borrowings earlier than indicated in the table above. The Group has not breached any debt covenants in the financial period/year ended 30 June 2021 and 31 December 2020 respectively.
US$835.1 million (2020: US$791.7 million) of project finance debts, US$ nil million (2019: US$142.7 million) of term loan and US$198.1 million (2019: US$179.1 million) of revolving credit facilities are taken up by the subsidiaries of the Group where these debt obligations have no recourse to the Group.
Leverage ratio
Pursuant to the amendment and restatement agreement dated 21 May 2021 relating to the existing facilities agreement between the Company, Vena Energy (Taiwan) Holdings Limited (“VETHL”), Zenith Japan Holdings Limited (“ZJH”) and Credit Agricole Corporate and Investment Bank acting as agent and issuing bank (the “RCF Facility Agreement”), the Company has complied with all covenants as at 30 June 2021.
Pledges for facility agreements
The Group has entered into several Facilities agreements with various financial institutions. Under these agreements, these financial institutions provide project financing debts of US$833 million (2020: US$792 million) to the Group on a combination of fixed and floating rates.
The obligations of the Group to the banks are collateralised by the pledges of all the shares of the project entities and liens on and security interests in substantially all of the project entities’ assets, its rights under various agreements, all of the project entities’ revenues and all insurance proceeds payable to the project entities and require the project entities to comply with various administrative requirements.
As at 30 June 2021 and 31 December 2020, the assets of the project entities pledged in relation to the facilities agreements are as follows:
30 June 2021
31 December 2020
US$’000 US$’000
Property, plant and equipment 858,339 798,311 Right-of-use assets 13,782 14,927 Intangible assets 162,991 166,084 Prepayments and other assets 3,934 3,970 Trade and other receivables 100,033 91,378 Deferred tax assets 1,609 4,618 Cash and cash equivalents 104,246 108,908
Loan receivables 58,090 61,782
Other investment 204 205
1,303,228 1,250,183

Vena Energy Holdings Ltdand its subsidiaries
Condensed interim financial statementsFor the six months ended 30 June 2021
FS33
20 Trade and other payables Group Company
Note30 June
202131 December
202030 June
202131 December
2020US$’000 US$’000 US$’000 US$’000
Non-currentDeferred income (a) 3,006 3,223 – –
CurrentAmounts due to: - Direct subsidiary (b) – – 3,537 2,101 - Indirect subsidiaries (b) – – 4,104 4,104 - Related parties (c) 14,334 11,841 – – - Equity-accounted investees (d) 149 351 – – - Other third parties (e) 13,790 11,137 – – Trade payables 5,311 10,130 200 – Payables to EPC contractors 15,087 1,924 – – Other tax payable 4,142 7,268 – – Accrued operating expenses 17,617 24,924 331 221 Accrued staff costs 1,988 1,792 – – Deferred income (f) 6,058 5,856 – –
78,476 75,223 8,172 6,426 Total trade and other payables 81,482 78,446 8,172 6,426
(a) Non-current deferred income is contract liabilities which relates to advanced mobilization payments received from subsidiaries of Zenith Japan Holdings Trust of US$1.8 million (2020: US$1.9 million), amortized over period with regards to operations and maintenance agreements.
(b) The amount due to subsidiaries of US$7.6 million (2020: US$6.2 million) is non-trade, unsecured, non-interest bearing and repayable on demand.
(c) Amounts due to related parties include US$2.3 million (2020: US$2.2 million) of advances received from subsidiaries of Zenith Japan Holdings Trust for asset management fees and operational and maintenance fees. It also includes US$8.7 million (2020: US$9.3 million) payables to subsidiaries of Zenith Japan Holdings Trust for purchase of land which was subsequently leased back to the same subsidiaries of the Zenith Japan Holdings Trust.
(d) The amount due to equity-accounted investees of US$149,000 (2020: US$351,000) is non-trade, unsecured, non-interest bearing and repayable on demand.
(e) Included in amounts due to other third parties are due to seller of a subsidiary of Zenith Japan Holdings Trust upon acquisition of US$6 million (2020: US$6 million).
(f) Included in current deferred income is contract liabilities of US$0.8 million (2020: US$0.3 million) which relates to advances received from customers for services yet to be fulfilled, US$4.7 million (2020: US$4.9 million) which relates to government grants on project, amortized over PPA period of 25 years, US$0.2 million (2020: US$0.2 million) which relates to government grants on bond issuance, amortized over bond life of 5 years.
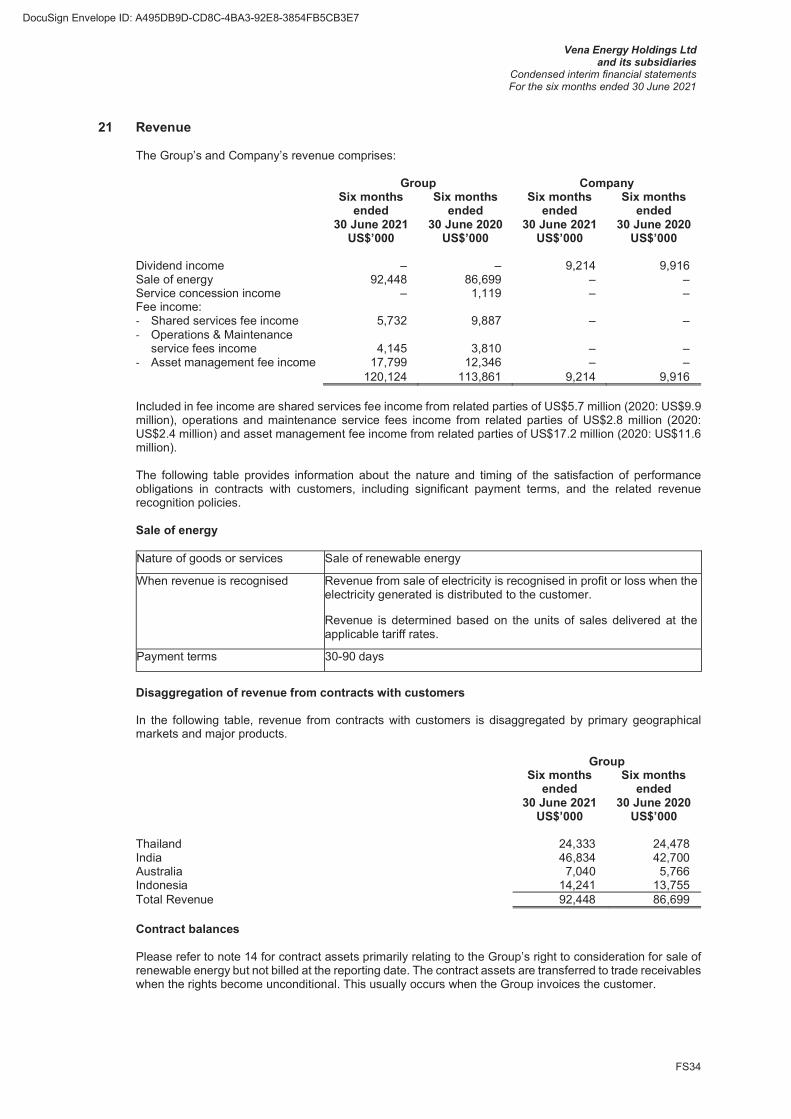
Vena Energy Holdings Ltdand its subsidiaries
Condensed interim financial statementsFor the six months ended 30 June 2021
FS34
21 Revenue
The Group’s and Company’s revenue comprises:
Group CompanySix months
endedSix months
endedSix months
endedSix months
ended30 June 2021 30 June 2020 30 June 2021 30 June 2020
US$’000 US$’000 US$’000 US$’000
Dividend income – – 9,214 9,916 Sale of energy 92,448 86,699 – – Service concession income – 1,119 – – Fee income: - Shared services fee income 5,732 9,887 – – - Operations & Maintenance
service fees income 4,145 3,810 – – - Asset management fee income 17,799 12,346 – –
120,124 113,861 9,214 9,916
Included in fee income are shared services fee income from related parties of US$5.7 million (2020: US$9.9 million), operations and maintenance service fees income from related parties of US$2.8 million (2020: US$2.4 million) and asset management fee income from related parties of US$17.2 million (2020: US$11.6 million).
The following table provides information about the nature and timing of the satisfaction of performance obligations in contracts with customers, including significant payment terms, and the related revenue recognition policies.
Sale of energy
Nature of goods or services Sale of renewable energy
When revenue is recognised Revenue from sale of electricity is recognised in profit or loss when the electricity generated is distributed to the customer.
Revenue is determined based on the units of sales delivered at the applicable tariff rates.
Payment terms 30-90 days
Disaggregation of revenue from contracts with customers
In the following table, revenue from contracts with customers is disaggregated by primary geographical markets and major products.
GroupSix months
endedSix months
ended30 June 2021 30 June 2020
US$’000 US$’000
Thailand 24,333 24,478 India 46,834 42,700 Australia 7,040 5,766 Indonesia 14,241 13,755 Total Revenue 92,448 86,699
Contract balances
Please refer to note 14 for contract assets primarily relating to the Group’s right to consideration for sale of renewable energy but not billed at the reporting date. The contract assets are transferred to trade receivables when the rights become unconditional. This usually occurs when the Group invoices the customer.

Vena Energy Holdings Ltdand its subsidiaries
Condensed interim financial statementsFor the six months ended 30 June 2021
FS35
21 Revenue (cont’d)
Please refer to note 20 for contract liabilities primarily relating to advance consideration received from customers for performance of service contracts.
22 Other income
The Group’s other income comprises:
GroupSix months
endedSix months
ended30 June 2021 30 June 2020
US$’000 US$’000
Insurance claims – 402 Government grants 199 197 Lease income 97 – Ancillary income – 47 Others 1,108 425
1,404 1,071
23 Operating costs Group
Six months ended
Six months ended
30 June 2021 30 June 2020US$’000 US$’000
Operations and maintenance costs 13,047 10,788 Utilities and transmission costs 1,716 2,344 Asset related insurance 1,428 970 Professional fees 1,414 1,359 Rental - land & site office 124 136 Asset related tax and levies 284 148 Travel and entertainment expenses 81 93 Other general and administrative costs 1,001 536
19,095 16,374
Staff costs of US$2.5 million (2020: US$2.2 million) is included within operations and maintenance costs.

Vena Energy Holdings Ltdand its subsidiaries
Condensed interim financial statementsFor the six months ended 30 June 2021
FS36
24 Shared services costs
Group CompanySix months
endedSix months
endedSix months
endedSix months
ended30 June 2021 30 June 2020 30 June 2021 30 June 2020
US$’000 US$’000 US$’000 US$’000
Staff costs 26,103 20,643 – – Directors and Investment
Committee members fee 338 310 – – Occupancy costs 520 576 – – Professional fees 2,882 2,193 140 258 IT expenses 1,002 900 – – Secondment fee – 161 – – Insurance 265 179 – – Travel and entertainment expenses 906 796 – – Other general and administrative
costs 1,229 1,596 3 46 33,245 27,354 143 304
Less: shared service costs capitalised (114) – – –
33,131 27,354 143 304
25 Development costs Group
Six months ended
Six months ended
30 June 2021 30 June 2020 US$’000 US$’000
Staff costs –* –*
Professional fees 195 133
Travel and entertainment expenses 3 9 Occupancy costs 15 9 Other general and administrative costs 88 48
301 199
* Less than US$1,000.

Vena Energy Holdings Ltdand its subsidiaries
Condensed interim financial statementsFor the six months ended 30 June 2021
FS37
26 Finance income and finance costs
Group CompanySix months
endedSix months
endedSix months
endedSix months
ended30 June 2021 30 June 2020 30 June 2021 30 June 2020
US$’000 US$’000 US$’000 US$’000Finance incomeInterest income from: - Loan to related parties 1,825 1,937 892 1,154 - Loan to equity-accounted
investees 428 1,057 – – - Loan to other third parties 422 221 – – - Cross currency swaps 5,119 3,564 – – - Short term deposits 982 1,488 – 32 Other finance income 179 125 6 – Gain from disposal of financial
instrument – 27 – 27 Total finance income 8,955 8,419 898 1,213
Finance costs Interest expense on: - Project finance debt (26,822) (26,870) – – - Term loan and revolving credit
facility (1,656) (2,220) (1,656) (2,220) - Loan from Euro Medium Term
Note Issuer – – (1,208) (962)
- Euro Medium Term Note (5,119) (3,564) – – - Cross currency swaps (2,104) (1,448) – – - Interest rate swaps (2,071) (1,162) – –
- Lease liabilities (497) (527) – – Other finance costs (2,059) (1,102) (919) (534)
Total finance costs (40,328) (36,893) (3,783) (3,716)
27 Change in fair value of financial instrument at FVTPL
Group Company Six months
ended Six months
ended Six months
ended Six months
ended 30 June 2021 30 June 2020 30 June 2021 30 June 2020
US$’000 US$’000 US$’000 US$’000
Gain/(loss) on change in fair value:- Equity investment – (1,824) – – - Electricity derivatives (21,250) 8,313 – – - Forward exchange contracts (191) (190) (191) (140)- Interest rate swaps 7,934 (4,822) – – - Cross currency swaps 23,134 6,674 – –
9,627 8,151 (191) (140)

Vena Energy Holdings Ltdand its subsidiaries
Condensed interim financial statementsFor the six months ended 30 June 2021
FS38
28 Profit before tax
The following items have been included in arriving at profit before tax:
Group Six months
ended Six months
ended 30 June 2021 30 June 2020
US$’000 US$’000 Staff costsWages and salaries 18,597 15,311 Ordinary bonus 4,153 3,492 Contributions to defined contribution plans 442 366 Employee insurance 1,237 727 Recruitment fee 833 354 Staff benefits, allowances and others 3,430 2,600
28,692 22,850
29 Fair value of financial instruments
Fair value measurement
Fair value is the price that would be received to sell an asset or paid to transfer a liability in an orderly transaction between market participants at the measurement date in the principal or, in its absence, the most advantageous market to which the Group has access at that date. The fair value of a liability reflects its non-performance risk.
When available, the Group measures the fair value of an instrument using the quoted price in an active market for that instrument. A market is regarded as active if transactions for the asset or liability take place with sufficient frequency and volume to provide pricing information on an ongoing basis. The Group measures instruments quoted in an active market at mid-price.
If there is no quoted price in an active market, then the Group uses valuation techniques that maximise the use of relevant observable inputs and minimise the use of unobservable inputs. The chosen valuation technique incorporates all of the factors that market participants would take into account in pricing a transaction.
The Group recognises transfers between levels of the fair value hierarchy as at the end of the reporting period during which the change has occurred.
The Group measures fair values using the following fair value hierarchy that reflects the significance of the inputs used in making the measurements.
Level 1: Inputs that are quoted market prices (unadjusted) in active markets for identical instruments.
Level 2: Inputs other than quoted prices included within Level 1 that are observable either directly (i.e. as prices) or indirectly (i.e. derived from prices). This category includes instruments valued using quoted market prices in active markets for similar instruments; quoted prices for identical or similar instruments in markets that are considered less than active; or other valuation techniques in which all significant inputs are directly or indirectly observable from market data.
Level 3: Inputs that are unobservable. This category includes all instruments for which the valuation technique includes inputs not based on observable data and the unobservable inputs have a significant effect on the instrument’s valuation. This category includes instruments that are valued based on quoted prices for similar instruments but for which significant unobservable adjustments or assumptions are required to reflect differences between the instruments.

Ven
a E
ne
rgy H
old
ing
s L
tdan
d i
ts s
ub
sid
iari
es
Condensed inte
rim
fin
ancia
l sta
tem
ents
For
the s
ix m
onth
s e
nded 3
0 J
une 2
021
FS
39
29
Fair
valu
e o
f fi
na
nc
ial in
str
um
en
ts (
co
nt’
d)
Acc
ou
nti
ng
cla
ss
ific
ati
on
an
d f
air
valu
e
Th
e ta
ble
belo
w s
um
ma
rise
s th
e c
lassi
fica
tion
of th
e fin
an
cia
l asse
ts a
nd
lia
bili
tie
s o
f th
e G
rou
p. It
doe
s n
ot in
clu
de
fa
ir v
alu
e in
form
atio
n fo
r fin
an
cia
l asse
ts a
nd
fin
ancia
l lia
bili
ties n
ot m
easu
red
at
fair
va
lue
if th
e c
arr
yin
g a
mo
unt
is a
re
aso
nab
le a
pp
roxim
atio
n o
f fa
ir v
alu
e.
Ca
rry
ing
am
ou
nt
Fa
ir v
alu
e
No
teM
an
da
tori
ly
at
FV
TP
LA
mo
rtis
ed
c
ost
Oth
er
fin
an
cia
l li
ab
ilit
ies
To
tal
Le
ve
l 1
Le
ve
l 2
Le
ve
l 3
To
tal
US
$’0
00
US
$’0
00
US
$’0
00
US
$’0
00
US
$’0
00
US
$’0
00
US
$’0
00
US
$’0
00
Gro
up
30
Ju
ne
202
1L
oa
ns r
ece
iva
ble
s1
2
–
30
1,9
66
–
30
1,9
66
–
30
4,8
89
–
30
4,8
89
Tra
de
an
d o
the
r re
ceiv
ab
les*
14
–
15
7,1
76
–
15
7,1
76
–
–
–
–
Oth
er
inve
stm
en
ts
11
30
,872
–
–
30
,872
–
–
30,8
72
30
,872
Ele
ctr
icity d
eriva
tive
13
16
0,5
84
–
–
16
0,5
84
–
–
16
0,5
84
16
0,5
84
Fo
rwa
rd e
xch
an
ge
co
ntr
acts
1
3
93
7
–
–
93
7
–
93
7
–
93
7
Cro
ss c
urr
en
cy s
wap
s 1
3
11
,93
3
–
–
11
,933
–
11
,933
–
11
,933
Inte
rest
rate
sw
aps
13
1,1
78
–
–
1,1
78
–
1,1
78
–
1,1
78
Ca
sh
an
d c
ash
equ
iva
len
ts
16
–
22
7,3
26
–
22
7,3
26
–
–
–
–
20
5,5
04
68
6,4
68
–
89
1,9
72
Lo
ans a
nd
bo
rro
win
gs
19
–
–
(1
,402
,338
) (1
,40
2,3
38
) –
(1
,41
9,8
55
) –
(1
,41
9,8
55
) In
tere
st ra
te s
wa
ps
13
(14
,087
) –
–
(1
4,0
87)
–
–
(14
,087
) (1
4,0
87
) F
orw
ard
exch
ang
e c
on
tracts
1
3
(33
) –
–
(3
3)
–
–
(33
) (3
3)
Tra
de
an
d o
the
r p
aya
ble
s*
20
–
–
(6
8,2
76
) (6
8,2
76
) –
–
–
–
(14
,120
) –
(1
,47
0,6
14
) (1
,484
,73
4)
* E
xcl
udes
non-f
inanci
al a
ssets
and li
abili
ties

Ven
a E
ne
rgy H
old
ing
s L
tdan
d i
ts s
ub
sid
iari
es
Condensed inte
rim
fin
ancia
l sta
tem
ents
For
the s
ix m
onth
s e
nded 3
0 J
une 2
021
FS
40
29
Fair
valu
e o
f fi
na
nc
ial in
str
um
en
ts (
co
nt’
d)
Acc
ou
nti
ng
cla
ss
ific
ati
on
an
d f
air
valu
e
Th
e ta
ble
belo
w s
um
ma
rise
s th
e c
lassi
fica
tion
of th
e fin
an
cia
l asse
ts a
nd
lia
bili
tie
s o
f th
e G
rou
p. It
doe
s n
ot in
clu
de
fa
ir v
alu
e in
form
atio
n fo
r fin
an
cia
l asse
ts a
nd
fin
ancia
l lia
bili
ties n
ot m
easu
red
at
fair
va
lue
if th
e c
arr
yin
g a
mo
unt
is a
re
aso
nab
le a
pp
roxim
atio
n o
f fa
ir v
alu
e.
Ca
rry
ing
am
ou
nt
Fa
ir v
alu
e
No
teM
an
da
tori
ly
at
FV
TP
LA
mo
rtis
ed
c
os
t
Oth
er
fin
an
cia
l li
ab
ilit
ies
To
tal
Le
vel 1
Le
ve
l 2
Le
ve
l 3
To
tal
US
$’0
00
US
$’0
00
US
$’0
00
US
$’0
00
US
$’0
00
US
$’0
00
US
$’0
00
US
$’0
00
Gro
up
31
De
cem
be
r 20
20
Lo
ans r
ece
iva
ble
s1
2
–
44
3,0
75
–
44
3,0
75
–
44
6,3
92
–
44
6,3
92
Tra
de
an
d o
the
r re
ce
iva
ble
s*
14
–
15
1,6
65
–
15
1,6
65
–
–
–
–
Oth
er
inve
stm
en
ts
11
26
,340
–
–
26
,340
–
–
26
,340
26
,340
Ele
ctr
icity d
eriva
tive
13
18
2,3
82
–
–
18
2,3
82
–
–
18
2,3
82
18
2,3
82
Fo
rward
exch
ang
e c
on
tract
s 1
3
1,3
50
–
–
1,3
50
–
1,3
50
–
1,3
50
Ca
sh
an
d c
ash
equ
iva
len
ts
16
–
20
8,8
41
–
20
8,8
41
21
0,0
72
80
3,5
81
–
1,0
13
,65
3
Lo
ans a
nd
bo
rro
win
gs
19
–
–
(1,4
45
,58
0)
(1,4
45
,58
0)
–
(1,4
62
,23
4)
–
(1,4
62
,23
4)
Inte
rest
rate
sw
ap
s
13
(20
,380
) –
–
(2
0,3
80
) –
(2
0,3
80
) –
(2
0,3
80
) F
orw
ard
exch
ange
co
ntr
acts
1
3
(3,7
18
) –
–
(3
,71
8)
–
(3,7
18
) –
(3
,71
8)
Cro
ss c
urr
en
cy s
waps
13
(11
,201
) –
–
(1
1,2
01
) –
(1
1,2
01
) –
(1
1,2
01
) T
rade
an
d o
the
r p
aya
ble
s*
20
–
–
(62
,099
) (6
2,0
99
) –
–
–
–
(35
,299
) –
(1
,50
7,6
79
) (1
,54
2,9
78
)
* E
xcl
udes
non-f
inanci
al a
ssets
and li
abili
ties

Ven
a E
ne
rgy H
old
ing
s L
tdan
d i
ts s
ub
sid
iari
es
Condensed inte
rim
fin
ancia
l sta
tem
ents
For
the s
ix m
onth
s e
nded 3
0 J
une 2
021
FS
41
29
Fair
valu
e o
f fi
na
nc
ial in
str
um
en
ts (
co
nt’
d)
Acc
ou
nti
ng
cla
ss
ific
ati
on
an
d f
air
valu
e (
co
nt’
d)
Ca
rry
ing
am
ou
nt
Fair
va
lue
No
teM
an
da
tori
ly
at
FV
TP
LA
mo
rtis
ed
c
ost
Oth
er
fin
an
cia
l li
ab
ilit
ies
To
tal
Lev
el 1
Le
ve
l 2
Le
ve
l 3
To
tal
US
$’0
00
US
$’0
00
US
$’0
00
US
$’0
00
US
$’0
00
US
$’0
00
US
$’0
00
US
$’0
00
Co
mp
an
y3
0J
un
e 2
02
1L
oa
ns r
ece
iva
ble
s1
2
–
95
,867
–
95
,867
–
95,8
67
–
9
5,8
67
Tra
de
an
d o
the
r re
ceiv
ab
les*
14
–
3,5
17
–
3,5
17
–
–
–
–
Ca
sh
an
d c
ash
equ
iva
len
ts
16
–
98
,149
–
98
,149
–
–
–
–
Fo
rwa
rd e
xch
an
ge
co
ntr
acts
1
3
93
7
–
–
93
7
–
93
7
–
93
7
93
7
19
7,5
33
–
19
8,4
70
Lo
ans a
nd
bo
rro
win
gs
19
–
–
(41
5,1
00
) (4
15
,10
0)
–
(419
,18
2)
–
(41
9,1
82
) F
orw
ard
exch
ang
e c
on
tract
13
(33
) –
–
(3
3)
–
(33
) –
(3
3)
Tra
de
an
d o
the
r p
aya
ble
s*
20
–
–
(8
,17
2)
(8,1
72
) –
–
–
–
(3
3)
–
(42
3,2
72
) (4
23
,30
5)
31 D
ecem
ber
2020
Lo
ans r
ece
iva
ble
s1
2
–
21
5,3
22
–
21
5,3
22
–
21
5,3
22
–
21
5,3
22
Tra
de
an
d o
the
r re
ceiv
ab
les*
14
–
2,2
87
–
2,2
87
–
–
–
–
Fo
rward
exch
ang
e c
on
tract
s 1
3
1,3
50
–
–
1,3
50
–
1,3
50
–
1,3
50
Ca
sh
an
d c
ash
equ
iva
len
ts
16
–
75
,603
–
75
,603
–
–
–
–
1,3
50
29
3,2
12
–
29
4,5
62
Lo
ans a
nd
bo
rro
win
gs
19
–
–
(52
0,3
02
) (5
20
,30
2)
–
(522
,00
0)
–
(52
2,0
00
) F
orw
ard
exch
an
ge c
on
tracts
1
3
(3,7
18
) –
–
(3
,718
) –
(3
,71
8)
–
(3,7
18
) T
rade
an
d o
the
r p
aya
ble
s*
20
–
–
(6
,42
6)
(6,4
26
) –
–
–
–
(3
,71
8)
–
(52
6,7
28
) (5
30
,44
6)
* E
xcl
udes
non-f
inanci
al a
ssets
and li
abili
ties

Vena Energy Holdings Ltdand its subsidiaries
Condensed interim financial statementsFor the six months ended 30 June 2021
FS42
29 Fair value of financial instruments (cont’d)
Valuation techniques and significant unobservable inputs
The following tables show the valuation techniques used in measuring Level 2 and Level 3 fair values, as well as the significant unobservable inputs used.
Financial instruments measured at fair value
Type Valuation techniqueSignificant unobservable inputs
Inter-relationship between key unobservable inputs and fair value measurement
Other investments: Equity investments – at FVTPL
Discounted cash flows: The valuation model considers the present value of expected cash flows from the projects, discounted using a risk-adjusted discount rate.
Discount rate The estimated fair value would increase (decrease) if: the discount rate was
lower (higher)
Electricity derivative Discounted cash flows: The valuation model considers the present value of expected payment, discounted using a risk-adjusted discount rate. The expected payment is determined by considering the expectation of spot rates for the duration of the contract.
Electricity spot rate
Discount rate
The estimated fair value would increase (decrease) if: The electricity spot rate
was lower (higher); The discount rate was
lower (higher).
Interest rate swaps Swap models: The fair value is calculated as the present value of the estimated future cash flows. Estimates of future floating-rate cash flows are based on quoted swap rates, futures prices and interbank borrowing rates. Estimated cash flows are discounted using a yield curve constructed from similar sources and which reflects the relevant benchmark interbank rate used by market participants for this purpose when pricing interest rate swaps.
Not applicable Not applicable
Forward exchange contracts
Forward pricing: The fair value is determined using quoted forward rates at the reporting date and present value calculations based on yield curves in respective currencies.
Not applicable Not applicable
Cross currency swaps Swap models: Cross currency swaps are measured using quoted forward exchange rates and yield curves from quoted interest rates of the respective currencies, matching maturities of the swaps.
Not applicable Not applicable

Vena Energy Holdings Ltdand its subsidiaries
Condensed interim financial statementsFor the six months ended 30 June 2021
FS43
29 Fair value of financial instruments (cont’d)
Valuation techniques and significant unobservable inputs (cont’d)
Financial instruments not measured at fair value
Type Valuation technique
Loans and borrowings / Loans receivables
Discounted cash flows: The valuation model considers the present value of expected payment, discounted using a risk-adjusted discount rate.
Level 3 fair values
The following table shows a reconciliation from the opening balances to the ending balances for Level 3 fair values:
Group30 June 2021 31 December 2020
Equity investments –
at FVTPLElectricity derivative
Equity investments –
at FVTPLElectricity derivative
US$’000 US$’000 US$’000 US$’000
Beginning balance 26,340 182,382 24,643 117,992 Purchases 4,353 – 3,477 – Total unrealised gains and losses
recognised in profit or loss – (21,250) (1,790) 48,101 Foreign currency translation
recognised in OCI 179 (548) 10 16,289 Ending balance 30,872 160,584 26,340 182,382
30 Commitments
Construction agreements
The commitments for construction of property, plant and equipment as at 30 June 2021 and 31 December 2020 are as follows:
Group30 June 2021 31 December 2020
Contracted Balance Contracted BalanceUS$’000 US$’000 US$’000 US$’000
Type of contracts Supply Contract 59,755 9,855 91,523 91,523 Supply & Service Contract 22,709 8,971 17,770 17,770 Total 82,464 18,826 109,293 109,293
Acquisitions
On April 2020, the Group entered into a share purchase agreement to acquire 100% of Yokji. As part of the purchase consideration, the Group has committed to contingent payments upon achieving of the project milestones.
In May 2021, the Group made the contingent payment amounting to KRW2,200 million upon the execution of the grid connection agreement, and is recognised as part of the Group's project-related agreements and licenses in Note 8 Intangible assets.
The Group commits to pay the remaining contingent payment, amounting to KRW5,000 million, upon the submission of final and effective notice of the commencement of construction work to the competent Governmental Authority in relation to the project.

Vena Energy Holdings Ltdand its subsidiaries
Condensed interim financial statementsFor the six months ended 30 June 2021
FS44
31 Contingent liability
Stand-by letter of credit
As at 30 June 2021, the stand-by letter of credit (“SBLC”) totalled to USD 8.1 million and expires over the period from September 2021 to April 2022. The SBLC bears an interest of LIBOR + 0.95% per annum (2020: LIBOR + 1.25% per annum).
32 Related parties
During the period, other than those disclosed elsewhere in the financial statements, there were no other significant transactions with related parties.
The Group has determined Vena Energy (Taiwan) Holdings Ltd and its subsidiaries, Zenith Japan Holdings Trust and its subsidiaries as related parties in accordance with IAS 24.
33 Subsequent events
(i) Investment in a subsidiary
From July 2021 to September 2021, the Company subscribed 26,278,110 ordinary shares of US$1.00 each amounting to US$26,278,110 in Vena Energy Ltd, a wholly owned subsidiary of the Company.
From July 2021 to September 2021, the Company reduced its investment in subsidiary by US$24,462,038 in its wholly owned subsidiary, Vena Energy Ltd, by way of share buyback.
(ii) Bond issuance
On 8 July 2021, a direct subsidiary, Vena Energy Capital Pte. Ltd. (“Euro Medium Term Note Issuer”), issued US$175,000,000 3.133% per annum notes due in 2025 listed on Singapore Exchange Securities Trading Limited (“SGX-ST”) under the US$1,000,000,000 Global Medium Term Note Programme (the ”Notes”). The Notes is to be consolidated and form a single series with the US$325,000,000 3.133% per annum notes issued on 26 February 2020. The Notes bear interest at the rate of 3.133% per annum from and including 26 February 2021, and interest will be payable semi-annually in arrears on 26 February and 26 August in each year, commencing on 26 August 2021. The Notes will mature on 26 February 2025.
The bond proceeds were allocated to the Company, Vena Energy (Taiwan) Holdings Ltd and Zenith Japan Holdings Ltd (as trustee for Zenith Japan Holdings Trust) through intercompany loans.
The Company together with Vena Energy (Taiwan) Holdings Ltd and Zenith Japan Holdings Ltd (as trustee for Zenith Japan Holdings Trust) jointly and severally act as guarantors for Vena Energy Capital Pte. Ltd. for this bond issuance. The due and punctual payment of all sums payable by Vena Energy Capital Pte. Ltd. from time to time in respect of the bond will be unconditionally and irrevocably guaranteed on a joint and several basis by the guarantors.
34 Standards issued but not yet effective
A number of new standards and amendments to standards are effective for annual periods beginning after 1 January 2021 and earlier application is permitted; however, the Group has not early adopted any of the forthcoming new or amended standards in preparing these condensed interim financial statements.

KPMG LLP (Registration No. T08LL1267L), an accounting limited liability partnership registered in Singapore under the Limited Liability Partnership Act (Chapter 163A) and a member firm of the KPMG global organization of independent member firms affiliated with KPMG International Limited, a private English company limited by guarantee.
Vena Energy (Taiwan) Holdings Ltd and its subsidiaries
(Incorporated in Cayman Islands) Registration Number: 328010
Condensed Interim Financial Statements
For the six months ended 30 June 2021

Vena Energy (Taiwan) Holdings Ltdand its subsidiaries
Statement by DirectorsFor the six months ended 30 June 2021
1
Statement by Directors
In our opinion:
(a) the accompanying condensed interim financial statements set out on pages FS1 to FS25 comprising the condensed statement of financial position of the Group and the Company as at 30 June 2021, the condensed statement of profit or loss and other comprehensive income, changes in equity and cash flows for the Group and for the Company for the six months period then ended, and notes to the condensed interim financial statements, including significant accounting policies as set out on pages FS1 to FS25, are prepared, in all material respects, in accordance with the International Accounting Standard (“IAS”) 34 Interim Financial Reporting; and
(b) at the date of this statement, there are reasonable grounds to believe that the Group will be able to pay its debts as and when they fall due.
The Board of Directors has, on the date of this statement, authorised the condensed interim financial statements for issue.
On behalf of the Board of Directors
Director
8 September 2021

KPMG LLP
16 Raffles Quay #22-00
Hong Leong Building
Singapore 048581
Telephone +65 6213 3388
Fax +65 6225 0984
Internet www.kpmg.com.sg
KPMG LLP (Registration No. T08LL1267L), an accounting limited liability partnership registered in Singapore under the Limited Liability Partnership Act (Chapter 163A) and a member firm of the KPMG global organization of independent member firms affiliated with KPMG International Limited, a private English company limited by guarantee.
2
Independent auditors’ report
Member of the Company
Vena Energy (Taiwan) Holdings Ltd
Report on review of Condensed Interim Financial Statements
Introduction
We have reviewed the accompanying Condensed Interim Financial Statements of Vena Energy
(Taiwan) Holdings Ltd (‘the Company’) and its Subsidiaries (collectively the ‘Group’), which
comprise the condensed statements of financial position of the Group and of the Company as at
30 June 2021, the condensed statements of profit or loss and other comprehensive income,
changes in equity and cash flows for the Group and for the Company for the six month period
then ended and significant accounting policies and other explanatory notes (the Condensed
Interim Financial Statements). Management is responsible for the preparation and presentation of
the Condensed Interim Financial Statements in accordance with International Accounting
Standard IAS 34 Interim Financial Reporting. Our responsibility is to express a conclusion on
the Condensed Interim Financial Statements based on our review.
Scope of review
We conducted our review in accordance with the International Standard on Review Engagements
2410 Review of Interim Financial Information Performed by the Independent Auditor of the
Entity. A review of interim financial statements consists of making inquiries, primarily of persons
responsible for financial and accounting matters, and applying analytical and other review
procedures. A review is substantially less in scope than an audit conducted in accordance with
International Standards on Auditing and consequently does not enable us to obtain assurance that
we would become aware of all significant matters that might be identified in an audit.
Accordingly, we do not express an audit opinion.
Conclusion
Based on our review, nothing has come to our attention that causes us to believe that the
accompanying Condensed Interim Financial Statements as at and for the six months ended 30
June 2021 are not prepared, in all material respects, in accordance with IAS 34 Interim Financial
Reporting.


Vena Energy (Taiwan) Holdings Ltdand its subsidiaries
Condensed Interim Financial StatementsFor the six months ended 30 June 2021
FS1
The accompanying notes form an integral part of the condensed interim financial statements.
Condensed statements of financial position As at 30 June 2021
Group Company
Note30 June
2021 31 December
2020 30 June
2021 31 December
2020 US$’000 US$’000 US$’000 US$’000
Assets Property, plant and equipment 6 202,386 133,862 – – Right-of-use assets 7 82,938 84,474 – – Intangible assets 8 52,726 53,262 – – Investment in subsidiaries – – 248,701 170,413 Equity-accounted investees 9 64,044 63,975 – – Deferred tax assets 212 262 – –
Non-current assets 402,306 335,835 248,701 170,413
Loan receivables 10 140 140 – – Trade and other receivables 11 16,851 5,963 1,795 1,700 Prepayment and other assets 12 2,210 1,174 5 5 Cash and cash equivalents 13 34,904 24,227 647 798
Current assets 54,105 31,504 2,447 2,503
Total assets 456,411 367,339 251,148 172,916
Equity Equity contribution 14 125,497 125,497 125,497 125,497 (Accumulated losses)/Retained
earnings (12,944) (19,359) 931 (6,755) Reserves 15 6,723 6,888 – –
Equity attributable to owner of the Company 119,276 113,026 126,428 118,742
Non-controlling interests (‘NCI’) 5,667 5,164 – –
Total equity 124,943 118,190 126,428 118,742
LiabilitiesAsset retirement obligation 1,139 1,114 – – Derivative liabilities 18 339 392 – – Loans and borrowings 16 202,195 138,798 123,082 53,028 Lease liabilities 16 88,655 87,881 – –
Non-current liabilities 292,328 228,185 123,082 53,028
Loans and borrowings 16 18,225 6,544 1,530 1,034 Lease liabilities 16 573 805 – – Trade and other payables 17 19,813 13,200 108 112 Current tax liabilities 529 415 – –
Current liabilities 39,140 20,964 1,638 1,146
Total liabilities 331,468 249,149 124,720 54,174
Total equity and liabilities 456,411 367,339 251,148 172,916

Vena Energy (Taiwan) Holdings Ltdand its subsidiaries
Condensed Interim Financial StatementsFor the six months ended 30 June 2021
FS2
The accompanying notes form an integral part of the condensed interim financial statements.
Condensed statements of profit or loss and other comprehensive income For the six months ended 30 June 2021
Group Company
NoteSix months
ended Six months
ended Six months
ended Six months
ended 30 June 2021 30 June 2020 30 June 2021 30 June 2020
US$’000 US$’000 US$’000 US$’000
Revenue 19 8,626 7,467 – –
Other income 29 19 – –
Operating costs 20 (1,239) (1,263) (51) (42) Shared services costs 21 (2,059) (2,404) – – Management fee (150) (69) – – Development costs 22 (545) (595) – – Depreciation expense 6&7 (2,453) (2,349) – – Amortisation expense 8 (497) (463) – –
(6,943) (7,143) (51) (42)
Finance income 23 4 125 – 17 Finance costs 23 (2,257) (1,532) (900) (486) Change in fair value of
financial instruments at FVTPL 56 (387) – –
Net foreign exchange gain/(loss) 24 8,783 570 8,637 (172)
Net finance income/(costs) 6,586 (1,224) 7,737 (641)
Write-off of project costs previously capitalised 24 (1,226) – – –
Share of net profit/(loss) of equity-accounted investees, net of tax 9 875 (86) – –
Profit/(loss) before tax 24 7,947 (967) 7,686 (683) Tax expense (877) (454) – – Profit/(loss) for the period 7,070 (1,421) 7,686 (683)
Profit/(loss) attributable to:
Owner of the Company 6,453 (1,821) 7,686 (683) Non-controlling interests 617 400 – –
7,070 (1,421) 7,686 (683)

Vena Energy (Taiwan) Holdings Ltdand its subsidiaries
Condensed Interim Financial StatementsFor the six months ended 30 June 2021
FS3
The accompanying notes form an integral part of the condensed interim financial statements.
Condensed statements of profit or loss and other comprehensive income For the six months ended 30 June 2021 (cont’d)
Group Company
NoteSix months
ended Six months
ended Six months
ended Six months
ended 30 June 2021 30 June 2020 30 June 2021 30 June 2020
US$’000 US$’000 US$’000 US$’000 Items that are or may be
reclassified subsequently to profit or loss
Foreign currency translation differences 634 1,271 – –
Equity-accounted investees – share of other comprehensive income (“OCI”) 9 (806) 1,057 – –
Other comprehensive (loss)/income for the period (172) 2,328 – –
Total comprehensive income/(loss) for the period 6,898 907 7,686 (683)
Total comprehensive income/(loss) attributable to:
Owner of the Company 6,250 507 7,686 (683) Non-controlling interests 648 400 – –
6,898 907 7,686 (683)

Vena Energy (Taiwan) Holdings Ltdand its subsidiaries
Condensed Interim Financial StatementsFor the six months ended 30 June 2021
FS4
The accompanying notes form an integral part of the condensed interim financial statements.
Condensed consolidated statement of changes in equityFor the six months ended 30 June 2021
Attributable to owner of the Company
Equity contribution
Accumulated losses Reserves Total
Non-controlling
interestTotal
equityUS$’000 US$’000 US$’000 US$’000 US$’000 US$’000
At 1 January 2021 125,497 (19,359) 6,888 113,026 5,164 118,190
Total comprehensive income for the periodIncome for the period – 6,453 – 6,453 617 7,070
Other comprehensive incomeForeign currency translation differences – – 603 603 31 634 Equity-accounted investees – share of OCI – – (806) (806) – (806)Total comprehensive (loss)/income for the period – 6,453 (203) 6,250 648 6,898
Transactions with owner, recognised directly in equity Contributions by and distributions to ownersDividend declared – – – – (145) (145)Reallocation of profits to legal reserve – (38) 38 – – – Total contributions by and distributions to owners – (38) 38 – (145) (145)
At 30 June 2021 125,497 (12,944) 6,723 119,276 5,667 124,943

Vena Energy (Taiwan) Holdings Ltdand its subsidiaries
Condensed Interim Financial StatementsFor the six months ended 30 June 2021
FS5
The accompanying notes form an integral part of the condensed interim financial statements.
Condensed consolidated statements of changes in equity (cont’d)For the six months ended 30 June 2021
Attributable to owner of the Company
Equity contribution
Accumulated losses Reserves Total
Non-controlling
interestTotal
equityUS$’000 US$’000 US$’000 US$’000 US$’000 US$’000
1 January 2020 126,623 (16,211) (54) 110,358 4,500 114,858
Total comprehensive income for the period(Loss)/income for the period – (1,821) – (1,821) 400 (1,421)
Other comprehensive incomeForeign currency translation differences – – 1,271 1,271 –* 1,271 Equity-accounted investees – share of OCI – – 1,057 1,057 –* 1,057 Total comprehensive (loss)/income for the period – (1,821) 2,328 507 400 907
Transactions with owner, recognised directly in equity Contributions by and distributions to ownersIssuance of shares 1,174 – – 1,174 – 1,174 Conversion of advance from immediate holding company – – (1,174) (1,174) – (1,174)Repurchase of own shares (2,300) – – (2,300) – (2,300)Total contributions by and distributions to owners (1,126) – (1,174) (2,300) – (2,300)
At 30 June 2020 125,497 (18,032) 1,100 108,565 4,900 113,465
* Less than US$1,000

Vena Energy (Taiwan) Holdings Ltdand its subsidiaries
Condensed Interim Financial StatementsFor the six months ended 30 June 2021
FS6
The accompanying notes form an integral part of the condensed interim financial statements.
Condensed statement of changes in equityFor the six months ended 30 June 2021
Equity contribution
Retained earnings/
(Accumulated losses) Reserves Total
Company Note US$’000 US$’000 US$’000 US$’000
At 1 January 2021 125,497 (6,755) – 118,742
Total comprehensive income for the periodIncome for the period – 7,686 – 7,686
At 30 June 2021 125,497 931 – 126,428
At 1 January 2020 126,623 (3,716) 1,174 124,081
Total comprehensive loss for the periodLoss for the period – (683) – (683)
Transaction with owner, recognised directly in equity
Contributions by and distributions to owners
Issuance of shares 14 1,174 – – 1,174 Conversion of advance from owners 14 – – (1,174) (1,174)Repurchase of own shares (2,300) – – (2,300)Total contributions by and distributions to
owner/Total transactions with owners (1,126) – (1,174) (2,300)
At 30 June 2020 125,497 (4,399) – 121,098

Vena Energy (Taiwan) Holdings Ltdand its subsidiaries
Condensed Interim Financial StatementsFor the six months ended 30 June 2021
FS7
The accompanying notes form an integral part of the condensed interim financial statements.
Condensed consolidated statement of cash flows For the six months ended 30 June 2021
NoteSix months
ended Six months
ended 30 June 2021 30 June 2020
Group US$’000 US$’000
Cash flows from operating activitiesProfit/(loss) before tax 7,947 (967) Adjustments for: Depreciation expense 6&7 2,453 2,349 Amortisation expense 8 497 463 Finance costs 23 2,257 1,532 Finance income 23 (4) (125) Write-off of project costs previously capitalised 24 1,226 – Change in fair value of financial instruments at FVTPL (56) 387 Unrealised foreign exchange (gain)/loss (7,894) 2,374 Share of net (profit)/loss of equity-accounted investees,
net of tax 9 (875) 86 5,551 6,099
Changes in: - Trade and other receivables (10,888) 4,113 - Prepayments and other assets (1,552) (263) - Trade and other payables 5,189 (2,550) Cash (used in)/generated from operating activities (1,700) 7,399 Net tax paid (468) – Net cash (used in)/generated from operating activities (2,168) 7,399
Cash flows from investing activitiesPurchase of property, plant and equipment 6 (67,667) (3,081) Interest received 4 67 Net cash used in investing activities (67,663) (3,014)
Cash flows from financing activitiesProceeds from drawdown of projects finance debts 6,749 66,456 Proceeds from drawdown of loans from related parties 79,274 2,012 Repayment of loans from a related party (700) (67,425) Repayment of project finance debts (2,660) (676) Repayment of leases (979) (745) Repurchase of own shares – (2,300) Interest paid for: - Project finance debts (1,063) (646) - Euro Medium Term Note Issuer (216) – Payment of transaction cost related to loans and borrowings (227) (1,546) Deposits unpledged 43 5,630 Dividend paid to non-controlling interest (145) – Net cash generated from financing activities 80,076 760
Net increase in cash and cash equivalents 10,245 5,145 Cash and cash equivalents at 1 January 13 17,315 11,792 Effect of exchange rate fluctuations on cash held 475 750 Cash and cash equivalents at 30 June 13 28,035 17,687
Significant non-cash transaction The repayment of the Company’s intragroup loan due to Vena Energy Holdings Ltd (“VEHL”) amounting to US$ Nil (2020: US$ 29,226,413) was made on behalf of the Company by Vena Energy Capital Pte Ltd (“VECPL”) via an intragroup loan from VECPL during the period.

Vena Energy (Taiwan) Holdings Ltdand its subsidiaries
Condensed Interim Financial StatementsFor the six months ended 30 June 2021
FS8
The accompanying notes form an integral part of the condensed interim financial statements.
Condensed statement of cash flows For the six months ended 30 June 2021
NoteSix months
ended Six months
ended 30 June 2021 30 June 2020
Company US$’000 US$’000
Cash flows from operating activitiesProfit/(loss) before tax 7,686 (683) Adjustments for: Finance costs 23 900 486 Finance income 23 – (17) Unrealised foreign exchange (gain)/loss (8,637) 164
(51) (50) Changes in: - Trade and other receivables (95) 750 - Trade and other payables (19) 17 Net cash (used in)/generated from operating activities (165) 717
Cash flows from investing activitiesSubscription of additional shares in a subsidiary (83,826) (2,027) Reduction of interest in subsidiary 5,538 67,885 Interest received – 18 Net cash (used in)/generated from investing activities (78,288) 65,876
Cash flows from financing activitiesRepurchase of own shares – (2,300) Proceeds from drawdown of loans from related parties 79,274 2,012 Repayment of loans from a related party (700) (67,425) Payment of transaction cost related to loans and borrowings (272) (347) Net cash from/(used in) financing activities 78,302 (68,060)
Net decrease in cash and cash equivalents (151) (1,467) Cash and cash equivalents at 1 January 13 798 1,569 Cash and cash equivalents at 30 June 13 647 102
Significant non-cash transaction
During the financial period, the Company entered into the following non-cash transactions:
a) The repayment of the Company’s intragroup loan due to Vena Energy Holdings Ltd (“VEHL”) amounting to US$ Nil (2020: US$29,226,413) was made on behalf of the Company by Vena Energy Capital Pte Ltd (“VECPL”) via an intragroup loan from VECPL during the period.
b) The Company’s equity injection in its subsidiary, Vena Energy (Taiwan) Ltd, amounting to US$ Nil (2020: US$972,232) was funded directly by VEHL via an intragroup loan.
c) Extinguished amount due from its wholly owned subsidiary, Vena Energy (Taiwan) Ltd, amounting US$ Nil (2020: US$50,227,489) by issuance of shares.

Vena Energy (Taiwan) Holdings Ltd and its subsidiaries
Condensed interim financial statementsFor the six months ended 30 June 2021
FS9
Notes to the condensed interim financial statements
1 Domicile and activities
Vena Energy (Taiwan) Holdings Ltd (the ‘Company’) is incorporated in the Cayman Islands and has its registered office at Maples Corporate Services Limited, PO Box 309, Ugland House, Grand Cayman, KY1-1104, Cayman Islands.
The condensed interim financial statements of the Group as at and for the six months ended 30 June 2021 comprised the Company and its subsidiaries (together referred to as the ‘Group’ and individually as ‘Group entities’) and the Group’s interest in equity-accounted investees.
The principal activity of the Group is that of developer, owner and operator of renewable energy assets in Taiwan and Philippines.
The immediate holding company and ultimate controlling company of the Group as at 30 June 2021 are GIP Zenith (Taiwan) Ltd and Global Infrastructure Investors III, LLC respectively of which the former is incorporated in the Cayman Islands and the latter is incorporated in Delaware, U.S.A.
2 Basis of preparation
2.1 Purpose of the condensed interim financial statements
The condensed interim financial statements were drawn up for the purpose of a potential bond issuance and reporting to external counterparties for existing bonds issued.
2.2 Statement of compliance
The condensed interim financial statements have been prepared in accordance with International Accounting Standard IAS 34 Interim Financial Reporting, and should be read in conjunction with the last annual financial statements as at and for the year ended 31 December 2020. They do not include all of the information required for a complete set of International Financial Reporting Standards (‘IFRS’) financial statements.
3 Seasonality in operations
Seasonality in operations for the Interim period results are not necessarily indicative of results of operations or cash flows for an annual period. The Group’s operating results are impacted by external factors, such as resource availability. For example, the power production at the solar plants is directly impacted by seasonal changes in solar irradiance which is normally at its highest during the summer months.
4 Significant accounting policies
The Group has applied the following amendments to and interpretations of the Group accounting policies for the first time for the period beginning on 1 January 2021:
Covid-19-Related Rent Concessions (Amendment to IFRS 16)
Interest Rate Benchmark Reform – Phase 2 (Amendments to IFRS 9, IAS 39, IFRS 7, IFRS 4 and IFRS 16)
The application of these amendments to standards and interpretations does not have a material effect on the financial statements.

Vena Energy (Taiwan) Holdings Ltd and its subsidiaries
Condensed interim financial statementsFor the six months ended 30 June 2021
FS10
5 Use of judgements and estimates
The preparation of the financial statements in conformity with IFRS requires management to make judgements, estimates and assumptions that affect the application of accounting policies and the reported amounts of assets, liabilities, income and expenses. Actual results may differ from these estimates.
Estimates and underlying assumptions are reviewed on an ongoing basis. Revisions to accounting estimates are recognised in the period in which the estimates are revised and in any future periods affected.
Information about critical estimates in applying accounting policies that have the most significant effect on the amounts recognised in the financial statements is included in the following notes:
Measurement of fair values
A number of the Group’s accounting policies and disclosures require the measurement of fair values, for both financial and non-financial assets and liabilities.
When measuring the fair value of an asset or a liability, the Group uses observable market data as far as possible. Fair values are categorised into different levels in a fair value hierarchy based on the inputs used in the valuation techniques as follows:
Level 1: quoted prices (unadjusted) in active markets for identical assets or liabilities.
Level 2: inputs other than quoted prices included in Level 1 that are observable for the asset or liability, either directly (i.e. as prices) or indirectly (i.e. derived from prices).
Level 3: inputs for the asset or liability that are not based on observable market data (unobservable inputs).
If the inputs used to measure the fair value of an asset or a liability fall into different levels of the fair value hierarchy, then the fair value measurement is categorised in its entirety in the same level of the fair value hierarchy as the lowest level input that is significant to the entire measurement (with Level 3 being the lowest).
The Group recognises transfers between levels of the fair value hierarchy as of the end of the reporting period during which the change has occurred.
Further information about the assumptions made in measuring fair values is included in Note 25 Financial instruments.

Vena Energy (Taiwan) Holdings Ltd and its subsidiaries
Condensed interim financial statementsFor the six months ended 30 June 2021
FS11
6 Property, plant and equipment
Note
Building and
leasehold
improvements
Electric
generator
equipment
Computer,
fitting and
fixture and
office
equipment
Assets under
construction Vehicle Total
US$’000 US$’000 US$’000 US$’000 US$’000 US$’000Group
CostAt 1 January 2020 51 109,723 145 8,120 – 118,039
Additions – 239 27 11,604 85 11,955
Reclassifications from right-of-use asset 7 – – – 2,393 – 2,393
Effect of exchange rate changes 4 7,784 9 942 1 8,740
At 31 December 2020 55 117,746 181 23,059 86 141,127
Additions – 95 – 68,342 41 68,478
Reclassification – 11,763 – (11,763) – –
Reclassifications from right-of-use asset 7 – – – 1,661 – 1,661
Write-off 24 – – – (369) – (369)
Effect of exchange rate changes –* 490 –* 420 –* 910
At 30 June 2021 55 130,094 181 81,350 127 211,807
Accumulated depreciation
At 1 January 2020 29 2,647 22 – – 2,698
Depreciation charge for the year 3 4,133 39 – 3 4,178
Effect of exchange rate changes 4 383 2 – –* 389
At 31 December 2020 36 7,163 63 – 3 7,265
Depreciation charge for the period – 2,079 9 – 11 2,099
Effect of exchange rate changes –* 57 –* – –* 57
At 30 June 2021 36 9,299 72 – 14 9,421
Carrying amounts
At 1 January 2020 22 107,076 123 8,120 – 115,341
At 31 December 2020 19 110,583 118 23,059 83 133,862
At 30 June 2021 19 120,795 109 81,350 113 202,386
As at reporting date, some property, plant and equipment for the Group were pledged as collateral to secure project finance debts (see note 16). * Less than US$1,000

Vena Energy (Taiwan) Holdings Ltd and its subsidiaries
Condensed interim financial statementsFor the six months ended 30 June 2021
FS12
7 Right-of-use assets Land
US$’000
Group
CostAt 1 January 2020 29,421 Additions 53,604 Effect of exchange rate changes 5,656 At 31 December 2020 88,681 Effect of exchange rate changes 507 At 30 June 2021 89,188
Accumulated depreciation
At 1 January 2020 1,072 Depreciation 644 Reclassification 2,393 Effect of exchange rate changes 98 At 31 December 2020 4,207 Depreciation 354 Reclassification 1,661 Effect of exchange rate changes 28 At 30 June 2021 6,250
Carrying amounts
At 1 January 2020 28,349
At 31 December 2020 84,474
At 30 June 2021 82,938
As at reporting date, some right-of-use assets were pledged as collateral to secure project finance debts (see note 16).
8 Intangible assets
Goodwill
Project-related
agreements &
licences Total
Note US$’000 US$’000 US$’000 Group Cost At 1 January 2020 32,847 18,493 51,340
Additions – 323 323
Effect of exchange rate changes 2,328 1,327 3,655
At 31 December 2020 35,175 20,143 55,318
Write-off 24 – (341) (341)
Effect of exchange rate changes 201 114 315
At 30 June 2021 35,376 19,916 55,292
Accumulated amortisation
At 1 January 2020 – 996 996
Amortisation expense – 945 945
Effect of exchange rate changes – 115 115
At 31 December 2020 – 2,056 2,056
Amortisation expense – 497 497
Effect of exchange rate changes – 13 13
At 30 June 2021 – 2,566 2,566

Vena Energy (Taiwan) Holdings Ltd and its subsidiaries
Condensed interim financial statementsFor the six months ended 30 June 2021
FS13
8 Intangible assets (cont’d)
Goodwill
Project-related
agreements &
licences Total
US$’000 US$’000 US$’000
GroupCarrying amounts
At 1 January 2020 32,847 17,497 50,344
At 31 December 2020 35,175 18,087 53,262
At 30 June 2021 35,376 17,350 52,726
Amortisation of the intangible assets will begin on the commercial operation date of the renewable asset as defined in the respective power purchase agreements.
9 Equity-accounted investees
The Group’s equity-accounted investee comprises a material associate (RA Solar Energy Holdings Inc. and its subsidiaries (collectively known as ‘RSEHI’)) and an immaterial associate, RA Group Holdings Inc. RSEHI owns Project Garcia, a solar power plant in Philippines.
The Group has one out of five representation in the board of directors of RSEHI. The Group has an economic interest of 99.91% in RSEHI, which consists of 40% of voting shares and 99.91% of redeemable preferred shares (‘RPSs’). The RPSs are non-convertible, non-voting and are redeemable at the sole option of RSEHI.
Through the Group’s holdings in RSEHI and the immaterial associate, the Group has an effective economic interest of 99.97% in Project Garcia.
The following summarises the financial statements of the Group’s material associates based on the financial statements prepared in accordance with IFRS:
RSEHI Group 30 June
2021 31 December
2020 US$’000 US$’000
Statement of financial position
Property, plant and equipment 27,009 28,171 Equity-accounted for investees 4,925 4,433 Other receivables 280 227 Prepayment and other assets 35 127 Right-of-use assets 230 3
Non-current assets 32,479 32,961
Trade and other receivables 3,864 2,960 Prepayment and other assets 76 144 Cash and cash equivalents 980 989
Current assets 4,920 4,093
Total assets 37,399 37,054

Vena Energy (Taiwan) Holdings Ltd and its subsidiaries
Condensed interim financial statementsFor the six months ended 30 June 2021
FS14
9 Equity-accounted investees (cont’d) RSEHI Group
30 June 2021
31 December 2020
US$’000 US$’000 Statement of financial position (cont’d)
Loans and borrowings 15,740 14,955 Asset retirement obligation 184 187 Deferred tax liabilities 105 106
Non-current liabilities 16,029 15,248
Loans and borrowings 2,338 4,784 Trade and other payables 822 1,072 Current tax liabilities – 10
Current liabilities 3,160 5,866
Total liabilities 19,189 21,114
Net assets 18,210 15,940
RSEHI GroupSix months
endedSix months
ended30 June 2021 30 June 2020
US$’000 US$’000
Statement of comprehensive income
Sale of energy 3,733 3,191 Other income 637 155
4,370 3,346 Operating costs (569) (518) Shared services costs (26) (246) Depreciation expense (793) (760)
2,982 1,822
Finance income 16 59 Finance costs (493) (601) Net foreign exchange gain (62) 465
Net finance costs (539) (77)
Profit before tax 2,443 1,745 Tax expense – (4)
Profit for the period/year 2,443 1,741 Other comprehensive income (173) –
Total comprehensive income 2,270 1,741

Vena Energy (Taiwan) Holdings Ltd and its subsidiaries
Condensed interim financial statementsFor the six months ended 30 June 2021
FS15
9 Equity-accounted investees (cont’d)
The following summarises the financial information of the Group’s associates based on the financial statements prepared in accordance with IFRS. The balances relating to immaterial associate is not significant.
30 June 2021
31 December 2020
US$’000 US$’000Group’s interest in net assets of associates Share of profit of associates 2,442 4,322 Amortisation expenses of intangibles allocated to associates (1,567) (3,057)
875 1,265 Foreign currency translation difference on intangibles
allocated to associates (646) 2,677 Share of other comprehensive income (160) 941
69 4,883 Carrying amount of interest in associates
at beginning of the period 63,975 59,092
Carrying amount of interest in associates at end of the period 64,044 63,975
10 Loans receivables Group
30 June 2021
31 December 2020
US$’000 US$’000
Interest receivables from equity-accounted investee 140 140
Loan receivable from an equity-accounted investee is denominated in US$, unsecured and repayable on demand. The loan bears an interest rate of 7% (2020: 7%) per annum. The interest receivables of US$140,000 were received in July 2021.
11 Trade and other receivables Group Company
Note30 June
2021 31 December
2020 30 June
2021 31 December
2020 US$’000 US$’000 US$’000 US$’000
Contract assets 1,601 1,001 – – Amounts due from: - Subsidiary (a) – – 1,795 1,700 - Other third parties 19 317 – – Deposits and advance 11,290 3,781 – – VAT receivable 3,941 864 – –
16,851 5,963 1,795 1,700

Vena Energy (Taiwan) Holdings Ltd and its subsidiaries
Condensed interim financial statementsFor the six months ended 30 June 2021
FS16
11 Trade and other receivables (cont’d)
(a) The amounts due from a subsidiary is non-trade, unsecured, non-interest bearing and repayable on demand. As at 30 June 2021, the movement of amount due from subsidiaries are as follows:
Company30 June
202131 December
2020US$’000 US$’000
Balance as at 1 January 1,700 50,977 Capitalised to investment in subsidiary – (50,227) Advances to subsidiary 95 1,700 Repayment of advances from subsidiary – (750) Balance as at 30 June and 31 December 1,795 1,700
As at reporting date, some trade and other receivables were pledged as collateral to secure project finance debts (see note 16).
12 Prepayments and other assets Group
Note 30 June
202131 December
2020US$’000 US$’000
Other assets 622 592 Prepaid expenses 2,104 582 Less: write-off 24 (516) –
2,210 1,174
As at reporting date, some prepayments and other assets were pledged as collateral to secure project finance debts (see note 16).
13 Cash and cash equivalents Group Company
Note30 June
2021 31 December
2020 30 June
2021 31 December
2020 US$’000 US$’000 US$’000 US$’000
Bank balances 32,892 22,215 647 798 Short term deposit 2,012 2,012 – –
Cash and cash equivalents in the statements of financial position 34,904 24,227 647 798
Restricted bank balances and deposits (a) (6,869) (6,912) – –
Cash and cash equivalents in the statements of cash flows 28,035 17,315 647 798
(a) As at reporting date, some cash and cash equivalents were pledged as collateral to secure project finance debts (see note 16). Included US$4.9 million (2020: US$4.9 million) were held under debt service reserve accounts which represents a reserve account used for debt service of project finance debt when cash flow available for debt services is inadequate to service the project finance debt and US$2 million (2020: US$2 million) fixed deposit pledged in relation to banker’s guarantees.

Vena Energy (Taiwan) Holdings Ltd and its subsidiaries
Condensed interim financial statementsFor the six months ended 30 June 2021
FS17
14 Equity contribution Group and Company
30 June 2021
31 December 2020
US$’000 US$’000Group and Company Equity contribution
Share capital at US$0.01 per share (US$) 1,254 1,254 Share premium (US$) 124,243 124,243
125,497 125,497
Group and Company30 June
202131 December
2020No. of shares
(‘000)No. of shares
(‘000)Issued and fully paidAt beginning of period/year 125,497 126,623 Issued during the period/year – 1,174 Repurchase of shares – (2,300) At end of period/year 125,497 125,497
15 Reserves
The reserves of the Group comprise the following balances:
Group Company30 June
202131 December
202030 June
202131 December
2020US$’000 US$’000 US$’000 US$’000
Translation reserve 6,610 6,813 – – Legal reserve 113 75 – –
6,723 6,888 – –
Translation reserve
The translation reserve comprises all foreign currency differences arising from the translation of the financial statements of foreign operations.
Legal reserve
The Taiwan Companies Act requires that for profit making Taiwan registered companies, 10% of the profits shall be kept as a reserve which is non distributable. The legal reserve will be capped at amount equivalent to authorised share capital.
16 Loans and borrowings and lease liabilities Group Company
Note30 June
202131 December
202030 June
202131 December
2020US$’000 US$’000 US$’000 US$’000
Non-currentProject finance debts 79,113 85,770 – – Loan from related parties 94,473 22,339 94,473 22,339 Loan from Euro Medium Term
Note Issuer (a) 28,609 30,689 28,609 30,689 202,195 138,798 123,082 53,028
Lease liabilities 88,655 87,881 – –

Vena Energy (Taiwan) Holdings Ltd and its subsidiaries
Condensed interim financial statementsFor the six months ended 30 June 2021
FS18
16 Loans and borrowings and lease liabilities (cont’d) Group Company
Note30 June
202131 December
202030 June
202131 December
2020US$’000 US$’000 US$’000 US$’000
CurrentProject finance debts 16,477 5,310 – – Interest payables on: - Project finance debts 218 200 – – - Loan from related parties 1,394 884 1,394 884 - Loan from Euro Medium
Term Note Issuer 136 150 136 150 18,225 6,544 1,530 1,034
Lease liabilities 573 805 – –
(a) The Euro Medium Term Note Issuer refers to Vena Energy Capital Pte Ltd, a related party, which issued US$325,000,000 3.133% per annum Notes due 2025 under the US$1,000,000,000 Global Medium Term Note Programme.
The below table shows the notional amount of the outstanding loans and borrowings not including transaction costs.
Group Company 30 June
2021 31 December
2020 30 June
2021 31 December
2020 US$’000 US$’000 US$’000 US$’000
Non-currentProject finance debts 80,502 87,029 – – Loan from related parties 94,473 22,339 94,473 22,339 Loan from Euro Medium Term
Note Issuer 28,863 30,978 28,863 30,978
203,838 140,346 123,336 53,317
CurrentProject finance debts 16,490 5,323 – –
220,328 145,669 123,336 53,317
Debt covenant
The Group has a secured bank loan with a carrying amount of US$4.7 million as at 30 June 2021 (2020: US$4.8 million). This loan is repayable in tranches within 5 years. However, the loan contains a covenant stating that at the end of each quarter, the debt to equity ratio shall be less than 4 times and the ratio of the aggregate of all of the Group’s liabilities to the Group’s liabilities paid in capital does not exceed the ratio of 82:18 at any time throughout the duration of the agreement, otherwise the loan will be repayable on demand.
The Group exceeded its maximum leverage threshold as at 30 June 2021. The Group had obtained a waiver letter in August 2021 from the bank and this bank loan has been reclassified from non-current to current as at 30 June 2021.
Pledges for facility agreements
The Group has entered into several Facilities agreements with various financial institutions. Under these agreements, these financial institutions provide project financing debts of US$97.0 million (2020: US$92.4 million) to the Group on floating rates.
The obligations of the Group to the banks are collateralised by the pledges of all the shares of the project entities and liens on and security interests in substantially all of the project entities’ assets, its rights under various agreements, all of the project entities’ revenues and all insurance proceeds payable to the project entities and require the project entities to comply with various administrative requirements.

Vena Energy (Taiwan) Holdings Ltd and its subsidiaries
Condensed interim financial statementsFor the six months ended 30 June 2021
FS19
16 Loans and borrowings and lease liabilities (cont’d)
As at 30 June 2021 and 31 December 2020, the assets of the project entities pledged in relation to the facilities agreements are as follows:
30 June 2021
31 December 2020
US$’000 US$’000
Property, plant and equipment 121,481 111,242
Right-of-use assets 18,902 16,932
Trade and other receivables 3,772 1,231
Prepayments and other assets 337 324
Deferred tax assets 345 315
Cash and cash equivalents 14,071 14,456
158,908 144,500
17 Trade and other payables Group Company
30 June 2021
31 December 2020
30 June 2021
31 December 2020
US$’000 US$’000 US$’000 US$’000 Amounts due to: - Related parties 1,101 1,280 – 71
- Other third party 10 679 – – Trade payables 467 – – – Payable to EPC contractors 7,818 3,554 – – Shared services fees payables 6,424 6,419 – – Other tax payables 811 459 – – Accrued staff costs 19 14 – – Accrued operating expenses 3,163 795 108 41
19,813 13,200 108 112
The amounts due to related parties are non-trade, unsecured, non-interest bearing and repayable on demand.
18 Derivative liabilities Group Company
30 June 2021
31 December 2020
30 June 2021
31 December 2020
US$’000 US$’000 US$’000 US$’000
Interest rate swaps 339 392 – –
19 Revenue
The Group’s revenue comprises:
Group CompanySix months
endedSix months
endedSix months
endedSix months
ended30 June 2021 30 June 2020 30 June 2021 30 June 2020
US$’000 US$’000 US$’000 US$’000
Sale of energy 8,626 7,467 – –

and its subsidiaries
Condensed interim financial statements For the six months ended 30 June 2021
FS20
19 Revenue (cont’d)
The following table provides information about the nature and timing of the satisfaction of performance obligations in contracts with customers, including significant payment terms, and the related revenue recognition policies.
Sale of Energy Nature of goods or services Sale of renewable energy
When revenue is recognised Revenue from sale of electricity is recognised in profit or loss when the electricity generated is dispatched to the customer.
Revenue is determined based on the units of sales delivered at the applicable tariff rates.
Payment terms 15 to 30 days
Disaggregation of revenue from contracts with customers
In the following table, revenue from contracts with customers is disaggregated by primary geographical markets and major products.
GroupSix months
ended Six months
ended 30 June 2021 30 June 2020
US$’000 US$’000
Taiwan Solar 8,626 7,467
Contract balances
Please refer to note 11 for contract assets primarily relating to the Group’s right to consideration for sale of renewable energy but not billed at the reporting date. The contract assets are transferred to trade receivables when the rights become unconditional. This usually occurs when the Group invoices the customer.
20 Operating costs Group
Six months ended
Six months ended
30 June 2021 30 June 2020 US$’000 US$’000
Operations and maintenance costs 521 677 Utilities and transmission costs 139 85 Directors fee 13 10 Professional fees 262 155 IT expenses 3 2 Insurance 144 126 Occupancy cost 64 7 Travel and entertainment expenses 47 13 Other general and administrative costs 46 188
1,239 1,263
Staff costs of US$0.31 million (2020: US$0.1 million) is included within operations and maintenance costs.
21 Shared services costs
Shared services costs have been incurred in respect of transactions with Vena Energy Pte. Ltd., Vena Energy Pte. Ltd., Taiwan branch and Vena Energy (Thailand) Co., Ltd.

and its subsidiaries
Condensed interim financial statements For the six months ended 30 June 2021
FS21
Group Six months
endedSix months
ended30 June 2021 30 June 2020
US$’000 US$’000
Other employee benefits 2 – Professional fees 250 90 Travel and entertainment expenses 86 119 Occupancy costs 23 68 IT expenses – 8 Marketing and promotion costs – 11 Other general and administrative costs 184 299
545 595
23 Finance income and finance costs Group Company
Six months ended
Six months ended
Six months ended
Six months ended
30 June 2021 30 June 2020 30 June 2021 30 June 2020 US$’000 US$’000 US$’000 US$’000
Finance incomeInterest income from: - Short term deposit – 45 – – - Loan receivables from equity-
accounted investee – 58 – – - Bank balances 4 22 – 17 Total finance income 4 125 – 17
Finance costsInterest expense on: - Loan from related parties (587) (312) (587) (312) - Loan from Euro Medium Term
Note Issuer (205) (141) (205) (141) - Project finance debts (972) (778) – – - Lease liabilities (200) (187) – – - Other finance costs (293) (114) (108) (33) Total finance costs (2,257) (1,532) (900) (486)
24 Profit before tax
The following items have been included in arriving at profit before tax:
Group Company Six months
ended Six months
ended Six months
ended Six months
ended 30 June 2021 30 June 2020 30 June 2021 30 June 2020
US$’000 US$’000 US$’000 US$’000 Staff costsSalaries 202 97 – – Bonus 52 34 – – Other staff benefits 54 50 – –
308 181 – –
22 Development costs

Vena Energy (Taiwan) Holdings Ltd and its subsidiaries
Condensed interim financial statementsFor the six months ended 30 June 2021
FS22
24 Profit before tax (cont’d)
The following items have been included in arriving at profit before tax: (cont’d)
Group CompanySix months
endedSix months
endedSix months
endedSix months
endedNote 30 June 2021 30 June 2020 30 June 2021 30 June 2020
US$’000 US$’000 US$’000 US$’000Project cost written offProperty, plant and
equipment 6 369 – – – Intangible assets 8 341 – – – Other assets 12 516 – – –
1,226 – – –
Foreign exchange gain/(loss) 8,783 570 8,637 (172)
Foreign exchange gain recognised during the financial period is attributable to favourable foreign exchange movement of loans and borrowings, which comprises foreign currency intragroup loans denominated in Japanese Yen (‘JPY’).
25 Fair value of financial instruments
Fair value measurement
Fair value is the price that would be received to sell an asset or paid to transfer a liability in an orderly transaction between market participants at the measurement date in the principal or, in its absence, the most advantageous market to which the Group has access at that date. The fair value of a liability reflects its non-performance risk.
When available, the Group measures the fair value of an instrument using the quoted price in an active market for that instrument. A market is regarded as active if transactions for the asset or liability take place with sufficient frequency and volume to provide pricing information on an ongoing basis. The Group measures instruments quoted in an active market at mid-price.
If there is no quoted price in an active market, then the Group uses valuation techniques that maximise the use of relevant observable inputs and minimise the use of unobservable inputs. The chosen valuation technique incorporates all of the factors that market participants would take into account in pricing a transaction.
The Group recognises transfers between levels of the fair value hierarchy as at the end of the reporting period during which the change has occurred.
Level 1: Inputs that are quoted market prices (unadjusted) in active markets for identical instruments.
Level 2: Inputs other than quoted prices included within Level 1 that are observable either directly (i.e. as prices) or indirectly (i.e. derived from prices). This category includes instruments valued using: quoted market prices in active markets for similar instruments; quoted prices for identical or similar instruments in markets that are considered less than active; or other valuation techniques in which all significant inputs are directly or indirectly observable from market data.
Level 3: Inputs that are unobservable. This category includes all instruments for which the valuation technique includes inputs not based on observable data and the unobservable inputs have a significant effect on the instrument’s valuation. This category includes instruments that are valued based on quoted prices for similar instruments but for which significant unobservable adjustments or assumptions are required to reflect differences between the instruments.

Vena Energy (Taiwan) Holdings Ltd and its subsidiaries
Condensed interim financial statementsFor the six months ended 30 June 2021
FS23
25 Fair value of financial instruments (cont’d)
Financial instruments measured at fair value
Type Valuation techniqueSignificant unobservable inputs
Inter-relationship between key unobservable inputs and fair value measurement
Group
Interest rate swaps Swap models: The fair value is calculated as the present value of the estimated future cash flows. Estimates of future floating-rate cash flows are based on quoted swap rates, futures prices and interbank borrowing rates. Estimated cash flows are discounted using a yield curve constructed from similar sources and which reflects the relevant benchmark interbank rate used by market participants for this purpose when pricing interest rate swaps.
Not applicable. Not applicable.
Financial instruments not measured at fair value
Type Valuation technique
Group
Loans and borrowings Discounted cash flows: The valuation model considers the present value of expected payment, discounted using a risk-adjusted discount rate.

Vena Energy (Taiwan) Holdings Ltd and its subsidiaries
Condensed interim financial statementsFor the six months ended 30 June 2021
FS24
25 Fair value of financial instruments (cont’d)
Accounting classification and fair value
The table below summarises the classification of the financial assets and liabilities of the Group. It does not include fair value information for financial assets and financial liabilities not measured at fair value if the carrying amount is a reasonable approximation of fair value.
Carrying amount Fair value
NoteMandatorily
at FVTPLAmortised
cost
Other financial liabilities Total Level 1 Level 2 Level 3 Total
US$’000 US$’000 US$’000 US$’000 US$’000 US$’000 US$’000 US$’000Group30 June 2021Loan receivables 10 – 140 – 140 – – – –
Trade and other receivables* 11 – 5,473 – 5,473 – – – –
Cash and cash equivalents 13 – 34,904 – 34,904 – – – –
– 40,517 – 40,517
Loans and borrowings* 16 – – (220,420) (220,420) – (222,076) – (222,076) Trade and other payables* 17 – – (19,002) (19,002) – – – – Derivative liabilities 18 (339) – – (339) – (339) – (339)
(339) – (239,422) (239,761)
31 December 2020Loan receivables 10 – 140 – 140 – – – –
Trade and other receivables* 11 – 5,099 – 5,099 – – – –
Cash and cash equivalents 13 – 24,227 – 24,227 – – – –
– 29,466 – 29,466
Loans and borrowings 16 – – (145,342) (145,342) – (146,903) – (146,903) Trade and other payables* 17 – – (12,741) (12,741) – – – – Derivatives liabilities 18 (392) – – (392) – (392) – (392)
(392) – (158,083) (158,475)
* Excludes non-financial assets and liabilities

Vena Energy (Taiwan) Holdings Ltd and its subsidiaries
Condensed interim financial statementsFor the six months ended 30 June 2021
FS25
26 Related parties
The Group has determined Vena Energy Holdings Ltd and its subsidiaries and Zenith Japan Holdings Trust and its subsidiaries as related parties in accordance with IAS 24.
Related parties transactions
During the period, other than those disclosed elsewhere in the financial statements the following significant transactions between the Group and its related parties took place at terms agreed between the parties during the financial period:
Six months ended
Six months ended
30 June 2021 30 June 2020US$’000 US$’000
Related partiesShared services costs 2,059 2,404 Management fee 150 69 Interest cost 587 312
AssociatesInterest income – 58
Euro Medium Term Note IssuerInterest cost 240 164
27 Subsequent events
Investment in a subsidiary
In July 2021, the Company subscribed 20,137,270 ordinary shares of US$1.00 each amounting to US$20,137,270 in Vena Energy (Taiwan) Ltd, a wholly owned subsidiary of the Company.
In August 2021, the Company subscribed 21,213,628 ordinary shares of US$1.00 each amounting to US$21,213,628 in Vena Energy (Taiwan) Ltd, a wholly owned subsidiary of the Company.
Bonds issuance
On 8 July 2021, a related company, Vena Energy Capital Pte. Ltd. (“Euro Medium Term Note Issuer”), issued US$175,000,000 3.133% per annum notes due in 2025 listed on Singapore Exchange Securities Trading Limited (“SGX-ST”) under the US$1,000,000,000 Global Medium Term Note Programme (the ”Notes”). The Notes is to be consolidated and form a single series with the US$325,000,000 3.133% per annum notes issued on 26 February 2020. The Notes bear interest at the rate of 3.133% per annum from and including 26 February 2021, and interest will be payable semi-annually in arrears on 26 February and 26 August in each year, commencing on 26 August 2021. The Notes will mature on 26 February 2025.
The bond proceeds were allocated to the Vena Energy Holdings Ltd, Vena Energy (Taiwan) Holdings Ltd and Zenith Japan Holdings Ltd (as trustee for Zenith Japan Holdings Trust) through intercompany loans.
Vena Energy Holdings Ltd, together with Vena Energy (Taiwan) Holdings Ltd and Zenith Japan Holdings Ltd (as trustee for Zenith Japan Holdings Trust) jointly and severally act as guarantors for Vena Energy Capital Pte. Ltd. for this bond issuance. The due and punctual payment of all sums payable by Vena Energy Capital Pte. Ltd. from time to time in respect of the bond will be unconditionally and irrevocably guaranteed on a joint and several basis by the guarantors.
27 Standards issued but not yet effective
A number of new standards and amendments to standards are effective for annual periods beginning after 1 January 2021 and earlier application is permitted; however, the Group has not early adopted any of the forthcoming new or amended standards in preparing the condensed interim financial statements.

KPMG LLP (Registration No. T08LL1267L), an accounting limited liability partnership registered in Singapore under the Limited Liability Partnership Act (Chapter 163A) and a member firm of the KPMG global organization of independent member firms affiliated with KPMG International Limited, a private English company limited by guarantee.
Zenith Japan Holdings Trust and its subsidiaries
Condensed Interim Financial Statements For the six months ended 30 June 2021

Zenith Japan Holdings Trust
and its subsidiaries
Statement by Directors
For the six months ended 30 June 2021
1
Statement by Directors of the Trustee
In the opinion of the directors of Zenith Japan Holdings Ltd (the ‘Trustee’):
(a) the accompanying condensed interim financial statements set out on pages FS1 to FS32 comprising the condensed statements of financial position of the Group and the Trust as at 30 June 2021, the condensed statements of profit or loss and other comprehensive income, changes in unitholders’ fund and cash flows for the Group and for the Trust for the six months period then ended, and notes to the condensed interim financial statements, including significant accounting policies, are prepared, in all material respects, in accordance with the International Accounting Standard (“IAS”) 34 Interim Financial Reporting; and
(b) at the date of this statement, there are reasonable grounds to believe that the Trust will be able to pay its debts as and when they fall due.
The Board of Directors of the Trustee has, on the date of this statement, authorised the condensed interim financial statements for issue.
On behalf of the Board of Directors of the Trustee,
Director
8 September 2021

KPMG LLP
16 Raffles Quay #22-00
Hong Leong Building
Singapore 048581
Telephone +65 6213 3388
Fax +65 6225 0984
Internet www.kpmg.com.sg
2
KPMG LLP (Registration No. T08LL1267L), an accounting limited liability partnership registered in Singapore under the Limited Liability Partnership Act (Chapter 163A) and a member firm of the KPMG global organization of independent member firms affiliated with KPMG International Limited, a private English company limited by guarantee.
Independent auditors’ report
The Trustee
Zenith Japan Holdings Trust
Report on the review of Condensed Interim Financial Statements
Introduction
We have reviewed the accompanying Condensed Interim Financial Statements of Zenith Japan
Holdings Trust (the ‘Trust’) and its subsidiaries (collectively the ‘Group’) which comprise the
condensed consolidated statement of financial position of the Group and the condensed statement
of financial position of the Trust as at 30 June 2021, the condensed consolidated statements of
profit or loss and other comprehensive income, changes in unitholders’ fund and cash flows for
the Group and the condensed statements of profit or loss and other comprehensive income,
changes in unitholders’ fund and cash flows for the Trust for the six months period then ended
and certain explanatory notes. Management is responsible for the preparation and presentation of
the Condensed Interim Financial Statements in accordance with International Accounting
Standard IAS 34 Interim Financial Reporting. Our responsibility is to express a conclusion on the
Condensed Interim Financial Statements based on our review.
Scope of review
We conducted our review in accordance with International Standard on Review Engagements
2410 Review of Interim Financial Information Performed by the Independent Auditor of the
Entity. A review of interim financial statements consists of making inquiries, primarily of persons
responsible for financial and accounting matters, and applying analytical and other review
procedures. A review is substantially less in scope than an audit conducted in accordance with
International Standards on Auditing and consequently does not enable us to obtain assurance that
we would become aware of all significant matters that might be identified in an audit.
Accordingly, we do not express an audit opinion.
Conclusion
Based on our review, nothing has come to our attention that causes us to believe that the
accompanying Condensed Interim Financial Statements is not prepared, in all material respects,
in accordance with IAS 34 Interim Financial Reporting.


Zenith Japan Holdings Trust
and its subsidiaries
Condensed Interim Financial Statements
For the six months ended 30 June 2021
FS1
The accompanying notes form an integral part of the condensed interim financial statements.
Condensed statements of financial position As at 30 June 2021
Group Trust 30 June 31 December 30 June 31 December
Note 2021 2020 2021 2020 US$’000 US$’000 US$’000 US$’000
Assets Property, plant and equipment 6 1,114,393 1,001,708 – – Right-of-use assets 7 218,346 219,087 – – Intangible assets 8 1,227,388 1,329,071 – – Investment in subsidiary 9 – – 1,818,083 1,668,500 Equity-accounted investees 10 53,086 46,147 – – Loan receivable 11 38,234 – 38,234 – Prepayments and other assets 12 3,631 3,816 – – Trade and other receivables 13 45,245 29,494 – –
Non-current assets 2,700,323 2,629,323 1,856,317 1,668,500
Loan receivable 11 3 – 3 – Prepayments and other assets 12 5,442 5,446 – – Trade and other receivables 13 26,544 381,709 – 350,000 Cash and cash equivalents 14 70,128 107,402 1,275 6,808
Current assets 102,117 494,557 1,278 356,808
Total assets 2,802,440 3,123,880 1,857,595 2,025,308
Unitholders’ funds Units in issue 15 1,712,182 1,712,182 1,712,182 1,712,182 Accumulated profits/(losses) 29,917 16,266 19,437 (14,060)
Reserves 8,385 142,330 – –Equity attributable to
unitholder of the Trust 1,750,484 1,870,778 1,731,619 1,698,122 Non-controlling interests 15,685 16,255 – –
Total unitholders’ fund 1,766,169 1,887,033 1,731,619 1,698,122
LiabilitiesLoans and borrowings 16 679,564 826,132 125,161 325,022 Lease liabilities 16 206,519 205,118 – – Derivative liabilities 17 14,333 13,130 – – Asset retirement obligation 24,745 26,489 – – Trade and other payables 18 684 759 – –
Non-current liabilities 925,845 1,071,628 125,161 325,022
Loans and borrowings 16 13,557 69,044 597 1,996 Lease liabilities 16 8,031 6,529 – – Trade and other payables 18 88,838 88,703 218 168 Current tax liabilities – 943 – –
Current liabilities 110,426 165,219 815 2,164
Total liabilities 1,036,271 1,236,847 125,976 327,186
Total equity and liabilities 2,802,440 3,123,880 1,857,595 2,025,308

Zenith Japan Holdings Trust
and its subsidiaries
Condensed Interim Financial Statements
For the six months ended 30 June 2021
FS2
The accompanying notes form an integral part of the condensed interim financial statements.
Condensed statements of profit or loss and other comprehensive incomeFor the six months ended 30 June 2021
Group Trust
Note
Six months ended
30 June 2021
Six months ended
30 June 2020
Six months ended
30 June 2021
Six months ended
30 June 2020 US$’000 US$’000 US$’000 US$’000
Revenue 19 52,394 51,379 27,257 –
Other income 19 51 816 – –
Operating costs 20 (9,353) (7,361) (122) (93) Asset management fees 21 (1,792) (2,159) – – Development costs 22 (773) (167) – – Depreciation expense 6,7 (13,835) (12,859) – – Amortisation expense 8 (12,718) (11,199) – –
Results from operating activities 13,974 18,450 27,135 (93)
Finance income 23 4 1 3 – Finance costs 23 (4,630) (4,417) (1,360) (1,727) Net foreign exchange
gain/(loss) 11,973 (6,008) 7,719 (3,023) Change in fair value of
financial derivatives (1,965) (3,787) – –
5,382 (14,211) 6,362 (4,750)
Impairment loss on financial assets (149) (40) – –
Write-off of plant, property and equipment 6 (1,282) (94) – –
Loss on disposal of property, plant and equipment (223) – – –
Acquisition-related cost (1,126) (5,938) – – Share of profit/(loss) of
equity-accounted investees, net of tax 10 285 (735) – –
Profit/(loss) before tax 16,861 (2,568) 33,497 (4,843) Tax expense (3,122) (793) – –
Profit/(loss) for the period 13,739 (3,361) 33,497 (4,843)
Profit/(loss) attributable to:Unitholder of the Trust 13,651 (3,430) 33,497 (4,843) Non-controlling interests 88 69 – –
13,739 (3,361) 33,497 (4,843)

Zenith Japan Holdings Trust
and its subsidiaries
Condensed Interim Financial Statements
For the six months ended 30 June 2021
FS3
The accompanying notes form an integral part of the condensed interim financial statements.
Condensed statements of profit or loss and other comprehensive income (cont’d)For the six months ended 30 June 2021
Group Trust
Note
Six months ended
30 June 2021
Six months ended
30 June 2020
Six months ended
30 June 2021
Six months ended
30 June 2020 US$’000 US$’000 US$’000 US$’000
Other comprehensive (loss)/income
Items that are or may be reclassified subsequently to profit or loss
Foreign currency translation differences (132,252) 38,765 – –
Equity-accounted investees – share of OCI 10 (2,911) 377 – –
Other comprehensive (loss)/income for the period (135,163) 39,142 – –
Total comprehensive (loss)/income for the period (121,424) 35,781 33,497 (4,843)
Total comprehensive (loss)/income attributable to:
Unitholders of the Trust (120,294) 35,381 33,497 (4,843) Non-controlling interests (1,130) 400 – –
(121,424) 35,781 33,497 (4,843)

Zen
ith
Jap
an
Ho
ldin
gs T
rust
an
d i
ts s
ub
sid
iari
es
Conde
nsed I
nte
rim
Fin
ancia
l S
tate
ments
For
the s
ix m
on
ths e
nded 3
0 J
une 2
021
FS
4
Th
e a
cco
mpa
nyin
g n
ote
s f
orm
an in
tegra
l pa
rt o
f th
e c
onden
sed inte
rim
fin
an
cia
l sta
tem
ents
.
Co
nd
en
sed
co
nso
lid
ate
d s
tate
men
t o
f ch
an
ge
s in
un
ith
old
ers
’ fu
nd
F
or
the s
ix m
on
ths
en
ded
30 J
un
e 2
021
Att
rib
uta
ble
to
un
ith
old
er
of
the T
rust
No
teU
nit
s in
issu
e
Un
ith
old
ers
’ fu
nd
s
Accu
mu
late
d
pro
fits
T
ran
sla
tio
n
rese
rves
To
tal
No
n-c
on
tro
llin
g
inte
rest
To
tal
US
$’0
00
US
$’0
00
US
$’0
00
US
$’0
00
US
$’0
00
US
$’0
00
U
S$’0
00
At
1 J
an
uary
202
1
1,7
12,1
82
–
16
,266
142
,33
0
1,8
70,7
78
16,2
55
1,8
87,0
33
To
tal
co
mp
reh
en
siv
e i
nco
me f
or
the p
eri
od
P
rofit fo
r th
e p
erio
d
–
–
13,6
51
–
13
,651
88
13,7
39
Oth
er
co
mp
reh
en
siv
e in
co
me
Fore
ign c
urr
ency
tra
nsla
tion d
iffere
nces
–
–
–
(131
,034
) (1
31
,034
) (1
,218)
(132
,252
) E
qu
ity-a
ccou
nte
d in
veste
es –
sha
re o
f O
CI
10
–
–
–
(2,9
11)
(2,9
11)
–
(2,9
11)
To
tal
co
mp
reh
en
siv
e i
nco
me f
or
the p
eri
od
–
–
13
,651
(1
33
,945
) (1
20
,294
) (1
,130
) (1
21
,424
)
Tra
ns
acti
on
s w
ith
un
ith
old
er,
reco
gn
ise
d d
irectl
y i
n
eq
uit
y
Ch
an
ges in
ow
ners
hip
in
tere
sts
in
su
bsid
iari
es
Issu
e o
f ord
inary
share
s w
ith
out
a c
hang
e in c
ontr
ol
–
–
–
–
–
560
560
To
tal
tra
nsacti
on
s w
ith
un
ith
old
er
–
–
–
–
–
560
560
At
30 J
un
e 2
02
1
1,7
12,1
82
–
29
,917
8,3
85
1,7
50,4
84
15,6
85
1,7
66,1
69

Zen
ith
Jap
an
Ho
ldin
gs T
rus
t
an
d i
ts s
ub
sid
iari
es
Conde
nsed I
nte
rim
Fin
ancia
l S
tate
ments
For
the s
ix m
onth
s e
nded 3
0 J
une 2
021
FS
5
The
accom
panyin
g n
ote
s fo
rm a
n in
tegra
l part
of
the c
ond
ensed inte
rim
fin
ancia
l sta
tem
ents
.
Co
nd
en
sed
co
nso
lid
ate
d s
tate
men
t o
f ch
an
ge
s in
un
ith
old
ers
’ fu
nd
(c
on
t’d
) F
or
the
six
mo
nth
s e
nd
ed
30 J
un
e 2
02
1
Att
rib
uta
ble
to
un
ith
old
er
of
the
Tru
st
No
te
Un
its
in
is
su
e
Un
ith
old
er’
s
fun
ds
Ac
cu
mu
late
d
pro
fits
T
ran
sla
tio
n
res
erv
es
To
tal
No
n-
co
ntr
oll
ing
in
tere
st
To
tal
US
$’0
00
US
$’0
00
US
$’0
00
US
$’0
00
US
$’0
00
US
$’0
00
US
$’0
00
At
1 J
an
uary
20
20
1,4
16
,05
1
13
,131
48
,673
42
,470
1,5
20
,32
5
11,8
59
1,5
32
,18
4
To
tal
co
mp
reh
en
siv
e i
nc
om
e f
or
the
pe
rio
dL
oss
fo
r th
e p
eri
od
–
–
(3,4
30
) –
(3
,43
0)
69
(3,3
61
)
Oth
er
co
mp
reh
en
siv
e i
nc
om
e
Fo
reig
n c
urr
ency tra
nsla
tion
diff
ere
nce
s –
–
–
3
8,4
34
38
,434
33
1
38
,765
Eq
uity
-acco
unte
d inve
ste
es –
sha
re o
f O
CI
–
–
–
37
7
37
7
–
37
7
To
tal
co
mp
reh
en
siv
e i
nc
om
e f
or
the
pe
rio
d–
–
(3
,43
0)
38
,811
35
,381
40
0
35
,781
Tra
nsa
cti
on
s w
ith
un
ith
old
er,
re
co
gn
ise
d d
ire
ctl
y in
e
qu
ity
Co
ntr
ibu
tio
ns b
y u
nit
ho
lde
r
Co
nve
rsio
n o
f a
dva
nce
fro
m u
nith
old
er
13
,131
(13
,131
) –
–
–
–
–
Re
de
mption
of u
nits
(6
7,0
00
) –
–
–
(6
7,0
00
) –
(67,0
00
)
To
tal
co
ntr
ibu
tio
ns o
f u
nit
ho
lde
r (5
3,8
69
) (1
3,1
31
) –
–
(6
7,0
00
) –
(67,0
00
)
Ch
an
ge
s in
ow
ne
rsh
ip i
nte
res
ts i
n s
ub
sid
iari
es
Acq
uis
itio
n o
f su
bsid
iari
es w
ith n
on
-co
ntr
olli
ng
inte
rest
–
–
–
–
–
1,1
73
1,1
73
To
tal
ch
an
ges
in
ow
ne
rsh
ip in
tere
sts
in
su
bs
idia
rie
s–
–
–
–
–
1
,17
3
1,1
73
To
tal
tra
ns
acti
on
s w
ith
un
ith
old
er
(53
,869
) (1
3,1
31
) –
–
(6
7,0
00
) 1
,17
3
(65,8
27
)
At
30 J
un
e 2
02
0
1,3
62
,18
2
–
45
,243
81
,281
1,4
88
,70
6
13,4
32
1,5
02
,13
8

Zenith Japan Holdings Trust
and its subsidiaries
Condensed Interim Financial Statements
For the six months ended 30 June 2021
FS6
The accompanying notes form an integral part of the condensed interim financial statements.
Condensed statement of changes in unitholders’ fund (cont’d) For the six months ended 30 June 2021
Trust Units in issueUnitholder’s
funds Accumulated profit/(losses) Total
US$’000 US$’000 US$’000 US$’000
At 1 January 2021 1,712,182 – (14,060) 1,698,122
Total comprehensive income for the period – – 33,497 33,497
At 30 June 2021 1,712,182 – 19,437 1,731,619
At 1 January 2020 1,416,051 13,131 (404) 1,428,778
Total comprehensive loss for the period – – (4,843) (4,843)
Transactions with unitholder, recognised directly in equity
Conversion of advance from unitholder 13,131 (13,131) – –
Redemption of units (67,000) – – (67,000)
Total transactions with unitholder (53,869) (13,131) – (67,000)
At 30 June 2020 1,362,182 – (5,247) 1,356,935

Zenith Japan Holdings Trust
and its subsidiaries
Condensed Interim Financial Statements
For the six months ended 30 June 2021
FS7
The accompanying notes form an integral part of the condensed interim financial statements.
Condensed consolidated statement of cash flows For the six months ended 30 June 2021
Note
Six months ended
30 June 2021
Six months ended
30 June 2020Group US$’000 US$’000
Cash flows from operating activitiesProfit/(Loss) before tax 16,861 (2,568) Adjustments for: Depreciation expense 6,7 13,835 12,859 Amortisation expense 8 12,718 11,199 Write-off of property, plant and equipment 6 1,282 94 Loss on disposal of property, plant and equipment 223 – Net changes in fair value of financial derivatives 1,965 3,787 Impairment loss on financial assets 149 40 Finance income 23 (4) (1) Finance costs 23 4,630 4,417 Share of (profit)/loss of equity-accounted investees 10 (285) 735 Unrealised foreign exchange (gain)/loss (10,750) 10,171
40,624 40,733 Changes in: - Trade and other receivables (16,111) (8,758) - Prepayments and other assets (279) 13,205 - Trade and other payables 5,045 1,087 Cash generated from operating activities 29,279 46,267 Tax paid (4,052) (1,391) Net cash generated from operating activities 25,227 44,876
Cash flows from investing activitiesAcquisition of subsidiaries, net of cash acquired – (35,901) Investment in equity-accounted investees 10 (9,565) (6,500) Purchase of property, plant and equipment (200,769) (96,333) Disbursement of loan to related party (38,979) – Proceeds from sale of property, plant and equipment 3,434 305 Purchase of intangible assets – (4,802) Interest received 1 – Net cash used in investing activities (245,878) (143,231)
Cash flows from financing activitiesRedemption of issued units – (67,000) Proceeds from the issuance of unit 350,000 – Equity contribution from NCI 560 1,451 Proceeds from drawdown of loans and borrowings: - Project finance debts 93,568 209,094 - Loan from related parties 105,289 248,411 - Loan from Euro Medium Term Note Issuer – 126,331 Repayment of loans and borrowings: - Project finance debts (60,683) (43,891) - Loan from related parties (291,137) (542,826) Transaction costs related to loans and borrowings (2,091) (4,917) Interest paid to loans and borrowings: - Project finance debts (2,654) (1,901) - Loan from related party (1,660) (984) - Loan from Euro Medium Term Note Issuer (946) – Payment of lease liabilities (1,772) – Deposits (pledged) / unpledged (17,286) 317,336 Net cash generated from financing activities 171,188 241,104

Zenith Japan Holdings Trust
and its subsidiaries
Condensed Interim Financial Statements
For the six months ended 30 June 2021
FS8
The accompanying notes form an integral part of the condensed interim financial statements.
Condensed consolidated statement of cash flows(cont’d)For the six months ended 30 June 2021
Note
Six months ended
30 June 2021
Six months ended
30 June 2020Group US$’000 US$’000
Net increase in cash and cash equivalents (49,463) 142,749 Cash and cash equivalents at 1 January 96,386 97,269 Effect of exchange rate fluctuations on cash held (4,920) 1,893 Cash and cash equivalents at 30 June 14 42,003 241,911

Zenith Japan Holdings Trust
and its subsidiaries
Condensed Interim Financial Statements
For the six months ended 30 June 2021
FS9
The accompanying notes form an integral part of the condensed interim financial statements.
Condensed statement of cash flows For the six months ended 30 June 2021
Note
Six months ended
30 June 2021
Six months ended
30 June 2020Trust US$’000 US$’000
Cash flows from operating activitiesProfit/(Loss) before tax 33,497 (4,843) Adjustments for: Dividend income 19 (27,257) – Finance income 23 (3) – Finance costs 23 1,360 1,727
Unrealised foreign exchange (gain)/ loss (5,937) 3,022 1,660 (94)
Changes in: - Trade and other payables 556 188 Net cash generated from operating activities 2,216 94
Cash flows from investing activitiesDistribution from subsidiary: - Dividend income received 27,257 – - Redemption of units 9 63,879 – Subscription of additional units in subsidiary (218,773) – Disbursement of loan to related party 11 (38,979) – Proceeds from repayment of advances to subsidiary – 170,259 Advances to subsidiary – (53,863) Net cash (used in)/ generated from investing activities (166,616) 116,396
Cash flows from financing activitiesProceeds from issuance of units 15 350,000 – Redemption of issued units – (67,000) Proceeds from drawdown of loans and borrowings: - Loan from related party 16 100,783 111,276 - Loan from Euro Medium Term Note Issuer – 127,849 Repayment of loans and borrowings: - Loan from related party (290,311) (181,524) - On behalf of subsidiary to related party – (313,585) Interest paid to loans and borrowings: - Loan from related party (1,645) (984) - Loan from Euro Medium Term Note Issuer (946) – Transaction costs related to loans and borrowings – (1,517) Other finance costs paid – (582) Net cash generated from/ (used in) financing activities 157,881 (326,067)
Net increase in cash and cash equivalents (6,519) (209,577) Cash and cash equivalents at 1 January 6,808 318,160 Effect of exchange rate fluctuations on cash held 986 868 Cash and cash equivalents at 30 June 14 1,275 109,451

Zenith Japan Holdings Trust
and its subsidiaries
Condensed Interim Financial Statements
For the six months ended 30 June 2021
FS10
The accompanying notes form an integral part of the condensed interim financial statements.
Condensed statement of cash flows (cont’d) For the six months ended 30 June 2021
Significant non-cash transaction
Excluded in the statement of cash flows above were non-cash transactions that took place during the period. The significant non-cash transactions are disclosed below:
1) On 26 February 2020, total borrowings consisting of principal and accrued interest due to related party, Vena Energy Holdings Ltd, amounting to JPY 20 billion (US$183 million) was novated from subsidiary, Zenith Japan Trust at an annual interest rate of 1.35% on the principal outstanding of JPY 20 billion (US$182 million).
2) During the six months ended 30 June 2020, The Trust increased its investment in the subsidiary by US$64.5 million by extinguishing advances to subsidiaries.

Zenith Japan Holdings Trust
and its subsidiaries
Condensed Interim Financial Statements
For the six months ended 30 June 2021
FS11
Notes to the condensed interim financial statements
1 Domicile and activities
(i) Trust
Zenith Japan Holdings Trust (the ‘Trust’) is constituted in the island of Guernsey under the trust deed dated 18 October 2017 and has the registered office at 1st Floor, Les Echelons Court, Les Echelons, South Esplanade, St Peter Port, GY1 1AR, Guernsey.
The condensed interim financial statements of the Group as at and for the six months ended 30 June 2021 comprised the Trust and its subsidiaries (together referred to as the ‘Group’ and individually as ‘Group entities’).
The principal activity of the Group is to invest in renewable energy assets via Tokumei Kumiai (‘TK’) agreements in Japan.
Zenith Japan Ltd in its capacity as Trustee of Zenith Trust, is the sole unitholder in the Trust.
(ii) Trustee
Zenith Japan Holdings Ltd is the trustee (the ‘Trustee’) of Zenith Japan Holdings Trust. The Trustee shall manage and administer the Trust and the Trust Fund in accordance with the trust instrument and shall exercise all powers, duties and discretions exercisable under the Trust or conferred by law.
(iii) Asset Management Agreement
Nippon Renewable Energy K.K., Nippon Wind Energy K.K. and SPC Asset Management Inc. (each, the ‘Asset Manager’) enters into the asset management agreements with the Group entities to manage the asset and business of the Group entities and in return to receive the asset management fees.
(iv) Operations & Maintenance (‘O&M’) Agreement
NRE Operations K.K. (the ‘O&M Provider’) enters into the O&M agreements with the Group entities to provide the relevant operation and maintenance services to the Group entities.
2 Basis of preparation
2.1 Purpose of the condensed interim financial statements
The condensed interim financial statements were drawn up for the purpose of a potential bond issuance and reporting to external counterparties for existing bonds issued.
2.2 Statement of compliance
The condensed interim financial statements have been prepared in accordance with International Accounting Standard IAS 34 Interim Financial Reporting, and should be read in conjunction with the last annual financial statements as at and for the year ended 31 December 2020. They do not include all of the information required for a complete set of International Financial Reporting Standards (‘IFRS’) financial statements.
2.3 Comparative information
The Group presented the condensed interim financial information of the Trust for the six months period ended 30 June 2021 for the first time. The condensed interim financial information of the Trust for the six months period ended 30 June 2020 is included for comparative purposes and is neither reviewed nor audited.

Zenith Japan Holdings Trust
and its subsidiaries
Condensed Interim Financial Statements
For the six months ended 30 June 2021
FS12
3 Seasonality in operations
Seasonality in operations for the Interim period results are not necessarily indicative of results of operations or cash flows for an annual period. The Group’s operating results are impacted by external factors, such as resource availability. For example, the power production at the solar plants is directly impacted by seasonal changes in solar irradiance which is normally at its highest during the summer months in Japan.
4 Significant accounting policies
New standards and amendments
The Group has applied the following amendments to and interpretations of the Group accounting policies for the first time for the period beginning on 1 January 2021:
Covid-19-Related Rent Concessions (Amendment to IFRS 16)
Interest Rate Benchmark Reform – Phase 2 (Amendments to IFRS 9, IAS 39, IFRS 7, IFRS 4 and IFRS 16)
The application of these amendments to standards and interpretations does not have a material effect on the financial statements.
5 Use of judgements and estimates
The preparation of the financial statements in conformity with IFRS requires management to make judgements, estimates and assumptions that affect the application of accounting policies and the reported amounts of assets, liabilities, income and expenses. Actual results may differ from these estimates.
Estimates and underlying assumptions are reviewed on an ongoing basis. Revisions to accounting estimates are recognised in the period in which the estimates are revised and in any future periods affected.
Information about critical estimates in applying accounting policies that have the most significant effect on the amounts recognised in the financial statements is included in the following notes:
Measurement of fair values
A number of the Group’s accounting policies and disclosures require the measurement of fair values, for both financial and non-financial assets and liabilities.
When measuring the fair value of an asset or a liability, the Group uses observable market data as far as possible. Fair values are categorised into different levels in a fair value hierarchy based on the inputs used in the valuation techniques as follows:
Level 1: quoted prices (unadjusted) in active markets for identical assets or liabilities.
Level 2: inputs other than quoted prices included in Level 1 that are observable for the asset or liability, either directly (i.e. as prices) or indirectly (i.e. derived from prices).
Level 3: inputs for the asset or liability that are not based on observable market data (unobservable inputs).
If the inputs used to measure the fair value of an asset or a liability fall into different levels of the fair value hierarchy, then the fair value measurement is categorised in its entirety in the same level of the fair value hierarchy as the lowest level input that is significant to the entire measurement (with Level 3 being the lowest).
The Group recognises transfers between levels of the fair value hierarchy as of the end of the reporting period during which the change has occurred.
Further information about the assumptions made in measuring fair values is included in Note 24 Fair value of financial instruments.

Zenith Japan Holdings Trust
and its subsidiaries
Condensed Interim Financial Statements
For the six months ended 30 June 2021
FS13
6 Property, plant and equipment
Note
Freehold
land
Building and
leasehold
improvement
s
Electric
generator
equipment
Assets
under
construction Total
US$’000 US$’000 US$’000 US$’000 US$’000
Group
CostAt 1 January 2020 46,200 10 408,823 259,150 714,183
Acquisition through asset
acquisition of
subsidiaries – – – 42,280 42,280
Acquisition through
business combination – – 55,220 – 55,220
Additions 1,904 4 2,480 239,641 244,029
Reclassifications (a) – – 133,317 (159,705) (26,388)
Reclassifications from
right-of-use asset 7 – – – 3,199 3,199
Disposal (16,916) – (183) (1,097) (18,196)
Effect of exchange rate
changes 2,179 1 32,200 18,737 53,117
At 31 December 2020/
1 January 2021 33,367 15 631,857 402,205 1,067,444
Additions 298 1 86 201,598 201,983
Reclassifications from
right-of-use asset 7 – – – 2,496 2,496
Reclassification to
intangible asset 8 – – – (1,804) (1,804)
Reclassification – – 21,183 (21,183) –
Disposal (3,851) – – – (3,851)
Write-off – – – (1,282) (1,282)
Effect of exchange rate
changes (2,204) (2) (43,260) (32,112) (77,578)
At 30 June 2021 27,610 14 609,866 549,918 1,187,408
Accumulated depreciation
At 1 January 2020 – 1 38,548 – 38,549
Depreciation charge for
the year – –* 24,008 – 24,008
Effect of exchange rate
changes – –* 3,179 – 3,179
At 31 December 2020/
1 January 2021 – 1 65,735 – 65,736
Depreciation charge for
the period – – 12,356 – 12,356
Effect of exchange rate
changes – – (5,077) – (5,077)
At 30 June 2021 – 1 73,014 – 73,015
Carrying amounts
At 1 January 2020 46,200 9 370,275 259,150 675,634
At 31 December 2020 33,367 14 566,122 402,205 1,001,708
At 30 June 2021 27,610 13 536,852 549,918 1,114,393
* Amount less than US$1,000

Zenith Japan Holdings Trust
and its subsidiaries
Condensed Interim Financial Statements
For the six months ended 30 June 2021
FS14
6 Property, plant and equipment (cont’d)
(a) These pertain to recoverable taxes that were subsequently reclassified to “Trade and other receivables” in the financial year.
As at reporting date, some property, plant and equipment were pledged as collateral to secure project finance debts (see note 16).
During the period, asset management fee expenses and engineering, procurement and construction (‘EPC’) expenses charged by related parties of the Group, Nippon Renewable Energy K.K and Nippon Wind Energy K.K amounting to US$15.3 million (31 December 2020: US$13.7 million) have been capitalized for projects that have yet to reach their commercial operation dates.
7 Right-of-use assets
Note Land
US$’000Group
CostAt 1 January 2020 112,242
Acquisition through asset acquisition of subsidiaries 4,554
Acquisition through business combination 14,349
Additions 86,707
Effect of exchange rate changes 10,689
At 31 December 2020/ 1 January 2021 228,541
Additions 18,126
Effect of exchange rate changes (15,645)
At 30 June 2021 231,022
Accumulated depreciation
At 1 January 2020 3,001 Depreciation charge for the year 2,874 Reclassification to property, plant and equipment 6 3,199 Effect of exchange rate changes 380 At 31 December 2020/ 1 January 2021 9,454 Depreciation charge for the period 1,479 Reclassification to property, plant and equipment 6 2,496 Effect of exchange rate changes (753) At 30 June 2021 12,676
Carrying amounts
At 1 January 2020 109,241
At 31 December 2020 219,087
At 30 June 2021 218,346
As at reporting date, some right-of-use assets were pledged as collateral to secure project finance debts (see note 16).

Zenith Japan Holdings Trust
and its subsidiaries
Condensed Interim Financial Statements
For the six months ended 30 June 2021
FS15
8 Intangible assets
Note Goodwill
Project-related
agreements &
licences Total
US$’000 US$’000 US$’000
Group
Cost
At 1 January 2020 252,556 949,381 1,201,937
Acquisition through asset acquisition of subsidiaries – 65,756 65,756
Acquisition through business combination 8,949 14,366 23,315
Additions – 20,416 20,416
Effect of exchange rates changes 15,392 58,091 73,483
At 31 December 2020/ 1 January 2021 276,897 1,108,010 1,384,907
Reclassification from property, plant and equipment 6 – 1,804 1,804
Effect of exchange rates changes (18,906) (75,961) (94,867)
At 30 June 2021 257,991 1,033,853 1,291,844
Accumulated amortisation
At 1 January 2020 – 27,623 27,623
Amortisation expense for the year – 25,798 25,798
Effect of exchange rates changes – 2,415 2,415
At 31 December 2020/ 1 January 2021 – 55,836 55,836
Amortisation expense for the period – 12,718 12,718
Effect of exchange rates changes – (4,098) (4,098)
At 30 June 2021 – 64,456 64,456
Carrying amounts
At 1 January 2020 252,556 921,758 1,174,314
At 31 December 2020 276,897 1,052,174 1,329,071
At 30 June 2021 257,991 969,397 1,227,388
Amortisation of the intangible assets will begin on the commercial operation date of the renewable assets as defined in the respective power purchase agreements.
As at reporting date, some intangible assets were pledged as collateral to secure project finance debts (see note 16).
9 Investment in subsidiary Trust
30 June 2021
31 December 2020
US$’000 US$’000
Equity investments, at cost 1,818,083 1,668,500

Zenith Japan Holdings Trust
and its subsidiaries
Condensed Interim Financial Statements
For the six months ended 30 June 2021
FS16
9 Investment in subsidiary (cont’d)
The table below provides a reconciliation of the movement in investment in the subsidiary:
Trust 30 June
2021 31 December
2020 US$ US$
Balance as at 1 January 1,668,500 1,429,182 Additions during the period 213,462 239,318 Redemption during the period (63,879) –
Balance as 30 June 2021/31 December 2020 1,818,083 1,668,500
During six months period ended 30 June 2021, the Trust increased its investment in the subsidiary by
US$213,461,807 (31 December 2020: US$239,318,000) and redeemed 59,700,000 of its units as a price of
US$1.07 per unit for the aggregate consideration of US$63,879,000
Details of the subsidiary is as follows:
Name of subsidiaryCountry of
incorporationEffective equity interest
held by the Trust30 June
202131 December
2020% %
Zenith Japan Trust Guernsey 100 100
10 Equity-accounted investees
Interest in joint venture
Group30 June 31 December
2021 2020US$’000 US$’000
Interests in joint venture 53,086 46,147
During the six months period ended 30 June 2021, the Group acquired 49% economic interest in Wind Power Energy Co., Ltd. (“WPE”). The remaining economic interest is substantially owned by a third party, Prominet Power K.K. and decisions in relation to key relevant activities of WPE require unanimous consent. The Group has assessed that it has joint control over WPE, and that its investment in WPE meets the definition of a joint venture (as defined by the Group’s accounting policy). WPE is based in Japan, and principally engaged in development and operation of renewable energy assets.

Zenith Japan Holdings Trust
and its subsidiaries
Condensed Interim Financial Statements
For the six months ended 30 June 2021
FS17
10 Equity-accounted investees (cont’d)
Interest in joint venture (cont’d)
The following summarises the financial information of the Group’s joint ventures based on the financial statements prepared in accordance with IFRS:
2021 Nanao KK Kyudenko WPE
30 June 30 June 30 June 2021 2021 2021
US$’000 US$’000 US$’000 Statement of financial position
Property, plant and equipment 41,399 44,849 34,166 Right-of-use assets 15,862 52,660 11,619
Intangible assets 1,433 38,126 –
Prepayments and other assets 1,786 197 –
Trade and other receivables 198 – –
Non-current assets 60,678 135,832 45,785
Prepayments and other assets – 144 3
Trade and other receivables – 32,755 3
Cash and cash equivalents 2,886 5,865 8,666
Current assets 2,886 38,764 8,672
Total assets 63,564 174,596 54,457
Loans and borrowings 31,645 77,228 15,707
Lease liabilities 6,199 57,321 11,202
Derivative liabilities 378 2,623 –
Non-current liabilities 38,222 137,172 26,909
Loans and borrowings – – 57
Lease liabilities 380 225 409
Trade and other payables 7 2 2,663
Current liabilities 387 227 3,129
Total liabilities 38,609 137,399 30,038
Net assets 24,955 37,197 24,419
Statement of comprehensive income
Other income – 1 1
Operating expenses (10) (91) (16)
Change in fair value of financial derivatives 1,214 (701) –
Profit/(loss) before tax 1,204 (791) (15)
Tax expense (1) – –
Profit/(loss) for the period 1,203 (791) (15) Foreign currency translation differences (1,435) (2,783) (1)
Total comprehensive losses for the period (232) (3,574) (16)

Zenith Japan Holdings Trust
and its subsidiaries
Condensed Interim Financial Statements
For the six months ended 30 June 2021
FS18
10 Equity-accounted investees (cont’d)
Interest in joint venture (cont’d)
2020 Nanao KK Kyudenko
31 December 31 December 2020 2020
US$’000 US$’000 Statement of financial position
Property, plant and equipment 43,658 16,131 Right-of-use assets 1,538 40,920 Intangible assets 17,393 57,921 Prepayments and other assets 1,917 97
Non-current assets 64,506 115,069
Prepayments and other assets – 246 Trade and other receivables 221 33,177 Cash and cash equivalents 3,792 10,513
Current assets 4,013 43,936
Total assets 68,519 159,005
Loans and borrowings 33,684 48,699 Lease liabilities 7,129 61,578 Trade and other payables 1,709 2,063
Non-current liabilities 42,522 112,340
Loans and borrowings – – Lease liabilities 405 56 Trade and other payables 100 5,837
Current liabilities 505 5,893
Total liabilities 43,027 118,233
Net assets 25,492 40,772
Statement of comprehensive income
Other income – –
Development costs (993) (72)
Loss before tax (993) (72) Tax expense – – Loss for the year (993) (72) Foreign currency translation differences 495 51 Total comprehensive loss (498) (21)

Zenith Japan Holdings Trust
and its subsidiaries
Condensed Interim Financial Statements
For the six months ended 30 June 2021
FS19
10 Equity-accounted investees (cont’d)
Interest in joint venture (cont’d)
Nanao KK Kyudenko Kashima TotalUS$’000 US$’000 US$’000 US$’000
2021
Carrying amount of interest in joint venture at 1 January 2021 17,378 28,769 – 46,147
Group's acquisition of share capital during the period – – 9,565 9,565
Share of profit/(loss) of joint venture 831 (546) – 285
Share of OCI (990) (1,921) – (2,911) Carrying amount of interest in
joint venture at 30 June 2021 17,219 26,302 9,565 53,086
2020
Carrying amount of interest in joint venture at 1 January 2020 – 28,151 – 28,151
Group's acquisition of share capital during the year 18,156 – – 18,156
Share of loss of joint venture (1,204) (966) – (2,170) Share of OCI 426 1,584 – 2,010 Carrying amount of interest in
joint venture at 31 December 2020 17,378 28,769 – 46,147
11 Loan receivable Group and Trust
30 June 31 December2021 2020
US$’000 US$’000Non-currentLoan receivable from related party 38,234 –
CurrentInterest on loan receivable from related party 3 –
38,237 –
The Group and the Trust has a loan receivable from Vena Energy Holdings Ltd with an annual interest rate of 1.375%, unsecured and repayable in 35 months.

Zenith Japan Holdings Trust
and its subsidiaries
Condensed Interim Financial Statements
For the six months ended 30 June 2021
FS20
12 Prepayments and other assets Group
30 June 31 December2021 2020
US$’000 US$’000Non-currentPrepaid asset management fees 2,002 1,858 Prepaid O&M mobilisation fees 1,629 1,958
3,631 3,816
CurrentPrepaid Insurance 493 689 Advance payments for construction costs 3,572 3,399 Other assets 1,377 1,358
5,442 5,446
9,073 9,262
As at reporting date, some prepayments and other assets were pledged as collateral to secure project finance debts (see note 16).
13 Trade and other receivables
Group Trust30 June 31 December 30 June 31 December
Note 2021 2020 2021 2020US$’000 US$’000 US$’000 US$’000
Non-currentVAT receivables 6 44,696 28,912 – – Deposits 549 582 – –
45,245 29,494 – – CurrentNon-trade amounts due
from: - Unitholder (a) – 350,000 – 350,000 - Related parties (b) 8,648 9,314 – – - Asset Managers 399 137 – – - O&M Provider 84 13 – – Contract assets 10,336 5,150 – – VAT receivables 2,485 11,302 – – EPC contractors 1,163 1,248 – – Other deposits 3,492 4,645 – –
26,607 381,809 – 350,000 Less: Impairment loss (63) (100) – –
26,544 381,709 – 350,000
71,789 411,203 – 350,000
(a) Amount due from unitholder is unsecured, non-trade in nature, non-interest bearing and repayable on demand. This amount was subsequently received in February 2021.
(b) Amount due from related parties (as defined in note 26) are unsecured, non-trade in nature, non-interest bearing and repayable on demand
As at reporting date, some trade and other receivables were pledged as collateral to secure project finance debts (see note 16).

Zenith Japan Holdings Trust
and its subsidiaries
Condensed Interim Financial Statements
For the six months ended 30 June 2021
FS21
14 Cash and cash equivalents
Group Trust30 June 31 December 30 June 31 December
Note 2021 2020 2021 2020US$’000 US$’000 US$’000 US$’000
Bank balances 70,341 107,438 1,275 6,808 Less: Impairment loss (213) (36) – – Cash and cash
equivalents in the statement of financial position 70,128 107,402 1,275 6,808
Restricted bank balances and deposits (a) (28,338) (11,052) – –
Add: impairment loss 213 36 – – Cash and cash
equivalents in the statement of cash flows 42,003 96,386 1,275 6,808
(a) As at 30 June 2021, US$9.7 million (2020: US$11.0 million) of the Group’s cash and cash equivalents were held under Debt Service Reserve Accounts (“DSRA”), a reserve account used for servicing of project finance debts.
As at reporting date, some cash and cash equivalents were pledged as collateral to secure project finance debts (see note 16). Included in restricted bank balances and deposits above were pledged deposits with restrictions on usage amounting to US$18.6 million (2020: Nil).
15 Units in issue Group and Trust
30 June 31 December2021 2020
No. of units No. of units(’000) (’000)
IssuedAt 1 July 2020/1 January 2020 1,712,872 1,416,051 Issued during the period/year – 350,000 Advance from unitholder converted to units in issue – 13,131 Redemption during the period/year – (66,310) At 30 June 2021/31 December 2020 1,712,872 1,712,872
Units
Each unit in the Trust represents an equal undivided interest in the Trust.
As at 30 June 2021, all units were issued and fully paid.

Zenith Japan Holdings Trust
and its subsidiaries
Condensed Interim Financial Statements
For the six months ended 30 June 2021
FS22
16 Loans and borrowings and lease liabilities
Group Trust30 June 31 December 30 June 31 December
Note 2021 2020 2021 2020US$’000 US$’000 US$’000 US$’000
Non-currentProject finance debts (a) 548,329 498,472 – – Bond issued by O&M
Provider 316 339 – – Loan from: - Related parties (b) 5,758 193,058 – 190,759 - Euro Medium Term
Note Issuer (c) 125,161 134,263 125,161 134,263 679,564 826,132 125,161 325,022
Lease liabilities 206,519 205,118 – –
CurrentProject finance debts (a) 12,912 66,997 – – Interest payable on: - Project finance debts (a) 8 4 – – - Euro Medium Term
Note Issuer (c)
597 656 597 656 - Bond issued by O&M
Provider 11 11 – – - Loan from related
parties (b) 29 1,376 – 1,340 13,557 69,044 597 1,996
Lease liabilities 8,031 6,529 – –
907,671 1,106,823 125,758 327,018
(a) Project finance debts
Project finance debts are entered with reputable financial institutions by respective Group entities and are repayable on a quarterly basis with maturity date from 2023 to 2038 (2020: 2023 to 2038). The interest rates on these borrowings consist of fixed rate of 0.9% (2020: 0.9%) and floating rates with ranges between 1-month to 6-month of TIBOR + 0.5% to 1.0% (2020: 3-month TIBOR + 0.62% to 0.70% and LIBOR + 0.62% to 0.7%).
The project finance debts contain debt covenants which are tested on a regular basis. A future breach of these covenants may require the Group to repay the loans and borrowings earlier than its year of maturity. The Group has not breached any debt covenants in the six months period ended 30 June 2021 and 30 June 2020.
Project finance debts are secured over the assets of the Group (see note 16 (d)).
(b) Loan from related parties
During the six months period ended 30 June 2021, the Group obtained a loan from Nippon Wind Energy K.K. with an annual interest of 0.587% on the principal outstanding. The loan is repayable within 3 years with maturity date in 2024.
As of 30 June 2021, the Group has another loan from Vena Energy Solar (Japan) Pte. Ltd. with an annual interest of 0.8% (2020: 0.8%) on the principal outstanding and maturity date in 2035 (2020: 2035) and repayable within 20 years (2020: 20 years) in equal and consecutive instalments of 33.33% (2020: 33.33%) with the first payment due 17 years from the date of origination and the same amount on the same day every year, or earlier upon demand. Vena Energy Solar (Japan) Pte. Ltd. does not have the intention to recall the loan in the next 12 months.

Zenith Japan Holdings Trust
and its subsidiaries
Condensed Interim Financial Statements
For the six months ended 30 June 2021
FS23
16 Loans and borrowings and lease liabilities (cont’d)
(c) Loan from Euro Medium Term Note Issuer
The Euro Medium Term Note Issuer refers to Vena Energy Capital Pte. Ltd., a related company, who issued US$325,000,000 3.133% per annum notes due in 2025 listed on Singapore Exchange Securities Trading Limited (“SGX-ST”) under a $1 billion Global Medium Term Note Programme (the ”Notes”) on 27 February 2020.
The proceeds from the bond issuance were allocated to the Trust through intercompany loans.
The Trust together with Vena Energy Holdings Ltd and Vena Energy (Taiwan) Holdings Ltd jointly and severally act as guarantors for Vena Energy Capital Pte. Ltd. for this bond issuance. The due and punctual payment of all sums payable by Vena Energy Capital Pte. Ltd. from time to time in respect of the bond will be unconditionally and irrevocably guaranteed on a joint and several basis by the guarantors.
The loan from Euro Medium Term Note Issuer is a 5-year loan maturing on 26 February 2025 denominated in Japanese Yen (‘JPY’) with the contractual interest rate at 1.372% payable on a semi-annual basis.
The below table shows the notional amount of the outstanding loans and borrowings excluding transaction costs.
Group TrustGross debt 30 June 31 December 30 June 31 December
2021 2020 2021 2020US$’000 US$’000 US$’000 US$’000
Non-currentProject finance debts 556,618 505,600 – – Bond issued by O&M
Provider 316 339 – – Loan from: - Related parties 5,758 193,058 – 190,759 - Euro Medium Term
Note Issuer 126,274 135,528 126,274 135,528 688,966 834,525 126,274 326,287
CurrentProject finance debts 13,837 67,870 – –
702,803 902,395 126,274 326,287
(d) Pledges for facilities agreements
The Group has entered into several Facilities agreements with various financial institutions. Under these agreements, these financial institutions provide project financing debts of US$570 million (2020: US$573 million) to the Group on a combination of fixed and floating rates.
The obligations of the Group to the banks are collateralised by the pledges of all the shares of the project entities and liens on and security interests in substantially all of the project entities’ assets, its rights under various agreements, all of the project entities’ revenues and all insurance proceeds payable to the project entities and require the project entities to comply with various administrative requirements.

Zenith Japan Holdings Trust
and its subsidiaries
Condensed Interim Financial Statements
For the six months ended 30 June 2021
FS24
16 Loans and borrowings and lease liabilities (cont’d)
(d) Pledges for facilities agreements (cont’d)
As at 30 June 2021 and 31 December 2020, the assets of the project entities pledged in relation to the facilities agreements are as follows:
30 June 2021
31 December2020
US$’000 US$’000
Property, plant and equipment 544,217 535,332 Right-of-use assets 65,811 79,349 Intangible assets 13,092 14,438 Prepayments and other assets 1,644 2,695 Trade and other receivables 101,543 87,667 Cash and cash equivalents 59,892 85,419
786,199 804,900
17 Derivative liabilities
Group30 June 31 December
2021 2020US$’000 US$’000
Derivative liabilities:Interest rate swaps 14,333 13,130
18 Trade and other payables
Group Trust30 June 31 December 30 June 31 December
Note 2021 2020 2021 2020US$’000 US$’000 US$’000 US$’000
Non-currentDeferred income 684 759 – –
CurrentTrade payables 9,968 13,795 10 – Other tax payables 2,624 4,424 – – Advances received 52 56 – – Accrued expenses 40,174 30,719 158 108 Non-trade amounts due to:- Asset Managers 23,419 26,850 – – - O&M Provider 784 1,115 – – - Related parties (a) 6,865 8,049 50 60 - Other third parties 4,952 3,695 – –
88,838 88,703 218 168
89,522 89,462 218 168
(a) Amount due to related parties (as defined in note 26) are unsecured, non-trade in nature, non-interest bearing and repayable on demand.

Zenith Japan Holdings Trust
and its subsidiaries
Condensed Interim Financial Statements
For the six months ended 30 June 2021
FS25
19 Revenue and other income
The Group’s revenue and other income comprises:
Group TrustSix months
ended 30 June 2021
Six months ended
30 June 2020
Six months ended
30 June 2021
Six months ended
30 June 2020US$’000 US$’000 US$’000 US$’000
Revenue: Dividend income – – 27,257 – Sale of energy 52,394 51,379 – –
52,394 51,379 27,257 –
Other income: Insurance claims 46 816 – – Others 5 – – –
51 816 – –
52,445 52,195 27,257 –
The following table provides information about the nature and timing of the satisfaction of performance obligations in contracts with customers, including significant payment terms, and the related revenue recognition policies.
Nature of goods or services Sale of renewable energy
When revenue is recognised Revenue from sale of electricity is recognised in profit or loss when the electricity generated is distributed to the customer.
Revenue is determined based on the units of sales delivered at the applicable tariff rates.
Payment terms 15 to 30 days
Disaggregation of revenue from contracts with customers
In the following table, revenue from contracts with customers is disaggregated by primary geographical markets and major products.
GroupSix months
ended 30 June 2021
Six months ended
30 June 2020US$’000 US$’000
Japan 52,394 51,379
Contract balances
Please refer to note 13 for contract assets primarily relating to the Group’s right to consideration upon fulfilment of performance obligations for sale of renewable energy but not billed as at reporting date. The contract assets are transferred to trade receivables when the rights become unconditional. This usually occurs when the Group invoices the customer.

Zenith Japan Holdings Trust
and its subsidiaries
Condensed Interim Financial Statements
For the six months ended 30 June 2021
FS26
20 Operating costs Group Trust
Six months ended
30 June 2021
Six months ended
30 June 2020
Six months ended
30 June 2021
Six months ended
30 June 2020US$’000 US$’000 US$’000 US$’000
Operations and maintenance costs 3,808 3,123 – –
Asset related tax and levies 3,373 2,443 – –
Site office maintenance costs 157 52 – –
Professional fees 822 544 62 30 Asset related insurance 836 722 – – Utilities and transmission
costs 236 176 – – Service fees – – 60 60 Other general and
administrative costs 121 301 –* 3
9,353 7,361 122 93
* Amount less than US$1,000
21 Asset management fees Group
Six months ended
30 June 2021
Six months ended
30 June 2020US$’000 US$’000
Asset management fees 1,792 2,159
In accordance with the Asset Management Agreement, the Asset Management Fee for each Accounting period shall be entitled to receive an annual fee equal to the sum of:
(i) The actual reasonable expenses incurred by the Asset Manager on its own account for the performance of the Services (as opposed to expenses incurred on behalf of the GK) to the extent falling within the Operating Budget, and
(ii) 10% of the amount in (i) or the maximum asset management, as agreed.
Services are defined to be the Asset Management Agreement as general duties performed by the Asset Manager within reasonable requirements of GK in connection with the management of the Assets and the Business and the performance of the services as are customarily provided by a manager of properties of comparable class and standing; and do all such other things as may reasonably and properly be required to done within the scope of the Asset Manager’s duties to GK relating to the management of the Assets and the Business and the performance of the Services.

Zenith Japan Holdings Trust
and its subsidiaries
Condensed Interim Financial Statements
For the six months ended 30 June 2021
FS27
22 Development costs Group
Six months ended
30 June 2021
Six months ended
30 June 2020US$’000 US$’000
Professional fees 420 76 Business related taxes 109 47 Other general and administrative costs 244 44
773 167
23 Finance income and finance costs
Group Trust Six months
ended 30 June 2021
Six months ended
30 June 2020
Six months ended
30 June 2021
Six months ended
30 June 2020US$’000 US$’000 US$’000 US$’000
Finance income Interest income on: - Loan to related party 3 – 3 – - Others 1 1 – –
Total finance income 4 1 3 –
Finance costsInterest expense on:- Loan from related parties (320) (848) (310) (434) - Loan from Euro Medium Term Note Issuer (1,050) (712) (1,050) (712) - Bond with O&M Provider (2) (2) – – - Project finance debts (1,724) (2,048) – – - Interest rate swaps (812) – – – - Lease liabilities (383) (374) – – Other finance costs (339) (433) – (581)
Total finance costs (4,630) (4,417) (1,360) (1,727)
24 Fair value of financial instruments
Fair value measurement
Fair value is the price that would be received to sell an asset or paid to transfer a liability in an orderly transaction between market participants at the measurement date in the principal or, in its absence, the most advantageous market to which the Group has access at that date. The fair value of a liability reflects its non-performance risk.
When available, the Group measures the fair value of an instrument using the quoted price in an active market for that instrument. A market is regarded as active if transactions for the asset or liability take place with sufficient frequency and volume to provide pricing information on an ongoing basis. The Group measures instruments quoted in an active market at mid-price.
If there is no quoted price in an active market, then the Group uses valuation techniques that maximise the use of relevant observable inputs and minimise the use of unobservable inputs. The chosen valuation technique incorporates all of the factors that market participants would take into account in pricing a transaction.

Zenith Japan Holdings Trust
and its subsidiaries
Condensed Interim Financial Statements
For the six months ended 30 June 2021
FS28
24 Fair value of financial instruments (cont’d)
Fair value measurement (cont’d)
The Group recognises transfers between levels of the fair value hierarchy as at the end of the reporting period during which the change has occurred.
Level 1: Inputs that are quoted market prices (unadjusted) in active markets for identical instruments.
Level 2: Inputs other than quoted prices included within Level 1 that are observable either directly (i.e. as prices) or indirectly (i.e. derived from prices). This category includes instruments valued using quoted market prices in active markets for similar instruments; quoted prices for identical or similar instruments in markets that are considered less than active; or other valuation techniques in which all significant inputs are directly or indirectly observable from market data.
Level 3: Inputs that are unobservable. This category includes all instruments for which the valuation technique includes inputs not based on observable data and the unobservable inputs have a significant effect on the instrument’s valuation. This category includes instruments that are valued based on quoted prices for similar instruments but for which significant unobservable adjustments or assumptions are required to reflect differences between the instruments.
Type Valuation technique
Significant unobservable inputs
Inter-relationship between key unobservable inputs and fair value measurement
GroupInterest rate swaps
Swap models: The fair value is calculated as the present value of the estimated future cash flows. Estimates of future floating-rate cash flows are based on quoted swap rates, futures prices and interbank borrowing rates. Estimated cash flows are discounted using a yield curve constructed from similar sources and which reflects the relevant benchmark interbank rate used by market participants for this purpose when pricing interest rate swaps.
Not applicable. Not applicable.
Financial instruments not measured at fair value
Type Valuation techniqueGroup
Loans and borrowings
Discounted cash flows: The valuation model considers the present value of expected payment, discounted using a risk-adjusted discount rate.

Zen
ith
Jap
an
Ho
ldin
gs T
rus
t
an
d i
ts s
ub
sid
iari
es
Conde
nsed I
nte
rim
Fin
ancia
l S
tate
ments
For
the s
ix m
onth
s e
nded 3
0 J
une 2
021
FS
29
24
F
air
valu
e o
f fi
na
nc
ial in
str
um
en
ts (
co
nt’
d)
Ac
co
un
tin
g c
las
sif
icati
on
an
d f
air
valu
e
Th
e ta
ble
be
low
su
mm
arises th
e c
lassi
fica
tio
n o
f th
e fin
ancia
l ass
ets
an
d li
abili
ties o
f th
e G
rou
p. It
do
es n
ot in
clud
e fa
ir v
alu
e in
form
atio
n fo
r fina
nci
al a
ssets
an
d fin
ancia
l lia
bili
ties n
ot m
ea
su
red
at
fair
va
lue
if th
e c
arr
yin
g a
mo
unt
is a
re
aso
nab
le a
pp
roxim
atio
n o
f fa
ir v
alu
e.
Ca
rryin
g a
mo
un
tF
air
valu
e
No
teM
an
da
tori
ly a
t F
VT
PL
Am
ort
ise
d
co
st
To
tal
Lev
el 1
Le
ve
l 2
Le
ve
l 3
To
tal
US
$’0
00
US
$’0
00
US
$’0
00
US
$’0
00
US
$’0
00
US
$’0
00
US
$’0
00
Gro
up
30
Ju
ne
202
1L
oa
n r
eceiv
ab
le1
1
–
38
,237
38
,237
–
36
,375
–
36
,375
Tra
de
and
oth
er
rece
iva
ble
*1
3
–
24
,608
24
,608
–
–
–
–
Ca
sh
an
d c
ash
equ
iva
len
ts1
4
–
70
,128
70
,128
–
–
–
–
–
13
2,9
73
13
2,9
73
Lo
ans a
nd
bo
rro
win
gs
16
–
69
3,1
21
69
3,1
21
–
69
7,3
01
–
69
7,3
01
De
riva
tive
lia
bili
ties
17
14
,333
–
14
,333
–
14
,333
–
14
,333
Oth
er
fin
an
cia
l lia
bili
ties (
ne
t of a
dva
nce
s)*
18
–
86
,162
86
,162
–
–
–
–
14
,333
77
9,2
83
79
3,6
16
31
De
cem
be
r 20
20
Tra
de a
nd
oth
er
rece
iva
ble
*1
3
–
37
1,0
89
37
1,0
89
–
–
–
–
Ca
sh
an
d c
ash
equ
iva
len
ts1
4
–
10
7,4
38
107
,43
8
–
–
–
–
–
47
8,5
27
47
8,5
27
Lo
ans a
nd
bo
rro
win
gs
16
–
89
5,1
76
89
5,1
76
–
90
4,4
42
–
90
4,4
42
De
riva
tive
lia
bili
ties
17
13
,130
–
13
,130
–
13
,130
–
13
,130
Oth
er
fin
an
cia
l lia
bili
ties (
ne
t of a
dva
nce
s)*
18
–
84
,223
84
,223
–
–
–
–
13
,130
97
9,3
99
99
2,5
29
* E
xclu
des
non-f
inancia
l ass
ets
and lia
bili
ties

Zen
ith
Jap
an
Ho
ldin
gs T
rus
t
an
d i
ts s
ub
sid
iari
es
Conde
nsed I
nte
rim
Fin
ancia
l S
tate
ments
For
the s
ix m
onth
s e
nded 3
0 J
une 2
021
FS
30
24
F
air
valu
e o
f fi
na
nc
ial in
str
um
en
ts (
co
nt’
d)
Ac
co
un
tin
g c
las
sif
icati
on
an
d f
air
valu
e (
co
nt’
d)
Ca
rry
ing
am
ou
nt
Fa
ir v
alu
e
No
teM
an
da
tori
ly a
t F
VT
PL
Am
ort
ise
d
co
st
To
tal
Le
ve
l 1
Le
ve
l 2
Le
vel
3T
ota
lU
S$
’00
0U
S$
’00
0U
S$
’000
US
$’0
00
US
$’0
00
US
$’0
00
US
$’0
00
Tru
st
30
Ju
ne
202
1L
oa
n r
eceiv
ab
le1
1
–
38
,237
38
,237
–
36
,372
–
36
,372
Ca
sh
an
d c
ash
equ
iva
len
ts1
4
–
1,2
75
1,2
75
–
–
–
–
–
39
,512
39
,512
Lo
ans a
nd
bo
rro
win
gs
16
–
1
25
,75
8
12
5,7
58
–
12
0,7
23
–
12
0,7
23
Oth
er
fina
nci
al l
iab
ilitie
s (
ne
t of a
dva
nce
s)*
18
–
21
8
218
–
–
–
–
–
12
5,9
76
12
5,9
76
31
De
cem
be
r 20
20
Tra
de
an
d o
the
r re
ceiv
ab
les*
12
–
350
,00
0
35
0,0
00
–
–
–
–
Ca
sh
an
d c
ash
equ
iva
len
ts1
4
–
6,8
08
6,8
08
–
–
–
–
–
35
6,8
08
35
6,8
08
Lo
ans a
nd
bo
rro
win
gs
16
–
3
27
,01
8
32
7,0
18
–
32
8,2
82
–
32
8,2
82
Oth
er
fina
nci
al l
iab
ilitie
s (
ne
t of a
dva
nce
s)*
18
–
16
8
168
–
–
–
–
–
32
7,1
86
32
7,1
86
* E
xclu
des n
on-f
inancia
l ass
ets
an
d lia
bili
ties

Zenith Japan Holdings Trust
and its subsidiaries
Condensed Interim Financial Statements
For the six months ended 30 June 2021
FS31
25 Group entities
The table below provides details of the significant subsidiaries of the Group:
Name of subsidiaries SectorProject Name/
Activities Status
Principal place of business Ownership interest
2021 2020% %
Zenith Japan Trust Investment holding
company – Operating Guernsey 100 100 GK KC-01 Investment Solar Sotsukozawa Operating Japan 99 99 GK NRE Sannan Solar Sannan Operating Japan 99 99 GK NRE-05 Investment Solar Shichinohe 3,6,8 Operating Japan 99 99 GK NRE-13 Investment Solar Enokibayashi Operating Japan 99 99 GK NRE-15 Investment Solar Noheji Operating Japan 99 99 GK NRE-16 Investment Solar Tokai Operating Japan 99 99 GK NRE-17 Investment Solar Mito1 Operating Japan 99 99 GK NRE-19 Investment Solar Hitachi Omiya Operating Japan 99 99 GK NRE-36 Investment Solar Towada Operating Japan 99 99 GK NRE-39 Investment Solar Ono Operating Japan 99 99 KP Energy Solar Yaita 2 Operating Japan 99 99 GK NWE-02 Investment Wind Reihoku 1 Operating Japan 99 99
The relationship between the Trust and the TK Operators is governed by the TK Agreements. The Trust, as the investor, will provide funds to the TK Operator in return for the right to receive distribution of profit generated from the operation of the GK. Under the TK Agreement, the net income of the TK business, comprising principally the income generated from the solar, will be passed up to the Trust. The Trust is entitled to 99% of the profits and losses of such business, while the Asset Manager is entitled to 1% of the allocated profits and losses respectively. The Trust is, therefore, entitled to receive substantially all of the economic interest from the TK Operator.
The Trust has assessed the economic reality of the Group and its investment activities through the TK Operators and concluded that the TK Operators meet the definition of subsidiaries of the Group (as defined by IFRS).
26 Related parties
During the six months ended 30 June 2021, in addition to those disclosed elsewhere in the financial statements, the following were significant transactions with related parties.
The Group has determined Vena Energy (Taiwan) Holdings Ltd and its subsidiaries and Vena Energy Holdings Limited and its subsidiaries as related parties in accordance with IAS 24.
The following significant transactions between the Group and its related parties took place at terms agreed between the parties during the financial period:
Six months ended
30 June 2021
Six months ended
30 June 2020US$’000 US$’000
Asset management fees expense 1,792 2,159 Operations and maintenance costs 3,806 3,123

Zenith Japan Holdings Trust
and its subsidiaries
Condensed Interim Financial Statements
For the six months ended 30 June 2021
FS32
26 Related parties (cont’d)
Sale and leaseback
During the six months period ended 30 June 2021, the Group entered into sale and leaseback transactions with a related party of the Group, NRE Land Management GK, in respect of several freehold land parcels in Japan to transfer ownership and associated obligations relating to the land parcels to its related party. The freehold land parcels were sold at fair value and leased back over 20 to 35 years at market rentals. The total consideration for the sale of the land parcels amounted to US$3,410,639. During the six month period ended 30 June 2021, right-of-use assets and lease liabilities relating to sale and leaseback transactions with related party amounted to US$4,536,109 and US$4,341,876 respectively.
27 Non-controlling interest
Non-controlling interest denotes Nippon Renewable Energy K.K, Nippon Wind Energy K.K and Zeini Solar (S) Pte Ltd in fully paid up equity shares of all group entities domiciled in Japan.
28 Subsequent events
Bond issuance
On 8 July 2021, a related company, Vena Energy Capital Pte. Ltd. (“Euro Medium Term Note Issuer”), issued US$175,000,000 3.133% per annum notes due in 2025 listed on Singapore Exchange Securities Trading Limited (“SGX-ST”) under the US$1,000,000,000 Global Medium Term Note Programme (the ”Notes”). The Notes is to be consolidated and form a single series with the US$325,000,000 3.133% per annum notes issued on 26 February 2020. The Notes bear interest at the rate of 3.133% per annum from and including 26 February 2021, and interest will be payable semi-annually in arrears on 26 February and 26 August in each year, commencing on 26 August 2021. The Notes will mature on 26 February 2025.
The bond proceeds were allocated to the Vena Energy Holdings Ltd, Vena Energy (Taiwan) Holdings Ltd and Zenith Japan Holdings Ltd (as trustee for Zenith Japan Holdings Trust) through intercompany loans.
Vena Energy Holdings Ltd, together with Vena Energy (Taiwan) Holdings Ltd and Zenith Japan Holdings Ltd (as trustee for Zenith Japan Holdings Trust) jointly and severally act as guarantors for Vena Energy Capital Pte. Ltd. for this bond issuance. The due and punctual payment of all sums payable by Vena Energy Capital Pte. Ltd. from time to time in respect of the bond will be unconditionally and irrevocably guaranteed on a joint and several basis by the guarantors.
29 Standards issued but not yet effective
A number of new standards and amendments to standards are effective for annual periods beginning after 1 January 2021 and earlier application is permitted; however, the Group has not early adopted any of the forthcoming new or amended standards in preparing the condensed interim financial statements.