1H 2021 EARNINGS PRESENTATION - mondenissin.com
47
1H 2021 EARNINGS PRESENTATION August 2021 Confidential
Transcript of 1H 2021 EARNINGS PRESENTATION - mondenissin.com

1H 2021 EARNINGS PRESENTATIONAugust 2021
Confidential

2
Legal Disclaimer
Monde Nissin Corporation (“MONDE”) makes no warranties or representations with respect to the accuracy or completeness of the contents
of this presentation, and disclaims any liability whatsoever for any loss arising from or in reliance, in full or in part, of the contents of this
presentation. Neither this presentation nor any part thereof may be (a) used or relied upon by any person for any purpose, (b) copied,
photocopied, duplicated or otherwise reproduced in any form or by any means, or (c) redistributed, passed on or otherwise disseminated or
quoted, directly or indirectly, to any other person either in your organization or elsewhere, without MONDE’s prior written consent. The
contents of this presentation should not be construed as investment advice, nor as a recommendation or solicitation for any investment by or
in MONDE.
This presentation may contain forward-looking statements. These forward-looking statements are based upon current expectations and
assumptions regarding anticipated developments and other factors affecting MONDE. They are not historical facts, nor are they guarantees of
future performance.
Because these forward-looking statements involve risks and uncertainties, there are important factors that could cause actual results to differ
materially from those expressed or implied by these forward-looking statements. Among other risks and uncertainties, the material or principal
factors which could cause actual results to differ materially are: MONDE’s brands not meeting consumer preferences; MONDE’s ability to
innovate and remain competitive; MONDE’s investment choices in its portfolio management; the effect of climate change on MONDE’s
business; MONDE’s ability to find sustainable solutions to its packaging materials; significant changes or deterioration in customer
relationships; the recruitment and retention of talented employees; disruptions in our supply chain and distribution; increases or volatility in the
cost of raw materials and commodities; the production of safe and high quality products; secure and reliable IT infrastructure; execution of
acquisitions, divestitures and business transformation projects; economic, social and political risks and natural disasters; financial risks; failure
to meet high and ethical standards; and managing regulatory, tax and legal matters. A number of these risks have increased as a result of the
current Covid-19 pandemic.
These forward-looking statements speak only as of the date of this document. Except as required by any applicable law or regulation,
MONDE expressly disclaims any obligation or undertaking to release publicly any updates or revisions to any forward-looking statements
contained herein to reflect any change in MONDE’s expectations with regard thereto or any change in events, conditions or circumstances on
which any such statement is based.
3
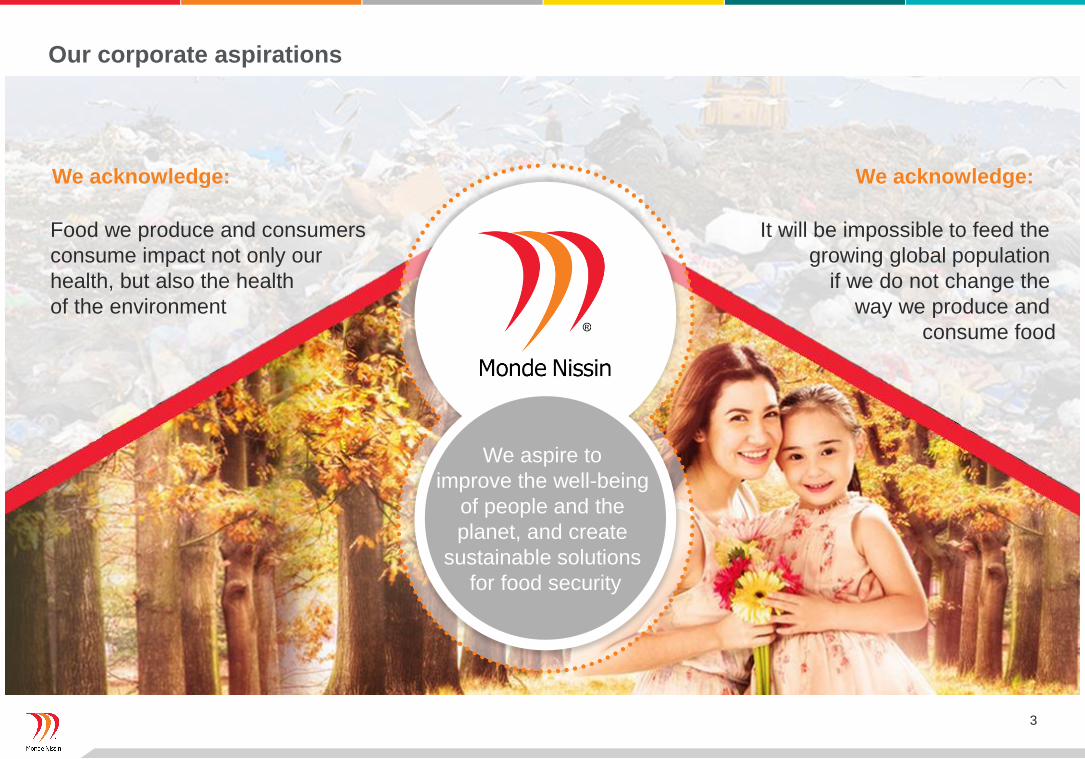
Our corporate aspirations
We acknowledge: We acknowledge:
We aspire to
improve the well-being
of people and the
planet, and create
sustainable solutions
for food security
It will be impossible to feed the
growing global population
if we do not change the
way we produce and
consume food
Food we produce and consumers
consume impact not only our
health, but also the health
of the environment
4
Section 1
First Half 2021
Financial PerformanceConsolidated & APAC BFB
5
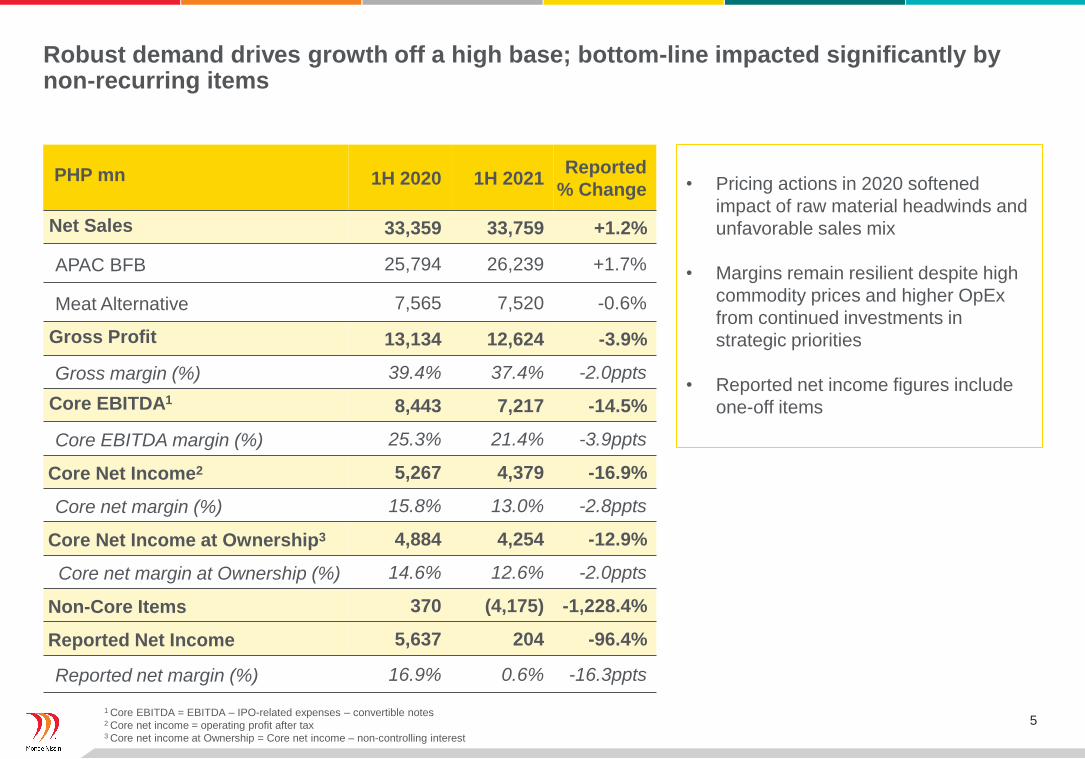
PHP mn 1H 2020 1H 2021Reported
% Change
Net Sales 33,359 33,759 +1.2%
APAC BFB 25,794 26,239 +1.7%
Meat Alternative 7,565 7,520 -0.6%
Gross Profit 13,134 12,624 -3.9%
Gross margin (%) 39.4% 37.4% -2.0ppts
Core EBITDA1 8,443 7,217 -14.5%
Core EBITDA margin (%) 25.3% 21.4% -3.9ppts
Core Net Income2 5,267 4,379 -16.9%
Core net margin (%) 15.8% 13.0% -2.8ppts
Core Net Income at Ownership3 4,884 4,254 -12.9%
Core net margin at Ownership (%) 14.6% 12.6% -2.0ppts
Non-Core Items 370 (4,175) -1,228.4%
Reported Net Income 5,637 204 -96.4%
Reported net margin (%) 16.9% 0.6% -16.3ppts
Robust demand drives growth off a high base; bottom-line impacted significantly by non-recurring items
• Pricing actions in 2020 softened
impact of raw material headwinds and
unfavorable sales mix
• Margins remain resilient despite high
commodity prices and higher OpEx
from continued investments in
strategic priorities
• Reported net income figures include
one-off items
1 Core EBITDA = EBITDA – IPO-related expenses – convertible notes2 Core net income = operating profit after tax3 Core net income at Ownership = Core net income – non-controlling interest
6
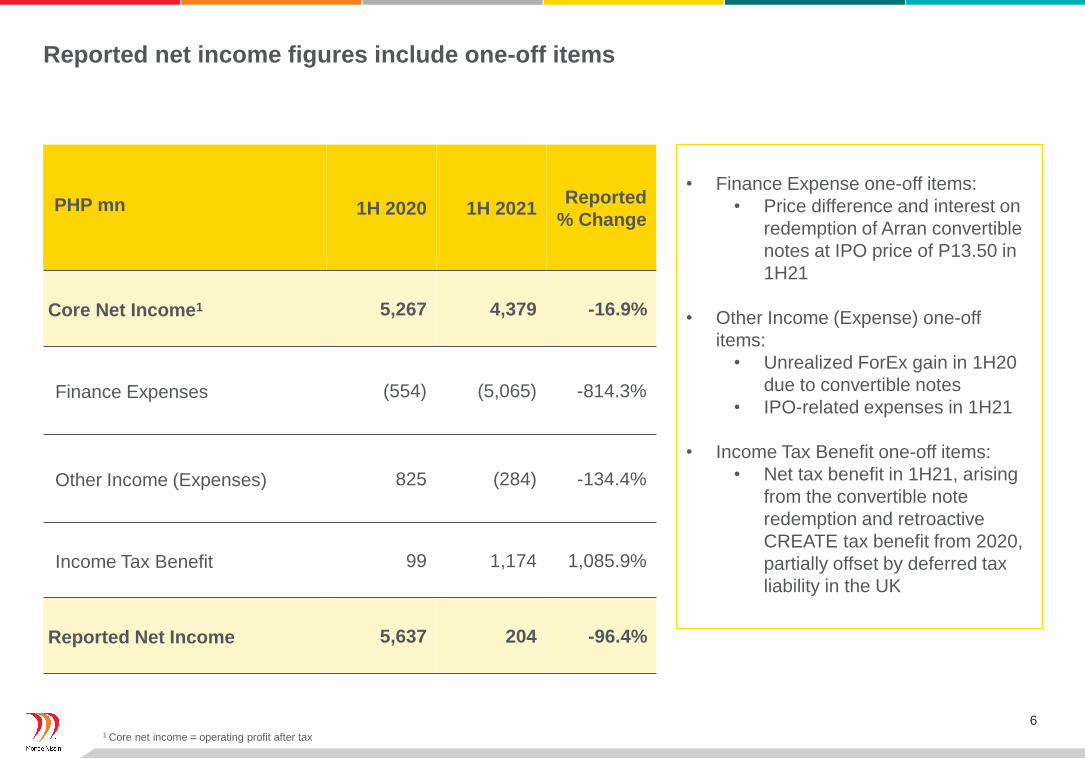
PHP mn 1H 2020 1H 2021Reported
% Change
Core Net Income1 5,267 4,379 -16.9%
Finance Expenses (554) (5,065) -814.3%
Other Income (Expenses) 825 (284) -134.4%
Income Tax Benefit 99 1,174 1,085.9%
Reported Net Income 5,637 204 -96.4%
Reported net income figures include one-off items
• Finance Expense one-off items:
• Price difference and interest on
redemption of Arran convertible
notes at IPO price of P13.50 in
1H21
• Other Income (Expense) one-off
items:
• Unrealized ForEx gain in 1H20
due to convertible notes
• IPO-related expenses in 1H21
• Income Tax Benefit one-off items:
• Net tax benefit in 1H21, arising
from the convertible note
redemption and retroactive
CREATE tax benefit from 2020,
partially offset by deferred tax
liability in the UK
1 Core net income = operating profit after tax

7
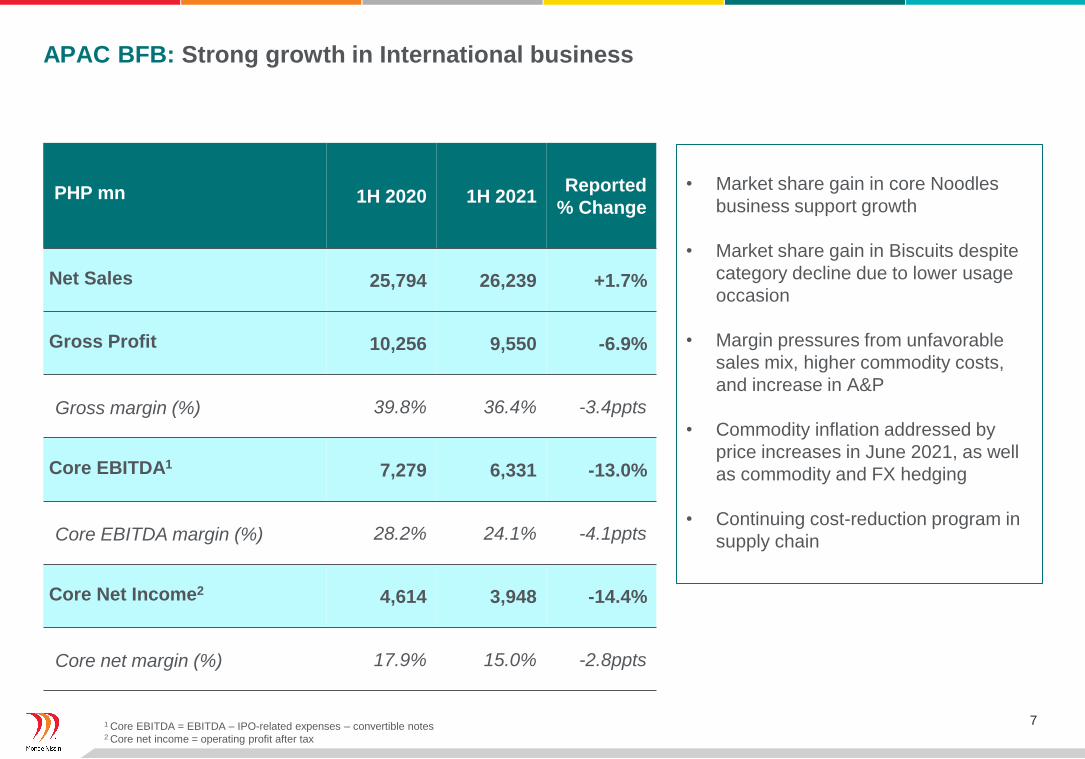
APAC BFB: Strong growth in International business
PHP mn 1H 2020 1H 2021Reported
% Change
Net Sales 25,794 26,239 +1.7%
Gross Profit 10,256 9,550 -6.9%
Gross margin (%) 39.8% 36.4% -3.4ppts
Core EBITDA1 7,279 6,331 -13.0%
Core EBITDA margin (%) 28.2% 24.1% -4.1ppts
Core Net Income2 4,614 3,948 -14.4%
Core net margin (%) 17.9% 15.0% -2.8ppts
• Market share gain in core Noodles
business support growth
• Market share gain in Biscuits despite
category decline due to lower usage
occasion
• Margin pressures from unfavorable
sales mix, higher commodity costs,
and increase in A&P
• Commodity inflation addressed by
price increases in June 2021, as well
as commodity and FX hedging
• Continuing cost-reduction program in
supply chain
1 Core EBITDA = EBITDA – IPO-related expenses – convertible notes2 Core net income = operating profit after tax
8
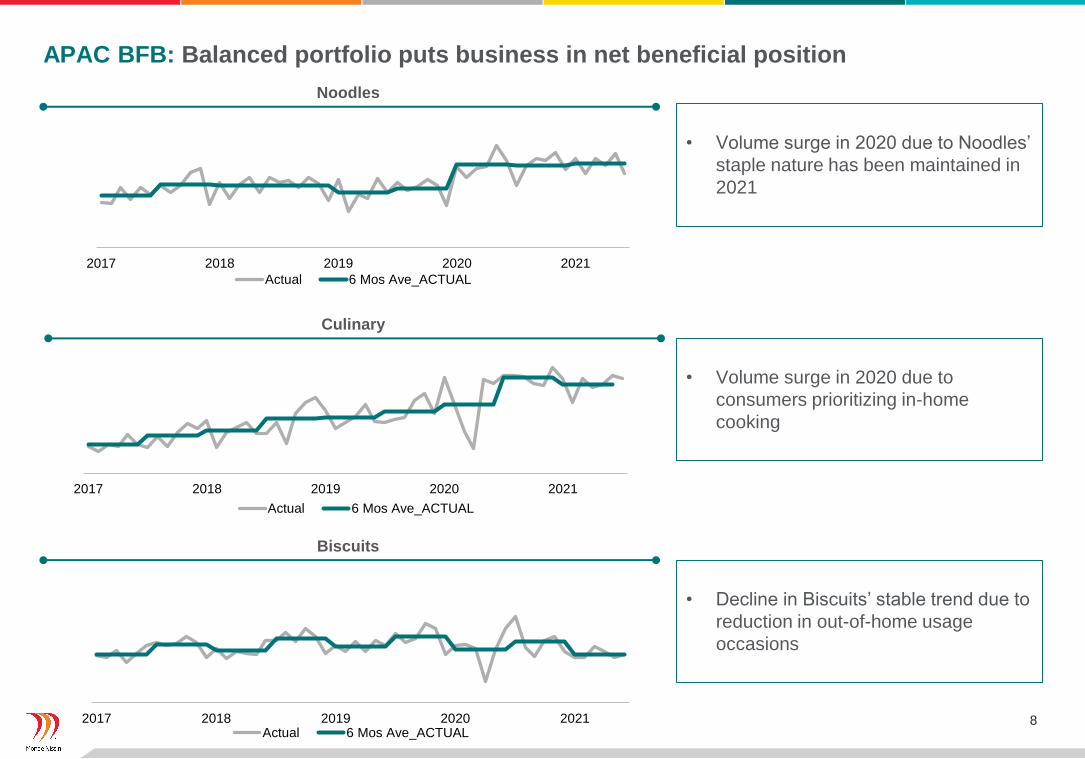
Biscuits
• Decline in Biscuits’ stable trend due to
reduction in out-of-home usage
occasions
APAC BFB: Balanced portfolio puts business in net beneficial position
Noodles
• Volume surge in 2020 due to Noodles’
staple nature has been maintained in
2021
2017 2018 2019 2020 2021
Actual 6 Mos Ave_ACTUAL
Culinary
2017 2018 2019 2020 2021Actual 6 Mos Ave_ACTUAL
2017 2018 2019 2020 2021
Actual 6 Mos Ave_ACTUAL
• Volume surge in 2020 due to
consumers prioritizing in-home
cooking
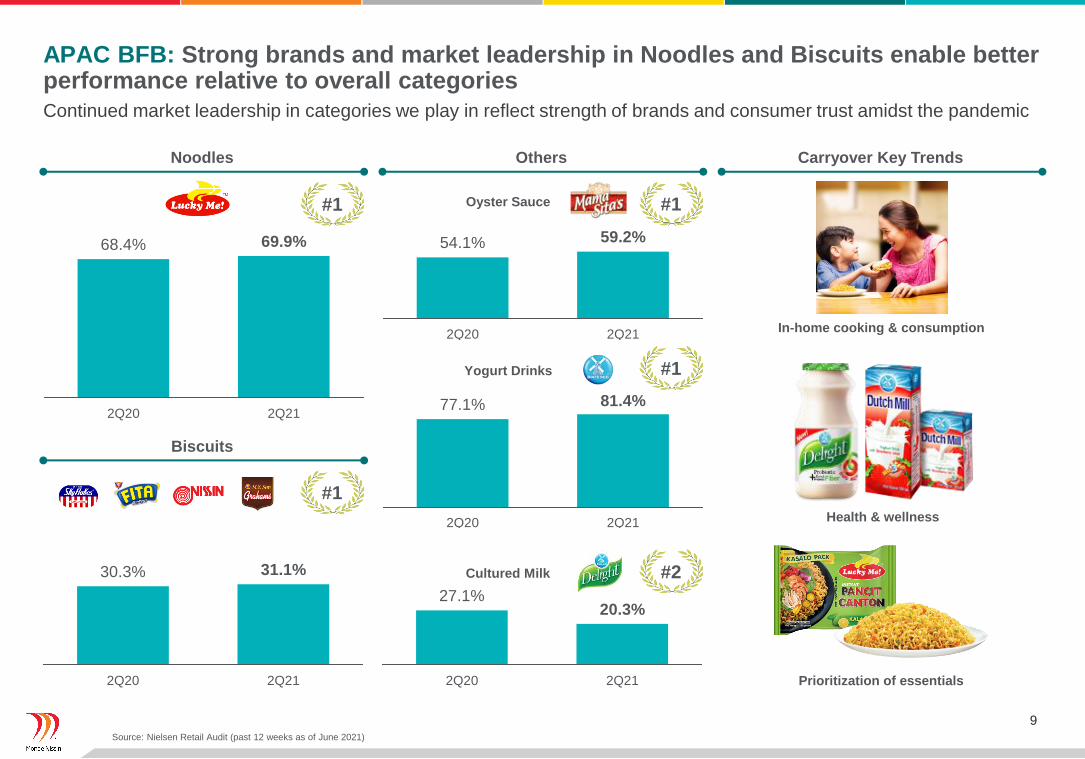
9Source: Nielsen Retail Audit (past 12 weeks as of June 2021)
27.1%20.3%
2Q20 2Q21
54.1% 59.2%
2Q20 2Q21
30.3% 31.1%
2Q20 2Q21
APAC BFB: Strong brands and market leadership in Noodles and Biscuits enable better performance relative to overall categories
Biscuits
Continued market leadership in categories we play in reflect strength of brands and consumer trust amidst the pandemic
In-home cooking & consumption
Health & wellness
Prioritization of essentials
Noodles Others Carryover Key Trends
68.4% 69.9%
2Q20 2Q21
Oyster Sauce
Yogurt Drinks
77.1% 81.4%
2Q20 2Q21
Cultured Milk
#1
#1
#1
#1
#2
10
4.5
5.5
6.5
7.5
8.5
9.5
2017 2018 2019 2020 2021
US
D
300
500
700
900
1100
2017 2018 2019 2020 2021
US
D
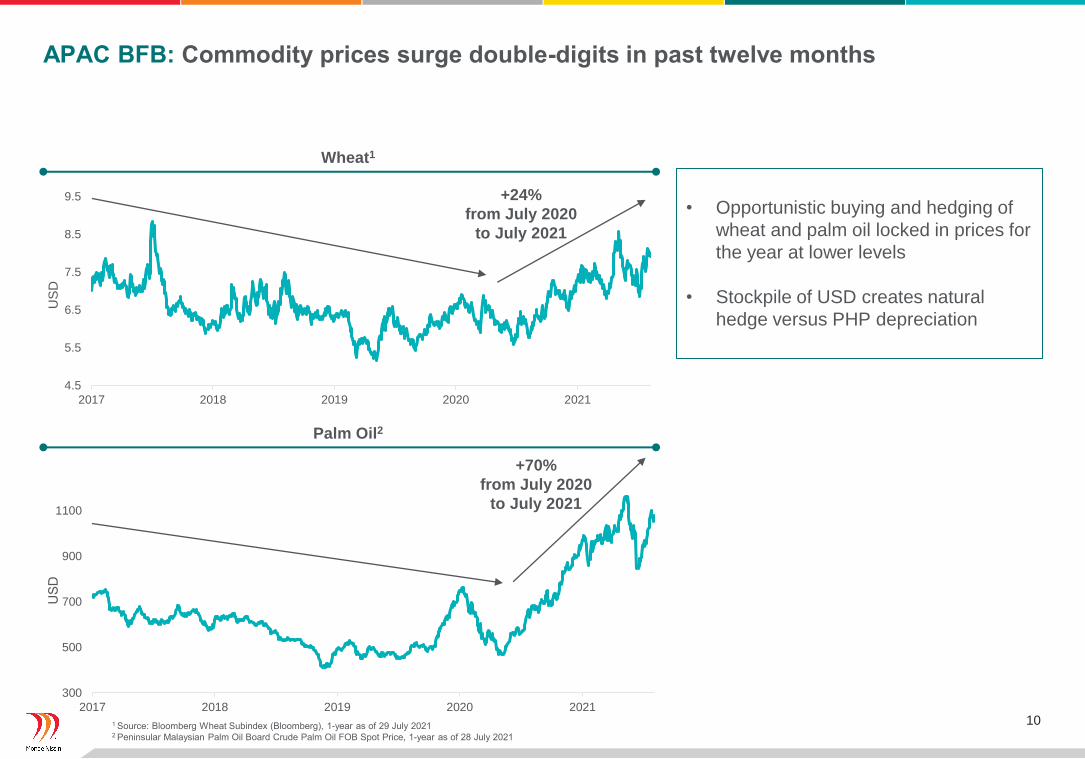
Wheat1
APAC BFB: Commodity prices surge double-digits in past twelve months
Palm Oil2
• Opportunistic buying and hedging of
wheat and palm oil locked in prices for
the year at lower levels
• Stockpile of USD creates natural
hedge versus PHP depreciation
+70%
from July 2020
to July 2021
1 Source: Bloomberg Wheat Subindex (Bloomberg), 1-year as of 29 July 20212 Peninsular Malaysian Palm Oil Board Crude Palm Oil FOB Spot Price, 1-year as of 28 July 2021
+24%
from July 2020
to July 2021
11
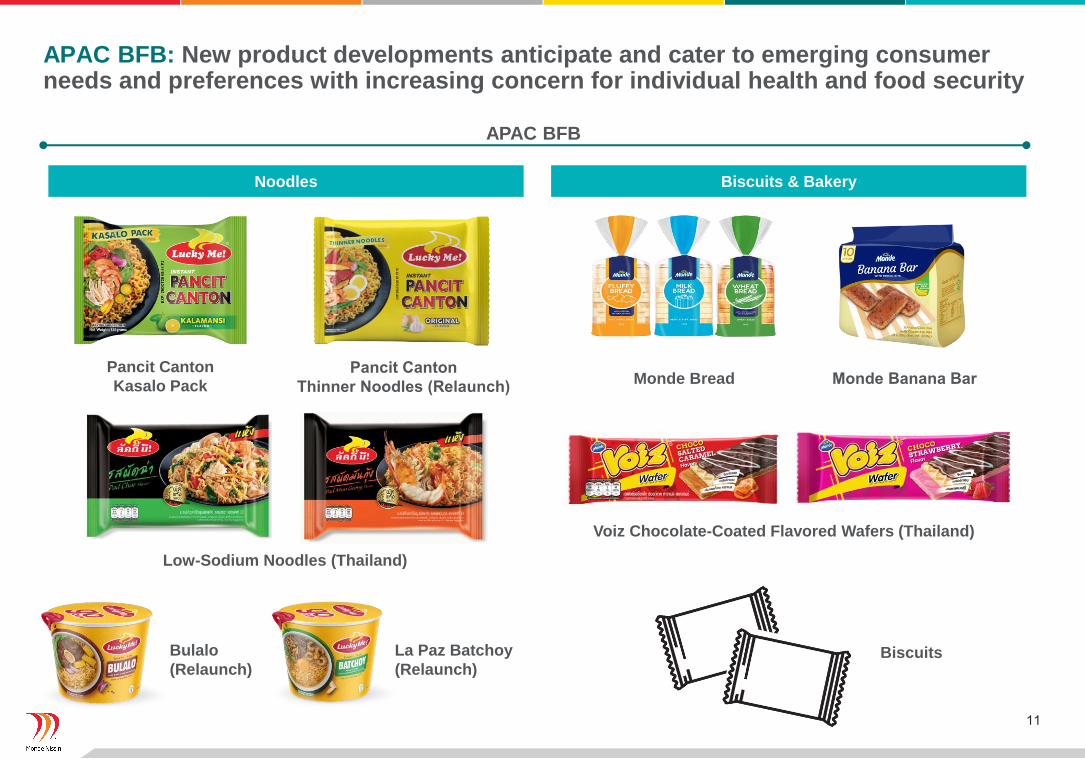
APAC BFB
BiscuitsBulalo
(Relaunch)
La Paz Batchoy
(Relaunch)
Pancit Canton
Kasalo PackPancit Canton
Thinner Noodles (Relaunch)Monde Bread Monde Banana Bar
Noodles Biscuits & Bakery
Voiz Chocolate-Coated Flavored Wafers (Thailand)
Low-Sodium Noodles (Thailand)
APAC BFB: New product developments anticipate and cater to emerging consumer needs and preferences with increasing concern for individual health and food security
12
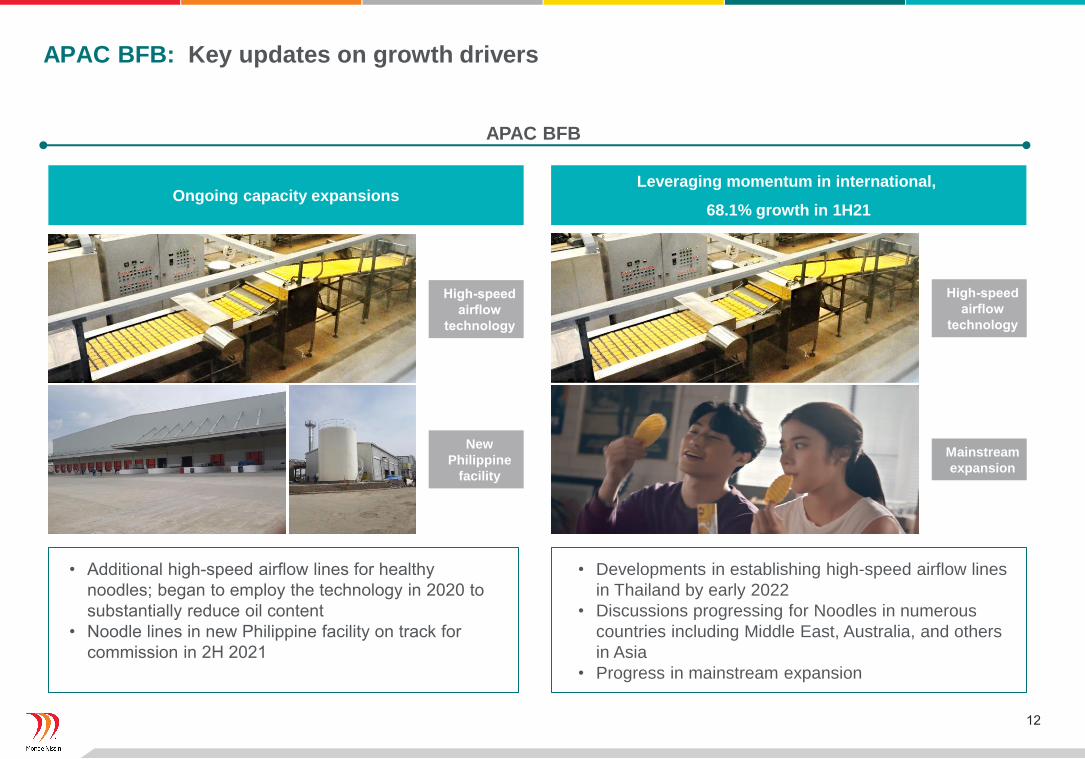
APAC BFB
• Additional high-speed airflow lines for healthy
noodles; began to employ the technology in 2020 to
substantially reduce oil content
• Noodle lines in new Philippine facility on track for
commission in 2H 2021
• Developments in establishing high-speed airflow lines
in Thailand by early 2022
• Discussions progressing for Noodles in numerous
countries including Middle East, Australia, and others
in Asia
• Progress in mainstream expansion
Ongoing capacity expansionsLeveraging momentum in international,
68.1% growth in 1H21
Mainstream
expansion
APAC BFB: Key updates on growth drivers
High-speed
airflow
technology
New
Philippine
facility
High-speed
airflow
technology
13
Section 2
First Half 2021
Financial PerformanceMeat Alternative
14
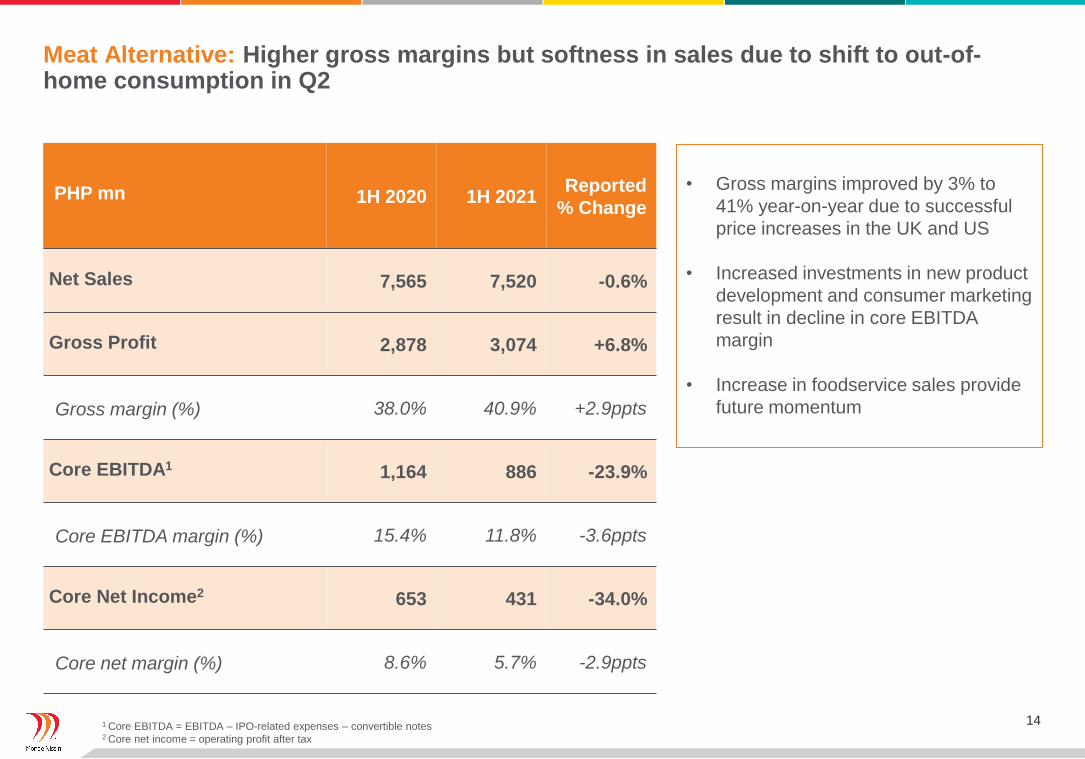
Meat Alternative: Higher gross margins but softness in sales due to shift to out-of-home consumption in Q2
PHP mn 1H 2020 1H 2021Reported
% Change
Net Sales 7,565 7,520 -0.6%
Gross Profit 2,878 3,074 +6.8%
Gross margin (%) 38.0% 40.9% +2.9ppts
Core EBITDA1 1,164 886 -23.9%
Core EBITDA margin (%) 15.4% 11.8% -3.6ppts
Core Net Income2 653 431 -34.0%
Core net margin (%) 8.6% 5.7% -2.9ppts
• Gross margins improved by 3% to
41% year-on-year due to successful
price increases in the UK and US
• Increased investments in new product
development and consumer marketing
result in decline in core EBITDA
margin
• Increase in foodservice sales provide
future momentum
1 Core EBITDA = EBITDA – IPO-related expenses – convertible notes2 Core net income = operating profit after tax
15
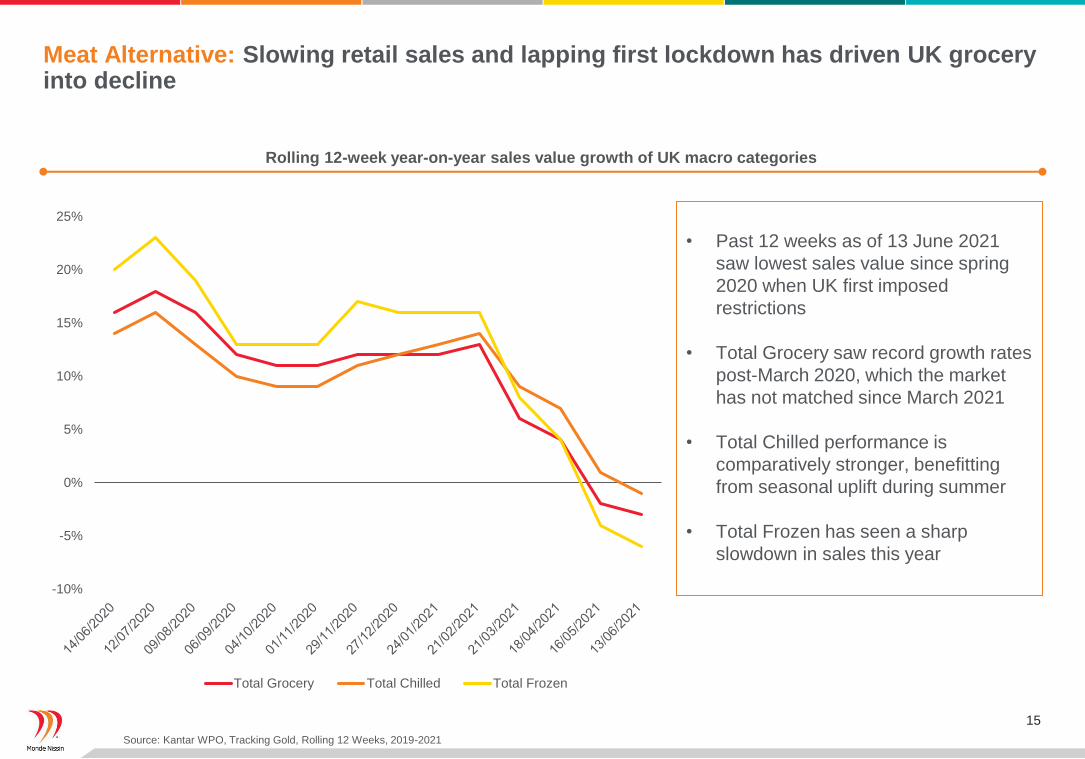
Rolling 12-week year-on-year sales value growth of UK macro categories
Meat Alternative: Slowing retail sales and lapping first lockdown has driven UK grocery into decline
Source: Kantar WPO, Tracking Gold, Rolling 12 Weeks, 2019-2021
• Past 12 weeks as of 13 June 2021
saw lowest sales value since spring
2020 when UK first imposed
restrictions
• Total Grocery saw record growth rates
post-March 2020, which the market
has not matched since March 2021
• Total Chilled performance is
comparatively stronger, benefitting
from seasonal uplift during summer
• Total Frozen has seen a sharp
slowdown in sales this year
-10%
-5%
0%
5%
10%
15%
20%
25%
Total Grocery Total Chilled Total Frozen
16
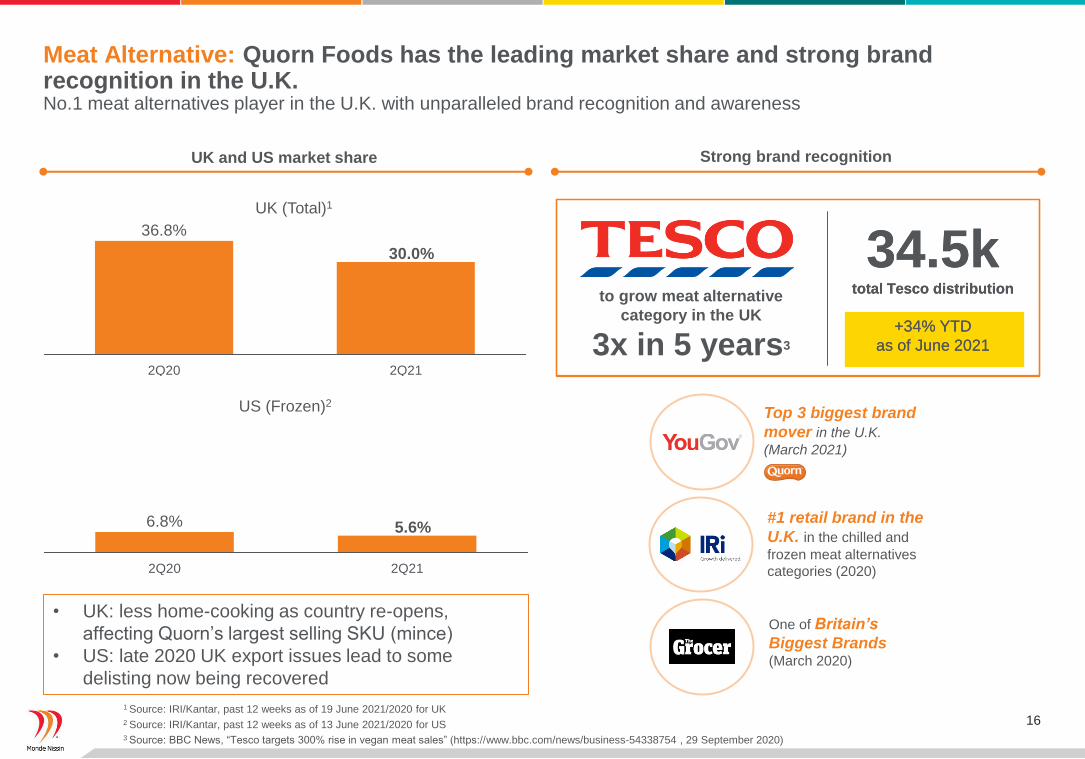
UK and US market share
Meat Alternative: Quorn Foods has the leading market share and strong brand recognition in the U.K.No.1 meat alternatives player in the U.K. with unparalleled brand recognition and awareness
1 Source: IRI/Kantar, past 12 weeks as of 19 June 2021/2020 for UK2 Source: IRI/Kantar, past 12 weeks as of 13 June 2021/2020 for US3 Source: BBC News, “Tesco targets 300% rise in vegan meat sales” (https://www.bbc.com/news/business-54338754 , 29 September 2020)
#1 retail brand in the
U.K. in the chilled and
frozen meat alternatives
categories (2020)
One of Britain’s
Biggest Brands (March 2020)
Top 3 biggest brand
mover in the U.K.
(March 2021)
to grow meat alternative
category in the UK
3x in 5 years3
36.8%
30.0%
2Q20 2Q21
UK (Total)1
Strong brand recognition
6.8% 5.6%
2Q20 2Q21
US (Frozen)2
• UK: less home-cooking as country re-opens,
affecting Quorn’s largest selling SKU (mince)
• US: late 2020 UK export issues lead to some
delisting now being recovered
34.5ktotal Tesco distribution
+34% YTD
as of June 2021
34.5ktotal Tesco distribution
+34% YTD
as of June 2021
17
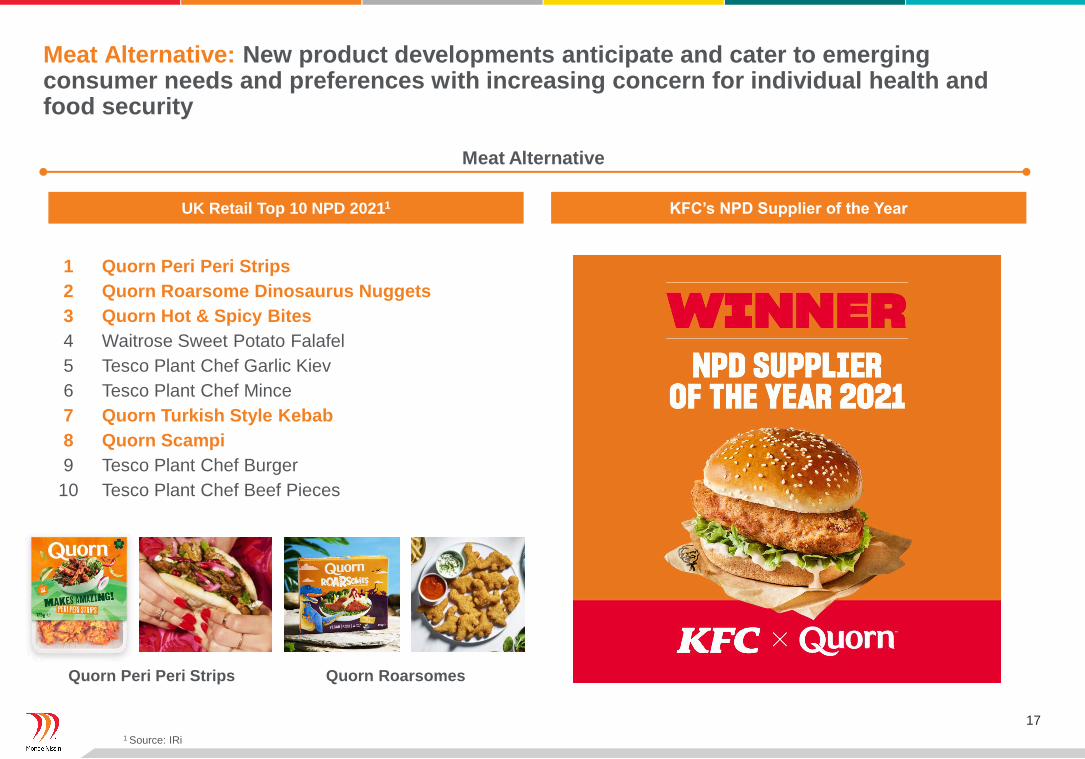
Quorn Peri Peri Strips Quorn Roarsomes
1 Quorn Peri Peri Strips
2 Quorn Roarsome Dinosaurus Nuggets
3 Quorn Hot & Spicy Bites
4 Waitrose Sweet Potato Falafel
5 Tesco Plant Chef Garlic Kiev
6 Tesco Plant Chef Mince
7 Quorn Turkish Style Kebab
8 Quorn Scampi
9 Tesco Plant Chef Burger
10 Tesco Plant Chef Beef Pieces
1 Source: IRi
Meat Alternative
UK Retail Top 10 NPD 20211 KFC’s NPD Supplier of the Year
Meat Alternative: New product developments anticipate and cater to emerging consumer needs and preferences with increasing concern for individual health and food security
18
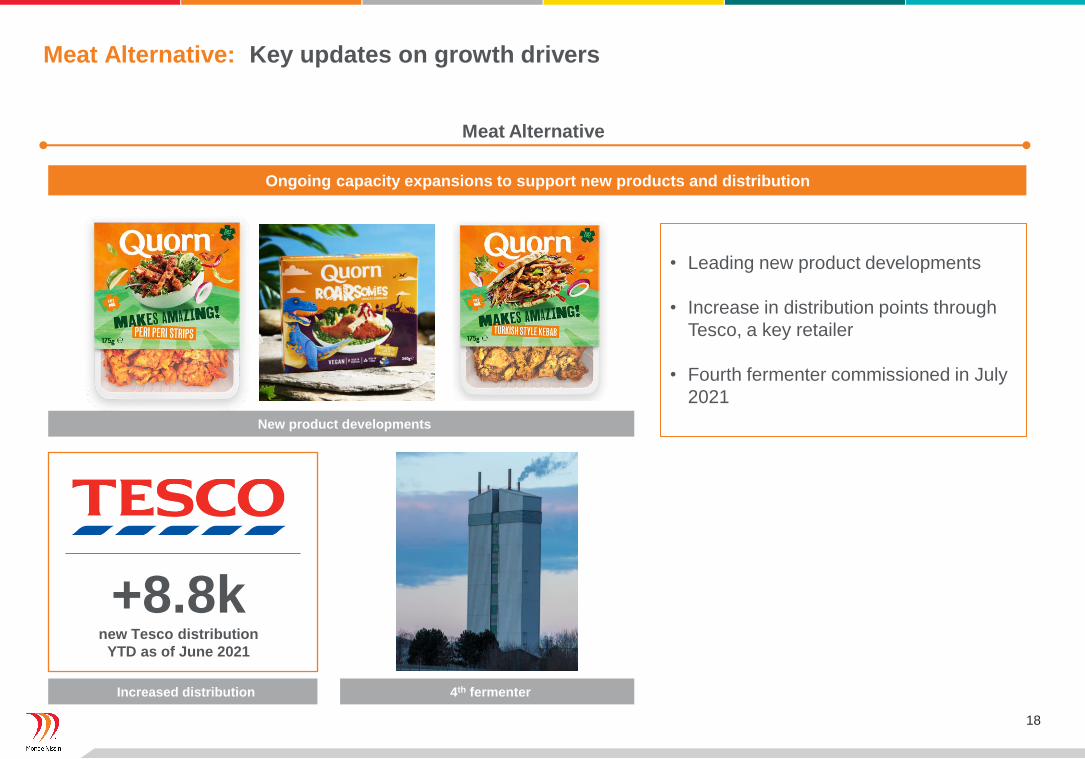
Meat Alternative
Ongoing capacity expansions to support new products and distribution
Meat Alternative: Key updates on growth drivers
New product developments
Increased distribution 4th fermenter
• Leading new product developments
• Increase in distribution points through
Tesco, a key retailer
• Fourth fermenter commissioned in July
2021
+8.8knew Tesco distribution
YTD as of June 2021
19
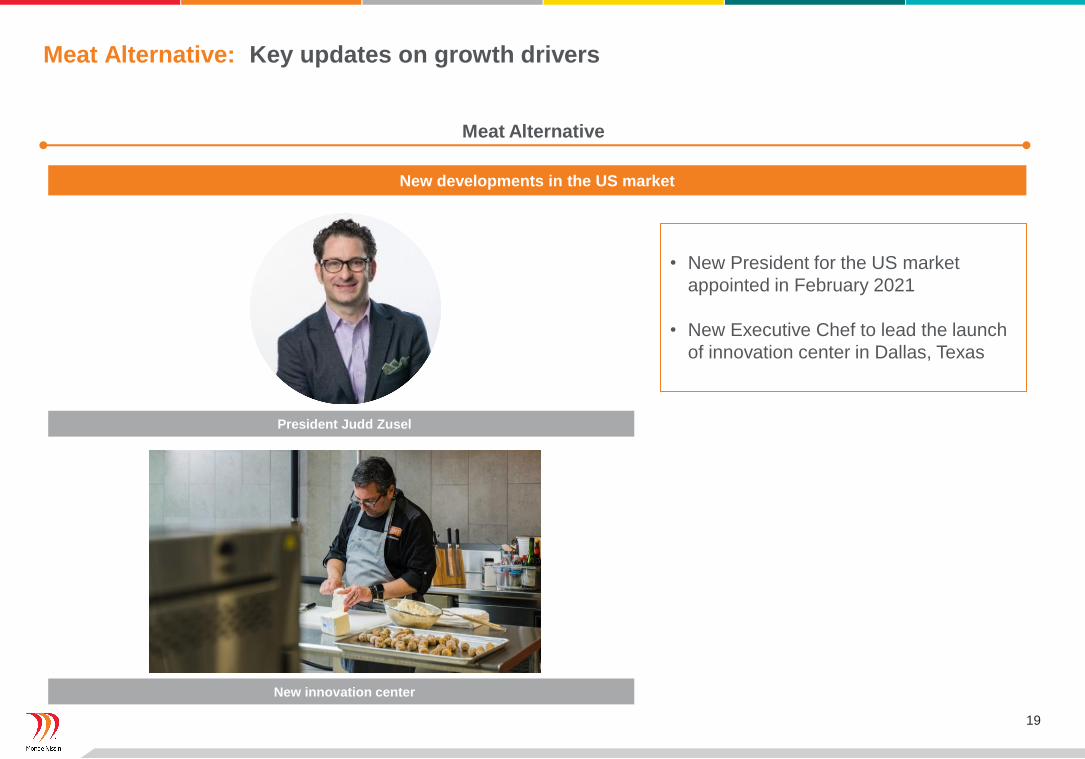
Meat Alternative
New developments in the US market
Meat Alternative: Key updates on growth drivers
• New President for the US market
appointed in February 2021
• New Executive Chef to lead the launch
of innovation center in Dallas, Texas
President Judd Zusel
New innovation center
20
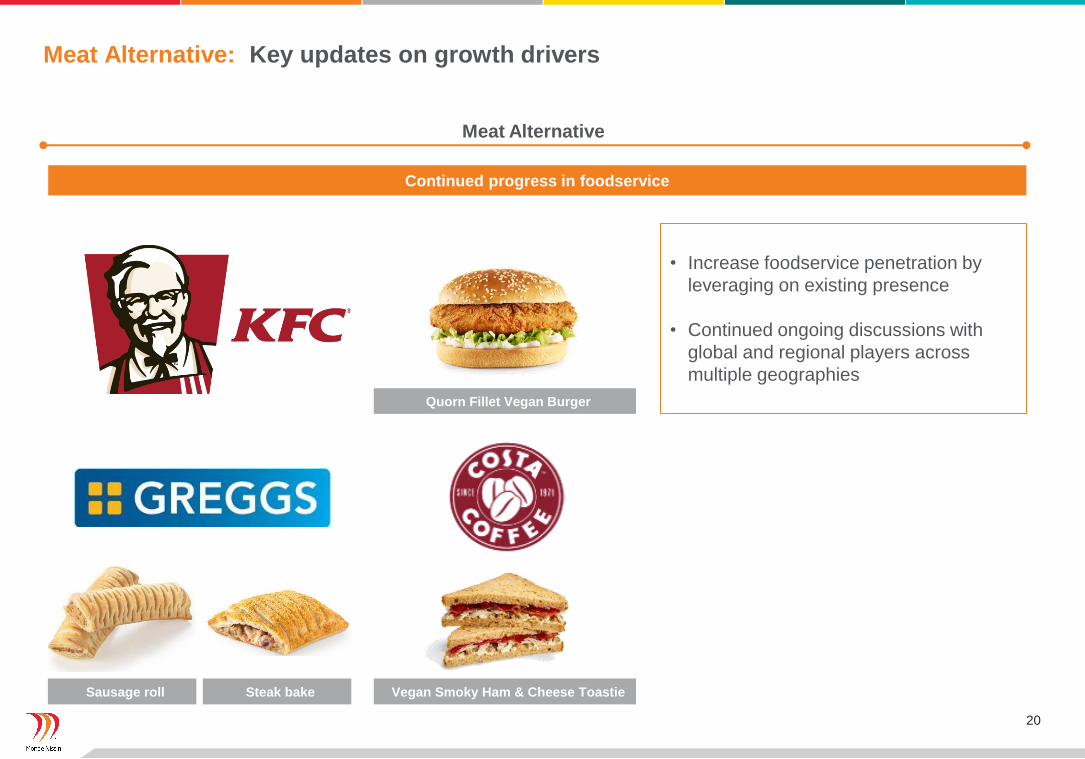
Meat Alternative
Continued progress in foodservice
Meat Alternative: Key updates on growth drivers
Sausage roll Vegan Smoky Ham & Cheese Toastie
Quorn Fillet Vegan Burger
Steak bake
• Increase foodservice penetration by
leveraging on existing presence
• Continued ongoing discussions with
global and regional players across
multiple geographies
21
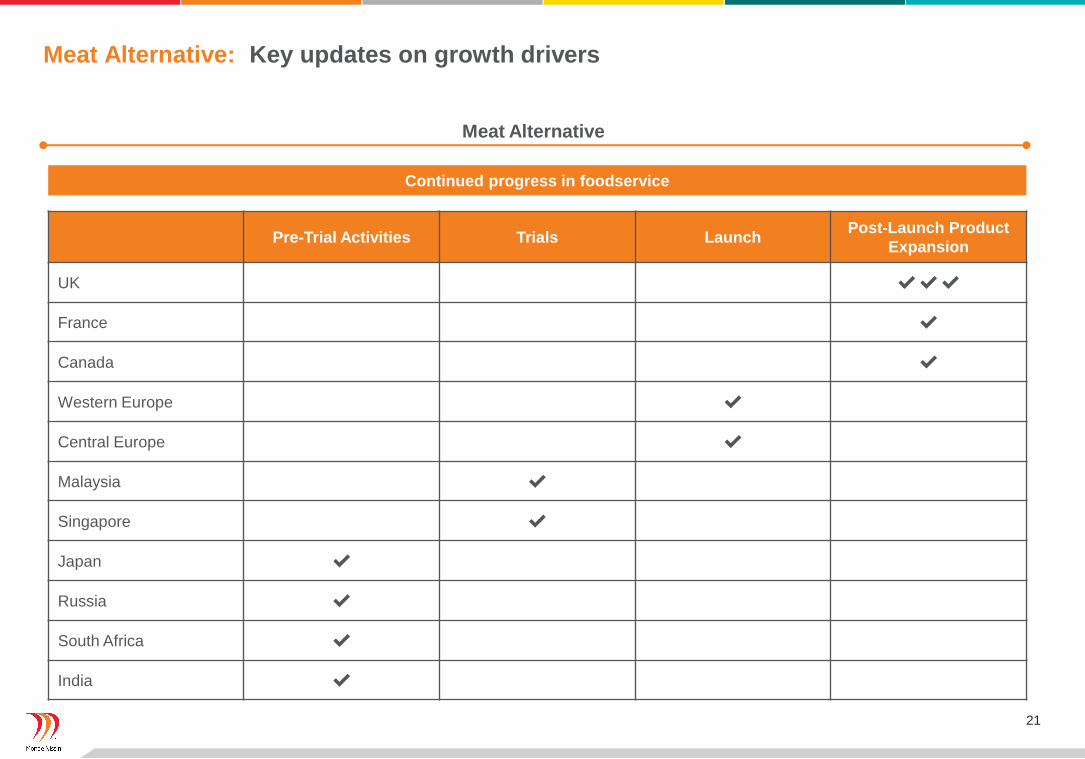
Pre-Trial Activities Trials LaunchPost-Launch Product
Expansion
UK ✔️✔️✔️
France ✔️
Canada ✔️
Western Europe ✔️
Central Europe ✔️
Malaysia ✔️
Singapore ✔️
Japan ✔️
Russia ✔️
South Africa ✔️
India ✔️
Meat Alternative
Continued progress in foodservice
Meat Alternative: Key updates on growth drivers

22
Section 3
Guidance & Outlook
23
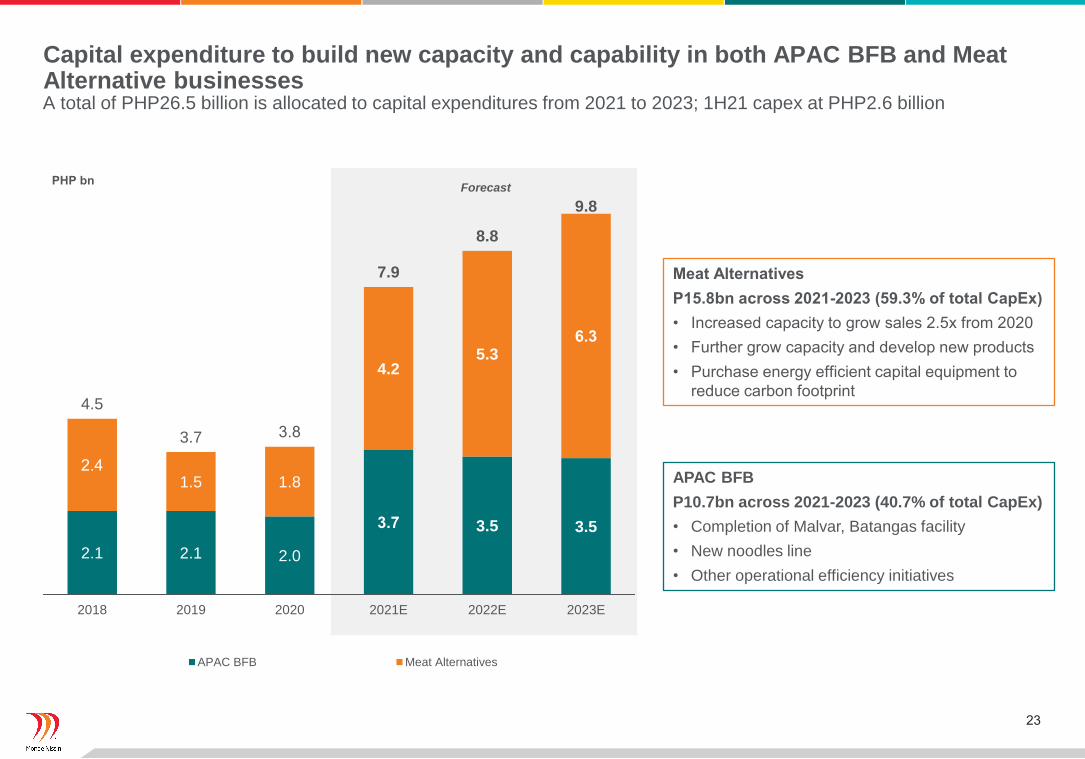
Capital expenditure to build new capacity and capability in both APAC BFB and Meat Alternative businesses
APAC BFB
P10.7bn across 2021-2023 (40.7% of total CapEx)
• Completion of Malvar, Batangas facility
• New noodles line
• Other operational efficiency initiatives
Meat Alternatives
P15.8bn across 2021-2023 (59.3% of total CapEx)
• Increased capacity to grow sales 2.5x from 2020
• Further grow capacity and develop new products
• Purchase energy efficient capital equipment to
reduce carbon footprint
A total of PHP26.5 billion is allocated to capital expenditures from 2021 to 2023; 1H21 capex at PHP2.6 billion
2.1 2.1 2.0
3.7 3.5 3.5
2.41.5 1.8
4.25.3
6.3
4.5
3.7 3.8
7.9
8.8
9.8
2018 2019 2020 2021E 2022E 2023E
APAC BFB Meat Alternatives
ForecastPHP bn
24
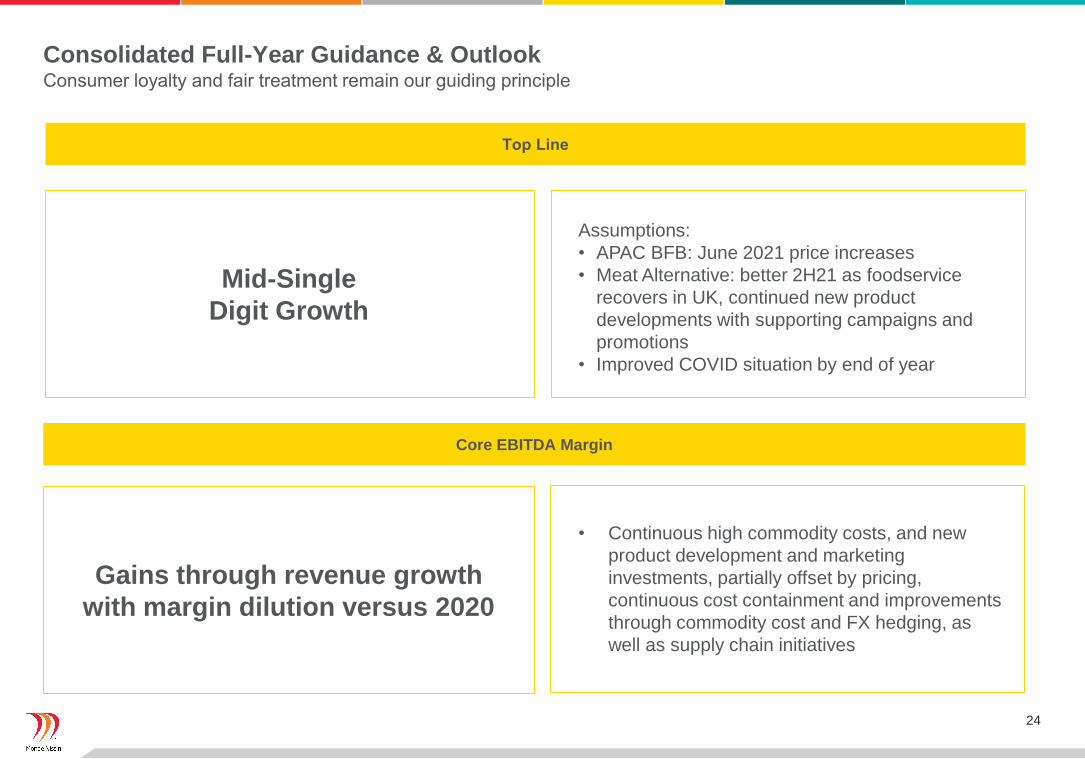
Consolidated Full-Year Guidance & Outlook
Top Line
Mid-Single
Digit Growth
Core EBITDA Margin
Gains through revenue growth
with margin dilution versus 2020
Assumptions:
• APAC BFB: June 2021 price increases
• Meat Alternative: better 2H21 as foodservice
recovers in UK, continued new product
developments with supporting campaigns and
promotions
• Improved COVID situation by end of year
• Continuous high commodity costs, and new
product development and marketing
investments, partially offset by pricing,
continuous cost containment and improvements
through commodity cost and FX hedging, as
well as supply chain initiatives
Consumer loyalty and fair treatment remain our guiding principle

25
Q&A

26
Section 4
Appendix
27
Key takeaways
1
2
3
4
5
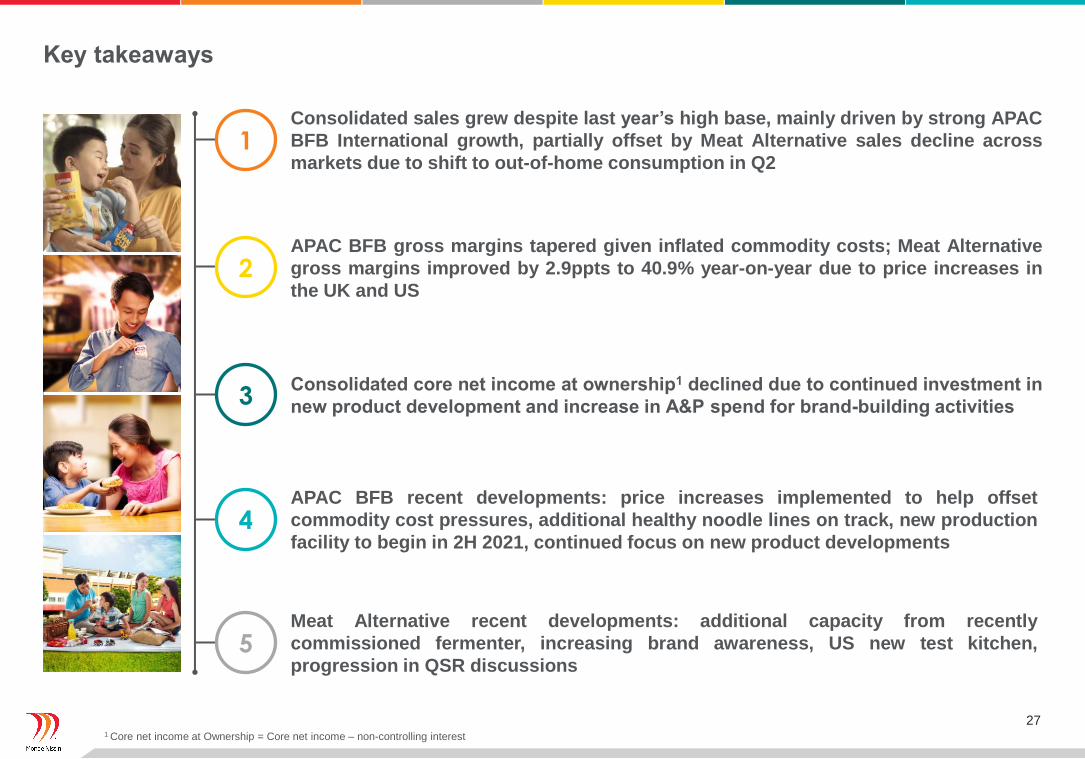
Consolidated sales grew despite last year’s high base, mainly driven by strong APAC
BFB International growth, partially offset by Meat Alternative sales decline across
markets due to shift to out-of-home consumption in Q2
APAC BFB gross margins tapered given inflated commodity costs; Meat Alternative
gross margins improved by 2.9ppts to 40.9% year-on-year due to price increases in
the UK and US
Consolidated core net income at ownership1 declined due to continued investment in
new product development and increase in A&P spend for brand-building activities
APAC BFB recent developments: price increases implemented to help offset
commodity cost pressures, additional healthy noodle lines on track, new production
facility to begin in 2H 2021, continued focus on new product developments
Meat Alternative recent developments: additional capacity from recently
commissioned fermenter, increasing brand awareness, US new test kitchen,
progression in QSR discussions
1 Core net income at Ownership = Core net income – non-controlling interest
28
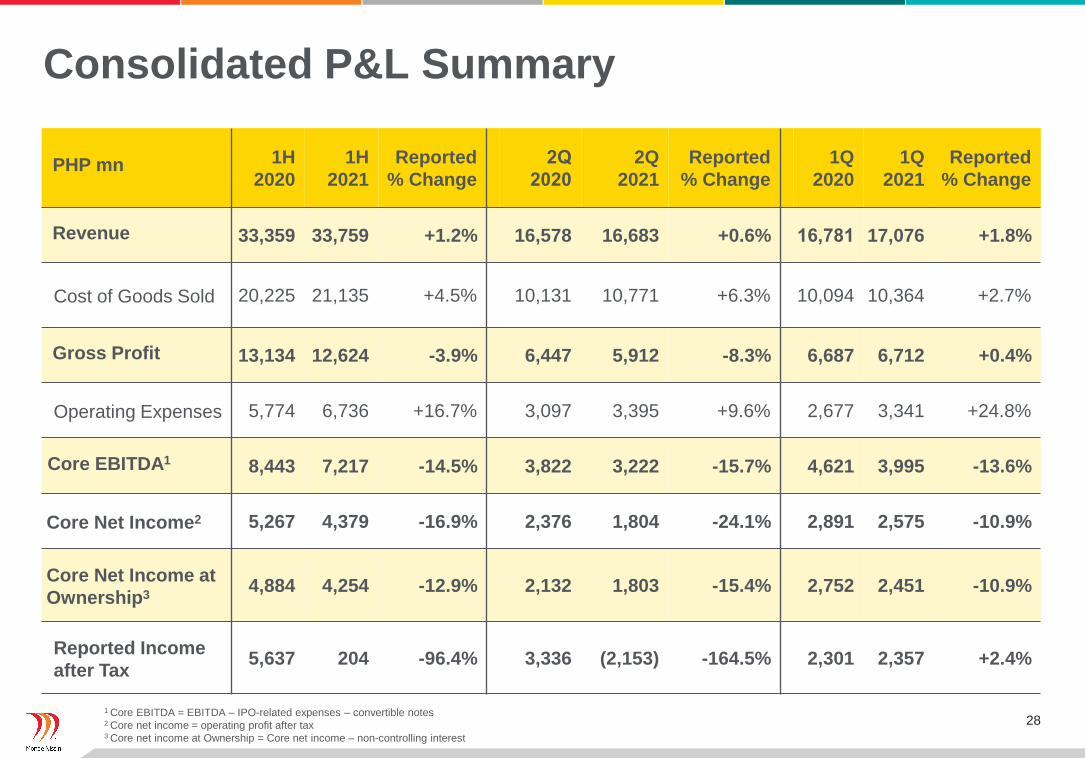
Consolidated P&L Summary
PHP mn 1H
2020
1H
2021
Reported
% Change
2Q
2020
2Q
2021
Reported
% Change
1Q
2020
1Q
2021
Reported
% Change
Revenue 33,359 33,759 +1.2% 16,578 16,683 +0.6% 16,781 17,076 +1.8%
Cost of Goods Sold 20,225 21,135 +4.5% 10,131 10,771 +6.3% 10,094 10,364 +2.7%
Gross Profit 13,134 12,624 -3.9% 6,447 5,912 -8.3% 6,687 6,712 +0.4%
Operating Expenses 5,774 6,736 +16.7% 3,097 3,395 +9.6% 2,677 3,341 +24.8%
Core EBITDA1 8,443 7,217 -14.5% 3,822 3,222 -15.7% 4,621 3,995 -13.6%
Core Net Income2 5,267 4,379 -16.9% 2,376 1,804 -24.1% 2,891 2,575 -10.9%
Core Net Income at
Ownership34,884 4,254 -12.9% 2,132 1,803 -15.4% 2,752 2,451 -10.9%
Reported Income
after Tax5,637 204 -96.4% 3,336 (2,153) -164.5% 2,301 2,357 +2.4%
1 Core EBITDA = EBITDA – IPO-related expenses – convertible notes2 Core net income = operating profit after tax3 Core net income at Ownership = Core net income – non-controlling interest
29
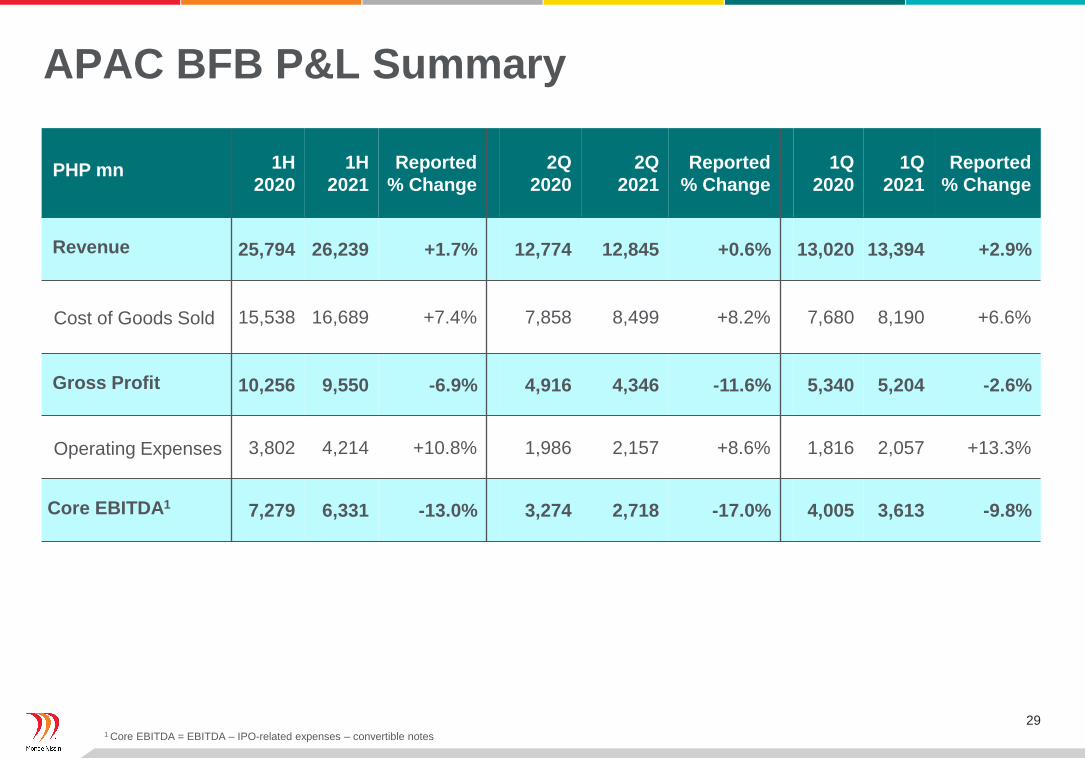
APAC BFB P&L Summary
PHP mn 1H
2020
1H
2021
Reported
% Change
2Q
2020
2Q
2021
Reported
% Change
1Q
2020
1Q
2021
Reported
% Change
Revenue 25,794 26,239 +1.7% 12,774 12,845 +0.6% 13,020 13,394 +2.9%
Cost of Goods Sold 15,538 16,689 +7.4% 7,858 8,499 +8.2% 7,680 8,190 +6.6%
Gross Profit 10,256 9,550 -6.9% 4,916 4,346 -11.6% 5,340 5,204 -2.6%
Operating Expenses 3,802 4,214 +10.8% 1,986 2,157 +8.6% 1,816 2,057 +13.3%
Core EBITDA1 7,279 6,331 -13.0% 3,274 2,718 -17.0% 4,005 3,613 -9.8%
1 Core EBITDA = EBITDA – IPO-related expenses – convertible notes
30
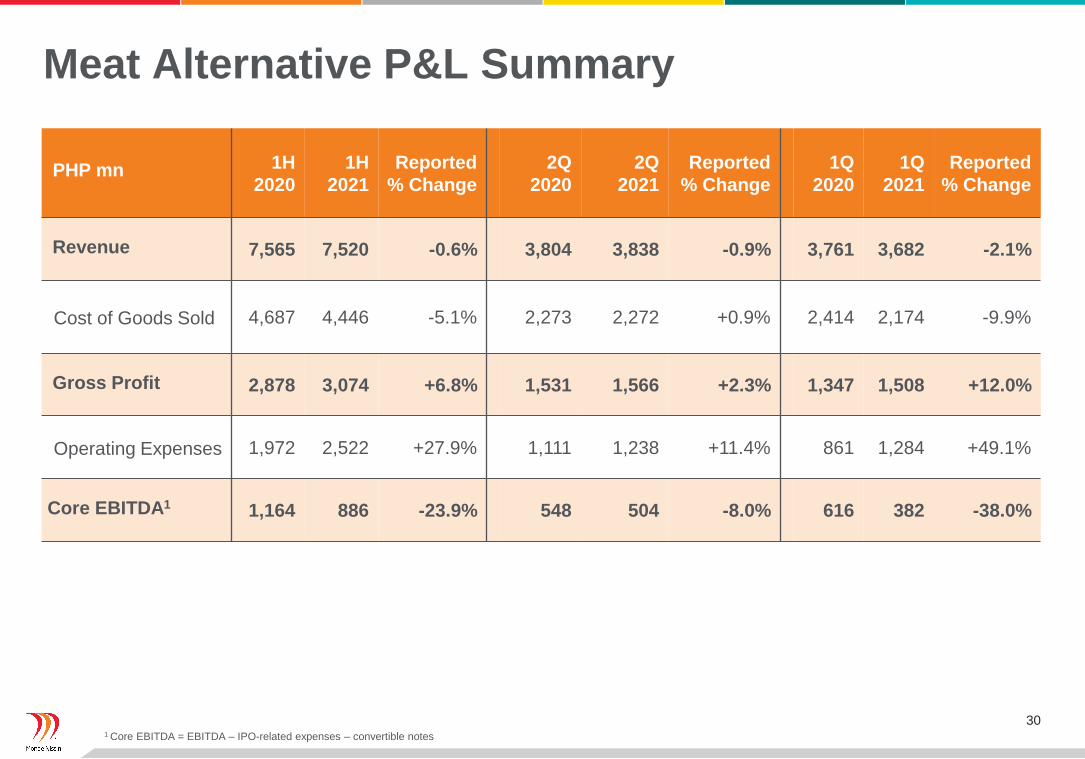
Meat Alternative P&L Summary
PHP mn 1H
2020
1H
2021
Reported
% Change
2Q
2020
2Q
2021
Reported
% Change
1Q
2020
1Q
2021
Reported
% Change
Revenue 7,565 7,520 -0.6% 3,804 3,838 -0.9% 3,761 3,682 -2.1%
Cost of Goods Sold 4,687 4,446 -5.1% 2,273 2,272 +0.9% 2,414 2,174 -9.9%
Gross Profit 2,878 3,074 +6.8% 1,531 1,566 +2.3% 1,347 1,508 +12.0%
Operating Expenses 1,972 2,522 +27.9% 1,111 1,238 +11.4% 861 1,284 +49.1%
Core EBITDA1 1,164 886 -23.9% 548 504 -8.0% 616 382 -38.0%
1 Core EBITDA = EBITDA – IPO-related expenses – convertible notes
31
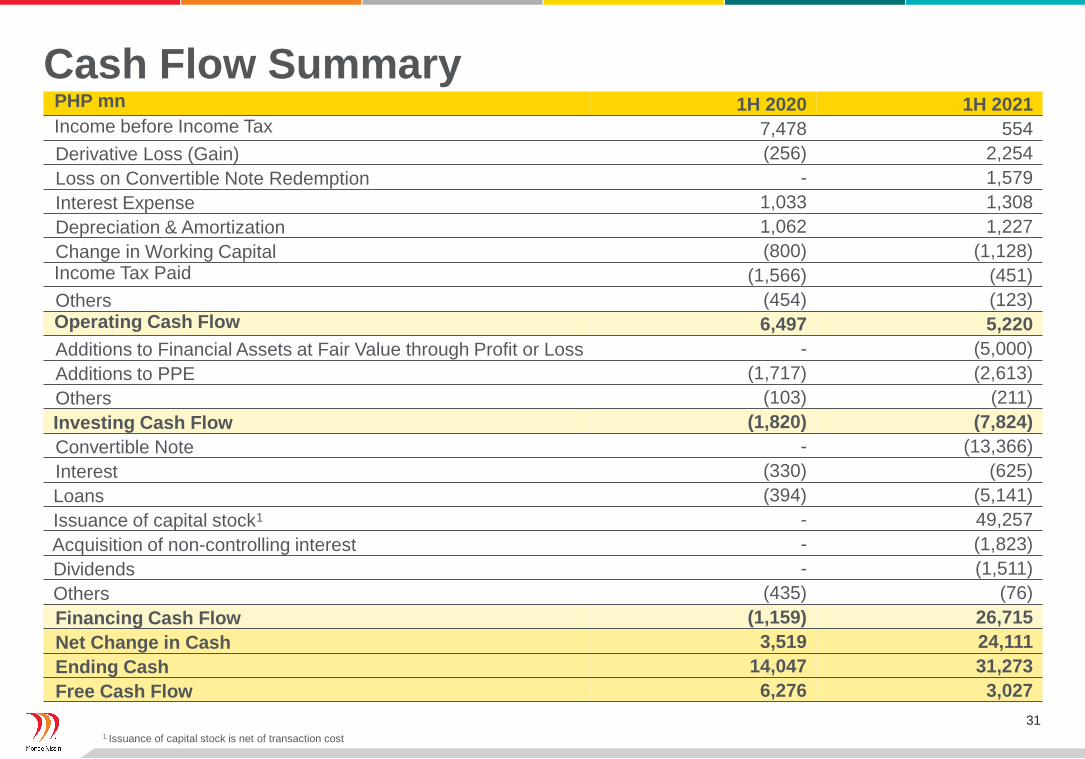
PHP mn 1H 2020 1H 2021
Income before Income Tax 7,478 554
Derivative Loss (Gain) (256) 2,254
Loss on Convertible Note Redemption - 1,579
Interest Expense 1,033 1,308
Depreciation & Amortization 1,062 1,227
Change in Working Capital (800) (1,128)
Income Tax Paid (1,566) (451)
Others (454) (123)
Operating Cash Flow 6,497 5,220
Additions to Financial Assets at Fair Value through Profit or Loss - (5,000)
Additions to PPE (1,717) (2,613)
Others (103) (211)
Investing Cash Flow (1,820) (7,824)
Convertible Note - (13,366)
Interest (330) (625)
Loans (394) (5,141)
Issuance of capital stock1 - 49,257
Acquisition of non-controlling interest - (1,823)
Dividends - (1,511)
Others (435) (76)
Financing Cash Flow (1,159) 26,715
Net Change in Cash 3,519 24,111
Ending Cash 14,047 31,273
Free Cash Flow 6,276 3,027
Cash Flow Summary
1 Issuance of capital stock is net of transaction cost
32
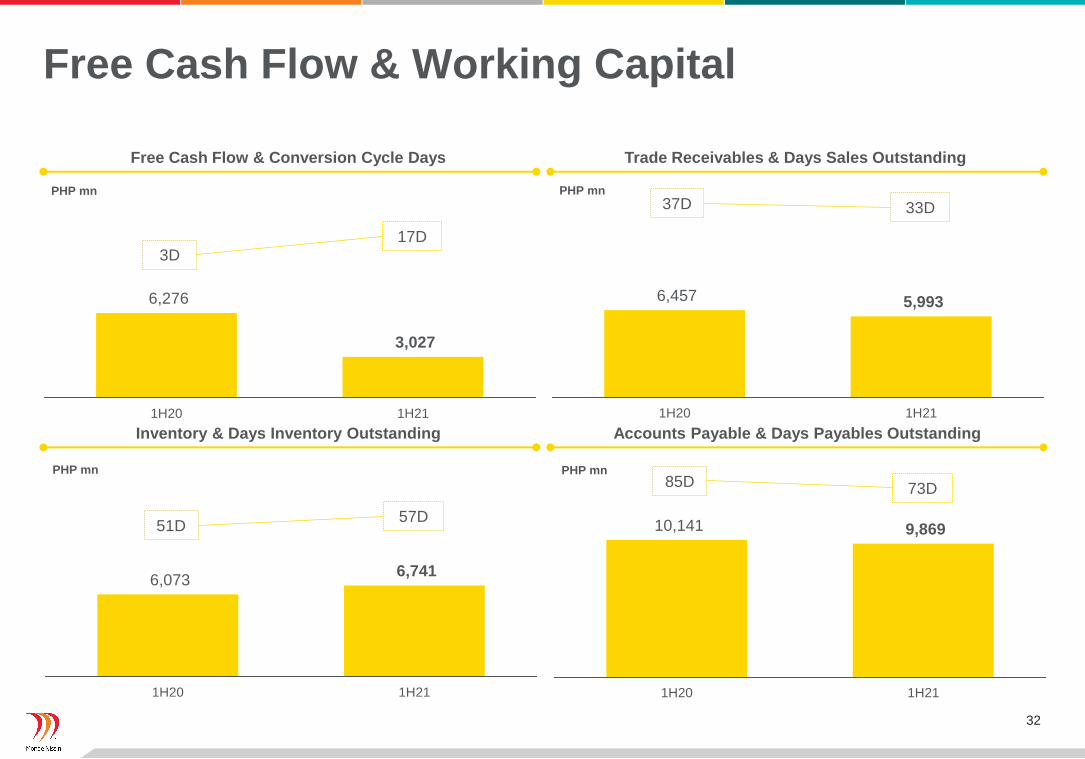
6,276
3,027
1H20 1H21
3D17D
Free Cash Flow & Conversion Cycle Days
Inventory & Days Inventory Outstanding
Trade Receivables & Days Sales Outstanding
Accounts Payable & Days Payables Outstanding
Free Cash Flow & Working Capital
PHP mn
6,457 5,993
1H20 1H21
37D 33DPHP mn
6,073 6,741
1H20 1H21
51D57D
PHP mn
10,141 9,869
1H20 1H21
85D 73D
PHP mn
33
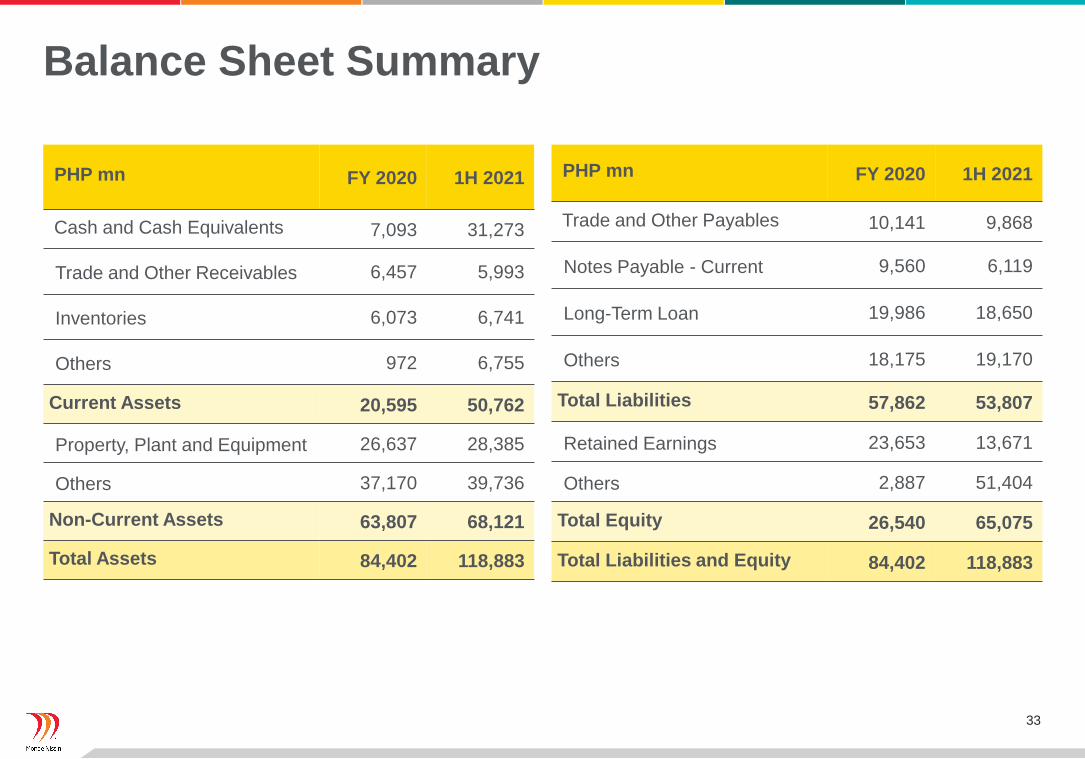
Balance Sheet Summary
PHP mn FY 2020 1H 2021
Cash and Cash Equivalents 7,093 31,273
Trade and Other Receivables 6,457 5,993
Inventories 6,073 6,741
Others 972 6,755
Current Assets 20,595 50,762
Property, Plant and Equipment 26,637 28,385
Others 37,170 39,736
Non-Current Assets 63,807 68,121
Total Assets 84,402 118,883
PHP mn FY 2020 1H 2021
Trade and Other Payables 10,141 9,868
Notes Payable - Current 9,560 6,119
Long-Term Loan 19,986 18,650
Others 18,175 19,170
Total Liabilities 57,862 53,807
Retained Earnings 23,653 13,671
Others 2,887 51,404
Total Equity 26,540 65,075
Total Liabilities and Equity 84,402 118,883
34
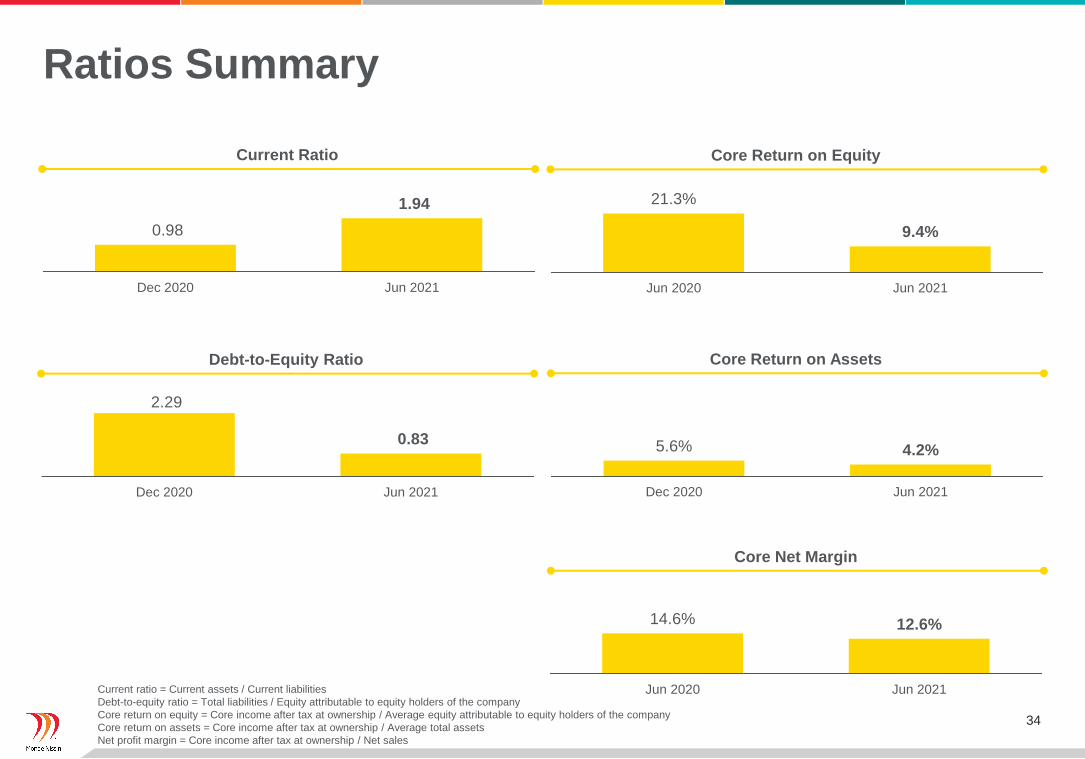
21.3%
9.4%
Jun 2020 Jun 2021
Core Return on Equity
Ratios Summary
0.98
1.94
Dec 2020 Jun 2021
Current Ratio
2.29
0.83
Dec 2020 Jun 2021
Debt-to-Equity Ratio
5.6% 4.2%
Dec 2020 Jun 2021
Core Return on Assets
Core Net Margin
14.6% 12.6%
Jun 2020 Jun 2021Current ratio = Current assets / Current liabilities
Debt-to-equity ratio = Total liabilities / Equity attributable to equity holders of the company
Core return on equity = Core income after tax at ownership / Average equity attributable to equity holders of the company
Core return on assets = Core income after tax at ownership / Average total assets
Net profit margin = Core income after tax at ownership / Net sales
35
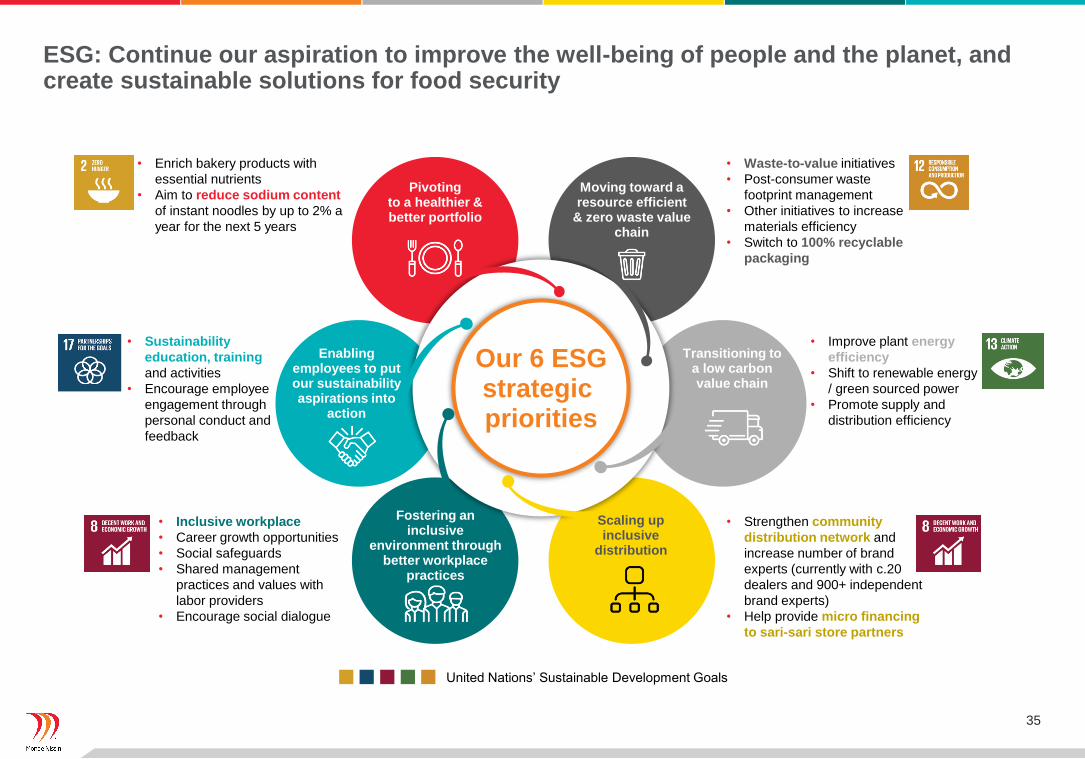
Business plan components
Our 6 ESGstrategic priorities
Pivoting to a healthier & better portfolio
Moving toward a resource efficient
& zero waste value chain
Transitioning to a low carbon value chain
Enabling employees to put our sustainability aspirations into
action
Fostering an inclusive
environment through better workplace
practices
Scaling up inclusive
distribution
• Enrich bakery products with
essential nutrients
• Aim to reduce sodium content
of instant noodles by up to 2% a
year for the next 5 years
• Waste-to-value initiatives
• Post-consumer waste
footprint management
• Other initiatives to increase
materials efficiency
• Switch to 100% recyclable
packaging
• Improve plant energy
efficiency
• Shift to renewable energy
/ green sourced power
• Promote supply and
distribution efficiency
• Strengthen community
distribution network and
increase number of brand
experts (currently with c.20
dealers and 900+ independent
brand experts)
• Help provide micro financing
to sari-sari store partners
• Inclusive workplace
• Career growth opportunities
• Social safeguards
• Shared management
practices and values with
labor providers
• Encourage social dialogue
• Sustainability
education, training
and activities
• Encourage employee
engagement through
personal conduct and
feedback
United Nations’ Sustainable Development Goals
ESG: Continue our aspiration to improve the well-being of people and the planet, and create sustainable solutions for food security

36
Santa Rosa City, Laguna, Philippines
+63 2 7759 7519 / +63 2 7759 7577
https://mondenissin.com/
https://edge.pse.com.ph/
www.linkedin.com/company/monde-nissin-corporation/
www.facebook.com/Monde-Nissin-Corporation
1H 2021 EARNINGS PRESENTATIONAugust 2021
Confidential
2
Legal Disclaimer
Monde Nissin Corporation (“MONDE”) makes no warranties or representations with respect to the accuracy or completeness of the contents
of this presentation, and disclaims any liability whatsoever for any loss arising from or in reliance, in full or in part, of the contents of this
presentation. Neither this presentation nor any part thereof may be (a) used or relied upon by any person for any purpose, (b) copied,
photocopied, duplicated or otherwise reproduced in any form or by any means, or (c) redistributed, passed on or otherwise disseminated or
quoted, directly or indirectly, to any other person either in your organization or elsewhere, without MONDE’s prior written consent. The
contents of this presentation should not be construed as investment advice, nor as a recommendation or solicitation for any investment by or
in MONDE.
This presentation may contain forward-looking statements. These forward-looking statements are based upon current expectations and
assumptions regarding anticipated developments and other factors affecting MONDE. They are not historical facts, nor are they guarantees of
future performance.
Because these forward-looking statements involve risks and uncertainties, there are important factors that could cause actual results to differ
materially from those expressed or implied by these forward-looking statements. Among other risks and uncertainties, the material or principal
factors which could cause actual results to differ materially are: MONDE’s brands not meeting consumer preferences; MONDE’s ability to
innovate and remain competitive; MONDE’s investment choices in its portfolio management; the effect of climate change on MONDE’s
business; MONDE’s ability to find sustainable solutions to its packaging materials; significant changes or deterioration in customer
relationships; the recruitment and retention of talented employees; disruptions in our supply chain and distribution; increases or volatility in the
cost of raw materials and commodities; the production of safe and high quality products; secure and reliable IT infrastructure; execution of
acquisitions, divestitures and business transformation projects; economic, social and political risks and natural disasters; financial risks; failure
to meet high and ethical standards; and managing regulatory, tax and legal matters. A number of these risks have increased as a result of the
current Covid-19 pandemic.
These forward-looking statements speak only as of the date of this document. Except as required by any applicable law or regulation,
MONDE expressly disclaims any obligation or undertaking to release publicly any updates or revisions to any forward-looking statements
contained herein to reflect any change in MONDE’s expectations with regard thereto or any change in events, conditions or circumstances on
which any such statement is based.

3
Our corporate aspirations
We acknowledge: We acknowledge:
We aspire to
improve the well-being
of people and the
planet, and create
sustainable solutions
for food security
It will be impossible to feed the
growing global population
if we do not change the
way we produce and
consume food
Food we produce and consumers
consume impact not only our
health, but also the health
of the environment

4
First Half 2021
Financial Performance

5
PHP mn 1H 2020 1H 2021Reported
% Change
Net Sales 33,359 33,759 +1.2%
APAC BFB 25,794 26,239 +1.7%
Meat Alternative 7,565 7,520 -0.6%
Gross Profit 13,134 12,624 -3.9%
Gross margin (%) 39.4% 37.4% -2.0ppts
Core EBITDA1 8,443 7,217 -14.5%
Core EBITDA margin (%) 25.3% 21.4% -3.9ppts
Core Net Income2 5,267 4,379 -16.9%
Core net margin (%) 15.8% 13.0% -2.8ppts
Core Net Income at Ownership3 4,884 4,254 -12.9%
Core net margin at Ownership (%) 14.6% 12.6% -2.0ppts
Non-Core Items 370 (4,175) -1,228.4%
Reported Net Income 5,637 204 -96.4%
Reported net margin (%) 16.9% 0.6% -16.3ppts
Robust demand drives growth off a high base; bottom-line impacted significantly by non-recurring items
• Pricing actions in 2020 softened
impact of raw material headwinds and
unfavorable sales mix
• Margins remain resilient despite high
commodity prices and higher OpEx
from continued investments in
strategic priorities
• Reported net income figures include
one-off items
1 Core EBITDA = EBITDA – IPO-related expenses – convertible notes2 Core net income = operating profit after tax3 Core net income at Ownership = Core net income – non-controlling interest

6
PHP mn 1H 2020 1H 2021Reported
% Change
Core Net Income1 5,267 4,379 -16.9%
Finance Expenses (554) (5,065) -814.3%
Other Income (Expenses) 825 (284) -134.4%
Income Tax Benefit 99 1,174 1,085.9%
Reported Net Income 5,637 204 -96.4%
Reported net income figures include one-off items
• Finance Expense one-off items:
• Price difference and interest on
redemption of Arran convertible
notes at IPO price of P13.50 in
1H21
• Other Income (Expense) one-off
items:
• Unrealized ForEx gain in 1H20
due to convertible notes
• IPO-related expenses in 1H21
• Income Tax Benefit one-off items:
• Net tax benefit in 1H21, arising
from the convertible note
redemption and retroactive
CREATE tax benefit from 2020,
partially offset by deferred tax
liability in the UK
1 Core net income = operating profit after tax
7
APAC BFB: Strong growth in International business
PHP mn 1H 2020 1H 2021Reported
% Change
Net Sales 25,794 26,239 +1.7%
Gross Profit 10,256 9,550 -6.9%
Gross margin (%) 39.8% 36.4% -3.4ppts
Core EBITDA1 7,279 6,331 -13.0%
Core EBITDA margin (%) 28.2% 24.1% -4.1ppts
Core Net Income2 4,614 3,948 -14.4%
Core net margin (%) 17.9% 15.0% -2.8ppts
• Market share gain in core Noodles
business support growth
• Market share gain in Biscuits despite
category decline due to lower usage
occasion
• Margin pressures from unfavorable
sales mix, higher commodity costs,
and increase in A&P
• Commodity inflation addressed by
price increases in June 2021, as well
as commodity and FX hedging
• Continuing cost-reduction program in
supply chain
1 Core EBITDA = EBITDA – IPO-related expenses – convertible notes2 Core net income = operating profit after tax

8
Meat Alternative: Higher gross margins but softness in sales due to shift to out-of-home consumption in Q2
PHP mn 1H 2020 1H 2021Reported
% Change
Net Sales 7,565 7,520 -0.6%
Gross Profit 2,878 3,074 +6.8%
Gross margin (%) 38.0% 40.9% +2.9ppts
Core EBITDA1 1,164 886 -23.9%
Core EBITDA margin (%) 15.4% 11.8% -3.6ppts
Core Net Income2 653 431 -34.0%
Core net margin (%) 8.6% 5.7% -2.9ppts
• Gross margins improved by 3% to
41% year-on-year due to successful
price increases in the UK and US
• Increased investments in new product
development and consumer marketing
result in decline in core EBITDA
margin
• Increase in foodservice sales provide
future momentum
1 Core EBITDA = EBITDA – IPO-related expenses – convertible notes2 Core net income = operating profit after tax

9
Key takeaways
1
2
3
4
5
Consolidated sales grew despite last year’s high base, mainly driven by strong APAC
BFB International growth, partially offset by Meat Alternative sales decline across
markets due to shift to out-of-home consumption in Q2
APAC BFB gross margins tapered given inflated commodity costs; Meat Alternative
gross margins improved by 2.9ppts to 40.9% year-on-year due to price increases in
the UK and US
Consolidated core net income at ownership1 declined due to continued investment in
new product development and increase in A&P spend for brand-building activities
APAC BFB recent developments: price increases implemented to help offset
commodity cost pressures, additional healthy noodle lines on track, new production
facility to begin in 2H 2021, continued focus on new product developments
Meat Alternative recent developments: additional capacity from recently
commissioned fermenter, increasing brand awareness, US new test kitchen,
progression in QSR discussions
1 Core net income at Ownership = Core net income – non-controlling interest

10
Q&A

11
Santa Rosa City, Laguna, Philippines
+63 2 7759 7519 / +63 2 7759 7577
https://mondenissin.com/
https://edge.pse.com.ph/
www.linkedin.com/company/monde-nissin-corporation/
www.facebook.com/Monde-Nissin-Corporation