1H 2017 Briefing v.8.14 - dmciholdings.com 2017 Briefing v.8.14.17.pdfAug 14, 2017 · • Sales...
26
ANALYST BRIEFING 1H 2017 Earnings Call Monday, 14 August 2017 3:00 p m DMCI Annex
Transcript of 1H 2017 Briefing v.8.14 - dmciholdings.com 2017 Briefing v.8.14.17.pdfAug 14, 2017 · • Sales...

ANALYSTBRIEFING1H2017EarningsCallMonday,14August20173:00pmDMCIAnnex

Agenda
• DMCI Holdings Inc.: Net Income (segment breakdown)
• Business Segment 1H 2017 Results:
Coal & On-Grid Power (Semirara)
Real Estate Development (DMCI Homes)Construction (DMCI)Nickel (DMCI Mining)Off-Grid Power (DMCI Power)Water Concession (Maynilad)
• Parent Balance Sheet as of 30 June 2017
314August2017
Holdings’ Net Income Breakdown
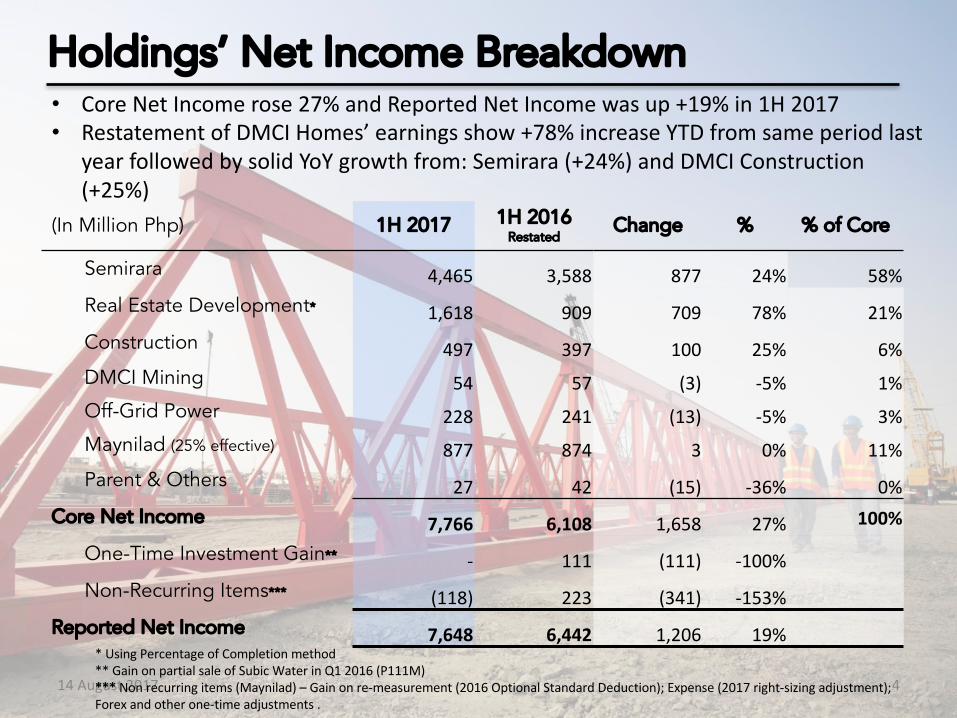
(In Million Php) 1H 2017 1H 2016Restated
Change % % of Core
Semirara 4,465 3,588 877 24% 58%Real Estate Development* 1,618 909 709 78% 21%Construction 497 397 100 25% 6%DMCI Mining 54 57 (3) -5% 1%Off-Grid Power 228 241 (13) -5% 3%Maynilad (25% effective) 877 874 3 0% 11%Parent & Others 27 42 (15) -36% 0%
Core Net Income 7,766 6,108 1,658 27% 100%
One-Time Investment Gain** - 111 (111) -100%Non-Recurring Items*** (118) 223 (341) -153%
Reported Net Income 7,648 6,442 1,206 19%
4
• CoreNetIncomerose27%andReportedNetIncomewasup+19%in1H2017• RestatementofDMCIHomes’earningsshow+78%increaseYTDfromsameperiodlast
yearfollowedbysolidYoYgrowthfrom:Semirara (+24%)andDMCIConstruction(+25%)
14August2017
*UsingPercentageofCompletionmethod**GainonpartialsaleofSubicWaterinQ12016(P111M)***Nonrecurringitems(Maynilad)– Gainonre-measurement(2016OptionalStandardDeduction);Expense(2017right-sizingadjustment);Forexandotherone-timeadjustments.
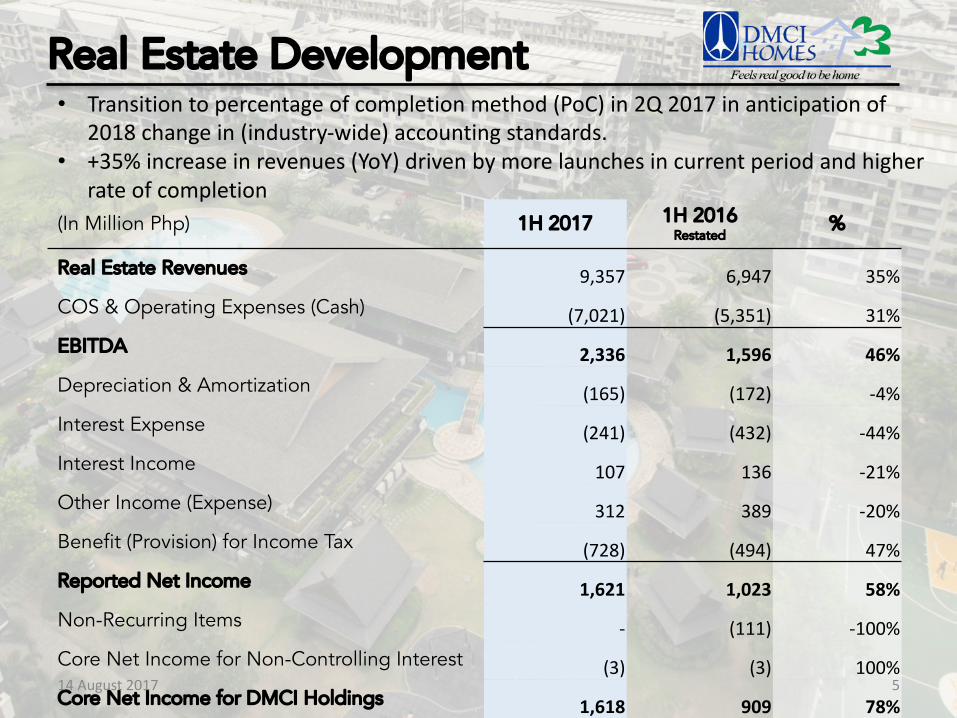
(In Million Php) 1H 2017 1H 2016 Restated
%
Real Estate Revenues 9,357 6,947 35%COS & Operating Expenses (Cash) (7,021) (5,351) 31%EBITDA 2,336 1,596 46%Depreciation & Amortization (165) (172) -4%Interest Expense (241) (432) -44%Interest Income 107 136 -21%Other Income (Expense) 312 389 -20%Benefit (Provision) for Income Tax (728) (494) 47%Reported Net Income 1,621 1,023 58%Non-Recurring Items - (111) -100%Core Net Income for Non-Controlling Interest (3) (3) 100%Core Net Income for DMCI Holdings 1,618 909 78%
5
Real Estate Development• Transitiontopercentageofcompletionmethod(PoC)in2Q2017inanticipationof
2018changein(industry-wide)accountingstandards.• +35%increaseinrevenues(YoY)drivenbymorelaunchesincurrentperiodandhigher
rateofcompletion
14August2017
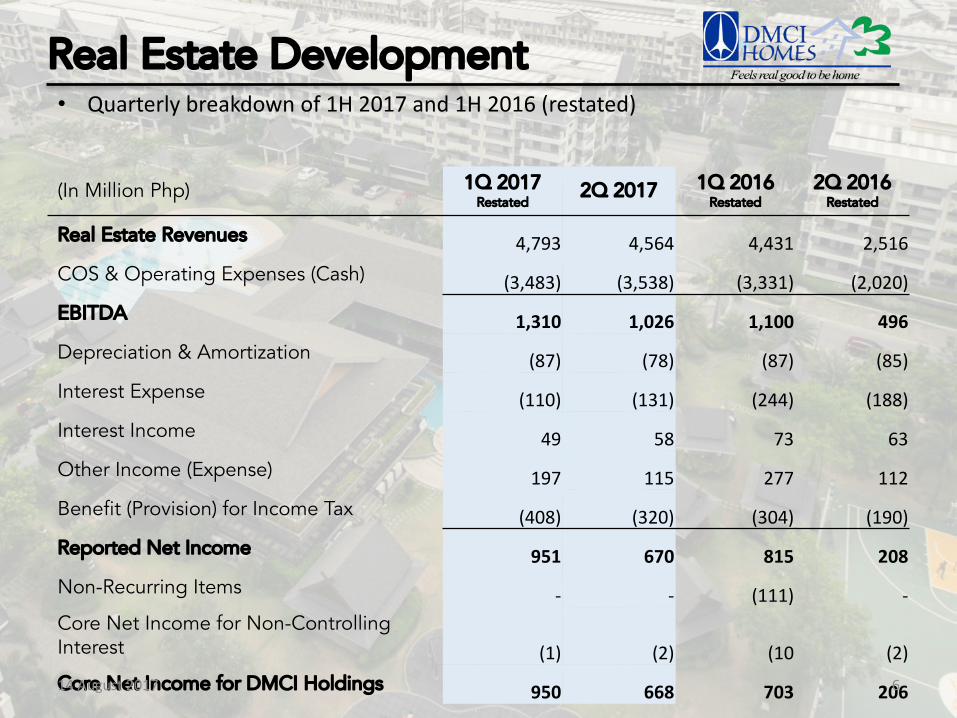
(In Million Php) 1Q 2017Restated
2Q 2017 1Q 2016 Restated
2Q 2016Restated
Real Estate Revenues 4,793 4,564 4,431 2,516COS & Operating Expenses (Cash) (3,483) (3,538) (3,331) (2,020)EBITDA 1,310 1,026 1,100 496Depreciation & Amortization (87) (78) (87) (85)Interest Expense (110) (131) (244) (188)Interest Income 49 58 73 63Other Income (Expense) 197 115 277 112Benefit (Provision) for Income Tax (408) (320) (304) (190)Reported Net Income 951 670 815 208Non-Recurring Items - - (111) -Core Net Income for Non-ControllingInterest (1) (2) (10 (2)Core Net Income for DMCI Holdings 950 668 703 2066
Real Estate Development• Quarterlybreakdownof1H2017and1H2016(restated)
14August2017
7
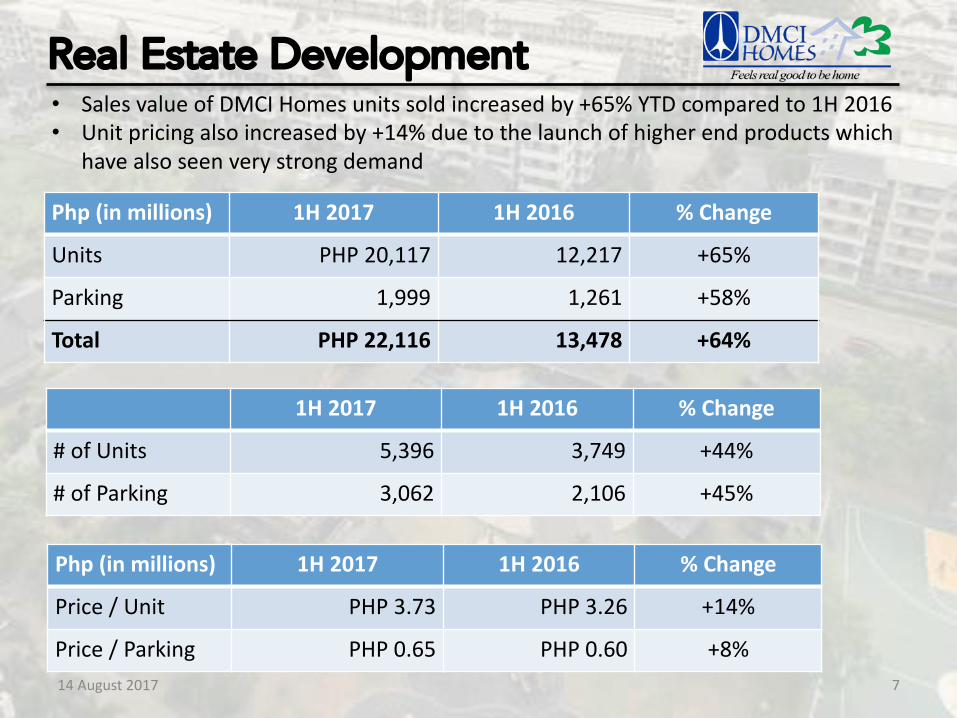
Real Estate Development• SalesvalueofDMCIHomesunitssoldincreasedby+65%YTDcomparedto1H2016• Unitpricingalsoincreasedby+14%duetothelaunchofhigherendproductswhich
havealsoseenverystrongdemand
1H 2017 1H 2016 %Change
#ofUnits 5,396 3,749 +44%
# ofParking 3,062 2,106 +45%
Php (inmillions) 1H 2017 1H 2016 %Change
Units PHP20,117 12,217 +65%
Parking 1,999 1,261 +58%
Total PHP22,116 13,478 +64%
Php (in millions) 1H 2017 1H 2016 %Change
Price /Unit PHP3.73 PHP3.26 +14%
Price/Parking PHP0.65 PHP0.60 +8%14August2017

8
2017 Launch Calendar• DMCIHomeswilllaunchacombinationofmidandhighrisebuildingsin2017
Month Project No.ofBldgs./Type
Jan PRISMA RESIDENCES PasigBlvd,PasigCity 3HRB(42F)
Mar MULBERRYPLACE AcaciaEstates 8MRB(6F)
May THEORABELLA 21ST Street,QuezonCity 1HRB(47F)
Aug KAIGARDENRESIDENCESMandaluyongCity 3HRB(40F)
Sept SATORIRESIDENCES PasigCity 3MRB/2HRB(6/15F)
Oct THEATHERTON Sucat,Parañaque 3HRB(15F)
NovTHEPOLARIS Oliveros St,Balintawak,Q.C. 3HRB
(40F)
SERISSA LasPinas 7MRB(6F)
14August2017
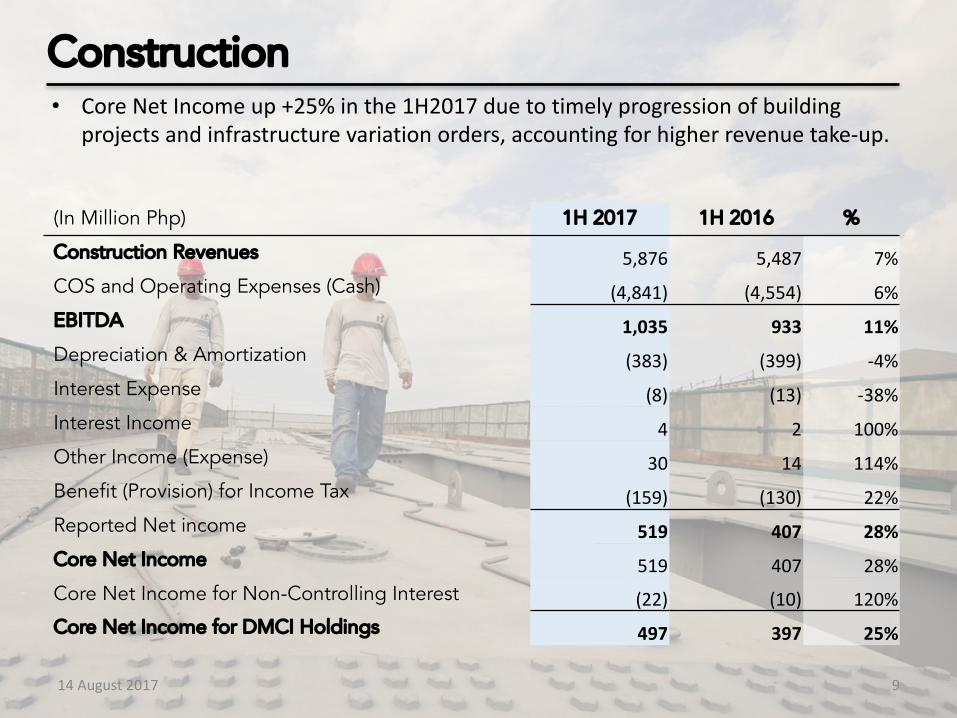
(In Million Php) 1H 2017 1H 2016 %
Construction Revenues 5,876 5,487 7%COS and Operating Expenses (Cash) (4,841) (4,554) 6%EBITDA 1,035 933 11%Depreciation & Amortization (383) (399) -4%Interest Expense (8) (13) -38%Interest Income 4 2 100%Other Income (Expense) 30 14 114%Benefit (Provision) for Income Tax (159) (130) 22%Reported Net income 519 407 28%Core Net Income 519 407 28%Core Net Income for Non-Controlling Interest (22) (10) 120%Core Net Income for DMCI Holdings 497 397 25%
9
Construction• CoreNetIncomeup+25%inthe1H2017duetotimelyprogressionofbuilding
projectsandinfrastructurevariationorders,accountingforhigherrevenuetake-up.
14August2017
10
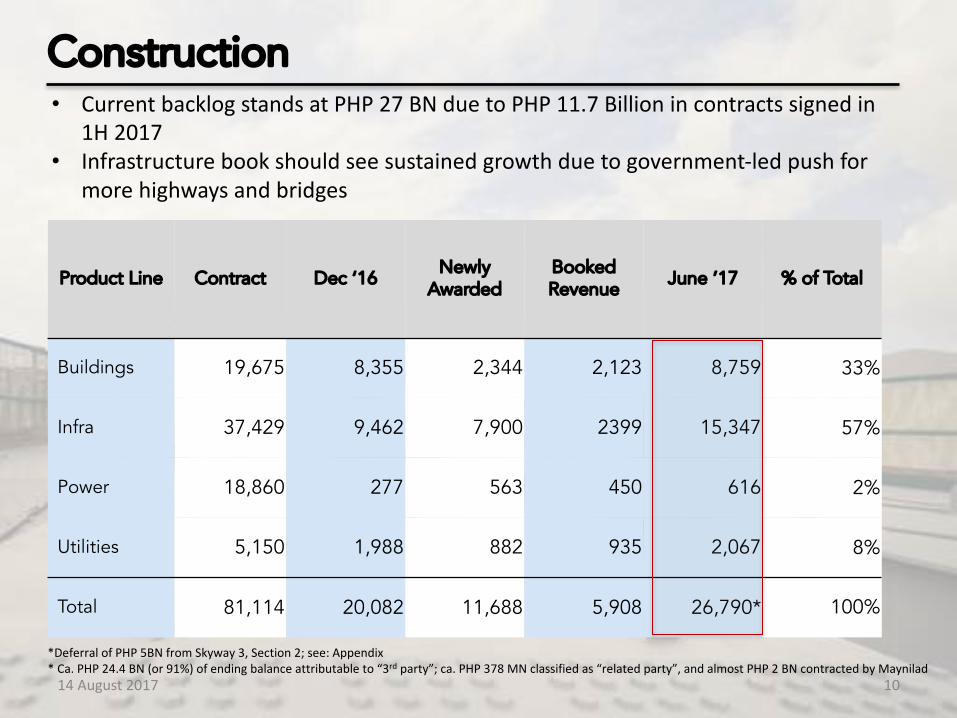
Construction• CurrentbacklogstandsatPHP27BNduetoPHP11.7Billionincontractssignedin
1H2017• Infrastructurebookshouldseesustainedgrowthduetogovernment-ledpushfor
morehighwaysandbridges
Product Line Contract Dec ‘16Newly
AwardedBooked Revenue June ’17 % of Total
Buildings 19,675 8,355 2,344 2,123 8,759 33%
Infra 37,429 9,462 7,900 2399 15,347 57%
Power 18,860 277 563 450 616 2%
Utilities 5,150 1,988 882 935 2,067 8%
Total 81,114 20,082 11,688 5,908 26,790* 100%
*DeferralofPHP5BNfromSkyway3,Section2;see:Appendix*Ca.PHP24.4BN(or91%)ofendingbalanceattributableto“3rd party”;ca.PHP378MNclassifiedas“relatedparty”,andalmostPHP2BNcontractedbyMaynilad14August2017
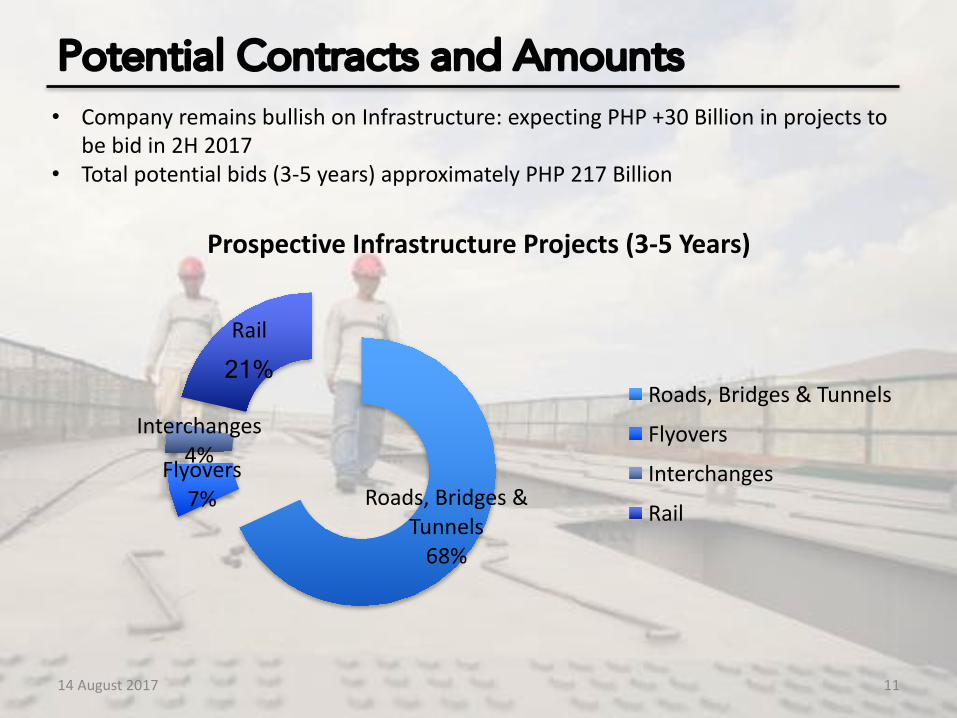
Roads,Bridges&Tunnels68%
Flyovers7%
Interchanges4%
Rail
21%
ProspectiveInfrastructureProjects(3-5Years)
Roads,Bridges&Tunnels
Flyovers
Interchanges
Rail
14August2017 11
Potential Contracts and Amounts• CompanyremainsbullishonInfrastructure:expectingPHP+30Billioninprojectsto
bebidin2H2017• Totalpotentialbids(3-5years)approximatelyPHP217Billion
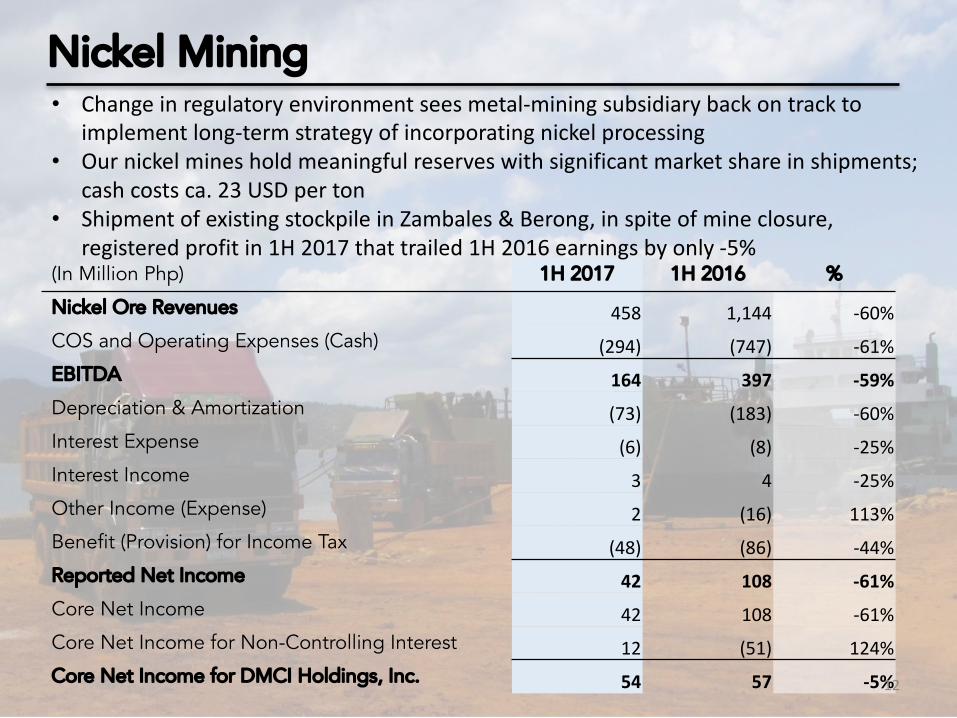
(In Million Php) 1H 2017 1H 2016 %
Nickel Ore Revenues 458 1,144 -60%COS and Operating Expenses (Cash) (294) (747) -61%EBITDA 164 397 -59%Depreciation & Amortization (73) (183) -60%Interest Expense (6) (8) -25%Interest Income 3 4 -25%Other Income (Expense) 2 (16) 113%Benefit (Provision) for Income Tax (48) (86) -44%Reported Net Income 42 108 -61%Core Net Income 42 108 -61%Core Net Income for Non-Controlling Interest 12 (51) 124%Core Net Income for DMCI Holdings, Inc. 54 57 -5%12
Nickel Mining• Changeinregulatoryenvironmentseesmetal-miningsubsidiarybackontrackto
implementlong-termstrategyofincorporatingnickelprocessing• Ournickelminesholdmeaningfulreserveswithsignificantmarketshareinshipments;
cashcostsca.23USDperton• ShipmentofexistingstockpileinZambales &Berong,inspiteofmineclosure,
registeredprofitin1H2017thattrailed1H2016earningsbyonly-5%
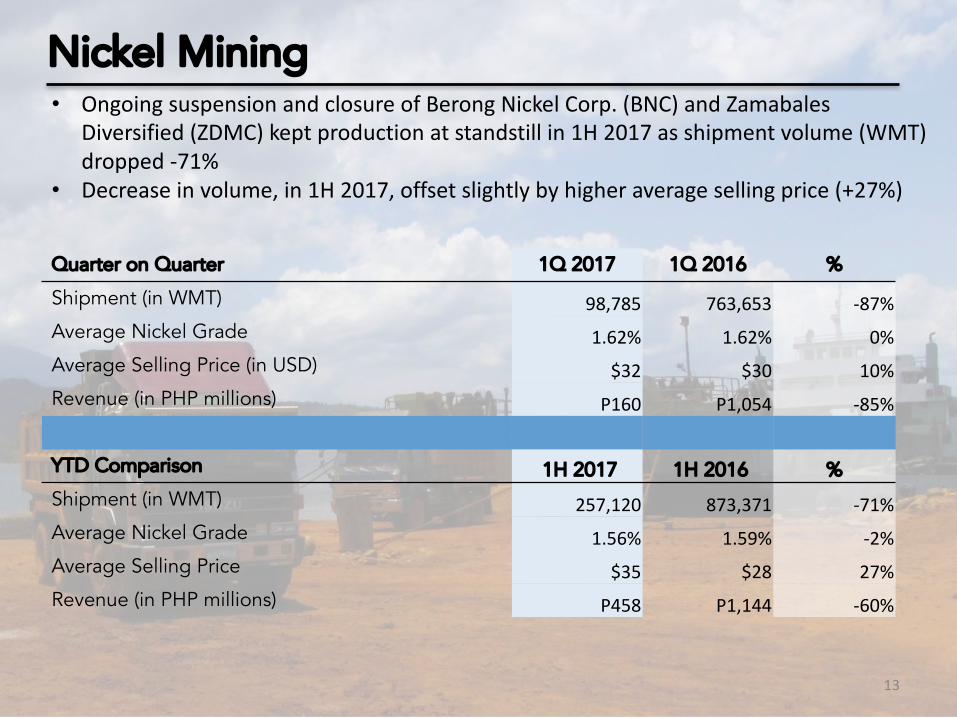
Quarter on Quarter 1Q 2017 1Q 2016 %
Shipment (in WMT) 98,785 763,653 -87%Average Nickel Grade 1.62% 1.62% 0%Average Selling Price (in USD) $32 $30 10%Revenue (in PHP millions) P160 P1,054 -85%
YTD Comparison 1H 2017 1H 2016 %Shipment (in WMT) 257,120 873,371 -71%Average Nickel Grade 1.56% 1.59% -2%Average Selling Price $35 $28 27%Revenue (in PHP millions) P458 P1,144 -60%
13
Nickel Mining• OngoingsuspensionandclosureofBerong NickelCorp.(BNC)andZamabales
Diversified(ZDMC)keptproductionatstandstillin1H2017asshipmentvolume(WMT)dropped-71%
• Decreaseinvolume,in1H2017,offsetslightlybyhigheraveragesellingprice(+27%)
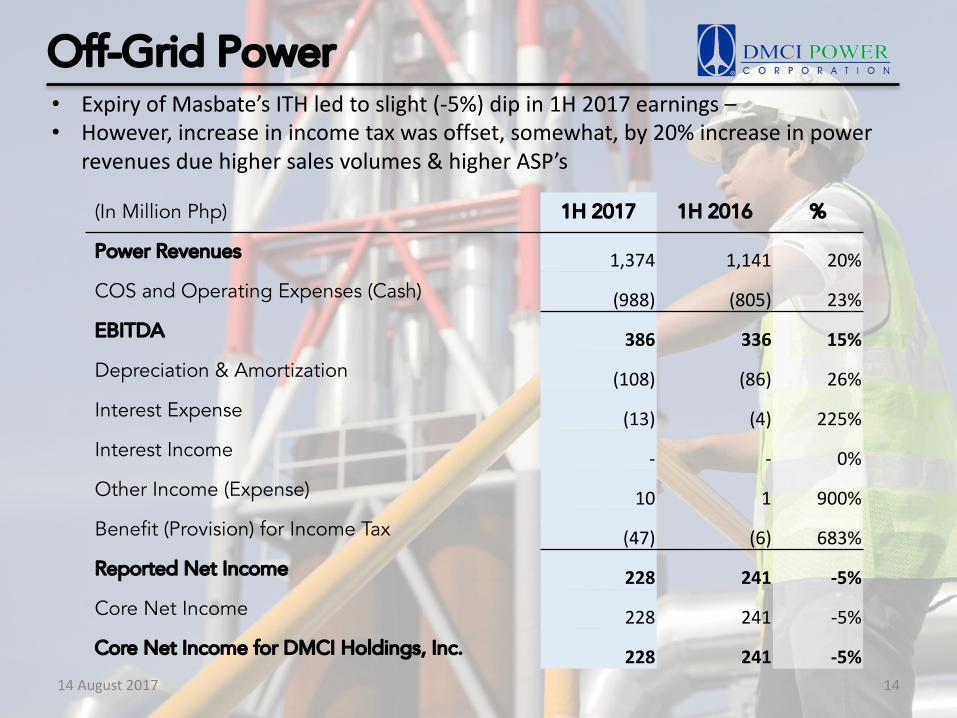
(In Million Php) 1H 2017 1H 2016 %
Power Revenues 1,374 1,141 20%COS and Operating Expenses (Cash) (988) (805) 23%EBITDA 386 336 15%Depreciation & Amortization (108) (86) 26%Interest Expense (13) (4) 225%Interest Income - - 0%Other Income (Expense) 10 1 900%Benefit (Provision) for Income Tax (47) (6) 683%Reported Net Income 228 241 -5%Core Net Income 228 241 -5%Core Net Income for DMCI Holdings, Inc. 228 241 -5%
14
Off-Grid Power• ExpiryofMasbate’sITHledtoslight(-5%)dipin1H2017earnings –• However,increaseinincometaxwasoffset,somewhat,by20%increaseinpower
revenuesduehighersalesvolumes&higherASP’s
14August2017
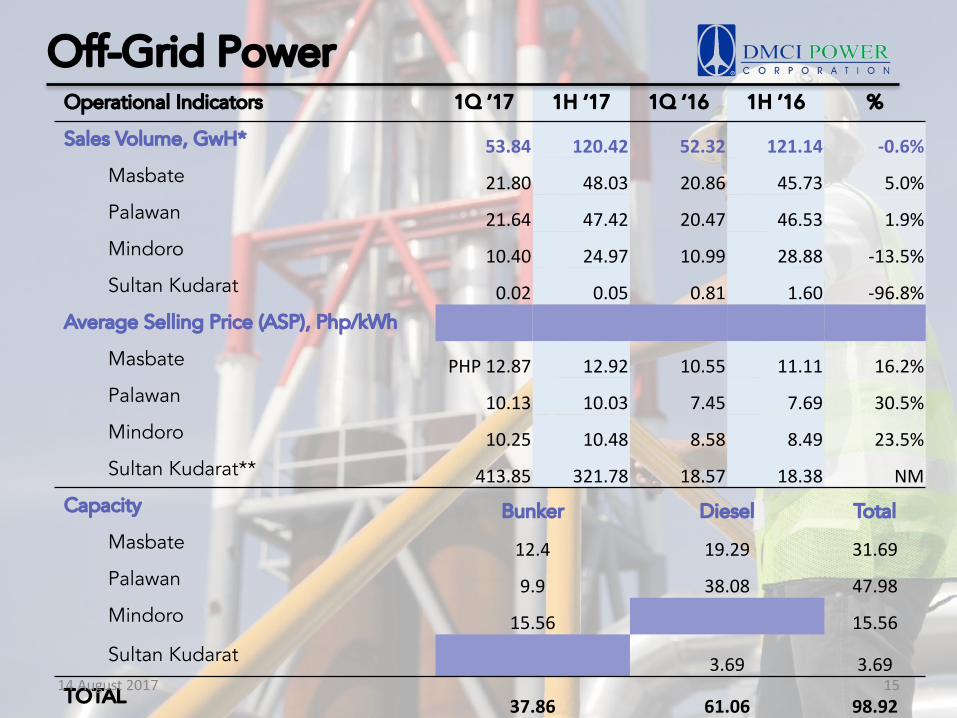
Operational Indicators 1Q ’17 1H ‘17 1Q ‘16 1H ’16 %
Sales Volume, GwH* 53.84 120.42 52.32 121.14 -0.6%Masbate 21.80 48.03 20.86 45.73 5.0%Palawan 21.64 47.42 20.47 46.53 1.9%Mindoro 10.40 24.97 10.99 28.88 -13.5%Sultan Kudarat 0.02 0.05 0.81 1.60 -96.8%
Average Selling Price (ASP), Php/kWh
Masbate PHP12.87 12.92 10.55 11.11 16.2%Palawan 10.13 10.03 7.45 7.69 30.5%Mindoro 10.25 10.48 8.58 8.49 23.5%Sultan Kudarat** 413.85 321.78 18.57 18.38 NM
Capacity Bunker Diesel Total
Masbate 12.4 19.29 31.69Palawan 9.9 38.08 47.98Mindoro 15.56 15.56
Sultan Kudarat 3.69 3.69TOTAL 37.86 61.06 98.92
15
Off-Grid Power
14August2017
16
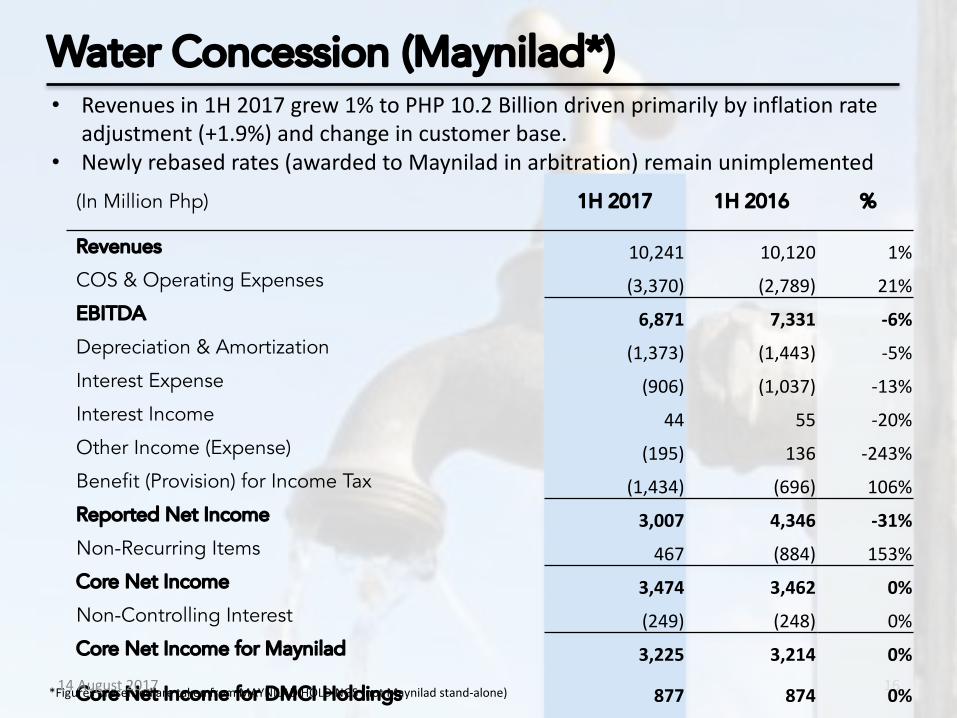
(In Million Php) 1H 2017 1H 2016 %
Revenues 10,241 10,120 1%COS & Operating Expenses (3,370) (2,789) 21%EBITDA 6,871 7,331 -6%Depreciation & Amortization (1,373) (1,443) -5%Interest Expense (906) (1,037) -13%Interest Income 44 55 -20%Other Income (Expense) (195) 136 -243%Benefit (Provision) for Income Tax (1,434) (696) 106%Reported Net Income 3,007 4,346 -31%Non-Recurring Items 467 (884) 153%Core Net Income 3,474 3,462 0%Non-Controlling Interest (249) (248) 0%Core Net Income for Maynilad 3,225 3,214 0%
Core Net Income for DMCI Holdings 877 874 0%
Water Concession (Maynilad*)• Revenuesin1H2017grew1%toPHP10.2Billiondrivenprimarilybyinflationrate
adjustment(+1.9%)andchangeincustomerbase.• Newlyrebasedrates(awardedtoMaynilad inarbitration)remainunimplemented
*FigurespresentedaretakenfromMAYNILADHOLDINGS(notMaynilad stand-alone)14August2017
14August2017 17
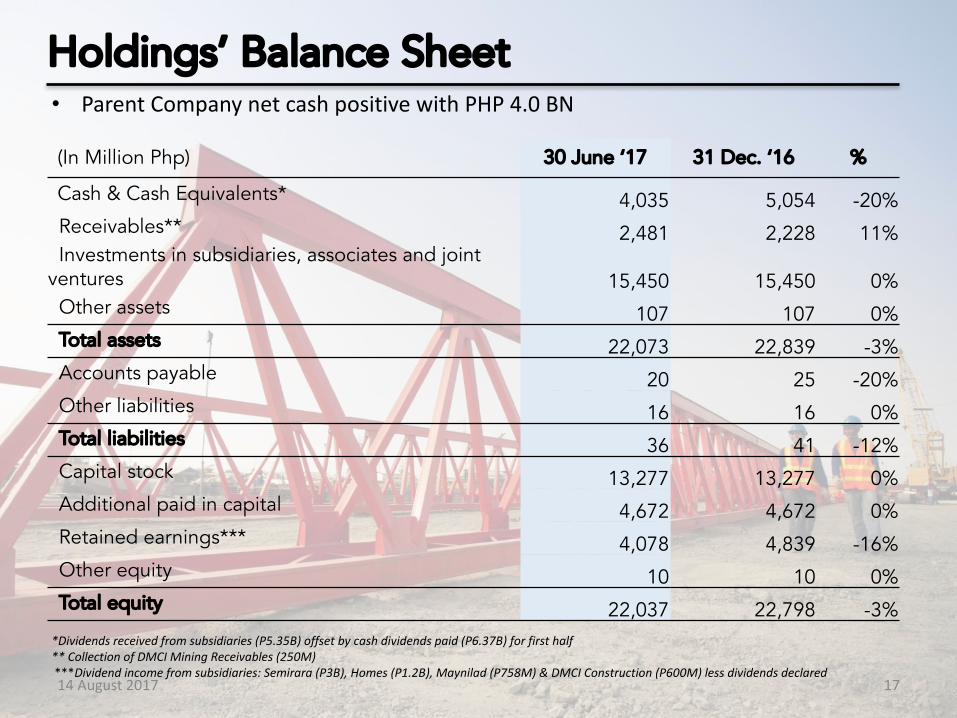
(In Million Php) 30 June ‘17 31 Dec. ‘16 %
Cash & Cash Equivalents* 4,035 5,054 -20%Receivables** 2,481 2,228 11%Investments in subsidiaries, associates and joint
ventures 15,450 15,450 0%Other assets 107 107 0%Total assets 22,073 22,839 -3%Accounts payable 20 25 -20%Other liabilities 16 16 0%Total liabilities 36 41 -12%Capital stock 13,277 13,277 0%Additional paid in capital 4,672 4,672 0%Retained earnings*** 4,078 4,839 -16%Other equity 10 10 0%Total equity 22,037 22,798 -3%
Holdings’ Balance Sheet• ParentCompanynetcashpositivewithPHP4.0BN
*Dividendsreceivedfromsubsidiaries(P5.35B)offsetbycashdividendspaid(P6.37B)forfirsthalf**CollectionofDMCIMiningReceivables(250M)***Dividendincomefromsubsidiaries:Semirara (P3B),Homes(P1.2B),Maynilad (P758M)&DMCIConstruction(P600M)lessdividendsdeclared
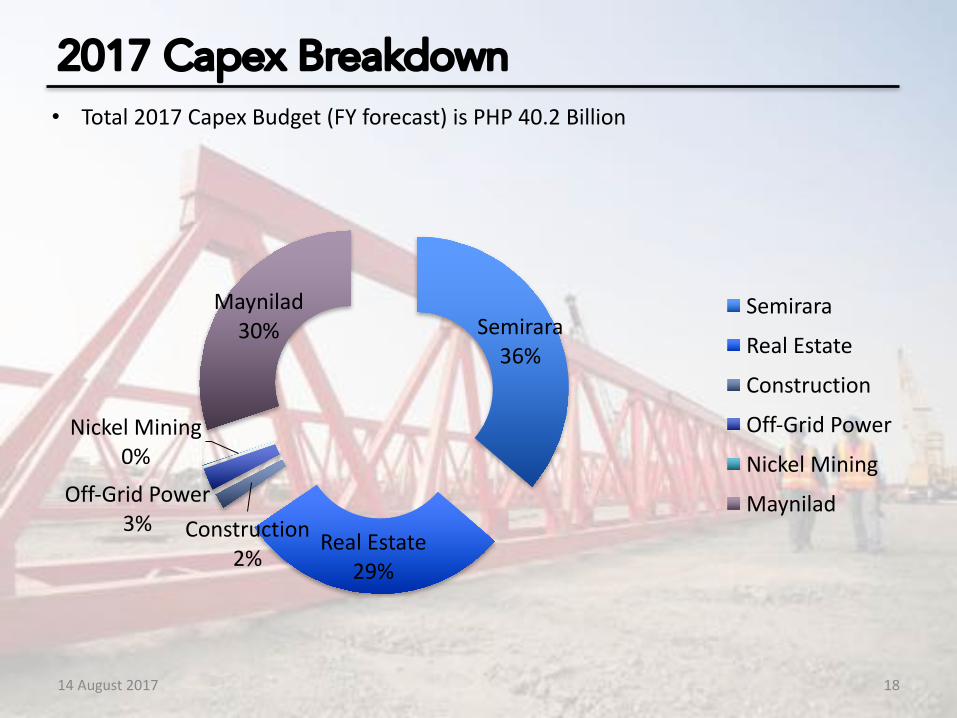
Semirara36%
RealEstate29%
Construction2%
Off-GridPower3%
NickelMining0%
Maynilad30%
Semirara
RealEstate
Construction
Off-GridPower
NickelMining
Maynilad
14August2017 18
2017 Capex Breakdown• Total2017CapexBudget(FYforecast)isPHP40.2Billion
14August2017 19
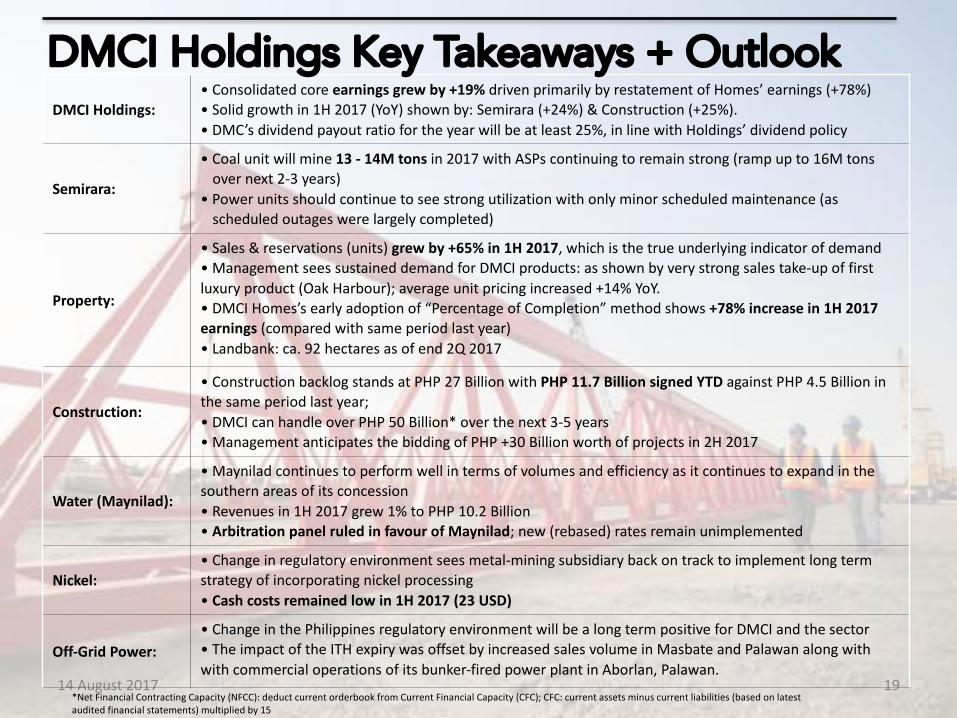
DMCI Holdings:•Consolidatedcoreearningsgrewby+19% drivenprimarilybyrestatementofHomes’earnings(+78%)•Solidgrowthin1H2017(YoY)shownby:Semirara (+24%)&Construction(+25%).•DMC’sdividendpayoutratioforthe yearwillbeatleast25%,inlinewithHoldings’dividendpolicy
Semirara:
•Coalunitwillmine13- 14Mtons in2017with ASPscontinuingtoremainstrong(rampupto16Mtonsovernext2-3years)
•Powerunitsshouldcontinuetosee strongutilizationwithonlyminorscheduledmaintenance(asscheduledoutageswerelargelycompleted)
Property:
•Sales&reservations(units)grewby+65%in1H 2017, whichisthetrueunderlyingindicatorofdemand•ManagementseessustaineddemandforDMCIproducts: asshownbyverystrongsalestake-upoffirstluxuryproduct(OakHarbour);averageunitpricingincreased+14%YoY.•DMCIHomes’s earlyadoptionof“PercentageofCompletion”methodshows+78%increasein1H2017earnings (comparedwithsameperiodlastyear)•Landbank:ca.92hectaresasofend2Q2017
Construction:
•ConstructionbacklogstandsatPHP27BillionwithPHP11.7BillionsignedYTDagainstPHP4.5Billioninthesameperiodlastyear;•DMCIcanhandleoverPHP50Billion*overthenext3-5years•ManagementanticipatesthebiddingofPHP+30Billionworthofprojectsin2H2017
Water(Maynilad):
•Maynilad continuestoperformwellintermsofvolumesandefficiencyasitcontinuestoexpandinthesouthernareasofitsconcession•Revenuesin1H2017grew1%toPHP10.2Billion•Arbitrationpanelruledinfavour ofMaynilad;new(rebased)ratesremainunimplemented
Nickel:•Changein regulatoryenvironmentseesmetal-miningsubsidiarybackontracktoimplementlongtermstrategyofincorporatingnickelprocessing•Cashcostsremainedlowin1H2017(23USD)
Off-GridPower:•Change inthePhilippinesregulatoryenvironmentwillbealongtermpositiveforDMCIandthesector•TheimpactoftheITHexpirywasoffsetbyincreased salesvolumeinMasbateandPalawanalongwithwithcommercialoperationsofitsbunker-firedpowerplantinAborlan,Palawan.
DMCI Holdings Key Takeaways + Outlook
*NetFinancialContractingCapacity(NFCC):deductcurrentorderbook fromCurrentFinancialCapacity(CFC);CFC:currentassetsminuscurrentliabilities(basedonlatestauditedfinancialstatements)multipliedby15
Disclaimer
The information contained in this document is strictly confidential. Neither DMCI Holdings, Inc. (DMCI), nor its advisors make any representation regarding, and assumes no responsibility or liability for, the accuracy or completeness of, or any errors or omissions in any information contained herein. Such information is subject to change without notice, its accuracy is not guaranteed and it may not contain all material information concerning DMCI.
In addition, this document contains certain financial information and results of operation, and may also contain certain projections, plans, strategies, and objectives of DMCI, that are not statements of historical fact which would be treated as forward looking statements within the meaning of applicable law. Forward looking statements are subject to risks and uncertainties that may cause actual events and DMCI’s future results to be materially different than expected or indicated by such statements. No assurance can be given that the results anticipated by DMCI, or indicated by any such forward looking statements, will be achieved.
This document is not an offer of securities for sale in the United States. Securities may not be offered or sold in the United States absent registration under the United States Securities Act of 1933, as amended (the “Securities Act”) or an exemption from such registration. This document is not an offer to sell securities or a solicitation of an offer to buy securities in any jurisdiction where such offer or sale is not permitted.
14August2017 20
21
Real Estate Development
12%
9%
6%4% 3%
0%
5%
10%
15%
2012 2013 2014 2015 2016
DefaultRate
2,576
5,5082,829 2,866
10,611
8.1 17.5
95.3
11.4
38.1
0.0
50.0
100.0
150.0
0
3,000
6,000
9,000
12,000
2012 2013 2014 2015 2016
Launches
Units Value
#ofUnits
InPHPinBillions#ofUnits
InPHPinBillions
558
1,028 1,066
496 4841.6
3.3 3.6
1.8 1.8
0
1
2
3
4
0
300
600
900
1,200
2012 2013 2014 2015 2016
InventoryofRFOs
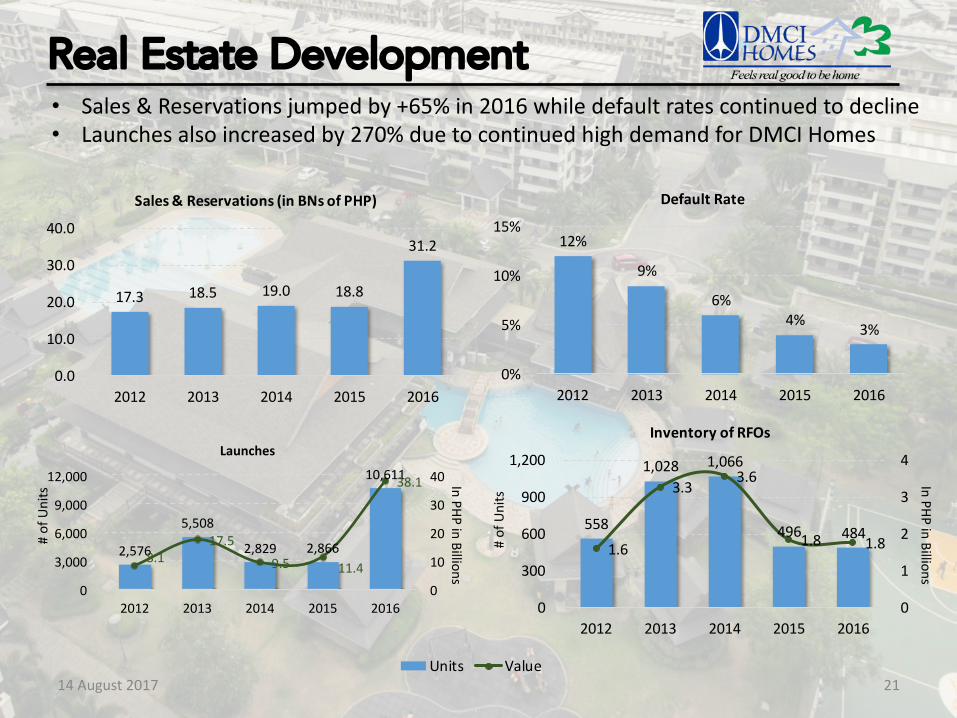
• Sales&Reservationsjumpedby+65%in2016whiledefaultratescontinuedtodecline• Launchesalsoincreasedby270%duetocontinuedhighdemandforDMCIHomes
17.3 18.5 19.0 18.8
31.2
0.0
10.0
20.0
30.0
40.0
2012 2013 2014 2015 2016
Sales&Reservations(inBNsofPHP)
2,576&&
5,508&&
2,829&& 2,866&&
10,611&&
8.1&&17.5&&
9.5&& 11.4&&
38.1&&
0&&
10&&
20&&
30&&
40&&
0&&
3,000&&
6,000&&
9,000&&
12,000&&
2012& 2013& 2014& 2015& 2016&
Launches)
14August2017
14August2017
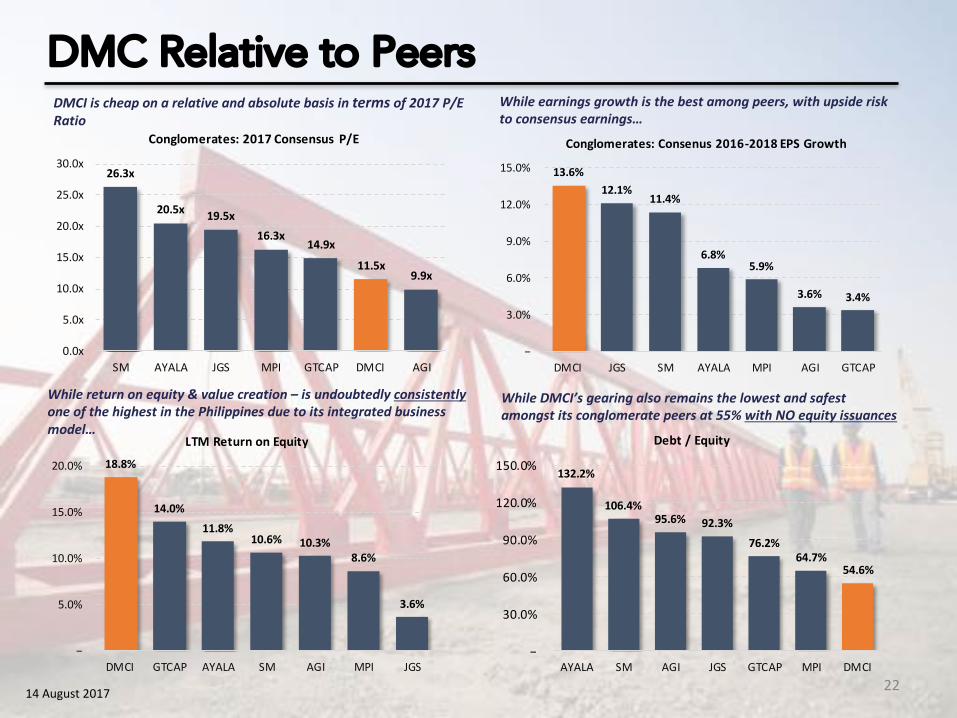
DMCIischeaponarelativeandabsolutebasisinterms of2017P/ERatio
Whileearningsgrowthisthebestamongpeers,withupsiderisktoconsensusearnings…
Whilereturnonequity&valuecreation– isundoubtedlyconsistentlyoneofthehighestinthePhilippinesduetoitsintegratedbusinessmodel…
WhileDMCI’sgearingalsoremainsthelowestandsafestamongstitsconglomeratepeersat55%withNOequityissuances
22
DMC Relative to Peers
26.3x
20.5x 19.5x16.3x
14.9x11.5x
9.9x
0.0x
5.0x
10.0x
15.0x
20.0x
25.0x
30.0x
SM AYALA JGS MPI GTCAP DMCI AGI
Conglomerates:2017Consensus P/E
13.6%12.1%
11.4%
6.8%5.9%
3.6% 3.4%
−
3.0%
6.0%
9.0%
12.0%
15.0%
DMCI JGS SM AYALA MPI AGI GTCAP
Conglomerates:Consenus2016-2018EPSGrowth
18.8%
14.0%11.8%
10.6% 10.3%8.6%
3.6%
−
5.0%
10.0%
15.0%
20.0%
DMCI GTCAP AYALA SM AGI MPI JGS
LTMReturnonEquity
132.2%
106.4%95.6% 92.3%
76.2%64.7%
54.6%
−
30.0%
60.0%
90.0%
120.0%
150.0%
AYALA SM AGI JGS GTCAP MPI DMCI
Debt/Equity
(In Million Php) 1H 2017 1H 2016 %
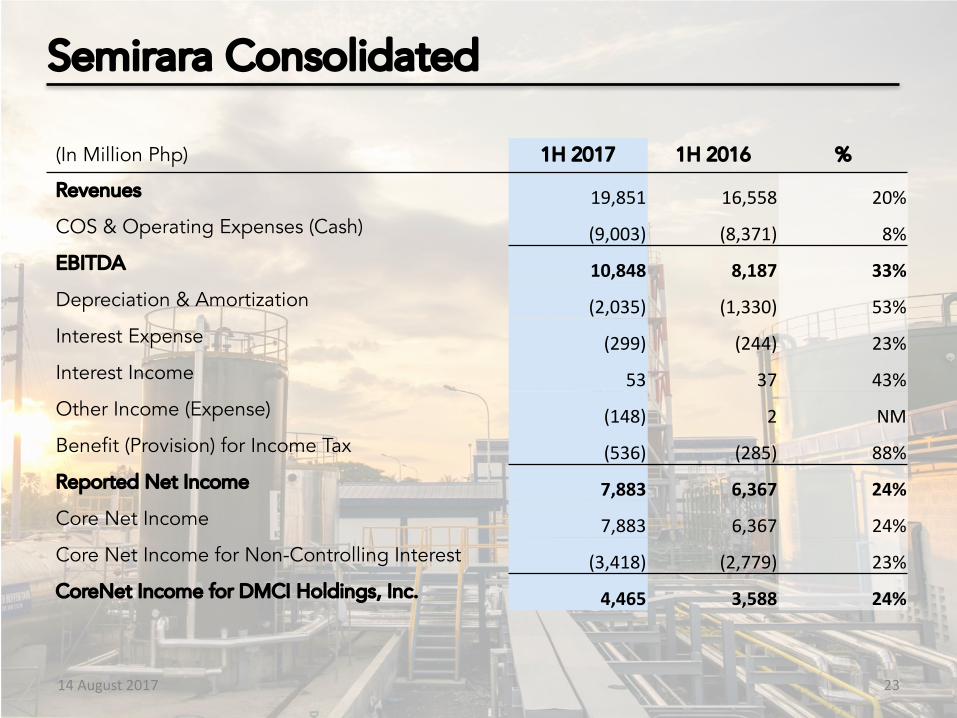
Revenues 19,851 16,558 20%COS & Operating Expenses (Cash) (9,003) (8,371) 8%EBITDA 10,848 8,187 33%Depreciation & Amortization (2,035) (1,330) 53%Interest Expense (299) (244) 23%Interest Income 53 37 43%Other Income (Expense) (148) 2 NMBenefit (Provision) for Income Tax (536) (285) 88%Reported Net Income 7,883 6,367 24%Core Net Income 7,883 6,367 24%Core Net Income for Non-Controlling Interest (3,418) (2,779) 23%CoreNet Income for DMCI Holdings, Inc. 4,465 3,588 24%
23
Semirara Consolidated
14August2017
(In Million Php) 1H 2017 1H 2016 %
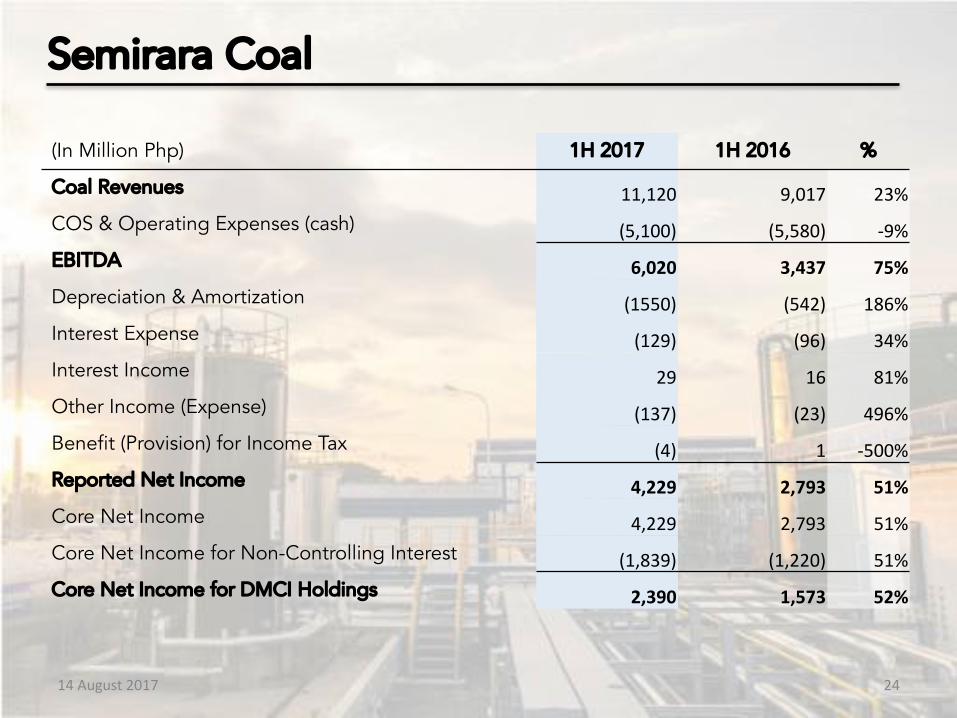
Coal Revenues 11,120 9,017 23%COS & Operating Expenses (cash) (5,100) (5,580) -9%EBITDA 6,020 3,437 75%Depreciation & Amortization (1550) (542) 186%Interest Expense (129) (96) 34%Interest Income 29 16 81%Other Income (Expense) (137) (23) 496%Benefit (Provision) for Income Tax (4) 1 -500%Reported Net Income 4,229 2,793 51%Core Net Income 4,229 2,793 51%Core Net Income for Non-Controlling Interest (1,839) (1,220) 51%Core Net Income for DMCI Holdings 2,390 1,573 52%
24
Semirara Coal
14August2017
(In Million Php) 1H 2017 1H 2016 %
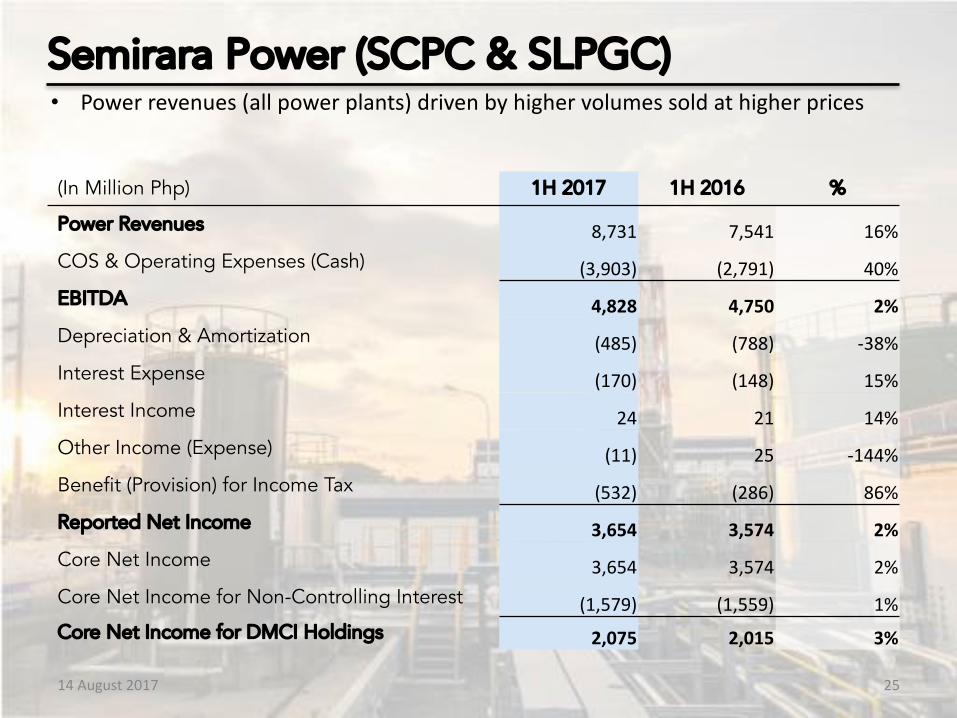
Power Revenues 8,731 7,541 16%COS & Operating Expenses (Cash) (3,903) (2,791) 40%EBITDA 4,828 4,750 2%Depreciation & Amortization (485) (788) -38%Interest Expense (170) (148) 15%Interest Income 24 21 14%Other Income (Expense) (11) 25 -144%Benefit (Provision) for Income Tax (532) (286) 86%Reported Net Income 3,654 3,574 2%Core Net Income 3,654 3,574 2%Core Net Income for Non-Controlling Interest (1,579) (1,559) 1%Core Net Income for DMCI Holdings 2,075 2,015 3%
14August2017 25
Semirara Power (SCPC & SLPGC)• Powerrevenues(allpowerplants)drivenbyhighervolumessoldathigherprices
(In Million Php) 1H 2017 1H 2016 %
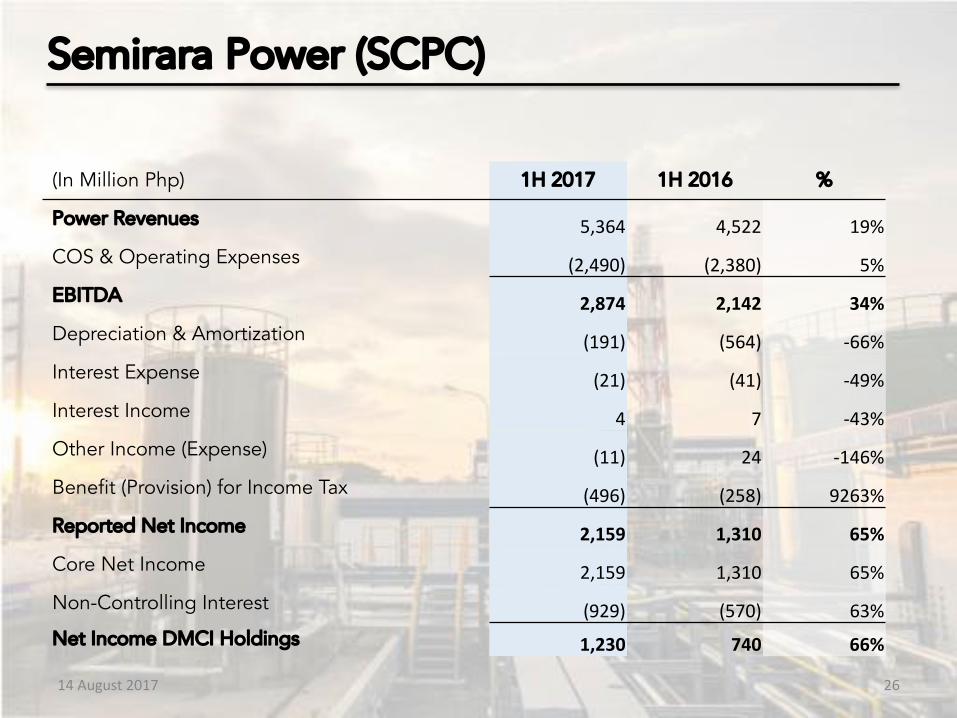
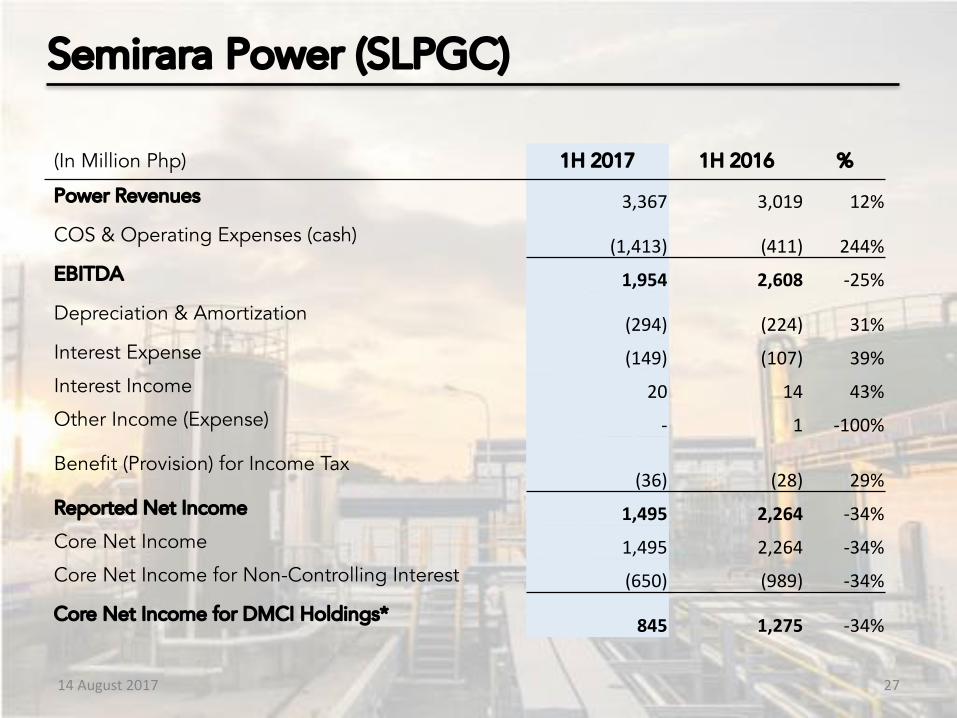
Power Revenues 5,364 4,522 19%COS & Operating Expenses (2,490) (2,380) 5%EBITDA 2,874 2,142 34%Depreciation & Amortization (191) (564) -66%Interest Expense (21) (41) -49%Interest Income 4 7 -43%Other Income (Expense) (11) 24 -146%Benefit (Provision) for Income Tax (496) (258) 9263%Reported Net Income 2,159 1,310 65%Core Net Income 2,159 1,310 65%Non-Controlling Interest (929) (570) 63%Net Income DMCI Holdings 1,230 740 66%
26
Semirara Power (SCPC)
14August2017
(In Million Php) 1H 2017 1H 2016 %
Power Revenues 3,367 3,019 12%
COS & Operating Expenses (cash) (1,413) (411) 244%EBITDA 1,954 2,608 -25%
Depreciation & Amortization (294) (224) 31%Interest Expense (149) (107) 39%Interest Income 20 14 43%Other Income (Expense) - 1 -100%
Benefit (Provision) for Income Tax(36) (28) 29%
Reported Net Income 1,495 2,264 -34%Core Net Income 1,495 2,264 -34%Core Net Income for Non-Controlling Interest (650) (989) -34%
Core Net Income for DMCI Holdings* 845 1,275 -34%
27
Semirara Power (SLPGC)
14August2017