1H 2014 Results Presentation - Astra International | … laporan...Actual results may vary...
27
PT Astra International Tbk 1H 2014 Results Presentation
Transcript of 1H 2014 Results Presentation - Astra International | … laporan...Actual results may vary...

PT Astra International Tbk1H 2014 Results Presentation

This report has been prepared by PT Astra International Tbk independently and is circulated for thepurpose of general information only. It is not intended for the specific person who may receive this report.The information in this report has been obtained from sources which we deem reliable. No warranty(expressed or implied) is made as to the accuracy or completeness of the information. All opinions andestimations included in this report constitute our judgment as of this date and are subject to changewithout prior notice.
We disclaim any responsibility or liability whatsoever arising which may be brought or suffered by anyperson as a result of acting in reliance upon the whole or any part of the contents of this report andneither PT Astra International Tbk and/or its affiliated companies and/or their respective employeesand/or agents accepts liability for any errors, omissions, negligent or otherwise, in this report and anyinaccuracy herein or omission here from which might otherwise arise.
Cautionary note on forward-looking statements: This report may contain statements regarding thebusiness of PT Astra International Tbk and its subsidiaries that are of a forward-looking nature and aretherefore based on management's assumptions about future developments. Forward-looking statementsinvolve certain risks and uncertainties because they relate to future events. Actual results may varymaterially from those targeted, expected or projected due to several factors. Potential risks anduncertainties includes such factors as general economic conditions, foreign exchange fluctuations, interestrate changes, commodity price fluctuations and regulatory developments. The reader and/or listener iscautioned to not unduly rely on these forward-looking statements. We do not undertake any duty topublish any update or revision of any forward-looking statements.
Disclaimer
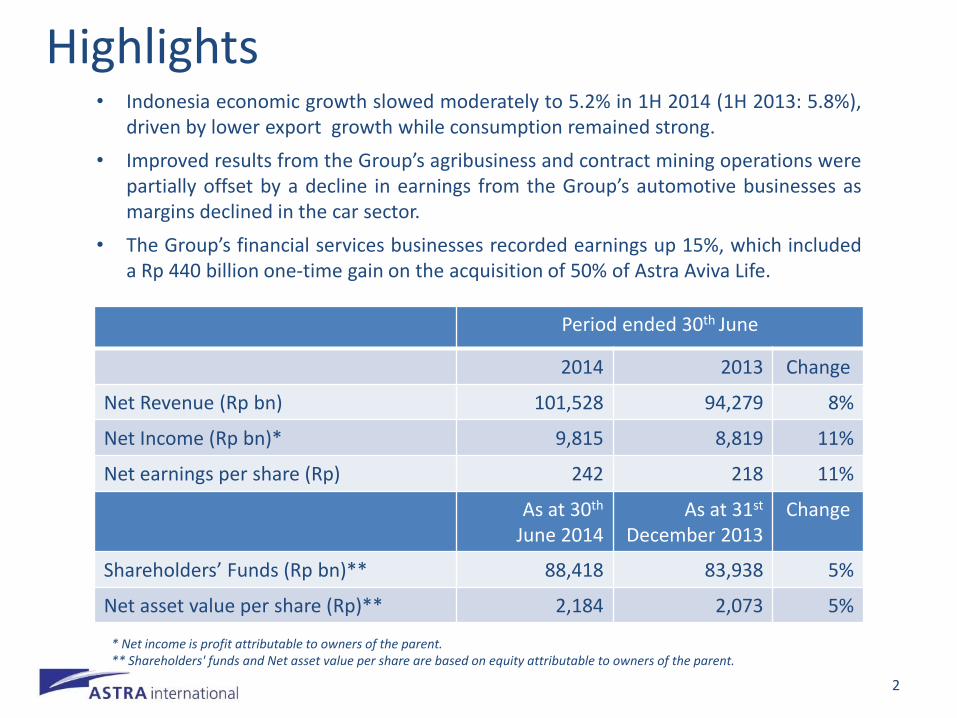
Highlights
2
Period ended 30th June
2014 2013 Change
Net Revenue (Rp bn) 101,528 94,279 8%
Net Income (Rp bn)* 9,815 8,819 11%
Net earnings per share (Rp) 242 218 11%
As at 30th
June 2014As at 31st
December 2013Change
Shareholders’ Funds (Rp bn)** 88,418 83,938 5%
Net asset value per share (Rp)** 2,184 2,073 5%
* Net income is profit attributable to owners of the parent. ** Shareholders' funds and Net asset value per share are based on equity attributable to owners of the parent.
• Indonesia economic growth slowed moderately to 5.2% in 1H 2014 (1H 2013: 5.8%),driven by lower export growth while consumption remained strong.
• Improved results from the Group’s agribusiness and contract mining operations werepartially offset by a decline in earnings from the Group’s automotive businesses asmargins declined in the car sector.
• The Group’s financial services businesses recorded earnings up 15%, which includeda Rp 440 billion one-time gain on the acquisition of 50% of Astra Aviva Life.

Business structure
3
Automotive
Automobile
•Toyota•Daihatsu• Isuzu•BMW•Peugeot•UD Trucks
Motorcycle
Honda
Component
Astra Otoparts
Others
Astraworld
Financial Services
•Astra Credit Companies
•Toyota Astra Finance
Motorcycle
Federal Intl. Finance
Heavy Equipment
Banking
•SAN Finance•Komatsu Astra
Finance
Bank Permata
Insurance
• Asuransi Astra Buana
• Astra Aviva Life
Heavy Equipment & Mining
Construction Machinery
•United Tractors•Traktor
Nusantara
Mining Contractor
PAMA PersadaNusantara
Coal Mining
•PMM• TTA• ABP• BEE• ABB / ABJ• DS / DN• PJU
Agribusiness
Palm Oil
Astra Agro Lestari
Infrastructure,Logistics & Others
Toll Road
•MMS : 72km•MTN : 11km•MHI : 41km
Water Utility
Palyja
Fuel Logistic
Gresik Terminal
InformationTechnology
Document Solution
Astra Graphia
IT Solution
Astra GraphiaInformation Technology
Logistics
•SERA / TRAC•Mobil 88 (used)•SELOG•TFLI
Automobile
Sea Port
Eastkal
Toll Road
•MMS : 72km•MTN : 11km•MHI : 41km
Water Utility
Palyja
Fuel Logistic
Gresik Terminal
Logistics
•SERA / TRAC•Mobil 88 (used)•SELOG•TFLI
Sea Port
Eastkal
Property
•Menara Astra•Anandamaya
Apartment

• Astra’s car market share decreased from 53% to 52%, and Astra’s motorcycle market shareincreased from 60% to 62%.
• Komatsu continue to maintain leading market position with 40% market share.
Market position at 31 June 2014
4
Toyota35%
Daihatsu15%
Isuzu2%
Mitsubishi12%
Suzuki13%
Nissan3%
Honda13%
Others6%
Car
Source : Gaikindo
Honda62%
Yamaha32%
Suzuki4%
Kawasaki2%
Motorcycle
Source : AISI
Source: United Tractors – Internal Market Research
Heavy Equipment
Komatsu 40%
Caterpillar 14%
Hitachi 19%
Kobelco14%
Others13%
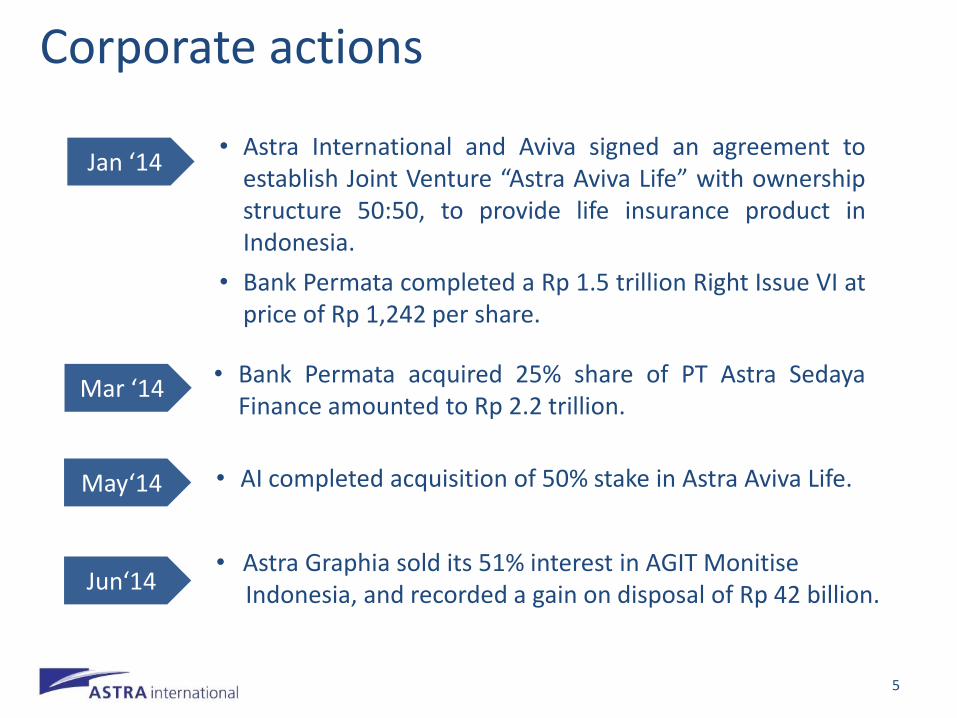
Corporate actions
5
Jan ‘14• Astra International and Aviva signed an agreement to
establish Joint Venture “Astra Aviva Life” with ownershipstructure 50:50, to provide life insurance product inIndonesia.
• Bank Permata completed a Rp 1.5 trillion Right Issue VI atprice of Rp 1,242 per share.
• Bank Permata acquired 25% share of PT Astra SedayaFinance amounted to Rp 2.2 trillion.
Mar ‘14
May‘14 • AI completed acquisition of 50% stake in Astra Aviva Life.
Jun‘14• Astra Graphia sold its 51% interest in AGIT Monitise
Indonesia, and recorded a gain on disposal of Rp 42 billion.

Financial Performance

Consolidated income statement
7
In Billion Rupiah 1H14 1H13 Change
USD / IDR, average 11,729 9,756 20%
Revenue 101,528 94,279 8%
Gross Profit 19,144 16,568 16%
Operating Expenses (9,224) (8,673) 6%
Other Income 1,413 1,292 9%
Equity Income 3,329 3,067 9%
Income Tax Expense (2,841) (2,125) 34%
Non-controlling interest (2,006) (1,310) 53%
Net Income 9,815 8,819 11%
“The Group’s businesses produced mixed results in the first half, despite generally strongoperating volumes. While the outlook for the remainder of the year is for a satisfactoryoperating performance, it is expected that there will continue to be heightenedcompetition in the car market and a subdued outlook for coal prices.”
- Prijono Sugiarto, President Director

Ownership %
Share of NI %
1H14 1H13
Auto Non-Auto Auto Non-Auto
4W AutomotiveSO – Toyota, Daihatsu, IsuzuToyota Astra MotorAstra Daihatsu MotorIsuzu Astra Motor Indonesia
100513245
23 28
2W AutomotiveAstra Honda MotorHonda SO
50100
16 17
ComponentAstra Otoparts 80 3 6
Financial ServicesAstra Sedaya FinanceFederal International FinanceToyota Astra Financial ServicesKomatsu Astra FinanceSAN FinanceAsuransi Astra BuanaPermata BankAstra Aviva Life
75100505060964550
16 9 19 5
Heavy Equipment & MiningUnited TractorsPamapersada Nusantara
6060
20 16
AgribusinessAstra Agro Lestari 80 11 7
Infrastructure, Logistics, ITSERAPalyjaMarga MandalasaktiAstra Graphia
100497977
2 2
8
2001 2012 2013 1H14
Auto (Incl. auto related Financial Services) 89% 64% 68% 58%
Non-Auto 11% 36% 32% 42%
Astra portfolio as at 30 June 2014
Increased Net Income contribution from Non-Auto segment, driven by Agribusinessand Heavy Equipment and Mining:

• Astra’s net asset value of Rp 2,184 per share at 30th June 2014 was 5% higher than at the end of 2013.
• Net debt at 30th June 2014, exclusive of the Group’s financial services subsidiaries, was Rp 4.2 trillion, compared to net debt of Rp 3.7 trillion at the end of 2013, a 14% increase.
Consolidated balance sheet
9
In Billion Rupiah 30-Jun-14 31-Dec-13 Change
Cash and Cash Equivalents 17,160 18,557 (8%)
Trade Receivables 22,947 19,843 16%
Inventories 18,708 14,433 30%
Financing Receivables 57,265 54,677 5%
Investment in Jointly Controlled Entities and Associates 25,144 23,870 5%
Fixed Assets 39,017 37,862 3%
Other Assets 46,888 44,752 5%
Total Assets 227,129 213,994 6%
Short-term Borrowings 12,022 12,854 (6%)
Trade Payables 20,681 17,275 20%
Long-term Debt 51,456 51,669 (0%)
Other Liabilities 30,177 26,008 16%
Total Liabilities 114,336 107,806 6%
Equity Attributable to Owners of The Parent 88,418 83,938 5%
Non – controlling Interest 24,375 22,250 10%
Total Equity 112,793 106,188 6%
Net Debt (46,318) (45,966) 1%
Net Debt (Excl. Financial Services) (4,219) (3,687) 14%
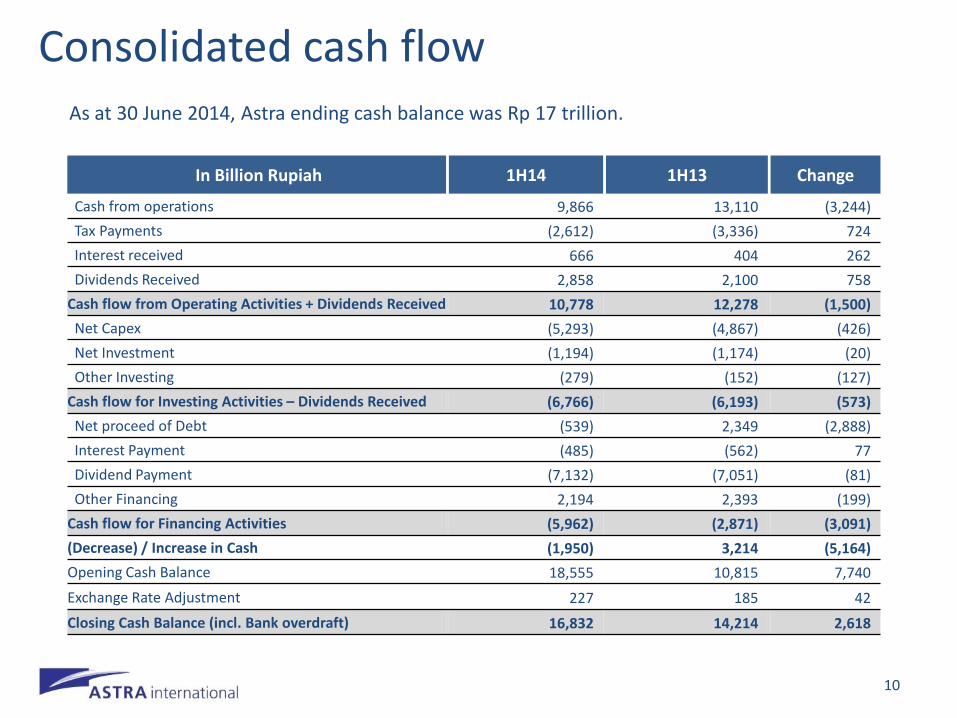
Consolidated cash flow
10
In Billion Rupiah 1H14 1H13 Change
Cash from operations 9,866 13,110 (3,244)
Tax Payments (2,612) (3,336) 724
Interest received 666 404 262
Dividends Received 2,858 2,100 758
Cash flow from Operating Activities + Dividends Received 10,778 12,278 (1,500)
Net Capex (5,293) (4,867) (426)
Net Investment (1,194) (1,174) (20)
Other Investing (279) (152) (127)
Cash flow for Investing Activities – Dividends Received (6,766) (6,193) (573)
Net proceed of Debt (539) 2,349 (2,888)
Interest Payment (485) (562) 77
Dividend Payment (7,132) (7,051) (81)
Other Financing 2,194 2,393 (199)
Cash flow for Financing Activities (5,962) (2,871) (3,091)
(Decrease) / Increase in Cash (1,950) 3,214 (5,164)
Opening Cash Balance 18,555 10,815 7,740
Exchange Rate Adjustment 227 185 42
Closing Cash Balance (incl. Bank overdraft) 16,832 14,214 2,618
As at 30 June 2014, Astra ending cash balance was Rp 17 trillion.

Business Updates
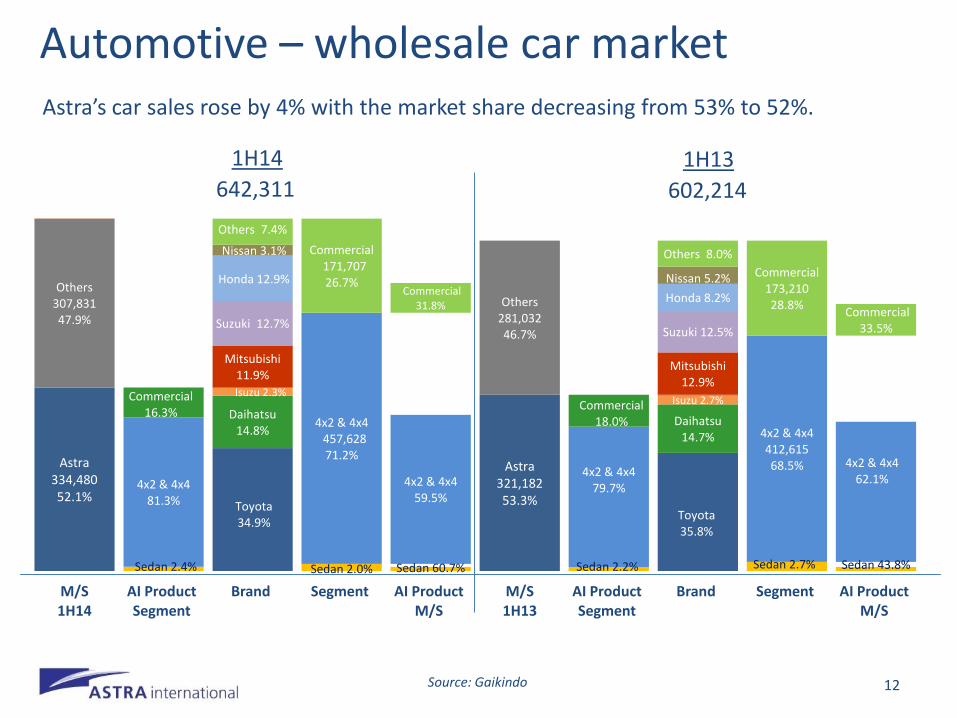
Astra 334,48052.1%
Astra 321,18253.3%
Others 307,83147.9%
Others281,03246.7%
4x2 & 4x481.3%
4x2 & 4x479.7%
Commercial16.3%
Commercial 18.0%
Toyota34.9%
Toyota35.8%
Daihatsu14.8%
Daihatsu 14.7%
Isuzu 2.3%Isuzu 2.7%
Mitsubishi11.9%
Mitsubishi12.9%
Suzuki 12.7%Suzuki 12.5%
Honda 12.9%
Honda 8.2%
Nissan 3.1%
Nissan 5.2%
Others 7.4%
Others 8.0%
Sedan 2.0% Sedan 2.7%
4x2 & 4x4457,62871.2%
4x2 & 4x4412,61568.5%
Commercial171,70726.7%
Commercial173,21028.8%
Sedan 60.7% Sedan 43.8%
4x2 & 4x459.5%
4x2 & 4x462.1%
Commercial 31.8%
Commercial33.5%
M/S1H14
AI Product Segment
Brand Segment AI Product M/S
M/S1H13
AI Product Segment
Brand Segment AI Product M/S
Sedan 2.4% Sedan 2.2%
Source: Gaikindo
Automotive – wholesale car market
12
1H14 1H13
Astra’s car sales rose by 4% with the market share decreasing from 53% to 52%.
602,214642,311
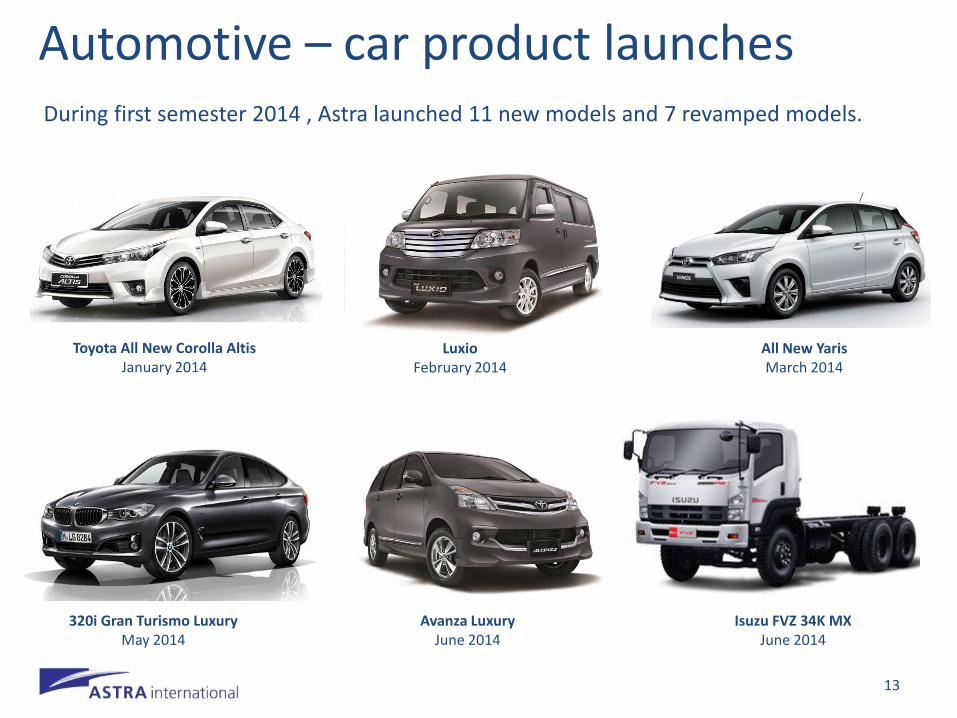
Automotive – car product launchesDuring first semester 2014 , Astra launched 11 new models and 7 revamped models.
13
Isuzu FVZ 34K MXJune 2014
LuxioFebruary 2014
Avanza LuxuryJune 2014
Toyota All New Corolla AltisJanuary 2014
320i Gran Turismo LuxuryMay 2014
All New YarisMarch 2014

Honda, 2,623,175
62.4%
Honda, 2,364,297
60.3%
Yamaha,1,329,967
31.6 % Yamaha, 1,277,781
32.6%
Suzuki,4.0%
Suzuki, 5.3%
Others, 2.0%
Others, 1.9%
Cub512,34419.5%
Cub466,99519.8%
Scooter1,876,415
71.5%
Scooter1,717,700
72.7%
Sport/Others8.9% Sport/Others
7.6%
Cub512,34463.4%
Cub225,66859.5%
Scooter1,876,415
69.2%
Scooter1,717,700
68.7%
Sport/Others34.3 % Sport/Others
28.0%
Cub807,73219.2%
Cub784,76020.0%
Scooter2,710,555
64.5%
Scooter2,498,641
63.7%
Sport & Others 16.3%
Sport & Others 16.3%
Brand1H14
Honda Segment Honda Product M/S
Segment Brand1H13
Honda Segment Honda Product M/S
Segment
Automotive – wholesale motorcycle market
Source: AISI
1H14 1H13
Astra Honda Motor’s sales increased by 11%, with it’s market share increasing from 60%to 62%.
14
4,202,296 3,923,6957%

Automotive – motorcycle product launches
15
During first semester of 2014, Astra Honda Motor launched 11 revamped models.
Honda CBR 250 RMay 2014
Honda Vario PGM-FIMarch 2014
Honda Mega Pro PGM-FIJanuary 2014
Honda Supra-X 125 PGM-FIFebruary 2014
Honda Beat-FI
May 2014Honda Spacy-FI
June 2014

OEM, 48%After
Market, 45%
Export, 7%
211140
243 371
Equity Income Consolidated
54%52%
37%
40%
9%
8%
Export After Market OEM
Automotive - components
16
Net Income (IDR billion)
Astra Otoparts, the Group’s 80%-held component business, saw higher sales volumes although net income fell by 11% to Rp 454 billion on lower manufacturing margins.
454
511
Revenue (IDR billion)
6,227
26% 11%
1H14 1H13 1H14 1H13
4,961
OEM, 65%,
After Market,
29%,
Export, 6%

Amount Financed (Rp bio) 1H14 1H13 %
Auto
ACC 13,934 13,056 7
TAFS 4,877 4,883 0
Total 4W 18,811 17,939 5
FIF 12,092 9,878 22
Total Auto 30,903 27,817 11
HE
SANF 1,379 1,663 (17)
KAF 591 904 (35)
Total HE 1,970 2,567 (23)
Financial services
17
• 1H14 consolidated net income decreased by
2% to Rp 800 billion
• Loan book grew by 19% to Rp 128 trillion
• LDR 92% & CAR 14%
• Gross-NPL ratio was up from 1.2% to 1.5%
Asuransi Astra Buana
• 1H14 Gross Written Premium up by 9% year on year to Rp 2 trillion
• RBC : 149%, requirement 120%
Bank Permata
Net income from the Group’s financial services businesses increased by 15% to Rp 2.5 trillion, driven bythe strong growth from FIF and one-time gain from the acquisition of a 50% stake in Astra Aviva Life.
Unit Financed 1H14 1H13 %
Auto
ACC (new & used cars) 108,030 95,047 14
TAFS 32,548 32,124 1
Total 4W 140,578 127,171 11
FIF (Incl.Electronics) 1,434K 1,234K 16
HE
SANF 991 1,479 (33)
KAF 95 199 (52)
Total HE 1,086 1,678 (35)
* Incl. Joint Financing

59.9 50.1
Coal Production (mn tonnes)
1,742
818
1,690
1,459
3,432
2,277
PMM & Asmin TTA & DN (all in thousand tonnes)
8,441 8,484
16,203 14,436
2,8891,981
Construction Machinery Mining Contracting Mining
794 1,177
309 196
618 564
486 515
Mining Forestry Construction Agro
United Tractors, 59.5%-owned, reported a 42% improvement in net income to Rp 3.3 trillion, drivenby strong performance from its mining contracting business.
Mining Contracting
Coal Mines: Reserves and SalesKomatsu Unit Sales
2,452
Revenue (Rp bio)
1H14 1H13 1H14 1H13
Heavy equipment & mining
18
2,207 Est. Combined Coal Reserves (Mio Tons)*
TTA 30
PMM 3
ABP 9
ABB/ABJ 101
DS/DN 45
BEE 177
PJU 45
Total 409
27,533
1H14 1H13 1H14 1H13
24,901
401.3 415.6
Overburden Removal (mn bcm)
11%Coal Prod: 20%
OB Removal:
3%
51%10%
* As at 2013 year end
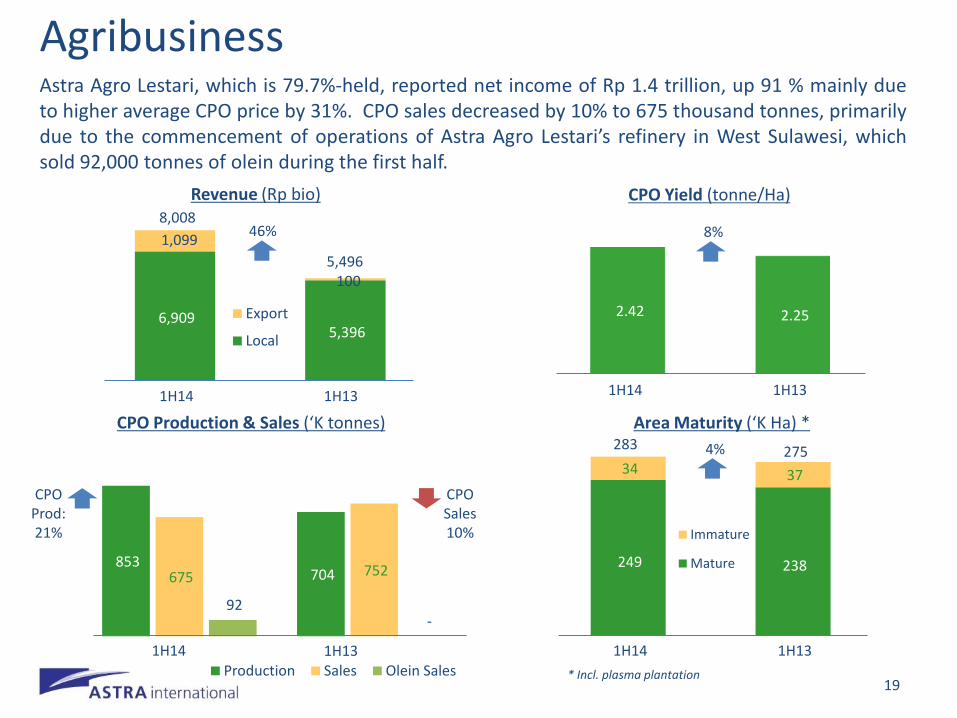
2.42 2.25
249 238
34 37
Immature
Mature
6,909 5,396
1,099
100
Export
Local
Area Maturity (‘K Ha) *
Revenue (Rp bio)
CPO Production & Sales (‘K tonnes)
275283
Astra Agro Lestari, which is 79.7%-held, reported net income of Rp 1.4 trillion, up 91 % mainly dueto higher average CPO price by 31%. CPO sales decreased by 10% to 675 thousand tonnes, primarilydue to the commencement of operations of Astra Agro Lestari’s refinery in West Sulawesi, whichsold 92,000 tonnes of olein during the first half.
* Incl. plasma plantation
CPO Yield (tonne/Ha)
Agribusiness
19
8,008
5,496
853 704 675 752
92 -
Production Sales Olein Sales
1H14 1H13 1H14 1H13
1H14 1H13
46% 8%
CPO Prod: 21%
CPO Sales 10%
1H14 1H13
4%
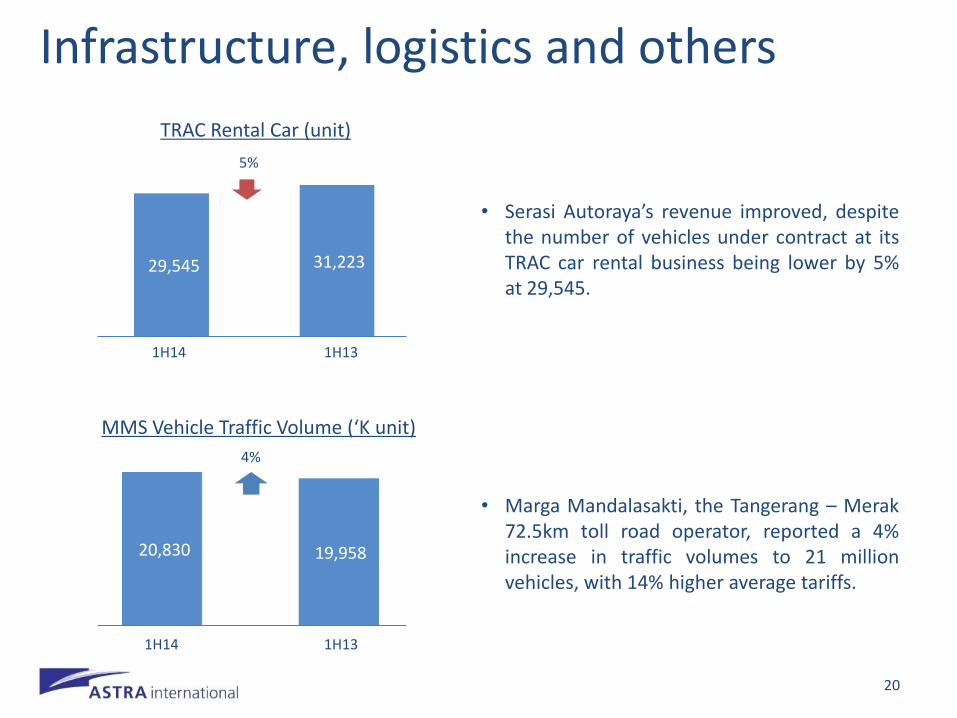
29,545 31,223
Infrastructure, logistics and others
20
• Marga Mandalasakti, the Tangerang – Merak72.5km toll road operator, reported a 4%increase in traffic volumes to 21 millionvehicles, with 14% higher average tariffs.
TRAC Rental Car (unit)
20,830 19,958
MMS Vehicle Traffic Volume (‘K unit)
1H14 1H13
1H14 1H13
• Serasi Autoraya’s revenue improved, despitethe number of vehicles under contract at itsTRAC car rental business being lower by 5%at 29,545.
5%
4%

Appendices

Divisional Revenue
Divisional revenue and net income
22
In Billion Rupiah 1H14 1H13 % Chg
Automotive 54,188 53,208 2%
Financial Services 7,489 6,707 12%
Heavy Equipment 27,458 24,864 10%
Agribusiness 8,008 5,495 46%
Infrastructure, Logistics & Others 3,556 3,105 15%
Information Technology 829 900 (8%)
Total 101,528 94,279 8%
Divisional Net Income
In Billion Rupiah 1H14 1H13 % Chg
Automotive 4,003 4,413 (9%)
Financial Services 2,478 2,147 15%
Heavy Equipment 1,988 1,410 41%
Agribusiness 1,091 571 91%
Infrastructure, Logistics & Others 171 223 (23%)
Information Technology 84 55 53%
Total 9,815 8,819 11%

Car products launched in 1H14
23
Models Launched Launching Time Engine Capacity Prices (IDR mn)
Car
Toyota All New Altis Jan’14 1,800cc 375 – 410
BMW 520d Modern Jan’14 2,000cc 838*
BMW 520i Modern Jan’14 2,000cc 858*
BMW 528i Luxury Jan’14 2,000cc 998*
BMW 535i M Sport Jan’14 3,000cc 1,298*
Isuzu Giga FVZ Long Wheel Base Feb’14 7,800cc 798
Daihatsu Luxio Feb’14 1,500cc 157.4 – 182.6
Toyota All New Yaris Mar’14 1,500cc 219.2 – 256.1
BMW M235i Mar’14 3,000cc 928*
BMW X5 xDrive 35i M Sport Apr’14 3,000cc 1,348*
BMW 320i Gran Turismo Luxury May’14 2,000cc 859*
BMW 428i Convertible Sport May’14 2,000cc 1,088*
BMW 428i Gran Coupe M Sport May’14 2,000cc 968*
Toyota Nav - 1 May’14 2,000cc 386.7-412.5
BMW M3 Jun’14 3,000cc 1,699*
BMW M4 Coupe Jun’14 3,000cc 1,799*
Isuzu Giga FVZ 34K MX Jun’14 7,800cc 820
Toyota Avanza Luxury Jun’14 1,300cc – 1,500cc 184.6-191.6
*Off the road

Motorcycle products launched in 1H14
24
Models Launched Launching Time Engine Capacity Prices (IDR mn)
Motorcycle
Honda Revo Series FI Jan’14 110cc 12.7 – 14.1
Honda Mega Pro FI Jan’14 150cc 20.5
Honda Supra – X 125 FI Feb’14 125cc 15.4 – 16.4
Honda Verza Feb’14 150cc 17.1 – 17.9
Honda Blade 125 FI Mar’14 125cc 15.4 – 16.1
Honda Vario FI Mar’14 110cc 15.2
Honda Vario Techno 125 FI Mar’14 125cc 16.1 – 16.8
Honda BeAT FI May’14 110cc 12.9 – 14.3
Honda CBR 250 R May’14 250cc 53.7 – 55.2
Honda Scoopy FI May’14 110cc 15.2
Honda Spacy FI Jun’14 110cc 13.4

25
1H14 1H13Major Brands
Wholesale Astra Wholesale Astra
Car
Sedan 12,976 60.7% 16,389 43.8%Toyota - Vios/Limo, Altis, Camry; Honda - City, Civic,Accord; Mercedes - E Series, C Series
4X2 & 4X4 457,628 59.5% 412,615 62.1%
Toyota - Avanza, Innova, Rush, AgyaDaihatsu - Xenia, Terios, Ayla; Nissan - Grand Livina,March, Evalia; Suzuki - Ertiga, APV, Splash; Honda –Mobilio, CR-V, Jazz, Freed; Mitsubishi – PajeroSport, Mirage, Outlander Sport
Pick Up/ Trucks/ Bus 165,846 31.2% 165,581 33.3%Mitsubishi – Canter, L-300, Strada; Daihatsu – Gran Max; Suzuki – Carry, APV; Isuzu – Elf, Panther, Giga; Toyota – Dyna ,Hi-Lux, Hi-Ace
Double Cabin 5,861 47.7% 7,629 37.2%Toyota – Hilux; Mitsubishi – Strada; Ford – Ranger; Isuzu – D-Max
Total 642,311 52.1% 602,214 53.3%
Mo
torc
ycle
Cub 807,732 63.4% 784,760 59.5%Honda - Supra X 125, Revo Series, Blade; Yamaha -Jupiter MX, Vega RR, Jupiter Z; Suzuki – SmashTitan, Shooter, Shogun Axello 125
Scooter 2,710,555 69.2% 2,498,641 68.7%Honda - BeAT, Vario, Scoopy; Yamaha - Mio, Xeon, X-Ride; Suzuki – Nex, Hayate, Let’s
Sport & Others 684,009 34.3% 640,294 28.0%Yamaha - V-ixion, Byson, Scorpio Z; Honda - CB 150 R, Verza, New Mega Pro; Suzuki - Satria F 150, Thunder 125
Total 4,202,296 62.4% 3,923,695 60.3%
Source: Gaikindo & AISI
National market data (summary)

For further information please contact:
Investor Relations of PT Astra International Tbk - Attn:
Iwan Hadiantoro / Tira Ardianti / Christian
P: (+62 21) 652 2555
F: (+62 21) 6530 4953
E: [email protected] / [email protected] / [email protected]
26