1H 2014 Results
28
1 Financial Results 1H 2014
-
Upload
magnit-ir-team -
Category
Investor Relations
-
view
91 -
download
0
Transcript of 1H 2014 Results
1
Financial Results
1H 2014
Magnit at a Glance
Magnit at a Glance
As of 30.06.2014 Source: Company, Bloomberg, IFRS accounts for 1H2014 2
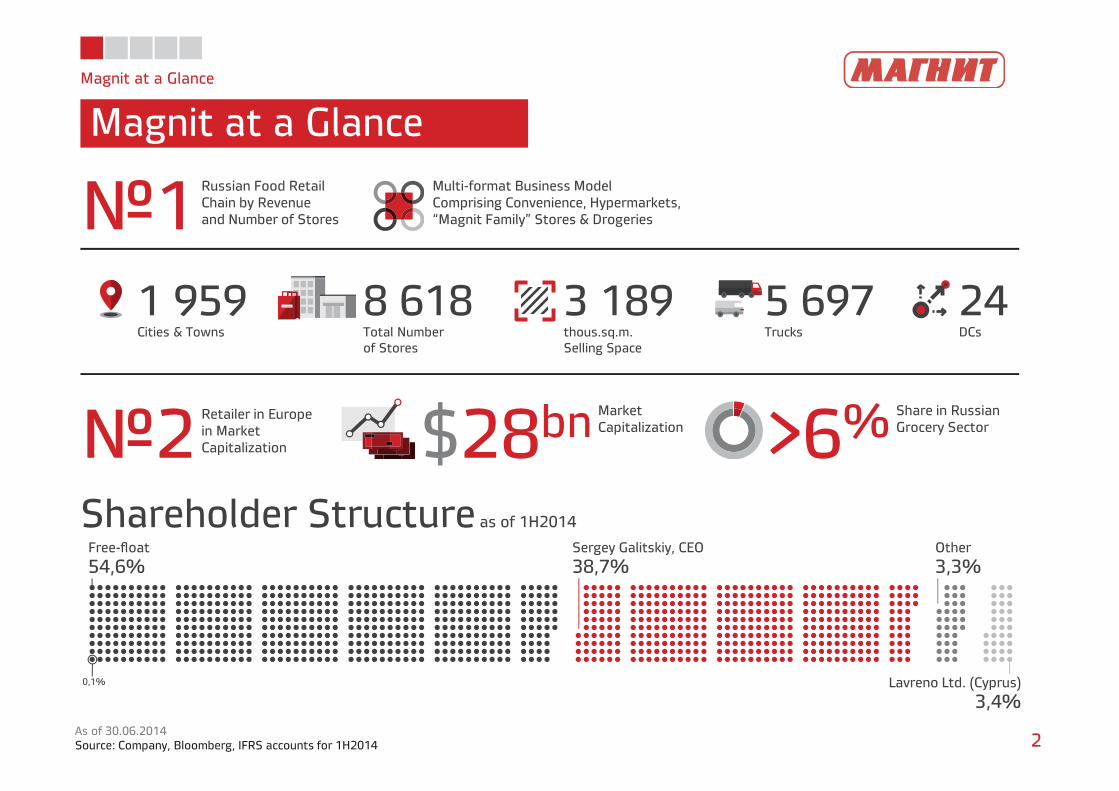
1 959Cities & Towns
№1Russian Food RetailChain by Revenueand Number of Stores
8 618Total Numberof Stores
3 189thous.sq.m.Selling Space
24DCs
5 697Trucks
Multi-format Business ModelComprising Convenience, Hypermarkets,“Magnit Family” Stores & Drogeries
№2Retailer in Europein MarketCapitalization $28bn Market
Capitalization >6% Share in RussianGrocery Sector
Shareholder Structure as of 1H2014
54,6%Free-float
38,7%Sergey Galitskiy, CEO
3,3%Other
3,4%Lavreno Ltd. (Cyprus)0,1%
Magnit at a Glance
Key Metrics
3*As of FY2013Source: IFRS accounts for 1H2014, Company’s Estimates
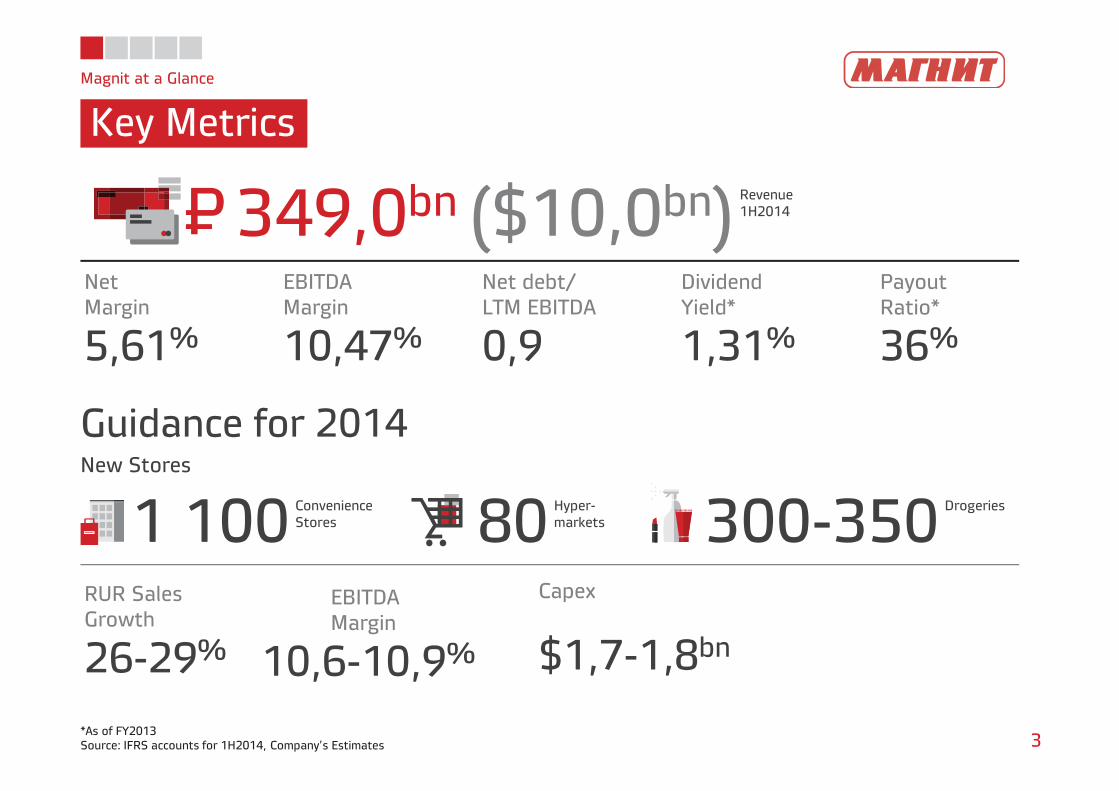
Guidance for 2014New Stores
349,0bn ($10,0bn) Revenue1H2014
5,61%
NetMargin
10,47%
EBITDAMargin
0,9
Net debt/LTM EBITDA
1,31%
DividendYield*
36%
PayoutRatio*
1 100 ConvenienceStores 80 Hyper-
markets 300-350 Drogeries
26-29%
RUR SalesGrowth
10,6-10,9%
EBITDAMargin
$1,7-1,8bn
Capex
P=
Magnit at a Glance
Strategy
4
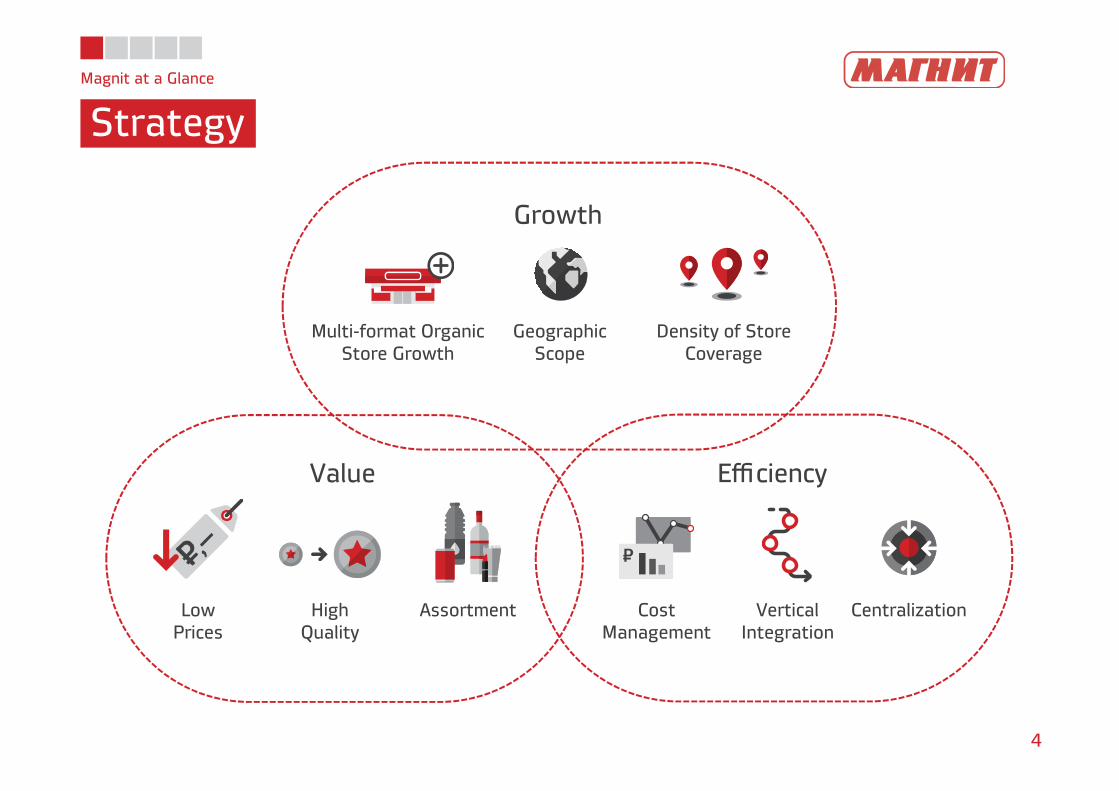
Growth
Value Efficiency
Multi-format OrganicStore Growth
GeographicScope
Density of StoreCoverage
LowPrices
HighQuality
Assortment CostManagement
VerticalIntegration
Centralization
47
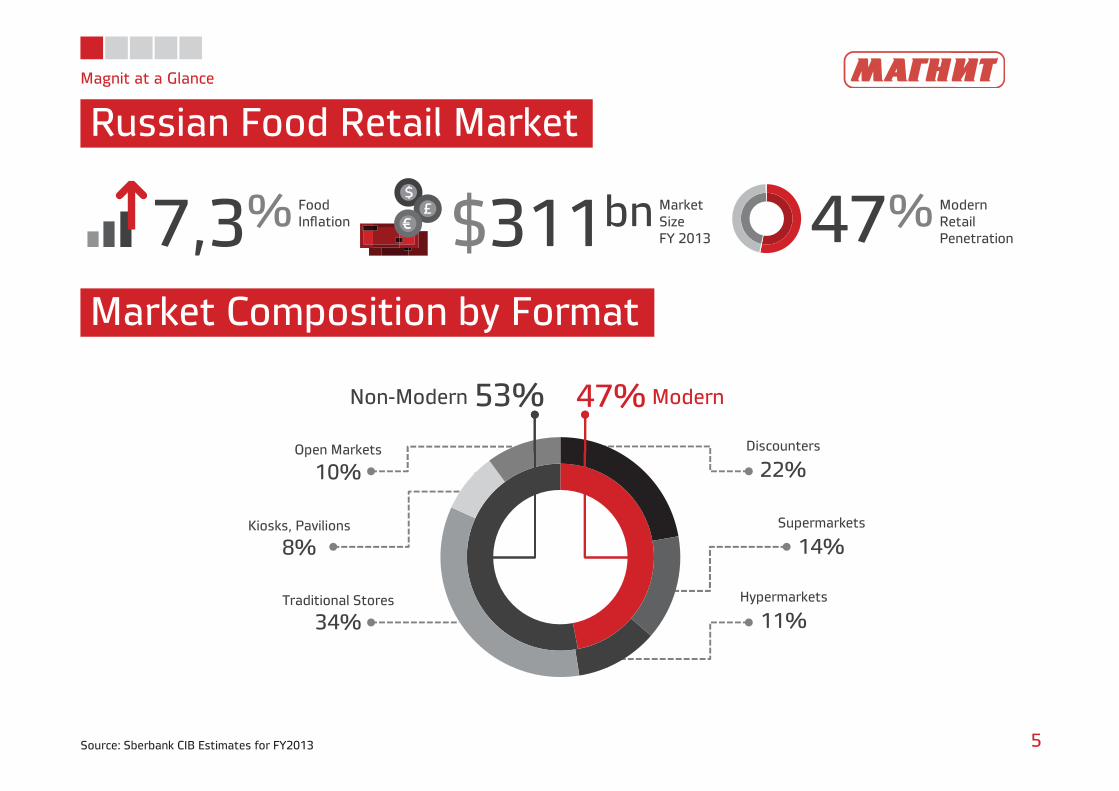
47%53%Discounters
22%
Supermarkets
14%
Hypermarkets
11%Traditional Stores
34%
Kiosks, Pavilions
8%
Open Markets
10%
Magnit at a Glance
Russian Food Retail Market
5
Market Composition by Format
7,3% FoodInflation $311bn Market
SizeFY 2013
% ModernRetailPenetration
Non-Modern Modern
Source: Sberbank CIB Estimates for FY2013
Magnit at a Glance
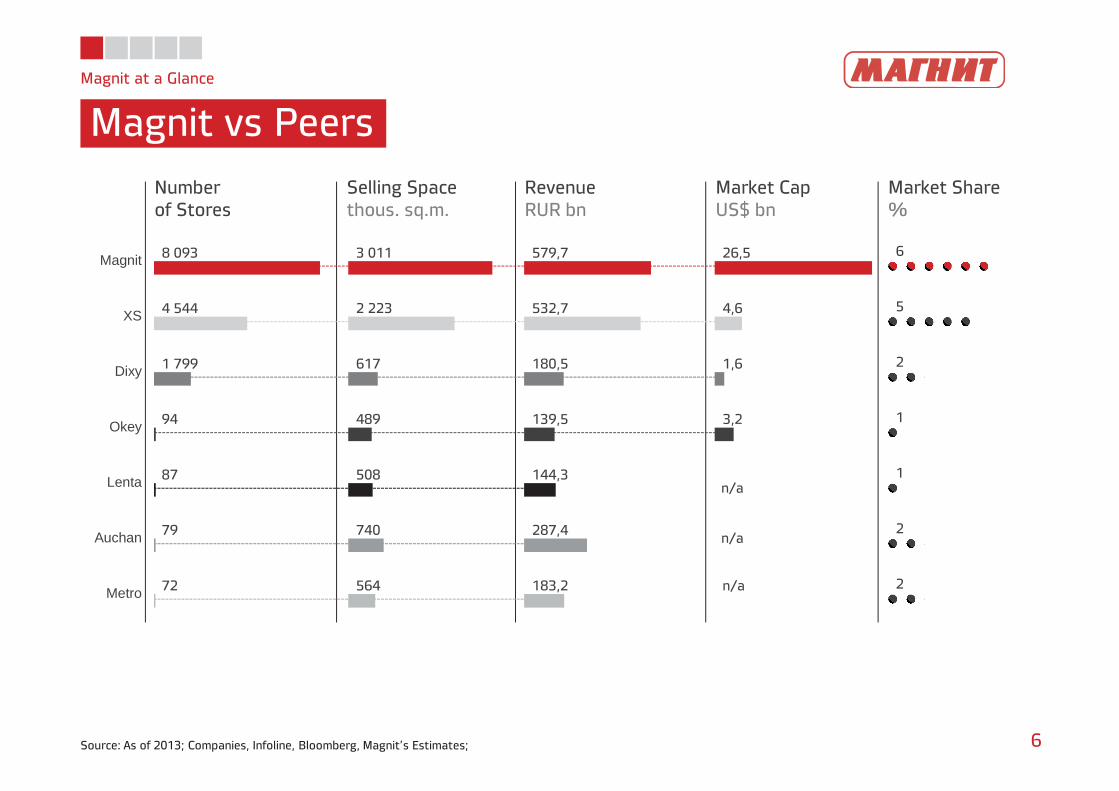
Magnit vs Peers
6Source: As of 2013; Companies, Infoline, Bloomberg, Magnit’s Estimates;
Numberof Stores
Selling Spacethous. sq.m.
RevenueRUR bn
Market CapUS$ bn
Market Share%
8 093
4 544
1 799
94
87
79
72
Magnit
XS
Dixy
Okey
Lenta
Auchan
Metro
3 011
2 223
617
489
508
740
564
579,7
532,7
180,5
139,5
144,3
287,4
183,2
26,5
4,6
1,6
3,2
n/a
n/a
n/a
6
5
2
1
1
2
2
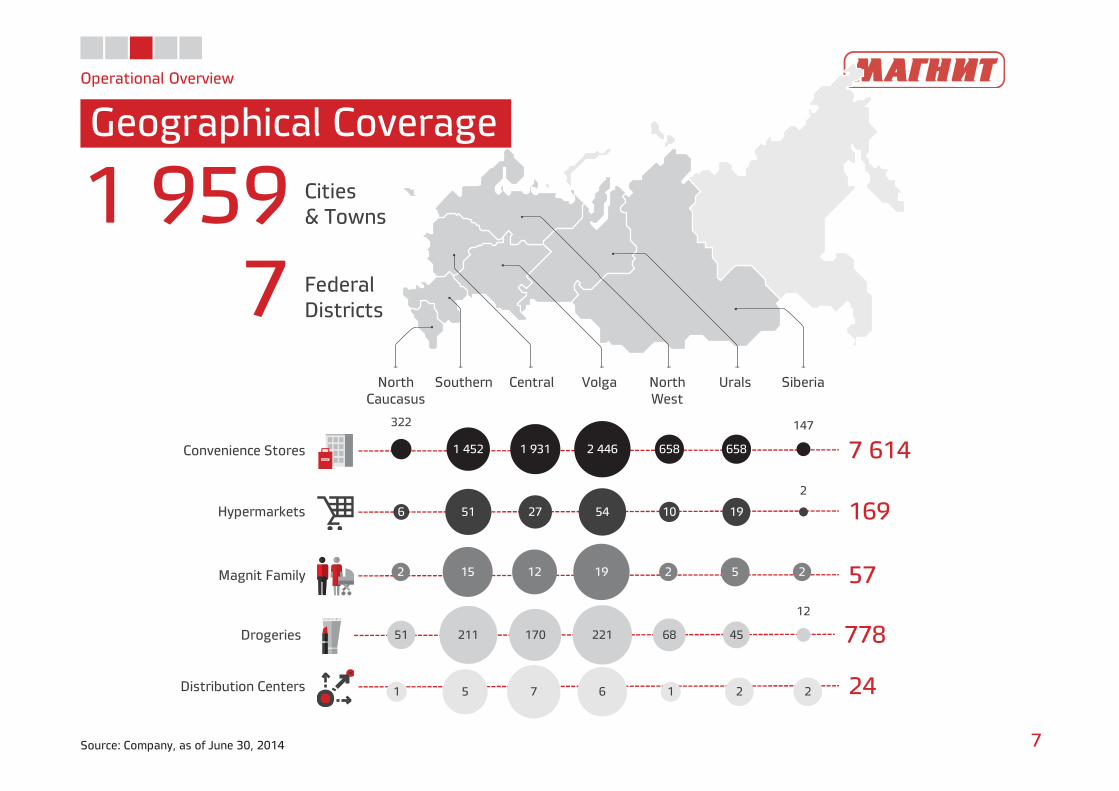
778Drogeries
7 614Convenience Stores
169Hypermarkets
57Magnit Family
24Distribution Centers 1 5 7 6 1 2 2
51 211 170 221 68 45
12
2 15 12 19 2 5 2
6 51 27 54 10 19
2
322
1 452 1 931 2 446 658 658
147
Operational Overview
Geographical Coverage
7Source: Company, as of June 30, 2014
1 959 Cities& Towns
7 FederalDistricts
North Caucasus
Southern Volga North West
Urals SiberiaCentral
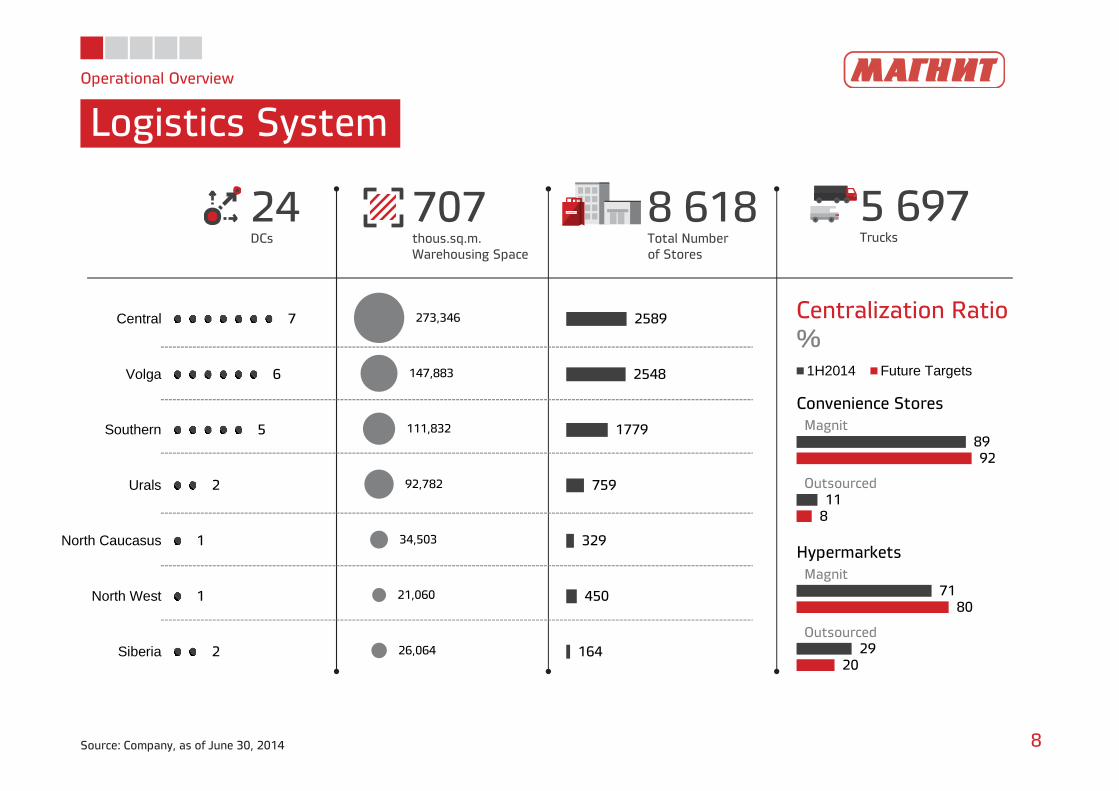
Operational Overview
Logistics System
8Source: Company, as of June 30, 2014
8 618Total Numberof Stores
707thous.sq.m.Warehousing Space
24DCs
5 697Trucks
7
6
5
2
1
1
2
Central
Volga
Southern
Urals
North Caucasus
North West
Siberia
2589
2548
1779
759
329
450
164
273,346
147,883
111,832
92,782
34,503
21,060
26,064
Centralization Ratio%
Magnit
Outsourced
89
11
92
8
Convenience Stores
1H2014 Future Targets
Magnit
Outsourced
71
29
80
20
Hypermarkets
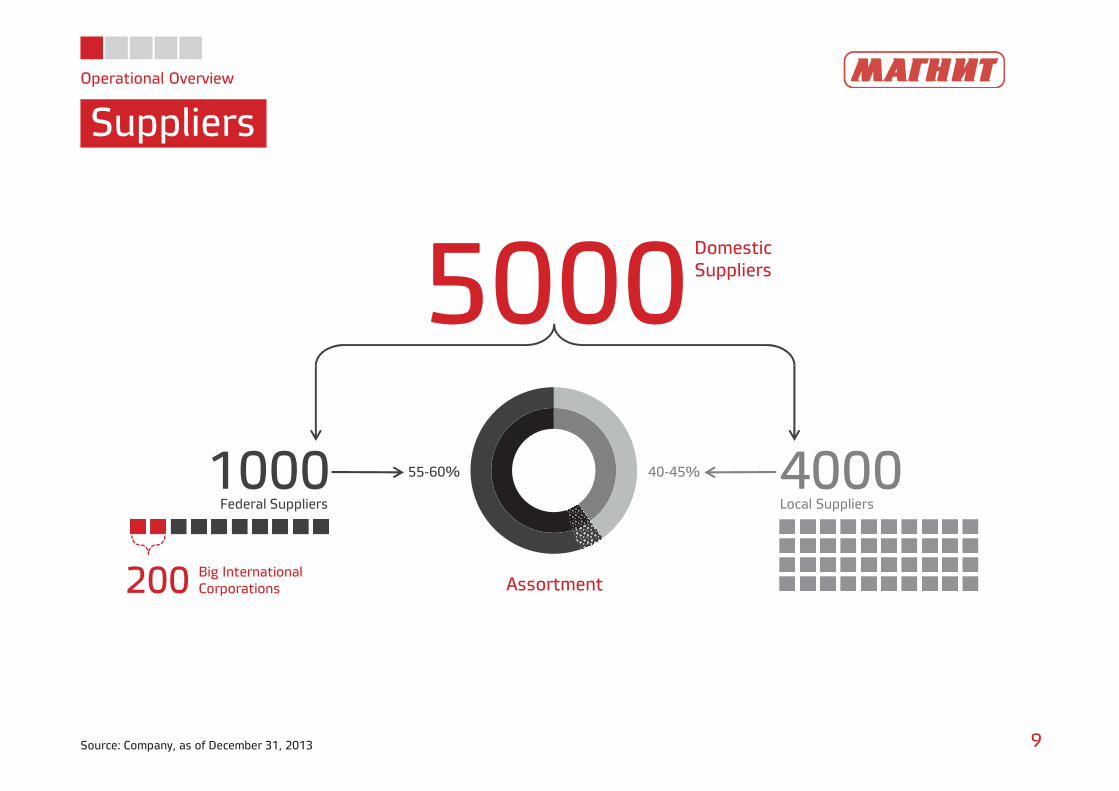
Operational Overview
Suppliers
9Source: Company, as of December 31, 2013
5000DomesticSuppliers
4000Local Suppliers
1000Federal Suppliers
Assortment
55-60% 40-45%
200 Big InternationalCorporations
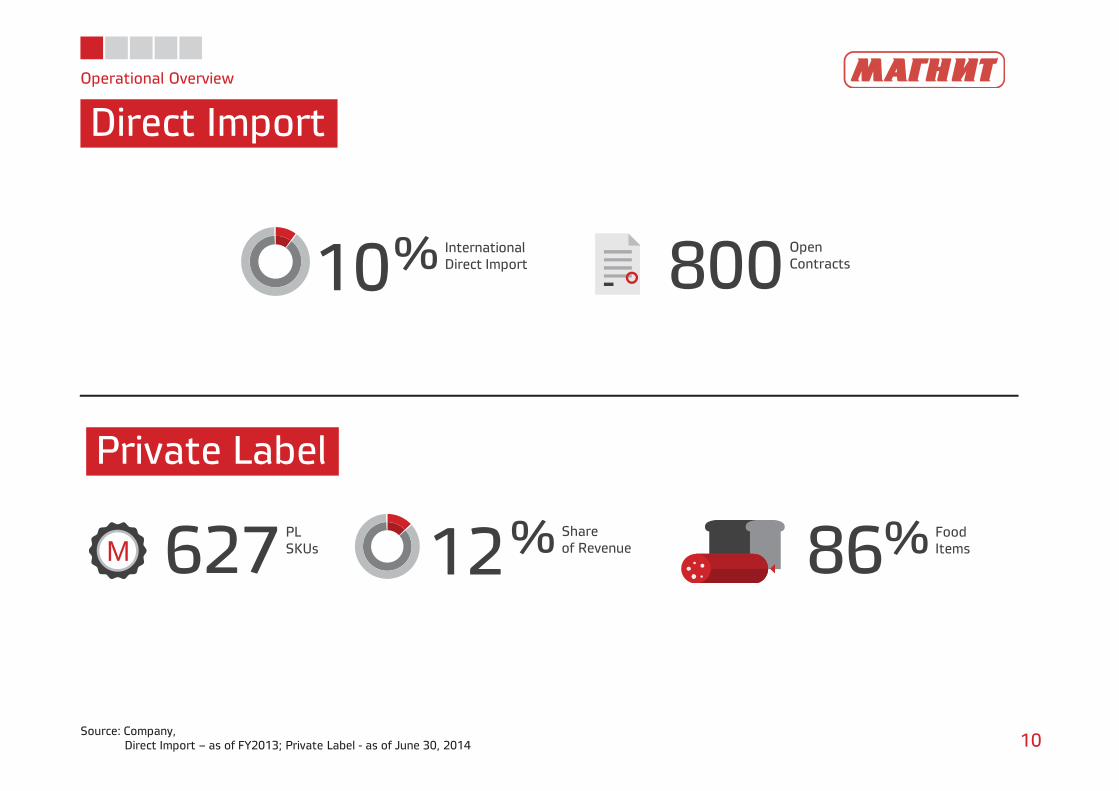
Operational Overview
Direct Import
10Source: Company,
Direct Import – as of FY2013; Private Label - as of June 30, 2014
12% Shareof Revenue627 PL
SKUsM 86% FoodItems
Private Label
10% InternationalDirect Import 800 Open
Contracts
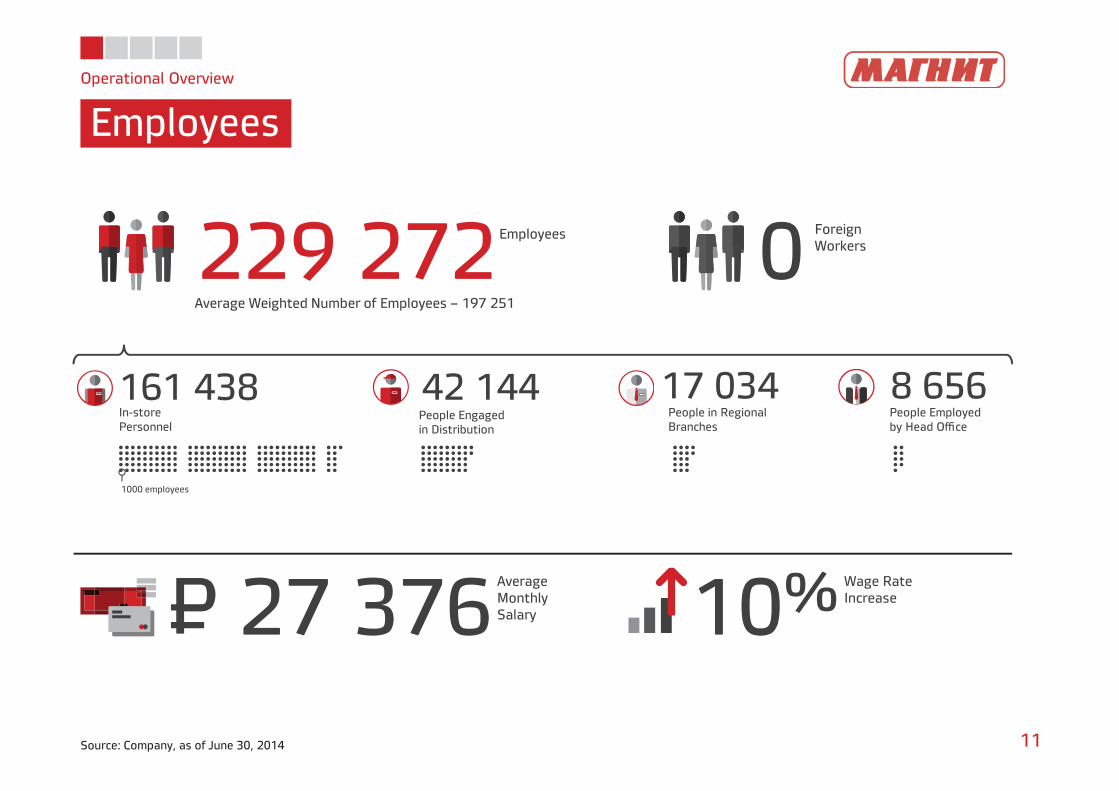
Operational Overview
Employees
11Source: Company, as of June 30, 2014
229 272 Employees 0ForeignWorkers
27 376AverageMonthlySalary 10% Wage Rate
IncreaseP=
161 438In-storePersonnel
42 144People Engagedin Distribution
17 034People in RegionalBranches
8 656People Employedby Head Office
1000 employees
Average Weighted Number of Employees – 197 251
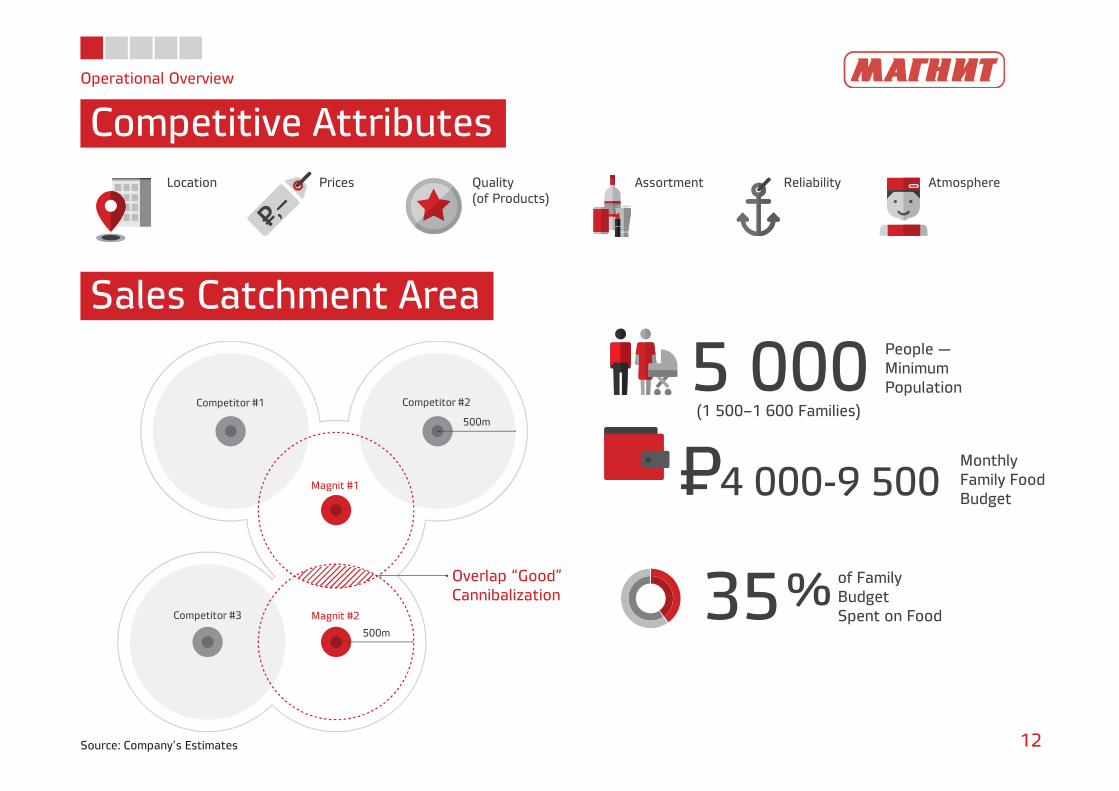
Operational Overview
Competitive Attributes
12
35% of FamilyBudgetSpent on Food
Location Quality(of Products)
Assortment Reliability AtmospherePrices
5 000 People —MinimumPopulation
(1 500–1 600 Families)
4 000-9 500MonthlyFamily FoodBudget
P=Overlap “Good”Cannibalization
Magnit #1
Magnit #2
500m
Competitor #1 Competitor #2
Competitor #3
500m
Sales Catchment Area
Source: Company’s Estimates
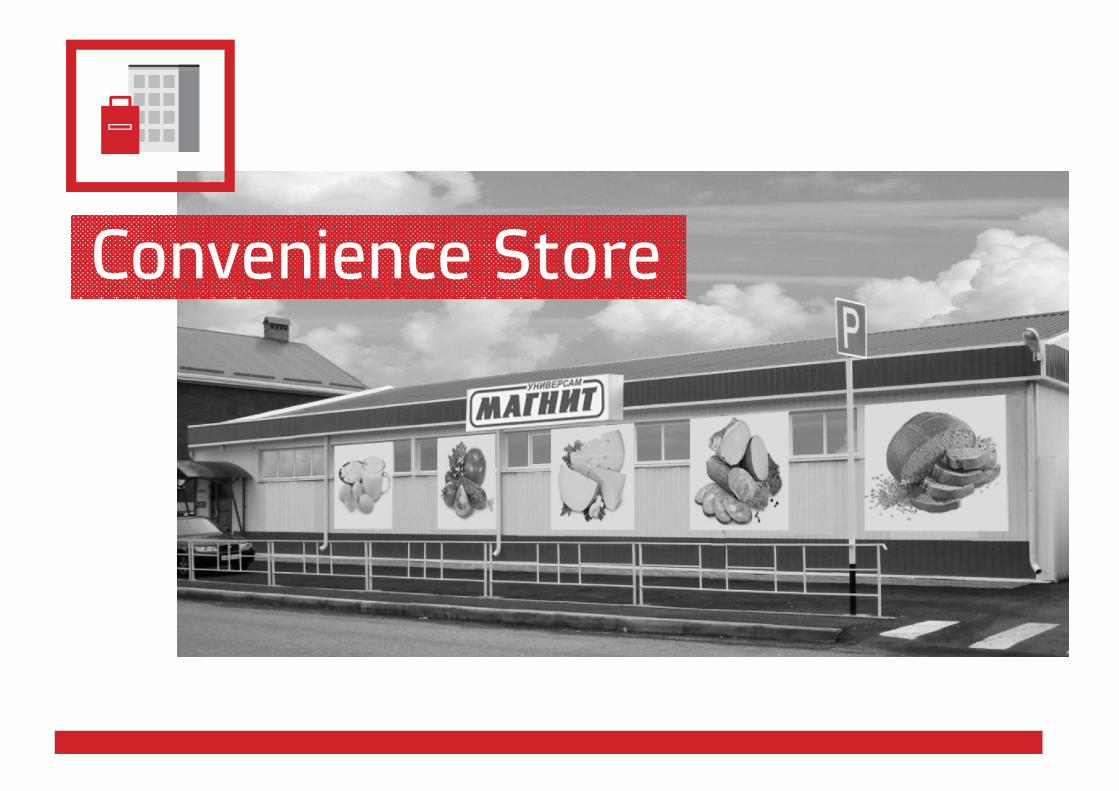
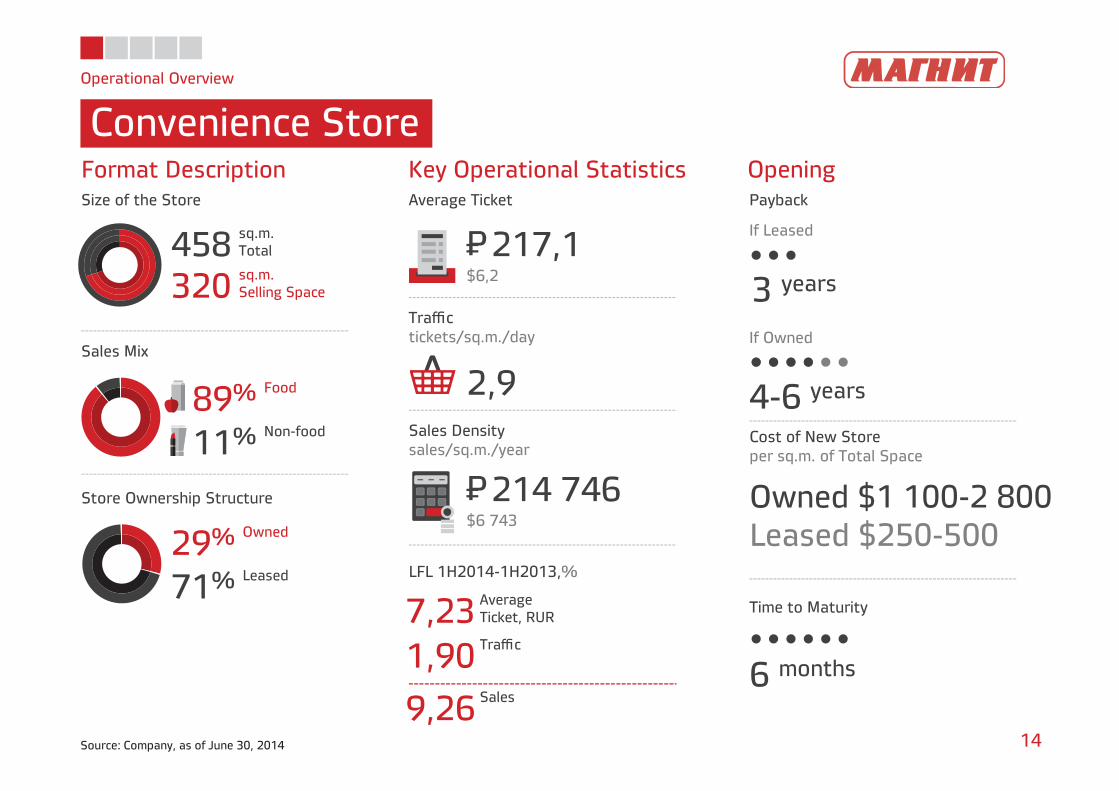
Convenience Store
Operational Overview
Convenience Store
14Source: Company, as of June 30, 2014
458 sq.m.Total
320 sq.m.Selling Space
89% Food
11% Non-food
29% Owned
71% Leased
Format Description Key Operational Statistics OpeningSize of the Store Average Ticket Payback
Store Ownership Structure
Sales Mix
Traffictickets/sq.m./day
Sales Densitysales/sq.m./year
LFL 1H2014-1H2013,%
217,1P=$6,2
214 746P=$6 743
7,23 AverageTicket, RUR
1,90 Traffic
9,26 Sales
2,9
3 years
If Leased
If Owned
Cost of New Storeper sq.m. of Total Space
Time to Maturity
6 months
Owned $1 100-2 800 Leased $250-500
4-6 years
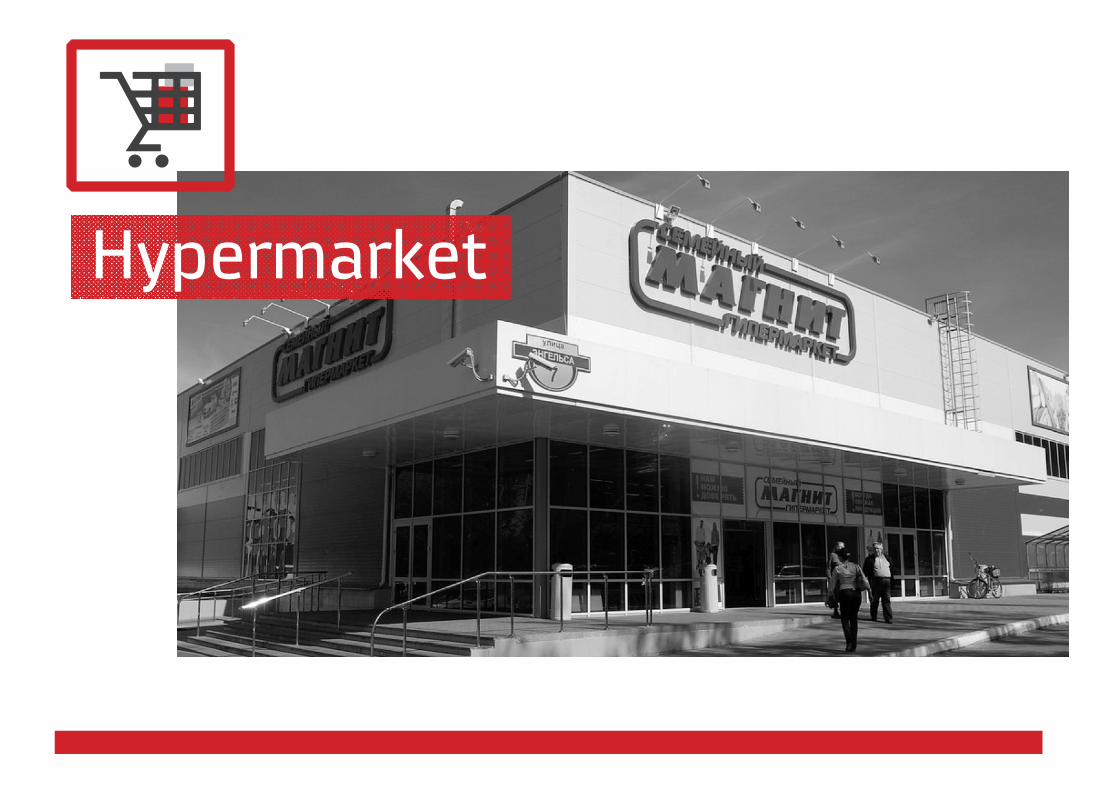
Hypermarket
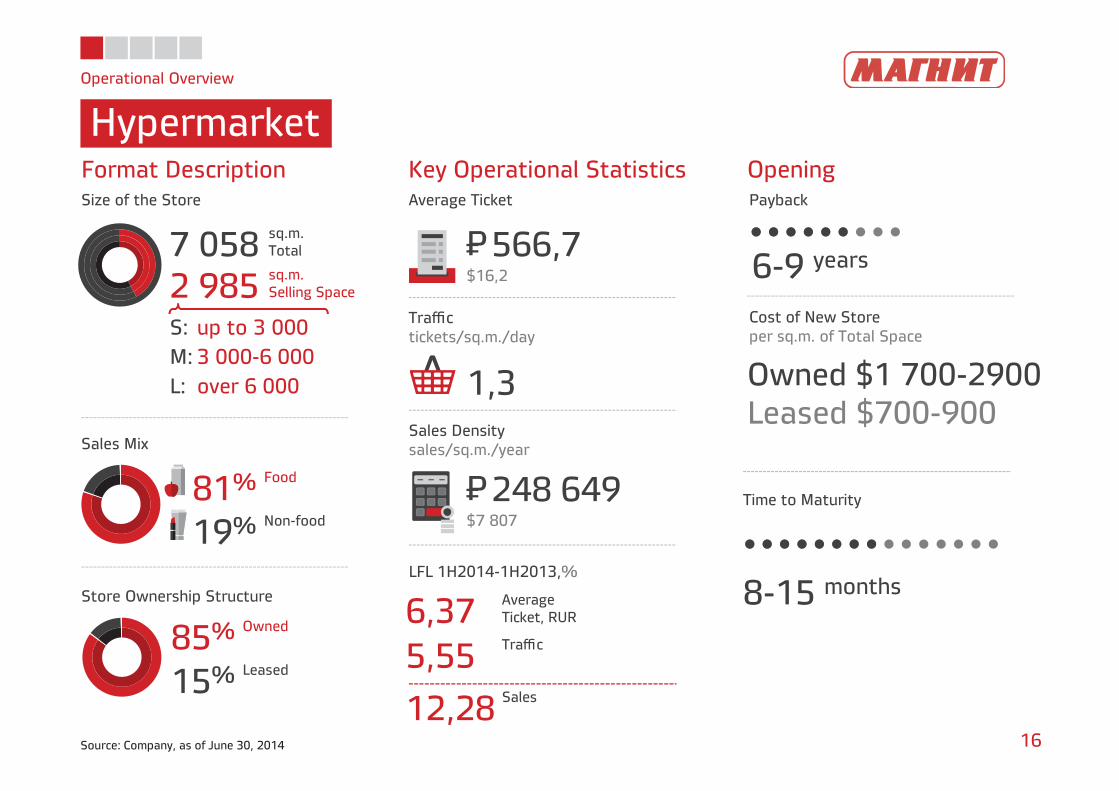
Operational Overview
Hypermarket
16Source: Company, as of June 30, 2014
81% Food
19% Non-food
85% Owned
15% Leased
Format Description Key Operational StatisticsSize of the Store Average Ticket
Store Ownership Structure
Sales Mix
Traffictickets/sq.m./day
Sales Densitysales/sq.m./year
LFL 1H2014-1H2013,%
566,7P=$16,2
248 649P=$7 807
1,3
7 058 sq.m.Total
2 985 sq.m.Selling Space
6,37 AverageTicket, RUR
5,55 Traffic
12,28 Sales
OpeningPayback
6-9 years
Cost of New Storeper sq.m. of Total Space
Owned $1 700-2900Leased $700-900
8-15 months
Time to Maturity
S: up to 3 000M: 3 000-6 000L: over 6 000
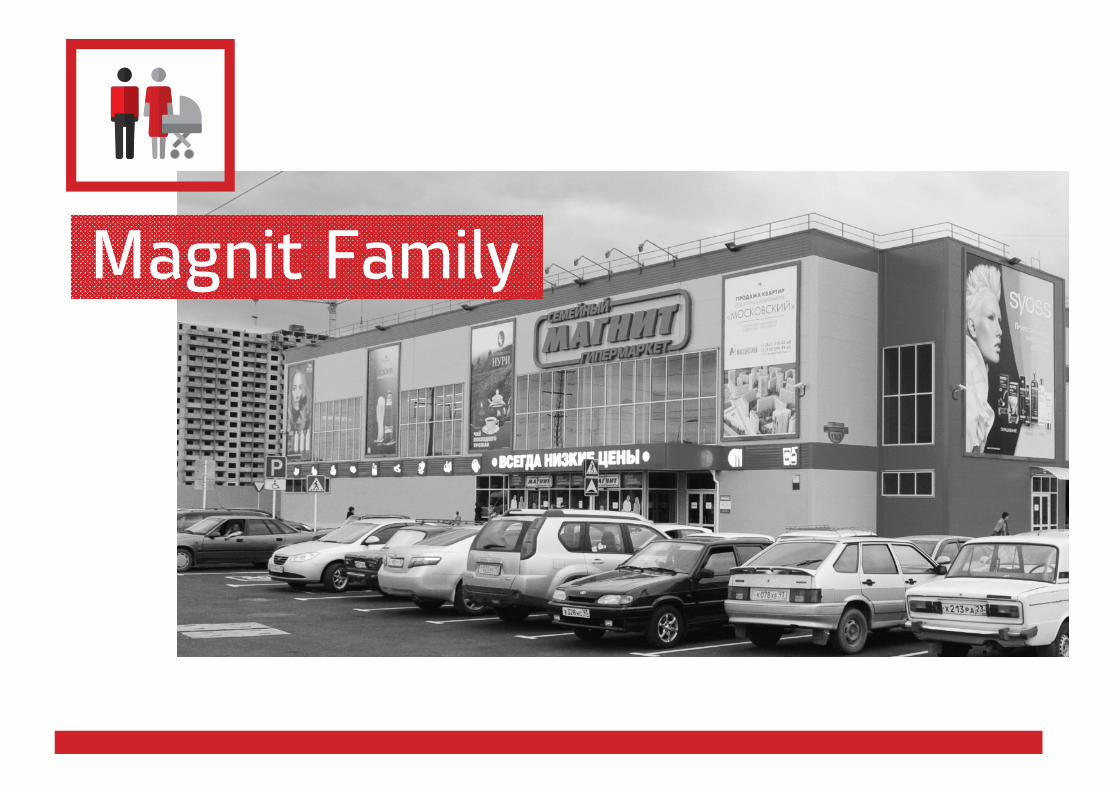
Magnit Family
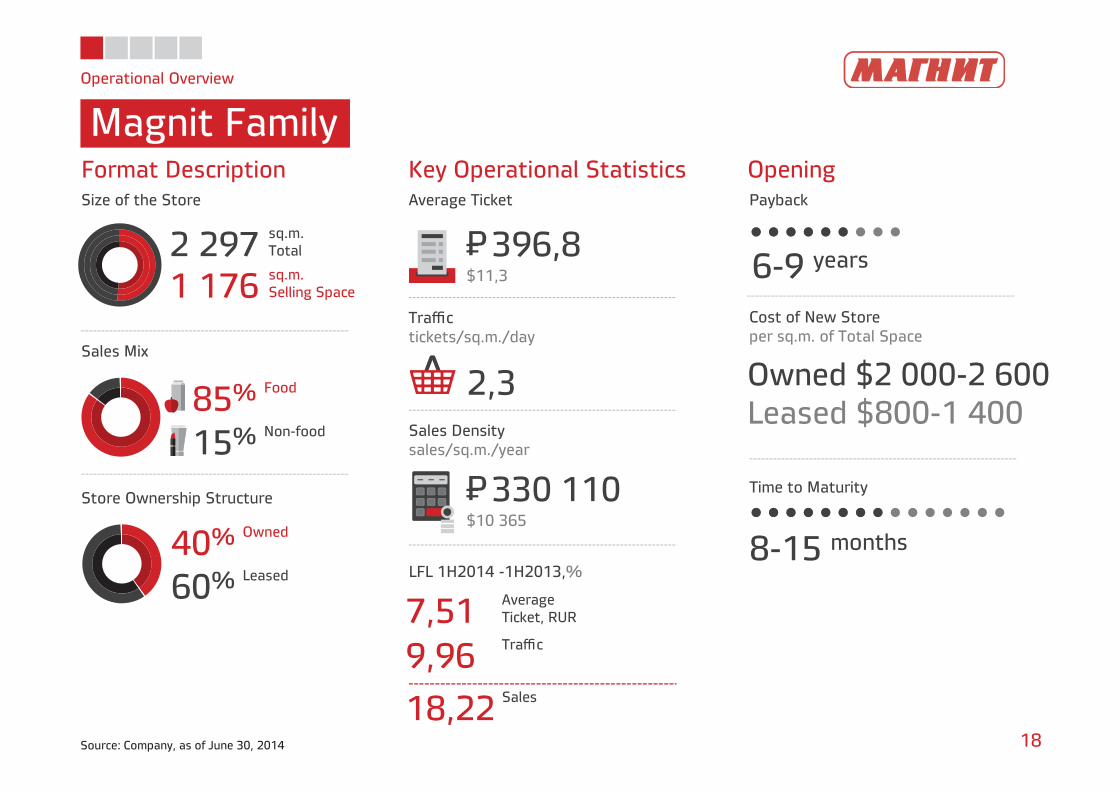
Operational Overview
Magnit Family
18Source: Company, as of June 30, 2014
2 297 sq.m.Total
1 176 sq.m.Selling Space
85% Food
15% Non-food
40% Owned
60% Leased
Format Description Key Operational Statistics OpeningSize of the Store Average Ticket Payback
Store Ownership Structure
Sales Mix
Traffictickets/sq.m./day
Sales Densitysales/sq.m./year
LFL 1H2014 -1H2013,%
396,8P=$11,3
330 110P=$10 365
2,3
6-9 years
Cost of New Storeper sq.m. of Total Space
Owned $2 000-2 600Leased $800-1 400
8-15 months
7,51 AverageTicket, RUR
9,96 Traffic
18,22 Sales
Time to Maturity
Drogerie
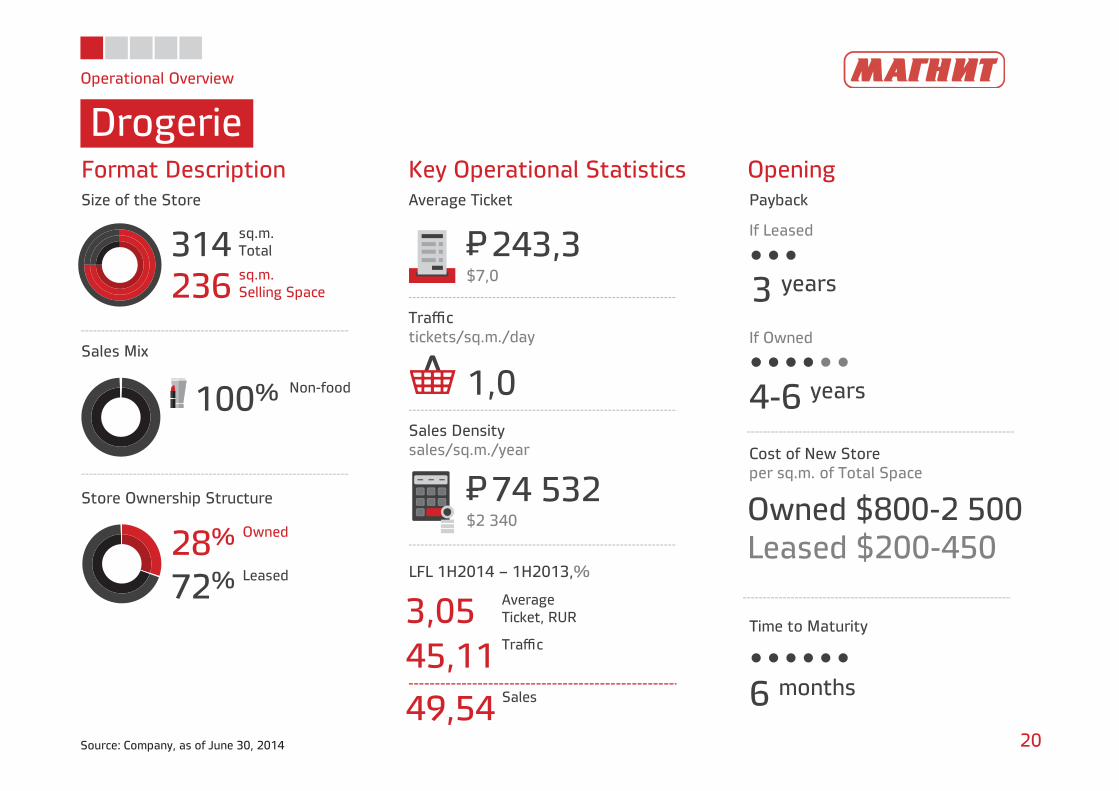
Operational Overview
Drogerie
20Source: Company, as of June 30, 2014
314 sq.m.Total
236 sq.m.Selling Space
100% Non-food
28% Owned
72% Leased
Format Description Key Operational Statistics OpeningSize of the Store Average Ticket Payback
Store Ownership Structure
Sales Mix
Traffictickets/sq.m./day
Sales Densitysales/sq.m./year
LFL 1H2014 – 1H2013,%
243,3P=$7,0
74 532P=$2 340
3,05 AverageTicket, RUR
45,11 Traffic
49,54 Sales
1,0
3 years
If Leased
If Owned
Cost of New Storeper sq.m. of Total Space
Time to Maturity
6 months
Owned $800-2 500Leased $200-450
4-6 years
Sizeof the Store
sq.m.
AverageTicket
TrafficTickets/sq.m./day
DensitySales/
sq.m./year
SalesMix
LFL 1H2014-1H2013
%
Store Owner-ship Structure
PaybackYears
Cost of New Store
per sq.m.of Total Space
Timeto Maturity
Months
• Total• Selling Space
• Food• Non-food
• Av.ticket• Traffic/ Sales
• Owned• Leased
28%72%
40%60%
85%15%
29%71%
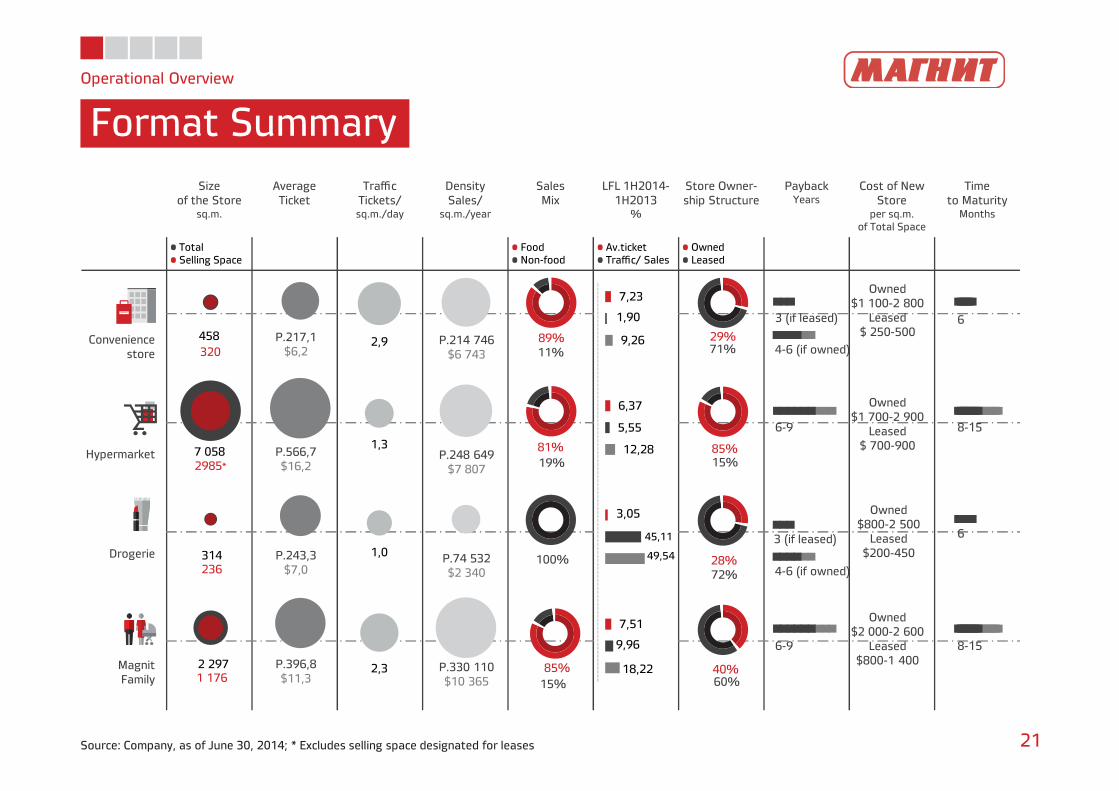
Operational Overview
Format Summary
21Source: Company, as of June 30, 2014; * Excludes selling space designated for leases
Hypermarket
Drogerie
MagnitFamily
458
7 058
314
2 297
320
2985*
236
1 176
Owned $1 100-2 800
Leased $ 250-500
2,9
1,3
1,0
2,3
P.217,1$6,2
P.566,7$16,2
P.243,3$7,0
P.396,8$11,3
P.214 746$6 743
P.248 649$7 807
P.74 532$2 340
P.330 110$10 365
81%19%
100%
85%15%
89%11%
Conveniencestore
6
8-15
6
8-15
3 (if leased)
6-9
3 (if leased)
6-9
4-6 (if owned)
4-6 (if owned)
7,23
6,37
3,05
7,51
1,90
5,55
45,11
9,96
9,26
12,28
49,54
18,22
Owned$1 700-2 900
Leased$ 700-900
Owned$800-2 500
Leased$200-450
Owned$2 000-2 600
Leased$800-1 400
Financial Overview
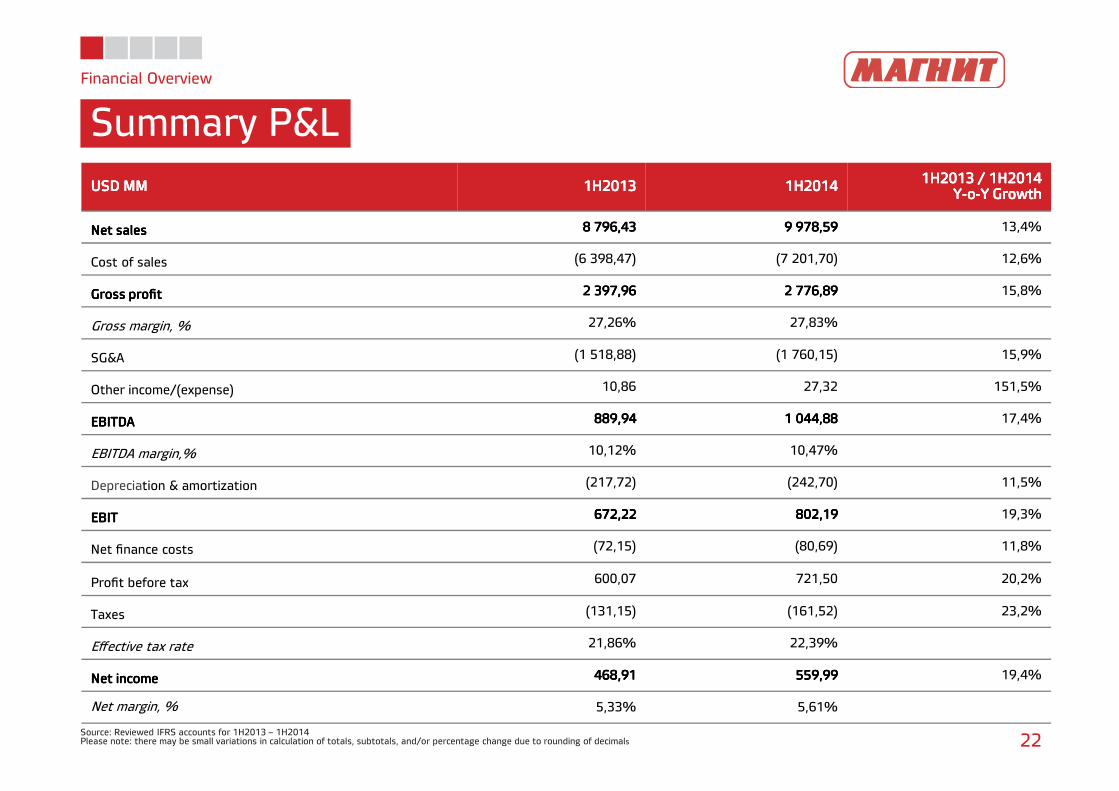
Summary P&L
Source: Reviewed IFRS accounts for 1H2013 – 1H2014Please note: there may be small variations in calculation of totals, subtotals, and/or percentage change due to rounding of decimals 22
USD MMUSD MMUSD MMUSD MM 1H20131H20131H20131H2013 1H20141H20141H20141H2014 1H2013 / 1H20141H2013 / 1H20141H2013 / 1H20141H2013 / 1H2014YYYY----oooo----Y GrowthY GrowthY GrowthY Growth
Net salesNet salesNet salesNet sales 8 796,438 796,438 796,438 796,43 9 978,599 978,599 978,599 978,59 13,4%
Cost of sales (6 398,47) (7 201,70) 12,6%
Gross profitGross profitGross profitGross profit 2 397,962 397,962 397,962 397,96 2 776,892 776,892 776,892 776,89 15,8%
Gross margin, % 27,26% 27,83%
SG&A (1 518,88) (1 760,15) 15,9%
Other income/(expense) 10,86 27,32 151,5%
EBITDAEBITDAEBITDAEBITDA 889,94889,94889,94889,94 1 044,881 044,881 044,881 044,88 17,4%
EBITDA margin,% 10,12% 10,47%
Depreciation & amortization (217,72) (242,70) 11,5%
EBITEBITEBITEBIT 672,22672,22672,22672,22 802,19802,19802,19802,19 19,3%
Net finance costs (72,15) (80,69) 11,8%
Profit before tax 600,07 721,50 20,2%
Taxes (131,15) (161,52) 23,2%
Effective tax rate 21,86% 22,39%
Net incomeNet incomeNet incomeNet income 468,91468,91468,91468,91 559,99559,99559,99559,99 19,4%
Net margin, % 5,33% 5,61%
Financial Overview
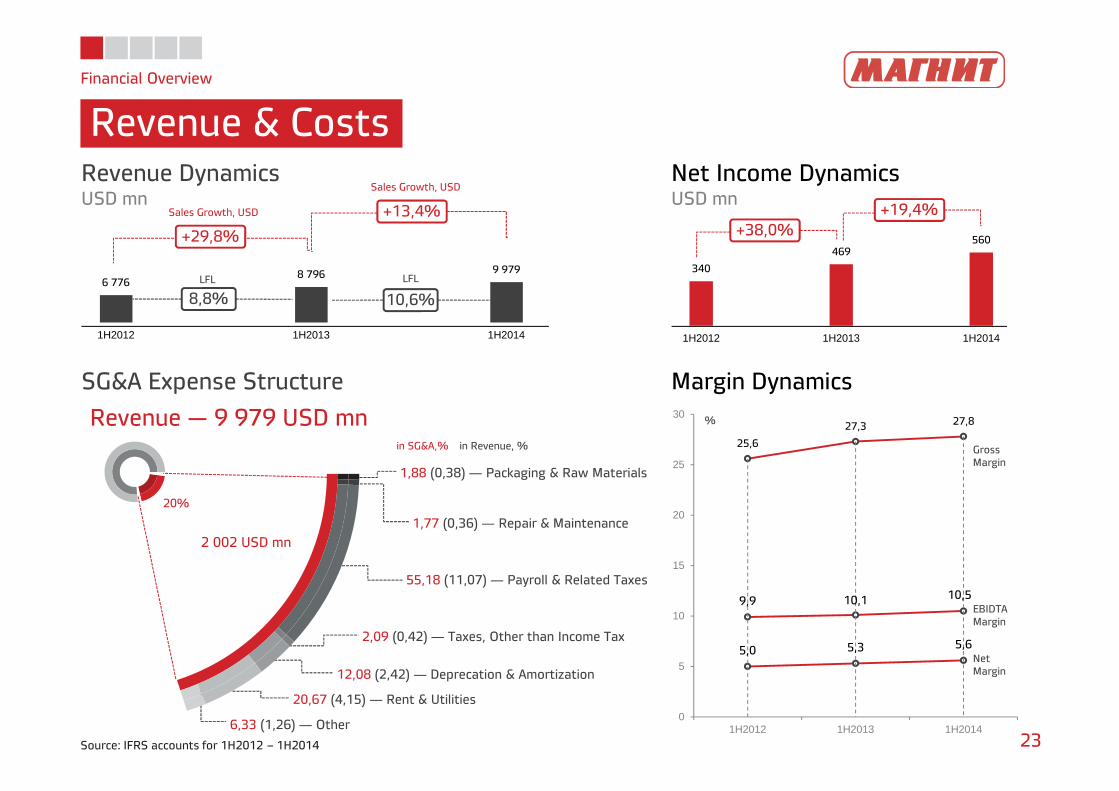
Revenue & Costs
23Source: IFRS accounts for 1H2012 – 1H2014
25,6
27,3 27,8
9,9 10,1 10,5
5,0 5,3 5,6
0
5
10
15
20
25
30
1H2012 1H2013 1H2014
Revenue DynamicsUSD mn
Net Income DynamicsUSD mn
Margin DynamicsSG&A Expense Structure
Revenue — 9 979 USD mnGrossMargin
EBIDTAMargin
NetMargin
%
+29,8%
8,8% 10,6%
+13,4%+38,0%
+19,4%
LFLLFL
Sales Growth, USD
Sales Growth, USD
6 7768 796 9 979
1H2012 1H2013 1H2014
340
469560
1H2012 1H2013 1H2014
20%
2 002 USD mn
1,88 (0,38) ― Packaging & Raw Materials
1,77 (0,36) ― Repair & Maintenance
55,18 (11,07) ― Payroll & Related Taxes
2,09 (0,42)― Taxes, Other than Income Tax
12,08 (2,42) ― Deprecation & Amortization
20,67 (4,15) ― Rent & Utilities
6,33 (1,26) ― Other
in SG&A,% in Revenue, %
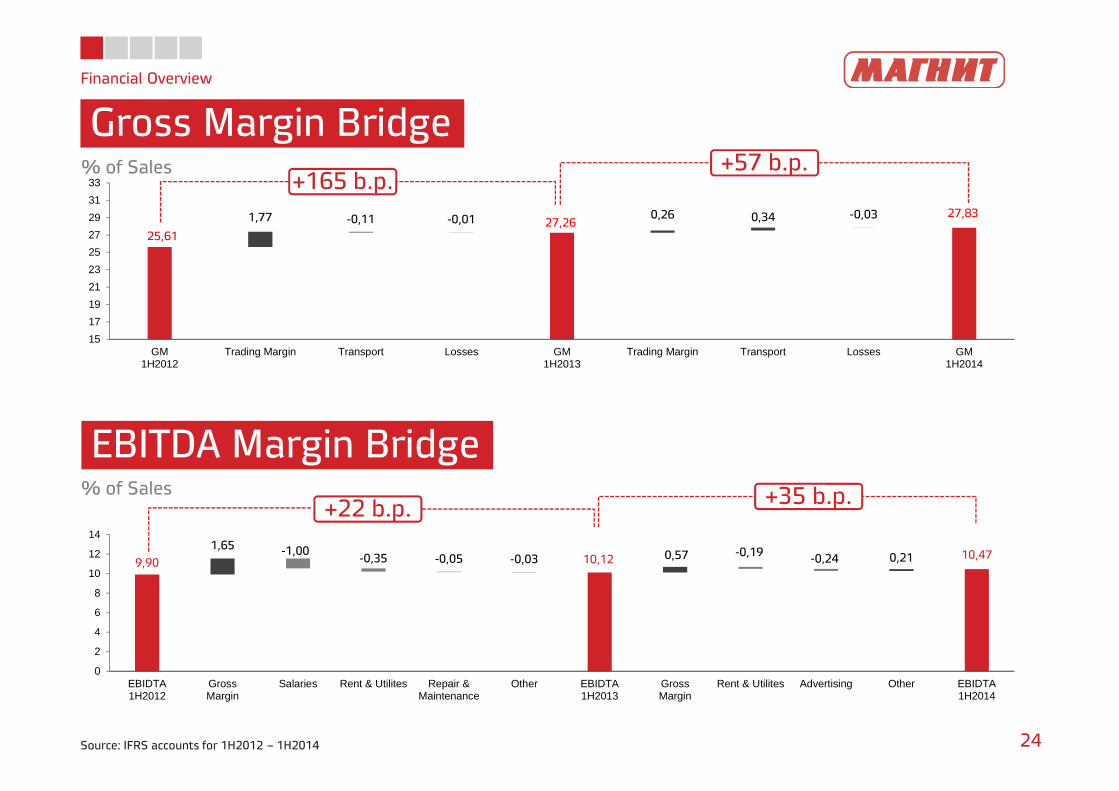
25,6127,26
27,83-0,11 -0,01 -0,031,77 0,26 0,34
15
17
19
21
23
25
27
29
31
33
GM1H2012
Trading Margin Transport Losses GM1H2013
Trading Margin Transport Losses GM1H2014
Financial Overview
Gross Margin Bridge
24Source: IFRS accounts for 1H2012 – 1H2014
EBITDA Margin Bridge
% of Sales
% of Sales
+165 b.p.+57 b.p.
+22 b.p. +35 b.p.
9,90 10,12 10,47-1,00-0,35 -0,05 -0,03
-0,19 -0,241,65
0,57 0,21
0
2
4
6
8
10
12
14
EBIDTA1H2012
GrossMargin
Salaries Rent & Utilites Repair &Maintenance
Other EBIDTA1H2013
GrossMargin
Rent & Utilites Advertising Other EBIDTA1H2014
Financial Overview
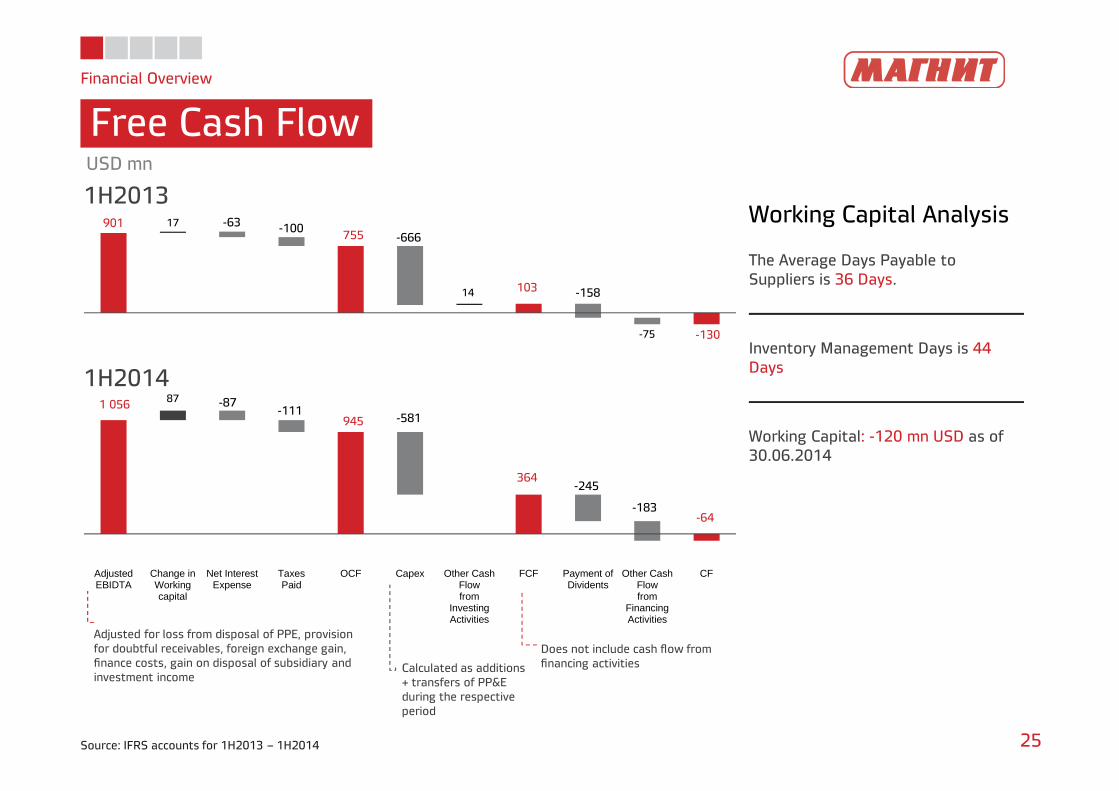
Free Cash Flow
25Source: IFRS accounts for 1H2013 – 1H2014
Working Capital Analysis
The Average Days Payable to Suppliers is 36 Days.
Inventory Management Days is 44 Days
Working Capital: -120 mn USD as of 30.06.2014
USD mn
1H2013
1H2014
Adjusted for loss from disposal of PPE, provision for doubtful receivables, foreign exchange gain, finance costs, gain on disposal of subsidiary and investment income
Calculated as additions + transfers of PP&E during the respective period
Does not include cash flow from financing activities
1 056
945
364
-64
-87-111
-581
-245
-183
87
AdjustedEBIDTA
Change inWorkingcapital
Net InterestExpense
TaxesPaid
OCF Capex Other CashFlowfrom
InvestingActivities
FCF Payment ofDividents
Other CashFlowfrom
FinancingActivities
CF
901755
103
-130
-63 -100-666
-158
17
14
-75
Financial Overview
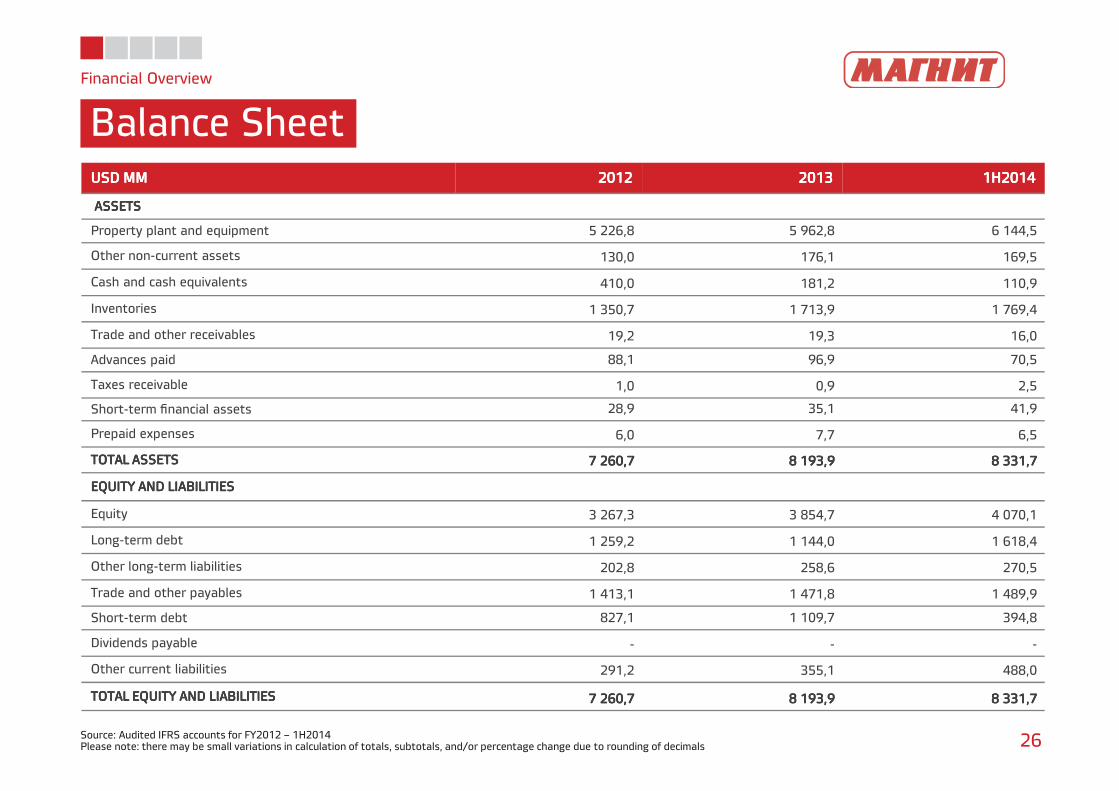
Balance Sheet
Source: Audited IFRS accounts for FY2012 – 1H2014Please note: there may be small variations in calculation of totals, subtotals, and/or percentage change due to rounding of decimals 26
USD MMUSD MMUSD MMUSD MM 2012201220122012 2013201320132013 1H20141H20141H20141H2014
ASSETS ASSETS ASSETS ASSETS
Property plant and equipment 5 226,8 5 962,8 6 144,5
Other non-current assets 130,0 176,1 169,5
Cash and cash equivalents 410,0 181,2 110,9
Inventories 1 350,7 1 713,9 1 769,4
Trade and other receivables 19,2 19,3 16,0
Advances paid 88,1 96,9 70,5
Taxes receivable 1,0 0,9 2,5
Short-term financial assets 28,9 35,1 41,9
Prepaid expenses 6,0 7,7 6,5
TOTAL ASSETS TOTAL ASSETS TOTAL ASSETS TOTAL ASSETS 7 260,7 7 260,7 7 260,7 7 260,7 8 193,9 8 193,9 8 193,9 8 193,9 8 331,7 8 331,7 8 331,7 8 331,7
EQUITY AND LIABILITIES EQUITY AND LIABILITIES EQUITY AND LIABILITIES EQUITY AND LIABILITIES
Equity 3 267,3 3 854,7 4 070,1
Long-term debt 1 259,2 1 144,0 1 618,4
Other long-term liabilities 202,8 258,6 270,5
Trade and other payables 1 413,1 1 471,8 1 489,9
Short-term debt 827,1 1 109,7 394,8
Dividends payable - - -
Other current liabilities 291,2 355,1 488,0
TOTAL EQUITY AND LIABILITIESTOTAL EQUITY AND LIABILITIESTOTAL EQUITY AND LIABILITIESTOTAL EQUITY AND LIABILITIES 7 260,7 7 260,7 7 260,7 7 260,7 8 193,9 8 193,9 8 193,9 8 193,9 8 331,7 8 331,7 8 331,7 8 331,7
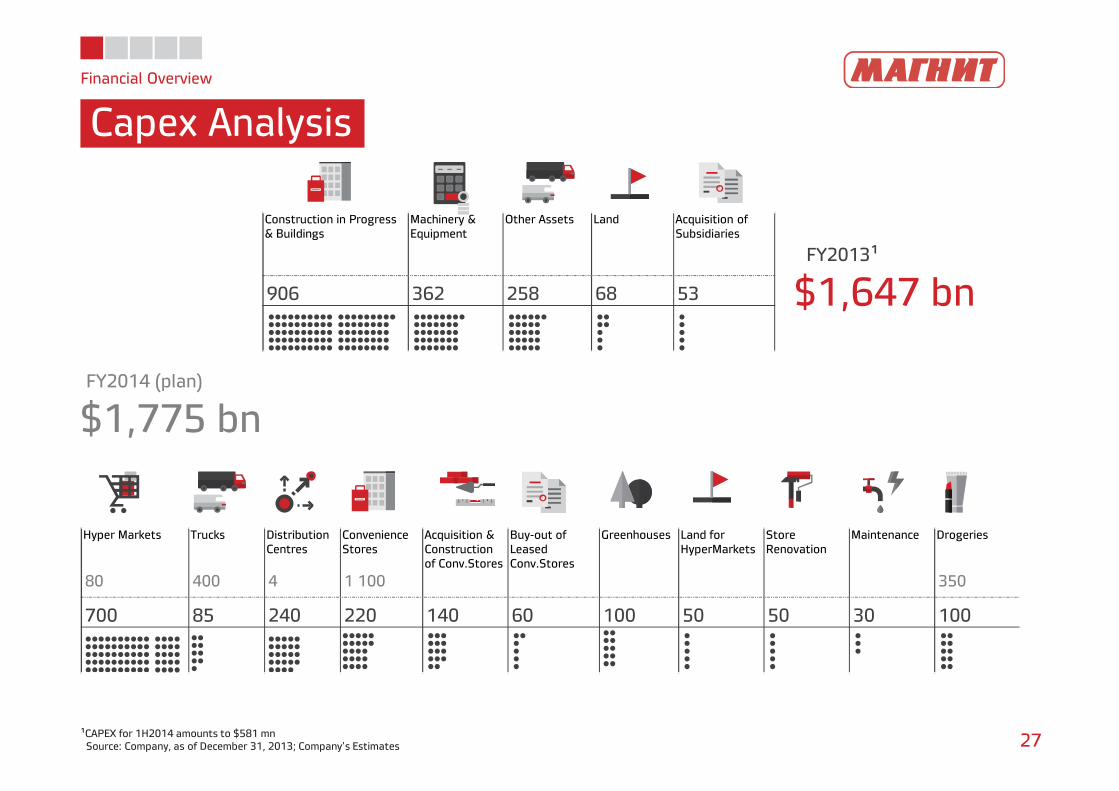
Financial Overview
Capex Analysis
27¹CAPEX for 1H2014 amounts to $581 mnSource: Company, as of December 31, 2013; Company’s Estimates
Construction in Progress & Buildings
Machinery & Equipment
Other Assets Land Acquisition of Subsidiaries
906 362 258 68 53
FY2013¹
$1,647 bn
FY2014 (plan)
$1,775 bn
Hyper Markets Trucks Distribution Centres
Convenience Stores
Acquisition & Construction of Conv.Stores
Buy-out of Leased Conv.Stores
Greenhouses Land for HyperMarkets
Store Renovation
Maintenance Drogeries
80 400 4 1 100 350
700 85 240 220 140 60 100 50 50 30 100
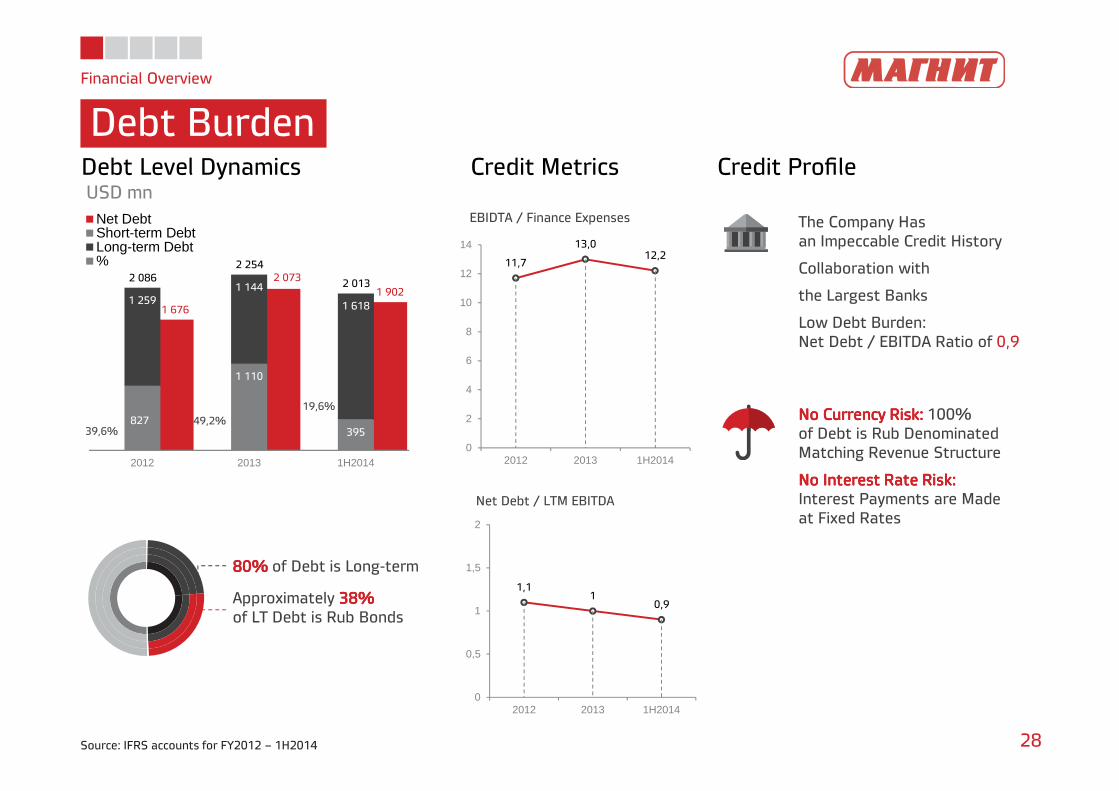
Financial Overview
Debt Burden
28Source: IFRS accounts for FY2012 – 1H2014
11,7
13,012,2
0
2
4
6
8
10
12
14
2012 2013 1H2014
1,11
0,9
0
0,5
1
1,5
2
2012 2013 1H2014
Debt Level DynamicsUSD mn
Credit Metrics Credit Profile
EBIDTA / Finance Expenses
Net Debt / LTM EBITDA
The Company Hasan Impeccable Credit History
Collaboration with
the Largest Banks
Low Debt Burden:Net Debt / EBITDA Ratio of 0,9
No Currency Risk: No Currency Risk: No Currency Risk: No Currency Risk: 100%of Debt is Rub DenominatedMatching Revenue Structure
No Interest Rate Risk:No Interest Rate Risk:No Interest Rate Risk:No Interest Rate Risk:Interest Payments are Madeat Fixed Rates
2 0862 254
2 013
1 676
2 0731 902
827
1 110
395
1 2591 144
1 618
2012 2013 1H2014
Net DebtShort-term DebtLong-term Debt%
39,6%49,2%
19,6%
80% 80% 80% 80% of Debt is Long-term
Approximately 38%38%38%38%of LT Debt is Rub Bonds