1H 2006 Results Announcement 23 May 2006
44
1H 2006 Results Announcement 23 May 2006
Transcript of 1H 2006 Results Announcement 23 May 2006

1H 2006 ResultsAnnouncement
23 May 2006
2
1H 2006 presentation outline
Graeme Liebelt
Noel Meehan
Graeme Liebelt
• Overview of Results • Strategy
• Business Performance• Cashflow• Balance Sheet• A-IFRS
• IPL Divestment• Chemnet Restructure• Dyno Acquisition• Outlook

3
Sales Revenue +9%
EBIT +13%
NPAT +14%
EPS +6%
Record Result in Mining Services & Chemical Services
Improving Cashflow Performance
Successful Capital Raisings to Fund Dyno Acquisition
Continued growth in shareholder value
Half year ended 31 March 2006
Highlights

4A solid result
Half year ended 31March 2006
Financial summary2006 2005 % Change
NPAT (excluding significant items)
Underlying Results:Sales Revenue A$M 2,599 2,384 9EBIT (excluding significant items) A$M 276 245 13
A$M 146 128 14
Coverage Ratios:Gearing (book) % 35.2 49.0
Interest cover x 5.0 5.2
Results including significant items:
Significant items after tax A$M (23) (3) NPAT including significant items A$M 123 125 (1)
Gearing (adjusted)* % 41.3 49.0
* Hybrid shares notionally reclassified as 50% equity and 50% debt
5
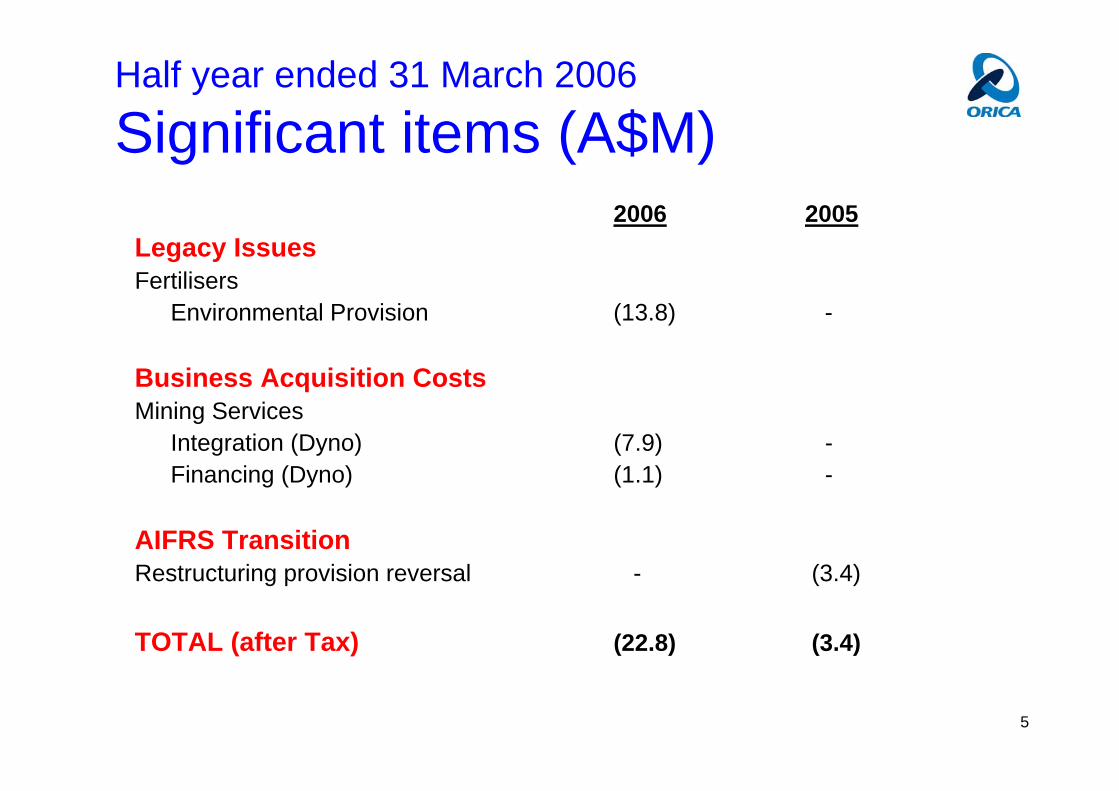
Half year ended 31 March 2006
Significant items (A$M)2006 2005
Legacy IssuesFertilisers
Environmental Provision (13.8) -
Business Acquisition CostsMining Services
Integration (Dyno) (7.9) -Financing (Dyno) (1.1) -
AIFRS TransitionRestructuring provision reversal - (3.4)
TOTAL (after Tax) (22.8) (3.4)
6
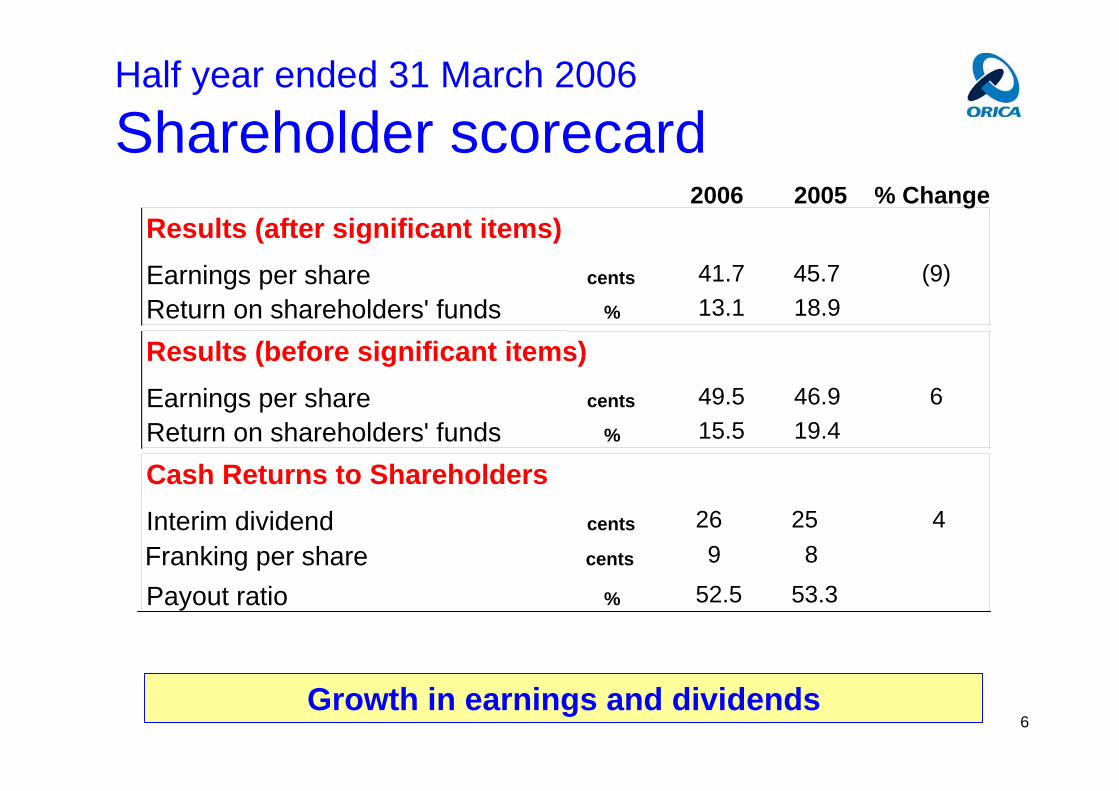
Half year ended 31 March 2006
Shareholder scorecard
Growth in earnings and dividends
Results (after significant items)Earnings per share cents 41.7 45.7 (9)Return on shareholders' funds % 13.1 18.9
Results (before significant items)Earnings per share cents 49.5 46.9 6Return on shareholders' funds % 15.5 19.4
Cash Returns to ShareholdersInterim dividend cents 26 25 4
Payout ratio % 52.5 53.3
2006 2005 % Change
Franking per share cents 9 8

7
Orica’s approach – value drivers

8
Half year ended 31 March 2006
Cost productivity
More work to do on productivity
2006 2005 Increase$M $M $M %
Sales revenue 2,599 2,384 215 9
Variable costs 1,589 1,442 147 10
Gross margin 1,010 942 68 7Gross margin/sales 38.9% 39.5%
Cash fixed costs 692 644 48 7
Depn and amortisation 74 68 7 10
Whole of cost bar 2,355 2,154 201 9WOCB/sales 90.6% 90.3%
Cash fixed costs/gross margin 68.5% 68.4%

9
Half year ended 31 March 2006
Capital productivity
290
50
275
128
FY 2004FY 20051H 2006
Yarwun AN
Major Plant Capacity - ktpa
Yarwun Sodium Cyanide
Kooragang Island
295
60
430 * 400
60
295
Share Buy-Back
Active Capital Management - $MN/A 54
Expansion Capex - $M 178 207 53Sustenance Capex - $M 103 147 146
* As of June 2006

10
Orica’s strategy
Three Key Principles:
Market leadership
Earning the “right to grow”
Growing “close to the core”
No change to existing strategy

11
SH&E
Commercial Ownership- Group Procurement- Supply chain improvement- Manufacturing efficiency
Creative Customer Solutions- Customer driven- Technology
Working Together
‘Deliver the Promise’
Orica – our culture

12
Business PerformanceCash Flow
Balance SheetA-IFRS

13• pre significant items
• pre 2005 not AIFRS adjusted
Expanded capital base impacted ROSHF
Half year ended 31 March 2006
Financial results
128
146
8097
122
300
20
40
60
80
100
120
140
160
01 02 03 04 05 06
NPA
T (A
$M)
0%
5%
10%
15%
20%
25%
RO
SHF

14
Half year ended 31 March
NPAT analysis
EBIT up 13%
Record result for Mining Services and Chemical Services
Fertilisers EBIT up significantly
OCP down marginally
Chemnet down 25%
Sale and Leaseback
Contribution from acquisitions
Sale of QGC shares
Higher interest on higher debt levels
Insurance costs
Elders Rebate & Botany Ground Water
1H05NPATBSI
ExistingBusinesses
SLB Acquisitions QGC Interest Insurance Elders case Other 1H06NPATBSI
128
18
73
4
-6
-4-4 -1
146
120
130
140
150
160A
$M

15
Mining ServicesSales $1,134M, EBIT $151M, Net Assets $1,387M
EBIT
A$M
0
50100
150
200
250
300
350
400
2003 2004 2005 200611
12
13
14
15
EBIT
MA
RG
IN %
1st Half EBIT 2nd Half EBIT 1st Half EBIT Margin
Record half year result
Robust Australia/Asia & North American markets
Strong earnings from Joint Ventures
Recovering cost increases through price
Volume growth across all regions
Sale & Leaseback
Rapidly rising gas, ammonia and AN input costs impact margins
Higher fixed costs
Kooragang Island shutdown impact
1H05EBIT
Price/ Mix
NetVolume
SLB VariableCosts
FixedCosts
KI Shut Other 1H06EBIT
131
77
207
-72 -6 -5 -1
151
100
120
140
160
180
200
220
240
260A$M

16
Mining Services by geographyAustralia/Asia
EBIT
A$M
0
50
100
150
200
250
2003 2004 2005 200616
17
18
19
20
21
22
EBIT
MA
RG
IN %
1st Half EBIT 2nd Half EBIT 1st Half EBIT Margin
Europe
EBIT
A$M
0
5
10
15
20
25
30
35
2003 2004 2005 20060
2
4
6
8
10
12
EBIT
MA
RG
IN %
1st Half EBIT 2nd Half EBIT 1st Half EBIT Margin
Latin America
EBIT
A$M
05
1015202530354045
2003 2004 2005 200602468101214161820
EBIT
MA
RG
IN %
1st Half EBIT 2nd Half EBIT 1st Half EBIT Margin
North America
01020304050607080
2003 2004 2005 20060
2
4
6
8
EBIT
MA
RG
IN %
1st Half EBIT 2nd Half EBIT 1st Half EBIT Margin
EBIT
A$M
17
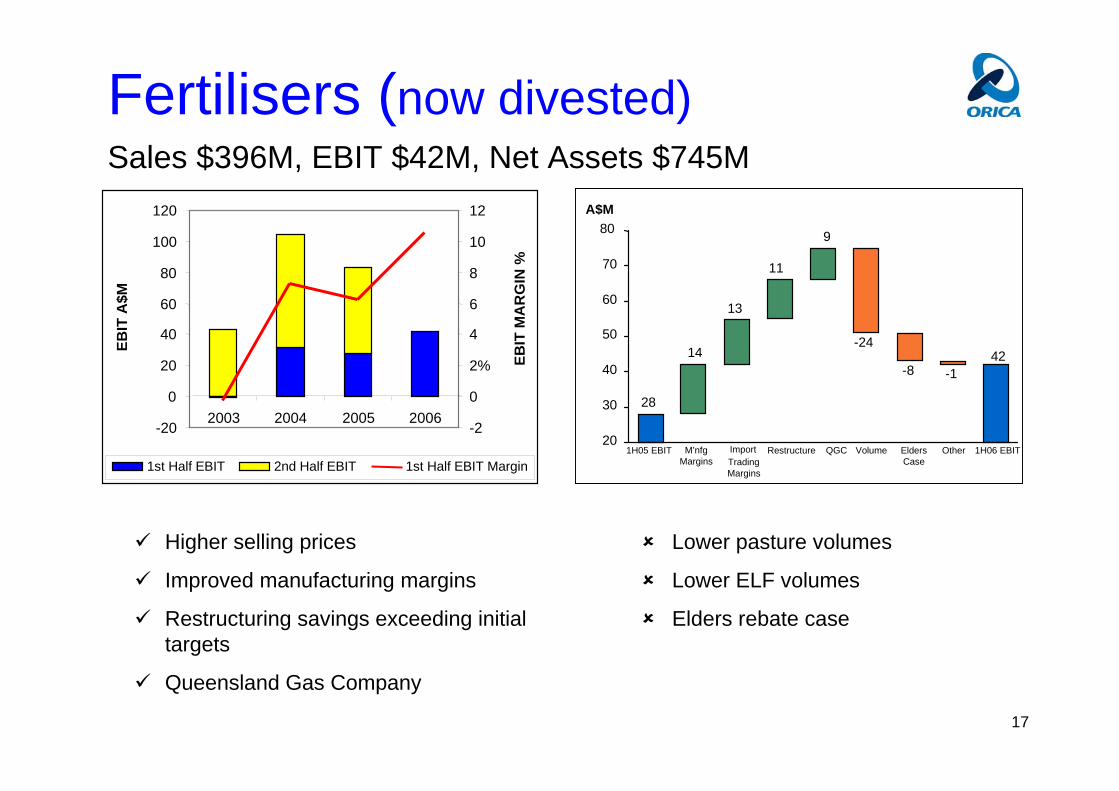
Fertilisers (now divested)Sales $396M, EBIT $42M, Net Assets $745M
Higher selling prices
Improved manufacturing margins
Restructuring savings exceeding initial targets
Queensland Gas Company
Lower pasture volumes
Lower ELF volumes
Elders rebate case
-20
0
20
40
60
80
100
120
2003 2004 2005 2006
EBIT
A$M
-2
0
2%
4
6
8
10
12
EBIT
MA
RG
IN %
1st Half EBIT 2nd Half EBIT 1st Half EBIT Margin1H05 EBIT Import
TradingMargins
Restructure QGC Volume EldersCase
Other 1H06 EBIT
28
14
13
11
9
-24
-8 -142
20
30
40
50
60
70
80
M’nfgMargins
A$M

18
Consumer ProductsSales $402M, EBIT $48M, Net Assets $236M
Market share increase
Australian retail market soft
Woodcare, protective coatings, texture coatings and trade
Powder Coatings
Yates improvement
Raw material cost increases not fully passed on
Efficiency improvement
WA plant closure
Higher depreciation
EBIT
A$M
0
20
40
60
80
100
120
2003 2004 2005 20060
2
4
6
8
10
12
14
16
EBIT
MA
RG
IN %
1st Half EBIT 2nd Half EBIT 1st Half EBIT Margin1H05 EBIT Yates Net Price Efficiency W.A.
ClosureDepreciation 1H06 EBIT
49
2
-3
2
-1-1
48
40
42
44
46
48
50
52
A$M

19
ChemnetSales $505M; EBIT $29M; Net Assets $425M
Pass through of input costs
Improved product mix
Volumes down (inc. Marplex)
Cash fixed costs up
B&J integration issues
Restructure costs up
1H05 EBIT Price / Mix Volume CashFixed Costs
RestructureCosts
Other 1H06 EBIT
38
4
-7
-2
-3 -1
29
20
25
30
35
40
45
A$M
EBIT
A$M
0102030405060708090
2003 2004 2005 20060
2
4
6
8
10
12
EBIT
MA
RG
IN %
1st Half EBIT 2nd Half EBIT 1st Half EBIT Margin
20
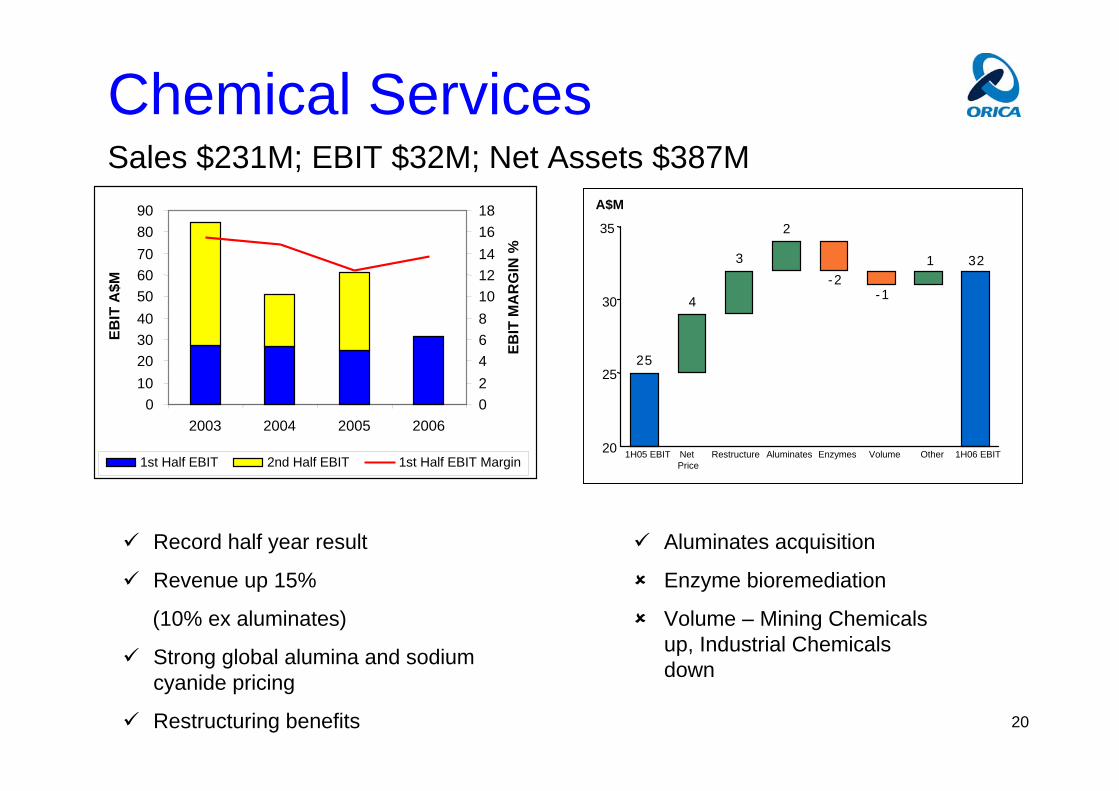
Chemical ServicesSales $231M; EBIT $32M; Net Assets $387M
1H05 EBIT Net Price
Restructure Aluminates Enzymes Volume Other 1H06 EBIT
25
4
3
2
-2-1
1 32
20
25
30
35
A$M
Record half year result
Revenue up 15%
(10% ex aluminates)
Strong global alumina and sodium cyanide pricing
Restructuring benefits
Aluminates acquisition
Enzyme bioremediation
Volume – Mining Chemicals up, Industrial Chemicals down
EBIT
A$M
0102030405060708090
2003 2004 2005 2006024681012141618
EBIT
MA
RG
IN %
1st Half EBIT 2nd Half EBIT 1st Half EBIT Margin

21
Corporate centre and other support services (A$M)
Corporate CentreLower head count
Other Support ServicesHigher insurance costsLower corporate initiative spend
2006 2005 $ ChangeCorporate Centre (17.7) (19.9) 2.2
Other Support Costs (6.8) (6.7) (0.1)
(24.5) (26.6) 2.2

22
Half year ended 31 March 2006
Cashflow A$M2006 2005 Change
EBITDA 350 312 38 Net interest paid (49) (44) (5)Net tax paid (52) (154) 102Trade working capital (223) (170) (53) Non-trade working capital (44) (76) 32
Net operating cash flows (17) (133) 116
Net investing cash flows (1,151) (166) (985)
Net financing cash flows 1,112 322 790 (56) 23 (79)
23
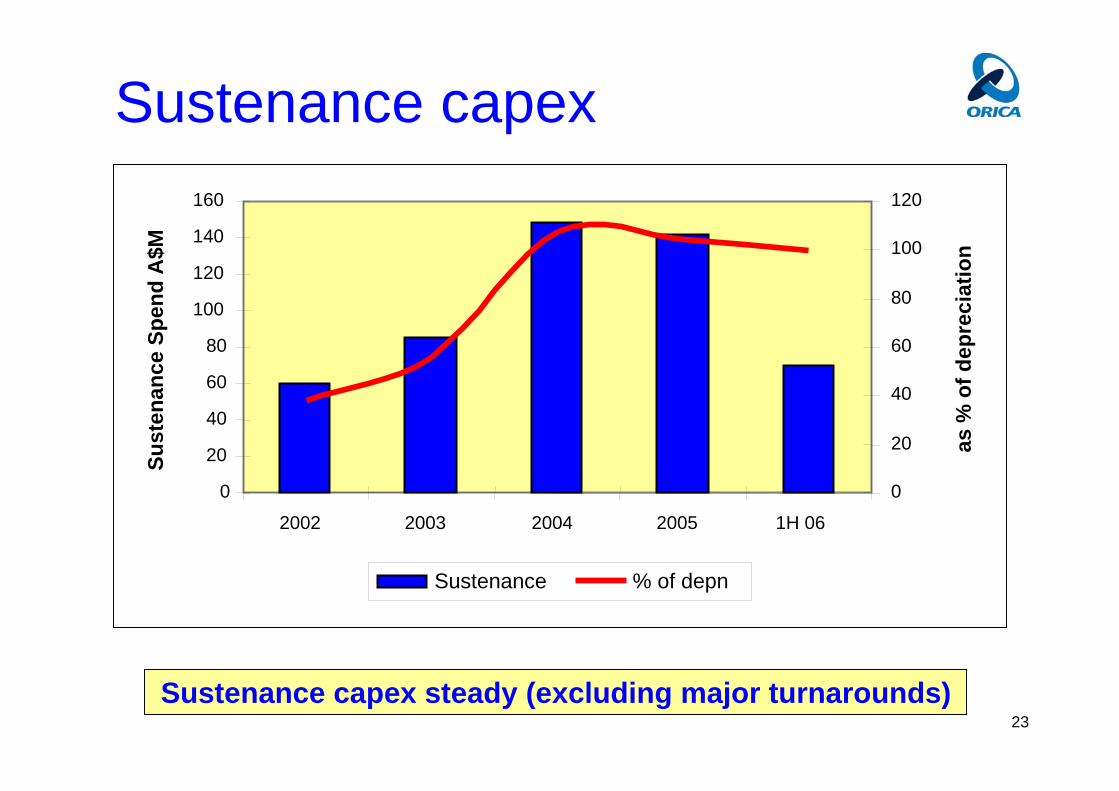
Sustenance capex
Sustenance capex steady (excluding major turnarounds)
Sust
enan
ce S
pend
A$M
0
20
40
60
80
100
120
140
160
2002 2003 2004 2005 1H 06
0
20
40
60
80
100
120
as %
of d
epre
ciat
ion
Sustenance % of depn

24
March Sept March2006 2005 2005
Trade working capital 875 604 949
Net property, plant & equipment 1,774 1,606 1,560
Net other assets 1,392 422 433
Net debt (1,423) (1,112) (1,441)
Net Assets 2,618 1,520 1,501
Orica shareholders' equity 2,432 1,328 1,306
Outside equity interests 187 192 195
Equity 2,618 1,520 1,501
Half year ended 31 March 2006
Balance sheet (A$M)
25
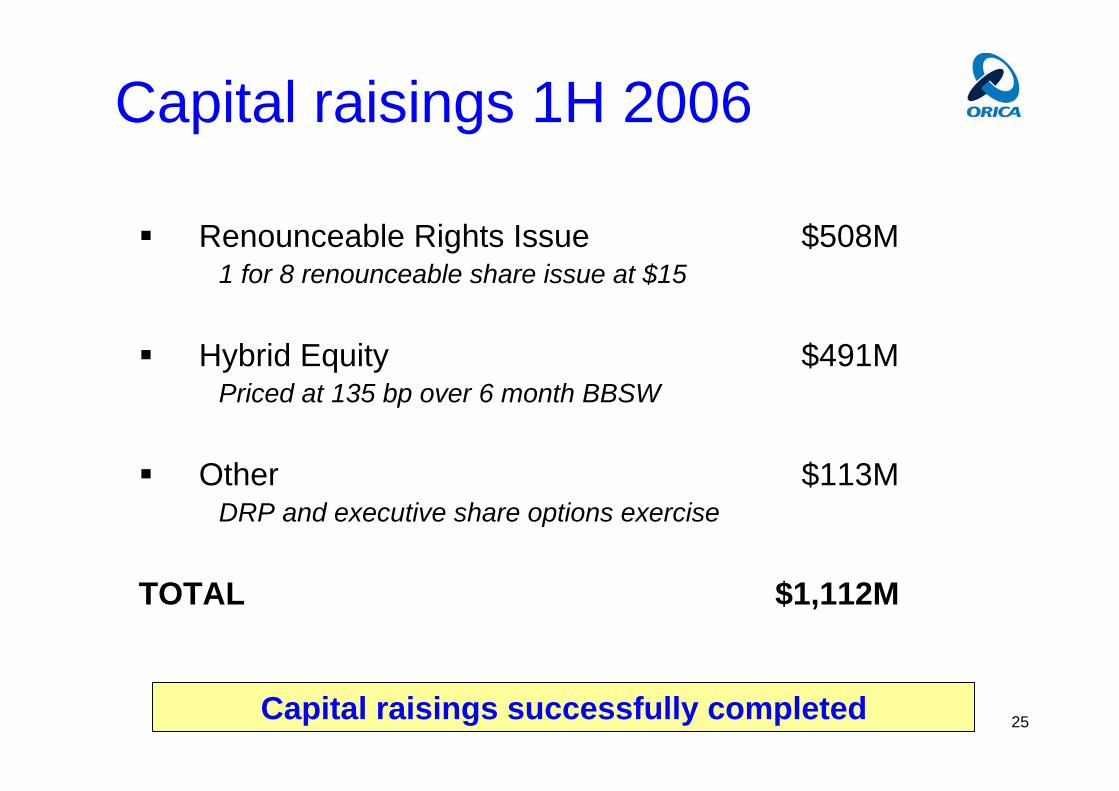
Renounceable Rights Issue $508M1 for 8 renounceable share issue at $15
Hybrid Equity $491MPriced at 135 bp over 6 month BBSW
Other $113MDRP and executive share options exercise
TOTAL $1,112M
Capital raisings 1H 2006
Capital raisings successfully completed

26
Book Gearing 35.2%
Adjusted Gearing 41.3% (hybrids notionally 50/50 debt & equity split)
Interest cover 5.0 times
Net debt and gearing
600
700
800
900
1000
1100
1200
1300
1400
1500
HY02 FY02 HY03 FY03 HY04 FY04 HY05 FY05 HY06
Net
deb
t (A
$M)
0
10
20
30
40
50
60
Gea
ring
%
Target gearing range shaded

27
Carrying amount 30 September 2005 $186M
Provisions made 1H 2006 $31M- Cockle Creek $28M- Botany Ground Water $3M
Cash Payments made 1H 2006 $24M- Botany Ground Water $16M- HCB Management $3M- Other $5M
Carrying amount 31 March 2006 $193M
Environmental provisions update
$48M of $193M carrying value relates to IPL
28
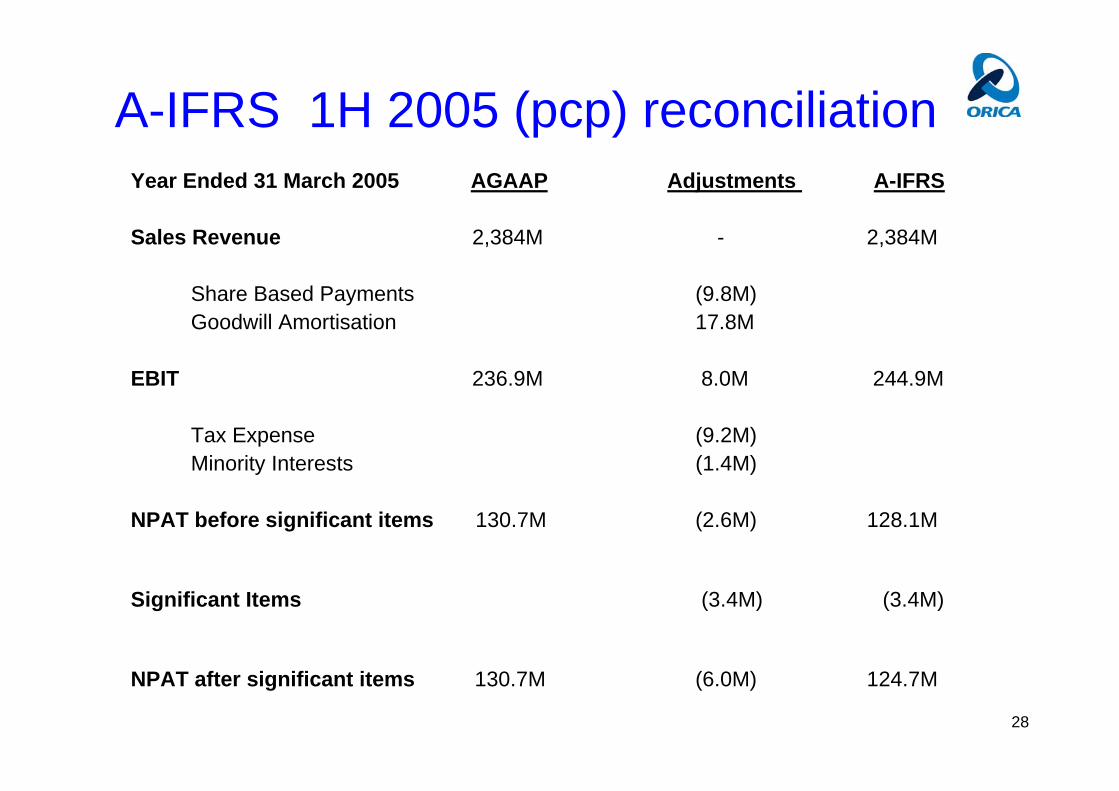
Year Ended 31 March 2005 AGAAP Adjustments A-IFRS
Sales Revenue 2,384M - 2,384M
Share Based Payments (9.8M)Goodwill Amortisation 17.8M
EBIT 236.9M 8.0M 244.9M
Tax Expense (9.2M)Minority Interests (1.4M)
NPAT before significant items 130.7M (2.6M) 128.1M
Significant Items (3.4M) (3.4M)
NPAT after significant items 130.7M (6.0M) 124.7M
A-IFRS 1H 2005 (pcp) reconciliation

29
Strong half year result despite weakness in some business platforms
Record Mining Services and Chemical Services result
Resilience to cost increases
Financial discipline and improved cashflow performance
Strong balance sheet capable of funding future growth
Summary
A disciplined and consistent approach to growing shareholder value
30
IPL DivestmentChemnet Restructure
Dyno AcqusitionOutlook

31
IPL divestment
Orica’s earnings will be less volatile post IPL
Rationale - less earnings volatility going forward- allows each entity to pursue an independent strategy
Orica capital management- Capital projects relating to existing businesses- M&A across remaining businesses
Gross proceeds from sale $857M
After tax gain $399M (to be booked as a significant item in FY2006 results)
32
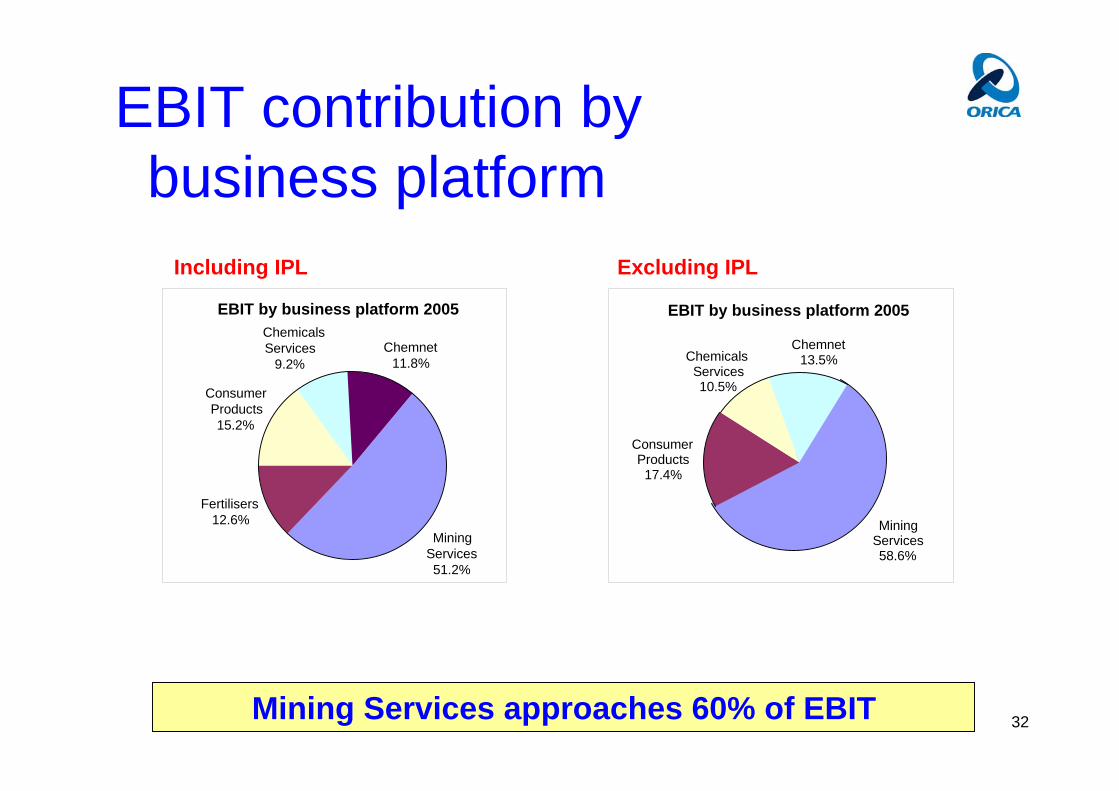
EBIT contribution by business platform
Mining Services approaches 60% of EBIT
EBIT by business platform 2005
Mining Services51.2%
Fertilisers12.6%
Consumer Products15.2%
Chemicals Services
9.2%Chemnet
11.8%
Including IPL
EBIT by business platform 2005
Mining Services58.6%
Consumer Products
17.4%
Chemicals Services10.5%
Chemnet13.5%
Excluding IPL

33
Gross sales by geography
Continuing the “internationalisation” of Orica
Gross sales by geographic area 2005
Australia61.3%
New Zealand9.4%
Americas17.9%
Other11.4%
Including IPL
Gross sales by geographic area 2005
Australia51.5%
New Zealand 11.8%
Americas22.4%
Other14.3%
Excluding IPL

34
EBIT* performance (exc. IPL)
Earnings less cyclical going forward* excluding corporate costs
Past Performance Orica Today
0
50100
150
200250
300350
400
450500
550
600650
700
1987 1988 1989 1990 1991 1992 1993 1994 1995 1996 1997 1998 1999 2000 2001 2002 2003 2004 2005
EBIT
$A
M
Current Business EBIT EBIT as reported
35
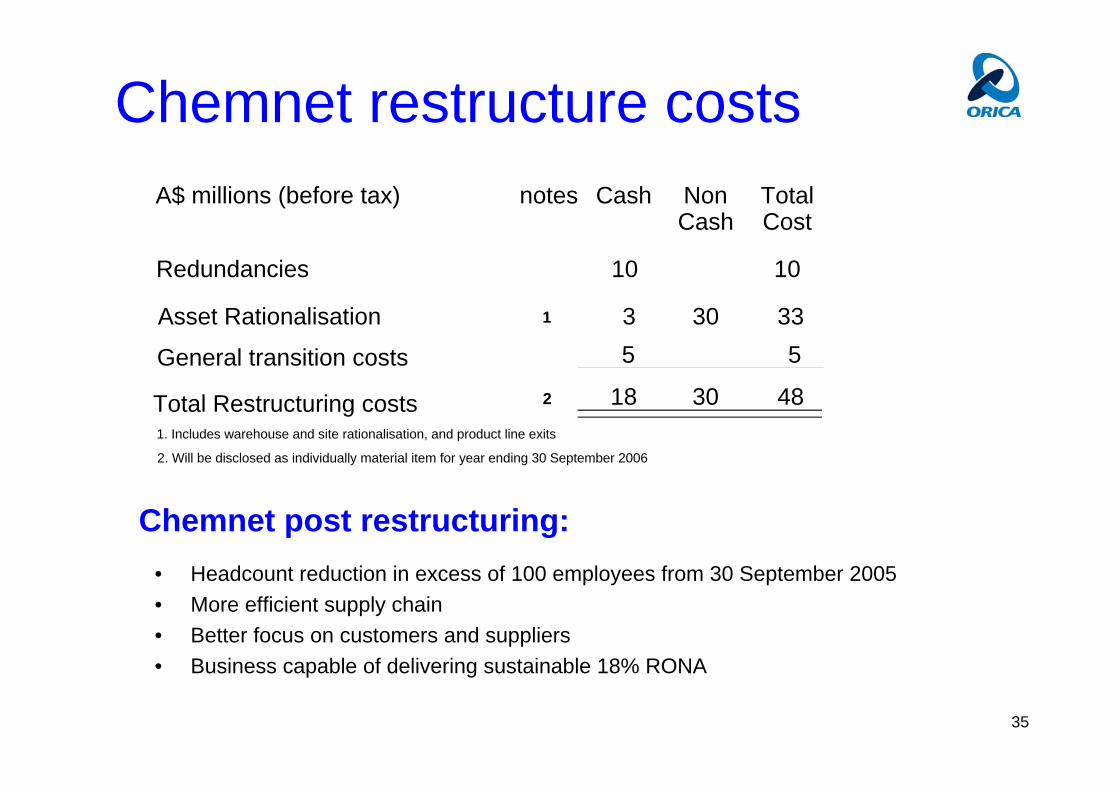
Chemnet restructure costs
1. Includes warehouse and site rationalisation, and product line exits
2. Will be disclosed as individually material item for year ending 30 September 2006
A$ millions (before tax) notes Cash Non TotalCash Cost
Redundancies 10 10
Asset Rationalisation 1 3 30 33
General transition costs 5 5
Total Restructuring costs 2 18 30 48
• Headcount reduction in excess of 100 employees from 30 September 2005• More efficient supply chain• Better focus on customers and suppliers• Business capable of delivering sustainable 18% RONA
Chemnet post restructuring:

36
Dyno businesses already transferred to Orica:VenezuelaThailandSlovakiaSwitzerlandPhilippinesPapua New GuineaIndonesiaChile
Transferred businesses represent 16% of Dynorevenue
Dyno acquisition - update
We remain confident of achieving synergy targets

37
Integration Progress to Date:
– 10 person integration team based in London
– Appointed MD’s of EMEA & Latin America
– No loss of customers from Dyno businesses
– Safety performance maintained
Dyno acquisition - update
We remain confident of achieving synergy targets

38
After the divestment of Incitec Pivot Limited, and excluding earnings from newly acquired Dyno Nobel businesses, earning growth in 2006 compared with 2005, influenced by general economic conditions.
Outlook

1H 2006 ResultsAnnouncement
23 May 2006
40
Supplementary Information

41
Half year ended 31 March 2006
Balance sheet – excluding IPL*
*Estimate subject to final accounting adjustments
March2006
Trade working capital 875M
Net property, plant & equipment 1,774M
Net other assets 1,392M
Net debt (1,423M)
Net Assets 2,618M
Orica shareholders' equity 2,431M
Outside equity interests 187M
Equity 2,618M
Gearing
Sale of IPL Orica excl IPL
35.2%
(263M)
(312M)
15M
0
(560M)
(399M)
(161M)
(560M)
17.9%
Proceeds
799M
799M
799M
612M
1,462M
1,407M
(624M)
2,857M
2,830M
27M
2,857M

42
Half year ended 31 March 2006
Profit & loss – excluding IPL*
*Estimate subject to final accounting adjustments
March2006
Sales Revenue 2,599M
Underlying Results
EBIT 276M
Net Interest (56M)
Tax (61M)
Minority interests (13M)
NPAT and minority interests
Results incl significant items
(23M)Significant items after tax
Sale of IPLOrica excl IPLMarch 2006
123M
(396M)
(42M)
4M
8M
(21M)
14M
116M
2,203M
234M
(51M)
(53M)
125M
(9M)
NPAT and minority interests
146M
(7M)
9M (5M)
Orica excl IPLMarch 2005
111M
1,945M
215M
(44M)
(54M)
114M
(3M)
(4M)
% change
4.5
13.3
8.8
15.9
(2)
9.6
(25)
43
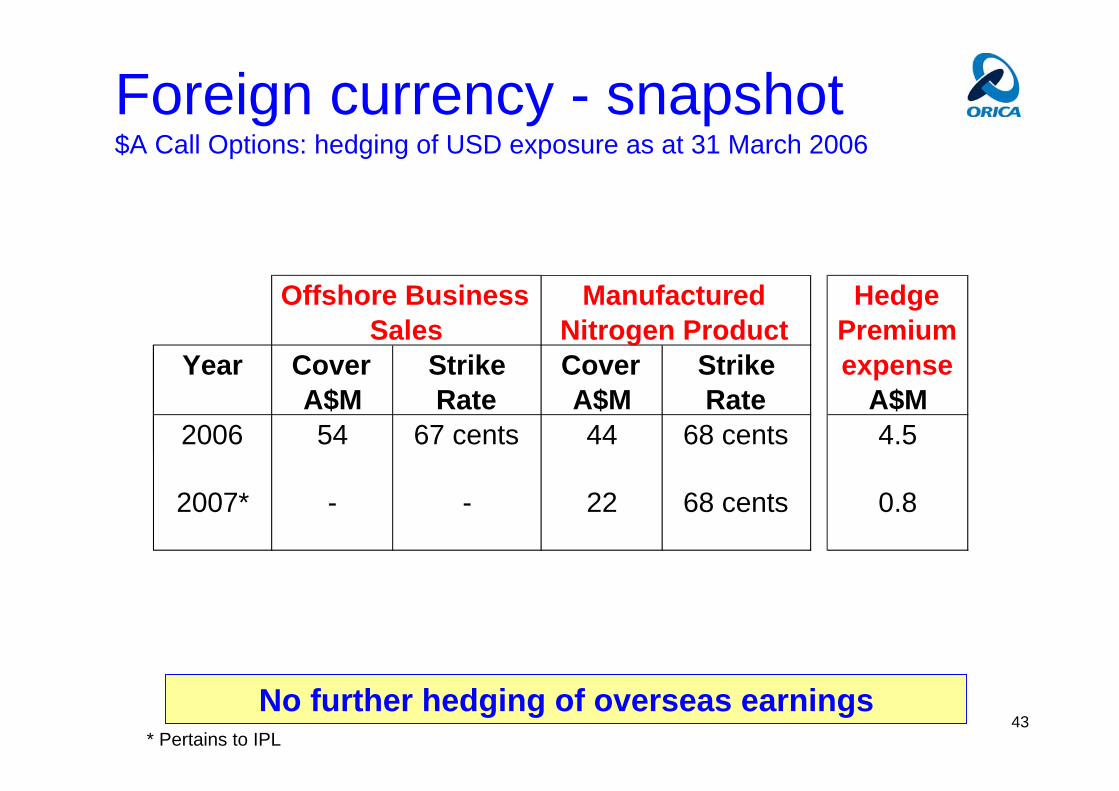
Offshore Business Manufactured HedgeSales Nitrogen Product Premium
Year Cover Strike Cover Strike expenseA$M Rate A$M Rate A$M
2006 54 67 cents 44 68 cents 4.5
2007* - - 22 68 cents 0.8
Foreign currency - snapshot$A Call Options: hedging of USD exposure as at 31 March 2006
No further hedging of overseas earnings* Pertains to IPL

44
50% of Orica’s AUD/USD exposure came from IPL
Every one cent movement in the USD/AUD exchange rate will impact EBIT:
2006 +/- $0.5M 2007 +/- $1.0M
Foreign currency - sensitivity(excluding IPL)


![Wimm-Bill-Dann Foods OJSC [NYSE: WBD] · 5 1H 2006 Operational Highlights • Profitable growth continues in 1H 2006 • New CEO Tony Maher appointed • Beverage segment turnaround](https://static.fdocuments.in/doc/165x107/5f0f51037e708231d4438ee9/wimm-bill-dann-foods-ojsc-nyse-wbd-5-1h-2006-operational-highlights-a-profitable.jpg)