1ARY TABLE OF CONTENTS I
34
I I I I I I I I I I I I I I I I I I I BUDGET SUM1\1ARY TABLE OF CONTENTS Pinellas County Organization Chart . . . . . . . . . . . . . . . . . . . . . . . . . . . B-2 Description of Pinellas County Government . . . . . . . . . . . . . . . . . . . . . . B-3 Introduction to the County Budget Document for FY99 . . . . . . . . . . . . . . B-4 Appropriations and Sources Table . . . . . . . . . . . . . . . . . . . . . . . . . . . . B-6 Ad Valorem and Millages Table . . . . . . . . . . . . . . . . . . . . . . . . . . . . . B-7 Operating Budget Comparison . . . . . . . . . . . . . . . . . . . . . . . . . . . . . . B-8 Capital Budget Comparison . . . . . . . . . . . . . . . . . . . . . . . . . . . . . . . . B-10 Operating and Capital Summary . . . . . . . . . . . . . . . . . . . . . . . . . . . . . B-10 Operating and Capital Graphics . . . . . . . . . . . . . . . . . . . . . . . . . . . . . . B-11 Resources and Balances . . . . . . . . . . . . . . . . . . . . . . . . . . . . . . . . . . . B-12 Appropriations by Function and Activity ........................ B-13 Sources and Uses Graphics ................................ B-14 Long Term Debt Structure for Pinellas County . . . . . . . . . . . . . . . . . . . . B-15 Total Fund Budgets ..................................... B-16 Personnel Position Comparison . . . . . . . . . . . . . . . . . . . . . . . . . . . . . . B-18 Personnel Position Comparison Summary ....................... B-19 Schedule of Budget Transfers ............................... B-20 Economic Trends and Major Revenues ......................... B-21 Population ..................................... B-25 Number of Visitors - St. Petersburg/Clearwater ............. B-25 Unemployment Statistics ........................... B-26 Total Labor Force ................................ B-26 Housing Units Permitted ................... . ....... B-27 Taxable Sales ................................... B-27 Taxable Value: County-wide ........................ B-28 Taxable Value: County-wide New Construction ............ B-28 Taxable Value: MSTU ............................ B-29 Taxable Value: MSTU New Construction ................ B-29 County-wide Aggregate Property Tax Rates ............... B-30 County-wide Property Tax Collections .................. B-30 MSTU Property Tax Rate ........................... B-31 MSTU Property Tax Collections ...................... B-31 Penny for Pinellas ................................ B-32 Local Option Gas Tax ....... . ..................... B-32 1 h Cent Sales Tax ................................ B-33 State Revenue Sharing ............................. B-33 Tourist Development Tax ........................... B-34 General Fund Beginning Fund Balance .................. B-34 B-1
Transcript of 1ARY TABLE OF CONTENTS I
I I I I I I I I I I I I I I I I I I I
BUDGET SUM1\1ARY TABLE OF CONTENTS
Pinellas County Organization Chart . . . . . . . . . . . . . . . . . . . . . . . . . . . B-2 Description of Pinellas County Government . . . . . . . . . . . . . . . . . . . . . . B-3 Introduction to the County Budget Document for FY99 . . . . . . . . . . . . . . B-4 Appropriations and Sources Table . . . . . . . . . . . . . . . . . . . . . . . . . . . . B-6 Ad Valorem and Millages Table . . . . . . . . . . . . . . . . . . . . . . . . . . . . . B-7 Operating Budget Comparison . . . . . . . . . . . . . . . . . . . . . . . . . . . . . . B-8 Capital Budget Comparison . . . . . . . . . . . . . . . . . . . . . . . . . . . . . . . . B-10 Operating and Capital Summary . . . . . . . . . . . . . . . . . . . . . . . . . . . . . B-10 Operating and Capital Graphics . . . . . . . . . . . . . . . . . . . . . . . . . . . . . . B-11 Resources and Balances . . . . . . . . . . . . . . . . . . . . . . . . . . . . . . . . . . . B-12 Appropriations by Function and Activity ........................ B-13 Sources and Uses Graphics ................................ B-14 Long Term Debt Structure for Pinellas County . . . . . . . . . . . . . . . . . . . . B-15 Total Fund Budgets ..................................... B-16 Personnel Position Comparison . . . . . . . . . . . . . . . . . . . . . . . . . . . . . . B-18 Personnel Position Comparison Summary ....................... B-19 Schedule of Budget Transfers ............................... B-20
Economic Trends and Major Revenues ......................... B-21 Population ..................................... B-25 Number of Visitors - St. Petersburg/Clearwater ............. B-25 Unemployment Statistics ........................... B-26 Total Labor Force ................................ B-26 Housing Units Permitted ................... . ....... B-27 Taxable Sales ................................... B-27 Taxable Value: County-wide ........................ B-28 Taxable Value: County-wide New Construction ............ B-28 Taxable Value: MSTU ............................ B-29 Taxable Value: MSTU New Construction ................ B-29 County-wide Aggregate Property Tax Rates ............... B-30 County-wide Property Tax Collections .................. B-30 MSTU Property Tax Rate ........................... B-31 MSTU Property Tax Collections ...................... B-31 Penny for Pinellas ................................ B-32 Local Option Gas Tax ....... . ..................... B-32 1h Cent Sales Tax ................................ B-33 State Revenue Sharing ............................. B-33 Tourist Development Tax ........................... B-34 General Fund Beginning Fund Balance .................. B-34
B-1
PINELLAS COUNTY GOVERNMENT CITIZENS
STATE ATTORNEY
ASSISTANT COUNTY AOMINSTRATOR
SOCIAL SERVICES
ANIMAL SERVICES
COMMUNITY DEVELOPMENT
EMERGENCY COMMUNICATIONS
/9-1-1
COOPERATIVE EXTENSION
SERVICE
EMERGENCY MANAGEMENT
JUSTICE COORDINATION
EMS ANO FIRE ADMINISTRATION
VETERANS SERVICES
CONSUMER PROTECTION
Admlnstrallv• Coordlnallon
HEALTlt DEPARTMENT MEDICAL EXAMINER/FORENSIC
LABORATORY PASCO-PINELLAS HEALTH COUNCIL
HEALTH FACILITES AUTHORITY ALCOHOL, DRUG ABUSE, & MENTAL
FO~iB~11~~:N~~~~~1A~t:c~tr" EMPLOYMENT & DEVELOPMENT CQUrlCIL
COOPERATIVE LIBRARY SYSTfM •• LAW LIBRARIES ' · >!
a, I
N
- - - -
PUBLIC DEFENDER
SHERIFF
MANAGEMENT INFORMATION
SERVICES BOA AO
UNIFIED PERSONNEL
BOARD
MANAGEMENT & BUOGET INTERNAL REVIEW
ASSISTANT COUNTY ADMINSTRAfOR
PLANNING
PARK
HERITAGE VILLAGE
DEVELOPMENT REVIEW
SERVICES
CONSTRU.;TJON I ICENS,IIG
BOAnO
Admllflstrative CoordinaliCMI with
-c I I I
I I I I I
PINELLAS PLANNING COUNCIL .J METROPOLITAN PLANNING ORGANIZATION TAMPA BAY REGIONAL PLANNING COUNCIL
- - - -
• I I I
~---------------· .. ~~~~~~~~~ .. I I ~
COUNTY ADMINISTRATOR
ASSISTANT COUNTY ADMINSTRATOR
PURCHASING
GENERAL SERVICES
PUBLIC AFFAIRS
RISK MANAGEMENT
FLEET MANAGEMENT
EMPLOYEE RELATIONS
BCC INFORMATION
SYSTEMS
Admlnslr1llv1 Coordinalion with
COOPERATIVE LIBRARY SYSTEM
PERSONNEL HUMAN RIGHTS MANAGEMENT INFORMATION
SERVICES
- -
I I I I I I I I I
COUNTY ATTORNEY
ASSISTANT COUNTY ADMINSTRATOR
ECONOMIC OEVELOP~1ENT
AIRPORT
STAR CENTEl~J
ST.PETE/CLWTR A1'EA
CONVENTION VISITORS BUREA
Admlnsllallve C.oordlnation with
I.. TN.4PA8AYPARTIERSHf' USF
RS CY' co.4MERCl SP.JC
V(}lEOi WNJE.S BOAm
- -
PROPERTY APPRAISER
SUPERVISOR OF ELECTIONS
•• TAX COLLECTOR
-
ASSISTANT COUNTY ADMINISTRATOR INTER-GOVERNMENTAL
COORDINATION LEGISlATION
DIRECTOR OF PUBLIC WORKS
LAND SURVEY
CONSTRUCTION
COASTAL MANAGEMENT
MOSQUITO CONTROL
ENGINEERING
TRAFFIC
HIGHWAY
Admlnslrativ1 Coordinallon wllh
SOUTHWEST FLORIDA WATER MANAGEMENT
DISTRICT
- - -
DIRECTOR OF UTILITIES
CUSTOMER SERVICE
OPERATIONS
SOLID WASTE OPERATIONS
GENERAL MAINTENANCE DEPARTMENT
LABORATORY
ENGINEERING
FINANCE
ALTERNATE WATER
SOURCES
Admlnslrallve Coordination wilh
WEST COAST REGIONAL WATER SUPPLY AUTHORITY
SOUTHWEST FLORIDA WATER MANAGEMENT DISTRICT
PINELLAS ANCLOTE RIVER BASIN
LEGEND
- DIRECT AUTHORITY • • • • COORDINATED RESPONSIBILITY
PAEPAAED BY Pln.ttea County PubHc Aff1k1 121 ON Awtnue, C .. wwa,.,, FL H7H 414·4'00Ap,U1NI
- - -
I I I I I I I I I I I I I I I I I I I
A DESCRIPTION OF PINELLAS COUNTY
GOVERNMENT
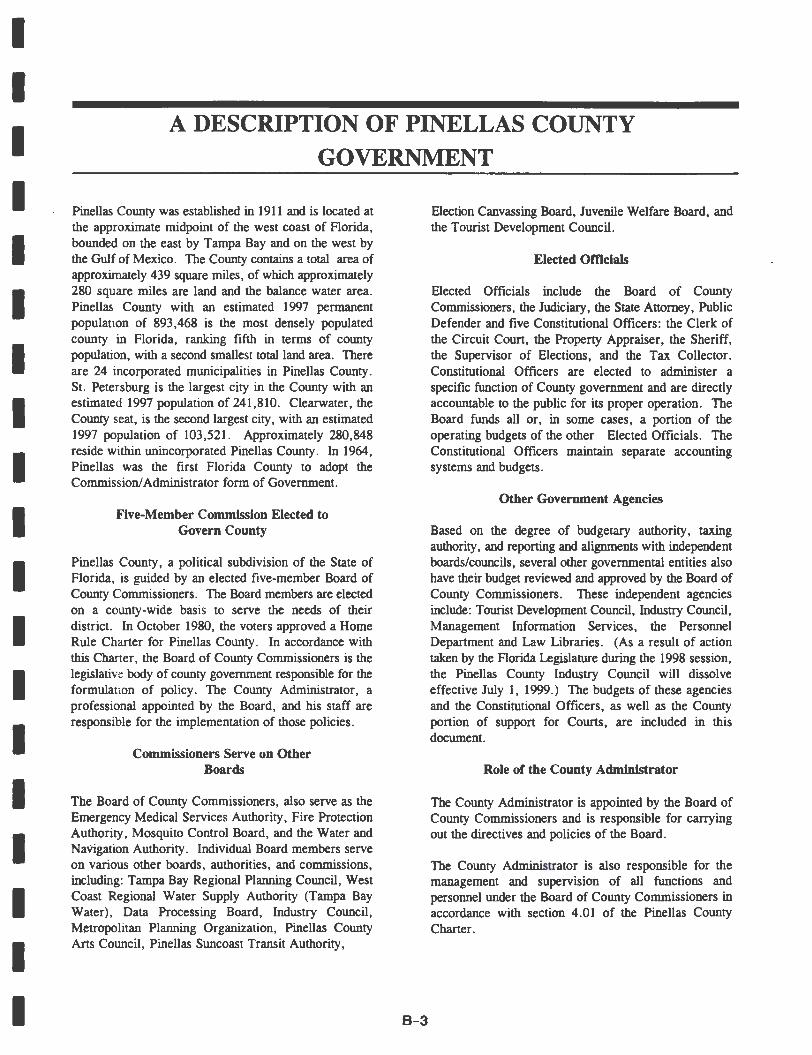
Pinellas County was established in 1911 and is located at the approximate midpoint of the west coast of Florida, bounded on the east by Tampa Bay and on the west by the Gulf of Mexico. The County contains a total area of approximately 439 square miles, of which approximately 280 square miles are land and the balance water area. Pinellas County with an estimated 1997 permanent population of 893,468 is the most densely populated county in Florida, ranking fifth in terms of county population, with a second smallest total land area. There are 24 incorporated municipalities in Pinellas County . St. Petersburg is the largest city in the County with an estimated 1997 population of 241, 810. Clearwater, the County seat, is the second largest city, with an estimated 1997 population of 103,521. Approximately 280,848 reside within unincorporated Pinellas County. In 1964, Pinellas was the first Florida County to adopt the Commission/ Administrator form of Government.
Five-Member Commission Elected to Govern County
Pinellas County, a political subdivision of the State of Florida, is guided by an elected five-member Board of County Commissioners. The Board members are elected on a county-wide basis to serve the needs of their district. In October 1980, the voters approved a Home Rule Charter for Pinellas County . In accordance with this Charter, the Board of County Commissioners is the legislative body of county government responsible for the formulat ion of policy. The County Administrator, a professional appointed by the Board, and his staff are responsible for the implementation of those policies.
Commissioners Serve on Other Boards
The Board of County Commissioners, also serve as the Emergency Medical Services Authority, Fire Protection Authority, Mosquito Control Board, and the Water and Navigation Authority. Individual Board members serve on various other boards, authorities, and commissions, including: Tampa Bay Regional Planning Council, West Coast Regional Water Supply Authority (Tampa Bay Water) , Data Processing Board, Industry Council, Metropolitan Planning Organization, Pinellas County Arts Council, Pinellas Suncoast Transit Authority,
B-3
Election Canvassing Board, Juvenile Welfare Board, and the Tourist Development Council.
Elected Officials
Elected Officials include the Board of County Commissioners, the Judiciary, the State Attorney, Public Defender and five Constitutional Officers: the Clerk of the Circuit Court, the Property Appraiser, the Sheriff, the Supervisor of Elections, and the Tax Collector. Constitutional Officers are elected to administer a specific function of County government and are directly accountable to the public for its proper operation. The Board funds all or, in some cases, a portion of the operating budgets of the other Elected Officials. The Constitutional Officers maintain separate accounting systems and budgets.
Other Government Agencies
Based on the degree of budgetary authority, taxing authority, and reporting and alignments with independent boards/councils, several other governmental entities also have their budget reviewed and approved by the Board of County Commissioners. These independent agencies include: Tourist Development Council, Industry Council, Management Information Services, the Personnel Department and Law Libraries. (As a result of action taken by the Florida Legislature during the 1998 session, the Pinellas County Industry Council will dissolve effective July 1, 1999.) The budgets of these agencies and the Constitutional Officers, as well as the County portion of support for Courts, are included in this document.
Role of the County Administrator
The County Administrator is appointed by the Board of County Commissioners and is responsible for carrying out the directives and policies of the Board.
The County Administrator is also responsible for the management and supervision of all functions and personnel under the Board of County Commissioners in accordance with section 4.01 of the Pinellas County Charter.
INTRODUCTION TO THE COUNTY BUDGET DOCUMENT FOR FY99
The Pinellas County FY99 Annual Operating and Capital Budget document is designed in a user friendly fashion. The book is divided by a series of tabs, with each tab representing a major functional or organizational division in the budget. The first three tabs are the Table of Contents, Budget Message, and Summaries. The Budget Message offers a transmittal letter from the County Administrator to the Board of County Commissioners presenting the Budget Document. The Summaries section contains a series of charts and tables that present the budget in an aggregated fashion together with various economic and population trend data for Pinellas County. For those users of the document requiring only a high level overview, these two sections will provide sufficient information.
The next series of six tabs contain budgets based on organizational responsibility. The tabs are as follows:
County Administrator Administrator Public Works Administrator Enterprise Funds
Elected Officials Court Support Independent Agencies
The next three tabs, Support Funding, Debt Service, and Capital, provide those budgets whose funding and appropriations are typically associated with the entire organization and not specific to any one entity.
The majority of the preceding sections are
organized in the following manner: Please note that certain page types may not appear in all sections due to the nature of that particular section. The label for each page type described below appears in the lower left hand corner of each page.
1.) Oc,:anization Department Summm:y Following each tab is a roll-up of the major departments, agencies or funding types;tbat are contained in that section. This roll-up also serves as a table of contents for the particular section.
2.) Department Center Listin1: This page type is the summary for each of the individual departments and independent agencies. In order to distinguish the department center listing page from the other page types, this page is printed on gray paper. The page is divided into four sections. The top section consists of a brief narrative describing the department. The next section, Department Expenditures by Cost Center, consists of a listing ot;alL . .cost centers relating to the particular department. : The following section, Department Expenditures by Fund, lists all of the budgetary funds that the preceding cost centers are appropriated and funded within. If more detailed information is desired regarding a particular fund, please see the Fund/Resource section of the document. The last section of the page lists the permanent full time positions for the particular
B-4
department. ..~:. $,<
3.) Department Account Summm:y This page type consists of two major sections: a
I I I I I I I I I I I I I I I I I I I
I I I I I I I I I I I I I I I I I I I
summary and the account detail. The summary provides a roll-up of all the cost centers within the department at the major object level (i.e. personal services, operating capital, etc.). The account detail section provides a roll-up of all the cost centers within the department at the line item detail (object) level. In order to avoid redundancy, and conserve paper, this page is omitted where the department encompasses only one cost center. The Fund/Center Account Detail contains all this information that would have otherwise appeared on this page.
4.) Fund/Center Account Detail This page type is the building block of the expenditure budget. Each page contains a brief narrative describing what the cost center represents . Often cost centers are only used for accounting and financial reasons and, therefore, do not have service delivery implications. However, to present a full accounting of the County's budget, all cost centers types are shown. The remaining portion of the page contains a line item detail of all the accounts in the cost center.
The Fund/Resources tab contains roll-ups of all the funds contained in the budget and a detailed listing of all budgeted resources. The Fund/Resource Summary page consists of three sections. The first section has a brief narrative describing what the fund's purpose is. As is the case with some of the cost centers, some funds have only an accounting or financial purpose and do not fulfill any direct public service. However, to provide a complete picture of the County's budget, all budgeted funds are contained in this document. The second section of the page, the Resource Summary, lists by major revenue category the resources that support the fund. The last section of the page lists
B- 5
those departments with appropriations within · the fund. Following the Fund/Resource Summary is a Detailed Resource Estimate page which lists all resources for the fund at the line item detail (object) level.
a, I 0,
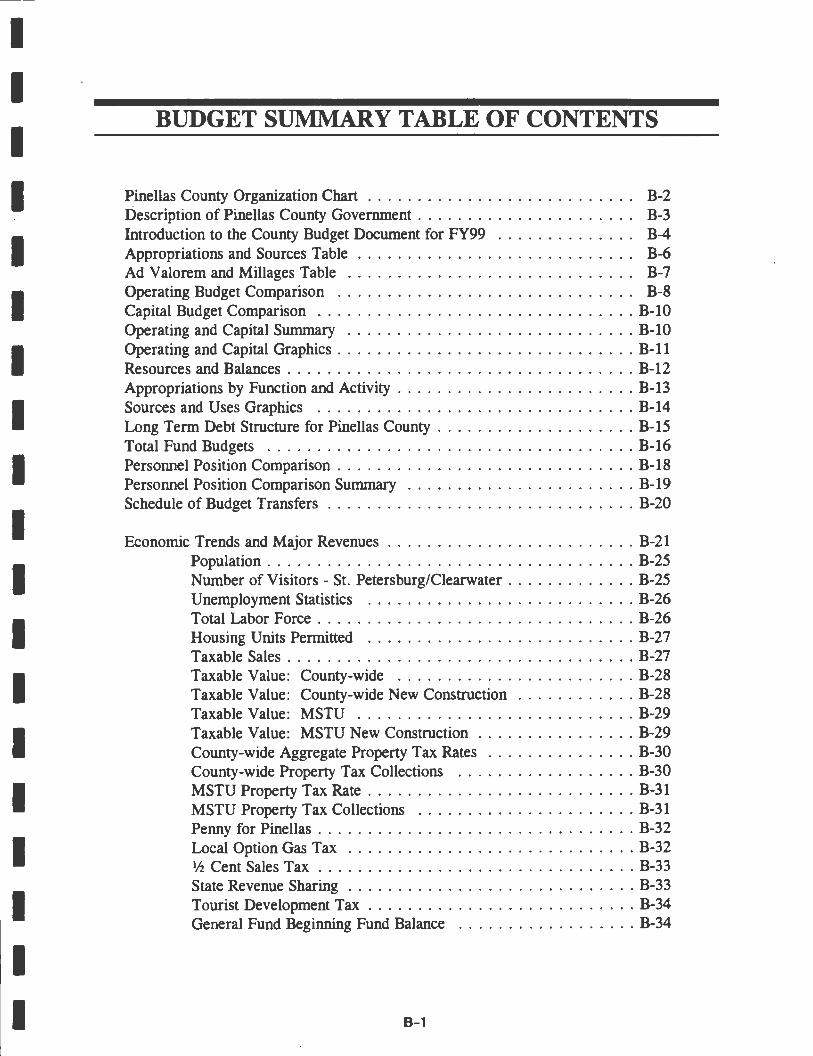
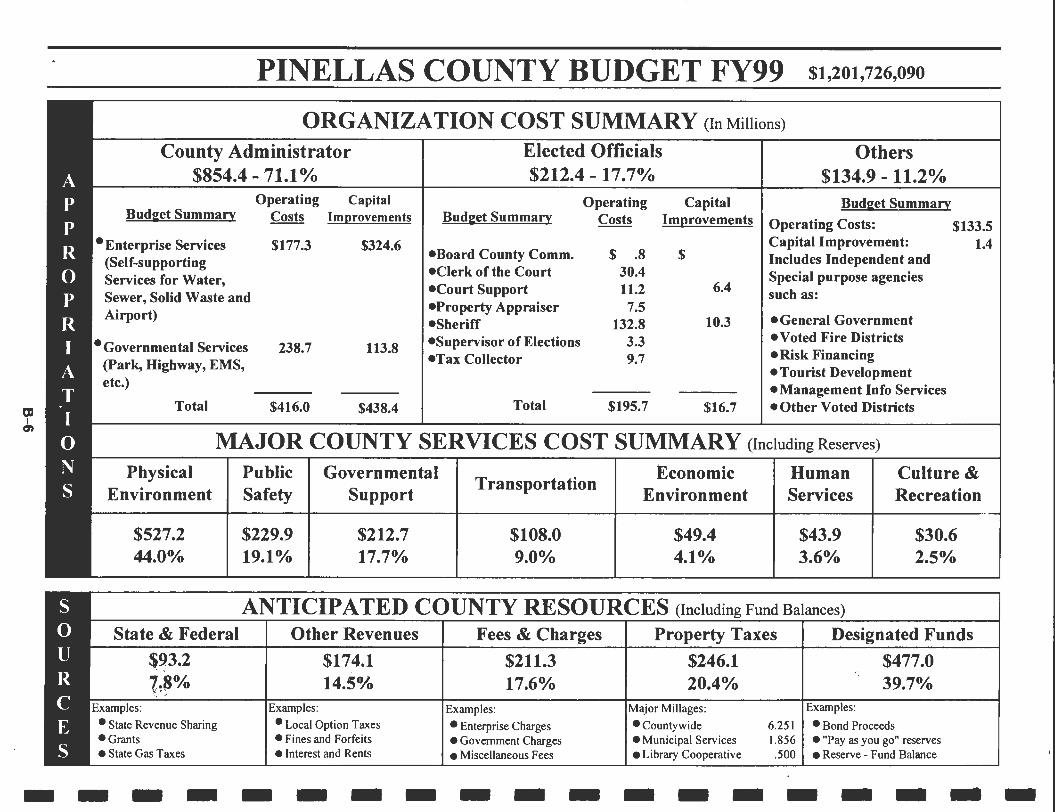
PINELLAS COUNTY BUDGET FY99 s1,201,126,09o
ORGANIZATION COST SUMMARY (In Millions)
County Administrator Elected Officials Others $854.4 - 71.1 °/o $212.4 -17.7%, $134.9 - 11.2%,
Operating Capital Operating Capital Budget Summan: Budget Summan: Costs Improvements Budget Summan: Costs lm(!rovements Operating Costs: $133.5
•Enterprise Services $177.3 $324.6 Capital Improvement: 1.4 (Self-supporting •Board County Comm. $ .8 $ Includes Independent and
Services for Water, •Clerk of the Court 30.4 Special purpose agencies
Sewer, Solid Waste and •Court Support 11.2 6.4 such as:
Airport) •Property Appraiser 7.5 •Sheriff 132.8 10.3 • General Government
•Governmental Services •Supervisor of Elections 3.3 • Voted Fire Districts 238.7 113.8
(Park, Highway, EMS, •Tax Collector 9.7 • Risk Financing • Tourist Development
etc.) • Management Info Services Total $416.0 $438.4 Total $195.7 $16.7 • Other Voted Districts
MAJOR COUNTY SERVICES COST SUMMARY (Including Reserves)
Physical Environment
$527.2 44.0%,
State & Federal
$~3.2 ! :.>
l,ff% -; ':f ..
Examples:
• State Revenue Sharing •Grants • State Gas Taxes
Public Safety
$229.9 19.1 %,
Governmental Support
$212.7 17.7°/o
Transportation
$108.0 9.0°/o
Economic Environment
$49.4 4.1%
Human Services
$43.9 3.6%
Culture & Recreation
$30.6 2.5%,
ANTICIPATED COUNTY RESOURCES (Including Fund Balances)
Other Revenues Fees & Charges Property Taxes Designated Funds
$174.1 $211.3 $246.1 $477.0 14;'5% 17.6% 20.4°/o
;:;
39.7% Examples: Examples: Major Millages: Examples:
• Local Option Taxes • Enterprise Charges • Countywide 6.251 • Bond Proceeds • Fines and Forfeits • Government Charges • Municipal Services 1.856 • "Pay as you go" reserves • Interest and Rents • Miscellaneous Fees • Library Cooperative .500 • Reserve - Fund Balance
-------------------
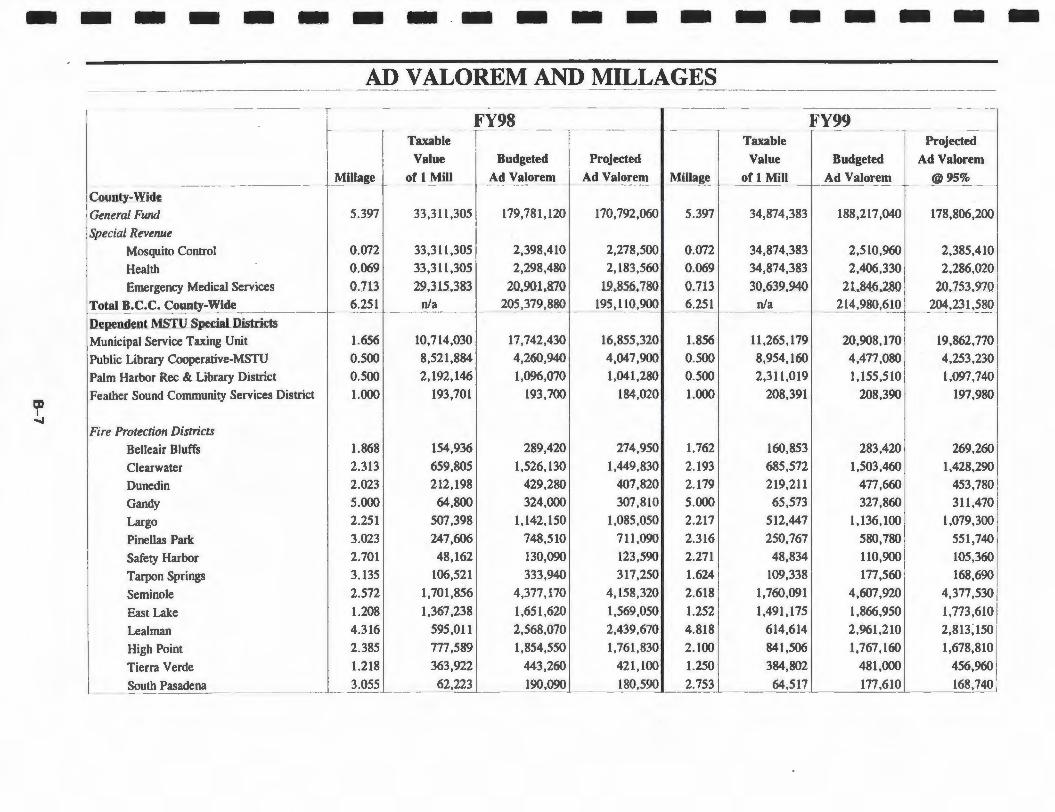
-------------------AD V ALOREM AND MILLAGES
----------- - - - - -- ----- -
--- ---- ------FY98 FY99 - -- ~ -
Taxable Taxable Projected
Value Budgeted Projected Value Budgeted Ad Valorem
_Millage of l Mill Ad Valorem Ad Valorem M!llage _ of l Mill Ad Valorem @95% ---·-· ---- - --- - - - -- -
CQUDty-Wid_e General Fund 5.397 33,311,305 179,781,120 170, 792,060 5.397 34,874,383 188,217,040 178,806,200
Special Revenue Mosquito Control 0.072 33,311,305 2,398,410 2,278,500 0.072 34,874,383 2,510,960 2,385,410
Health 0.069 33,311,305 2,298,480 2,183,560 0.069 34,874,383 2,406,330 2,286,020
Emergency Medical Services Q.113_ 22.lli.181 20.20-1_.810 12..85~ (Ul3_ 3Jtfil2.MO 2L~.2.8Q 20,753,970
~o~l J}.C.~. County-~ide_ 6.251 n/a _ 205,379,880 195, 110,900 6.251 n/a 214,980,610 _2Q<!,23 ~?80 - --- ---- -~ -D_epe.ndentMSTIJ _,5pe.cial.Oisttids Municipal Service Taxing Unit l.656 10,714,030 17,742,430 16,855,320 1.856 11,265,179 20,908,170 19,862,770
Public Library Cooperative-MSTU 0.500 8,521,884 4,260,940 4,047,900 0.500 8,954,160 4,477,080 4,253,230
Palm Harbor Rec & Library District 0.500 2, 192, 146 1,096,070 1,041,280 0.500 2,311,019 1,155,510 1,097,740
Feather Sound Community Services District l.000 193,701 193,700 184,020 1.000 208,391 208,390 197,980 a, I
--.I Fire Protection Districts
Belleair Bluffs l.868 154,936 289,420 274,950 1.762 160,853 283,420 269,260
Clearwater 2.313 659,805 1,526,130 1,449,830 2.193 685,572 1,503,460 1,428,290
Dunedin 2.023 212,198 429,280 407,820 2.179 219,211 477,660 453,780
Gandy 5.000 64,800 324,000 307,810 5.000 65,573 327,860 311,470
Largo 2.251 507,398 1,142,150 1,085,050 2.217 512,447 1,136,100 1,079,300
Pinellas Park 3.023 247,606 748,510 711,090 2 .316 250,767 580,780 551,740
Safety Harbor 2.701 48,162 130,090 123,590 2.271 48,834 110,900 105,360
Tarpon Springs 3.135 106,521 333,940 317,250 1.624 109,338 177,560 168,690
Seminole 2.572 1,701,856 4,377,170 4,158,320 2.618 1,760,091 4 ,607,920 4,377,530
East Lake 1.208 1,367,238 1,651,620 1,569,050 1.252 1,491,175 1,866,950 1,773,610
Leal man 4 .316 595,011 2,568,070 2,439,670 4.818 614,614 2,961,210 2,813,150
High Point 2 .385 777,589 1,854,550 1,761,830 2.100 841,506 1,767,160 1,678,810
Tierra Verde 1.218 363,922 443,260 421,100 1.250 384,802 481,000 456,960
South Pasadena 3.055 62,223 190,029 180,590 2.753 64,517 177,610 168,74Q_j - - - - - --- - - -
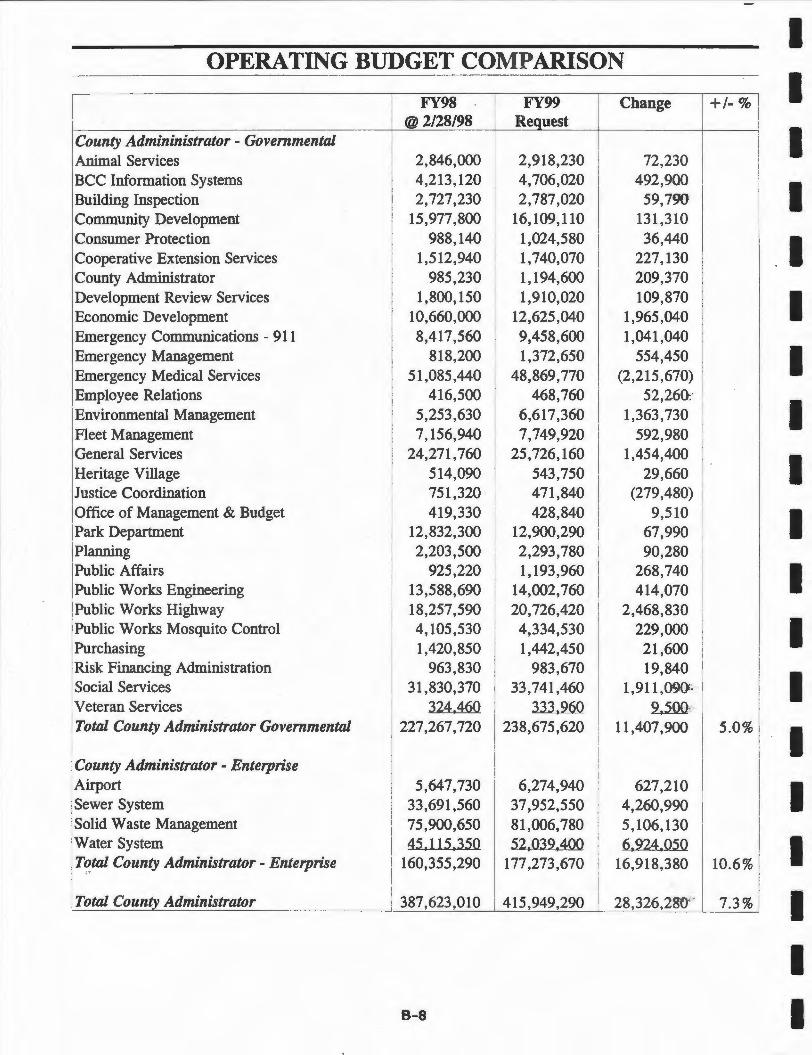
OPERATING BUDGET COM ARISON
FY98 FY99 Change @2/28/98 Request
County Admininistrator - Governmental Animal Services 2,846,000 2,918,230 72,230 BCC Information Systems 4,213, 120 4,706,020 492,900 Building Inspection 2,727,230 2,787,020 59,790 Community Development 15,977,800 16,109,110 131,310 Consumer Protection 988,140 1,024,580 36,440 Cooperative Extension Services 1,512,940 1,740,070 227,130 County Administrator 985,230 1,194,600 209,370 Development Review Services 1,800,150 1,910,020 109,870 Economic Development 10,660,000 12,625,040 1,965,040 Emergency Communications - 911 8,417,560 9,458,600 1,041,040 Emergency Management 818,200 1,372,650 554,450 Emergency Medical Services 51,085,440 48,869,770 (2,215,670) Employee Relations 416,500 468,760 52,260:· I Environmental Management 5,253,630 6,617,360 1,363,730 I Fleet Management 7,156,940 7,749,920 592,980 General Services 24,271,760 25,726,160 1,454,400 Heritage Village 514,090 543,750 29,660 Justice Coordination 751,320
I 471,840 (279,480)
Office of Management & Budget 419,330 428,840 9,510 I Park Department 12,832,300 12,900,290 67,990
Planning 2,203,500 2,293,780 90,280 Public Affairs 925,220 1,193,960 268,740 Public Works Engineering 13,588,690 14,002,760 414,070 Public Works Highway 18,257,590 20,726,420 2,468,830 Public Works Mosquito Control 4, 105,530 4,334,530 229,000 Purchasing 1,420,850 1,442,450 21,600 Risk Financing Administration 963,830 983,670 19,840 Social Services 31,830,370 33,741 ,460 1,911,090G Veteran Services 324,460 333.260 ~ ' I Total County Administrator Governmental 227 ,267, 720 238,675,620 11,407,900
County Administrator - Enterprise Airport 5,647,730 6,274,940 627,210 Sewer System 33,691,560 37,952,550 4,260,990 Solid Waste Management 75,900,650 81,006,780 5,106,130 Water System 45,115,350 52,032,400 6.224,050 T'!_tal County Administrator - Enterprise 160,355,290 177 ,273,670 16,918,380
Total County Administrator 387,623,010 415,949,290 28,326,28()"'
B-8
+I-%
5.0%
10.6%
7.3%
I I I I I I I I I I I I I I I I I I I
I I I I I I I I I I I I I I I I I I I
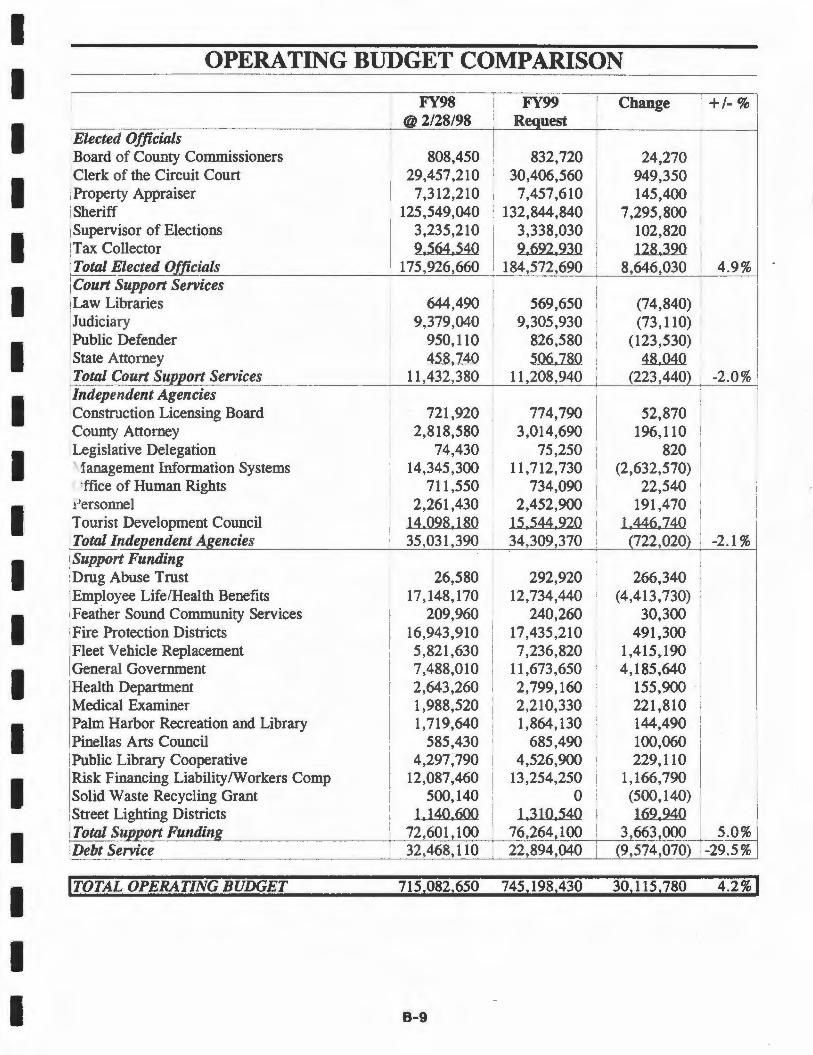
OPERA TING BUDGET COMPARISON
i FY98 I FY99
I Change I +/-%
@ 2/28/98 I Request - I
Elected Officials I
I Board of County Commissioners 808,450 ' 832,720 24,270 Clerk of the Circuit Court 29,457,210 ' 30,406,560 949,350 I
I
I Property Appraiser I 7,312,210 7,457,610 145,400 ! !Sheriff 125,549,040 I 132,844,840 7,295,800 jSupervisor of Elections I 3,235,210 i 3,338,030 102,820
I JTax Collector I 2,564,540 ! 2.622.230 128.320 Total Elected Officials 175,926,660 I 184,572,690 8,646,030 4.9% Court Support Services I
I
Law Libraries 644,490 I 569,650 (74,840) Judiciary 9,379,040 I 9,305,930 (73,110) Public Defender 950,110 I 826,580 (123,530) State Attorney I 458,140 506.180 I 48.040 I I Total <;ourt Supp__ort Services
I
11,432,380 11,208,940 I
(223,440) -2.0% ' I
!Independent Agencies ' I ' I
I Construction Licensing Board 721,920 I 774,790 I 52,870 ' I I County Attorney 2,818,580 I 3,014,690 196,110 I
'. Legislative Delegation I 74,430 I 75,250 820 ' fanagement Information Systems I 14,345,300
I
11,712,730 (2,632,570) I
ffice of Human Rights 711,550 734,090 22,540 I 1Jersonnel 2,261,430 2,452,900 191,470 I Tourist Development Council 14.028.180 15,544.220 1,446,140
I
I Total Independent Agencies I 35,031,390 ' 34,309,370 (722,020) : -2.1 % ! Support Funding
' I !Drug Abuse Trust 26,580 292,920 266,340 [Employee Life/Health Benefits 17,148,170 12,734,440 (4,413,730) I !Feather Sound Community Services 209,960 I 240,260 30,300 !Fire Protection Districts 16,943,910 I 17,435,210 491,300
I I !
!Fleet Vehicle Replacement I 5,821,630 7,236,820 I
1,415,190 General Government 7,488,010 11,673,650 4,185,640
I Health Department 2,643,260 2,799,160 155,900 I
Medical Examiner 1,988,520 I
2,210,330 221,810 I I Palm Harbor Recreation and Library 1,719,640 1,864,130 144,490
, Pinellas Arts Council 585,430 I 685,490 100,060 I
Public Library Cooperative 4,297,790 4,526,900 229,110 Risk Financing Liability IW orkers Comp 12,087,460 13,254,250 1, 166,790 Solid Waste Recycling Grant 500,140 0 (500,140) Street Lighting Districts I 1.140,600 1.310,540 162.240 I Total Suooort Funding I 72,601,100 76,264,100 3,663,000 5.0% Debt Service 32,468,110 22,894,040 i (9,574,070) 1-29.5%
ITOTAL OPERATING BUDGET 715,082,650 745,198,430 30,115,780 4.2% 1
B-9
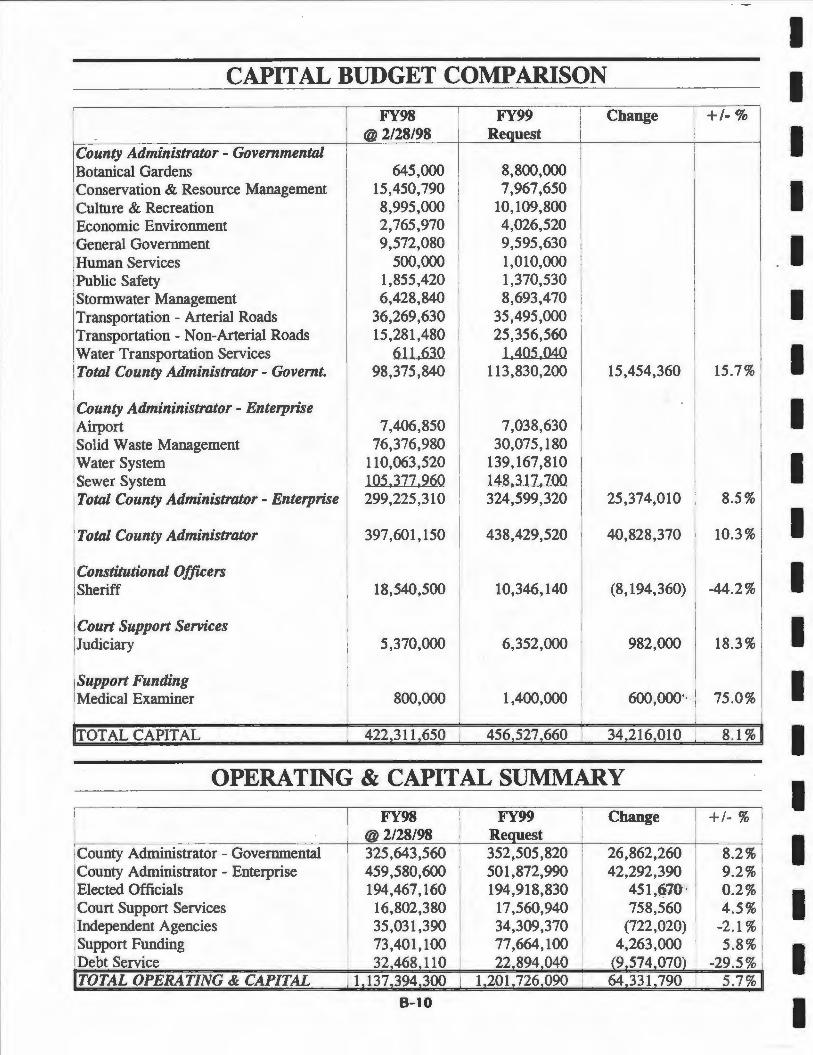
CAPITAL BUDGET COMPARISON
FY98 FY99 Change @2/28/98 Reau est
County Administrator - Governmental Botanical Gardens 645,000 8,800,000 Conservation & Resource Management 15,450,790 7,967,650 Culture & Recreation 8,995,000 10,109,800 Economic Environment 2,765,970 4,026,520 General Government 9,572,080 9,595,630 Human Services 500,000 1,010,000 Public Safety 1,855,420 1,370,530 Stormwater Management 6,428,840 8,693,470 Transportation - Arterial Roads 36,269,630 35,495,000 Transportation - Non-Arterial Roads 15,281 ,480 25,356,560 Water Transportation Services 611 .630 l,4Q5,Q4Q Total County Administrator - Govemt. 98,375,840 113,830,200 15,454,360
I
I County Admininistrator - Enterprise .
Airport 7,406,850 7,038,630 I Solid Waste Management 76,376,980 30,075,180 Water System 110,063,520 139,167,810 I Sewer System 1Q5,3:Z:Z.26Q 148,31:Z,:ZQQ I Total County Administrator - Enterprise 299,225,310 324,599,320 25,374,010
j Total County Administrator I 397,601,150 438,429,520 40,828,370
Constitutional Officers Sheriff 18,540,500 10,346,140 (8, 194,360)
Court Support Services Judiciary 5,370,000 6,352,000 982,000
Support Funding Medical Examiner 800,000
I 1,400,000 600,000'·,
TOT AL CAPITAL 422.311.650 I 456.527 660 34.216 010
OPERATING & CAPITAL SUMMARY
FY98 FY99 Change @ 2/28/98 Reauest
County Administrator - Governmental 325,643,560 352,505,820 26,862,260 County Administrator - Enterprise 459,580,600 501,872,990 42,292,390 Elected Officials 194,467,160 194,918,830 451 ,~70 · Court Support Services 16,802,380 17,560,940 758,560 Independent Agencies 35,031,390 34,309,370 (722,020) Support Funding 73,401,100 I 77,664,100 4,263,000 Debt Service 32.468 110 I 22 894.040 I (9.574.070) TOTAL OPERATING & CAPITAL 1.137.394.300 1.201 726.090 64.331.790
B-10
I I I
I
+I-%
15.7%
8.5%
10.3%
-44.2%
18.3%
75.0%
8.1 %
+I-%
8.2% 9.2% 0.2% 4.5%
-2.1 % 5.8%
-29.5% 5.7%
I I I I I I I I I I I I I I I I I I I
I I I I I I I I I I I I I I I I I I I
300.0
250.0
200.0 VJ c ~ 150.0
~ 100.0
50.0
0.0
OPERATING & CAPITAL
"o
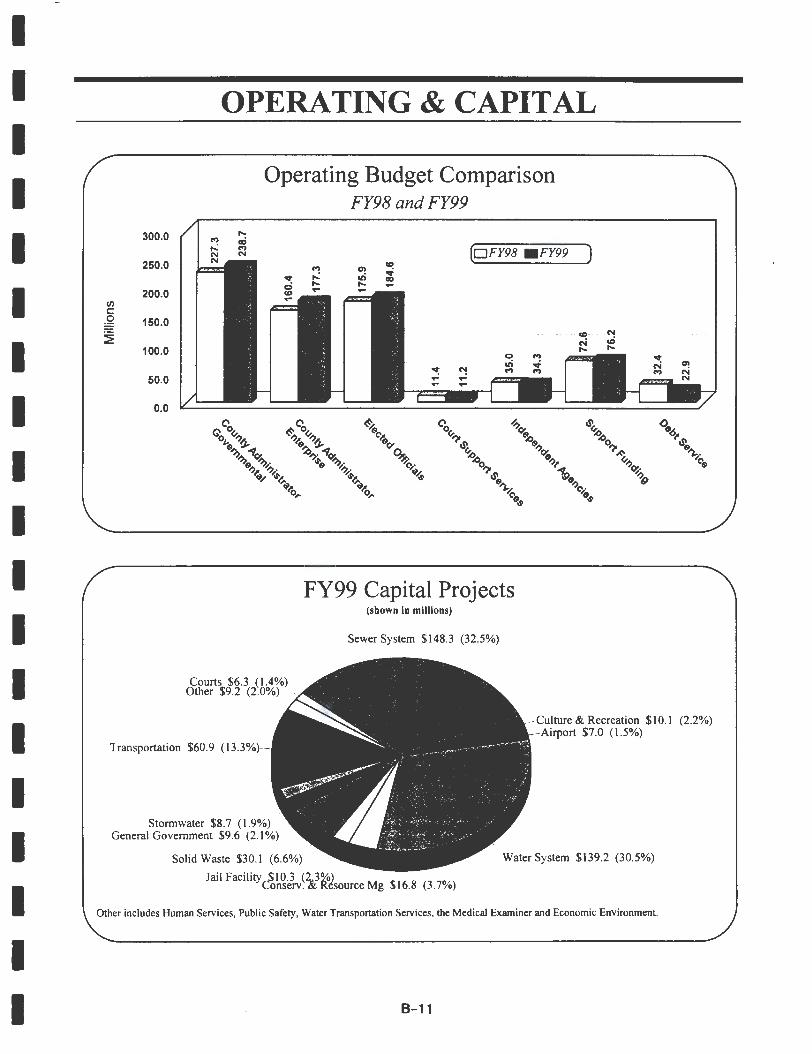
Operating Budget Comparison FY98 and FY99
(DFY98 •FY99 )
"o ~
"": ('! ...... ... ...
"o
······· CO···· .. N c-i co ,... ,...
~ ~
IS'« <>'o ~., ¢; ~., t-,- ~.,, ~
~19"?.~~ '$ ~ 190' IS'« ::019 o.,,
~-)• '1~ ~ ~~ 't ~ ~%
19-, ~ . ~/ ~~
<i>.-, o,.
Courts $6.3 (1.4%) Other $9.2 (2.0%) ,
d'19 ~,,.· C',,.· o? ~,,.· <i>~ .,.., 1$119 .... ~ ~-<"o,.
"19.,
FY99 Capital Projects (shown in millions)
Sewer System $148.3 (32.5%)
19~ ... ~ )).
o;:,. ~19
~C',.· ,9
19,t
<>19 ~ ...
1$119 ~-
C'19
Culture & Recreation $10.1 (2.2%) Airport $7.0 (1.5%)
Transportation $60.9 (13 .3%
Storrnwater $8.7 (1.9%) General Government $9.6 (2 .1%)
Solid Waste $30.1 (6.6%)
Jail Facility $10.3 (2d}%) · M .,16 8
(3 70")
Conserv. °' Resource g ,J) • • , o
Water System $139.2 (30.5%)
Other includes Human Services, Public Safety, Water Transportation Services, the Medical Examiner and Economic Environment.
B-11
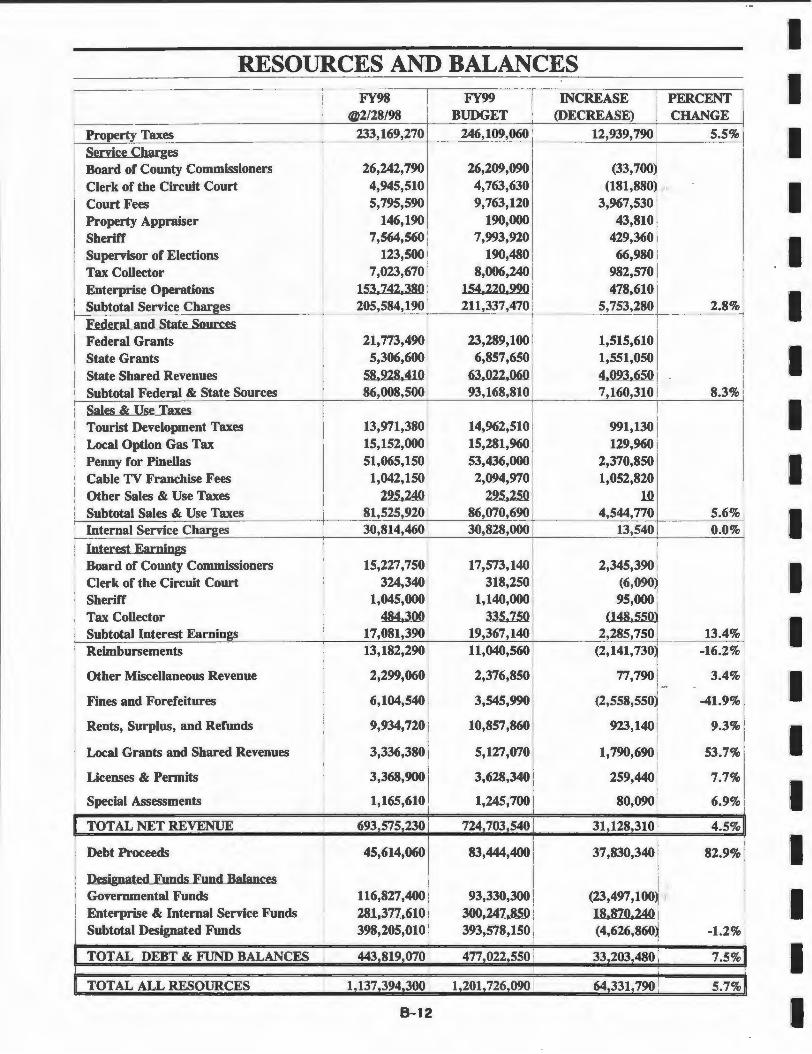
RESOURCES AND BALANCES FY98 FY99 INCREASE
@2/28/98 BUDGET (DECREASE)
Property Taxes 233,169,270 246,109,060 12,939,790
Service Charges Board of County Commissioners 26,242,790 26,209,090 (33,700 Clerk of the Circuit Court 4,945,510 4,763,630 (181,880 ·" Court Fees 5,795,590 9,763,120 3,967,530 Property Appraiser 146,190 190,000 43,810 Sheriff 7,564,560 7,993,920 429,360 Supervisor of Elections 123,500 190,480 66,980 Tax Collector 7,023,670 8,006,240 982,570 Enterprise Operations 153,142,380 154,220,990 478,610 Subtotal Service Charges 205,584,190 211,337,470 5,753,280
Eederal and State Sources Federal Grants 21,773,490 23,289,100 1,515,610 State Grants 5,306,600 6,857,650 1,551,050 State Shared Revenues 58,228,410 63,022,060 4,023,650 Subtotal Federal & State Sources 86,008,500 93,168,810 7,160,310
Sales & Use Taxes Tourist Development Taxes 13,971,380 14,962,510 991,130 Local Option Gas Tax 15,152,000 15,281,960 129,960 Penny for Pinellas 51,065,150 53,436,000 2,370,850 Cable TV Franchise Fees 1,042,150 2,094,970 1,052,820 Other Sales & Use Taxes 225,240 225,250 10 Subtotal Sales & Use Taxes 81,525,920 86,070,690 4,544,770 Internal Service Charges 30,814,460 I 30,828,000 13,540
I Interest Earnings I I Board of County Commissioners I
15,227,750 j 17,573,140 2,345,390 I Clerk of the Circuit Court I 324,340 1 318,250 (6,090) I Sheriff I 1,045,000 1,140,000 95,ooo l
I Tax Collector i 484,300 335,150 {1,tt;t CCO'
Subtotal Interest Earnings 17,081,390 19,367,140 2,285,750 Reimbursements 13,182,290 11,040,560 (2,141,730,
Other Miscellaneous Revenue 2,299,060 2,376,850 77,790
I i -
Fines and Forefeitures 6,104,540 3,545,990 (2,558,550
I Rents, Surplus, and Refunds I 9,934,720 10,857,860 923,140
Local Grants and Shared Revenues 3,336,380 5,127,070 1,790,690
Licenses & Permits 3,368,900 3,628,340 259,440
Special Assessments 1,165,610 1,245,700 80,090
TOTAL NET REVENUE 693,575,230 724, 703.540 31.128.310
Debt Proceeds 45,614,060 83,444,400 37,830,340
Designated Eunds Fund Balances Governmental Funds 116,827 ,400 93,330,300 (23,497,100) '1
Enterprise & Internal Service Funds 281,311,610 300,247 ,850 18,810,240 Subtotal Designated Funds 398,205,010 393,578,150 (4,626,860
TOT AL DEBT & FUND BALANCES I 443,819.070 477.022.550 33.203.480 J I I I
TOT AL ALL RESOURCES I 1.137 ,394.300 1.201. 126.090 I 64.331.190 I B-12
PERCENT CHANGE
5.5%
2.8%
8.3%
5.6% 0.0%
13.4% -16.2%
3.4%
-41.9%
9.3%
53.7%
7.7%
6.9%
4.5%
82.9%
-1.2%
7.5%
5.7%
I I I I I I I I I I I I I I I I I I I
I I I I I I
11 I I I I I I I I I I I I I
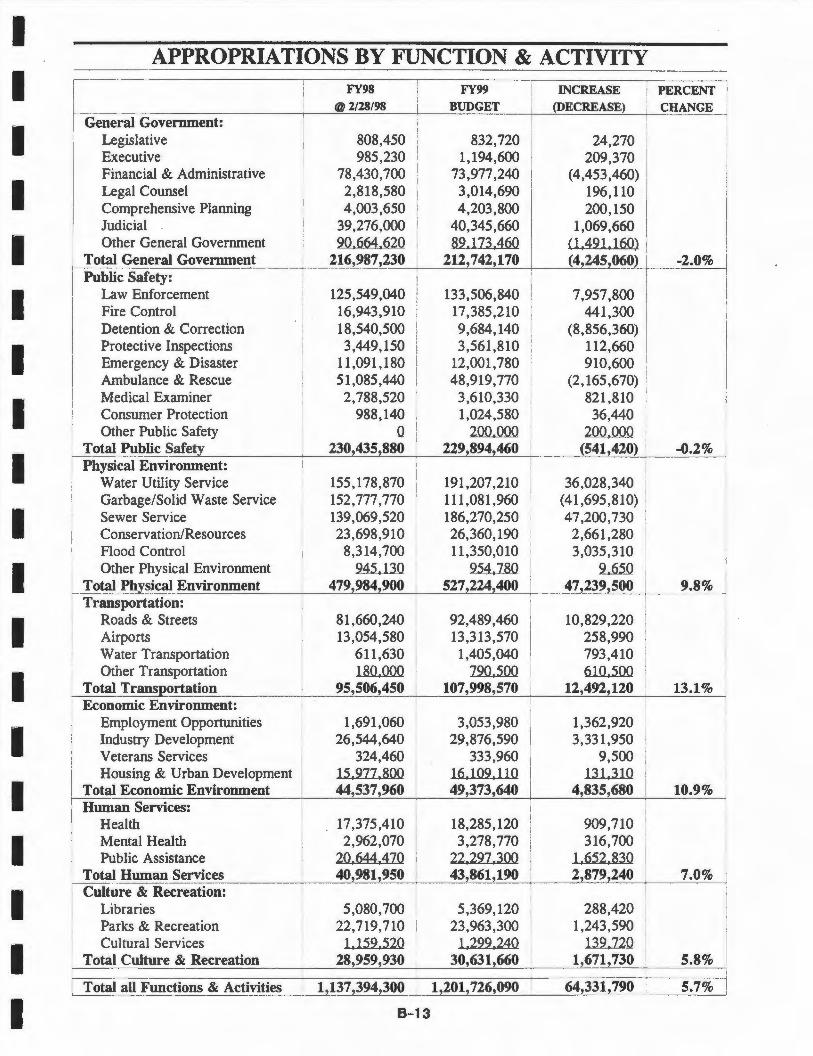
APPROPRIATIONS BY FUNCTION & ACTIVITY
I General Government: I Legislative
Executive Financial & Administrative Legal Counsel Comprehensive Planning Judicial Other General Government
Total General Government Public Safety:
Law Enforcement Fire Control Detention & Correction Protective Inspections Emergency & Disaster Ambulance & Rescue Medical Examiner Consumer Protection Other Public Safety
Total Public Safet Physical Environment:
Water Utility Service Garbage/Solid Waste Service Sewer Service Conservation/Resources Flood Control Other Physical Environment
Total Ph sical Environment Transportation:
Roads & Streets Airports Water Transportation Other Transportation
Total Transportation Economic Environment:
Employment Opportunities Industry Development Veterans Services Housing & Urban Development
Total Economic Environment I Human Services: I Health
Mental Health Public Assistance al Human Services
I Culture & Recreation: Libraries Parks & Recreation Cultural Services
Tota!._~ ulture & Recreation >------··
Total all Functions & Activities
I I I
I I
I
I
I
I
FY98 @2/28/98
808,450 985,230
78,430,700 2,818,580 I 4,003,650 i
39,276,000 I 20.664,620 I
216,987 ,230 I
I
125,549,040 I 16,943,910 I
18,540,500 3,449,150
11,091,180 51,085,440
2,788,520 988,140
Q 230,435,880
155,178,870 152, 777, 770 139,069,520 23,698,910
8,314,700 245,130
479,984,900
81,660,240 13,054,580
611,630 180,QQO
95,506,450
1,691,060 26,544,640
324,460 15,917,800 44,537,960
17,375,410 2,962,070
20,644.4:ZO 40,981,950
5,080,700 22,719,710
1,152,520 28,959,930
1, 137 ,394,300
i
I I
B- 13
FY99 BUDGET
832,720 1,194,600
73,977,240 3,014,690 4,203,800
40,345,660 82.173,460
212,742,170
133,506,840 17,385,210 9,684,140 3,561,810
12,001,780 48,919,770
3,610,330 1,024,580
200,000 229,894,460
191,207,210 111,081,960 186,270,250 26,360,190 11 ,350,010
2.5.428_0 527,224,400
92,489,460 13,313,570
1,405,040 720,500
107,998,570
3,053,980 29,876,590
333,960 16.102.110 49,373,640
18,285,120 3,278,770
22,22:Z,300 43,861,190
5,369,120 23,963,300
1,222,240 30,631,660
1,201, 726,090
I I
I I
i '
INCREASE (DECREASE)
24,270 I
209,370 (4,453,460)
196,110 200,150
1,069,660 0 .421.160) I (4,245,060) I
7,957,800 441,300
(8,856,360) 112,660 910,600 I
(2.165.670) I 821,810
36,440 I 2QO,QQO I (541,420)
I 36,028,340 I
(41,695,810) I
47,200,730 I 2,661,280 ' 3,035,310 ~
47,239,500
10,829,220 258,990 793,410 610,500
12,492,120 '
1,362,920 3,331,950
9,500 131,310
4,835,680
909,710 316,700
1,652,830 2,879,240
288,420 1,243,590
132,:Z2Q 1,671,730 I
64,331,790
PERCENT CHANGE
-2.0% I
I
-0.2%
9.8%
13.1%
10.9%
7.0%
5.8% I
5.7%
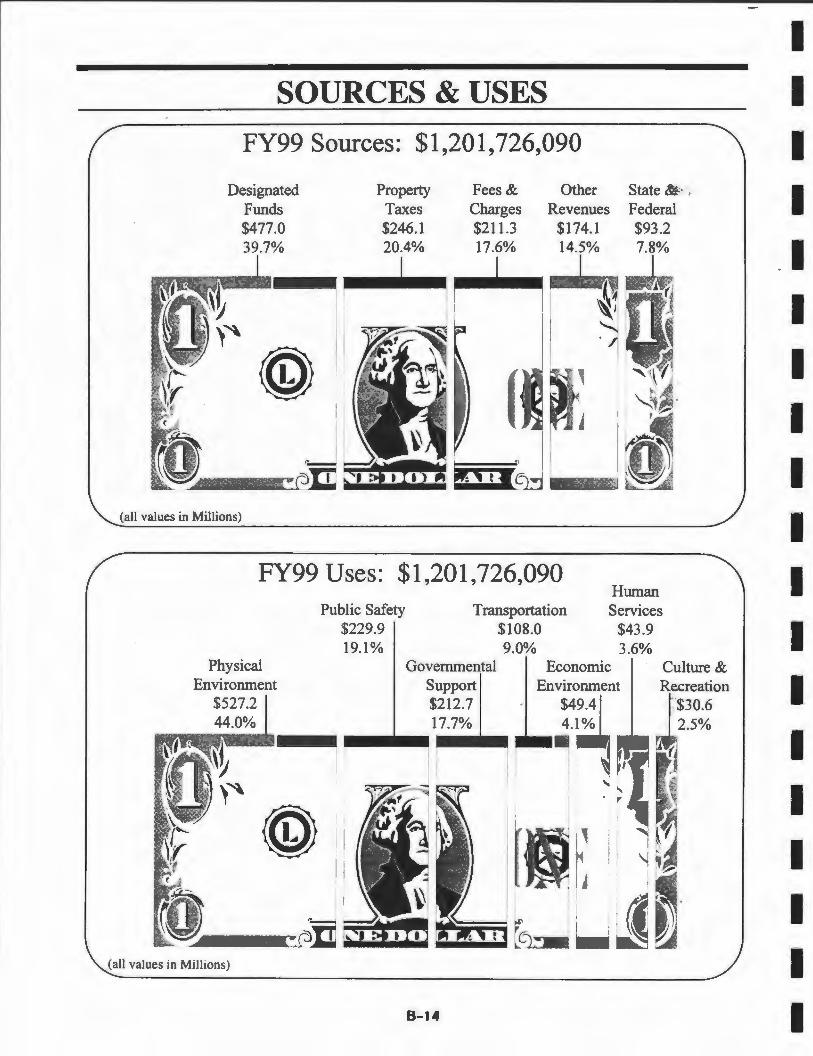
SOURCES & USES
FY99 Sources: $1,201,726,090
Designated Funds $477.0
Property Taxes $246.1
Fees & Other Charges Revenues $211.3 $174.1
39.7% 20.4% 17.6% 14.5%
State&,·. Federal $93.2 7.8% --------r, .... ~
I
1 ·
~--Fllfttl[-:~@~ ~
1
~---~ ;.~;;;;."
(all values in Millions)
FY99 Uses: $1,201,726,090 Human Services
$43.9
Physical Environment
$527.2 44.0%
(all values in Millions)
Public Safety $229.9 19.1%
Transportation $108.0
Governmental Support $212.7 17.7%
8 - 14
9.0% 3.6% Economic Culture &
Environment Recreation $4:~; I ·:$30.6 4. ~ 2.5%
, I ~ 1
.... ' ,.
I I I I
.I I I I I I I I I I I I I I I
I I I I I I
I I
I I I I I
I I
I I I I I I I I I
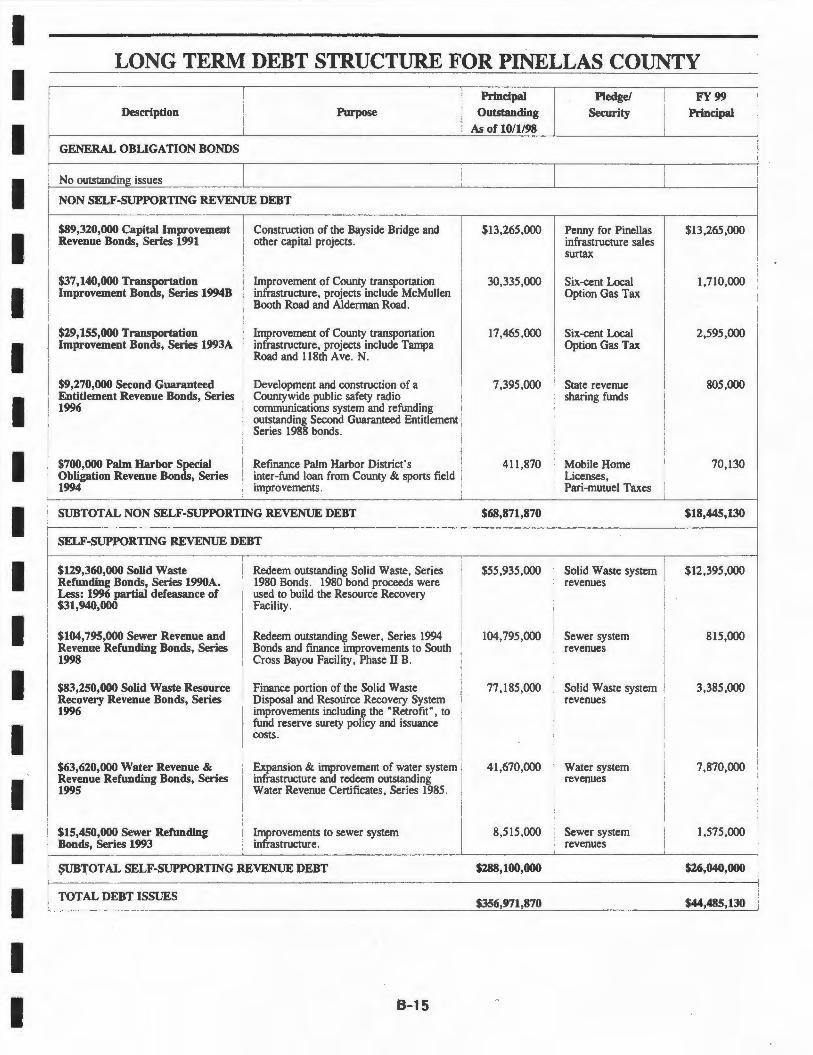
LONG TERM DEBT STRUCTURE FOR PINELLAS COUNTY
Description Purpose
GENERAL OBLIGATION BONDS
No outstanding issues I NON SELF-SUPPORTING REVENUE DEBT
$89,320,000 Capital Improvement I Construction of the Bayside Bridge and Revenue Bonds, Series 1991
I other capital projects.
$37, 140,000 Transportation
I Improvement of County transportation
Improvement Bonds, Series 1994B infrastructure, projects include McMullen Booth Road and Alderman Road.
$29, 155,000 Transportation Improvement of County transportation Improvement Bonds, Series 1993A infrastructure, projects include Tampa
Road and 118th Ave. N.
$9,270,000 Second Guaranteed I Development and construction of a ' Entitlement Revenue Bonds, Series I Countywide public safety radio
1996 r communications system and refunding outstanding Second Guaranteed Entitlement
I Series 1988 bonds.
$700,000 Palm Harbor Special Refinance Palm Harbor District's Obligation Revenue Bonds, Series inter-fund loan from County & sports field 1994 improvements.
I
SUBTOTAL NON SELF-SUPPORTING REVENUE DEBT
SELF-SUPPORTING REVENUE DEBT
$129,360,000 Solid Waste I I
Refunding Bonds, Series 1990A. Less: 1996 partial defeasance of i $31,940,000 I
I $104, 795,000 Sewer Revenue and
I I
Revenue Refunding Bonds, Series I 1998 ' $83,250,000 Solid Waste Resource Recovery Revenue Bonds, Series 1996
Redeem outstanding Solid Waste, Series 1980 Bonds. 1980 bond proceeds were used to build the Resource Recovery Facility.
Redeem outstanding Sewer, Series 1994 Bonds and finance improvements to South Cross Bayou Facility, Phase II B.
Finance portion of the Solid Waste !)isposal and ~esm.ir~ Recovery System improvements mcludmg the "Retrofit", to fund reserve surety policy and issuance costs.
I
I I I
I
I I i i I
I I I
!
$63,620,000 Water Revenue & Revenue Refunding Bonds, Series 1995
Expansion & improvement of water system I infrastructure and redeem outstanding
$15,450,000 Sewer Refunding Bonds, Series 1993
I Water Revenue Certificates, Series 1985.
I
I Improvements to sewer system infrastructure.
~'I_'OTAL SELF-SUPPORTING REVENUE DEBT
TOTAL DEBT ISSUES
B- 15
Principal
Outstanding
As of 10/1/98
$13,265,000
30,335,000
17,465,000
7,395,000
411,870
$68,871,870
$55,935,000
104,795,000
77,185,000
41,670,000
8,515,000
$288,100,000
$356,971,870
Pledge/ ! Security
I
Penny for Pinellas infrastructure sales surtax
Six-cent Local
I Option Gas Tax
!
Six-cent Local Option Gas Tax
I State revenue I sharing funds
I I
Mobile Home I
Licenses, Pari-mutuel Taxes
I
Solid Waste system I revenues I
Sewer system revenues
Solid Waste system I
I
revenues
Water system revenues
II Sewer system
revenues
FY99 Principal
$13,265,000
1,710,000
2,595,000
805,000
70,130
$18,445,130
$12,395,000
815,000
3,385,000
7,870,000
1,575,000
$26,040,000
$44,485,130
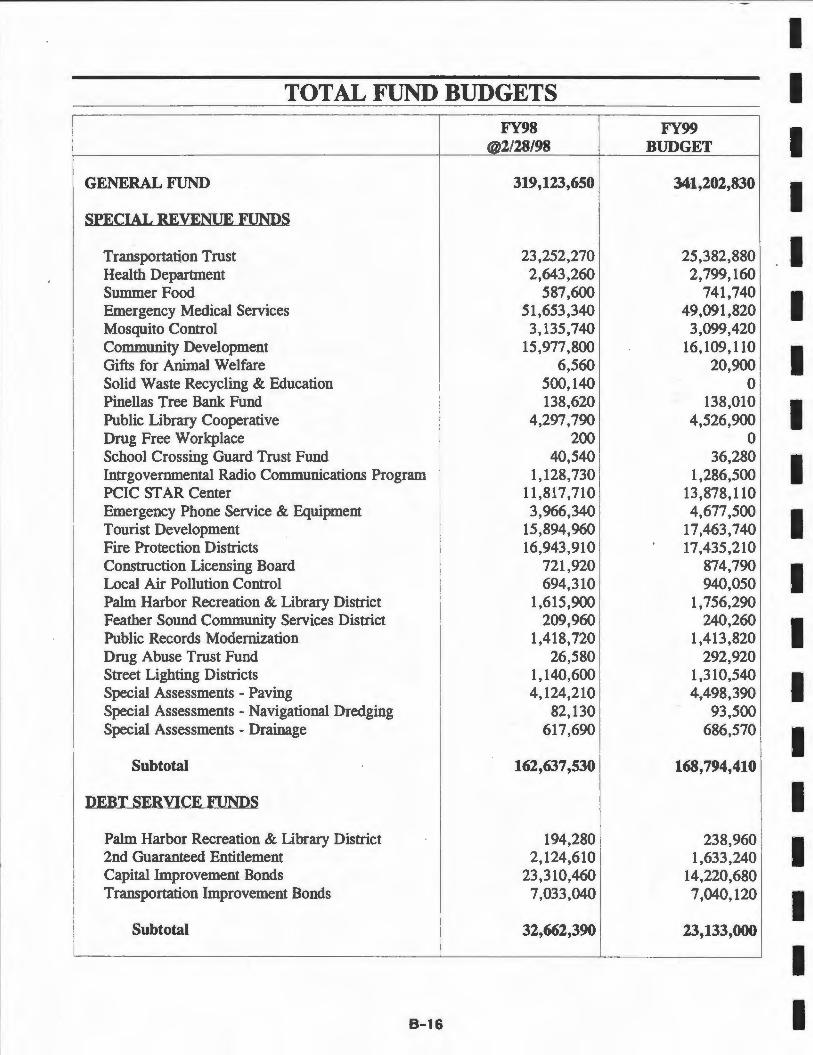
TOTAL FUND BUDGETS FY98
@2/28/98
GENERAL FUND 319,123,650
SPECIAL REVENUE FUNDS
Transportation Trust 23,252,270 Health Department 2,643,260 Suminer Food 587,600 Emergency Medical Services 51,653,340 Mosquito Control 3,135,740 Community Development 15,977,800 Gifts for Animal Welfare 6,560 Solid Waste Recycling & Education 500,140 Pinellas Tree Bank Fund 138,620 Public Library Cooperative 4,297,790
I Drug Free Workplace 200 School Crossing Guard Trust Fund 40,540 Intrgovernmental Radio Communications Program 1,128,730 PCIC ST AR Center 11,817,710 Emergency Phone Service & Equipment 3,966,340 Tourist Development 15,894,960 Fire Protection Districts 16,943,910 Construction Licensing Board 721,920 Local Air Pollution Control 694,310 Palm Harbor Recreation & Library District 1,615,900 Feather Sound Community Services District 209,960 Public Records Modernization 1,418,720 Drug Abuse Trust Fund 26,580 Street Lighting Districts
I 1,140,600
Special Assessments - Paving 4,124,210 Special Assessments - Navigational Dredging
I 82,130
I Special Assessments - Drainage 617,690
Subtotal 162,637 ,530
DEBT SERVICE FUNDS
Palm Harbor Recreation & Library District 194,280 2nd Guaranteed Entitlement 2,124,610 Capital Improvement Bonds 23,310,460 Transportation Improvement Bonds 7,033,040
Subtotal I
32,662,390
8 - 16
FY99 BUDGET
341,202,830
25,382,880 2,799,160
741,740 49,091,820
3,099,420 16,109,110
20,900 0
138,010 4,526,900
0 36,280
1,286,500 13,878,110 4,677,500
17,463,740 17,435,210
874,790 940,050
1,756,290 240,260
1,413,820 292,920
1,310,540 4,498,390
93,500 686,570
168,794,410
238,960 1,633,240
14,220,680 7,040,120
23,133,000
I I I I I I I I I I I I I I I I I I I
I 11 I I I I I I I I I I I I I I I I I
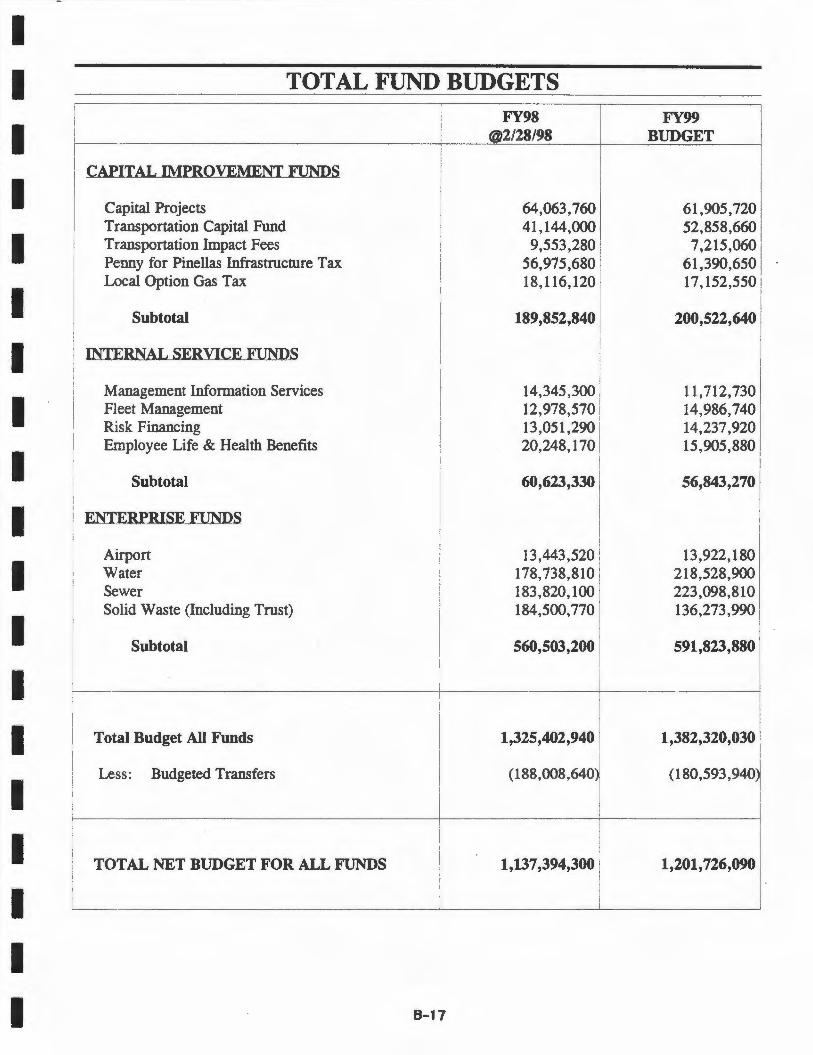
TOTAL FUND BUDGETS
CAPITAL IMPROVEMENT FUNDS
Capital Projects Transportation Capital Fund Transportation Impact Fees Penny for Pinellas Infrastructure Tax Local Option Gas Tax
Subtotal
INTERNAL SERVICE FUNDS
Management Information Services Fleet Management Risk Financing Employee Life & Health Benefits
Subtotal
I ENTERPRISE FUNDS
Airport Water Sewer Solid Waste (Including Trust)
Subtotal
FY98 @2/28/98
64,063,760 41,144,000
9,553,280 56,975,680 18,116,120
189,852,840
14,345,300 12,978,570 13,051,290 20,248,170
60,623,330
13,443,520 178,738,810 183,820,100 184,500,770
560,503,200
FY99 BUDGET
61,905,720 52,858,660
7,215,060 61,390,650 17,152,550
200,522,640
11,712,730 14,986,740 14,237,920 15,905,880
56,843,270
13,922,180 218,528,900 223,098,810 136,273,990
591,823,880
,---·~~~~~~~~~~~~~~~~"----~~~~~~---+~~~~~~~-,
I
Total Budget All Funds
Less: Budgeted Transfers
TOTAL NET BUDGET FOR ALL FUNDS
B- 17
1,325,402,940
( 188,008,640
1,137,394,300 I
I
1,382,320,030,[
(180,593,940~
I 1.201. ,2,.090 I
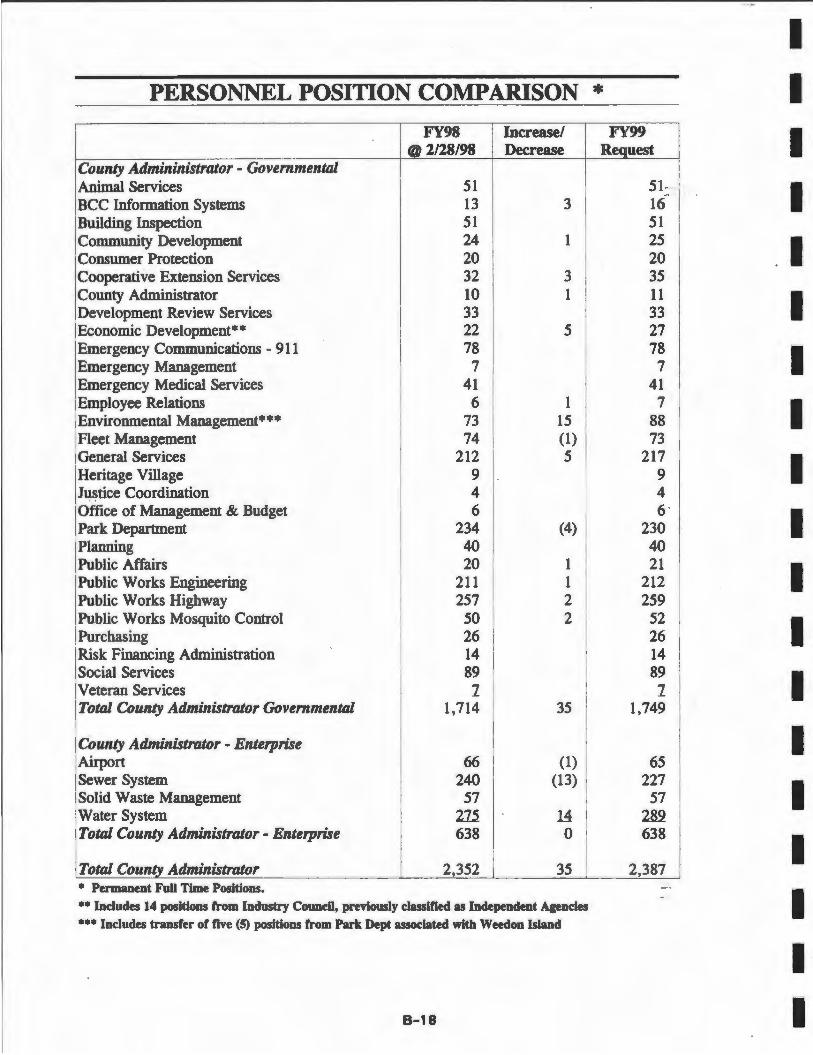
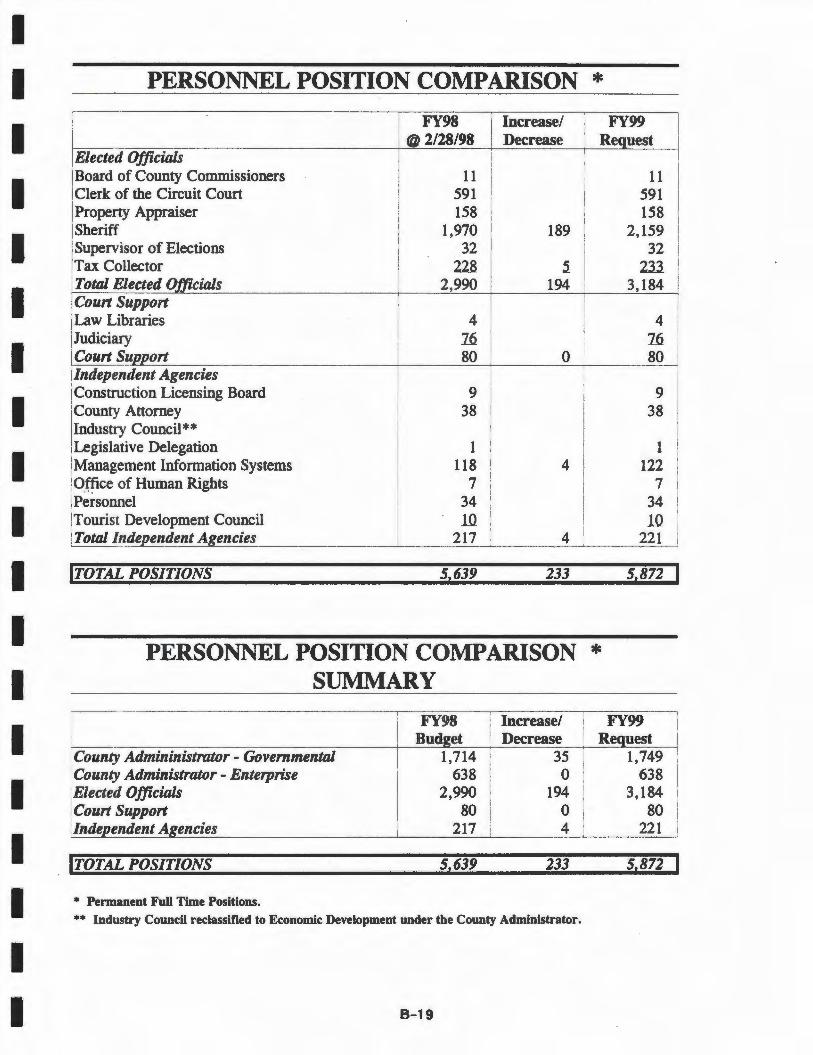
PERSONNEL POSITION COMPARISON * FY98 Increase/
@2/28/98 Decrease County Admininistrator - Governmental Animal Services 51 BCC Information Systems 13 3 Building Inspection 51 Community Development 24 1 Consumer Protection 20 Cooperative Extension Services 32 3 County Administrator 10 1 Development Review Services 33 Economic Development** 22 5 Emergency Communications - 911 78 Emergency Management 7 Emergency Medical Services 41 Employee Relations 6 1 Environmental Management*** 73 15 Fleet Management 74 (1) General Services 212 5 Heritage Village 9 J~~tice Coordination 4 Office of Management & Budget 6 Park Department 234 (4) Planning 40
I Public Affairs 20 1 Public Works Engineering 211 1 I Public Works Highway 257 2
I Public Works Mosquito Control 50 2 I
Purchasing 26 Risk Financing Administration 14 Social Services 89 I
Veteran Services 1 Total County Administrator Governmental 1,714 35
County Administrator - Enterprise Airport 66 (1) Sewer System 240 (13) Solid Waste Management 57 Water System lli 14 Total County Administrator - Enterprise 638 0
Total County Administrator 2,352 35 • Permanent Full Time Positions. •• Includes 14 positions from Industry Council, previously classified as Independent Agencies
••• Includes transfer of five (5) positions from Park Dept associated with Weedon Island
8-18
FY99 Request
51-16 51 25 20 35 11 33 27 78
7 41
7 88 73
217 9 4 6 •
230 40 21
212 259
52 26 14 89 1
1,749
65 227
57 2.8.2 638
2,387
I
I
I I I I I I I I I I I I I I I I I I I
I I I I I I I I I I I I I I I I I I I
PERSONNEL POSITION COMPARISON * I FY98 Increase/ I FY99 I
@2/28/98 Decrease I
Request Elected Officials Board of County Commissioners Clerk of the Circuit Court Property Appraiser Sheriff I Supervisor of Elections /Tax Collector Total Elected Officials Court Support Law Libraries Judiciary Court Support Independent Agencies Construction Licensing Board County Attorney Industry Council** / Legislative Delegation Management Information Systems !Qffice of Human Rights !Personnel jTounst Development Council I Tota/. Independent Agencies
ITOTAL POSITIONS
I
I ! i
I I I
11 591 158
1,970 32
228 2,990
4 1.f,_
80
9 38
1 118
7 34 10
217
5,639
I I
' '
189
S_
194 I I
I i
I 0
I I
I I
I I
4 I I I
I I
4
233
PERSONNEL POSITION COMPARISON * SUMMARY
FY98 Increase/
11 591 158
2,159 32
213 3,184
4 1.f,_
80
9 38
1 122
7 34 10
221
5,872
FY99 Bud et Decrease Re uest
County Admininistrator - Governmental. 1,714 35 1,749 County Administrator - Enterprise 638 0 638 Elected Officials 2,990 194 3,184 · Court Support 80 0 80 Inde endent A encies 217 4 221
ITOTAL POSITIONS 5,639 233 5,872
• Permanent Full Time Positions. •• Industry Council reclassified to Economic Development under the County Administrator.
B- 19
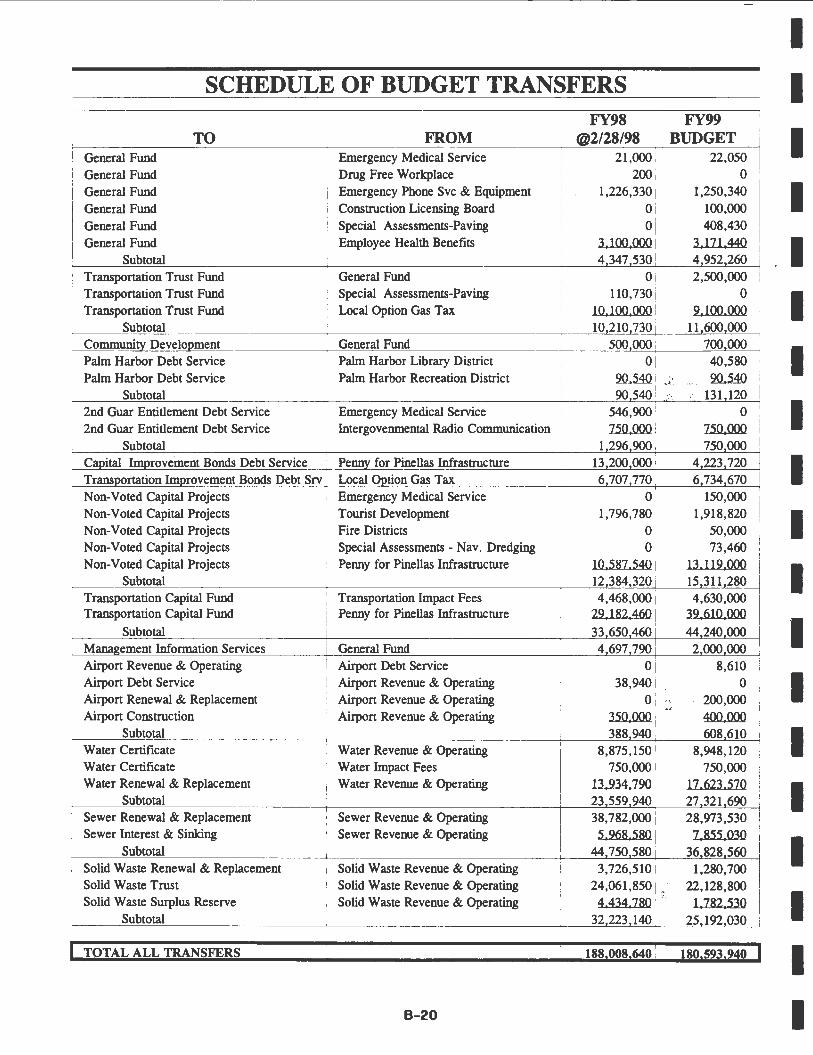
SCHEDULE OF BUDGET TRANSFERS FY98
I TO FROM @2/28/98 General Fund I Emergency Medical Service
I
21,000 1 General Fund Drug Free Workplace 200 General Fund Emergency Phone Svc & Equipment 1,226,330 General Fund Construction Licensing Board 0 General Fund Special Assessments-Paving
I 0
General Fund Employee Health Benefits 3,100,000 Subtotal 4.347 530
Transportation Trust Fund General Fund
I 0
Transportation Trust Fund Special Assessments-Paving 110,730 Transportation trust Fund Local Option Gas Tax 10.100,000
. Subtotal ! 10.210 730 i Communitv Develooment I General Fund 500 OOO i Palm Harbor Debt Service Palm Harbor Library District 0 Palm Harbor Debt Service Palm Harbor Recreation District ~
Subtotal 90 540 2nd Guar Entitlement Debt Service Emergency Medical Service 546,900 2nd Guar Entitlement Debt Service lntergovenmental Radio Communication I 150,000
Subtotal 1,296 900 Caoital Imnroveinent Bonds Debt Service Pennv for Pinellas Infrastructure 13 200 000 Transnortation lmorovement Bonds Debt Srv Local Ontion Gas Tax 6 707 770 Non-Voted Capital Projects Emergency Medical Service
I 0
Non-Voted Capital Projects Tourist Development 1,796,780 I Non-Voted Capital Projects Fire Districts I 0 1
I Non-Voted Capital Projects Special Assessments - Nav. Dredging I 0 \ Non-Voted Capital Projects Penny for Pinellas Infrastructure I 10,581,540 : Subtotal 12 384.320 Transportation Capital Fund Transportation Impact Fees 4,468,000 Transportation Capital Fund Penny for Pinellas Infrastructure 22.182,460
Subtotal 33 650,460 ManaJ,?ement Information Services General Fund 4 697.790 Airport Revenue & Operating Airport Debt Service
0 1 Airport Debt Service Airport Revenue & Operating 38,940 Airport Renewal & Replacement Airport Revenue & Operating 0 1
I Airport Construction Airport Revenue & Operating 350,000 Subtotal 388.940
Water Certificate Water Revenue & Operating 8,875,150 Water Certificate Water Impact Fees 750,000 1 Water Renewal & Replacement Water Revenue & Operating 13 234,190
Subtotal 23 559.940 Sewer Renewal & Replacement Sewer Revenue & Operating 38,782,000 Sewer Interest & Sinking Sewer Revenue & Operating 5,268.580
Subtotal 44 750.580
I Solid Waste Renewal & Replacement
I Solid Waste Revenue & Operating 3,726,510
Solid Waste Trust Solid Waste Revenue & Operating 24,061,850 I
I Solid Waste Surplus Reserve I Solid Waste Revenue & Operating 4,434.180
Subtotal I 32 223.140 1 I
TOTAL ALL TRANSFERS 188,0081640 1
B- 20
FY99 BUDGET
22,050 0
1,250,340 100,000 408,430
3.111.440 4.952 260 2,500,000
0 2.100,000
11.600 000 700 000 40,580
... .. ~ ... it.'... .;.~ . ...... ~~· • .. <:: 131 120
0 150,000 750 000
4.223 720 6.734 670
150,000 1,918,820
50,000 73,460
13,112,000 15.311.280 4,630,000
32,610,000 44,240,000
2.000.000 8,610
0 ' wt;, 200,000
.-... ;. · . 400,000 608 610
8,948,120 750,000
11,623,510 27.321 690 28,973,530
1.855.030 36.828 560
1,280,700 22,128,800
~? 1,182,530 25.192 030
18015931940
I
I I I I I I I I I I I I I I I I I I I
I I I I I I I I I I I I I I I I
I I
I I
ECONOMIC TRENDS & MAJOR REVENUES
The following provides a brief discussion of the economic trend and major revenue graphics that appear after this narrative · section.
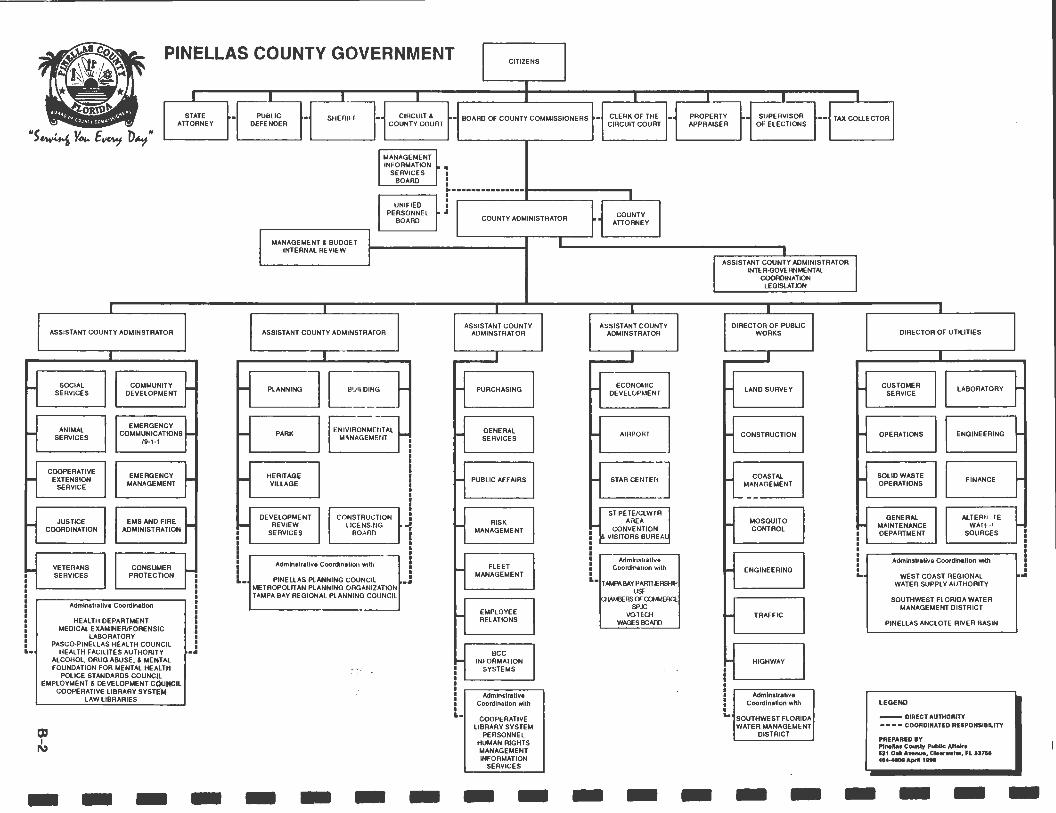
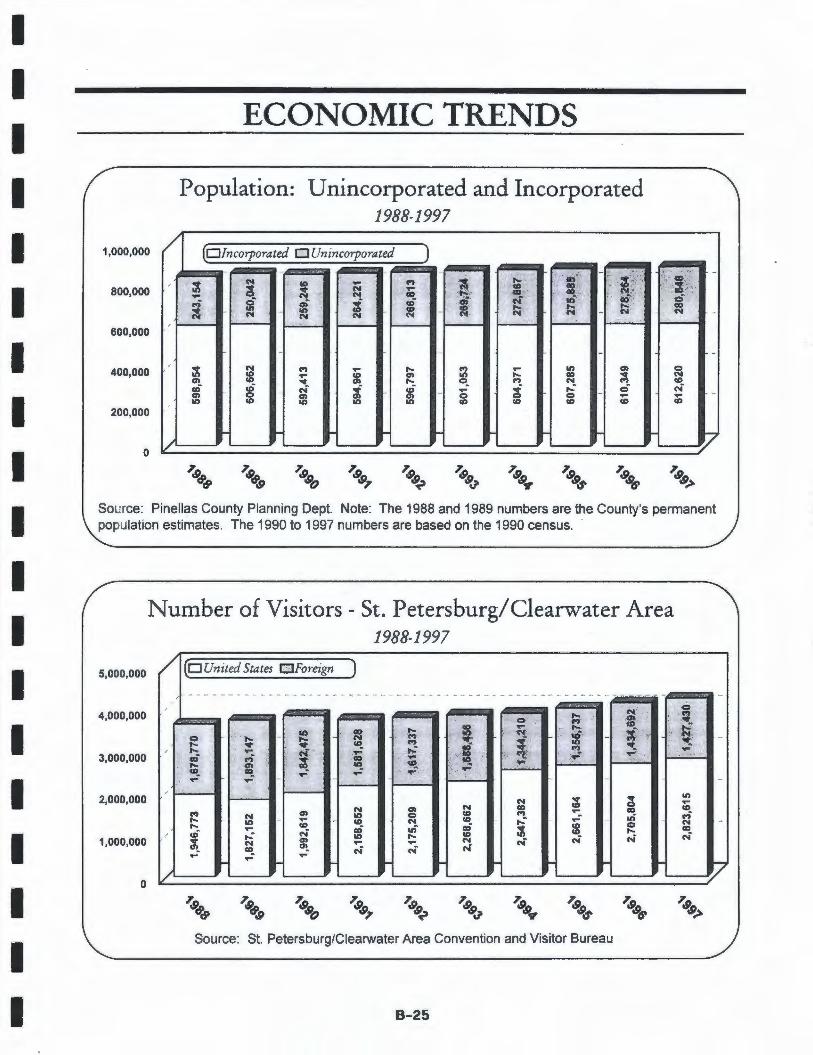
Pqpulation: Unincor,porated and Incor,porated: Pinellas County's population has grown from an estimated population of 842, 108 in 1988 to an estimate of 893,468 in 1997. This reflects a growth rate of 6.1 % over the past ten (10) years. The unincorporated area of the County from 1996 to 1997 has grown an estimated 0.9% from 278,264 to 280,848. During the same period the incorporated area of the County has grown at a slightly slower pace of 0.4% from 610,349 to 612,620. Over the past ten ( 10) years, the unincorporated area has increased at an annual average rate of 1.6% versus 0.2% in the incorporated area. The unincorporated area population as a percentage of the total population has grown from 28.9% in 1988 to 31.4% in 1997. This trend is a result of the majority of the land for development being in the unincorporated area.
Number of Visitors - St. Petersbur~ Clearwater Area: A key indicator to the economic growth and strength of Pinellas County is tourism. The number of visitors to Pinellas County in 1988 was estimated at 3,625,543 versus 4,251 ,045 in 1997 for a growth rate of 17.3%. Over the same period the number of foreign visitors has decreased by 15.0% from 1,678,770 to 1,427,430. The number of domestic visitors has increased at a rate of 45.0% from 1,946,773 to 2,823,615. Within the past three (3) years, the average annual increase in tourism has been approximately 3.0%, which compares to the 1.8% ten year average. In 1995, the annual growth reached a high of 3.2%, the highest rate in the past ten ( 10) years.
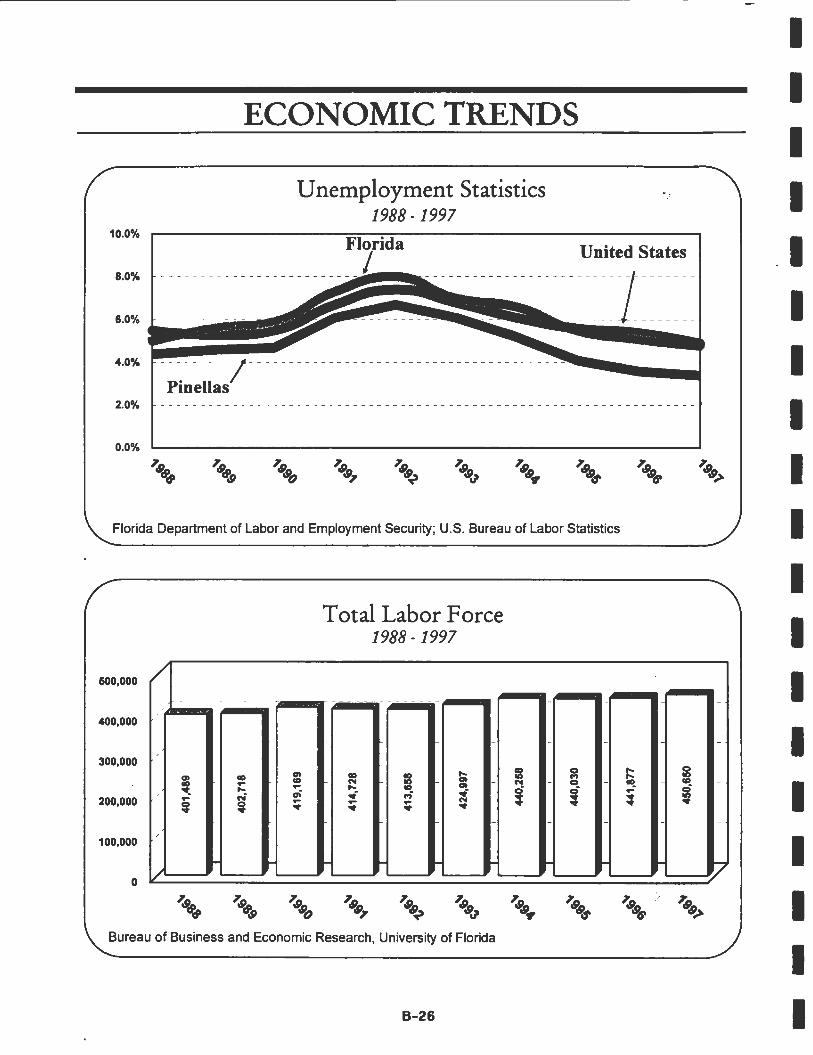
Unemployment Statistics: Pinellas County's unemployment rate has remained lower than the State of Florida and the United States for the period 1988 to 1997. The County's unemployment rate for 1997 was 3.4%, while Florida's rate was 4.8% and the United States' rate was 4.9%.
Total Labor Force: The labor force has grown from 401,489 in 1988 to 450,650 in 1997, an increase of 12.2% over the ten year period, or an average annual increase of approximately 1.2%. The County has shown annual increases from 1988 to 1997, with decreases occurring between 1990 and 1992 and 1994 and 1995. An increase of 8,773 or 2.0% ocurred in the labor force in 1997.
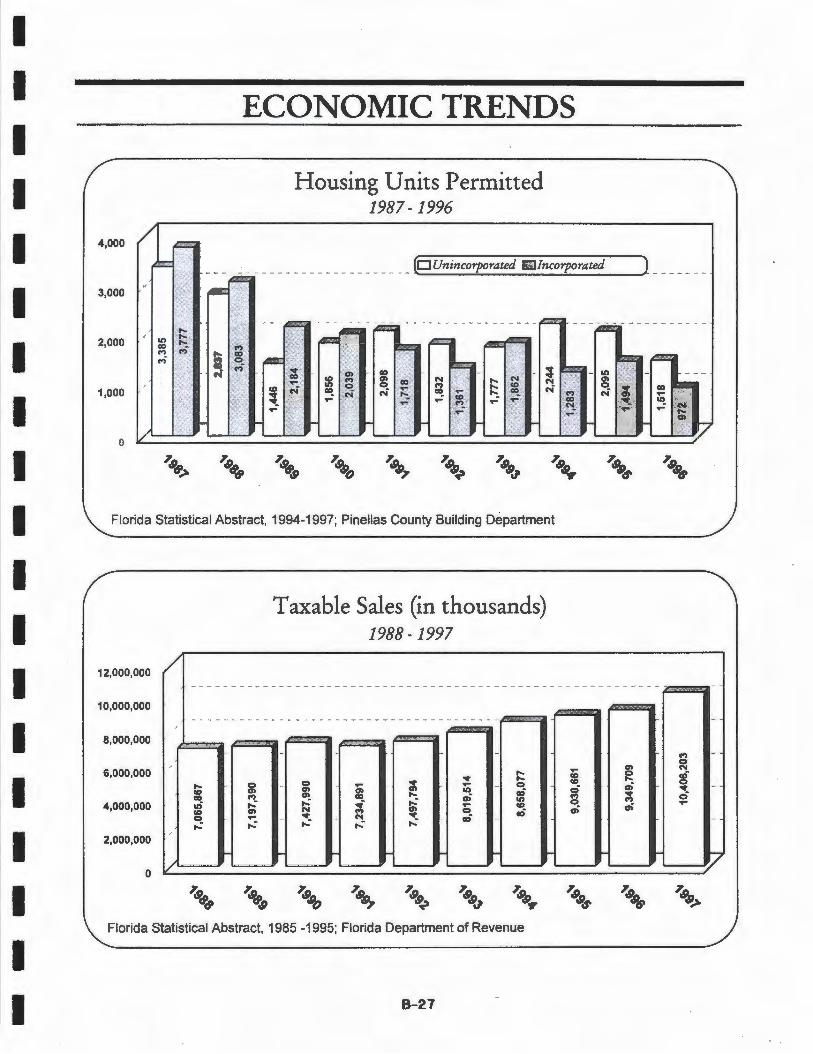
Housin~ Units Pennitted: In 1996 housing units permitted in Pinellas County totaled 2,490, down compared to 1995. Permitting activity in the incorporated area decreased by 34.9%. Activity in the unincorporated area decreased by 27.5%. Of the 1996 total, 39.0% was in the incorporated area and 61 . 0% in the unincorporated area. The number of housing units in the unincorporated area has remained relatively constant over the last eight (8) years, after higher activity occurring in 1988 and 1989. The incorporated area has shown an overall decrease in activity over the ten year period. From a pigh of 3,777 units in 1987, activity has decreased steadily to lows of 1,283 in 1994 and 972 in 1996, with slight increases in 1993 and 1995, as shown on the graph.
Taxable Sales: Taxable sales in Pinellas County for 1997 exceeded $10.4 billion, an increase of 11.3% from 1996 and an increase of 47.3% from 1988. During the last five (5)
· years, taxable sales increased 29.8% from
B- 21
1993 to 1997. This increase exceeds the growth of 6.1 % from 1988 to 1992.
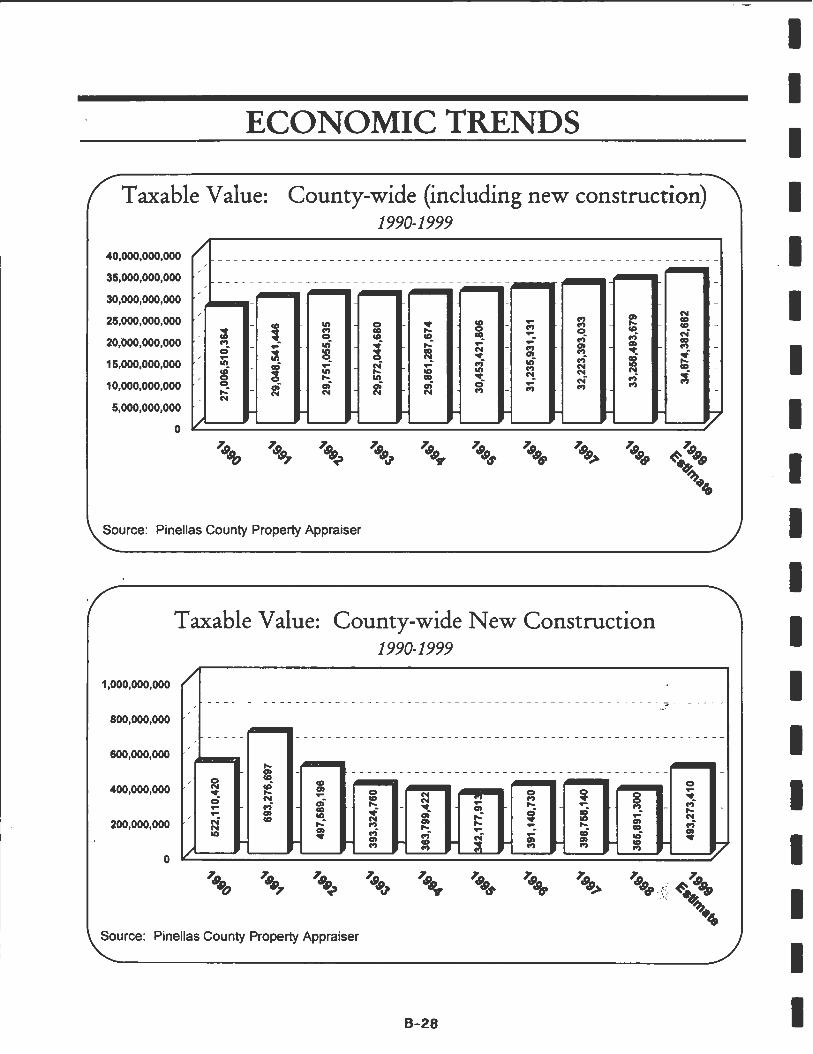
For all of the charts relating to taxable value, the data is presented on a budget year basis. However, the data reflects actual activity· occurring through December 3 I of the preceding year. The I 999 taxable value is the official estimate from the Property Appraiser.
Taxable Value: County-wide (includin~ new construction): The county-wide taxable value has grown from $27.0 billion in 1990 to an estimated $34.9 billion for 1999, an increase of 29.1%. The estimated increase of 4.9% between 1998 and 1999 is higher than the ten year average annual trend of2.9%. Note, that
· between 1992 and 1993 Pinellas County experienced an unprecedented decline in taxable value. Since this time, taxable values have rebounded and shown steady growth.
Taxable Value: County-wide New Construction: After decreasing steadily from 1991 to 1995, the value of new construction increased from $342.2 million in 1995 to $391.1 million in 1996 and to $398.8 million in 1997. This represents increases of 14.3% in 1996 and 2.0% in 1997. The 1998 value of $365.9 million represents a decline of 8.2%. The 1999 estimate of $493.3 million reflects an increase of34.8%. New construction, as a percentage of overall taxable value, has decreased over the past ten (10) years from 1.9% in 1990 to 1.4% for 1999, with a low of 1.1% in 1998.
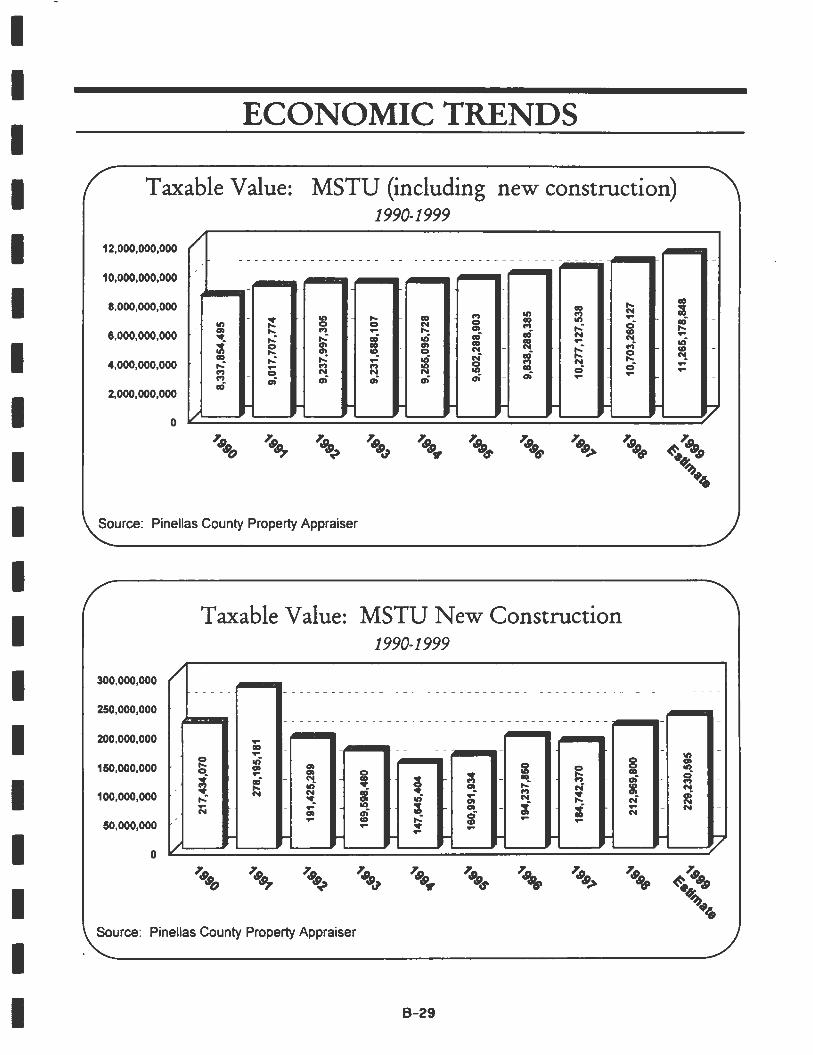
Taxable Value: MSTU (includin~ new construction): Taxable value has increased in the unincorporated area of the County from $8.3 billion in 1990 to an estimate of $11.3 billion in 1999, an increase of 35.1 %. The unincorporated taxable value as a percentage of the total county tax base has increased from 30.9% in 1990 to 32.3% for 1999. Note, that
between 1992 and 1993 Pinellas County experienced an unprecedented decline in taxable value. Since this time, taxable values have rebounded and shown steady growth.
.. Taxable Value MSTU New Construction: Unincorporated area new construction shows an increase between the 1998 value of $213.0 million and the 1999 value of $229.2 million, an increase of 7.6%. The overall trend, however, has shown a decline from 1990 to 1994, with an overall upward trend beginning in 1995.
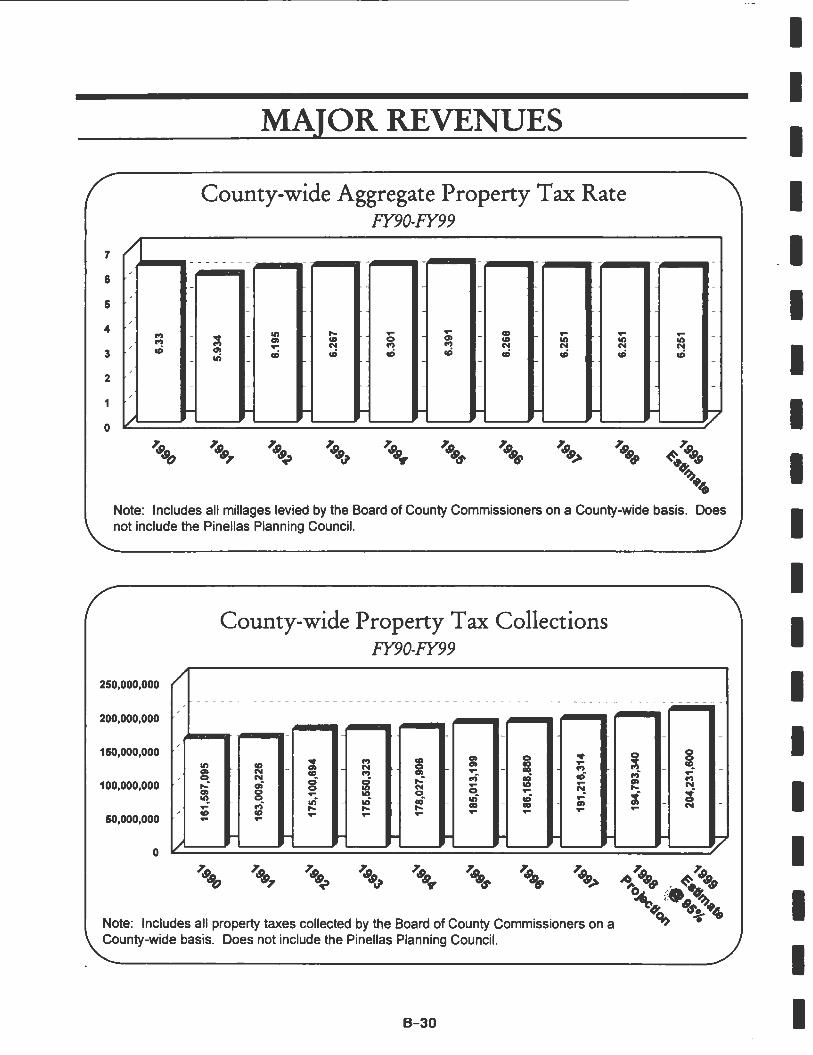
County-wide A~~re~ate Property Tax Rate: The proposed 1999 county-wide property tax rate of 6.251 mills reflects the same rate adopted in 1998. This aggregate millage includes the following: General Fund, 5.397; Mosquito Control, 0.072; Health, 0.069; and Emergency Medical Services (EMS), 0.713. Please note that all of the millage rates, with the exception of EMS, are levied on all taxable property. The EMS millage is levied on only real property. The taxable value estimate for all taxable property is $34.9 billion versus the real property estimate of $30.6 billion. The county-wide tax rate has remained relatively constant over the past ten (10) years.
County-wide Property Tax Collections: County-wide property tax collections have increased annually from 1990 to 1997. The 1998 projected receipts and the 1999 estimated receipts continue to reflect annual increases in property tax collections. The collections are a direct result of the countywide aggregate millage and the county-wide taxable value.
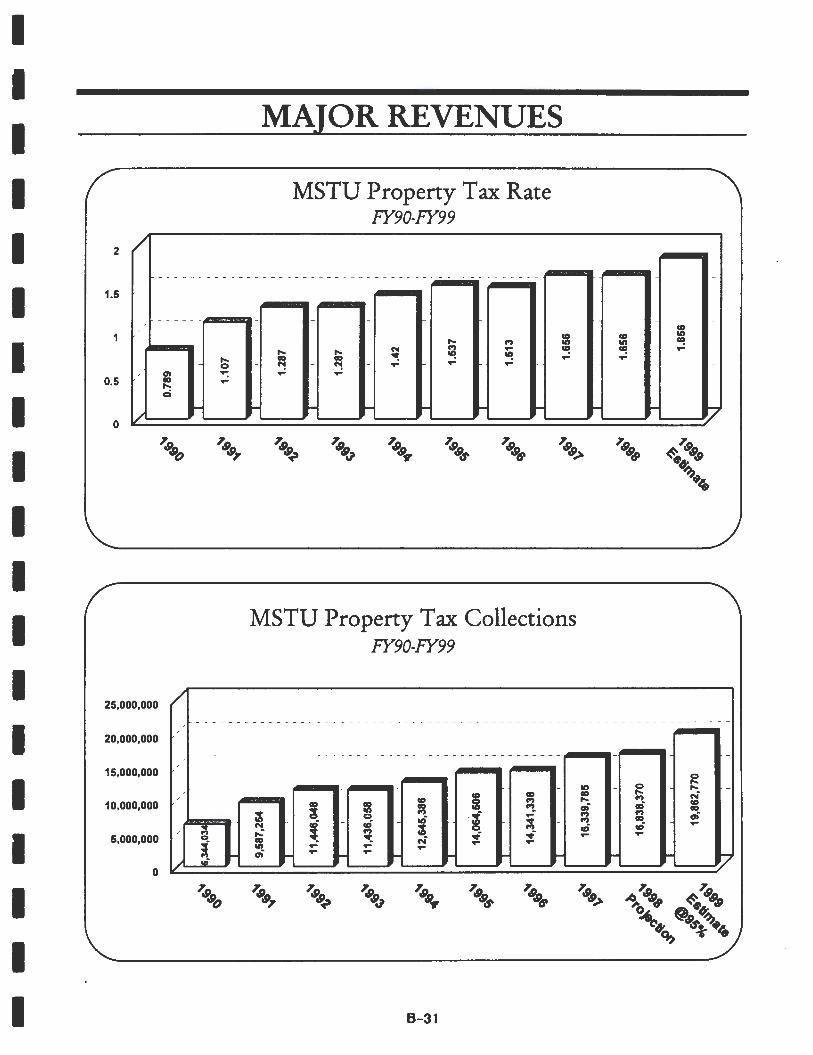
MSTU Property Tax Rate: The proposed 1999 MSTU property tax rate of 1.856 mills reflects an increase of 0.2 over the rate adopted in 1998.
8 - 22
I I I I I I I I I I I I I I I I I I I
I I I I I I I I I I I I I I I I I I I
MSTU Property Tax Collections: MSTU property collections are a direct result of the MSTU property tax rate and the MSTU taxable value. The MSTU collections are used to fund a variety of services benefiting
· only the unincorporated area of the County. The 1998 projected receipts and the 1999 estimated receipts reflect increases of 3.1 % and 18.0%, respectively.
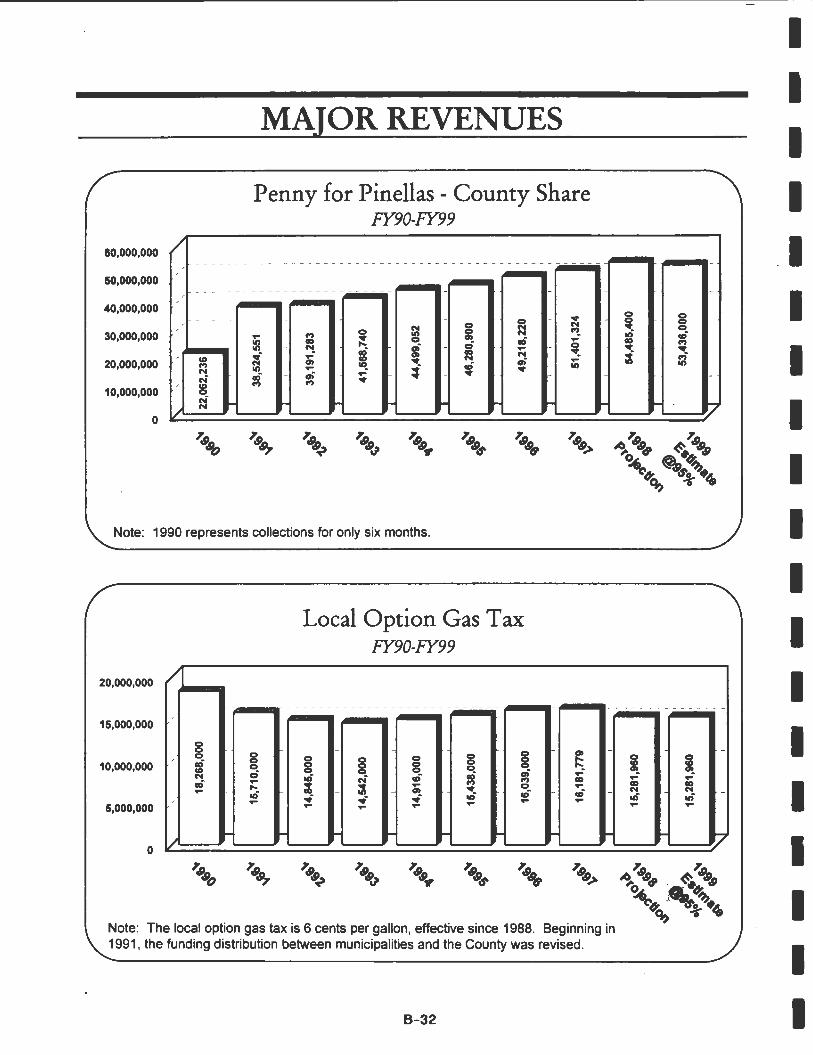
Penny for Pinellas - County Share: The Penny for Pinellas (Local Infrastructure Sales Tax) was established as a result of a countywide referendum in November 1989, and was extended until 2010 by a referendum passed in March 1997. The surtax is a one ( 1) percent levy on sales up to $5,000. Of the tax revenue, $80 million is earmarked . for improvements at the Pinellas County Criminal Courts Complex. The remaining sales tax revenue is divided between the County's 24 municipalities and the County, pursuant to an interlocal agreement. The chart reflects the County's share including the court allocation. Since 1991, the first full year of collections, the county's portion has increased from $38.5 million to a total of $51.4 million received in 1997. This represents a 33.4% increase. For the past three (3) completed fiscal years, receipts have increased 11.1 % or an annual average rate of 3.7%. The 1998 projected receipts reflect the continued growth in collections, which is consistent with the growth shown in the Taxable Sales chart.
Local Option Gas Tax: In accordance with Section 336.025(7) Florida Statutes, Pinellas County levies a six ( 6) cents per gallon tax on motor fuel sold. The tax is in effect through August 31, 2007. Pursuant to an interlocal agreement, the County retains 75% of the proceeds from the local option gas tax and the remaining 25% is allocated to the municipalities within the County. The chart reflects the County share of the proceeds. The County uses the proceeds to fund the debt
service requirements of the Transportation Improvement Bonds, Series 1993A and 1994B and the operating and maintenance of the County's road inventory.
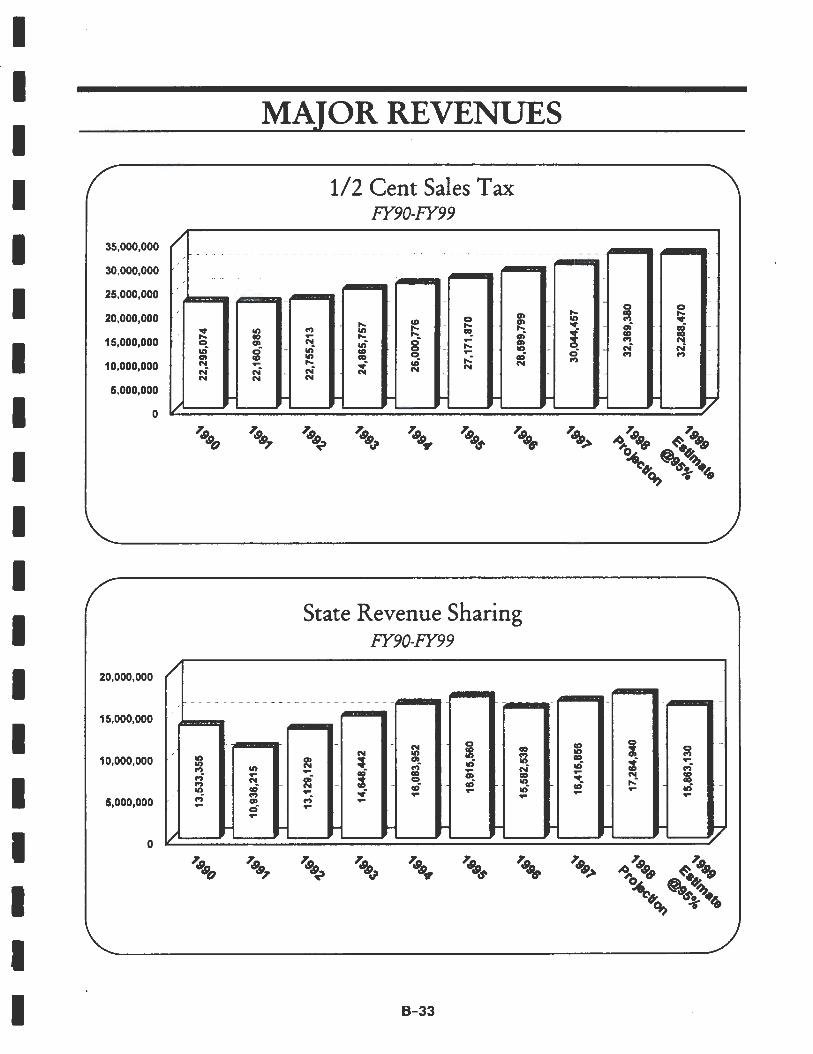
~ Cents Sales Tax: ·.The state of Florida levies a sales tax of six ( 6) percent on the purchase of consumer goods, with a variety of exemptions for nonprepared food items, prescription drugs, services, etc. The state returns 9.653 percent to the locality where the allocation to the county and municipalities is determined by a state-mandated distribution formula which considers taxable sales and population. The chart reflects the County share of the proceeds. Pinellas County uses this revenue in support of general fund . operations. From 1990 to 1997, receipts increased from $22.3 million to $30.0 million or 34.8%.
State Revenue Sharin~: The State Revenue Sharing Act of 1972 established trust funds for certain State-levied tax monies to be shared with counties and municipalities. The major sources of these funds are cigarette taxes and intangible personal property taxes. The State formula for distribution is based upon population and sales tax collections. The chart reflects the County share of the proceeds. Pinellas County uses this revenue in support of general fund operations.
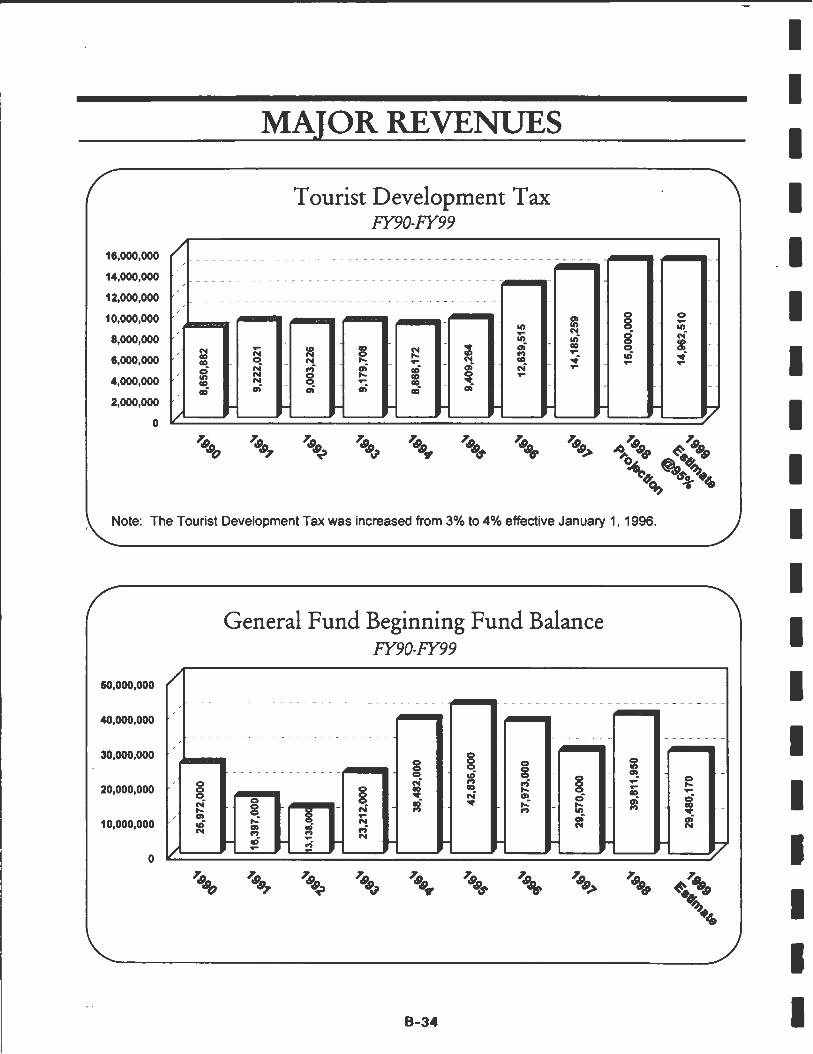
Tourist Development Tax: The County imposes a Local Option Resortffourist Tax, also known as the Tourist Development Tax, of four (4) percent on most rents, leases, or lets which have been contracted for periods of six ( 6) months or less, or living accommodations in hotels, motels, apartment houses, rooming houses, and mobile home parks. In fiscal year 1988, the Tourist Development Tax was increased from the initial two (2) percent to three (3) percent to provide additional revenue for tourist
B- 23
development activity. Of this, one-half (Yi) of the additional one (1) percent is earmarked for the Pinellas County Beach Renourishment program. In fiscal year 1996 ( effective January 1, 1996), the tax was increased from three (3) percent to four (4) percent. The fourth cent is restricted to debt service on the City of St. Petersburg's Excise Tax Bond, Series 1993, in accordance with the provisions of Section 125.0104(3)(1), Florida Statutes. The imposition of the fourth cent provided for the release of proceeds to provide additional revenue for increased promotional activity and beach renourishment. The chart reflects the tax as it relates to the four ( 4) percent levy.
From 1990 to 1997, tourist development tax revenue increased 64.0% from $8.7 million to $14.2 million. Approximately 41.0% of this increase is attributable to the imposition of the fourth cent. ·
General Fund Be2innin2 Fund Balance: This resource reflects the amount of carry forward revenue the County has at the beginning of each fiscal year in the General Fund. This fund balance is used as "cash flow" until other revenue sources are available. The fund balance reflected a steady increase from 1993 to 1995, coming out of the recessionary years of 1991 and 1992. It should be noted, however, that there is an overall downward trend beginning in 1996 through the 1999 estimate with an increase in 1998.
8-24
I I I I I I
,- ... ~, . I I I I I I I I I I I I I
I I I I I I I I I I I I I I I I I I I
1,000,000
800,000
600,000
400,000
200,000
0
ECONOMIC TRENDS
Population: Unincorporated and Incorporated 1988-1997
/ (D!nco,porated D Uninco,porated ) " •i "' i N . co .... ..,
~ ,.. ' .,, ,
i ~ N .... ·= ' : :t-'· .... N Cl
,.. oi "' ,.; 0 . a; 'i .,; a; "' .,; .,, co co ~ ~ ,.. .... - ,o· - - N
N N N N N N
- - -,
~ N .., ... ,.._ .., ... .,, en ID ... ID en .,, ,.._ a, ....
en ID .... en ,.._ o. .., N .., CD - CD - ri .,; CD - ... .,; ,..: - 0 en 0 en en en 0 0 0 ... II) ID .,, .,, II) ID ID ID ID ,
... ... ... - - - -/
; cor':-~ -
. ~,,-O-· i'r CD N -
-0 N ID
"' ... -ID
- r7
Source: Pinellas County Planning Dept. Note: The 1988 and 1989 numbers are the County's permanent population estimates. The 1990 to 1997 numbers are based on the 1990 census.
Number of Visitors - St. Petersburg/ Clearwater Area 1988-1997
5,000,000 / (DVnited States DForeign ) ------------------------------------ -- --- - ------- - - --- -
N c,
4,000,000 ~ .; . ..,
c, OI ~ co II> ' "' s:; I. .... . ,..
{ I:. .,, N .,; c, .,.. ,.. N { , ~ -,.. .... .... ~ .., .,;
.,, ,.. .... c,i • .... ,..: .. I "!. .... .... 3,000,000 h . .,; ,.; ~ - Cl ... .. ,.. O> ~ ~ - .,: :~ ;<;:
~ - ~ ... ... .. "' ....
2,000,000 ;,; ~ II)
N ... N a, co
M en N OI co M '"':. a, ,.; N .,, 0 .,; ,.. .,, ... ID N co ,..: ... N ,.. ... ID CD .,; CD ~ ID c, a,
CD ri ID ,.._
,..: .,, ,... ID ri ri c,; 1,000,000 .... N en ... ... N ri en. ~ CJ?. ri ri ri ... ... ... ... - ... ..... - - ..... i7
0 /
1'..9. c9e
1'..9. «9-9
1'..9. 3>o
1'..9. 3>7
1'..9. ~
1'..9. 3>ui
1'..9. 3>,,.
1'..9. 3>'1'
1'..9. 3>6'
1'..9. 3>.>
Source: St. Petersburg/Clearwater Area Convention and Visitor Bureau
B-25
10.0%
ECONOMIC TRENDS
Unemployment Statistics 1988-1997
United States Florida I 8.0%
6.0%
4.0% - - - - - - - - -; -- - - - - - - - - - - - - - - - - - - - - - - - - - - - - - - - - - - - ~- - - ----- - ---- -~- -
Pinellas 2.0%
0.0%
Florida Department of Labor and Employment Security; U.S. Bureau of Labor Statistics
500,000 / ------- - ---- -
' ' 400,000
/
300,000
200,000
0, 0, Cl) co Cl) .... .... ~ ...
ai / f'i .... .... ~ 0 • •
' 100,000
.. -0 /
Total Labor Force 1988-1997
- - - - - -
- -
... Cl) m N 0, -... co °' t .. " .... .... • • • - -
.. .. ..
Bureau of Business and Economic Research, University of Florida
B- 26
- -
m 0 .., N - 0 -
! ! - -
- -
... ~ ... ~ co
t .... i •
..
-
-
-
-
i,7
I I I I I I I I I I I I I I I I I I I
I I I I I I I I I I I I I I I I I I I
4,000
ECONOMIC TRENDS
Housing Units Permitted 1987-1996
____ ___ __ __ ________ __ __ ___ (D Unincorporated Olncorporated L _____ _ 3,000
..... 2,000 It)
..... ..... IX) M° C') .., .... CD ..; .., 0
IX) M° C'i 0) IX) .... ID C') OI CX) N .... N
C'i It)
~ 0 .... .., .... co 1,000 CC!. C'i Cl) .... ...._ ~ (') N .... _ .,.: ,:s: .. .... .... Cl) ... C'!.
0
7~ (9>
7~ '9c9
7~ '9-9
7,P. .Po
7,P. .P7
7,P. .g~
7,P. .Pu-a
7,P. .P,,.
Florida Statistical Abstract, 1994-1997; Pinellas County Building Department
12,000,000 /
Taxable Sales (in thousands) 1988- 1997
7,P. .P.,..
-- - --------------------------- -- ---- --- -------- -- -----------
10,000,000 --- --- ------------------ - ------------- -
8,000,000
6,000,000 .... OI .... ID 0
0 "" "" .... ID .... .... 0 .... .... 0 oi OI OI OI OI It) 00 0 ID .., O> IX) .... oi C') "" Cl) ,..: It) .., 4,000,000 .,.; ,..: ,..: ...; .... ID 0 oi
ID O> N .., OI 0 00 oi 0 .... "" N "" 00 ,..: ,..: ,..: ,..: ,..:
2,000,000 .... I- - .... - .... -
0 v
7~ '9c9
7~ '9-9
7,P. :Po
7,P. .P7
7,P. .g~
7,P. :Pu-a
7,P. ;g,,.
7,P. .g.,..
7,P. ;g6'
Florida Statistical Abstract, 1985 -1995; Florida Department of Revenue
B-27
7,P. .pd'
.., 0 N ID-0
"" 0 ....
7,P. ;g>
7
ECONOMIC TRENDS
Taxable Value: County-wide (including new construction) 1990-1999
/ 40,000,000,000 ------------------------------------- - - - ---- - ------------------
35,000,000,000 ----- - --- - - -- ---------------------- -30,000,000,000
0) 25,000,000,000 .. .., co II) 0 ~ co .., .., ....
J ~ .., CD 0 0 co 0 co co ~ "':. M M 20,000,000,000 .., .,; 1 ,.: .. .. 0) .. 0) 0 II) CD N
.., .., ~ ~ m .. ct ~ ~ .,; M 18 15,000,000,000 II) ,,; .. ,.; ... .., N vi
~ .,, .... .,, .,, ..,
N N 0 .... .,, CD ... ~ ,.; M
10,000,000,000 0 ,,; ,,; ,,; ,,; 0 .. .., ,.: .., .., ..,
N N N N N
5,000,000,000 .... .... .... .... - - .... .... 0 /
7.9. '9o
7.9. '97
7.9. ~
7.9. '9.,
7.9. '9~
7.9. '9~
7.9. '96'
7.9. '9.>
7.9. '9c,
Source: Pinellas County Property Appraiser
Taxable Value: County-wide New Construction 1990-1999
1,000,000,000 /
800,000,000
600,000,000 ....
N CD co ,.; CD .., t CD
t
?
7.9. ~ '9-9 ~
c,~
i~ .: .
m ---------------------------------- - -----400,000,000
0 co N vi co 0 m .. ~ .... .. 0 N 0 ~ g ~ 0 N ,,; co N
r, .., .. M - .... ~
.. .... ... Co?.
.., 18 it m tj :s .... ... m m ~ ... N ,.; co ,.: m 0) M N
.., .... "':. .... CD m M .. ,,; 0) .,, M ~
.. .,; ... m 0) m ... I- - .... I- co I- - I- - co .... ? .., .., .., .., ..,
200,000,000
/ 0
Source: Pinellas County Property Appraiser
B-28
I I I I I I I I I I I I I I I I I I I
I I I I I I I I I I I I I I I I I I I
ECONOMIC TRENDS
Taxable Value: MSTU (including new construction) 1990-1999
12,000,000,000 / ----------- - ---- --- -------------------- - ---------
10,000,000,000
8,000,000,000 a, .,, .., .,, .., ;!
,... a, a, .,, .,, 0 0 N 0 .., ,..: 0, ,... .., .... ,... 0, fO 6,000,000,000 ~ ,..: ,..: i .,; fO N ICI ....
i 0 0, 0, a, N ,..: ,... 0, Cl.?. 0 N fO ICI ,..: ,..: .,; f'i ,...
4,000,000,000 ,..: .... 0
.., N .... .., .., .,, .,, ICI 0 .., 0 N N N ,,; .., ,,; ,,; ,,; ,,; ,,; ....
2,000,000,000 fO .. .. .. ..
0 /
"a. 3>o "a. 3>., "a. 3>~
"a. 3>-, "a. 3>,r "a. 3>-,. "a. 3>6' "a. 3>>
Source: Pinellas County Property Appraiser
300,000,000 /
250,000,000
200,000,000
150,000,000
100,000,000
50,000,000
0 /
Taxable Value: MSTU New Construction 1990-1999
- ------ - ------------------ - --------- - - ---
--- -- --0 ,... 0
i ~ ,... T" N
..
0, j 0 0, 0 :J; ,...
N ~ {
ICI .., .,; ,..: O!.. f'i N ICI .... ..,
;! ~ 0, .,, I
N .... .,,
~ i i 0, ,,; 0 .... co ,... co .... T" .... .... .... .... - - - - - - .. "a. 3>o "a. "a. "a. "4>. "a. "a. 3!, 3>-, 3>,r ~ 3>6' 3>.>
Source: Pinellas County Property Appraiser
B- 29
,... a, N ;g .... .; 0 co
,... N
....
.,; ..; 0 co ,... "!. 0 .... .... ....
v
"a. "a. 3>c, ~ 3>" ~
.. (p
.,, 0 0, 0 .,, ICI 0 ,,; .., I N
t f'i .... N N
- r7
"a. "a. 3>c, ~ 3>" ~
"'"
MAJOR REVENUES
County-wide Aggregate Property Tax Rate FY90-FY99
I I I I I I I I I
Note: Includes all millages levied by the Board of County Commissioners on a County-wide basis. Does I not include the Pinellas Planning Council.
I County-wide Property Tax Collections I
FY90-FY99
250,000,000 /
----------------------------------------------- - - - -- - -------- - - ---200,000,000
150,000,000 0, 0 ... ! g .,, co ... "' i OI ., ....
~ 0, N
0, N .... - ., "' co "' fO c-; .... 0 N 0 g ...: c-; t "' 100,000,000 ..... - a; .... .... OI N 0, 0
0 N 0 .... "t ..... t .... .,, 0 i "?. 0 .,; .,; fO .,; - fO .... c-; ., ., 0, N .... ..... ..... ..... .... .... co co .... .... .... .... ....
50,000,000 .... .... - - - - - ... ... I- - '7 ,,
0 /
1'~ 1'~ 1'~ 1''5! 1''5! 'J?P. 1''5! '"8> 1'~ 1''5! -Po -s>, ~ -911 -P,r ~ ~ ~ iP :,i ~ -s>a ~···:~
Note: Includes all property taxes collected by the Board of County Commissioners on a ~~ &>""-t iP~
County-wide basis. Does not include the Pinellas Planning Council.
B-30
I I I I I I I
I I I I I I I I I I I I I I I I I I I
2 /
MAJOR REVENUES
MSTU Property Tax Rate FY90-FY99
- - - - - - - - - - - - - - - - - - - - - - - - - - - - - - - - - - - - - - - - - - - - - - - -~-.. -"'-... 1.5
------
... 0
0, "": 0.5 Ill ... ...
0 ... 0 /
'.P. .s>o '.P. .s>,
25,000,000 /
20,000,000
co ... .., II) ... ... N .., ... ~
Ill Ill ~ ~ ~ ... "! "! ... . ... ... ... ...
... - ... - - ...
'.P. ~
'.P. .s>_, '.P. .s>,, '.P. .s>~ '.P. .s>cS' '.P. .9.>
MSTU Property Tax Collections FY90-FY99
co :g II)
«! ~ ... ...
- - "7
'.P. '.P. .Pc, ~ .s>,p ~
"4
- - - - - - - - - - - - - - - - - - - - - - - - - - - - - - - - - - - - - - - - - - - - - - .-~·-.----15,000,000 0
0 ...
II) - ... I Ill Ill ... r,; co .., ... ..,
flO co Ill "?. ,,; Ill .., ·i ... .., .., ,,; .,;
~ .., Ill
: vi vi ... .. .. ... ... r,; ... ... ... - - ... .... - .. ?
- -- ------- --
10,000,000 i 18 ~ 0 N t - vi
/ i ,..: .., 5,000,000 Ill ~
II) ... ... - ,,; - ... .... ... ... 0 I/
'.P. '.P. '.P. '.P. '.P. '.P. .s>,, .s>~ .Pc, .s>.> ~ .Pc, ~ .s>,9
~~~ 0a~;~.4 '.P. '.P. '.P. '.P. .s>o .s>, ~ .s>_,
B- 31
60,000,000 /
50,000,000
40,000,000
30,000,000
20,000,000
10,000,000
0 /
MAJOR REVENUES
Penny for Pinellas - County Share FY90-FY99
- - - - - - - - - - - - - - - - - - - - - - - - - - - - - - - - - - - - - - - - - - - - - .. - -ililiiii
- - - - - - - - - - - - - - - - - - -.--iilillilllliilf
co M N ~-0
~
M
~ ... OI ... °' M
- - -
Note: 1990 represents collections for only six months.
20,000,000 /I --· Local Option Gas Tax
FY90-FY99
- '7
~--- - - - - - - - - - - - - - - - - - - - - - - - - - - - ..----.------ - - - - - - - - - - - - -15,000,000
g 0 8 OI 0 0 0 8 g
~ 10,000,000 .,; 0 8 g 0 0 co 0 °' N .,; N .,; .,; ....
.,; ... M M CIO ,... J i ... ~ 0 ... ... .,; - OI .,; .,; ... .. .. .. U) .. ...
5,000,000 ... ... ... .. - ... - ... - ... - -
0 /
Note: The local option gas tax is 6 cents per gallon, effective since 1988. Beginning in 1991 , the funding distribution between municipalities and the County was revised.
B-32
0 0
~ co O!. ... ....
CIO CIO N N .,; .,; ...
- '7
I I I I I I I I I I I I I I I I I I I
I I I I I I I I I I I I I I I I I I I
35,000,000
30,000,000
25,000,000
20,000,000
15,000,000
10,000,000
5,000,000
/
MAJOR REVENUES
1/2 Cent Sales Tax FY90-FY99
- - - - - - - - - - - - - - - - - - - - - - - - - - - - - - - - - - - - - - - - - - - - - - - - - - - ------ ill-..
--------------------------..... -{Im-·
~ 0 .,; 0) N ri N
Ill CD OI 0 co .... ri N
.., .... N
:g" .... ri N
~ .... .... .... ...: N
- 7 0 ~/:.::==~-===~-===~..:::===--=====-====~====~====~====~====~
.... - .... -.... -
20,000,000 /
15,000,000
10,000,000
5,000,000
State Revenue Sharing FY90-FY99
- - - - - - - - - - - - - - - - - - - - - - - - - -.-.-.. Ill Ill .., ..; .., Ill ..;
Ill .... N
t OI 0 ....
~ .... t .... ..; ....
~ OI ..; CD 0 Iii ....
8-33
0 :g .,; .... 0)
Iii ....
CD .., ID ri :g .,; ....
:g CD .,; .... ~ co .... -
0 .., .... ..; :s .,; ....
16,000,000
14,000,000
12,000,000
10,000,000
8,000,000
6,000,000
4,000,000
2,000,000
0
/ , , , ,
MAJOR REVENUES
Tourist Development Tax FY90-FY99
---------------------------------------------------~-.. 1'11----- - - - - - - - - - - - - - - - - - - - - - - - - - - - - - - - - - - - - - -----
U) .... .., N .... co CD N ;z oi CD N N 0 .... "' 0 N .... N co CD f'i ...; oi
.... oi f'i 0 ro
U) N 0 .... co 0 .... co N 0 .... CD ,,t
11/0 oi oi oi 11/0 oi
- """ - ,.. - ,.. -
0 g § .,; ....
8l N :g .... ..; ....
0 .... U)
f'i I ..; ....
i/ ic::==::::.....:==:::::.....::::::::::::::......:::==::::......::==:::::.....:::::::::::::....:::==::......::==:::::::...===:-=:=::J
Note: The Tourist Development Tax was increased from 3% to 4% effective January 1, 1996.
50,000,000 /
40,000,000
30,000,000
20,000,000
10,000,000
0 /
General Fund Beginning Fund Balance FY90-FY99
- - - - - - - - - - - - - - - - - - - - - - - - - - - - - - - - ----- - - - - - - - - - - - - - - - - - - - - - - - - - - - -
g j g 0 0 g --------- - - -- 0 ro ~ g 0 0 f'i "' ...; .... .... 0 0 i CD .... .... .... f'i CD 0 g °' 0 oi 0 f'i Cl :t ,,t ...: g f'i ....
"' i .... { "' U)
°' .... - .... fJ oi .,; N
°' ID ...; N N "'
.., ro .. N - - !! """ - ,..
""" - - .... r? ....
,~ ,~ ,~ ,~ ,~ ,~ ,~ '~ ,. ,. ~ oP, ~ -'11 -',r .,~
" -'..> i.\,~ ~-' ~~ ""a.g ~ .. ~
8-34
I I I I I I I I I I I I I I I I I I I