1a - RAC 010609 Overview DTC January 2009. 8 January 2009 Page 1 ... – Establish budget guidelines...
33
Our water. Our future. SAWS Overview Financial Services Dan Crowley Director - Financial Planning Rate Advisory Committee 8 January 2009
Transcript of 1a - RAC 010609 Overview DTC January 2009. 8 January 2009 Page 1 ... – Establish budget guidelines...

Our water. Our future.
SAWS Overview
Financial Services
Dan CrowleyDirector - Financial Planning
Rate Advisory Committee8 January 2009
8 January 2009 Page 1
SAWS Overview San Antonio Water System
We proudly serve our customersand help communities flourish
with plentiful, quality, affordable water services
SAWS is a nationally recognized leader in providing reliable and affordable water
service

8 January 2009 Page 2
SAWS Overview San Antonio Water System
Mission & VisionMission: Proudly serving our customers
and helping communities flourish with plentiful, quality, affordable water services.
Vision: Our VISION of success is achieved through people, best in class performance, and strong partnerships.
8 January 2009 Page 3
SAWS Overview San Antonio Water System
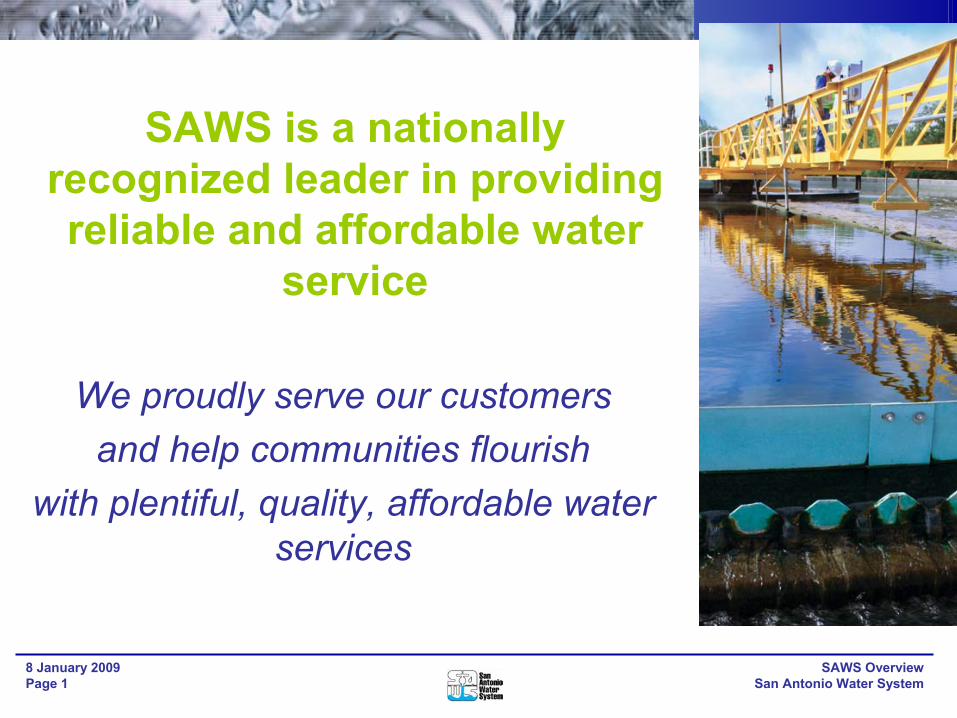
Water Source Well/Pump Storage
RiverSewageCollection System
Wastewater Treatment Plant
Commitment to Essential ServicesProviding Value Around the Clock
Distribution

8 January 2009 Page 4
SAWS Overview San Antonio Water System
Employees: 1,601
YTD Revenues: $319.7 Million
Assets: $3.42 Billion
Liabilities: $1.71 Billion
Equity: $1.71 Billion
Nearly 10,000 miles of mains
Serving over 1.3 million people
Located within 620 square miles
SAWSBy the Numbers at 10/31/2008

8 January 2009 Page 5
SAWS Overview San Antonio Water System
Acting for the FutureA Brief History
1980
1994 – Residential Conservation funding established by Ordinance
2000
1984 – Council approves first Drought Management Plan
2000 – Water Supply Fee established by Ordinance
2010
2005 – Council endorses Water Supply Plan Update
2004 – Aquifer Storage & Recovery grand opening
1998 – Council endorses Water Supply Plan
1998 – Commercial Conservation funding established by Ordinance
1990s – Federal lawsuit and establishment of EAA, pumping limits, and drought restrictions
1992 – SAWS created
1980s – Conservation initiatives begin
1990
2001 – Recycled Water System comes online

8 January 2009 Page 6
SAWS Overview San Antonio Water System
SAWS Organization
InternalAudit
BoardSupport
Accounting
Finance
FinancialPlanning
Purchasing
RiskManagement
Supply
Treasury
FinancialServices
ApplicationServices
DatabaseAdministration
ERSS
Print ShopServices
ProgramManagement
TechnicalServices
InformationServices
Senior Vice President /Chief Financial Officer
Doug Evanson
Constructionand
Maintenance
EasternServiceCenters
WesternServiceCenters
SupportServices
Distribution& Collection
Val RuizVice President
CorporateReal
Estate
EnvironmentalLaboratoryServices
FacilitiesMaintenance
FacilitiesManagement
Fleet
ResourceProtection &Compliance
Security
OperationsServices
Mike BrinkmannVice President
Production
TreatmentOperations
TreatmentMaintenance
Heatingand
Cooling
EnvironmentalServices
Production &Treatment
Senior Vice President /Chief Operations Officer
Steve Clouse
Distribution& CollectionEngineering
GovernmentalEngineering
InfrastructurePlanning
PipelineInspection
Production/Recycle/
Treatment Eng.
Engineeringand
Construction
Conservation
WaterResources
WaterResources
Senior Vice PresidentStrategic Resources
Kelley Neumann
Customer Svc.Stacey IsenbergVice President
Communications
PublicAffairs
Greg FloresVice President
Claims
CorporateTraining
HumanResources
Safety andEnvironmental
Health
HumanResourcesJerry Bailey
Vice President
Contracting
Legal
RecordsManagement
Small, Minority,Women
Business
LegalFrank
Stenger-CastroVice President
President / CEORobert R. Puente
BOARDof
TRUSTEES
8 January 2009 Page 7
SAWS Overview San Antonio Water System
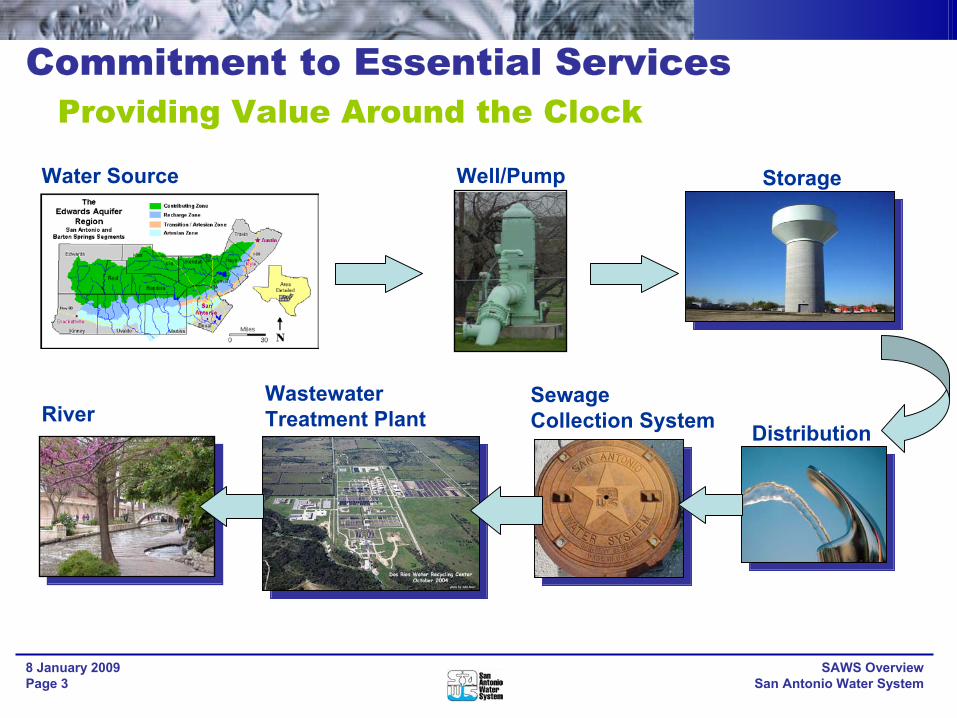
Structure
Plan and report from a Core Business perspective
– Water Delivery – Wastewater– Water Supply (Recycle, Water Resources,
Conservation, Stormwater)– Chilled Water & Steam
Allocation of revenues and costs by core businesses

8 January 2009 Page 8
SAWS Overview San Antonio Water System
PlanningPlan using 20 year model– Revenues– Operations & Maintenance Costs– Capital Improvement Program– Capital Outlay– Debt Service Portfolio– Financial Ratios (exp. Debt Coverage Ratios)– Ordinance Requirements (75686, 92752 est.)
• Operating Reserve• Debt Coverage and Reserves• City Payment and Matching City Payment

8 January 2009 Page 9
SAWS Overview San Antonio Water System
Budget Process• Review Strategic Plan• Update revenue forecast• Update 20 year Financial Plan• Develop budget goals & strategy
– Establish budget guidelines based on Executive Management directives
• Departments prepare budgets• Executive review and decision• Presentations to Board Subcommittees, Board• Board Approval

8 January 2009 Page 10
SAWS Overview San Antonio Water System
RatesCost of Service Based Structures
Rates are based on Cost of Service– By customers class– Matches rates to cost to serve each group– Each group “pays its own way”; no subsidies
The current general water and wholesale service rate structure are comprised of:– A monthly meter charge - based on meter size– An increasing volume charge - which includes five
blocks
SAWS rates are regulated by City Council– City Public Utilities office monitors SAWS activity
8 January 2009 Page 11
SAWS Overview San Antonio Water System
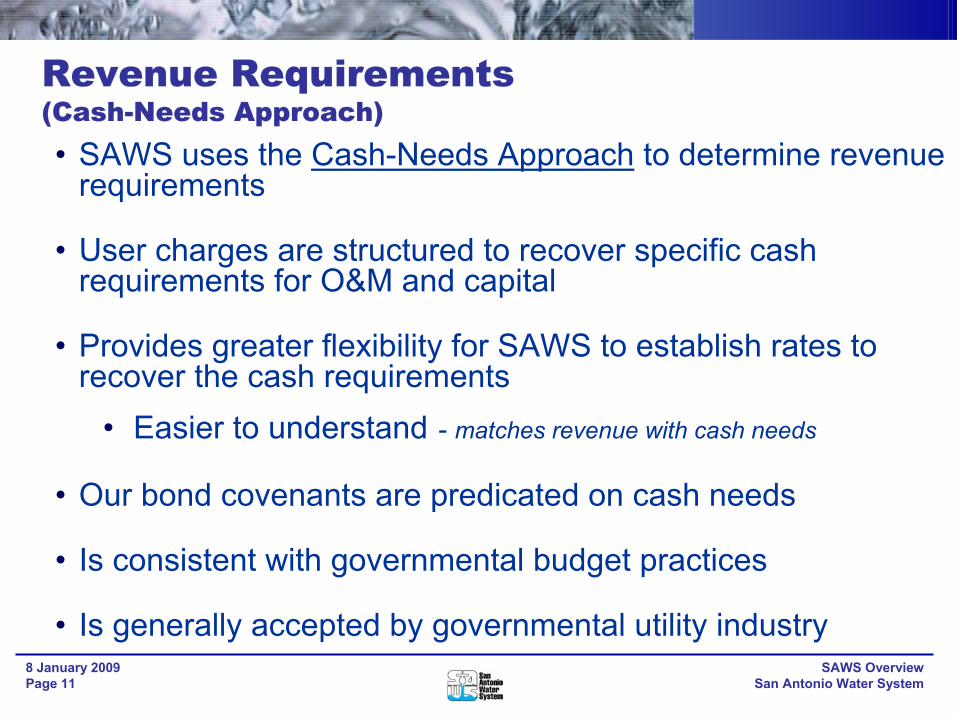
Revenue Requirements(Cash-Needs Approach)• SAWS uses the Cash-Needs Approach to determine revenue
requirements
• User charges are structured to recover specific cash requirements for O&M and capital
• Provides greater flexibility for SAWS to establish rates to recover the cash requirements
• Easier to understand - matches revenue with cash needs
• Our bond covenants are predicated on cash needs
• Is consistent with governmental budget practices
• Is generally accepted by governmental utility industry

8 January 2009 Page 12
SAWS Overview San Antonio Water System
50,00075,000
100,000125,000150,000175,000200,000225,000250,000275,000300,000325,000350,000375,000400,000425,000450,000
2009
2011
2013
2015
2017
2019
2021
2023
2025
2027
2029
2031
2033
2035
2037
2039
2041
2043
2045
2047
2049
2051
2053
2055
2057
2059
Acr
e-Fe
et
Edwards Supplies (Avg) Non-Edwards Supplies ASR Project
Demand*
Current water supplies in average conditions would meet demand through the 2040s
Without Edwards Restrictions
*Assumes aggressive conservation and customer growth

8 January 2009 Page 13
SAWS Overview San Antonio Water System
50,00075,000
100,000125,000150,000175,000200,000225,000250,000275,000300,000325,000350,000375,000400,000425,000450,000
2009
2011
2013
2015
2017
2019
2021
2023
2025
2027
2029
2031
2033
2035
2037
2039
2041
2043
2045
2047
2049
2051
2053
2055
2057
2059
Acr
e-Fe
et
Edwards Supplies Non-Edwards Supplies ASR Project
Edwards Supplies Cut 40%Under Stage IV Drought Restrictions
*Assumes aggressive conservation and customer growth
Demand*
50-yr Water Supply Plan
Edwards Aquifer LevelStage I <660’
Stage II <650’ vs Today 668.1’Stage III <640’Stage IV <630’

8 January 2009 Page 14
SAWS Overview San Antonio Water System
50,000
75,000
100,000
125,000
150,000
175,000
200,000
225,000
250,000
275,000
300,000
2009 2010 2011 2012 2013 2014 2015 2016 2017
Acr
e-Fe
et
Edwards Supplies Non-Edwards Supplies ASR Project
Demand*
Drought of Record ScenarioShortage as early as 2013
*Assumes aggressive conservation and customer growth

8 January 2009 Page 15
SAWS Overview San Antonio Water System
1987 20071987
2007
Conservation50% More Customers, 0% More Water
SAWS Edwards Aquifer Production(1987 vs. 2007)

8 January 2009 Page 16
SAWS Overview San Antonio Water System
0
20
40
60
80
100
120
140
160
180
200
220
240
1979 1989 1999 2009 2019
Gal
lons
per
Cap
ita p
er D
ay (G
PCD)
Actual GPCDPredicted GPCD
Gallons Per Capita Per Day(1979-2007)
220 GPCD (1980)
157 GPCD (1996) SAWS115 GPCD (2007)
45% reduction in per capita consumption
ConservationThe National
Leader
Dallas 217Austin 187El Paso 151Houston 134TX Water Dev Bd, 2006
8 January 2009 Page 17
SAWS Overview San Antonio Water System
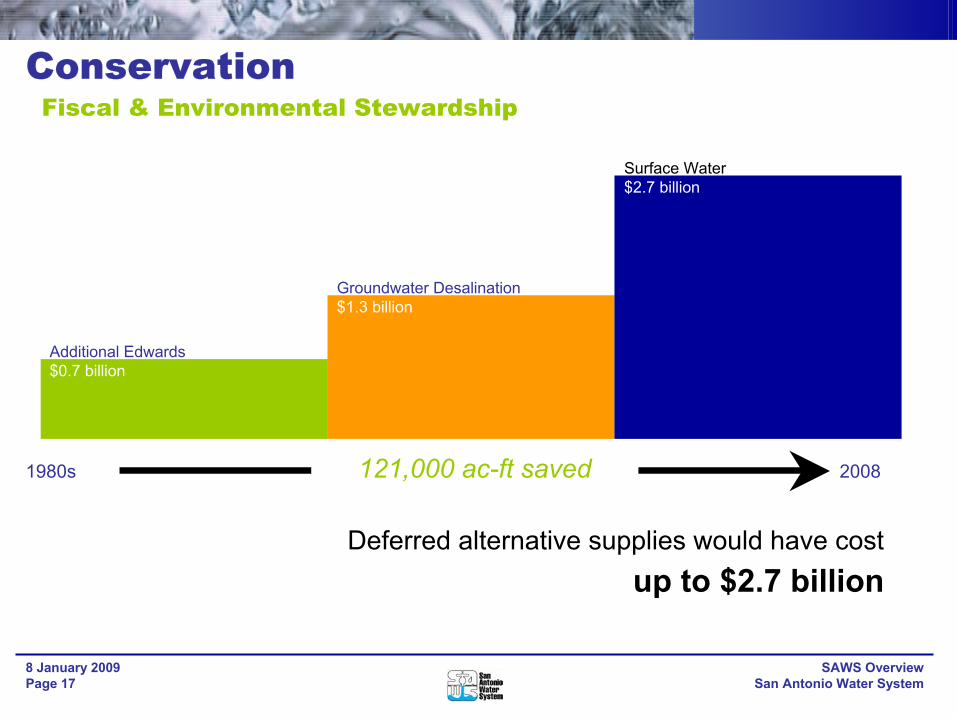
Deferred alternative supplies would have cost up to $2.7 billion
Additional Edwards$0.7 billion
Groundwater Desalination$1.3 billion
Surface Water $2.7 billion
1980s 2008121,000 ac-ft saved
ConservationFiscal & Environmental Stewardship
8 January 2009 Page 18
SAWS Overview San Antonio Water System
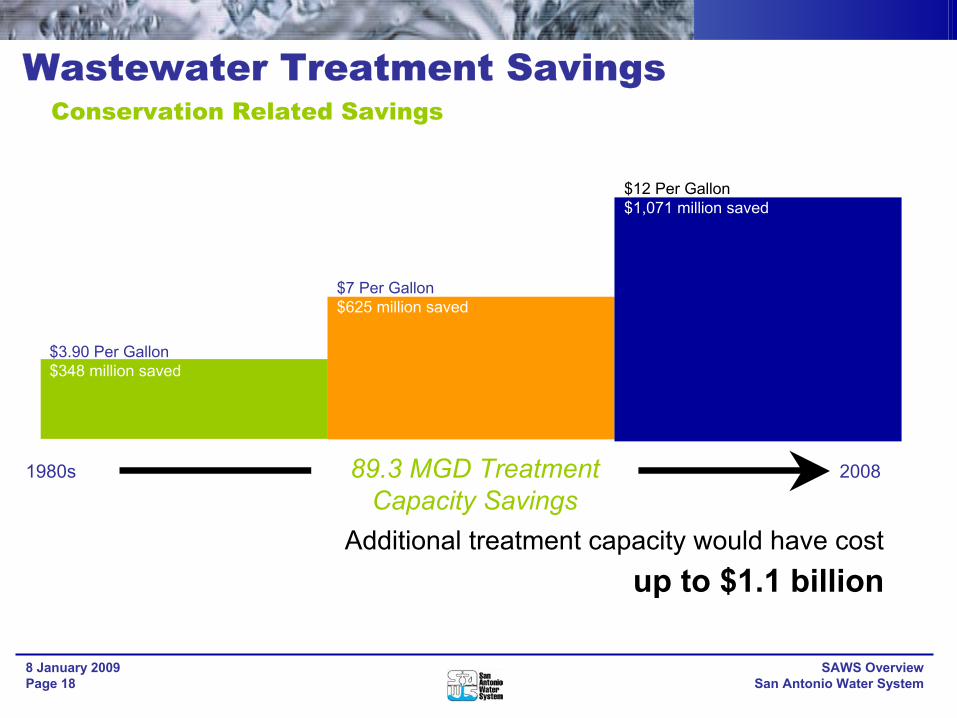
Additional treatment capacity would have cost up to $1.1 billion
$3.90 Per Gallon$348 million saved
$7 Per Gallon$625 million saved
$12 Per Gallon $1,071 million saved
1980s 200889.3 MGD Treatment Capacity Savings
Wastewater Treatment SavingsConservation Related Savings

8 January 2009 Page 19
SAWS Overview San Antonio Water System
Optimize use of the EdwardsConservationRecycled Water SystemAquifer Storage and Recovery
Reduce Stress on the EdwardsCanyon Lake - DesalinationTrinity Aquifer - Regional Carrizo Local Carrizo - Lower Colorado River Authority
- Recharge- Other Potential Supplies
Accommodating a growing community
Water Supply

8 January 2009 Page 20
SAWS Overview San Antonio Water System
Improving the SystemInfrastructure
Expensive Repairs
Pipes crumble and fail over time
Public Health and Safety

8 January 2009 Page 21
SAWS Overview San Antonio Water System
Capital Improvements Program 5 Year (Forecast)
$0
$100
$200
$300
$400
Water Supply $86.8 $132.7 $127.9 $98.7 $67.8 Water Delivery $58.1 $78.2 $69.0 $68.2 $53.1 Wastewater $123.3 $177.0 $138.4 $126.7 $172.2 Heating & Cooling $0.1 $0.1 $0.1 $0.1 $0.1
2009 2010 2011 2012 2013
$ in
Mill
ions
$268.3
$388.0
$335.4$293.7 $293.2

8 January 2009 Page 22
SAWS Overview San Antonio Water System
Operating Cost Increases
Wastewater Line CleaningPreventative Maintenance Program
Chemical Cost IncreasesFerrous Sulfate, Sulfuric Acid, Dewatering Polymer
Electricity Customer Growth, Rate Increase, Fuel Adjustment Clause
Employee-RelatedRetirement, Post-Retirement Medical
Maintenance Materials/ExpenseAsphalt Price Increases, General Inflation, System Expansion
Other Significant IncreasesCredit Card Payments, Security, Postage, Fuel
Water Related LeasesIncreased Edwards Leases to Support Customer Growth, Regional Carrizo Leases
Plus, Increased Conservation EffortsPrograms, Education and Awareness
Line maintenance and unavoidable rising costs

8 January 2009 Page 23
SAWS Overview San Antonio Water System
473464464441
403
0
100
200
300
400
500
2004 2005 2006 2007 2008*
Empl
oyee
Operations17% More Efficient Since 2004
Customers / Employee
*End of year projection
8 January 2009 Page 24
SAWS Overview San Antonio Water System
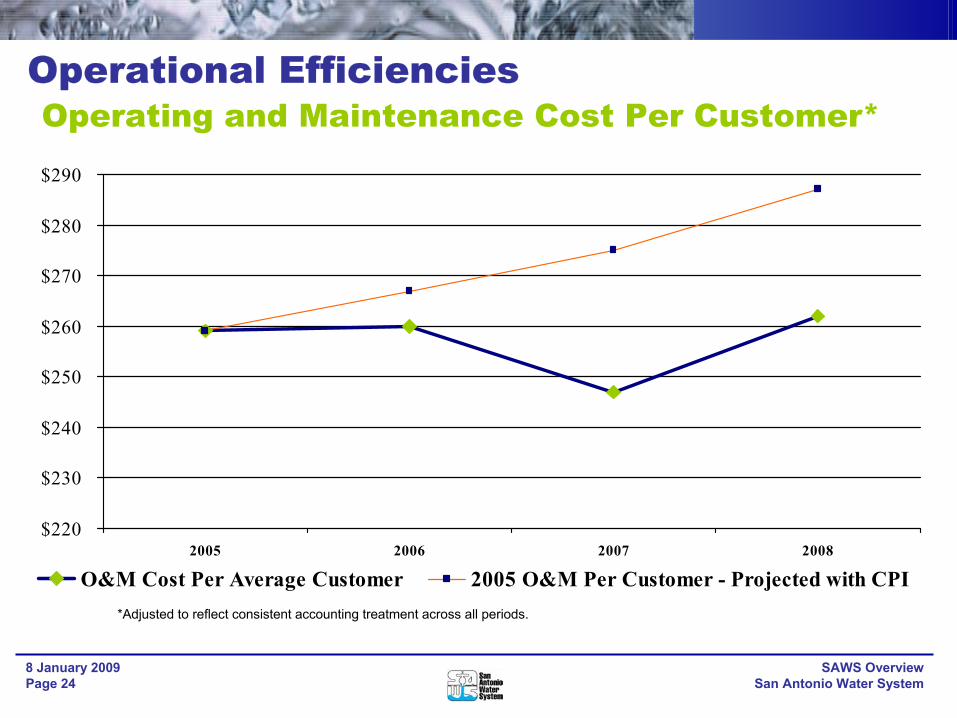
$220
$230
$240
$250
$260
$270
$280
$290
2005 2006 2007 2008
O&M Cost Per Average Customer 2005 O&M Per Customer - Projected with CPI
Operational EfficienciesOperating and Maintenance Cost Per Customer*
*Adjusted to reflect consistent accounting treatment across all periods.

8 January 2009 Page 25
SAWS Overview San Antonio Water System
Residential Bill & Rate Projection
Actual Projected
Monthly Residential Bill 2009 2010 2011 2012 2013 Water Supply 11.91 12.92 13.98 15.02 16.34 Water Delivery 13.94 14.52 15.31 16.01 16.49 Wastewater 17.39 19.08 20.64 21.46 23.04 Total 43.24$ 46.52$ 49.93$ 52.49$ 55.87$ Increase 1.63$ 3.28$ 3.41$ 2.56$ 3.38$ Increase % 3.9% 7.6% 7.3% 5.1% 6.4%
EAA Fee 0.95 0.95 0.95 0.95 0.95 Total With EAA 44.19$ 47.47$ 50.88$ 53.44$ 56.82$ Increase % with EAA 2.8% 7.4% 7.2% 5.0% 6.3%
Residential Bill (7,788 gallons water / 6,178 wastewater, ICL, Standard)
Average based on 7,788 gallons water and 6,178 gallons sewer usage. As of November 2008. Excludes COSA Stormwater.

8 January 2009 Page 26
SAWS Overview San Antonio Water System
Infrastructure1.7%
Operations & Maintenance
Water Supply1.0%
How the 2009 rate increase will be used
3.9%
Average Residential Bill Increase of $1.63 / monthAverage based on 7,788 gallons water and 6,178 gallons sewer usage. As of November 2008. Excludes COSA Stormwater.
(Other)0.3%
(Line Cleaning)0.9%

8 January 2009 Page 27
SAWS Overview San Antonio Water System
National Bill ComparisonNational Residential Water and WastewaterTop 10 U.S. Cities by Population
$0.00
$10.00
$20.00
$30.00
$40.00
$50.00
$60.00
$70.00
$80.00
$90.00
Monthly Bill $27.23 $32.28 $44.19 $49.88 $54.45 $55.21 $56.52 $57.94 $67.93 $78.48
Chicago Phoenix San Antonio Dallas New York Houston San Jose Los Angeles Phila- delphia
San Diego
Average based on 7,788 gallons water and 6,178 gallons sewer usage. Rates as of November 2008. Excludes COSA Stormwater.

8 January 2009 Page 28
SAWS Overview San Antonio Water System
Texas Bill ComparisonAverage Residential Water and Wastewater
$0.00
$10.00
$20.00
$30.00
$40.00
$50.00
$60.00
$70.00
$80.00
Monthly Bill $34.59 $44.19 $49.88 $52.75 $55.21 $67.94 $68.08
El Paso San Antonio Dallas Ft. Worth Houston Austin Corpus Christi
Average based on 7,788 gallons water and 6,178 gallons sewer usage. As of November 2008. Excludes COSA Stormwater.

8 January 2009 Page 29
SAWS Overview San Antonio Water System
Residential Rate IncreasesMajor Texas CitiesSince Last SAWS Rate Increase in 2006
0.0%
5.0%
10.0%
15.0%
20.0%
25.0%
30.0%
Monthly Bill 2.0% 3.9% 6.7% 8.1% 19.3% 21.1% 25.9%
El Paso San Antonio Ft. Worth Houston Corpus
Christi Dallas Austin
Average based on 7,788 gallons water and 6,178 gallons sewer usage. Excludes EAA Fee. As of November 2008.

8 January 2009 Page 30
SAWS Overview San Antonio Water System
Affordability ProgramsIncome Based Programs
- Affordability Discount- Project Agua Payment Assistance
• Includes- Senior & Disability Billing- Medical Consideration- Foster Care Transition Support- Payment Arrangements
• Participants- Project Agua 1,015- Wastewater only 3,528- Senior Citizens 6,234- Avg Monthly Enrollment 20,829
8 January 2009 Page 31
SAWS Overview San Antonio Water System
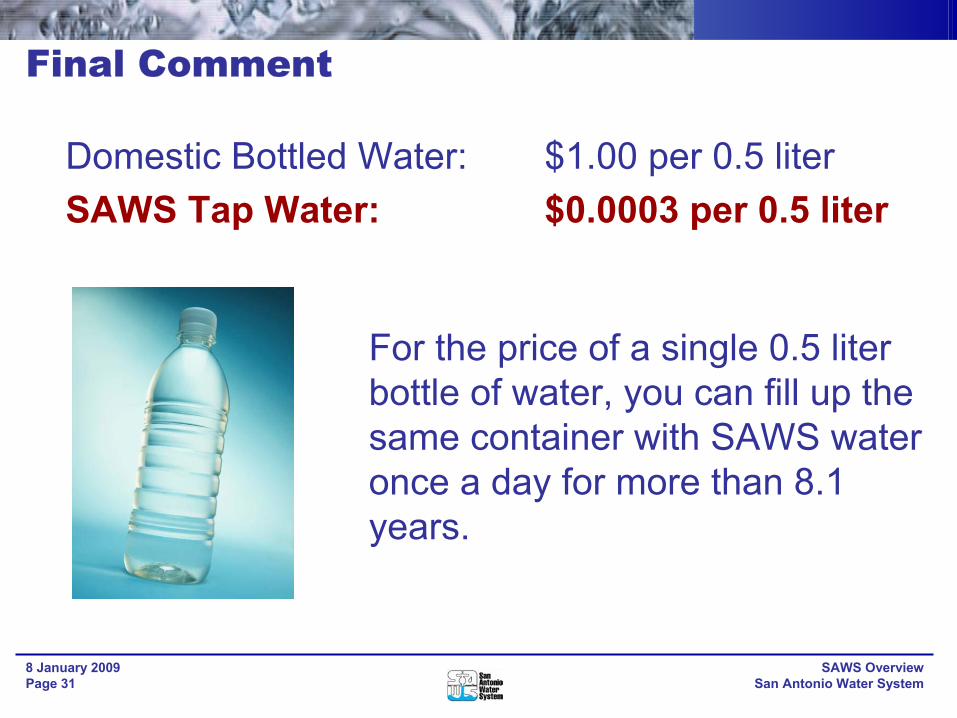
Domestic Bottled Water: $1.00 per 0.5 literSAWS Tap Water: $0.0003 per 0.5 liter
For the price of a single 0.5 liter bottle of water, you can fill up the same container with SAWS water once a day for more than 8.1 years.
Final Comment

Our water. Our future.
SAWS Overview
Financial Services
Dan CrowleyDirector - Financial Planning
Rate Advisory Committee8 January 2009


![biti0910.files.wordpress.com€¦ · Web viewBUSINESS IDEA [Version 2.1/010609/TED/MDeC] Contents . Section 1.0 EXECUTIVE SUMMARY…………………………………… Section](https://static.fdocuments.in/doc/165x107/5e7895e56399be5ae51dfa12/web-view-business-idea-version-21010609tedmdec-contents-section-10-executive.jpg)