19th CEE-Annual Report - Labour Guide
112
Transcript of 19th CEE-Annual Report - Labour Guide

A

B

i
PUBLISHER
Department of LabourChief Directorate of Communication
Private Bag X117, Pretoria, 0001
LAYOUT, DESIGN, EDITING AND DISTRIBUTION
Subdirectorate of Media Production, Chief Directorate of Communication
PRINTER
Government Printers
RP Number
RP135/2019
ISBN Number
978-0-621-47368-1
THE DEPARTMENT OF LABOUR, LABORIA HOUSE
215 Francis Baard Street, Pretoria.Private Bag X117, Pretoria, 0001
Tel: (012) 309 4000www.labour.gov.za

TRANSFORMATION MAKES BUSINESS SENSE
ACRONYMS
FOREWORD
MEMBERS OF THE COMMISSION FOR EMPLOYMENT EQUITY
1. INTRODUCTION
2. KEY STRATEGIC OBJECTIVES
3. HIGHLIGHTS FOR THE REPORTING PERIOD
4. CHAPTER II OF THE EEA: PROHIBITION OF UNFAIR DISCRIMINATION IN THE WORKPLACE
5. WORKFORCE REPRESENTATION ANALYSIS OF EMPLOYMENT EQUITY REPORTS RECEIVED IN 2018
6. ANALYSIS OF EE REPORTS RECEIVED
7. TRENDS ANALYSIS OF WORKFORCE PROFILE BY OCCUPATIONAL LEVEL, POPULATION GROUP, GENDER AND DISABILITY BETWEEN 2016 AND 2018
8. CONCLUDING OBSERVATIONS AND REMARKS
9. REFERENCES
10. APPENDIX
CONTENTS
iii
iv
vi
1
3
5
9
13
17
47
59
61
63

iii
ASDSA Association for Skills Development in South Africa
ACT Employment Equity Act, 1998 as amended
B-BBEE Broad-Based Black Economic Empowerment
B-BBEE COMMISSION Broad-Based Black Economic Empowerment Commission
BUSA Business Unity South Africa
CCMA Commission for Conciliation, Mediation and Arbitration
CEE Commission for Employment Equity
CGE Commission on Gender Equality
COSATU Congress of South African Trade Unions
DEPARTMENT Department of Labour
DG Director-General of the Department of Labour
DPSA Disabled People South Africa
DRAFT EE REGULATIONS Draft Employment Equity Regulations, 2018
DESIGNATED GROUPS
“Designated groups” mean black people, women and people with disabilities who – are citizens of the Republic of South Africa by birth or descent; or became citizens of the Republic of South Africa by naturalisation – before 27 April 1994; or after 26 April 1994 and who would have been entitled to acquire citizenship by naturalisation prior to that date but who were precluded by apartheid policies.
EAP Economically Active Population (EAP) includes people from 15 to 64 years of age who are either employed or unemployed and are seeking employment
EE AMENDMENT BILL Employment Equity Amendment Bill, 2018
EE AWARDS Employment Equity Awards
HSRC Human Sciences Research Council
ILO International Labour Organisation
NEDLAC National Economic Development and Labour Council
NPO ����������� ��� ���
NSA National Skills Authority
POPULATION GROUPS Means African, Coloured, Indian, White and Foreign National
PSC Public Service Commission
SASLAW South African Labour Law Society
ACRONYMS

iv
��������������������������������������������������������������� �������������������������� ����establish workplace transformation and we continue to be enthused by the introduction of the 1997 Bill in the Government Gazette publication, wherein the then Minister of Labour clearly articulate the objectives thereof: “We want to build a South Africa with a diverse and representative workforce. We want to abolish discrimination in the workplace. Let this Bill be the subject of debate in every workplace and by all workers and employers.” (Mboweni, 1997, p. 2)
This was the beginning of the journey to redress the wrongs of the past – the process towards establishing a fair and just workplace. It signalled an era in which purposeful action was introduced to eliminate all forms of unfair discrimination in the workplace. For most South Africans it was a promise of the elimination of all forms of systemic discrimination in the workplace, providing mobility to fair opportunity. As a Commission, the CEE remains committed to seeing the objectives of the EEA materialised, as we share the progress to date, in this 19th report (2018).
At a broad level, the trends presented in this, 19th Commission for Employment Equity Report, continue to paint a picture of a very slow, but steady pace of transformation especially at the top four occupational levels. Compared to the 2017 statistics, representation of the White Population Group has shown a decline of 3.6% at Senior and 4.3% at Skilled levels respectively. When considering the total number of employees covered in the report, Senior Management makes up 2% of the total employee population and thus a !"#$������������� �"&���� ��' � ������*"!$ ��+<����=>�?��'������� ������ �����@#JK$��������������=��������� �"Q������� �������V����� �=Y������� #Z$ ������������ ���[� ����=>�?��J �= \Z$ ��+<����=>�?��"Top Management constitutes only 0,8% of the total number of employees that are covered in the report.
Transformation in terms of gender representation has also remained steady but slow. The highest positive growth in representation is ���= ������������ �>�?���]"K$����� ��=������?���������"+������ ���������������������'��V�� ^��������� ���?�����'"����V����� �=Y�������������=��������_���� �?�_����"
The Commission has noted a concerning trend in the reporting of Skills Development. The EEA reports submitted, still indicates that the White Population group remains the preferred group in terms of Skills Development. Whilst the Employment Equity Regulations �@Z]*� �� ������� �� � +<���� V�?������� ������ �����= ���� ��=�� � `���� '�� �����?�= � ����� ���� ��� �� �������� �� ����?��� �� ������� � �� ��x{ ���_@J ��" |�" ��� ���������� �� ��� �� ��_ ������ � ���� ����� +<���� V�?������� �� ��designated group, in as far as it advances the objectives of the EEA. It leaves the inference to be drawn that that Designated Employers ���������� ��� �����J�"�"=����� �= �=����=����� �=������J'���������}�� ��'����� ~������̂ ������ ������� �����in these positions in general remain from amongst the White Population Group. This interpretation would have to be explored and the Commission has taken a decision, to enhance the reporting system to provide more meaningful data and to clarify compliance of this instruction in the annual EEA reports.
FOREWORDCHAIRPERSON: (CEE)
References 1. Mboweni, T. (1997). Employment Equity Bill. Government Publication2. Employment Equity Regulations (2014)

v
Over the past year, the Commission has also noted a higher number of reporting of violations to the Employment Equity Act (EEA). These have been directed to the Commission for Conciliation, Mediation and Arbitration (CCMA), the Courts and the Inspection and Enforcement Services (IES) in the Department of Labour, while other were investigated by the CEE itself, in terms of its statutory mandate. It appears as if workers in particular, have embraced the responsibility and their rights bestowed upon them through the EEA, to report discrimination and to seek justice, as was foreseen with the enactment of the EEA. This aim is to break the back of systemic discrimination.
The Commission has been hard at work with a number of interventions. The current amendments to the Act remains at the top of our agenda. We do believe the amendments will further the acceleration ����� ������ ��� ���= "����� ��� ����� ���������������� �= �"
A special word of thanks to the CCMA for their contribution to this report by way of the article on Chapter II of the EEA.
We moreover take this opportunity, to thank the previous Minister, Mildred Oliphant, for her support in enabling the Commission in furthering the work for a better South Africa. We thank the Employment Equity Directorate for all the team work and commitment to the objectives of the Commission. The Commissioners have displayed unwavering support to me as a Chairperson, and for that, I am eternally grateful.
_________________________________________T KABINDE, MSChairperson: Commission

vi
CHAIRPERSON: COMMISSION FOR EMPLOYMENT EQUITY
Ms Tabea Kabinde is the Managing Director of We Find Talent, a recruitment agency based in Pretoria and Cape Town. She holds a Master’s degree in Clinical Psychology and has been
within the recruitment industry for over two decades. She has wide experience in the Human Q�������� �= ��� ��� ��� � V�?������� ���=�� ����� ������ �� �� ��� � � �����and facilitation of involvements, Recruitment and Selection, Executive Search as well as Psychometric Screening.
Ms Kabinde has served on numerous Boards in the private and NPO Sectors. She was appointed as President of APSO in 2011. During her years with APSO, she drove the
transformation agenda within the Recruitment Industry Body and prides herself for moving APSO from a local association to a world respected professional body. She is also involved in
�_��+J'������ ���^���� ^�=�J����������� �����=?���������+���_���� �� ����industry.
Ms Kabinde has been an active role player at BUSA and NEDLAC. She was honoured with a role as one of three business representatives for South Africa at the ILO “Building the future with Decent Work” conference in Geneva. She proudly represented ��+_ �=� �^����������� ���=� ���� �=� ����������� ������+���_���� ����? ����������_�������J�� �������the industry’s commitment to professionalism and compliance. Ms Kabinde has been privileged enough to receive a number of accolades, which include Business Woman of the Year in 2013, as well as the Founders Cup conferred by APSO in 2014. She stepped =�'� � ̂ ��������������� �?����������@Z]|� <����� �����������J �_������ ���������������������� �=is currently serving as Chairperson for the fourth Commission.
BUSINESS CONSTITUENCY
Dr Annelie Gildenhuys is an Industrial Sociologist who specialises in Employee Relations and Diversity Management. She serves as commissioner on two statutory bodies i.e. the Essential
Service Committee member and as Commissioner for the Commission for Employment Equity. She has been an accredited CEDR Commercial and Labour Mediator for a number
of years and was instrumental in establishing the Bargaining Council for Civil Engineering (BCCEI). Annelie is a former CCMA Commissioner, trainer, mentor and panellist for several Bargaining Councils since the inception of the CCMA in 1996 until 2011, and alternative private dispute resolution bodies. She has re-joined the Tokiso panel as arbitrator, mediator,
investigator and trainer. Annelie is best known for her highly interactive dialogue sessions and training work in Diversity and Equity Management and focus on Sexual Harassment
and violence in the world of work. She is a GIBS MBA Research examiner and supervisor �� &�=���� � Q�� ����J �� ����= �}����?� �� �� �@Z]Z� �= � ��� ��� � Q��������
Practitioner.
V�Y��=�������������������=�= �?���� ������= �Y��^ ��� =����������Q�� �������� ������� � ���� �<'�������also served as ER representative for the Banking Association South Africa (BASA) and at Social Policy Level for Business Unity South _���� ���+_�"����������� � ����V�������� ������������ =?���= � ������^������������������ �]#�� ��"+��started her career at the Human sciences Research Council (HSRC) as Labour Economic Researcher.Dr Gildenhuys is the co-author �� =��� ���^�������������� �������=� �= � ��?����^������+���_���� �> '+������+_+>_��"�
��������
MEMBERS OF THECOMMISSION FOR EMPLOYMENT EQUITY
MSTABEA
KABINDEDRANN
ELIEG
ILDENHUYS

vii
MSTHEM
BICHAGONDA
COMMUNITY CONSTITUENCY
Mr Puleng Tsebe is a retired educator. He was a lecturer at Mokopane College of Education and later appointed as principal at Alfred Masebe School. He became a councillor at Mogalakwena
Municipality and Waterberg District Municipalities. He is active within the disability community and has held many leadership positions.
Among those are, the National Deputy Chairperson Development at Disabled People South Africa (DPSA), DPSA Provincial Chairperson – Limpopo, Chairperson of DPSA Mogalakwena Branch, Disability Forum Member at Services SETA (SSETA), Waterberg District Chairperson of Home Affairs’ National Population Registration Clean-up Campaign
Forum, Board member of Polokwane Gateway International Airport, Chairperson of Voortrekker Hospital Board, Chairperson at Mokopane Provincial Hospital Board, Member for
Polokwane/Mankweng Hospital Complex Board, Member of Waterberg FET College Council, ANC Secretary Western Sub-Region (now Waterberg Region) and Chairperson of SANCO in
Mahwelereng. He is the DPSA representative in the Community Constituency of the Development Chamber at NEDLAC. He is a member of the Executive Committee at NEDLAC and he is a member of the BEE Advisory Council.
Mr Malesela Maleka is presently the Head of Policy, Research and Political Education at the South _���� ���������� ���+_���"�����=� ���������� ������� �����^���� � ���������
��� �������� +������ ������ ������ � �� �������� V�?������� ���� �� ���?����� ��the Western Cape; Advanced Diploma in Public Administration from the University of the
Western Cape, and a Post Graduate Diploma in Public and Development Management from Wits University.
A sports activist, Mr Maleka has held various leadership positions in the sporting fraternity, the student movement (SASCO) and the Young Communist League of South Africa. He also
���?�����_��+��_������� �=��+_[_�� �="
MR
MALESELA
MALEKA
MR
PULENG
TSEBE
BUSINESS CONSTITUENCY
Ms Thembi Chagonda holds a degree in Social Science, majoring in Industrial Psychology & Sociology from Rhodes University. She also achieved a Post Graduate Diploma in Labour Law in 2005 and
is an accredited assessor and moderator. In 2016 she received accreditation in 4MAT Learning Design (About Learning), accredited through Michigan University.
She was the Managing Director of Global Business Solutions since 2005 and has extensive �}����������������� �� �����=������ ���������� � �����J � ������ ��� �� ��workplace, employment equity, skills development, and Broad-Based Black Economic Empowerment. Ms Chagondai is a board member of the ASDSA (Association for Skills
Development in South Africa), the IoD (Institute of Directors) and chairs a number of Education Trusts in order to facilitate opportunities for under privileged communities. She has served in
Remuneration Committee’s, Social and Ethics Committee and Nomination Committees.
She consults for a range of large multinational organisations and serves as a Commissioner on the Commission for Employment Equity representing organised business. In 2014 she was nominated
�� ��� ��� �� �< ��� �� >� =�� �� �� �� � _' �= � ����� �� �� ]!� ���?�� ����'����� _' �=" +�� �� � ����� � ^��empowerment of Persons with Disabilities.

viii
GOVERNMENT CONSTITUENCY
Ms Zodwa Ntuli is the Deputy Director-General for Consumer and Corporate Regulation in the Department of Trade and Industry (DTI) since 2008. She has delivered on major reforms, including the Corporate
Law Reform (new Companies Act of 2008 and establishment of CIPC), the Consumer Law Reform (Consumer Protection Act of 2008 and establishment of the National Consumer Commission),
the Removal of Adverse Credit Information (Negative Credit Bureau Listing) for consumers, the National Credit Amendment Act, introducing enhanced affordability tests for lending, Lotteries Amendments leading to improved distribution of lottery funds to good causes, to name a few.
Previously, she was the Executive Manager at South African Airways from 2006 - 2008 and part of the team that established Mango Airline. She was Executive Manager for the Compliance
V�?����� ���������������������J �=��==�?��������������>�����������������Competition Commission to uncover cartels. Her passion for women development led her to initiate
the Corporate Governance Development Program for Women, a partnership between the DTI and the Institute of Directors Southern Africa. Her strength is in project management, policy development
and business regulation. Since August 2015, she was appointed by the Minister of Trade and Industry to establish and head B-BBEE Commission, whose role is to oversee the implementation of the B-BBEE Act, as amended.
Mrs Tshabalala is currently the Deputy -Director General (DDG) in the Department of Women responsible for social transformation and economic empowerment. She is the former Head
of the Department for Social Development in Gauteng. Previously, she served as the DDG in the Department of Health and Social Development responsible for Social Services, the Chief Director for Social Crime Prevention in the Department of Community Safety and the Director ��������^�����+��� ��� ������ ����Y��=��J����J�V�� ^�������������������������of Gauteng Province.
ORGANISED LABOUR CONSTITUENCY
Ms Zingiswa Losi is presently the President of COSATU. She is employed as a Deputy Director for Partnership at the Civilian Secretariat for the South African Police Services. Previously she was employed
at Ford Motor Company as an operator and later became a quality inspector. She started her career as an Admin Technical Support for the South African Air Force, where she gained various skills
including inter-personal skills, communication strategies and high integrity and leadership skills.
��>��� �� �<������=J ����� �J����=��J � ��� ��� �= ����� ��?�� �^���=��"Through the military discipline, she has acquired many attributes among them humility, principles, determination and decisiveness and how to use initiatives in order to meet and
resolve challenges. She is presently pursuing a course in Criminal Law and Procedure through Damelin College.
Mr Bhabhali ka Maphikela Nhlapo is employed as the Skills Development Policy Coordinator at the Congress of South African Trade Unions (COSATU). Prior to his appointment to this position, he was the
��������� ���������� �Q����^������������� �=��� ����"��' � �����+<������ �����Manager and Constituency Support Executive Manager for the Chemical Industries Education and
�� �����_���������&��_�"����� ��� ��=���� ���� ����=�� ��� �=�� �����������later becoming a Skills Development Coordinator and eventually the Elections Manager at �����_��J'������ ��+_�� ���� �"
He holds a BA in Social Work from the University of Fort Hare and is currently pursuing an MA in Industrial Sociology at the University of the Witwatersrand. He obtained a number of
������ ����> ^���>����� ��� �=+<����������������������&>��� ������������& �� �=Y���? �'��� � ������ ������=���?��� � ������������ � �&���� ��� �
Labour Foundation (Tokyo).
MRS
TSHABALALAM
SZIN
GISW
ALOSI
MRBHABHALIKAM
APHIKELA NHLAPO
MS
ZOD
WA
NTULI

1
INTRODUCTION1.
1

2
The Commission of Employment Equity (CEE) is a statutory body established in terms of Section 28 of Employment Equity Act, No 55 of 1998 (EEA). The functions of the CEE (S30- 33 of the EEA) is to advise the Minister of Labour on Codes and Good practice and regulations made by the Minister, policy and any other matters concerning this Act. The CEE in addition, may make award recognizing achievements of employers in furthering the purpose of this Act; research and report to the Minister relating to the application of this Act, including appropriate and well researched norms and benchmarks for the setting of numerical goals in various sectors and perform any other prescribed functions.
In performing its functions, the CEE may call for written representation from members of the public and hold public hearings to allow for public comment.
In terms of S33, the CEE must submit an annual report to the Minister. This annual report is the 19th Commission for Employment Equity (CEE) Annual Report submitted to the Minister of Labour. The Report covers the work of the CEE for the period between 1 April 2018 and 31 March 2019.
The status of Employment Equity in the South African labour market is presented in this report. The information presented is as submitted by designated employers in their annual Employment Equity Reports as required by Section 21 of the Employment Equity _�J�����������������Q����������]+����^��@Z]\�]|� �� ��@Z]�"
The strategic objectives of the CEE for the term are highlighted in the report as it informed by their mandate and the key activities of the CEE for the annual period and provides workforce information on the National and Provincial Economically Active Population (EAP).
The current employment equity representation status and trend analysis over the past three years is discussed in terms of population group, gender and disability in the workforce. An analysis of the reports received in the 2018 reporting period is provided by province, sector and business type.
1. INTRODUCTION
2

33
2.OBJECTIVESKEY STRATEGIC

4
The CEE’s key strategic objectives are derived from the mandate provided by the Act, which is to advise the Minister on codes of good practice, regulations, policy and any other matter concerning the Act. In addition, the CEE may make awards recognising the achievements of employers, conduct research, including the establishment of well-researched norms and benchmarks for the setting of numerical goals in various sectors.
��������'��� ��<���� �����^~���?��� ����^������������������������
• To promote equity in the labour market;• To provide advice on the Act, Regulations, Codes of Good Practice, Policy and any other related matters to the Minister; • Engage stakeholders in order to promote effective implementation of the EEA;• Conduct research in order to inform and enrich the work of the Commission; and• Monitor, evaluate and report trends on employment equity.
2. KEY STRATEGIC OBJECTIVES
4

55
3.FOR THEHIGHLIGHTS
REPORTING PERIOD

6
The highlights of the work during 2018/19 included publishing the Employment Equity Amendment Bill, 2018, and the Revised Employment Equity Regulations for public comment, making preparations and inviting employers to participate in the Employment Equity Awards and consolidating efforts through strategic partnerships aimed at promoting equity in the labour market.
3.1 EMPLOYMENT EQUITY (EE) AMENDMENTS
The Employment Equity Amendment Bill, 2018 and the Draft Employment Equity Regulations, 2018 were published for public comment for 60 days from 21 September 2018 to 20 November 2018.
The main objectives of the Amendments are to enhance the administration and compliance mechanisms of the Act by introducing �� ^���� ���?������ ��� �� ����� �� +���� ������� �� ���� �= ��� �� ������� ��� �� +����� |! ��� �?��� �������� '��provides goods and services to any organ of State must comply with the provisions of the Act that are applicable to them.
Extensive engagements on the amendments did take place by the Social Partners at NEDLAC prior to publishing the EE Amendment Bill and draft EE Regulations for public comment. In addition to receiving public comments, stakeholders were also provided with the opportunity to express their views on the matter during public hearings conducted in October 2018.
The CEE is currently deliberating on public comments received from various organisations and individuals. The sector stakeholder ��� ���������������������� ���� ����?�� ��=���������������'�� ��� ��� �"&���� ���=� ����_���=���Bill will be tabled for discussion by the next Parliament established after May 2019 elections.
3.2 ENDING VIOLENCE AND HARASSMENT IN THE WORLD OF WORK
In the period under review, the CEE participated in key strategic advocacy fora and deliberations aimed at addressing the scourge of violence and harassment in the world of work.
3.2.1 SOUTH AFRICA NATIONAL HIGH LEVEL FORUM WITH SOCIAL PARTNERS
Violence and harassment in the world of work has become an alarming emerging phenomenon world-wide. The enormous cost of Violence and Harassment at work for the individual, the workplace and the community at large is becoming more and more apparent. Although incidents of violence and harassment are known to occur in all work environments, some employment sectors are particularly exposed to it, for example, law enforcement services, health care services and so forth.
In view of this, the International Labour Organisation (ILO) in consultation with the various ILO Member States agreed in 2016 to initiate discussions to explore possibilities of developing an International Labour Standard that will regulate the ending of violence and harassment in the world of work.
&����� � �����������=��������������������=&>�+ �= �=����=���?������� �=� � ���������'���=��'��<J����������� ^�� ���'����&>�������������� J���?���= +���_���� � ��� �������?�������'������ �� �����J�"�"��� ����=Business, Organised Labour, Community Constituency and Government on 17 May 2018 to discuss this matter.
������� ���^~���?�����������?�������' ������ �� �=�������= � ������������� ���= ��������������=���������������������=&>�� �= �=����=���?������� �=� � �����J'����' �����=���=� <��� �� ������@Z]\&���� ��� �Labour Conference (ILC).
Feedback received from the 2018 ILC indicated that Member States agreed that the proposed international standard should take the form of an ILO Convention supplemented by a Recommendation on ending violence and harassment in the world of work. It is ��?�� ��=� �������==��������� ���= �� ������ �= =�������&>�+ �= �=�'���^����=������@Z]�&>�"
In anticipation of the adoption of this proposed ILO Standard, the CEE will be undertaking a review of our current employment equity policy instruments with the view of ensuring that our national policies are aligned to the requirements of the standards and are ready for implementation.
3. HIGHLIGHTS OF ACTIVITIES FOR THE REPORTING PERIOD

7
3.2.2 1994 WOMEN’S CHARTER REVIEW CONFERENCE
The CEE being a statutory body mandated with the promotion of employment equity in the labour market participated in the 1994 Women’s Charter Review Conference held in the Parliament of South Africa on 20 August 2018.
The objective of the Conference was to review and amend the 1994 Women’s Charter and solicit inputs from various key stakeholders, which will inform the changes to be effected on the Women’s Charter.
The review process focused on the following key strategic areas, but not limited to violence against women; social and health services; economic empowerment of women in relation to advancing the inclusive economic growth paradigm for women; and Education and training geared at empowering women and girls to be independent.
Some of the key outcomes of the deliberations included amongst others, the following:
• Parliament should not approve Departmental budgets that are not gender responsive and must ensure that the proposed Women Empowerment and Gender Equality Bill is resuscitated and passed into law;
• Monitoring and Evaluation mechanisms must be implemented across all levels of government to assess progress in relation to gender equality and gender mainstreaming;
• Advocacy campaigns must be conducted at all levels to ensure that women and girls, including men and boys are educated regarding gender equality and gender-based violence. These campaigns must be inclusive of the Rural Areas as well;
• � �� ���� �= V�������������� �� �} ����� �� ����� � �� ����� � �� ��= ������� � ���� �� �� �}������� �� '���� ����inheriting land or being economically empowered, and this have harmed women’s human right to equality and dignity;
• Social Services should apply to all areas of women’s lives, in particular in the home, the workplace, health and education – special attention should be placed on the needs of rural and disabled women; and
• Gender inequality and dependency is inherently linked to lack of access and power. Therefore, there is a need to provide women with greater access to employment opportunities, skills development and training, as a mechanism to reduce inequality.
It is envisaged that the outcomes of the discussions and recommendations made by parties gathered will be incorporated into a report, which will then inform the review and the amendment process of the Women’s Charter by the Parliamentary Multi-Party Women’s Caucus.
3.2.3 NATIONAL SUMMIT ON GENDER-BASED VIOLENCE (GBV) AND FEMICIDE
Recognising that violence at work is a major workplace problem, which is rapidly becoming an everyday reality for many workers, from teachers, bank security personnel, nurses and air crews faced with mounting cases of air rage among passengers; the CEE participated in the National Summit on Gender-Based Violence (GBV) held from 1 to 2 November 2018.
����^~���?������ ��� �+����' ����=�����^����������� ==���������������Y��=���� ��=���������Y��������society. The highlights of the discussions focused on amongst others, the Panel discussion on real life experiences of women and ������������ ������=�������^�������������? �����<���� �������� ���=�=�^� ==�����=����=����� =�� ���scourge of GBV and the negative impact it may have on the societal well-being and growth.
It is important to highlight that the Commissions were each mandated to identify gaps and propose possible solutions in each of the themes, i.e. Prevention; Laws and policies; Response and support; Accountability and resourcing; Coordination and Communication. Some of the key recommendations made at the Summit included, but not limited to the following:
• �����=��� �� �=������+��������^����������= �= = ��=�� ����������=���?����������=���^ ��=?�������J�"�"��=���J���������?��������� ��J��������� ����?��������� �����^����� ���=����'�� �=��� ��� �=?����������=���^ ��=violence;
• Violence in South Africa is common despite the proliferation of legislation and state measures to prevent the crime before it happens and protection of victims after the fact are very weak;
• Implementation strategies and plans must be improved to strengthen the law enforcement mechanisms geared at eradicating GBV; • A National Strategic Plan on gender-based violence must be developed; and• A multi-disciplinary rapid response team on ending GBV must be established to monitor and evaluate the implementation of the
proposed National Strategic Plan on GBV.

The CEE acknowledges the fact that the prevalence of violence has increased at the workplace level, which was traditionally viewed as a violence-free environment. Employers and workers are urged to become equally interested in the prevention of violence and harassment at the workplace level.
The CEE sees the society as a whole having a critical role to play in preventing violence spreading over to the working life and recognising the potential of the workplace by removing such obstacles to productivity, development and workplace stability and peace.
3.3 EMPLOYMENT EQUITY AWARDS
��������������������_' �=����_' �=���?����<�� ����@Z]| �=���� � ���������������=�?��� ?� ��� =�started.
Key objectives of the EE Awards includes assessing and evaluating the overall transformation that has taken place; identifying and acknowledging employers that have innovative strategies for promoting sustainable, equitable and inclusive workforces; and recognising employers that excel in the implementation of the EE Act.
Nomination forms for employers to participate in the event were circulated on 21 October 2018 and the closing date for participation ' �@ZV����^��@Z]\"��������������'�� �����=�� ����� �� ?���'^��� ������= � ����������� ���������� ��(Basic Compliance) and upon passing, would qualify to participate in the second phase (Progressive Compliance) prior to being considered for excellent achievement by an impartial Adjudication Panel. Hosting of the EE Awards event is planned for the 2nd �� �������@Z]��@Z�� ��� ��� �"
3.4 STRATEGIC CO-OPERATIONS
The CEE engages a number of bodies involved in the transformation space in relation to mandates and co-operation, i.e. the B-BBEE Commission, CCMA, CGE, PSC and SAHRC. As mentioned above, social partners and a number of these institutions were involved in a high level discussion on ending violence and harassment in the world of work at a workshop hosted by the CEE and ILO in May 2018.
&� ==����J�� �����������=�� ����� ������ ����� �=������&�= ^ ���=��@\����@Z]\"������������&�= ^ ' ��&�������������������������@Z�� ��� ���"������������=������������� =������������� ���������_�?����� �@Z�� �� �=�����_� =� ������ �������� ��V�������� ���� ���" Q��������'��������?�=������� ����=Labour, Organised Business, Community, PSC and the CGE and on the way forward, including considering the setting of sectoral targets.
Memoranda of Understanding (MoU) with the PSC was concluded in September 2018. The purpose of this MoU is to provide a co-operative framework between the CEE and the PSC with the view of sharing information, making referrals of complaints and improving compliance in the Public Service.
8

999
4.DISCRIMINATIONUNFAIR
IN THE WORKPLACE

10
4. CHAPTER II OF THE EEA: PROHIBITION OF UNFAIR DISCRIMINATION IN THE WORKPLACE
The Commission for Conciliation, Mediation and Arbitration (CCMA) is a Chapter 3A institution established by Section 112 of the Labour Relations Act, no 66 of 1995 (as amended), mandated to conciliate and arbitrate designated labour disputes within the framework of South African employment law.
The dispute resolution function of the CCMA has provided millions of employees with the access to resolve disputes. The CCMA’s dispute resolution role in the implementation of the Employment Equity Act has increased since 2014 and will continue to grow.
������_� � ��������� <����=����� �����J'����^�'�� ����'����<�����=�=� <����=��������^��������� ^���market. During 2018, the CCMA signed a Memorandum of Understanding with the Commission for Employment Equity for the purposes of information sharing and support in achieving common objectives.
CONSTITUTIONAL IMPERATIVE OF EMPLOYMENT EQUITY
South Africa is a country in transition from its painful past. The right to fully participate in our democracy still largely excludes the most vulnerable in our society, particularly black people, women and Persons with Disabilities. Over the past 20 years, the progress in this regard has been painfully slow.
Our Constitution is predicated upon the restoration of dignity, for that is the mischief the Constitution seeks to correct. It is our joint responsibility to express the purpose of our Constitution by applying the laws which express the rights of the Constitution for the ^������ ������������"
The preamble to the South African Constitution (the Constitution) encourages us to recognise the injustices of our past, to be united in our diversity, and to improve the quality of life of all citizens and free the potential of each person.
There can be no societal transformation without the understanding and application of the Constitution of South Africa, since it is the supreme law of the country.
The Constitution is expressed in South Africa’s employment law framework, in particular the Employment Equity Act 55 of 1998 (as amended), which provides for expression of Section 10 (the right to dignity) and Section 9 (the right to equality) of the Constitution.
&���=������������������� �����������������J��������� �����=��� �=����� �^��������������J���������J �=its expression through the employment law framework. This is at the heart of the recognition of identity, which is the cornerstone of intercultural cohesion and solidarity in the workplace, and equal participation in the South African economy.
PURPOSE AND APPLICATION OF THE EMPLOYMENT EQUITY ACT
In the context of the aims of the Constitution, the Employment Equity Act (EEA) seeks to achieve equity in the workplace through the ������������� ���������� �= � �� �� ��� �����������J �������� �������� ��=�������� ���J �= ���� �?� ����measures to redress disadvantages experienced by designated groups (black people, women, and people with disabilities).
While the general understanding of unfair dismissal is well entrenched in workplace operations, the approach to employment equity still lags behind. Employers are slow to implement workplace equity. Unfair Discrimination in the form of sexual harassment and unequal pay for work of equal value continue to be prevalent in the workplace.
However, progressive legislation will not on its own deliver the dignity and social justice required. What is required is a system of dispute resolution which matches the purpose of the EEA.

11
DISPUTE RESOLUTION JURISDICTION UNDER THE EMPLOYMENT EQUITY ACT
Unfair discrimination forms a barrier to advancement in the workplace, and the removal of those barriers is affected by speedy legal recourse to appropriate remedy.
Although the EEA came into effect in 1998, prior to the 2014 amendments to the EEA, the CCMA was only allowed to conciliate unfair discrimination disputes, which then had to be adjudicated through the lengthier process of the Labour Courts. The common result was that prior to 2014, relatively few unfair discrimination disputes that remained unresolved after conciliation progressed any further.
�'���������� ��=�������� ���=������'����^�����=������@Z]* ���=����'������ �� �������<����� �� ��� �=+�}� �� � �����=������J� ����� ��� ���������&>����?������]ZZ���� �Q������ ���� �=]]]�V�������� ����"��� ���=�=��=���Y��=�� ��������� �=������+�}� �� � ������������<�� ��=�������}� �� � ����� ��x��'������conduct of a sexual nature that violates the rights of an employee and constitutes a barrier to equity in the workplace…’
The 2014 amendments to the EEA strengthened the CCMA’s jurisdiction, whereby the CCMA was conferred with the exclusive jurisdiction to conciliate all unfair discrimination disputes, and to arbitrate all sexual harassment disputes and those unfair discrimination disputes referred by employees earning below the earnings threshold as determined by the Minister of Labour in terms of Section 6 of the Basic Conditions of Employment Act. Thus the most vulnerable were provided with better recourse to more expeditious dispute resolution in unfair discrimination disputes.
The increase in referrals received by the CCMA since the commencement of the 2014 amendments to the EEA bears testimony to the impact of the jurisdictional change. In the three years 2000-2002, 1071 unfair discrimination referrals were received by the CCMA. Since 2014, over 3 000 unfair discrimination referrals per year have been received, which totalled 1.8% of the CCMA annual case load.
CONSIDERATIONS FOR THE FUTURE
The area of employment equity and labour equality is ever evolving. There is still a long way to go for the removal of the barriers to economic advancement presented by unfair discrimination in South African workplaces.
The CCMA remains at the forefront of employment equity dispute resolution, seeking to play a catalyst role to engage in the realisation of employment equity for the designated groups, i.e. of black people, women and Persons with Disabilities in South Africa.
The CCMA welcomes and supports the proposed ILO Convention on sexual harassment against women and men in the workplace. The South African legislative framework is well aligned with the requirements expressed in the proposed Convention. It is hoped that such efforts will contribute to the eradication of unfair discrimination in the workplace towards an equitable society in which all may equally participate.
The CCMA salutes and congratulates the Commission for Employment Equity on its achievements to date and wishes it well in its important endeavours for the future. The CCMA will continue to support the CEE in our partnership agreement, expecting the partnership to bear good fruit in the years to come.

12

1313
5.REPRESENTATIONWORKFORCE

14
5. WORKFORCE REPRESENTATION
This section of the report covers the statistical representation of the national and regional demographics of the Economically Active ����� ��� ��_��J '���� �� ��� ���= �� �� [� ����� > ^��� ����� +��?�� �[>�+� ���=���= �= ��^�����= ^� + ����� +���Africa. The EAP includes people between the ages of 15 to 64 years who are either employed or unemployed, and who are seeking employment.
The EAP is used as a benchmark to assist employers in the analysis of their workforce to determine the degree of under-representation of the designated groups in the workforce. It also guides employers in the setting of numerical goals and targets for the achievement of an equitable and representative workforce. The EAP for Persons with Disabilities remains unavailable from Statistics South Africa, and as a result this sector is dependent on other avenues for the setting of benchmarks.
5.1 NATIONAL ECONOMICALLY ACTIVE POPULATION (EAP) BY POPULATION AND GENDER GROUP
TABLE 1: NATIONAL EAP BY POPULATION AND GENDER GROUP*
MALE FEMALE TOTAL
AM African Male 42.8% AF African Female 36.0% 78.8%
CM Coloured Male 5.2% CF Coloured Female 4.4% 9.6%
IM Indian Male 1.7% IF Indian Female 1.0% 2.6%
WM White Male 5.1% WF White Female 3.9% 9.0%
54.7% 45.3% 100.0%
(*Source: Statistics South Africa, (QLFS, Quarter 3 2018)

15
5.2 PROVINCIAL ECONOMICALLY ACTIVE (EAP) BY POPULATION AND GENDER GROUP
TABLE 2: PROVINCIAL EAP BY POPULATION AND GENDER GROUP*
PROVINCE GENDERPOPULATION GROUP
AFRICAN COLOURED INDIAN WHITE TOTAL
Eastern Cape
Male 41.8% 5.3% 0.6% 4.0% 51.7%
Female 40.3% 4.7% 0.3% 3.0% 48.3%
TOTAL 82.1% 10.0% 0.9% 7.0% 100.0%
Free State
Male 48.7% 1.2% 0.6% 3.0% 53.5%
Female 43.6% 1.1% 0.1% 1.6% 46.5%
TOTAL 92.3% 2.4% 0.7% 4.6% 100.0%
Gauteng
Male 45.2% 1.3% 1.8% 7.3% 55.6%
Female 35.8% 1.4% 1.2% 6.0% 44.4%
TOTAL 81.0% 2.7% 3% 13.4% 100.0%
KwaZulu-Natal
Male 44.4% 0.9% 5.3% 2.0% 52.7%
Female 41.9% 0.9% 3.3% 1.2% 47.3%
TOTAL 86.3% 1.9% 8.6% 3.3% 100.0%
Limpopo
Male 53.5% 0.3% 0.6% 1.7% 56.2%
Female 42.8% 0.3% 0.0% 0.7% 43.8%
TOTAL 96.3% 0.7% 0.5% 2.3% 100.0%
Mpumalanga
Male 50.3% 0.3% 0.2% 3.3% 54.4%
Female 43.2% 0.2% 0.7% 2.1% 45.6%
TOTAL 93.5% 0.5% 0.9% 5.4% 100.0%
North West
Male 54.2% 0.7% 0.6% 3.6% 59.0%
Female 37.7% 0.6% 0.0% 2.7% 41.0%
TOTAL 91.9% 1.3% 0.6% 6.3% 100.0%
Northern Cape
Male 27.8% 22.8% 0.6% 4.0% 51.7%
Female 21.1% 17.7% 0.3% 3.0% 48.3%
TOTAL 48.8% 40.6% 0.9% 7.0% 100.0%
Western Cape
Male 20.3% 25.2% 0.5% 8.2% 54.3%
Female 17.4% 21.2% 0.4% 6.8% 45.7%
TOTAL 37.7% 46.4% 0.9% 15.0% 100.0%
(*Source: Statistics South Africa, (QLFS, Quarter3 2018)

16

1717
6.OF EE REPORTSANALYSIS
RECEIVED IN 2018

18
6. ANALYSIS OF EMPLOYMENT EQUITY REPORTS RECEIVED IN 2018
This section of the report provides an analysis of the extent of reporting by employers for 2018 by Province, Sector and Business ����"&�����=�������� �������'��<�����������J'��<�������?���� �=�<����=�?�������^������ ��� ���?��J����� ��������J���=�� �==�� ^�������@Z]\"����������������=��'�� ���=� � ���������'��<���������������@Z]#�@Z]\^�occupational level in terms of population group, gender and disability.
(Please note that when reading this report any reference to an increase or decrease in percentage refers to the percentage point difference.)
6.1 REPORTING FOR 2018
During the 2018 employment equity reporting period, 27 485 employment equity reports were submitted by designated employers covering 7 415 876 employees. In the 2017 reporting period, 27 163 employment equity reports were submitted by designated employers covering 7 299 428 employees. This represented an increase of 320 reports (1.2%) and an increase of 116 447 employees (1.6%) as compared to the 2017 reporting period.
TABLE 3: TOTAL NUMBER OF REPORTS AND THE NUMBER OF EMPLOYEES COVERED BY PROVINCE
PROVINCE REPORTS RECEIVED % REPORTS RECEIVED EMPLOYEES % EMPLOYEES
Eastern Cape 1 426 5.2% 364 063 4.9%
Free State 728 2.6% 148 270 2.0%
Gauteng 12 090 44.0% 3 766 106 50.8%
KwaZulu-Natal 4 156 15.1% 950 274 12.8%
Limpopo 782 2.8% 266 824 3.6%
Mpumalanga 1 528 5.6% 369 911 5.0%
Northern Cape 673 2.4% 233 997 3.2%
North West 385 1.4% 89 006 1.2%
Western Cape 5 717 20.8% 1 227 425 16.6%
TOTAL 27 485 100.0% 7 415 876 100.0%
Table 3 shows that the majority of EE reports submitted in 2018 come from Gauteng, Western Cape and KwaZulu-Natal.

19
TABLE 4: TOTAL NUMBER OF REPORTS AND THE NUMBER OF EMPLOYEES COVERED BY SECTOR
SECTOR REPORTS RECEIVED % REPORTS RECEIVED EMPLOYEES % EMPLOYEES
Agriculture 3 684 13.4% 606 756 8.2%
Mining 779 2.8% 398 084 5.4%
Manufacturing 4 961 18.0% 900 180 12.1%
Electricity 426 1.5% 157 982 2.1%
Construction 2 688 9.8% 363 709 4.9%
Retail 2 185 7.9% 621 833 8.4%
Wholesale 3 622 13.2% 530 603 7.2%
Catering 1 605 5.8% 307 699 4.1%
Transport 1 874 6.8% 445 299 6.0%
Finance 3 164 11.5% 946 255 12.8%
Community 2 497 9.1% 2 137 476 28.8%
TOTAL 27 485 100.0% 7 415 876 100.0%
Table 4 indicates that the highest number of reports submitted were from the Manufacturing, Agriculture, Wholesale and Finance ������"�?���������� ~������������� ��������� ��� �����������J���������������� �=����=��+���=���*��the Act) is the largest employer amongst the sectors.
TABLE 5: TOTAL NUMBER OF REPORTS AND EMPLOYEES COVERED BY BUSINESS TYPE
BUSINESS TYPE REPORTS RECEIVED % REPORTS RECEIVED EMPLOYEES % EMPLOYEES
National Government 58 0.2% 418 286 5.6%
Provincial Government 133 0.5% 498 327 6.7%
Local Government 184 0.7% 191 167 2.6%
Private Sector 26 113 95.0% 5 445 848 73.4%
����������� ��� ���� 566 2.1% 179 914 2.4%
� ����������������� 133 0.5% 194 124 2.6%
Educational Institutions 298 1.1% 488 210 6.6%
TOTAL 27 485 100.0% 7 415 876 100.0%
Table 5 shows that the Private Sector accounted for the vast majority of the reports submitted.

20
6.2 ANALYSIS OF WORKFORCE PROFILE, WORKFORCE MOVEMENT AND SKILLS DEVELOPMENT BY OCCUPATIONAL LEVEL, PROVINCE, SECTOR AND BUSINESS TYPE AND BY POPULATION GROUP, GENDER AND DISABILITY
The analysis below is benchmarked against the National Economicaly Active Population:
NATIONAL EAP BY POPULATION AND GENDER GROUP*
MALE FEMALE TOTAL
AM African Male 42.8% AF African Female 36.0% 78.8%
CM Coloured Male 5.2% CF Coloured Female 4.4% 9.6%
IM Indian Male 1.7% IF Indian Female 1.0% 2.6%
WM White Male 5.1% WF White Female 3.9% 9.0%
TOTAL 54.7% TOTAL 45.3% 100.0%
6.2.1 WORKFORCE PROFILE AT THE TOP MANAGEMENT LEVEL BY POPULATION GROUP, GENDER AND DISABILITY
��������������'��<����������� � ����������?� ���=�� ��������������?�� =������������ ��� ���?��� �������=^�designated employers.
FIGURE 1: TOP MANAGEMENT BY POPULATION GROUP (ALL EMPLOYERS)
3.4%
15.1%
5.3%
9.7%
66.5%
Figure 1 shows that the representation of the African Population Group at the Top management level constitutes 15%, whilst this group constitutes 79% of their EAP.
AfricanColouredIndianWhiteForeign National

21
FIGURE 2: TOP MANAGEMENT BY GENDER (ALL EMPLOYERS)
0
20
40
60
80
Male Female
76.5%
23.5%
%
Figure 2 shows that Female representation at the Top Management level is approximately half their EAP.
FIGURE 3: TOP MANAGEMENT- GOVERNMENT AND PRIVATE SECTOR BY POPULATION GROUP1
GovernmentPrivate
0
10
20
30
40
50
60
70
80
11.8%
African Coloured Indian White Foreign National
76.0%
8.8%5.1% 6.0%
10.0%
69.6%
8.9%
0.3%3.5%
%
Figure 3 shows that in the Private Sector the representation of the White Population Group is nearly eight times their EAP and in the Government the representation is more aligned to their EAP. The Private Sector employs more Foreign Nationals than Government at this occupational level.
1 Government in this section of the report includes National Departments, Provincial Departments and Local government, excludes State-Owned Enterprises

22
FIGURE 4: TOP MANAGEMENT-GOVERNMENT AND PRIVATE SECTOR BY GENDER
GovernmentPrivate
0
10
20
30
40
50
60
70
80
Male Female
77.7%
67.0%
33.0%
22.3%
%
Figure 4 shows that the Top Management level is predominantly Male in both the Private and Government. Female representation is ����������� �����'��� ������_���^������������"
FIGURE 5: TOP MANAGEMENT- DISABILITY (ALL EMPLOYERS)
DisabledNot Disabled
1.3%
98.7%
Figure 5 shows that the representation of Persons with Disabilities at the Top Management Level remains negligible.
TABLE 6: WORKFORCE PROFILE AT THE TOP MANAGEMENT LEVEL BY POPULATION GROUP AND GENDER FOR PERSONS WITH DISABILITIES (ALL EMPLOYERS)
MALE FEMALE FOREIGN NATIONAL TOTAL
AFRICAN COLOURED INDIAN WHITE AFRICAN COLOURED INDIAN WHITE MALE FEMALE
10.2% 5.0% 12.3% 45.4% 4.6% 4.0% 5.0% 11.5% 1.5% 0.5% 100.0%
Table 6 shows that when Employers employ Persons with Disabilities it is mainly from the White Population Group.

23
TABLE 7: WORKFORCE PROFILE AT THE TOP MANAGEMENT LEVEL BY PROVINCE, POPULATION GROUP AND GENDER
PROVINCEMALE FEMALE FOREIGN
NATIONALTOTAL
AFRICAN COLOURED INDIAN WHITE AFRICAN COLOURED INDIAN WHITE MALE FEMALE
Eastern Cape 11.1% 4.1% 2.5% 58.9% 5.4% 2.6% 0.5% 12.6% 2.0% 0.2% 100%
Free State 17.3% 1.7% 0.9% 58.6% 7.9% 0.6% 0.6% 12.0% 0.2% 0.1% 100.0%
Gauteng 10.8% 2.0% 6.4% 52.1% 6.3% 1.3% 2.8% 13.6% 4.0% 0.7% 100.0%
KwaZulu-Natal 10.1% 1.6% 19.0% 44.9% 4.3% 0.7% 7.4% 9.7% 2.0% 0.3% 100.0%
Limpopo 17.7% 0.7% 4.6% 51.3% 8.8% 0.4% 1.0% 14.4% 1.0% 0.2% 100.0%
Mpumalanga 16.8% 1.2% 3.1% 55.6% 7.0% 0.7% 1.3% 12.8% 1.3% 0.1% 100.0%
Northern Cape 13.2% 9.8% 1.7% 56.3% 4.9% 3.8% 0.5% 8.6% 1.0% 0.2% 100.0%
North West 23.2% 0.9% 2.7% 50.6% 7.4% 0.3% 0.8% 12.9% 1.1% 0.2% 100.0%
Western Cape 3.1% 8.7% 2.5% 60.7% 1.3% 5.0% 1.3% 14.9% 2.1% 0.4% 100.0%
Table 7 above shows that the highest percentage of Top Management representation is from the White Population Group. The highest Foreign National representation is recorded in Gauteng, followed by Western Cape , KwaZulu-Natal and Eastern Cape respectively.
TABLE 8: WORKFORCE PROFILE AT THE TOP MANAGEMENT LEVEL BY SECTOR, POPULATION GROUP AND GENDER
SECTORMALE FEMALE FOREIGN
NATIONALTOTAL
AFRICAN COLOURED INDIAN WHITE AFRICAN COLOURED INDIAN WHITE MALE FEMALE
Agriculture 5.8% 2.7% 1.1% 72.0% 2.0% 1.9% 0.3% 13.3% 0.8% 0.1% 100.0%
Mining and Quarrying 20.5% 2.6% 2.5% 54.3% 7.1% 0.7% 1.2% 7.8% 3.0% 0.4% 100.0%
Manufacturing 5.8% 3.3% 9.3% 58.7% 3.0% 1.6% 2.8% 10.4% 4.5% 0.5% 100.0%
Electricity, Gas and Water 22.4% 4.8% 5.7% 38.4% 12.7% 2.3% 3.6% 6.1% 3.5% 0.4% 100.0%
Construction 13.8% 5.5% 5.9% 55.9% 5.3% 2.0% 2.5% 6.7% 2.2% 0.3% 100.0%
Retail and Motor Trade/Repair Service
4.7% 3.3% 8.9% 59.8% 2.0% 2.0% 2.8% 14.8% 1.4% 0.2% 100.0%
Wholesale Trade/Commercial Agents/Allied Services
4.7% 2.7% 10.7% 55.9% 2.8% 1.4% 3.7% 14.7% 2.8% 0.6% 100.0%
Catering/ Accommodation/other trade
8.9% 2.4% 4.5% 49.3% 5.6% 2.3% 2.4% 20.4% 3.6% 0.8% 100.0%
Transport/ Storage/ Communications
11.5% 3.4% 9.4% 46.7% 6.4% 2.4% 4.2% 11.0% 4.6% 0.4% 100.0%
Finance/Business Services 9.4% 2.7% 5.8% 50.3% 5.7% 2.3% 3.4% 16.2% 3.3% 0.9% 100.0%
Community/Social/Personal Services
21.7% 4.0% 5.1% 33.3% 11.5% 2.2% 3.1% 17.0% 1.4% 0.7% 100.0%
Table 8 shows that in all sectors of the economy the White Population Group representation is more than half their EAP and the African Population Group representation is less than a third of their EAP at this level. The representation of the Foreign National Population Group is recorded as being the highest in the Manufacturing and the Transport, Storage and Communication Sectors.
24
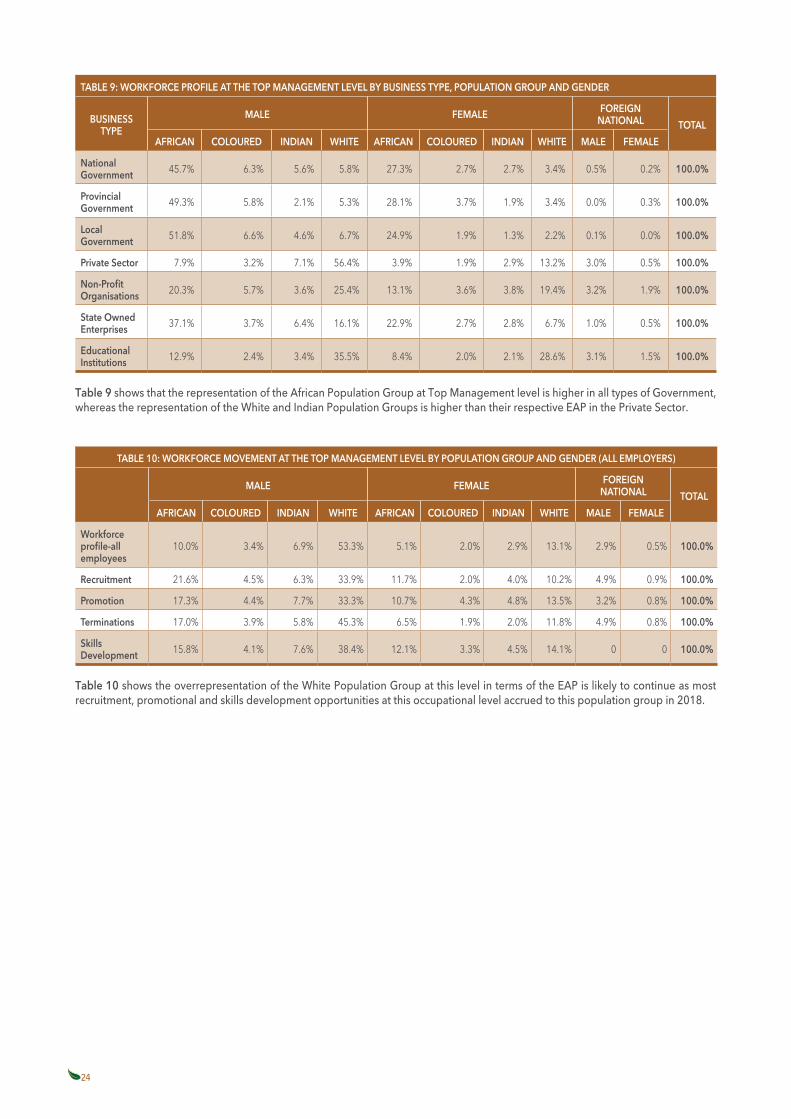
TABLE 9: WORKFORCE PROFILE AT THE TOP MANAGEMENT LEVEL BY BUSINESS TYPE, POPULATION GROUP AND GENDER
BUSINESS TYPE
MALE FEMALE FOREIGN NATIONAL TOTAL
AFRICAN COLOURED INDIAN WHITE AFRICAN COLOURED INDIAN WHITE MALE FEMALE
National Government 45.7% 6.3% 5.6% 5.8% 27.3% 2.7% 2.7% 3.4% 0.5% 0.2% 100.0%
Provincial Government 49.3% 5.8% 2.1% 5.3% 28.1% 3.7% 1.9% 3.4% 0.0% 0.3% 100.0%
Local Government 51.8% 6.6% 4.6% 6.7% 24.9% 1.9% 1.3% 2.2% 0.1% 0.0% 100.0%
Private Sector 7.9% 3.2% 7.1% 56.4% 3.9% 1.9% 2.9% 13.2% 3.0% 0.5% 100.0%
��������Organisations 20.3% 5.7% 3.6% 25.4% 13.1% 3.6% 3.8% 19.4% 3.2% 1.9% 100.0%
State Owned Enterprises 37.1% 3.7% 6.4% 16.1% 22.9% 2.7% 2.8% 6.7% 1.0% 0.5% 100.0%
Educational Institutions 12.9% 2.4% 3.4% 35.5% 8.4% 2.0% 2.1% 28.6% 3.1% 1.5% 100.0%
Table 9 shows that the representation of the African Population Group at Top Management level is higher in all types of Government, whereas the representation of the White and Indian Population Groups is higher than their respective EAP in the Private Sector.
TABLE 10: WORKFORCE MOVEMENT AT THE TOP MANAGEMENT LEVEL BY POPULATION GROUP AND GENDER (ALL EMPLOYERS)
MALE FEMALE FOREIGN NATIONAL TOTAL
AFRICAN COLOURED INDIAN WHITE AFRICAN COLOURED INDIAN WHITE MALE FEMALE
Workforce ����� ����employees
10.0% 3.4% 6.9% 53.3% 5.1% 2.0% 2.9% 13.1% 2.9% 0.5% 100.0%
Recruitment 21.6% 4.5% 6.3% 33.9% 11.7% 2.0% 4.0% 10.2% 4.9% 0.9% 100.0%
Promotion 17.3% 4.4% 7.7% 33.3% 10.7% 4.3% 4.8% 13.5% 3.2% 0.8% 100.0%
Terminations 17.0% 3.9% 5.8% 45.3% 6.5% 1.9% 2.0% 11.8% 4.9% 0.8% 100.0%
Skills Development 15.8% 4.1% 7.6% 38.4% 12.1% 3.3% 4.5% 14.1% 0 0 100.0%
Table 10 shows the overrepresentation of the White Population Group at this level in terms of the EAP is likely to continue as most recruitment, promotional and skills development opportunities at this occupational level accrued to this population group in 2018.

25
6.2.2 WORKFORCE PROFILE AT THE SENIOR MANAGEMENT LEVEL BY POPULATION GROUP, GENDER AND DISABILITY
FIGURE 6: SENIOR MANAGEMENT BY POPULATION GROUP (ALL EMPLOYERS)
3.3%
23.2%
8.0%
11.1%
54.4%
Figure 6 shows that the representation of the White Population Group is more than six times their EAP at this level.
FIGURE 7: SENIOR MANAGEMENT BY GENDER (ALL EMPLOYERS)
0
10
20
30
40
50
60
70
Male Female
65.5%
34.5%%
Figure 7 shows that the representation of Female Population Group is less than their EAP at the Senior Management level.
AfricanColouredIndianWhiteForeign National

26
FIGURE 8: SENIOR MANAGEMENT-GOVERNMENT AND PRIVATE SECTOR BY POPULATION GROUP
GovernmentPrivate
0
10
20
30
40
50
60
70
80
16.7%
African Coloured Indian White Foreign national
71.0%
7.6% 8.0% 6.7%11.8%
60.0%
13.9%
0.8%3.4%
%
Figure 8 shows that Government is the highest employer of the African Population Group and the Private Sector is the highest employer of the White Population Group at this occupational level. The Private Sector employs more Foreign Nationals than Government at this level.
FIGURE 9: SENIOR MANAGEMENT-GOVERNMENT AND PRIVATE SECTOR BY GENDER
Male Female
66.9%
60.8%
39.2%
33.1%%
0
10
20
30
40
50
60
70
GovernmentPrivate
Figure 9 shows that Senior Management level is predominantly Male in both the Private and Government. Female representation ��� ���������� �����'��� ������_���^��������"

27
FIGURE 10: SENIOR MANAGEMENT- DISABILITY (ALL EMPLOYERS)
DisabledNot Disabled
1.2%
98.8%
Figure 10 illustrates that the representation of Persons with Disabilities at the Senior Management level remains negligible.
TABLE 11: WORKFORCE PROFILE AT THE SENIOR MANAGEMENT LEVEL BY POPULATION GROUP AND GENDER FOR PERSONS WITH DISABILITIES (ALL EMPLOYERS)
MALE FEMALE FOREIGN NATIONALTOTAL
AFRICAN COLOURED INDIAN WHITE AFRICAN COLOURED INDIAN WHITE MALE FEMALE
11.2% 5.9% 8.8% 40.1% 6.5% 4.1% 4.7% 17.1% 1.2% 0.6% 100.0%
Table 11 indicates that Persons with Disabilities are mainly recruited from the White Population Group.
TABLE 12: WORKFORCE PROFILE AT THE SENIOR MANAGEMENT LEVEL BY PROVINCE, POPULATION GROUP AND GENDER
PROVINCEMALE FEMALE FOREIGN
NATIONAL TOTALAFRICAN COLOURED INDIAN WHITE AFRICAN COLOURED INDIAN WHITE MALE FEMALE
Eastern Cape 17.7% 6.5% 2.1% 40.2% 10.3% 3.1% 1.0% 17.1% 1.7% 0.3% 100.0%
Free State 22.4% 3.0% 1.3% 41.6% 11.3% 1.5% 0.6% 17.7% 0.6% 0.2% 100.0%
Gauteng 14.9% 3.2% 7.0% 36.6% 9.6% 2.2% 4.0% 18.4% 3.0% 1.0% 100.0%
KwaZulu-Natal 14.6% 2.5% 20.1% 27.7% 8.3% 1.8% 9.9% 13.2% 1.6% 0.3% 100.0%
Limpopo 34.4% 0.5% 1.8% 28.8% 18.2% 0.3% 0.9% 12.8% 1.9% 0.4% 100.0%
Mpumalanga 28.4% 1.2% 2.7% 38.2% 12.1% 0.5% 0.6% 14.5% 1.5% 0.3% 100.0%
Northern Cape 17.2% 10.9% 0.9% 40.2% 7.5% 5.8% 0.2% 16.1% 1.0% 0.1% 100.0%
North West 27.0% 1.5% 2.4% 37.6% 11.5% 1.1% 0.7% 15.5% 2.4% 0.2% 100.0%
Western Cape 5.4% 12.5% 3.2% 41.2% 3.0% 8.7% 2.1% 21.2% 2.0% 0.7% 100.0%
Table 12 shows that the highest percentage of Senior Management representation is from the White Population Group. The highest Foreign National representation is recorded in Gauteng, followed by Western Cape and North West respectively.

28
TABLE 13: WORKFORCE PROFILE AT THE SENIOR MANAGEMENT LEVEL BY SECTOR, POPULATION GROUP AND GENDER
SECTORMALE FEMALE FOREIGN
NATIONAL TOTALAFRICAN COLOURED INDIAN WHITE AFRICAN COLOURED INDIAN WHITE MALE FEMALE
Agriculture 9.1% 4.3% 1.5% 58.1% 3.5% 2.1% 0.8% 19.4% 1.1% 0.2% 100.0%
Mining and Quarrying 21.9% 2.5% 4.0% 51.6% 5.8% 0.8% 1.9% 8.8% 2.3% 0.4% 100.0%
Manufacturing 9.7% 5.8% 9.7% 44.7% 4.5% 2.9% 4.0% 15.4% 2.9% 0.5% 100.0%
Electricity, Gas and Water 31.1% 3.9% 5.6% 23.5% 19.9% 2.3% 2.9% 8.5% 2.0% 0.4% 100.0%
Construction 17.0% 6.3% 5.8% 46.2% 6.5% 2.1% 1.8% 11.3% 2.5% 0.5% 100.0%
Retail and Motor Trade/Repair Service 11.0% 6.4% 8.4% 38.2% 6.3% 4.8% 4.0% 19.3% 1.2% 0.4% 100.0%
Wholesale Trade/Commercial Agents/Allied Services
9.5% 4.4% 11.1% 37.7% 5.6% 3.7% 4.9% 20.2% 2.3% 0.6% 100.0%
Catering/Accommodation/other trade
14.2% 4.5% 4.0% 29.5% 11.2% 5.2% 2.8% 25.1% 2.5% 1.0% 100.0%
Transport/ Storage/ Communications 15.4% 4.9% 9.6% 33.9% 8.2% 2.9% 4.5% 15.6% 4.1% 0.9% 100.0%
Finance/Business Services 10.0% 3.7% 7.7% 35.0% 7.8% 3.4% 5.8% 22.0% 3.2% 1.4% 100.0%
Community/Social/Personal Services 28.0% 4.5% 4.0% 17.8% 18.9% 3.4% 3.3% 17.6% 1.6% 0.9% 100.0%
A high representation of the White Population Group is noted at this level across all sectors as shown in Table 13. In Electricity, Gas �=� ������� �'��� �������������J+��� � �=������ �+��?���� �=������ �=[� �����������J ��?�� ������� ����the African Population Group is noted across the gender groups.
TABLE 14: WORKFORCE PROFILE AT THE SENIOR MANAGEMENT LEVEL BY BUSINESS TYPE, POPULATION GROUP AND GENDER
BUSINESS TYPEMALE FEMALE FOREIGN
NATIONAL TOTALAFRICAN COLOURED INDIAN WHITE AFRICAN COLOURED INDIAN WHITE MALE FEMALE
National Government 39.2% 4.4% 4.5% 8.8% 29.6% 2.5% 3.4% 6.5% 0.6% 0.5% 100.0%
Provincial Government 44.2% 5.4% 2.9% 5.8% 31.1% 3.8% 2.5% 3.8% 0.5% 0.1% 100.0%
Local Government 46.6% 5.4% 4.3% 11.3% 24.4% 2.0% 1.6% 3.9% 0.3% 0.1% 100.0%
Private Sector 10.8% 4.7% 7.7% 41.0% 5.9% 3.2% 4.1% 19.1% 2.7% 0.8% 100.0%
��������Organisations 25.8% 5.4% 3.6% 16.6% 17.3% 5.0% 3.3% 18.6% 2.7% 1.7% 100.0%
State Owned Enterprises 32.7% 4.7% 7.5% 15.5% 23.1% 2.7% 3.8% 7.6% 1.7% 0.5% 100.0%
Educational Institutions 16.3% 3.1% 3.2% 23.4% 9.5% 2.7% 3.5% 32.2% 4.2% 1.8% 100.0%
Representation of the African Population Group and the Female Groups at Senior Management level is reasonable in Government, whereas the representation of the White and Indian Population Groups in the Private Sector is higher than their respective EAPs. The Educational Institutions have a relatively high representation of the Foreign National Population Group (6%) at this occupational level.

29
TABLE 15: WORKFORCE MOVEMENT AT THE SENIOR MANAGEMENT LEVEL BY POPULATION GROUP AND GENDER (ALL EMPLOYERS)
MALE FEMALE FOREIGN NATIONAL TOTAL
AFRICAN COLOURED INDIAN WHITE AFRICAN COLOURED INDIAN WHITE MALE FEMALE
�������� ����� �all employees 14.5% 4.7% 7.2% 36.6% 8.6% 3.2% 3.9% 17.9% 2.5% 0.8% 100.0%
Recruitment 17.1% 5.0% 6.9% 33.0% 10.8% 3.3% 4.3% 15.3% 3.3% 0.9% 100.0%
Promotion 19.0% 5.4% 7.8% 26.3% 11.6% 4.3% 5.7% 16.4% 2.5% 1.0% 100.0%
Terminations 14.7% 4.8% 6.3% 38.2% 8.4% 3.0% 3.7% 16.7% 3.1% 0.9% 100.0%
Skills Development 16.4% 8.6% 7.4% 25.8% 13.6% 7.7% 4.7% 15.9% 0 0 100.0%
Table 15 shows a dominant pattern of recruitment, promotion and skills development of the White Population Group at this level.
6.2.3 PROFESSIONALLY QUALIFIED LEVEL BY POPULATION GROUP, GENDER AND DISABILITY
FIGURE 11: PROFESSIONALLY QUALIFIED LEVEL BY POPULATION GROUP (ALL EMPLOYERS)
3.0%
40.2%
10.0%9.4%
37.4%
Figure 11 shows that the African Population Group (40,2%) at this level is higher compared to the representation at the Senior Management level. The representation of the White Population Group is approximately four times their EAP at this occupational level.
AfricanColouredIndianWhiteForeign National

30
FIGURE 12: PROFESSIONALLY QUALIFIED LEVEL BY GENDER (ALL EMPLOYERS)
0
10
20
30
40
50
60
Male Female
55.1%
44.9%
%
Figure 12 shows that more aligned representation of the designated groups to their EAP of both the Male and Female Population Y����� ������������ ���[� ����=��?��"
FIGURE 13: PROFESSIONALLY QUALIFIED LEVEL BY GOVERNMENT AND PRIVATE SECTOR AND POPULATION GROUP
0
10
20
30
40
50
60
70
29.0%
African Coloured Indian White Foreign national
65.2%
10.5% 10.7%
5.4%
11.4%
45.9%
17.3%
1.6% 3.0%
%
GovernmentPrivate
Figure 13 Government is aligned to the EAP of the various Population Groups and the White Population Group is highest in the Private Sector compared to the other Population Groups at this level.

31
FIGURE 14: PROFESSIONALLY QUALIFIED LEVEL BY GOVERNMENT AND PRIVATE SECTOR AND GENDER
0
10
20
30
40
50
60
Male Female
59.6%
47.0%
53.0%
40.4%
GovernmentPrivate
_������������ ���[� ����=��?��J��� �����Y�?������� ?����� ���=�����_�^� ����\$ ����'��� Figure 14. There is a higher representation of Males in the Private Sector.
FIGURE 15: PROFESSIONALLY QUALIFIED LEVEL – DISABILITY (ALL EMPLOYERS)
1.1%
98.9%
DisabledNot Disabled
Figure 15 shows that the representation of Persons with Disabilities at this level remains negligible.
TABLE 16: WORKFORCE PROFILE AT THE PROFESSIONALLY QUALIFIED LEVEL BY POPULATION GROUP AND GENDER FOR PERSONS WITH DISABILITIES (ALL EMPLOYERS)
MALE FEMALE FOREIGN NATIONALTOTAL
AFRICAN COLOURED INDIAN WHITE AFRICAN COLOURED INDIAN WHITE MALE FEMALE
16.4% 5.7% 5.7% 28.6% 14.1% 4.4% 4.2% 19.8% 0.8% 0.3% 100.0%
Table 16 shows a higher representation of Persons with Disabilities are from the White Population Group.

32
TABLE 17: WORKFORCE PROFILE AT THE PROFESSIONALLY QUALIFIED LEVEL BY PROVINCE, POPULATION GROUP AND GENDER
PROVINCEMALE FEMALE FOREIGN NATIONAL
TOTALAFRICAN COLOURED INDIAN WHITE AFRICAN COLOURED INDIAN WHITE MALE FEMALE
Eastern Cape 26.2% 6.1% 1.6% 16.9% 29.2% 4.4% 0.9% 11.8% 2.1% 0.8% 100.0%
Free State 28.7% 2.7% 0.4% 28.8% 17.4% 2.0% 0.3% 18.1% 1.3% 0.4% 100.0%
Gauteng 21.0% 4.0% 5.4% 23.3% 18.7% 3.5% 4.4% 16.5% 2.2% 0.9% 100.0%
KwaZulu-Natal 22.7% 2.3% 14.4% 13.6% 21.6% 2.1% 11.2% 9.8% 1.8% 0.6% 100.0%
Limpopo 39.2% 0.2% 0.4% 6.7% 46.5% 0.2% 0.3% 4.7% 1.3% 0.5% 100.0%
Mpumalanga 33.2% 0.6% 1.1% 19.7% 28.7% 0.6% 0.8% 11.2% 3.1% 0.9% 100.0%
Northern Cape 18.1% 15.8% 0.7% 18.4% 15.9% 13.7% 0.7% 14.4% 1.8% 0.6% 100.0%
North West 28.6% 1.2% 1.3% 22.1% 23.5% 1.3% 1.0% 16.3% 3.7% 1.1% 100.0%
Western Cape 8.9% 14.7% 2.7% 24.6% 8.4% 14.5% 2.3% 21.0% 2.0% 0.8% 100.0%
Table 17 shows that the African Population Group representation is higher in Limpopo (85.6%) and Mpumalanga (61,9%) respectively versus the highest representation of the White Population Group in the Western Cape (45.6%) compared to their respective EAPs.
TABLE 18: WORKFORCE PROFILE AT THE PROFESSIONALLY QUALIFIED LEVEL BY SECTOR, POPULATION GROUP AND GENDER
SECTORMALE FEMALE FOREIGN
NATIONAL TOTALAFRICAN COLOURED INDIAN WHITE AFRICAN COLOURED INDIAN WHITE MALE FEMALE
Agriculture 18.2% 5.7% 1.9% 37.7% 9.3% 3.2% 1.5% 20.6% 1.4% 0.4% 100.0%
Mining and Quarrying 29.3% 3.4% 2.3% 37.9% 11.6% 1.2% 1.5% 10.1% 2.2% 0.4% 100.0%
Manufacturing 16.1% 6.6% 8.6% 35.1% 8.5% 3.7% 4.3% 14.5% 2.1% 0.5% 100.0%
Electricity, Gas and Water 32.0% 4.9% 5.1% 19.5% 25.3% 2.4% 2.5% 6.6% 1.3% 0.3% 100.0%
Construction 25.8% 7.4% 4.6% 34.8% 9.6% 1.9% 1.9% 10.3% 3.3% 0.5% 100.0%
Retail and Motor Trade/Repair Service
17.7% 7.7% 7.0% 23.2% 13.7% 7.8% 4.6% 17.0% 0.8% 0.4% 100.0%
Wholesale Trade/Commercial Agents/Allied Services
15.4% 5.4% 7.3% 27.1% 11.2% 4.6% 5.3% 21.0% 2.1% 0.6% 100.0%
Catering/Accommodation/other trade
19.4% 5.3% 3.8% 18.0% 19.3% 6.9% 3.1% 19.5% 3.1% 1.5% 100.0%
Transport/ Storage/ Communications
22.9% 6.0% 7.5% 26.9% 12.8% 3.3% 4.0% 12.8% 3.1% 0.8% 100.0%
Finance/Business Services 15.2% 5.2% 6.9% 22.5% 14.9% 5.9% 6.5% 19.4% 2.4% 1.1% 100.0%
Community/Social/Personal Services
25.4% 4.0% 2.6% 9.7% 32.2% 5.1% 3.4% 14.5% 2.0% 1.0% 100.0%
Table 18 shows that the highest percentage of the African Population Group is found in Community, Social and Personal Services as well as the Electricity, Gas and Water Supply Sector at this level. A relatively high representation (4,6%) of the Foreign National Population Group is recorded in the Catering, Accommodation and Other Trade Sector.

33
TABLE 19: WORKFORCE PROFILE AT THE PROFESSIONALLY QUALIFIED LEVEL BY BUSINESS TYPE, POPULATION GROUP AND GENDER
BUSINESS TYPEMALE FEMALE FOREIGN
NATIONAL TOTALAFRICAN COLOURED INDIAN WHITE AFRICAN COLOURED INDIAN WHITE MALE FEMALE
National Government 34.5% 4.6% 2.6% 11.4% 31.9% 3.6% 2.0% 8.2% 0.8% 0.4% 100.0%
Provincial Government 26.3% 3.9% 2.3% 5.7% 38.2% 7.4% 3.8% 10.1% 1.5% 0.7% 100.0%
Local Government 36.8% 8.9% 2.6% 11.7% 28.0% 4.9% 1.5% 5.3% 0.2% 0.1% 100.0%
Private Sector 17.0% 5.9% 6.5% 28.0% 12.0% 4.9% 4.8% 17.9% 2.3% 0.8% 100.0%
��������Organisations 23.9% 7.7% 2.2% 12.1% 25.4% 6.7% 2.8% 15.9% 1.9% 1.4% 100.0%
State Owned Enterprises 31.9% 4.4% 5.2% 18.4% 25.3% 2.9% 3.0% 7.0% 1.4% 0.5% 100.0%
Educational Institutions 21.2% 2.2% 3.0% 11.0% 30.4% 2.5% 3.5% 20.2% 4.1% 2.0% 100.0%
Table 19 shows that the representation of the White and Indian Population Groups is higher than their respective EAP in the Private Sector at this level. The percentage representation of the African Population Group is higher than 60% in all Government (national, provincial and local) .
TABLE 20: WORKFORCE PROFILE AND MOVEMENT AT THE PROFESSIONALLY QUALIFIED LEVEL BY POPULATION GROUP AND GENDER (ALL EMPLOYERS)
MALE FEMALE FOREIGN NATIONAL TOTAL
AFRICAN COLOURED INDIAN WHITE AFRICAN COLOURED INDIAN WHITE MALE FEMALE
Workforce ����� ����employees
20.9% 5.2% 5.2% 21.6% 19.3% 4.8% 4.2% 15.8% 2.2% 0.8% 100.0%
Recruitment 21.3% 4.9% 5.4% 21.8% 18.4% 4.2% 4.6% 14.8% 3.3% 1.2% 100.0%
Promotion 25.5% 5.4% 5.5% 14.5% 23.4% 5.6% 5.6% 11.6% 1.9% 0.9% 100.0%
Terminations 20.4% 4.8% 4.9% 23.5% 20.0% 3.7% 3.8% 15.0% 2.8% 1.1% 100.0%
Skills Development 27.9% 4.7% 4.2% 12.0% 30.4% 6.2% 3.7% 10.8% 0 0 100.0%
Table 20���'�� ��_���� ������ ���Y���� ����� ��^������ ����������������!�"K$�J���������*\"�$� �=�<����development (58.3%) opportunities as compared to the other Population Groups.

34
6.2.4 SKILLED, TECHNICAL AND ACADEMICALLY QUALIFIED/JUNIOR MANAGEMENT/SUPERVISORS/FOREMEN/SUPERINTENDENTS LEVEL BY POPULATION GROUP, GENDER AND DISABILITY
FIGURE 16: SKILLED LEVEL BY POPULATION GROUP (ALL EMPLOYERS)
AfricanColouredIndianWhiteForeign National
1.6%
63.3%
11.2%
5.4%
18.5%
Figure 16 shows that at this occupational level, the representation of the African Population Group totals 63.3% .
FIGURE 17: SKILLED LEVEL BY GENDER (ALL EMPLOYERS)
46
47
48
49
50
51
52
Male Female
51.9%
48.1%
%
Figure 17 shows that at the Skilled Technical Level, Females are slightly higher (48.1%) than their National EAP (45.3%).

35
FIGURE 18: SKILLED LEVEL BY GOVERNMENT AND PRIVATE SECTOR AND POPULATION GROUP
GovernmentPrivate
0
10
20
30
40
50
60
70
80
54.3%
African Coloured Indian White Foreign national
77.5%
9.3%13.0%
2.7%6.9%
23.5%
10.1%
0.5% 2.3%
%
Figure 18 Illustrates a higher representation of the African Population Group in Government when compared to the Private Sector at the Skilled level.
FIGURE 19: SKILLED LEVEL BY GOVERNMENT AND PRIVATE SECTOR AND GENDER
GovernmentPrivate
0
10
20
30
40
50
60
Male Female
59.8%
44.1%
55.9%
40.2%
%
Figure 19 shows that Government employs more Females when compared to the Private Sector at the Skilled level.

36
FIGURE 20: SKILLED LEVEL - DISABILITY (ALL EMPLOYERS)
DisabledNot Disabled
1.1%
98.9%
Figure 20 shows that the representation of Persons with Disabilities at the Skilled level remains negligible.
���������� ��� ���� ���������������������������������������������������� ������������� ��� ��� ����������������������������������� ��
���� ������ FOREIGN NATIONALTOTAL
AFRICAN COLOURED INDIAN WHITE AFRICAN COLOURED INDIAN WHITE ���� ������
29.1% 6.1% 3.3% 17.3% 22.5% 5.2% 2.6% 13.2% 0.5% 0.2% 100.0%
Table 21 indicates that slightly more than half of Persons with Disabilities are from the African Population Group.
TABLE 22: WORKFORCE PROFILE AT THE SKILLED TECHNICAL LEVEL BY PROVINCE, POPULATION GROUP AND GENDER
PROVINCE MALE FEMALE FOREIGN
NATIONAL TOTAL
AFRICAN COLOURED INDIAN WHITE AFRICAN COLOURED INDIAN WHITE MALE FEMALE
Eastern Cape 25.3% 6.1% 0.4% 6.6% 48.1% 5.9% 0.4% 6.4% 0.7% 0.2% 100.0%
Free State 33.4% 1.7% 0.2% 11.3% 37.4% 1.7% 0.2% 13.1% 0.8% 0.2% 100.0%
Gauteng 36.6% 4.5% 2.6% 11.5% 26.5% 4.2% 2.5% 9.9% 1.2% 0.4% 100.0%
KwaZulu-Natal 30.5% 1.8% 8.6% 4.0% 39.5% 2.0% 8.3% 4.2% 0.8% 0.2% 100.0%
Limpopo 38.3% 0.2% 0.1% 2.6% 54.5% 0.1% 0.1% 2.6% 1.4% 0.3% 100.0%
Mpumalanga 41.1% 0.6% 0.3% 8.9% 39.8% 0.4% 0.3% 6.6% 1.8% 0.1% 100.0%
Northern Cape 22.0% 15.0% 0.2% 8.7% 22.8% 20.4% 0.1% 9.0% 1.3% 0.5% 100.0%
North West 34.3% 0.8% 0.2% 10.2% 41.8% 0.9% 0.3% 9.4% 1.9% 0.2% 100.0%
Western Cape 16.7% 19.7% 1.5% 10.5% 15.5% 19.2% 1.7% 13.0% 1.6% 0.7% 100.0%
Table 22 indicates that other than in the Northern and Western Cape, the African Population Group (Male and Female) represents more than 60% of the total workforce at this level.

37
TABLE 23: WORKFORCE PROFILE AT THE SKILLED TECHNICAL LEVEL BY SECTOR, POPULATION GROUP AND GENDER
SECTOR MALE FEMALE FOREIGN NATIONAL TOTAL
AFRICAN COLOURED INDIAN WHITE AFRICAN COLOURED INDIAN WHITE MALE FEMALE
Agriculture 34.3% 11.8% 1.3% 15.5% 15.4% 6.5% 1.0% 11.9% 1.9% 0.3% 100.0%
Mining and Quarrying 50.4% 3.9% 0.6% 22.5% 11.8% 1.0% 0.4% 5.1% 4.2% 0.1% 100.0%
Manufacturing 33.7% 10.0% 5.9% 18.5% 12.5% 5.2% 3.0% 9.0% 1.9% 0.3% 100.0%
Electricity, Gas and Water 44.6% 4.6% 1.9% 11.4% 28.2% 2.4% 1.3% 4.7% 0.6% 0.1% 100.0%
Construction 50.0% 7.9% 2.5% 14.3% 12.0% 2.4% 1.4% 6.7% 2.6% 0.2% 100.0%
Retail and Motor Trade/Repair Service
27.7% 7.2% 4.6% 12.0% 24.9% 9.4% 3.5% 9.6% 0.8% 0.3% 100.0%
Wholesale Trade/Commercial Agents/Allied Services
27.9% 6.1% 4.9% 14.0% 19.1% 6.9% 4.7% 14.2% 1.7% 0.5% 100.0%
Catering/Accommodation/other trade
27.9% 4.6% 1.9% 6.2% 35.5% 8.1% 2.5% 9.0% 2.7% 1.7% 100.0%
Transport/ Storage/ Communications
38.6% 7.6% 4.7% 14.0% 18.5% 4.3% 2.6% 7.6% 1.8% 0.3% 100.0%
Finance/Business Services 22.1% 5.8% 3.8% 9.3% 28.9% 9.6% 5.1% 13.8% 1.0% 0.6% 100.0%
Community/Social/Personal Services
31.9% 3.6% 1.2% 3.7% 44.5% 4.6% 2.1% 7.6% 0.5% 0.3% 100.0%
���?������ �� � ������= ^� � ���� � �� �������� ���J �� ������ �= [� ��� �= �� ������� � �= Y � +����� ���' ����noticeable representation of women i.e. 18.4% and 36.7% respectively. Female representation at this level is higher than their EAP in the Financial sector (58%) and Catering (56%) and in the Community/Social and Personal Services remains mainly dominated by Female representation at 51.9% as shown in Table 23.
� ������_������= ���������� =����������������������������� ��� ���*"*$������'�=^������� �=[� �������*"!$�ath this level.
TABLE 24: WORKFORCE PROFILE AT THE SKILLED TECHNICAL LEVEL BY BUSINESS TYPE, POPULATION GROUP AND GENDER
BUSINESS TYPES
MALE FEMALE FOREIGN NATIONAL TOTAL
AFRICAN COLOURED INDIAN WHITE AFRICAN COLOURED INDIAN WHITE MALE FEMALE
National Government 42.8% 6.5% 1.7% 7.2% 30.4% 4.3% 1.0% 6.1% 0.0% 0.0% 100.0%
Provincial Government 26.3% 1.8% 0.6% 1.5% 56.7% 4.6% 1.5% 6.2% 0.5% 0.3% 100.0%
Local Government 35.9% 11.9% 4.0% 6.5% 29.3% 6.8% 1.8% 3.7% 0.1% 0.0% 100.0%
Private Sector 34.4% 6.8% 3.8% 13.0% 19.9% 6.2% 3.2% 10.4% 1.8% 0.5% 100.0%
��������Organisations 25.7% 10.2% 1.1% 6.2% 30.3% 14.1% 1.5% 10.0% 0.4% 0.4% 100.0%
State Owned Enterprises 40.7% 5.0% 2.2% 12.5% 30.4% 3.1% 1.4% 4.4% 0.2% 0.1% 100.0%
Educational Institutions 21.8% 1.3% 1.2% 2.6% 57.3% 2.8% 3.2% 8.6% 0.7% 0.5% 100.0%
Table 24���'� ������������ �?��_������� ��+<����=��?�� ����� �������������������=����� �=������"& ������'�that the highest employer of Foreign Nationals is the Private Sector, followed by Educational Institutions.

38
TABLE 25: WORKFORCE MOVEMENT AT THE SKILLED TECHNICAL LEVEL BY POPULATION GROUP AND GENDER (ALL EMPLOYERS)
MALE FEMALE FOREIGN NATIONAL TOTAL
AFRICAN COLOURED INDIAN WHITE AFRICAN COLOURED INDIAN WHITE MALE FEMALE
Workforce ����� ����employees
32.7% 5.7% 2.8% 9.6% 30.6% 5.5% 2.7% 8.9% 1.2% 0.4% 100.0%
Recruitment 22.1% 3.9% 1.7% 6.6% 16.8% 3.3% 1.5% 42.8% 1.0% 0.3% 100.0%
Promotion 35.6% 5.8% 2.8% 5.7% 33.9% 6.1% 2.9% 5.7% 1.1% 0.4% 100.0%
Terminations 34.7% 6.7% 3.0% 12.5% 22.6% 5.5% 2.4% 10.0% 2.0% 0.5% 100.0%
Skills Development 35.5% 6.7% 3.3% 8.9% 27.3% 6.3% 3.2% 8.8% 100.0%
Table 25 shows that the White Females dominated recruitment at this level.
6.2.5 SEMI-SKILLED LEVEL BY POPULATION GROUP, GENDER AND DISABILITY
FIGURE 21: SEMI-SKILLED LEVEL BY POPULATION GROUP (ALL EMPLOYERS)
2.3%
75.5%
12.0%
2.8%5.5%
AfricanColouredIndianWhiteForeign National
Figure 21 shows a high representation of the African Population Group at Skilled level and the White Population Group representation is lower than their EAP.
FIGURE 22: SEMI-SKILLED LEVEL BY GENDER (ALL EMPLOYERS)
0
10
20
30
40
50
60
Male Female
56.1%
43.9%
%
Figure 22 shows that the Female representation more closely resembles their EAP at the Semi-skilled occupational level.

39
FIGURE 23: SEMI-SKILLED LEVEL BY GOVERNMENT AND PRIVATE SECTOR AND POPULATION GROUP
0
20
40
60
80
100
76.3%
African Coloured Indian White Foreign National
84.0%
11.5% 11.9%
1.7% 3.1% 5.8%2.7% 0.1% 2.8%
%
GovernmentPrivate
The African and Coloured Population Group representation exceeds their EAP at this level in Government whereas the Coloured Population Group exceed their EAP in both the Government and Private Sector. The White and Indian Population Groups are under-represented in relation to their EAP in both the Government and Private Sectors at this level.
FIGURE 24: SEMI-SKILLED LEVEL BY GOVERNMENT, PRIVATE SECTOR AND GENDER
GovernmentPrivate
0
10
20
30
40
50
60
Male Female
59.1%
45.8%
54.2%
40.9%
%
Figure 24 shows a positive Female representation in Government and a slightly lower representation in the Private Sector at the Semi-Skilled Level. The representation of Males in the Private Sector surpassed their EAP at this level.

40
FIGURE 25: SEMI-SKILLED LEVEL – DISABILITY (ALL EMPLOYERS)
0.9%
99.1%
DisabledNot Disabled
Figure 25 shows that Persons with Disabilities remain relatively low at the Semi-skilled level.
TABLE 26: WORKFORCE PROFILE AT THE SEMI-SKILLED LEVEL BY RACE AND GENDER FOR PERSONS WITH DISABILITIES (ALL EMPLOYERS)
MALE FEMALE FOREIGN NATIONALTOTAL
AFRICAN COLOURED INDIAN WHITE AFRICAN COLOURED INDIAN WHITE MALE FEMALE
39.4% 6.8% 2.2% 5.3% 29.9% 6.6% 1.9% 6.3% 1.5% 0.1% 100.0%
Table 26 shows that the majority of Persons with Disabilities are from the African Population Group at the Semi- skilled level.
TABLE 27: WORKFORCE PROFILE AT THE SEMI-SKILLED LEVEL BY PROVINCE, POPULATION GROUP AND GENDER
PROVINCE MALE FEMALE FOREIGN
NATIONAL TOTALAFRICAN COLOURED INDIAN WHITE AFRICAN COLOURED INDIAN WHITE MALE FEMALE
Eastern Cape 41.7% 9.3% 0.2% 2.5% 35.8% 6.6% 0.2% 3.0% 0.6% 0.1% 100.0%
Free State 53.9% 2.5% 0.1% 4.3% 25.7% 2.1% 0.1% 6.2% 4.9% 0.2% 100.0%
Gauteng 50.2% 3.5% 1.1% 2.7% 31.9% 3.7% 1.1% 3.5% 1.8% 0.3% 100.0%
KwaZulu-Natal 44.7% 1.7% 5.1% 0.9% 38.0% 2.1% 5.0% 1.6% 0.7% 0.1% 100.0%
Limpopo 50.1% 0.3% 0.1% 0.9% 43.4% 0.2% 0.0% 1.0% 3.8% 0.2% 100.0%
Mpumalanga 61.0% 0.5% 0.1% 2.1% 31.0% 0.4% 0.1% 2.2% 2.5% 0.1% 100.0%
Northern Cape 40.7% 17.8% 0.1% 2.3% 21.1% 14.2% 0.1% 2.7% 0.9% 0.2% 100.0%
North West 55.5% 0.7% 0.1% 2.2% 26.1% 0.8% 0.1% 2.9% 11.6% 0.1% 100.0%
Western Cape 23.8% 16.3% 0.6% 2.1% 31.4% 19.3% 0.8% 3.8% 1.4% 0.5% 100.0%
Table 27 indicates a high representation of the African Population Group across all provinces at this occupational level.

41
TABLE 28: WORKFORCE PROFILE AT THE SEMI-SKILLED LEVEL BY SECTOR, POPULATION GROUP AND GENDER
SECTORMALE FEMALE FOREIGN
NATIONAL TOTALAFRICAN COLOURED INDIAN WHITE AFRICAN COLOURED INDIAN WHITE MALE FEMALE
Agriculture 50.3% 14.4% 0.4% 2.2% 18.6% 7.3% 0.3% 3.2% 2.8% 0.5% 100.0%
Mining and Quarrying 71.0% 2.2% 0.1% 1.5% 10.2% 0.6% 0.1% 0.9% 13.4% 0.1% 100.0%
Manufacturing 51.9% 9.3% 2.6% 3.9% 19.5% 6.7% 1.6% 2.7% 1.5% 0.2% 100.0%
Electricity, Gas and Water 58.9% 5.4% 0.8% 3.1% 24.9% 2.3% 0.7% 3.4% 0.4% 0.1% 100.0%
Construction 71.2% 5.7% 0.7% 2.7% 12.7% 1.7% 0.5% 2.4% 2.3% 0.1% 100.0%
Retail and Motor Trade/Repair Service 27.9% 4.7% 1.4% 2.2% 48.8% 10.1% 1.5% 2.5% 0.6% 0.3% 100.0%
Wholesale Trade/Commercial Agents/Allied Services
41.6% 5.3% 1.8% 2.9% 33.2% 6.3% 2.3% 4.3% 1.6% 0.6% 100.0%
Catering/Accommodation/other trade
34.1% 3.0% 0.6% 1.2% 49.1% 5.2% 0.8% 2.0% 2.7% 1.4% 100.0%
Transport/ Storage/ Communications 54.9% 6.9% 2.3% 3.3% 22.4% 3.5% 1.6% 3.1% 1.8% 0.2% 100.0%
Finance/Business Services 36.2% 5.2% 2.2% 2.4% 35.8% 8.7% 3.3% 5.3% 0.5% 0.4% 100.0%
Community/Social/Personal Services
40.2% 4.3% 0.8% 1.2% 42.2% 6.4% 1.1% 3.5% 0.2% 0.1% 100.0%
The African Population Group is highly represented across all sectors at this occupational level.
TABLE 29: WORKFORCE PROFILE AT THE SEMI-SKILLED LEVEL BY BUSINESS TYPE, POPULATION GROUP AND GENDER
BUSINESS TYPEMALE FEMALE FOREIGN
NATIONAL TOTALAFRICAN COLOURED INDIAN WHITE AFRICAN COLOURED INDIAN WHITE MALE FEMALE
National Government 42.6% 4.8% 0.7% 0.9% 43.6% 4.8% 0.7% 1.9% 0.1% 0.0% 100.0%
Provincial Government 30.0% 3.5% 0.5% 0.4% 57.1% 6.1% 0.7% 1.6% 0.1% 0.1% 100.0%
Local Government 44.2% 12.3% 2.2% 1.8% 28.6% 7.6% 1.3% 2.1% 0.0% 0.0% 100.0%
Private Sector 46.8% 5.8% 1.5% 2.5% 29.6% 6.1% 1.6% 3.2% 2.5% 0.4% 100.0%
��������Organisations 27.6% 8.0% 0.5% 2.1% 34.2% 18.4% 0.8% 7.9% 0.3% 0.3% 100.0%
State Owned Enterprises 54.4% 5.8% 0.9% 3.0% 29.5% 3.3% 0.6% 2.3% 0.0% 0.1% 100.0%
Educational Institutions 30.3% 2.1% 0.5% 1.5% 55.4% 3.9% 1.0% 4.8% 0.3% 0.3% 100.0%
There is a high representation of the Female Population Group in Provincial Government and Educational Institutions a high representation African Males is noted at the Semi-skilled level mostly in State Owned Enterprises (54.4%) and the Private Sector (46.8%).

42
TABLE 30: WORKFORCE MOVEMENT AT THE SEMI-SKILLED LEVEL BY POPULATION GROUP AND GENDER (ALL EMPLOYERS)
MALE FEMALE FOREIGN NATIONALTOTAL
AFRICAN COLOURED INDIAN WHITE AFRICAN COLOURED INDIAN WHITE MALE FEMALE
Workforce ����� ����employees
44.8% 5.7% 1.4% 2.3% 32.7% 6.3% 1.4% 3.2% 2.0% 0.3% 100.0%
Recruitment 44.3% 6.0% 1.5% 2.9% 31.3% 7.5% 1.5% 3.2% 1.3% 0.4% 100.0%
Promotion 43.4% 5.4% 1.2% 1.5% 39.3% 5.2% 0.9% 1.3% 1.7% 0.2% 100.0%
Terminations 45.7% 6.3% 1.7% 3.0% 28.7% 7.4% 1.5% 3.5% 1.9% 0.4% 100.0%
Skills Development 45.9% 6.0% 1.7% 2.1% 33.2% 6.6% 1.7% 2.7% 0 0 100.0%
Table 30 shows that the recruitment, promotion and skills development of the African Population Group, is aligned to their EAP.
6.2.6 UNSKILLED LEVEL BY POPULATION GROUP, GENDER AND DISABILITY
FIGURE 26: UNSKILLED LEVEL BY POPULATION GROUP (ALL EMPLOYERS)
AfricanColouredIndianWhiteForeign National
3.5%
83.7%
11.0%
0.8%1.1%
Figure 26 shows that both African and Coloured Population Groups are higher than their respective EAPs and the White and Indian Population Groups representation remains less than their EAP.

43
FIGURE 27: UNSKILLED LEVEL BY GENDER (ALL EMPLOYERS)
0
10
20
30
40
50
60
Male Female
57.4%
42.7%
%
Figure 27 ���'�� ���������� �������� ������������ �����'��� ������_� �����<����=����� ��� ���?��"
FIGURE 28: UNSKILLED LEVEL BY GOVERNMENT AND PRIVATE SECTOR AND POPULATION GROUP
GovernmentPrivate
0
10
20
30
40
50
60
70
80
9083.2%
African Coloured Indian White Foreign National
87.0%
11.4% 10.8%
0.7% 0.8% 1.1%0.9% 0.0% 4.1%
%
Figure 28 shows that the African and Coloured Population Groups are over represented in Government and in the Private Sector at the Unskilled level in terms of their EAP.

44
FIGURE 29: UNSKILLED LEVEL BY GOVERNMENT AND PRIVATE SECTOR AND GENDER
GovernmentPrivate
0
10
20
30
40
50
60
Male Female
59.2%56.4%
43.6%40.8%
%
Figure 29 illustrates that Males are over-represented in both the Private and Government.
FIGURE 30: UNSKILLED LEVEL – DISABILITY (ALL EMPLOYERS)
DisabledNot Disabled
1.1%
98.9%
Figure 30 shows that the representation of Persons with Disabilities remains very low at the Unskilled level.
TABLE 31: WORKFORCE PROFILE AT THE UNSKILLED LEVEL BY POPULATION GROUP AND GENDER FOR PERSONS WITH DISABILITIES (ALL)
MALE FEMALE FOREIGN NATIONALTOTAL
AFRICAN COLOURED INDIAN WHITE AFRICAN COLOURED INDIAN WHITE MALE FEMALE
44.7% 6.4% 1.2% 2.6% 35.7% 5.2% 0.5% 1.1% 2.5% 0.2% 100.0%
The majority of Persons with Disabilities employed at this level is from the African Population Group as shown in Table 31.

45
TABLE 32: WORKFORCE PROFILE AT THE UNSKILLED LEVEL BY PROVINCE, POPULATION GROUP AND GENDER
PROVINCE MALE FEMALE FOREIGN NATIONAL
TOTALAFRICAN COLOURED INDIAN WHITE AFRICAN COLOURED INDIAN WHITE MALE FEMALE
Eastern Cape 43.1% 8.3% 0.1% 0.6% 39.2% 7.3% 0.0% 0.3% 0.8% 0.3% 100.0%
Free State 58.3% 2.3% 0.0% 1.4% 32.8% 1.5% 0.0% 0.7% 2.6% 0.3% 100.0%
Gauteng 54.1% 2.6% 0.4% 0.9% 35.4% 2.4% 0.2% 0.4% 2.8% 0.7% 100.0%
KwaZulu-Natal 51.4% 1.4% 2.0% 0.4% 40.8% 1.1% 1.3% 0.3% 1.1% 0.2% 100.0%
Limpopo 45.0% 0.5% 0.0% 0.3% 39.8% 0.2% 0.0% 0.1% 10.3% 3.7% 100.0%
Mpumalanga 54.4% 0.5% 0.0% 0.6% 39.1% 0.4% 0.0% 0.2% 3.7% 1.0% 100.0%
Northern Cape 46.5% 21.7% 0.1% 0.9% 17.4% 11.5% 0.0% 0.4% 1.1% 0.6% 100.0%
North West 60.3% 0.6% 0.0% 0.6% 30.3% 0.5% 0.0% 0.4% 6.7% 0.5% 100.0%
Western Cape 31.4% 17.3% 0.2% 0.7% 30.5% 16.7% 0.2% 0.4% 1.9% 0.8% 100.0%
Table 32 above, shows the African Population Group as the highest representative group across all provinces at the Unskilled level (compared to the National and Regional EAP).
TABLE 33: WORKFORCE PROFILE AT THE UNSKILLED LEVEL BY SECTOR, POPULATION GROUP AND GENDER
SECTORMALE FEMALE FOREIGN
NATIONAL TOTALAFRICAN COLOURED INDIAN WHITE AFRICAN COLOURED INDIAN WHITE MALE FEMALE
Agriculture 42.2% 8.4% 0.0% 0.2% 34.0% 8.1% 0.0% 0.1% 5.1% 1.8% 100.0%
Mining and Quarrying 69.7% 0.7% 0.0% 0.6% 15.6% 0.2% 0.0% 0.1% 12.1% 1.0% 100.0%
Manufacturing 53.6% 7.2% 1.1% 1.1% 28.1% 6.3% 0.6% 0.3% 1.4% 0.3% 100.0%
Electricity, Gas and Water 65.3% 4.6% 0.6% 1.4% 25.7% 1.5% 0.1% 0.2% 0.6% 0.0% 100.0%
Construction 68.7% 5.8% 0.2% 0.6% 20.3% 1.1% 0.1% 0.2% 2.8% 0.2% 100.0%
Retail and Motor Trade/Repair Service 39.1% 5.2% 0.7% 0.9% 44.5% 7.0% 0.5% 0.5% 1.1% 0.5% 100.0%
Wholesale Trade/Commercial Agents/Allied Services
44.9% 5.6% 0.9% 1.0% 38.7% 4.9% 0.8% 0.6% 1.8% 0.7% 100.0%
Catering/Accommodation/other trade
30.8% 3.1% 0.1% 0.5% 55.0% 6.8% 0.1% 0.4% 2.0% 1.2% 100.0%
Transport/ Storage/ Communications 63.4% 6.4% 0.9% 1.1% 23.5% 2.2% 0.2% 0.4% 1.4% 0.5% 100.0%
Finance/Business Services 45.6% 4.1% 0.5% 0.5% 42.4% 4.6% 0.3% 0.4% 1.0% 0.7% 100.0%
Community/Social/Personal Services
42.5% 6.2% 0.4% 0.7% 43.8% 5.1% 0.3% 0.6% 0.3% 0.1% 100.0%
Table 33���'�� _���� �� ��� �������?������������=�������� �=[� ������J����������J���������JY � �=� �� �=Transport, Storage and Communication, Finance, Business Services and Wholesale and Retail sectors in relation to their EAP. African Females representation is higher in the Accommodation and other Trade, Retail and Motor Trade, Repair Service sectors in relation to their EAP and Male counterparts.

4646
TABLE 34: WORKFORCE PROFILE AT THE UNSKILLED LEVEL BY BUSINESS TYPE, POPULATION GROUP AND GENDER
BUSINESS TYPE
MALE FEMALE FOREIGN NATIONAL TOTAL
AFRICAN COLOURED INDIAN WHITE AFRICAN COLOURED INDIAN WHITE MALE FEMALE
National Government 42.6% 4.0% 0.4% 0.6% 48.3% 3.8% 0.1% 0.2% 0.0% 0.0% 100.0%
Provincial Government 41.4% 3.5% 0.2% 0.6% 50.3% 3.4% 0.2% 0.5% 0.0% 0.0% 100.0%
Local Government 53.7% 11.6% 0.7% 0.6% 28.9% 4.1% 0.2% 0.2% 0.0% 0.0% 100.0%
Private Sector 49.2% 5.5% 0.5% 0.7% 34.0% 5.3% 0.3% 0.3% 3.2% 0.8% 100.0%
��������Organisations 33.9% 11.3% 0.1% 0.7% 39.9% 12.5% 0.1% 1.1% 0.2% 0.2% 100.0%
State Owned Enterprises 59.1% 5.5% 0.1% 0.5% 32.5% 2.1% 0.1% 0.1% 0.0% 0.0% 100.0%
Educational Institutions 34.6% 1.4% 0.3% 0.5% 58.5% 3.1% 0.3% 0.8% 0.4% 0.2% 100.0%
Table 34 shows that the representation of African Males at State Owned Enterprises is higher than their EAP. The Private Sector employs a relatively high percentage (4%) of Foreign Nationals at this level.
TABLE 35: WORKFORCE MOVEMENT AT THE UNSKILLED LEVEL BY POPULATION GROUP AND GENDER (ALL)
MALE FEMALE FOREIGN NATIONAL TOTAL
AFRICAN COLOURED INDIAN WHITE AFRICAN COLOURED INDIAN WHITE MALE FEMALE
�������� ����� �all employees 48,4% 5,7% 0,5% 0,7% 35,3% 5,3% 0,3% 0,4% 2,8% 0,7% 100.0%
Recruitment 47,8% 6,9% 0,5% 0,9% 34,7% 6,1% 0,3% 0,5% 1,8% 0,5% 100.0%
Promotion 48,5% 5,2% 0,6% 1,0% 37,9% 3,7% 0,3% 0,5% 1,8% 0,6% 100.0%
Terminations 50,0% 7,0% 0,5% 0,9% 31,3% 6,5% 0,3% 0,5% 2,4% 0,5% 100.0%
Skills Development 55,5% 4,9% 0,5% 0,8% 33,2% 4,3% 0,4% 0,3% 0 0 100.0%
Table 35 shows that the representation of African Population Group, particularly Males, are mostly recruited, promoted and given Skills Development opportunities at the Unskilled level.

47474747
7.ANALYSIS OFTRENDS
WORKFORCE PROFILE

48
7. TRENDS ANALYSIS OF WORKFORCE PROFILE BY OCCUPATIONAL LEVEL, POPULATION GROUP, GENDER AND DISABILITY BETWEEN 2016 AND 2018
TABLE 1: NATIONAL EAP BY POPULATION GROUP AND GENDER*
MALE FEMALE TOTAL
AM African Male 42.8% AF African Female 36.0% 78.8%
CM Coloured Male 5.2% CF Coloured Female 4.4% 9.6%
IM Indian Male 1.7% IF Indian Female 1.0% 2.6%
WM White Male 5.1% WF White Female 3.9% 9.0%
TOTAL 54.7% TOTAL 45.3% 100.0%
(*Source: Statistics South Africa, (QLFS, Quarter3 2018)
7.1 WORKFORCE PROFILE TRENDS AT THE TOP MANAGEMENT LEVEL BY POPULATION GROUP, GENDER AND DISABILITY BETWEEN 2016 AND 2018
FIGURE 31: TOP MANAGEMENT BY POPULATION GROUP BETWEEN 2016 AND 2018
0
10
20
30
40
50
60
70
14.3%15.1%
African Coloured Indian White Foreign National
14.4%
4.9%5.0%
5.3%8.9%
9.4%9.7%
68.5% 67.7%66.5%
3.4% 3.4%3.4%
%
Figure 31 indicates that the representation of the White and Indian Population Groups remained dominant between 2016 and 2018. Little movement in the representation of both African and Coloured Population Groups at Top Management level is noted. The Foreign National Population Group representation remains unchanged for the same period.
201620172018

49
FIGURE 32: TOP MANAGEMENT BY GENDER BETWEEN 2016 AND 2018
78.0%
2016 2017 2018
22.0%
77.1%
22.9%
76.5%
23.5%
0
20
40
60
80
% MaleFemale
Figure 32 shows that there is a slight increase in Female representation at the Top Management level.
FIGURE 33: TOP MANAGEMENT BY DISABILITY BETWEEN 2016 AND 2018
DisabledNot Disabled
0
20
40
60
80
100
1.2%
2016 2017 2018
98.8%
1.3%
98.7%
1.3%
98.7%
%
Figure 33: The representation of Persons with Disabilities at the Top Management level remains unchanged.

50
7.2 WORKFORCE PROFILE TRENDS AT THE SENIOR MANAGEMENT LEVEL BY POPULATION GROUP, GENDER AND DISABILITY BETWEEN 2016 AND 2018
FIGURE 34: SENIOR MANAGEMENT LEVEL BY POPULATION GROUP BETWEEN 2016 AND 2018
0
10
20
30
40
50
60
22.1%23.2%
African Coloured Indian White Foreign National
21.7%
7.6%7.7%
8.0%10.5%
10.9%11.1%
57.2% 56.1%54.5%
3.0% 3.3%3.2%
%
Figure 34������ ���������� �������������� �����^����_���� � �=�������=����� ���Y�����"����������� �����the White, Indian and Foreign National Population Groups remains dominant at this level.
FIGURE 35: SENIOR MANAGEMENT BY GENDER BETWEEN 2016 AND 2018
0
10
20
30
40
50
60
70 66.7%
2016 2017 2018
33.3%
66.2%
33.8%
65.5%
34.5%%
Figure 35 shows that there is a slight improvement in the representation of Females at the Senior Management level between 2016 and 2018.
201620172018
MaleFemale

51
FIGURE 36: SENIOR MANAGEMENT BY DISABILITY BETWEEN 2016 AND 2018
DisabledNot Disabled
0
20
40
60
80
100
1.1%
2016 2017 2018
98.9%
1.3%
98.7%
1.2%
98.8%
%
Figure 36: The representation of Persons with Disabilities at this level remains at around 1% at Senior Management level over the past three years.
7.3 WORKFORCE PROFILE TRENDS AT THE PROFESSIONALLY QUALIFIED LEVEL BY POPULATION GROUP, GENDER AND DISABILITY BETWEEN 2016 AND 2018
FIGURE 37: PROFESSIONALLY QUALIFIED LEVEL BY POPULATION GROUP BETWEEN 2016 AND 2018
0
5
10
15
20
25
30
35
40
45 41.5%
40.2%
African Coloured Indian White Foreign National
41.5%
9.7%9.7%
10.0%8.5%
8.5%9.4%
37.5%37.5%
37.4%
2.8% 3.0%2.8%
%
Figure 37��=�� �� ]"!$=���� �������������� �������_���� ������ ���Y���� ������������ ���[� ����=��?������2016 to 2018. However, a slight increase in the representation of the Coloured, Indian and Foreign National Population Groups is noted at this level.
201620172018

52
FIGURE 38: PROFESSIONALLY QUALIFIED BY GENDER BETWEEN 2016 AND 2018
0
10
20
30
40
50
6054.4%
2016 2017 2018
45.6%
53.4%
46.6%
55.1%
44.9%
%
Figure 38 shows a noticeable decrease of 1.7% in the representation of Females between 2017 and 2018.
FIGURE 39: PROFESSIONALLY QUALIFIED BY DISABILITY BETWEEN 2016 AND 2018
0
20
40
60
80
100
0.9%
2016 2017 2018
99.1%
1.3%
98.7%
1.1%
98.9%
%
DisabledNot Disabled
Figure 39 ���'�� �������� ������������'��V�� ^������ ������������ ���[� ����=��?����� ���= ]$^�'���@Z]#and 2018.
MaleFemale

53
7.4 WORKFORCE PROFILE TRENDS AT THE SKILLED LEVEL BY POPULATION GROUP, GENDER AND DISABILITY BETWEEN 2016 AND 2018
FIGURE 40: SKILLED LEVEL BY POPULATION GROUP BETWEEN 2016 AND 2018
0
10
20
30
40
50
60
70 60.2%63.3%
African Coloured Indian White Foreign National
60.2%
11.5%11.5%
11.2%5.8%
5.8%5.4%
20.8%22.8%
18.5%
1.8% 1.8%1.8%
%
Figure 40 ������ ���������?������?���������������� �������_���� ������ ���Y���� ��+<����=��?��^�'���@Z]#and 2018.
FIGURE 41: SKILLED LEVEL BY GENDER BETWEEN 2016 AND 2018
42
44
46
48
50
52
5454.0%
2016 2017 2018
46.0%
52.9%
47.1%
51.9%
48.1%%
Figure 41 shows a positive progress in the representation of Females at the Skilled level between 2016 and 2018.
201620172018
MaleFemale

54
FIGURE 42: SKILLED LEVEL BY DISABILITY BETWEEN 2016 AND 2018
DisabledNot Disabled
0
20
40
60
80
100
0.9%
2016 2017 2018
99.1%
1.2%
98.8%
1.1%
98.9%
%
Figure 42: The disability representation at this level remained at around 1% at Skilled level between 2016 and 2018.
7.5 WORKFORCE PROFILE TRENDS AT THE SEMI-SKILLED LEVEL BY POPULATION GROUP, GENDER AND DISABILITY BETWEEN 2016 AND 2018
FIGURE 43: SEMI-SKILLED LEVEL BY POPULATION GROUP BETWEEN 2016 AND 2018
0
10
20
30
40
50
60
70
8076.1%
77.5%
African Coloured Indian White Foreign National
76.1%
12.2%12.3%
12.0%
3.0%3.1%
2.8%6.2%
6.2%5.5%
2.2% 2.3%2.3%
%
Figure 43 indicates that the various population groups seem to be reasonably represented at this level, whereas the representation of the White Population Group at this occupational level is below the EAP.
201620172018

FIGURE 44: SEMI-SKILLED LEVEL BY GENDER BETWEEN 2016 AND 2018
0
10
20
30
40
50
6053.9%
2016 2017 2018
46.1%
56.5%
43.5%
56.1%
43.9%
%
Figure 44: The representation of Females has slightly increased from the reduction in 2017 at the Semi-skilled Level.
FIGURE 45: SEMI-SKILLED LEVEL BY DISABILITY BETWEEN 2016 AND 2018
DisabledNot Disabled
0
20
40
60
80
100
0.8%
2016 2017 2018
99.2%
0.9%
99.1%
0.9%
99.1%
%
Figure 45 shows that the representation of Persons with Disabilities remained below 1% over the three-year period between 2016 and 2018 at the Semi-Skilled level.
MaleFemale

56
7.6 WORKFORCE PROFILE TRENDS AT THE UNSKILLED LEVEL BY POPULATION GROUP, GENDER AND DISABILITY BETWEEN 2016 AND 2018
FIGURE 46: UNSKILLED LEVEL BY POPULATION GROUP BETWEEN 2016 AND 2018
0
10
20
30
40
50
60
70
80
9083.2%
83.7%
African Coloured Indian White Foreign National
83.3%
11.4%11.4%
11.0%
0.8%0.8%
0.8% 1.2%1.1%
1.2% 3.5% 3.5%3.4%
%
Figure 46������� ������ �=&�=� ������ ���Y����� �����������=������������=����� �������_� �����<����=level. It also shows that the Foreign National Population Group is being highly represented at this occupational level between 2016 and 2018.
FIGURE 47: UNSKILLED LEVEL BY GENDER BETWEEN 2016 AND 2018
0
10
20
30
40
50
6054.8%
2016 2017 2018
45.2%
59.1%
40.9%
58.1%
41.9%
%
Figure 47 ���'� � �� �������� ��� �� ��� ��� �� ���<����= ��?�� ������� ����� ��= �� @Z]\ ���� ��= � �� ������� �reduction noticed between 2016 and 2017 at this level.
201620172018
MaleFemale

57
FIGURE 48: UNSKILLED LEVEL BY DISABILITY BETWEEN 2016 AND 2018
DisabledNot Disabled
0
20
40
60
80
100
0.8%
2016 2017 2018
99.2%
1.0%
99.0%
1.1%
98.9%
%
Figure 48 indicates that the representation of Persons with Disabilities remained around 1% at the Unskilled level for the past three years.
7.7 TRENDS FOR THE REPRESENTATION OF PERSONS WITH DISABILITIES BETWEEN 2016 AND 2018 (ALL EMPLOYERS)
TABLE 36: TRENDS FOR THE REPRESENTATION OF PERSONS WITH DISABILITIES BETWEEN 2016-2018
2016 2017 2018
0.8% 1% 1%
Table 36������� ���������� ������������'��V�� ^������� ���� ���= ]$

5858

595959
8.OBSERVATIONS CONCLUDING
AND REMARKS

60
8. CONCLUDING OBSERVATIONS AND REMARKS
An improved and equitable representation of women is noted at the Skilled Technical/ junior management level to Professionally [� ����=� ��==�� � � ����� ��������" ��'�?��J ���� � ��� �� �� ^���� � ��� �= ��� �������� � ����������� �=meaningful gains for women to enable them to access opportunities at the Top and Senior Management levels.
& �� ��� � ���� �� = � ����� ������= �� ��� ����� � �� �������� ��� �� ��� ���J �� � ����� � �� ��� �= +�����Management levels requires drastic measures or interventions, which will enable this group to break the glass ceiling from the ���������� ���[� ����=���==��� � �������?�������'������������������� ��� ��������� ^���� �<�"
It is noticeable from the trend analysis on the representation of Persons with Disabilities over the past three years that little progress is being made in increasing the representation of Persons with Disabilities in the workforce across all occupational levels. Therefore, the CEE urges all designated employers to prioritise increasing the representation of Persons with Disabilities in their workplaces across all occupational levels.
The high representation of the Foreign National Population Group, particularly at the lower occupation levels remains a serious �������"[����������=�̂ � �<�= ��'��������� ^���� '���?���������� ��� �� =��� ������������=��+���_���� J������ ����� ������'�� ������������������ ����}������@K$"���~����� ��������������������������� �������very little or no skill at all need to be assessed given the high rate of unemployed South African locals seeking for work.
The implementation of the principle of Equal Pay For Work of Equal Value is not only a moral issue, but a human rights issue, which requires a will and commitment from decision- makers in the workplace to put in place policies and implementation strategies geared towards addressing the persisting pay inequalities experienced by the majority of employees in our country.
The elimination of violence and harassment in the world of work as a form of discrimination has become an international issue. Therefore, the CEE urges all South Africans to work together to ensure that we develop policies and strategies aimed at adequately addressing the scourge of violence and harassment in all spheres of the society being it in the workplace, schools and in our communities.
60

616161
9. REFERENCES

62
9. REFERENCES
1. Mboweni, T. (1997). Employment Equity Bill. Government Publication
2. Employment Equity Regulation (2014)
3. Department of Labour (2016). 16th Commission for Employment Equity Annual Report 2015-2016. Pretoria
4. Department of Labour (2017). 17th Commission for Employment Equity Annual Report 2016-2017. Pretoria
5. Department of Labour (2018). 18th Commission for Employment Equity Annual Report 2017-2018. Pretoria
6. South Africa (2013). Employment Equity Amendment Act. No. 47. Government Printer. Pretoria.
K" + �����+���_���� �@Z]\�"[� �����> ^��������+��?��"[� ���!"������ "
8. Employment Equity Act. 1998, as amended
9. General Administrative Regulations. 2014
62

636363
10.APPENDIX

64
10. APPENDIX
A. WORKFORCE PROFILE AND MOVEMENT FOR ALL EMPLOYEES IN TERMS OF POPULATION GROUP, GENDER AND DISABILITY FOR 2018
WORKFORCE PROFILE FOR ALL EMPLOYEES
MALE FEMALE FOREIGN NATIONALTOTALA C I W A C I W MALE FEMALE
Top Management6 067 2 053 4 193 32 441 3 095 1 189 1 738 7 989 1 755 312 60 832
10.0% 3.4% 6.9% 53.3% 5.1% 2.0% 2.9% 13.1% 2.9% 0.5% 100.0%
Senior Management
21 620 7 054 10 712 54 392 12 838 4 795 5 870 26 659 3 702 1 164 148 806
14.5% 4.7% 7.2% 36.6% 8.6% 3.2% 3.9% 17.9% 2.5% 0.8% 100.0%
Professionally �� �����
124 916 31 343 31 174 129 206 115 288 28 565 25 066 94 197 12 914 5 061 597 730
20.9% 5.2% 5.2% 21.6% 19.3% 4.8% 4.2% 15.8% 2.2% 0.8% 100.0%
Skilled 647 057 112 061 54 484 189 254 605 369 108 876 52 725 176 308 24 170 7 722 1 978 026
32.7% 5.7% 2.8% 9.6% 30.6% 5.5% 2.7% 8.9% 1.2% 0.4% 100.0%
Semi-skilled1 132 847 144 573 34 902 57 474 826 089 158 150 36 088 80 892 49 867 7 762 2 528 644
44.8% 5.7% 1.4% 2.3% 32.7% 6.3% 1.4% 3.2% 2.0% 0.3% 100.0%
Unskilled636 058 75 446 6 568 9 431 464 280 69 059 3 962 4 625 36 287 9 565 1 315 281
48.4% 5.7% 0.5% 0.7% 35.3% 5.3% 0.3% 0.4% 2.8% 0.7% 100.0%
TOTAL PERMANENT
2 568 565 372 530 142 033 472 198 2 026 959 370 634 125 449 390 670 128 695 31 586 6 629 319
38.7% 5.6% 2.1% 7.1% 30.6% 5.6% 1.9% 5.9% 1.9% 0.5% 100.0%
Temporary employees
295 704 37 069 5 382 16 933 338 397 43 734 5 444 16 823 18 237 8 834 786 557
37.6% 4.7% 0.7% 2.2% 43.0% 5.6% 0.7% 2.1% 2.3% 1.1% 100.0%
GRAND TOTAL 2 864 269 409 599 147 415 489 131 2 365 356 414 368 130 893 407 493 146 932 40 420 7 415 876
64

65
WORKFORCE PROFILE FOR PERSONS WITH DISABILITIES
MALE FEMALE FOREIGN NATIONALTOTALA C I W A C I W MALE FEMALE
Top Management84 41 101 372 38 33 41 94 12 4 820
10.2% 5.0% 12.3% 45.4% 4.6% 4.0% 5.0% 11.5% 1.5% 0.5% 100.0%
Senior Management201 107 158 722 117 73 84 308 21 10 1801
11.2% 5.9% 8.8% 40.1% 6.5% 4.1% 4.7% 17.1% 1.2% 0.6% 100.0%
���������� ����� �����1118 387 391 1 949 962 298 288 1 347 55 23 6 818
16.4% 5.7% 5.7% 28.6% 14.1% 4.4% 4.2% 19.8% 0.8% 0.3% 100.0%
Skilled 6 263 1 314 706 3 727 4 847 1 128 565 2848 101 47 21 546
29.1% 6.1% 3.3% 17.3% 22.5% 5.2% 2.6% 13.2% 0.5% 0.2% 100.0%
Semi-skilled 9 273 1 592 511 1 238 7 036 1 563 456 1 478 341 21 23 509
39.4% 6.8% 2.2% 5.3% 29.9% 6.6% 1.9% 6.3% 1.5% 0.1% 100.0%
Unskilled 6 383 920 166 373 5 098 741 78 151 352 27 14 289
44.7% 6.4% 1.2% 2.6% 35.7% 5.2% 0.5% 1.1% 2.5% 0.2% 100.0%
TOTAL PERMANENT23 322 4 361 2 033 8 381 18 098 3 836 1 512 6 226 882 132 68 783
33.9% 6.3% 3.0% 12.2% 26.3% 5.6% 2.2% 9.1% 1.3% 0.2% 100.0%
Temporary employees3 087 346 84 111 3 636 337 71 79 49 25 7 825
39.5% 4.4% 1.1% 1.4% 46.5% 4.3% 0.9% 1.0% 0.6% 0.3% 100.0%
GRAND TOTAL 26 409 4 707 2 117 8 492 21 734 4 173 1 583 6 305 931 157 76 608
RECRUITMENT FOR ALL EMPLOYEES BY POPULATION GROUP AND GENDER
MALE FEMALE FOREIGN NATIONAL
TOTALA C I W A C I W MALE FEMALE
Top Management915 189 267 1 434 495 86 168 431 206 39 4 230
21.6% 4.5% 6.3% 33.9% 11.7% 2.0% 4.0% 10.2% 4.9% 0.9% 100.0%
Senior Management2 663 784 1 073 5 150 1686 519 672 2 392 517 144 15 600
17.1% 5.0% 6.9% 33.0% 10.8% 3.3% 4.3% 15.3% 3.3% 0.9% 100.0%
���������� ����� �����14 697 3 390 3 747 15 063 12 696 2 929 3 168 10 224 2 271 833 69 018
21.3% 4.9% 5.4% 21.8% 18.4% 4.2% 4.6% 14.8% 3.3% 1.2% 100.0%
Skilled 96 004 17 008 7 508 28 839 72 788 14 200 6 644 185 783 4 344 1 426 434 544
22.1% 3.9% 1.7% 6.6% 16.8% 3.3% 1.5% 42.8% 1.0% 0.3% 100.0%
Semi-skilled 238 582 32 471 8 312 15 774 168 779 40 232 8 167 17 259 7 140 2 032 538 748
44.3% 6.0% 1.5% 2.9% 31.3% 7.5% 1.5% 3.2% 1.3% 0.4% 100.0%
Unskilled 194 600 27 930 2 034 3 747 141 045 24 932 1 151 2 034 7 352 1 900 406 725
47.8% 6.9% 0.5% 0.9% 34.7% 6.1% 0.3% 0.5% 1.8% 0.5% 100.0%
TOTAL PERMANENT547 461 81 772 22 941 70 007 397 489 82 898 19 970 218 123 21 830 6 374 1 468 865
37.3% 5.6% 1.6% 4.8% 27.1% 5.6% 1.4% 14.8% 1.5% 0.4% 100.0%
Temporary employees287 840 41 996 5 077 13 578 286 772 47 025 4 411 13 942 14 866 8 242 723 749
39.8% 5.8% 0.7% 1.9% 39.6% 6.5% 0.6% 1.9% 2.1% 1.1% 100.0%
GRAND TOTAL 835 301 123 768 28 018 83 585 684 261 129 923 24 381 232 065 36 696 14 616 2 192 614

66
PROMOTION FOR ALL EMPLOYEES BY POPULATION GROUP AND GENDER
MALE FEMALE FOREIGN NATIONAL
TOTALA C I W A C I W MALE FEMALE
Top Management428 109 192 825 264 107 118 335 79 21 2 478
17.3% 4.4% 7.7% 33.3% 10.7% 4.3% 4.8% 13.5% 3.2% 0.8% 100.0%
Senior Management2 069 592 843 855 1 256 467 620 1 782 275 110 10 869
19.0% 5.4% 7.8% 26.3% 11.6% 4.3% 5.7% 16.4% 2.5% 1.0% 100.0%
���������� ����� �����11 740 2 477 2 532 6 686 10 757 2 599 2 575 5 351 889 401 46 007
25.5% 5.4% 5.5% 14.5% 23.4% 5.6% 5.6% 11.6% 1.9% 0.9% 100.0%
Skilled 40 802 6 653 3 158 6 568 38 814 6 997 3 367 6 568 1 205 458 114 590
35.6% 5.8% 2.8% 5.7% 33.9% 6.1% 2.9% 5.7% 1.1% 0.4% 100.0%
Semi-skilled 44 046 5474 1 170 1 532 39 894 5 253 958 1 329 1 687 238 101 581
43.4% 5.4% 1.2% 1.5% 39.3% 5.2% 0.9% 1.3% 1.7% 0.2% 100.0%
Unskilled 6 299 676 76 133 4 933 477 38 59 235 73 12 999
48.5% 5.2% 0.6% 1.0% 37.9% 3.7% 0.3% 0.5% 1.8% 0.6% 100.0%
��������������105 384 15 981 7 971 18 599 95 918 15 900 7 676 15 424 4 370 1 301 288 524
36.5% 5.5% 2.8% 6.4% 33.2% 5.5% 2.7% 5.3% 1.5% 0.5% 100.0%
Temporary employees7 949 690 427 522 3 437 691 147 465 261 144 14 733
54.0% 4.7% 2.9% 3.5% 23.3% 4.7% 1.0% 3.2% 1.8% 1.0% 100.0%
GRAND TOTAL 113 333 16 671 8 398 19 121 99 355 16 591 7 823 15 889 4 631 1 445 303 257
SKILLS DEVELOPMENT FOR ALL EMPLOYEES BY POPULATION GROUP AND GENDER
MALE FEMALETOTALA C I W A C I W
Top Management16 743 465 734 4 362 929 294 402 1 565 25 494
65.7% 1.8% 2.9% 17.1% 3.6% 1.2% 1.6% 6.1% 100.0%
Senior Management57 607 2 609 24 274 46 289 56 160 2 489 2 297 7 958 199 683
28.8% 1.3% 12.2% 23.2% 28.1% 1.2% 1.2% 4.0% 100.0%
���������� ����� �����108 319 12 313 10 861 92 289 51 902 13 892 9 543 30 817 329 936
32.8% 3.7% 3.3% 28.0% 15.7% 4.2% 2.9% 9.3% 100.0%
Skilled 420 976 41 319 21 898 53 871 297 968 46 904 20 590 61 768 965 294
43.6% 4.3% 2.3% 5.6% 30.9% 4.9% 2.1% 6.4% 100.0%
Semi-skilled 338 737 40 947 12 243 15 491 244 304 44 871 13 683 22 742 733 018
46.2% 5.6% 1.7% 2.1% 33.3% 6.1% 1.9% 3.1% 100.0%
Unskilled 133 535 16 451 1 840 2 769 84 451 13 944 1 292 1 114 255 396
52.3% 6.4% 0.7% 1.1% 33.1% 5.5% 0.5% 0.4% 100.0%
TOTAL PERMANENT1 075 917 114 104 71 850 215 071 735 714 122 394 47 807 125 964 2 508 821
42.9% 4.5% 2.9% 8.6% 29.3% 4.9% 1.9% 5.0% 100.0%
Temporary employees48 308 6 653 1 317 2 382 491 55 8 780 1 499 2 173 120 267
40.2% 5.5% 1.1% 2.0% 40.9% 7.3% 1.2% 1.8% 100.0%
GRAND TOTAL 1 124 225 120 757 73 167 217 453 784 869 131 174 49 306 128 137 2 629 088

67
B. WORKFORCE PROFILE FOR ALL EMPLOYEES IN TERMS OF PROVINCE, POPULATION GROUP, GENDER AND DISABILITY
EASTERN CAPE
WORKFORCE PROFILE FOR ALL EMPLOYEES
MALE FEMALE FOREIGN NATIONALTOTALA C I W A C I W MALE FEMALE
Top Management283 104 64 1 503 138 67 14 322 50 6 2 551
11.1% 4.1% 2.5% 58.9% 5.4% 2.6% 0.5% 12.6% 2.0% 0.2% 100.0%
Senior Management915 335 107 2 077 532 161 53 884 88 15 5 167
17.7% 6.5% 2.1% 40.2% 10.3% 3.1% 1.0% 17.1% 1.7% 0.3% 100.0%
���������� ����� �����6 450 1 495 382 4 151 7 186 1 088 217 2902 506 196 24 573
26.2% 6.1% 1.6% 16.9% 29.2% 4.4% 0.9% 11.8% 2.1% 0.8% 100.0%
Skilled 28 581 6 885 425 7 495 54 334 6 624 418 7 246 780 256 113 044
25.3% 6.1% 0.4% 6.6% 48.1% 5.9% 0.4% 6.4% 0.7% 0.2% 100.0%
Semi-skilled 43 651 9 694 178 2 648 37 489 6 957 190 3124 595 111 104 637
41.7% 9.3% 0.2% 2.5% 35.8% 6.6% 0.2% 3.0% 0.6% 0.1% 100.0%
Unskilled 28 664 5 557 40 418 26 087 4 831 11 218 561 172 66 559
43.1% 8.3% 0.1% 0.6% 39.2% 7.3% 0.0% 0.3% 0.8% 0.3% 100.0%
TOTAL PERMANENT108 544 24 070 1 196 18 292 125 766 19 728 903 14 696 2 580 756 316 531
34.3% 7.6% 0.4% 5.8% 39.7% 6.2% 0.3% 4.6% 0.8% 0.2% 100.0%
Temporary employees17 443 3 693 44 595 18 793 3 514 47 578 2 342 483 47 532
36.7% 7.8% 0.1% 1.3% 39.5% 7.4% 0.1% 1.2% 4.9% 1.0% 100.0%
GRAND TOTAL 125 987 27 763 1 240 18 887 144 559 23 242 950 15 274 4 922 1 239 364 063
WORKFORCE PROFILE FOR PERSONS WITH DISABILITIES ONLY
MALE FEMALE FOREIGN NATIONAL
TOTALA C I W A C I W MALE FEMALE
Top Management1 3 1 26 0 4 0 4 0 0 39
2.6% 7.7% 2.6% 66.7% 0.0% 10.3% 0.0% 10.3% 0.0% 0.0% 100.0%
Senior Management10 3 4 42 3 1 1 17 0 0 81
12.3% 3.7% 4.9% 51.9% 3.7% 1.2% 1.2% 21.0% 0.0% 0.0% 100.0%
���������� ����� �����53 24 5 57 36 10 1 34 3 0 223
23.8% 10.8% 2.2% 25.6% 16.1% 4.5% 0.4% 15.2% 1.3% 0.0% 100.0%
Skilled 209 75 8 119 158 40 2 75 1 0 687
30.4% 10.9% 1.2% 17.3% 23.0% 5.8% 0.3% 10.9% 0.1% 0.0% 100.0%
Semi-skilled 386 104 2 49 264 86 3 35 0 0 929
41.6% 11.2% 0.2% 5.3% 28.4% 9.3% 0.3% 3.8% 0.0% 0.0% 100.0%
Unskilled 324 86 3 13 436 73 0 6 0 0 941
34.4% 9.1% 0.3% 1.4% 46.3% 7.8% 0.0% 0.6% 0.0% 0.0% 100.0%
TOTAL PERMANENT983 295 23 306 897 214 7 171 4 0 2 900
33.9% 10.2% 0.8% 10.6% 30.9% 7.4% 0.2% 5.9% 0.1% 0.0% 100.0%
Temporary employees323 53 0 9 365 45 4 2 0 1 802
40.3% 6.6% 0.0% 1.1% 45.5% 5.6% 0.5% 0.2% 0.0% 0.1% 100.0%
GRAND TOTAL 1 306 348 23 315 1 262, 259 11 173 4 1 3 702

68
FREE STATE
WORKFORCE PROFILE FOR ALL EMPLOYEES
MALE FEMALE FOREIGN NATIONAL
TOTALA C I W A C I W MALE FEMALE
Top Management250 25 13 846 114 9 8 173 3 2 �����
17.3% 1.7% 0.9% 58.6% 7.9% 0.6% 0.6% 12.0% 0.2% 0.1% 100.0%
Senior Management528 71 30 982 266 35 13 417 14 4 �����
22.4% 3.0% 1.3% 41.6% 11.3% 1.5% 0.6% 17.7% 0.6% 0.2% 100.0%
���������� ����� �����!"#$# 220 31 !"#$& '"$!$ 160 27 '"$() 104 33 �����
28.7% 2.7% 0.4% 28.8% 17.4% 2.0% 0.3% 18.1% 1.3% 0.4% 100.0%
Skilled '#"#*$ 691 68 $"*#' '$"+($ 689 70 *"!## 308 83 ������
33.4% 1.7% 0.2% 11.3% 37.4% 1.7% 0.2% 13.1% 0.8% 0.2% 100.0%
Semi-skilled !*"$#+ '"!// 37 !"/$' '!"'** 978 46 !"+'( !"#'& 108 ������
53.9% 2.5% 0.1% 4.3% 25.7% 2.1% 0.1% 6.2% 4.9% 0.2% 100.0%
Unskilled !'"!$$ 827 13 521 ''"+$$ 542 2 252 954 120 ������
58.3% 2.3% 0.0% 1.4% 32.8% 1.5% 0.0% 0.7% 2.6% 0.3% 100.0%
TOTAL PERMANENT������ ����� 192 ������ ������ ����� 166 ������ ����� 350 �������
46.6% 2.2% 0.1% 8.3% 30.1% 1.8% 0.1% 7.7% 2.7% 0.3% 100.0%
Temporary employees$"+&( 374 20 597 *"/)& 266 61 822 287 160 ������
39.4% 3.0% 0.2% 4.7% 40.1% 2.1% 0.5% 6.5% 2.3% 1.3% 100.0%
GRAND TOTAL ������ ����� 212 ������ ������ ����� 227 ������ ����� 510 �������
WORKFORCE PROFILE FOR PEOPLE WITH DISABILITIES ONLY
MALE FEMALE FOREIGN NATIONAL
TOTALA C I W A C I W MALE FEMALE
Top Management5 0 1 5 0 0 0 0 0 0 11
45.5% 0.0% 9.1% 45.5% 0.0% 0.0% 0.0% 0.0% 0.0% 0.0% 100.0%
Senior Management5 0 0 17 2 1 0 4 0 0 29
17.2% 0.0% 0.0% 58.6% 6.9% 3.4% 0.0% 13.8% 0.0% 0.0% 100.0%
Professionally �� �����
14 1 0 25 9 2 0 17 0 0 68
20.6% 1.5% 0.0% 36.8% 13.2% 2.9% 0.0% 25.0% 0.0% 0.0% 100.0%
Skilled 69 6 3 49 26 2 1 44 0 0 200
34.5% 3.0% 1.5% 24.5% 13.0% 1.0% 0.5% 22.0% 0.0% 0.0% 100.0%
Semi-skilled 174 14 1 34 66 9 0 39 6 0 343
50.7% 4.1% 0.3% 9.9% 19.2% 2.6% 0.0% 11.4% 1.7% 0.0% 100.0%
Unskilled 117 10 0 29 78 8 0 5 6 0 253
46.2% 4.0% 0.0% 11.5% 30.8% 3.2% 0.0% 2.0% 2.4% 0.0% 100.0%
TOTAL PERMANENT384 31 5 159 181 22 1 109 12 0 904
42.5% 3.4% 0.6% 17.6% 20.0% 2.4% 0.1% 12.1% 1.3% 0.0% 100.0%
Temporary employees7 0 0 3 10 0 0 0 0 0 20
35.0% 0.0% 0.0% 15.0% 50.0% 0.0% 0.0% 0.0% 0.0% 0.0% 100.0%
GRAND TOTAL 391 31 5 162 191 22 1 109 12 0 924

69
GAUTENG PROVINCE
WORKFORCE PROFILE FOR ALL EMPLOYEES
MALE FEMALE FOREIGN NATIONAL
TOTALA C I W A C I W MALE FEMALE
Top Management
#"!&+ 617 '"+)/ '*"&#$ '"+/( 398 855 $"'#( '"!/* 218 #/"$!/
10.8% 2.0% 6.4% 52.1% 6.3% 1.3% 2.8% 13.6% 4.0% 0.7% 100.0%
Senior Management
'!"&*$ !"(*+ )"/!) #'")$* &"#/& '"+'$ #"$+( '*"+'+ !")!/ 862 &)"$/$
14.9% 3.2% 7.0% 36.6% 9.6% 2.2% 4.0% 18.4% 3.0% 1.0% 100.0%
Professionally �� �����
()"*'& '$")*! '+"(## &*"/&# )&"$## '!")+& ')"/$$ )/"#+( &"''( #"#*/ #)*"/!*
21.0% 4.0% 5.4% 23.3% 18.7% 3.5% 4.4% 16.5% 2.2% 0.9% 100.0%
Skilled #&&")(( $("+!/ !("&/+ '!!"('/ !&!"'&' $$")&+ !)"#/# '/*"$$+ '!"('( $"$&) '"/)!"+$'
36.6% 4.5% 2.6% 11.5% 26.5% 4.2% 2.5% 9.9% 1.2% 0.4% 100.0%
Semi-skilled )$("!#/ $*"($$ '$"'($ #$"&#( $'!"/(! $&"/#' '$"*)# $*"(&# !#"&!! $"!(# '"!+/"*!+
50.2% 3.5% 1.1% 2.7% 31.9% 3.7% 1.1% 3.5% 1.8% 0.3% 100.0%
Unskilled !+'"*$# '$"!!) !"!&! $")#( '+/"(!( '!"&+& 998 !"'!# '*"#$* #")$$ *#&"$!#
54.1% 2.6% 0.4% 0.9% 35.4% 2.4% 0.2% 0.4% 2.8% 0.7% 100.0%
TOTAL PERMANENT
'"$!/"''' '!*"+'& ('"+&$ !+$"($) +)#")!& '!/")!& )!"!)/ !##"&/& )#"&!) ')"&## #"#(#"($!
42.1% 3.7% 2.1% 8.7% 28.6% 3.6% 1.8% 6.9% 1.9% 0.5% 100.0%
Temporary employees
')/")$! ''"+&' !"))* +"(() '(#"')( '$"//) !"*(/ +"#)( *"#'/ !"&&/ #+!"#)$
40.9% 3.1% 0.7% 2.5% 44.1% 3.6% 0.7% 2.4% 1.4% 0.7% 100.0%
GRAND TOTAL ��������� ������� ������ ������� ��������� ������� ������ ������� ������ ������ ���������
WORKFORCE PROFILE FOR PEOPLE WITH DISABILITIES ONLY
MALE FEMALE FOREIGN NATIONAL
TOTALA C I W A C I W MALE FEMALE
Top Management50 13 45 157 27 6 23 41 9 3 374
13.4% 3.5% 12.0% 42.0% 7.2% 1.6% 6.1% 11.0% 2.4% 0.8% 100.0%
Senior Management116 42 86 383 81 31 53 174 16 7 989
11.7% 4.2% 8.7% 38.7% 8.2% 3.1% 5.4% 17.6% 1.6% 0.7% 100.0%
���������� ����� �����769 186 253 '"#*( 759 157 218 978 34 18 $"(!+
16.3% 3.9% 5.3% 28.7% 16.0% 3.3% 4.6% 20.7% 0.7% 0.4% 100.0%
Skilled $")+! 559 391 !")&* #"(/+ 572 382 !"/+& 77 37 '*"!/!
30.9% 3.7% 2.6% 17.7% 24.4% 3.8% 2.5% 13.8% 0.5% 0.2% 100.0%
Semi-skilled *"*/' 518 197 751 $"#() 547 240 '"//' 252 11 '#"#+$
41.1% 3.9% 1.5% 5.6% 32.7% 4.1% 1.8% 7.5% 1.9% 0.1% 100.0%
Unskilled #"!#$ 221 59 183 !"##/ 182 30 54 225 11 )"*!+
49.5% 3.4% 0.9% 2.8% 35.7% 2.8% 0.5% 0.8% 3.4% 0.2% 100.0%
TOTAL PERMANENT'$"#)! '"*#+ '"/#' *"*') ''"!&! '"$+* 946 $"#$) 613 87 $'"!'(
34.8% 3.7% 2.5% 13.4% 27.4% 3.6% 2.3% 10.5% 1.5% 0.2% 100.0%
Temporary employees!"!#/ 174 65 64 !"(/# 190 47 60 14 11 *"**&
40.1% 3.1% 1.2% 1.2% 48.6% 3.4% 0.8% 1.1% 0.3% 0.2% 100.0%
GRAND TOTAL ������ ����� ����� ����� ������ ����� 993 ����� 627 98 ������

70
KWAZULU-NATAL
WORKFORCE PROFILE FOR ALL EMPLOYEES
MALE FEMALE FOREIGN NATIONALTOTALA C I W A C I W MALE FEMALE
Top Management887 144 '")(( #"+*( 377 63 649 852 175 28 �����
10.1% 1.6% 19.0% 44.9% 4.3% 0.7% 7.4% 9.7% 2.0% 0.3% 100.0%
Senior Management!"*!$ 437 #"$)/ $"((' '"$!! 308 '"(// !"!(( 274 57 ������
14.6% 2.5% 20.1% 27.7% 8.3% 1.8% 9.9% 13.2% 1.6% 0.3% 100.0%
Professionally �� �����
'#"/(& '"#/! &"!)/ ("&'& '!"$'' '"'++ )"$!) *")#* '"/$) 357 ������
22.7% 2.3% 14.4% 13.6% 21.6% 2.1% 11.2% 9.8% 1.8% 0.6% 100.0%
Skilled (&"#*# $")*$ !!"/** '/"#!) '/'"$(# *"'$+ !'"!*/ '/"&)$ !"''/ 577 �������
30.5% 1.8% 8.6% 4.0% 39.5% 2.0% 8.3% 4.2% 0.8% 0.2% 100.0%
Semi-skilled '*#")*+ *"+!# '(")#* #"/&( '#/"*## ("#!' '("!$# *"#++ !"!&( 464 �������
44.7% 1.7% 5.1% 0.9% 38.0% 2.1% 5.0% 1.6% 0.7% 0.1% 100.0%
Unskilled +$"*)! !"*)) #")#$ 797 ($"+#& '"+)# !"$/* 471 !"'// 387 �������
51.4% 1.4% 2.0% 0.4% 40.8% 1.1% 1.3% 0.3% 1.1% 0.2% 100.0%
TOTAL PERMANENT#$#"/)# '*"/!) *)"(!' #/"(*) #!'"'*$ ')"//# $+")(# !*"$+& ("++! '"&(/ �������
39.5% 1.7% 6.5% 3.5% 37.0% 1.8% 5.7% 2.9% 0.9% 0.2% 100.0%
Temporary employees
#/"#'# '"$$) !"'(' '"''/ $'"+'! '"!#! !"#'/ '"'+) 730 98 ������
36.7% 1.8% 2.6% 1.3% 50.8% 1.5% 2.8% 1.4% 0.9% 0.1% 100.0%
GRAND TOTAL ������� ������ ������ ������ ������� ������ ������ ������ ����� ����� �������
WORKFORCE PROFILE FOR PEOPLE WITH DISABILITIES ONLY
MALE FEMALE FOREIGN NATIONALTOTALA C I W A C I W MALE FEMALE
Top Management10 2 43 43 3 0 13 14 1 1 130
7.7% 1.5% 33.1% 33.1% 2.3% 0.0% 10.0% 10.8% 0.8% 0.8% 100.0%
Senior Management24 4 44 55 19 2 20 23 1 0 192
12.5% 2.1% 22.9% 28.6% 9.9% 1.0% 10.4% 12.0% 0.5% 0.0% 100.0%
���������� ����� �����83 13 102 102 47 10 45 65 3 1 471
17.6% 2.8% 21.7% 21.7% 10.0% 2.1% 9.6% 13.8% 0.6% 0.2% 100.0%
Skilled 426 46 256 169 328 57 129 112 3 6 �����
27.8% 3.0% 16.7% 11.0% 21.4% 3.7% 8.4% 7.3% 0.2% 0.4% 100.0%
Semi-skilled '"!)) 60 267 61 836 45 163 64 1 3 �����
45.8% 2.2% 9.7% 2.2% 30.2% 1.6% 5.9% 2.3% 0.0% 0.1% 100.0%
Unskilled 773 30 80 33 770 35 39 15 4 0 �����
43.5% 1.7% 4.5% 1.9% 43.3% 2.0% 2.2% 0.8% 0.2% 0.0% 100.0%
TOTAL PERMANENT!"*&! 155 792 463 2003 149 409 293 13 11 �����
37.6% 2.3% 11.5% 6.7% 29.2% 2.2% 6.0% 4.3% 0.2% 0.2% 100.0%
Temporary employees167 12 10 6 201 7 13 5 1 0 422
39.6% 2.8% 2.4% 1.4% 47.6% 1.7% 3.1% 1.2% 0.2% 0.0% 100.0%
GRAND TOTAL ����� 167 802 469 2204 156 422 298 14 11 �����

71
LIMPOPO
WORKFORCE PROFILE FOR ALL EMPLOYEES
MALE FEMALE FOREIGN NATIONALTOTALA C I W A C I W MALE FEMALE
Top Management215 8 56 625 107 5 12 175 12 3 '"!'&
17.7% 0.7% 4.6% 51.3% 8.8% 0.4% 1.0% 14.4% 1.0% 0.2% 100.0%
Senior Management923 14 48 773 487 7 24 344 51 11 !")&!
34.4% 0.5% 1.8% 28.8% 18.2% 0.3% 0.9% 12.8% 1.9% 0.4% 100.0%
���������� ����� �����(")(* 42 76 '"#!/ +"''/ 41 66 920 251 92 '+"*+#
39.2% 0.2% 0.4% 6.7% 46.5% 0.2% 0.3% 4.7% 1.3% 0.5% 100.0%
Skilled #!"!#( 149 75 !"'(& $*"+/* 123 65 !"'** '"'*/ 216 &$"!*#
38.3% 0.2% 0.1% 2.6% 54.5% 0.1% 0.1% 2.6% 1.4% 0.3% 100.0%
Semi-skilled #'"()$ 221 64 539 !("$&$ 134 25 623 !"#+* 148 )#"#+(
50.1% 0.3% 0.1% 0.9% 43.4% 0.2% 0.0% 1.0% 3.8% 0.2% 100.0%
Unskilled !/"+#/ 217 13 160 '&"$+& 97 2 46 $"&/& '"($/ $)"*''
45.0% 0.5% 0.0% 0.3% 39.8% 0.2% 0.0% 0.1% 10.3% 3.7% 100.0%
TOTAL PERMANENT+#"($$ 651 332 *"*+* '/'"*+' 407 194 $"!)# &"))( !"!'/ !'(")*$
43.1% 0.3% 0.2% 2.6% 46.7% 0.2% 0.1% 2.0% 4.0% 1.0% 100.0%
Temporary employees'*"*$! 183 2 118 !&"!++ 523 0 110 !"+$! '"$*' $+"'(/
31.6% 0.4% 0.0% 0.2% 57.6% 1.1% 0.0% 0.2% 6.0% 3.0% 100.0%
GRAND TOTAL ������� 834 334 ����� ������� 930 194 ����� ������ ����� �������
WORKFORCE PROFILE FOR PEOPLE WITH DISABILITIES ONLY
MALE FEMALE FOREIGN NATIONALTOTALA C I W A C I W MALE FEMALE
Top Management2 0 1 20 0 1 0 3 0 0 27
7.4% 0.0% 3.7% 74.1% 0.0% 3.7% 0.0% 11.1% 0.0% 0.0% 100.0%
Senior Management12 1 1 22 7 0 0 8 0 1 52
23.1% 1.9% 1.9% 42.3% 13.5% 0.0% 0.0% 15.4% 0.0% 1.9% 100.0%
���������� ����� �����82 0 0 24 33 1 0 14 1 0 155
52.9% 0.0% 0.0% 15.5% 21.3% 0.6% 0.0% 9.0% 0.6% 0.0% 100.0%
Skilled 201 1 0 32 158 0 3 26 4 0 425
47.3% 0.2% 0.0% 7.5% 37.2% 0.0% 0.7% 6.1% 0.9% 0.0% 100.0%
Semi-skilled 289 0 1 6 135 2 0 6 16 1 456
63.4% 0.0% 0.2% 1.3% 29.6% 0.4% 0.0% 1.3% 3.5% 0.2% 100.0%
Unskilled 199 0 0 4 113 0 0 0 28 7 351
56.7% 0.0% 0.0% 1.1% 32.2% 0.0% 0.0% 0.0% 8.0% 2.0% 100.0%
TOTAL PERMANENT785 2 3 108 446 4 3 57 49 9 '"$))
53.5% 0.1% 0.2% 7.4% 30.4% 0.3% 0.2% 3.9% 3.3% 0.6% 100.0%
Temporary employees29 0 0 2 21 0 0 0 3 4 59
49.2% 0.0% 0.0% 3.4% 35.6% 0.0% 0.0% 0.0% 5.1% 6.8% 100.0%
GRAND TOTAL 814 2 3 110 467 4 3 57 52 13 �����

72
MPUMALANGA
WORKFORCE PROFILE FOR ALL EMPLOYEES
MALE FEMALE FOREIGN NATIONALTOTALA C I W A C I W MALE FEMALE
Top Management411 30 76 '"#*( 171 17 31 313 31 3 !"$$/
16.8% 1.2% 3.1% 55.6% 7.0% 0.7% 1.3% 12.8% 1.3% 0.1% 100.0%
Senior Management'"*(+ 65 148 !"'!! 670 30 34 805 82 17 *"**!
28.4% 1.2% 2.7% 38.2% 12.1% 0.5% 0.6% 14.5% 1.5% 0.3% 100.0%
Professionally �� �����
)"*&( 117 215 #"+'+ *")+( 125 156 !"!#' 620 177 '+"&$$
33.2% 0.6% 1.1% 19.7% 28.7% 0.6% 0.8% 11.2% 3.1% 0.9% 100.0%
Skilled $/"/*# 565 296 &")#* #&"(*( 422 324 )"#&' '"(+* 144 +("#(!
41.1% 0.6% 0.3% 8.9% 39.8% 0.4% 0.3% 6.6% 1.8% 0.1% 100.0%
Semi-skilled )*"(*+ 527 78 !"!(+ ##"$*' 413 115 !"$'$ !")+$ 152 '/("&&!
61.0% 0.5% 0.1% 2.1% 31.0% 0.4% 0.1% 2.2% 2.5% 0.1% 100.0%
Unskilled *$"!*) 511 13 610 #+"//( 353 17 198 #"(#' '"//) ++"(/!
54.4% 0.5% 0.0% 0.6% 39.1% 0.4% 0.0% 0.2% 3.7% 1.0% 100.0%
TOTAL PERMANENT')&")$* '"&'* 826 '&"+!! ''("(*# '"#)/ 677 '!"#$! &"+*# '"$++ ##!"(+!
50.7% 0.5% 0.2% 5.7% 35.4% 0.4% 0.2% 3.7% 2.7% 0.5% 100.0%
Temporary employees'("#+( 377 90 '"'*& '$"+// 94 22 384 '"()+ 928 #("''+
46.9% 1.0% 0.2% 3.1% 40.1% 0.3% 0.1% 1.0% 4.8% 2.5% 100.0%
GRAND TOTAL ������� ����� 916 ������ ������� ����� 699 ������ ������ ����� �������
WORKFORCE PROFILE FOR PEOPLE WITH DISABILITIES ONLY
MALE FEMALE FOREIGN NATIONALTOTALA C I W A C I W MALE FEMALE
Top Management8 0 1 22 5 0 2 4 0 0 42
19.0% 0.0% 2.4% 52.4% 11.9% 0.0% 4.8% 9.5% 0.0% 0.0% 100.0%
Senior Management12 1 5 29 2 0 1 10 1 1 62
19.4% 1.6% 8.1% 46.8% 3.2% 0.0% 1.6% 16.1% 1.6% 1.6% 100.0%
���������� ����� �����47 3 3 62 22 0 2 24 0 0 163
28.8% 1.8% 1.8% 38.0% 13.5% 0.0% 1.2% 14.7% 0.0% 0.0% 100.0%
Skilled 245 4 0 111 150 3 1 36 2 1 553
44.3% 0.7% 0.0% 20.1% 27.1% 0.5% 0.2% 6.5% 0.4% 0.2% 100.0%
Semi-skilled 525 12 2 32 294 10 2 25 9 1 912
57.6% 1.3% 0.2% 3.5% 32.2% 1.1% 0.2% 2.7% 1.0% 0.1% 100.0%
Unskilled 441 5 3 9 280 8 1 1 17 3 768
57.4% 0.7% 0.4% 1.2% 36.5% 1.0% 0.1% 0.1% 2.2% 0.4% 100.0%
TOTAL PERMANENT'"!(& 25 14 265 753 21 9 100 29 6 !"*//
51.1% 1.0% 0.6% 10.6% 30.1% 0.8% 0.4% 4.0% 1.2% 0.2% 100.0%
Temporary employees62 4 1 2 65 0 0 0 30 9 173
35.8% 2.3% 0.6% 1.2% 37.6% 0.0% 0.0% 0.0% 17.3% 5.2% 100.0%
GRAND TOTAL ����� 29 15 267 818 21 9 100 59 15 �����

73
NORTHERN CAPE
WORKFORCE PROFILE FOR ALL EMPLOYEES
MALE FEMALE FOREIGN NATIONALTOTALA C I W A C I W MALE FEMALE
Top Management83 62 11 355 31 24 3 54 6 1 630
13.2% 9.8% 1.7% 56.3% 4.9% 3.8% 0.5% 8.6% 1.0% 0.2% 100.0%
Senior Management237 150 12 554 103 80 3 222 14 2 '"#((
17.2% 10.9% 0.9% 40.2% 7.5% 5.8% 0.2% 16.1% 1.0% 0.1% 100.0%
���������� ����� �����'"!'( '"/)! 48 '"!#$ '"/)) 918 45 971 120 42 )"(!#
18.1% 15.8% 0.7% 18.4% 15.9% 13.7% 0.7% 14.4% 1.8% 0.6% 100.0%
Skilled $")$/ #"'($ 38 '"&$/ $"&') $"#/* 31 '"+/* 275 97 !'"'!'
22.0% 15.0% 0.2% 8.7% 22.8% 20.4% 0.1% 9.0% 1.3% 0.5% 100.0%
Semi-skilled +"&(# $"#!( 18 550 *"'/( #"$## 25 660 222 46 !$"!)'
40.7% 17.8% 0.1% 2.3% 21.1% 14.2% 0.1% 2.7% 0.9% 0.2% 100.0%
Unskilled )"'+$ !"&+! 7 117 !"#'( '"*!+ 1 56 140 76 '#"#!+
46.5% 21.7% 0.1% 0.9% 17.4% 11.5% 0.0% 0.4% 1.1% 0.6% 100.0%
TOTAL PERMANENT!!"!$$ ''"))( 134 $")*/ '#"$$/ '/"!&+ 108 #"&)& 777 264 )("$$'
33.0% 17.3% 0.2% 6.9% 19.9% 15.3% 0.2% 5.7% 1.2% 0.4% 100.0%
Temporary employees+"/*( '"(+) 4 97 &"!'' '"+&( 3 62 203 145 !'"*)*
42.0% 8.3% 0.0% 0.4% 38.1% 9.2% 0.0% 0.3% 0.9% 0.7% 100.0%
GRAND TOTAL ������ ������ 138 ����� ������ ������ 111 ����� 980 409 ������
WORKFORCE PROFILE FOR PEOPLE WITH DISABILITIES ONLY
MALE FEMALE FOREIGN NATIONALTOTALA C I W A C I W MALE FEMALE
Top Management1 0 0 7 0 0 0 1 0 0 9
11.1% 0.0% 0.0% 77.8% 0.0% 0.0% 0.0% 11.1% 0.0% 0.0% 100.0%
Senior Management2 1 0 14 0 0 0 3 0 0 20
10.0% 5.0% 0.0% 70.0% 0.0% 0.0% 0.0% 15.0% 0.0% 0.0% 100.0%
���������� ����� �����7 9 0 11 5 6 0 5 1 0 44
15.9% 20.5% 0.0% 25.0% 11.4% 13.6% 0.0% 11.4% 2.3% 0.0% 100.0%
Skilled 37 32 1 36 22 16 0 9 0 0 153
24.2% 20.9% 0.7% 23.5% 14.4% 10.5% 0.0% 5.9% 0.0% 0.0% 100.0%
Semi-skilled 56 36 1 7 32 20 1 9 0 0 162
34.6% 22.2% 0.6% 4.3% 19.8% 12.3% 0.6% 5.6% 0.0% 0.0% 100.0%
Unskilled 62 20 1 4 54 15 1 2 0 0 159
39.0% 12.6% 0.6% 2.5% 34.0% 9.4% 0.6% 1.3% 0.0% 0.0% 100.0%
TOTAL PERMANENT165 98 3 79 113 57 2 29 1 0 547
30.2% 17.9% 0.5% 14.4% 20.7% 10.4% 0.4% 5.3% 0.2% 0.0% 100.0%
Temporary employees18 4 0 0 9 4 1 0 0 0 36
50.0% 11.1% 0.0% 0.0% 25.0% 11.1% 2.8% 0.0% 0.0% 0.0% 100.0%
GRAND TOTAL 183 102 3 79 122 61 3 29 1 0 583

74
NORTH WEST
WORKFORCE PROFILE FOR ALL EMPLOYEES
MALE FEMALE FOREIGN NATIONAL
TOTALA C I W A C I W MALE FEMALE
Top Management273 10 32 595 87 3 9 152 13 2 '"'()
23.2% 0.9% 2.7% 50.6% 7.4% 0.3% 0.8% 12.9% 1.1% 0.2% 100.0%
Senior Management677 38 60 943 287 28 18 389 60 5 !"*/*
27.0% 1.5% 2.4% 37.6% 11.5% 1.1% 0.7% 15.5% 2.4% 0.2% 100.0%
���������� ����� �����#"*$* 152 167 !"($* !"+') 158 118 !"/'& 456 140 '!"$'*
28.6% 1.2% 1.3% 22.1% 23.5% 1.3% 1.0% 16.3% 3.7% 1.1% 100.0%
Skilled !/"+') 473 135 )"!$& !*"*'' 545 181 *"($) '"'#$ 101 )/"++/
34.3% 0.8% 0.2% 10.2% 41.8% 0.9% 0.3% 9.4% 1.9% 0.2% 100.0%
Semi-skilled $#"+)/ 533 59 '"(!' !/")($ 667 51 !"#/* +"')/ 92 (+"!!!
55.5% 0.7% 0.1% 2.2% 26.1% 0.8% 0.1% 2.9% 11.6% 0.1% 100.0%
Unskilled #'"/(' 318 8 317 '*")/( 270 23 185 #"$)) 274 *'"*#+
60.3% 0.6% 0.0% 0.6% 30.3% 0.5% 0.0% 0.4% 6.7% 0.5% 100.0%
TOTAL PERMANENT'//"$$! '"*!$ 461 '!"*)+ )*"/&! '")(' 400 '/"(+* '$"!&+ 614 !/("&$(
48.3% 0.7% 0.2% 6.0% 31.3% 0.8% 0.2% 5.2% 6.9% 0.3% 100.0%
Temporary employees&")+* 134 39 789 '*"/'# 111 24 936 333 76 !)"'*/
33.3% 0.5% 0.1% 3.0% 57.4% 0.4% 0.1% 3.6% 1.3% 0.3% 100.0%
GRAND TOTAL ������� ����� 500 ������ ������ ����� 424 ������ ������ 690 �������
WORKFORCE PROFILE FOR PEOPLE WITH DISABILITIES ONLY
MALE FEMALE FOREIGN NATIONALTOTALA C I W A C I W MALE FEMALE
Top Management1 0 1 8 2 0 0 5 0 0 17
5.9% 0.0% 5.9% 47.1% 11.8% 0.0% 0.0% 29.4% 0.0% 0.0% 100.0%
Senior Management9 1 6 20 1 0 1 9 1 0 48
18.8% 2.1% 12.5% 41.7% 2.1% 0.0% 2.1% 18.8% 2.1% 0.0% 100.0%
���������� ����� �����20 1 1 49 16 1 1 23 2 1 115
17.4% 0.9% 0.9% 42.6% 13.9% 0.9% 0.9% 20.0% 1.7% 0.9% 100.0%
Skilled 128 8 0 123 76 4 1 61 2 0 403
31.8% 2.0% 0.0% 30.5% 18.9% 1.0% 0.2% 15.1% 0.5% 0.0% 100.0%
Semi-skilled 321 5 0 37 158 7 0 31 47 0 606
53.0% 0.8% 0.0% 6.1% 26.1% 1.2% 0.0% 5.1% 7.8% 0.0% 100.0%
Unskilled 421 2 0 11 175 0 0 4 65 0 678
62.1% 0.3% 0.0% 1.6% 25.8% 0.0% 0.0% 0.6% 9.6% 0.0% 100.0%
TOTAL PERMANENT900 17 8 248 428 12 3 133 117 1 '"&)(
48.2% 0.9% 0.4% 13.3% 22.9% 0.6% 0.2% 7.1% 6.3% 0.1% 100.0%
Temporary employees48 2 2 8 31 2 1 2 0 0 96
50.0% 2.1% 2.1% 8.3% 32.3% 2.1% 1.0% 2.1% 0.0% 0.0% 100.0%
GRAND TOTAL 948 19 10 256 459 14 4 135 117 1 �����

75
WESTERN CAPE
WORKFORCE PROFILE FOR ALL EMPLOYEES
MALE FEMALE FOREIGN NATIONALTOTALA C I W A C I W MALE FEMALE
Top Management376 '"/*# 304 ("#)+ 163 603 157 '"&'' 260 49 '!"'$*
3.1% 8.7% 2.5% 60.7% 1.3% 5.0% 1.3% 14.9% 2.1% 0.4% 100.0%
Senior Management'"#&# #"'&* 821 '/"*!* 763 !"!#! 528 *"$/! 499 191 !*"*!+
5.4% 12.5% 3.2% 41.2% 3.0% 8.7% 2.1% 21.2% 2.0% 0.7% 100.0%
Professionally �� �����
("*/# '!"#/' !"!)! !/"*&& ("/$* '!"'(& '"+)( '(")$( '")+$ 674 &#"&*+
8.9% 14.7% 2.7% 24.6% 8.4% 14.5% 2.3% 21.0% 2.0% 0.8% 100.0%
Skilled $/"!$) $("**/ #"*&# !*"!+' #("$'& $)"##/ $"/&# #'"#!+ #"+/' '"()! !$'"$+#
16.7% 19.7% 1.5% 10.5% 15.5% 19.2% 1.7% 13.0% 1.6% 0.7% 100.0%
Semi-skilled '''"*'! ()"$/$ !")*+ +"((! '$("'!$ +/"!') #"&#/ '("))( )"#($ !"#)& $)("+!)
23.8% 16.3% 0.6% 2.1% 31.4% 19.3% 0.8% 3.8% 1.4% 0.5% 100.0%
Unskilled &("*+$ $&"##! 558 '"&*$ &*"'** $)"*() 503 '"/() *"'&! !"'$) !(&"+()
31.4% 17.3% 0.2% 0.7% 30.5% 16.7% 0.2% 0.4% 1.9% 0.8% 100.0%
TOTAL PERMANENT
!$&")'$ '&&"&!* '/"'&( (*"#++ !(("))& '+&"'#* ''"/)& ($"+#! '("+'/ ("'+/ '"'/+"+!&
22.4% 17.0% 0.9% 6.8% 25.0% 17.9% 1.0% 6.8% 1.6% 0.6% 100.0%
Temporary employees
#'")!& '("/&* 347 !")+# ##"/#$ !!"//' 407 #"#)& $"#!' !")'# ''("$+(
26.9% 14.5% 0.3% 2.3% 28.1% 18.7% 0.3% 2.9% 3.7% 2.2% 100.0%
GRAND TOTAL ������� ������� ������ ������ ������� ������� ������ ������ ������ ����� ���������
WORKFORCE PROFILE FOR PEOPLE WITH DISABILITIES ONLY
MALE FEMALE FOREIGN NATIONAL
TOTALA C I W A C I W MALE FEMALE
Top Management6 23 8 84 1 22 3 22 2 0 171
3.5% 13.5% 4.7% 49.1% 0.6% 12.9% 1.8% 12.9% 1.2% 0.0% 100.0%
Senior Management11 54 12 140 2 38 8 60 2 1 328
3.4% 16.5% 3.7% 42.7% 0.6% 11.6% 2.4% 18.3% 0.6% 0.3% 100.0%
Professionally �� �����
43 150 27 262 35 111 21 187 11 3 850
5.1% 17.6% 3.2% 30.8% 4.1% 13.1% 2.5% 22.0% 1.3% 0.4% 100.0%
Skilled 256 583 47 403 220 434 46 387 12 3 !"#+'
10.7% 24.4% 2.0% 16.9% 9.2% 18.2% 1.9% 16.2% 0.5% 0.1% 100.0%
Semi-skilled 755 843 40 261 875 837 47 268 10 5 #"+$'
19.2% 21.4% 1.0% 6.6% 22.2% 21.2% 1.2% 6.8% 0.3% 0.1% 100.0%
Unskilled 812 546 20 87 862 420 7 64 7 6 !"&#'
28.7% 19.3% 0.7% 3.1% 30.4% 14.8% 0.2% 2.3% 0.2% 0.2% 100.0%
TOTAL PERMANENT'"&&# !"'++ 154 '"!#( '"++* '"&)! 132 988 44 18 '/"*'!
17.9% 20.9% 1.5% 11.8% 19.0% 17.7% 1.3% 9.4% 0.4% 0.2% 100.0%
Temporary employees
203 97 6 17 231 89 5 10 1 0 659
30.8% 14.7% 0.9% 2.6% 35.1% 13.5% 0.8% 1.5% 0.2% 0.0% 100.0%
GRAND TOTAL ����� ����� 160 ����� ����� ����� 137 998 45 18 ������

76
C. WORKFORCE PROFILE BY OF ALL EMPLOYERS BY SECTOR FOR 2018
AGRICULTURE
WORKFORCE PROFILE FOR ALL EMPLOYEES
MALE FEMALE FOREIGN NATIONALTOTALA C I W A C I W MALE FEMALE
Top Management299 139 59 #"(!& 106 101 13 689 43 4 *"'&'
5.8% 2.7% 1.1% 72.0% 2.0% 1.9% 0.3% 13.3% 0.8% 0.1% 100.0%
Senior Management700 329 112 $"$&# 274 166 58 '"$+& 83 18 ("(!'
9.1% 4.3% 1.5% 58.1% 3.5% 2.1% 0.8% 19.4% 1.1% 0.2% 100.0%
Professionally �� �����
#"$// '"/)& 362 ("/!& '"(#( 590 281 #"&$) 253 70 '&")#*
18.2% 5.7% 1.9% 37.7% 9.3% 3.2% 1.5% 20.6% 1.4% 0.4% 100.0%
Skilled '+"!#! )")$$ 740 &")+$ &")*+ #")() 555 )")*$ '"/+/ 191 *)"'#*
34.3% 11.8% 1.3% 15.5% 15.4% 6.5% 1.0% 11.9% 1.9% 0.3% 100.0%
Semi-skilled )/"/#! '("'$' 462 !")*) !!"!#$ &"($& 353 #"&)# #"#$* 574 ''+"$/&
50.3% 14.4% 0.4% 2.2% 18.6% 7.3% 0.3% 3.2% 2.8% 0.5% 100.0%
Unskilled +#"(*/ '&"*(+ 65 535 (*")#' '&"'/$ 23 233 ''"#(& $"/(! !!!"#(/
42.2% 8.4% 0.0% 0.2% 34.0% 8.1% 0.0% 0.1% 5.1% 1.8% 100.0%
TOTAL PERMANENT
'(("$'# $#"+// '"&// !("'!$ '/&")$' #'"#&* '"!&# ')"(&# ')"'+! $"+!+ $!+"$*/
41.3% 10.2% 0.4% 6.3% 25.3% 7.3% 0.3% 3.9% 3.8% 1.1% 100.0%
Temporary employees
)/"++$ ''"((! 34 528 ('")&* ')"!&& 29 305 '/"$#' *"!$/ '(("#/)
34.4% 6.6% 0.0% 0.3% 40.4% 9.2% 0.0% 0.2% 5.9% 3.0% 100.0%
GRAND TOTAL ������� ������ ����� ������ ������� ������ ����� ������ ������ ������ �������
WORKFORCE PROFILE FOR PEOPLE WITH DISABILITIES ONLY
MALE FEMALE FOREIGN NATIONALTOTALA C I W A C I W MALE FEMALE
Top Management4 0 1 53 1 7 0 5 0 0 71
5.6% 0.0% 1.4% 74.6% 1.4% 9.9% 0.0% 7.0% 0.0% 0.0% 100.0%
Senior Management8 4 2 69 0 0 1 14 0 1 99
8.1% 4.0% 2.0% 69.7% 0.0% 0.0% 1.0% 14.1% 0.0% 1.0% 100.0%
���������� ����� �����31 28 6 107 19 6 1 44 1 0 243
12.8% 11.5% 2.5% 44.0% 7.8% 2.5% 0.4% 18.1% 0.4% 0.0% 100.0%
Skilled 203 81 7 122 74 30 2 85 4 2 610
33.3% 13.3% 1.1% 20.0% 12.1% 4.9% 0.3% 13.9% 0.7% 0.3% 100.0%
Semi-skilled 541 149 5 50 278 85 4 47 13 0 '"'(!
46.2% 12.7% 0.4% 4.3% 23.7% 7.3% 0.3% 4.0% 1.1% 0.0% 100.0%
Unskilled 558 155 0 8 514 109 0 5 33 11 '"#+#
40.1% 11.1% 0.0% 0.6% 36.9% 7.8% 0.0% 0.4% 2.4% 0.8% 100.0%
TOTAL PERMANENT'"#$* 417 21 409 886 237 8 200 51 14 #"*&&
37.5% 11.6% 0.6% 11.4% 24.7% 6.6% 0.2% 5.6% 1.4% 0.4% 100.0%
Temporary employees144 27 0 4 113 23 0 2 36 18 367
39.2% 7.4% 0.0% 1.1% 30.8% 6.3% 0.0% 0.5% 9.8% 4.9% 100.0%
GRAND TOTAL ����� 444 21 413 999 260 8 202 87 32 �����

77
CATERING AND ACCOMODATION
WORKFORCE PROFILE FOR ALL EMPLOYEES
MALE FEMALE FOREIGN NATIONALTOTALA C I W A C I W MALE FEMALE
Top Management202 54 101 '"''( 127 52 54 462 81 18 !"!)&
8.9% 2.4% 4.5% 49.3% 5.6% 2.3% 2.4% 20.4% 3.6% 0.8% 100.0%
Senior Management916 292 259 '"+/( 724 337 178 '")!/ 160 65 )"$*&
14.2% 4.5% 4.0% 29.5% 11.2% 5.2% 2.8% 25.1% 2.5% 1.0% 100.0%
���������� ����� �����#"#$/ 919 648 #"/+) #"#') '"'&* 539 #"#$# 531 263 '("'&/
19.4% 5.3% 3.8% 18.0% 19.3% 6.9% 3.1% 19.5% 3.1% 1.5% 100.0%
Skilled '*"(/$ !"*($ '"/$( #"$+) !/"/!/ $"*$/ '"$/* *"/$! '"*!# 975 *)"#!)
27.9% 4.6% 1.9% 6.2% 35.5% 8.1% 2.5% 9.0% 2.7% 1.7% 100.0%
Semi-skilled $)"$)/ $"'$' 783 '")*) ))"+(! ("/*! '"/$' !"(*$ #")+' '"&(& '#)"$!&
34.1% 3.0% 0.6% 1.2% 49.1% 5.2% 0.8% 2.0% 2.7% 1.4% 100.0%
Unskilled !'"*/) !"'$+ 70 326 #&"$!$ $"(&$ 79 308 '"$!$ 818 )+"&&&
30.8% 3.1% 0.1% 0.5% 55.0% 6.8% 0.1% 0.4% 2.0% 1.2% 100.0%
TOTAL PERMANENT&&"'!& '/"'!+ !"+/& ''"*+& '!+"*&# '("+*/ #"!+) '#"*!+ ("$'/ $"/'( !&&"*$&
30.5% 3.5% 1.0% 4.0% 44.9% 6.2% 1.1% 4.7% 2.6% 1.4% 100.0%
Temporary employees*")'& 611 52 454 +"&#* '"')( 56 480 569 309 '+"'*'
29.3% 3.2% 0.3% 2.4% 51.4% 6.1% 0.3% 2.5% 3.0% 1.6% 100.0%
GRAND TOTAL ������ ������ ����� ������ ������� ������ ����� ������ ����� ����� �������
WORKFORCE PROFILE FOR PEOPLE WITH DISABILITIES ONLY
MALE FEMALE FOREIGN NATIONALTOTALA C I W A C I W MALE FEMALE
Top Management4 1 4 11 3 3 3 7 0 0 36
11.1% 2.8% 11.1% 30.6% 8.3% 8.3% 8.3% 19.4% 0.0% 0.0% 100.0%
Senior Management5 2 3 23 5 4 0 18 0 1 61
8.2% 3.3% 4.9% 37.7% 8.2% 6.6% 0.0% 29.5% 0.0% 1.6% 100.0%
���������� ����� �����32 5 6 37 34 15 4 40 3 1 177
18.1% 2.8% 3.4% 20.9% 19.2% 8.5% 2.3% 22.6% 1.7% 0.6% 100.0%
Skilled 115 24 10 50 99 42 16 65 5 0 426
27.0% 5.6% 2.3% 11.7% 23.2% 9.9% 3.8% 15.3% 1.2% 0.0% 100.0%
Semi-skilled 301 55 11 40 345 76 18 46 5 2 899
33.5% 6.1% 1.2% 4.4% 38.4% 8.5% 2.0% 5.1% 0.6% 0.2% 100.0%
Unskilled 233 27 2 14 325 39 2 9 6 1 658
35.4% 4.1% 0.3% 2.1% 49.4% 5.9% 0.3% 1.4% 0.9% 0.2% 100.0%
TOTAL PERMANENT690 114 36 175 811 179 43 185 19 5 �����
30.6% 5.1% 1.6% 7.8% 35.9% 7.9% 1.9% 8.2% 0.8% 0.2% 100.0%
Temporary employees72 2 1 5 92 3 0 2 0 0 177
40.7% 1.1% 0.6% 2.8% 52.0% 1.7% 0.0% 1.1% 0.0% 0.0% 100.0%
GRAND TOTAL 762 116 37 180 903 182 43 187 19 5 �����

78
COMMUNITY SERVICES
WORKFORCE PROFILE FOR ALL EMPLOYEES
MALE FEMALE FOREIGN NATIONALTOTALA C I W A C I W MALE FEMALE
Top Management'"$#( 263 338 !"!/* 761 147 203 '"'!( 95 45 )")!'
21.7% 4.0% 5.1% 33.3% 11.5% 2.2% 3.1% 17.0% 1.4% 0.7% 100.0%
Senior Management*"&*/ 938 839 #"('* #"+$/ 700 697 #")&# 343 190 !/"&+*
28.0% 4.5% 4.0% 17.8% 18.9% 3.4% 3.3% 17.6% 1.6% 0.9% 100.0%
Professionally �� �����
$+"/(/ ("()' *"/!' '&"(') )!"'$/ +"&*$ )")') !("&+' #"(() !"/'/ '+!"&**
25.4% 4.0% 2.6% 9.7% 32.2% 5.1% 3.4% 14.5% 2.0% 1.0% 100.0%
Skilled !)$"+$* !+"()+ '/"'*! #/")/& #)+"#/) #&"'+# '("!$* )#"/!# #"+($ !"($! &!+"+*(
31.9% 3.6% 1.2% 3.7% 44.5% 4.6% 2.1% 7.6% 0.5% 0.3% 100.0%
Semi-skilled !*$"'!& !("$'! *"//' ("(/( !))"(/+ $/"(*( )")*$ !!"'!! '"#&# 728 )#!")/'
40.2% 4.3% 0.8% 1.2% 42.2% 6.4% 1.1% 3.5% 0.2% 0.1% 100.0%
Unskilled +/"&/& '#"'#* 881 '"#++ +#")'* '/"+*! 620 '"'+* 610 297 !'#"*'!
42.5% 6.2% 0.4% 0.7% 43.8% 5.1% 0.3% 0.6% 0.3% 0.1% 100.0%
TOTAL PERMANENT)))"!#& (+"!(& !!"!#! )$"#*/ (+)"$(' '//")/# #!"/#* ''+"/$' '/"'&' )"/'! '"&+)"$$'
35.1% 4.2% 1.2% 3.4% 42.0% 5.3% 1.7% 6.3% 0.5% 0.3% 100.0%
Temporary employees)#"*/+ *"')' '"$!! *"!*& '$'"//& +")#( !"!)# &")/+ !"($& '"$!/ !$'"/#*
26.3% 2.1% 0.6% 2.2% 58.5% 4.0% 0.9% 3.6% 1.1% 0.6% 100.0%
GRAND TOTAL ������� ������ ������ ������ ������� ������� ������ ������� ������ ����� ���������
WORKFORCE PROFILE FOR PEOPLE WITH DISABILITIES ONLY
MALE FEMALE FOREIGN NATIONALTOTALA C I W A C I W MALE FEMALE
Top Management14 3 7 27 7 1 2 15 1 3 80
17.5% 3.8% 8.8% 33.8% 8.8% 1.3% 2.5% 18.8% 1.3% 3.8% 100.0%
Senior Management74 13 12 98 33 11 11 43 2 0 297
24.9% 4.4% 4.0% 33.0% 11.1% 3.7% 3.7% 14.5% 0.7% 0.0% 100.0%
���������� ����� �����552 111 76 460 591 97 80 489 16 9 �����
22.2% 4.5% 3.1% 18.5% 23.8% 3.9% 3.2% 19.7% 0.6% 0.4% 100.0%
Skilled !"&(# 374 126 '"/*# !"*!/ 347 185 '"!$# 18 21 �����
32.8% 4.3% 1.4% 12.0% 28.8% 4.0% 2.1% 14.2% 0.2% 0.2% 100.0%
Semi-skilled '"&*/ 350 108 303 '"&)& 326 98 509 5 2 �����
34.1% 6.5% 2.0% 5.6% 34.5% 6.0% 1.8% 9.4% 0.1% 0.0% 100.0%
Unskilled 966 211 17 100 916 120 9 67 2 3 �����
40.1% 8.8% 0.7% 4.1% 38.0% 5.0% 0.4% 2.8% 0.1% 0.1% 100.0%
TOTAL PERMANENT)"#!+ '"/)! 346 !"/$' *"+#* 902 385 !"#)) 44 38 ������
32.5% 5.5% 1.8% 10.5% 30.5% 4.6% 2.0% 12.2% 0.2% 0.2% 100.0%
Temporary employees'"!/' 86 19 42 '"$/+ 92 13 50 7 6 �����
41.1% 2.9% 0.6% 1.4% 48.2% 3.1% 0.4% 1.7% 0.2% 0.2% 100.0%
GRAND TOTAL ����� ����� 365 ����� ����� 994 398 ����� 51 44 ������

79
CONSTRUCTION
WORKFORCE PROFILE FOR ALL EMPLOYEES
MALE FEMALE FOREIGN NATIONALTOTALA C I W A C I W MALE FEMALE
Top Management873 350 373 #"*$) 338 128 156 423 139 16 �����
13.8% 5.5% 5.9% 55.9% 5.3% 2.0% 2.5% 6.7% 2.2% 0.3% 100.0%
Senior Management'"&&' 699 637 *"'/+ 717 236 203 '"!$$ 275 56 ������
17.0% 6.3% 5.8% 46.2% 6.5% 2.1% 1.8% 11.3% 2.5% 0.5% 100.0%
���������� ����� �����("!#/ !"/)( '"!+) +"(!$ !")(( 522 522 !"&&& 910 138 ������
25.8% 7.4% 4.6% 34.8% 9.6% 1.9% 1.9% 10.3% 3.3% 0.5% 100.0%
Skilled #&"&$+ )"''# '"+(/ ''"'/' +"##+ '"&)+ '"/(' *"'&! !"//! 185 ������
50.0% 7.9% 2.5% 14.3% 12.0% 2.4% 1.4% 6.7% 2.6% 0.2% 100.0%
Semi-skilled (/")($ *")$# 671 !")*$ '!"**' '")$* 530 !"$/+ !"#/& 122 ������
71.2% 5.7% 0.7% 2.7% 12.7% 1.7% 0.5% 2.4% 2.3% 0.1% 100.0%
Unskilled *$"$!( $"*)/ 159 509 ')"/&! 868 48 181 !"!'' 159 ������
68.7% 5.8% 0.2% 0.6% 20.3% 1.1% 0.1% 0.2% 2.8% 0.2% 100.0%
TOTAL PERMANENT'(#"+#$ '+"$#! *"'/) #!")$# $'"(/$ *"!)& !"*#/ '!"#!( ("&$* 676 �������
57.7% 6.4% 1.7% 10.8% 13.8% 1.7% 0.8% 4.1% 2.6% 0.2% 100.0%
Temporary employees$/"+$' #"(&) 300 !"/#' '#"'&/ 901 83 465 504 53 ������
65.8% 6.1% 0.5% 3.3% 21.2% 1.4% 0.1% 0.7% 0.8% 0.1% 100.0%
GRAND TOTAL ������� ������ ����� ������ ������ ����� ����� ������ ����� 729 �������
WORKFORCE PROFILE FOR PEOPLE WITH DISABILITIES ONLY
MALE FEMALE FOREIGN NATIONALTOTALA C I W A C I W MALE FEMALE
Top Management12 11 16 37 6 5 4 3 1 0 95
12.6% 11.6% 16.8% 38.9% 6.3% 5.3% 4.2% 3.2% 1.1% 0.0% 100.0%
Senior Management16 16 12 56 8 3 9 14 0 0 134
11.9% 11.9% 9.0% 41.8% 6.0% 2.2% 6.7% 10.4% 0.0% 0.0% 100.0%
���������� ����� �����60 25 15 92 23 5 5 32 2 0 259
23.2% 9.7% 5.8% 35.5% 8.9% 1.9% 1.9% 12.4% 0.8% 0.0% 100.0%
Skilled 323 66 23 122 92 15 19 44 2 0 706
45.8% 9.3% 3.3% 17.3% 13.0% 2.1% 2.7% 6.2% 0.3% 0.0% 100.0%
Semi-skilled 545 68 6 41 260 24 13 24 1 0 982
55.5% 6.9% 0.6% 4.2% 26.5% 2.4% 1.3% 2.4% 0.1% 0.0% 100.0%
Unskilled 248 20 5 10 162 18 2 6 2 1 474
52.3% 4.2% 1.1% 2.1% 34.2% 3.8% 0.4% 1.3% 0.4% 0.2% 100.0%
TOTAL PERMANENT'"!/$ 206 77 358 551 70 52 123 8 1 �����
45.4% 7.8% 2.9% 13.5% 20.8% 2.6% 2.0% 4.6% 0.3% 0.0% 100.0%
Temporary employees156 24 10 6 148 22 10 1 1 0 378
41.3% 6.3% 2.6% 1.6% 39.2% 5.8% 2.6% 0.3% 0.3% 0.0% 100.0%
GRAND TOTAL ����� 230 87 364 699 92 62 124 9 1 �����

80
ELECTRICITY, GAS AND WATER
WORKFORCE PROFILE FOR ALL EMPLOYEES
MALE FEMALE FOREIGN NATIONALTOTALA C I W A C I W MALE FEMALE
Top Management234 50 59 401 132 24 38 64 37 4 '"/$#
22.4% 4.8% 5.7% 38.4% 12.7% 2.3% 3.6% 6.1% 3.5% 0.4% 100.0%
Senior Management'"!$$ 155 223 941 796 93 118 339 79 15 $"//#
31.1% 3.9% 5.6% 23.5% 19.9% 2.3% 2.9% 8.5% 2.0% 0.4% 100.0%
���������� ����� �����*"*!/ 850 882 #"#*& $"#(' 416 428 '"'$/ 224 54 '("!$#
32.0% 4.9% 5.1% 19.5% 25.3% 2.4% 2.5% 6.6% 1.3% 0.3% 100.0%
Skilled !*"/+$ !")// '"/&& )"$!( '*"&+' '"#(( 759 !")$( 347 52 *)"!&!
44.6% 4.6% 1.9% 11.4% 28.2% 2.4% 1.3% 4.7% 0.6% 0.1% 100.0%
Semi-skilled !)")(' !"$#* 345 '"$'$ ''"!&* '"/$+ 321 '"*'( 194 38 $*"!)+
58.9% 5.4% 0.8% 3.1% 24.9% 2.3% 0.7% 3.4% 0.4% 0.1% 100.0%
Unskilled '$"!'# 997 133 310 *"*+# 322 21 45 124 9 !'"()(
65.3% 4.6% 0.6% 1.4% 25.7% 1.5% 0.1% 0.2% 0.6% 0.0% 100.0%
TOTAL PERMANENT(!"+() ("/&( !"(#/ '!"&*' #&"/)& #"!&' '")&* *"(*! '"//* 172 '$*")/(
50.1% 4.9% 1.9% 8.8% 26.1% 2.3% 1.2% 4.0% 0.7% 0.1% 100.0%
Temporary employees$")*$ 508 42 171 )"#+/ 432 32 93 48 5 '!"#(*
37.6% 4.1% 0.3% 1.4% 51.6% 3.5% 0.3% 0.8% 0.4% 0.0% 100.0%
GRAND TOTAL ������ ����� ����� ������ ������ ����� ����� ����� ����� 177 �������
WORKFORCE PROFILE FOR PEOPLE WITH DISABILITIES ONLY
MALE FEMALE FOREIGN NATIONALTOTALA C I W A C I W MALE FEMALE
Top Management3 0 4 5 2 0 1 2 0 0 17
17.6% 0.0% 23.5% 29.4% 11.8% 0.0% 5.9% 11.8% 0.0% 0.0% 100.0%
Senior Management10 1 4 18 6 2 4 6 0 0 51
19.6% 2.0% 7.8% 35.3% 11.8% 3.9% 7.8% 11.8% 0.0% 0.0% 100.0%
���������� ����� �����58 17 13 102 50 4 9 24 1 0 278
20.9% 6.1% 4.7% 36.7% 18.0% 1.4% 3.2% 8.6% 0.4% 0.0% 100.0%
Skilled 379 65 60 312 218 27 11 93 0 0 '"')*
32.5% 5.6% 5.2% 26.8% 18.7% 2.3% 0.9% 8.0% 0.0% 0.0% 100.0%
Semi-skilled 520 75 10 64 213 29 7 61 1 0 980
53.1% 7.7% 1.0% 6.5% 21.7% 3.0% 0.7% 6.2% 0.1% 0.0% 100.0%
Unskilled 166 16 5 8 80 4 0 3 0 0 282
58.9% 5.7% 1.8% 2.8% 28.4% 1.4% 0.0% 1.1% 0.0% 0.0% 100.0%
TOTAL PERMANENT'"'#) 174 96 509 569 66 32 189 2 0 !"((#
41.0% 6.3% 3.5% 18.4% 20.5% 2.4% 1.2% 6.8% 0.1% 0.0% 100.0%
Temporary employees24 0 1 0 15 0 0 0 0 0 40
60.0% 0.0% 2.5% 0.0% 37.5% 0.0% 0.0% 0.0% 0.0% 0.0% 100.0%
GRAND TOTAL ����� 174 97 509 584 66 32 189 2 0 �����

81
FINANCE AND BUSINESS SERVICES
WORKFORCE PROFILE FOR ALL EMPLOYEES
MALE FEMALE FOREIGN NATIONALTOTALA C I W A C I W MALE FEMALE
Top Management'"/!/ 296 622 *"$#! 615 246 365 '"(*$ 359 92 '/"&/'
9.4% 2.7% 5.8% 50.3% 5.7% 2.3% 3.4% 16.2% 3.3% 0.9% 100.0%
Senior Management#"#(+ '"!)/ !"*&) ''"&'' !")#+ '"'$& '"+$& ("$#! '"/)+ 461 ##"(##
10.0% 3.7% 7.7% 35.0% 7.8% 3.4% 5.8% 22.0% 3.2% 1.4% 100.0%
Professionally �� �����
!/"*'! ("/!/ +"!## #/"#'( !/"/$) ("+!* &"()! !)"''/ #"!&! '"$(& '#$")&*
15.2% 5.2% 6.9% 22.5% 14.9% 5.9% 6.5% 19.4% 2.4% 1.1% 100.0%
Skilled *("/#/ '*"/+! +"&!$ !$"/#+ ($")#/ !$"&#' '#"!!# #*")(' !"$(( '")/+ !*&"$!)
22.1% 5.8% 3.8% 9.3% 28.9% 9.6% 5.1% 13.8% 1.0% 0.6% 100.0%
Semi-skilled '/*"*#( '*"/() )"*#& ("/+* '/$"!#& !*"!)* +"*/& '*"*'! '"*)+ '"'!/ !+'"$*&
36.2% 5.2% 2.2% 2.4% 35.8% 8.7% 3.3% 5.3% 0.5% 0.4% 100.0%
Unskilled $)"'+$ $"'#) 468 491 $!"+$* $")$+ 319 400 '"/$' 730 '/'"#(#
45.6% 4.1% 0.5% 0.5% 42.4% 4.6% 0.3% 0.4% 1.0% 0.7% 100.0%
TOTAL PERMANENT!##")(! $!"&&/ !+"!(' (+"'&* !$*"''# )$"/)$ #$"'!* &)"&(+ +"(+( *"$+/ &#/"$()
28.1% 5.2% 3.5% 9.5% 29.5% 7.7% 4.1% 10.5% 1.2% 0.7% 100.0%
Temporary employees
*#"$(' )"'&& '"'$& !"+## $/"/*' )"/#$ 923 #"!'/ '"!/( 614 ''*"((+
46.2% 5.3% 1.0% 2.5% 34.6% 5.2% 0.8% 2.8% 1.0% 0.5% 100.0%
GRAND TOTAL ������� ������ ������ ������ ������� ������ ������ ������ ������ ����� �������
WORKFORCE PROFILE FOR PEOPLE WITH DISABILITIES ONLY
MALE FEMALE FOREIGN NATIONALTOTALA C I W A C I W MALE FEMALE
Top Management15 6 10 54 7 5 10 24 4 1 136
11.0% 4.4% 7.4% 39.7% 5.1% 3.7% 7.4% 17.6% 2.9% 0.7% 100.0%
Senior Management26 19 34 131 24 19 26 76 12 6 373
7.0% 5.1% 9.1% 35.1% 6.4% 5.1% 7.0% 20.4% 3.2% 1.6% 100.0%
���������� ����� �����130 69 98 423 126 92 103 378 16 7 �����
9.0% 4.8% 6.8% 29.3% 8.7% 6.4% 7.1% 26.2% 1.1% 0.5% 100.0%
Skilled 436 148 120 371 555 298 149 568 11 10 �����
16.4% 5.6% 4.5% 13.9% 20.8% 11.2% 5.6% 21.3% 0.4% 0.4% 100.0%
Semi-skilled 856 117 64 128 '"'*/ 258 124 278 4 7 �����
28.7% 3.9% 2.1% 4.3% 38.5% 8.6% 4.2% 9.3% 0.1% 0.2% 100.0%
Unskilled 494 77 24 13 545 84 12 10 1 1 �����
39.2% 6.1% 1.9% 1.0% 43.2% 6.7% 1.0% 0.8% 0.1% 0.1% 100.0%
TOTAL PERMANENT'"+*( 436 350 '"'!/ !"$/( 756 424 '"##$ 48 32 �����
22.1% 4.9% 3.9% 12.6% 27.2% 8.5% 4.8% 15.0% 0.5% 0.4% 100.0%
Temporary employees309 40 3 13 353 34 5 6 2 1 766
40.3% 5.2% 0.4% 1.7% 46.1% 4.4% 0.7% 0.8% 0.3% 0.1% 100.0%
GRAND TOTAL ����� 476 353 ����� ����� 790 429 ����� 50 33 �����
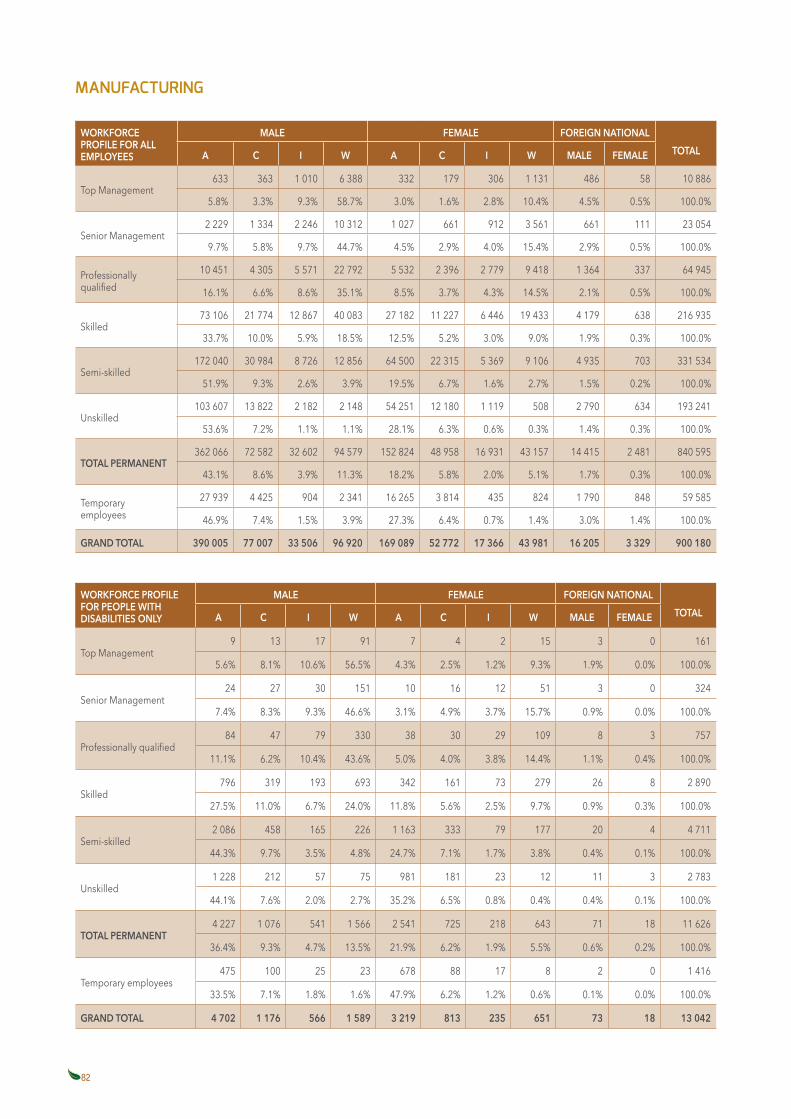
82
MANUFACTURING
WORKFORCE PROFILE FOR ALL EMPLOYEES
MALE FEMALE FOREIGN NATIONALTOTALA C I W A C I W MALE FEMALE
Top Management633 363 '"/'/ )"#&& 332 179 306 '"'#' 486 58 '/"&&)
5.8% 3.3% 9.3% 58.7% 3.0% 1.6% 2.8% 10.4% 4.5% 0.5% 100.0%
Senior Management!"!!+ '"##$ !"!$) '/"#'! '"/!( 661 912 #"*)' 661 111 !#"/*$
9.7% 5.8% 9.7% 44.7% 4.5% 2.9% 4.0% 15.4% 2.9% 0.5% 100.0%
Professionally �� �����
'/"$*' $"#/* *"*(' !!"(+! *"*#! !"#+) !"((+ +"$'& '"#)$ 337 )$"+$*
16.1% 6.6% 8.6% 35.1% 8.5% 3.7% 4.3% 14.5% 2.1% 0.5% 100.0%
Skilled (#"'/) !'"(($ '!"&)( $/"/&# !("'&! ''"!!( )"$$) '+"$## $"'(+ 638 !')"+#*
33.7% 10.0% 5.9% 18.5% 12.5% 5.2% 3.0% 9.0% 1.9% 0.3% 100.0%
Semi-skilled '(!"/$/ #/"+&$ &"(!) '!"&*) )$"*// !!"#'* *"#)+ +"'/) $"+#* 703 ##'"*#$
51.9% 9.3% 2.6% 3.9% 19.5% 6.7% 1.6% 2.7% 1.5% 0.2% 100.0%
Unskilled '/#")/( '#"&!! !"'&! !"'$& *$"!*' '!"'&/ '"''+ 508 !"(+/ 634 '+#"!$'
53.6% 7.2% 1.1% 1.1% 28.1% 6.3% 0.6% 0.3% 1.4% 0.3% 100.0%
TOTAL PERMANENT#)!"/)) (!"*&! #!")/! +$"*(+ '*!"&!$ $&"+*& ')"+#' $#"'*( '$"$'* !"$&' &$/"*+*
43.1% 8.6% 3.9% 11.3% 18.2% 5.8% 2.0% 5.1% 1.7% 0.3% 100.0%
Temporary employees
!("+#+ $"$!* 904 !"#$' ')"!)* #"&'$ 435 824 '"(+/ 848 *+"*&*
46.9% 7.4% 1.5% 3.9% 27.3% 6.4% 0.7% 1.4% 3.0% 1.4% 100.0%
GRAND TOTAL ������� ������ ������ ������ ������� ������ ������ ������ ������ ����� �������
WORKFORCE PROFILE FOR PEOPLE WITH DISABILITIES ONLY
MALE FEMALE FOREIGN NATIONALTOTALA C I W A C I W MALE FEMALE
Top Management9 13 17 91 7 4 2 15 3 0 161
5.6% 8.1% 10.6% 56.5% 4.3% 2.5% 1.2% 9.3% 1.9% 0.0% 100.0%
Senior Management24 27 30 151 10 16 12 51 3 0 324
7.4% 8.3% 9.3% 46.6% 3.1% 4.9% 3.7% 15.7% 0.9% 0.0% 100.0%
���������� ����� �����84 47 79 330 38 30 29 109 8 3 757
11.1% 6.2% 10.4% 43.6% 5.0% 4.0% 3.8% 14.4% 1.1% 0.4% 100.0%
Skilled 796 319 193 693 342 161 73 279 26 8 !"&+/
27.5% 11.0% 6.7% 24.0% 11.8% 5.6% 2.5% 9.7% 0.9% 0.3% 100.0%
Semi-skilled !"/&) 458 165 226 '"')# 333 79 177 20 4 $"(''
44.3% 9.7% 3.5% 4.8% 24.7% 7.1% 1.7% 3.8% 0.4% 0.1% 100.0%
Unskilled '"!!& 212 57 75 981 181 23 12 11 3 !"(&#
44.1% 7.6% 2.0% 2.7% 35.2% 6.5% 0.8% 0.4% 0.4% 0.1% 100.0%
TOTAL PERMANENT$"!!( '"/() 541 '"*)) !"*$' 725 218 643 71 18 ''")!)
36.4% 9.3% 4.7% 13.5% 21.9% 6.2% 1.9% 5.5% 0.6% 0.2% 100.0%
Temporary employees475 100 25 23 678 88 17 8 2 0 '"$')
33.5% 7.1% 1.8% 1.6% 47.9% 6.2% 1.2% 0.6% 0.1% 0.0% 100.0%
GRAND TOTAL ����� ����� 566 ����� ����� 813 235 651 73 18 ������

83
MINING AND QUARRYING
WORKFORCE PROFILE FOR ALL EMPLOYEES
MALE FEMALE FOREIGN NATIONAL
TOTALA C I W A C I W MALE FEMALE
Top Management301 38 37 798 104 10 18 114 44 6 '"$(/
20.5% 2.6% 2.5% 54.3% 7.1% 0.7% 1.2% 7.8% 3.0% 0.4% 100.0%
Senior Management'"/(# 123 195 !"*#/ 285 41 95 430 112 20 $"+/$
21.9% 2.5% 4.0% 51.6% 5.8% 0.8% 1.9% 8.8% 2.3% 0.4% 100.0%
���������� ����� �����*"'(& 606 407 )")&+ !"/*$ 217 266 '"(&+ 389 63 '(")*&
29.3% 3.4% 2.3% 37.9% 11.6% 1.2% 1.5% 10.1% 2.2% 0.4% 100.0%
Skilled $!"/(! #"!(/ 532 '&"(&& +"&&! 842 299 $"!$+ #"*'' 84 &#"*!+
50.4% 3.9% 0.6% 22.5% 11.8% 1.0% 0.4% 5.1% 4.2% 0.1% 100.0%
Semi-skilled '!&"!(* #"++( 104 !"(++ '&"$#( '"//# 107 '")$( !$"!'' 203 '&/"(&#
71.0% 2.2% 0.1% 1.5% 10.2% 0.6% 0.1% 0.9% 13.4% 0.1% 100.0%
Unskilled (/"*'' 728 14 583 '*"(*& 222 7 86 '!"!$& '"/$/ '/'"'+(
69.7% 0.7% 0.0% 0.6% 15.6% 0.2% 0.0% 0.1% 12.1% 1.0% 100.0%
TOTAL PERMANENT!$("$'/ &"()! '"!&+ #!"'&( $)"*!/ !"##* 792 &"#'* $/"*'* '"$') #&+"*$'
63.5% 2.2% 0.3% 8.3% 11.9% 0.6% 0.2% 2.1% 10.4% 0.4% 100.0%
Temporary employees$"(&) 322 34 875 '"++) 192 26 175 128 9 &"*$#
56.0% 3.8% 0.4% 10.2% 23.4% 2.2% 0.3% 2.0% 1.5% 0.1% 100.0%
GRAND TOTAL ������� ����� ����� ������ ������ ����� 818 ����� ������ ����� �������
WORKFORCE PROFILE FOR PEOPLE WITH DISABILITIES ONLY
MALE FEMALE FOREIGN NATIONAL
TOTALA C I W A C I W MALE FEMALE
Top Management5 1 0 9 0 0 1 2 0 0 18
27.8% 5.6% 0.0% 50.0% 0.0% 0.0% 5.6% 11.1% 0.0% 0.0% 100.0%
Senior Management3 0 2 25 0 1 1 3 1 0 36
8.3% 0.0% 5.6% 69.4% 0.0% 2.8% 2.8% 8.3% 2.8% 0.0% 100.0%
���������� ����� �����21 5 5 72 3 1 0 16 3 1 127
16.5% 3.9% 3.9% 56.7% 2.4% 0.8% 0.0% 12.6% 2.4% 0.8% 100.0%
Skilled 235 27 3 247 42 7 2 40 27 0 630
37.3% 4.3% 0.5% 39.2% 6.7% 1.1% 0.3% 6.3% 4.3% 0.0% 100.0%
Semi-skilled 859 25 4 52 170 22 2 23 280 1 '"$#&
59.7% 1.7% 0.3% 3.6% 11.8% 1.5% 0.1% 1.6% 19.5% 0.1% 100.0%
Unskilled '"'*# 14 1 5 180 8 1 0 286 1 '")$+
69.9% 0.8% 0.1% 0.3% 10.9% 0.5% 0.1% 0.0% 17.3% 0.1% 100.0%
TOTAL PERMANENT!"!() 72 15 410 395 39 7 84 597 3 #"&+&
58.4% 1.8% 0.4% 10.5% 10.1% 1.0% 0.2% 2.2% 15.3% 0.1% 100.0%
Temporary employees36 0 0 7 38 1 1 2 0 0 85
42.4% 0.0% 0.0% 8.2% 44.7% 1.2% 1.2% 2.4% 0.0% 0.0% 100.0%
GRAND TOTAL ����� 72 15 417 433 40 8 86 597 3 �����

84
RETAIL AND MOTOR
WORKFORCE PROFILE FOR ALL EMPLOYEES
MALE FEMALE FOREIGN NATIONAL
TOTALA C I W A C I W MALE FEMALE
Top Management212 147 400 !")+/ 92 92 128 668 62 9 $"*//
4.7% 3.3% 8.9% 59.8% 2.0% 2.0% 2.8% 14.8% 1.4% 0.2% 100.0%
Senior Management'"#/( 761 998 $"*$) 746 572 479 !"!+! 146 43 ''"&+/
11.0% 6.4% 8.4% 38.2% 6.3% 4.8% 4.0% 19.3% 1.2% 0.4% 100.0%
���������� ����� �����*"+(' !"*(+ !"#*# ("&'' $")!$ !")$/ '"*#' *"(!( 272 134 ##")$!
17.7% 7.7% 7.0% 23.2% 13.7% 7.8% 4.6% 17.0% 0.8% 0.4% 100.0%
Skilled !("(*# ("!$* $"*)) ''"++/ !$"++/ +"$*) #"$)& +"*(' 820 311 '//"'(/
27.7% 7.2% 4.6% 12.0% 24.9% 9.4% 3.5% 9.6% 0.8% 0.3% 100.0%
Semi-skilled &)"(*# '$"*$/ $"$/# )"&+$ '*'"))# #'"!)! $"(+' (")** '"(*( 848 #'/"*))
27.9% 4.7% 1.4% 2.2% 48.8% 10.1% 1.5% 2.5% 0.6% 0.3% 100.0%
Unskilled *#"#$+ ("/)! 983 '"!)* )/"(*( +")/! 642 710 '"$*) 645 '#)"$('
39.1% 5.2% 0.7% 0.9% 44.5% 7.0% 0.5% 0.5% 1.1% 0.5% 100.0%
TOTAL PERMANENT'(*"#$* #!"##$ '#"(/# #*"'+) !$!"&(! *#")!$ ''"/#+ !)")!# $"*'# '"++/ *+("!#+
29.4% 5.4% 2.3% 5.9% 40.7% 9.0% 1.8% 4.5% 0.8% 0.3% 100.0%
Temporary employees&"/)+ '"!)$ 268 507 ''"$'$ '"+!& 273 457 265 149 !$"*+$
32.8% 5.1% 1.1% 2.1% 46.4% 7.8% 1.1% 1.9% 1.1% 0.6% 100.0%
GRAND TOTAL ������� ����� ����� ������ ������ ����� 818 ����� ������ ����� �������
WORKFORCE PROFILE FOR PEOPLE WITH DISABILITIES ONLY
MALE FEMALE FOREIGN NATIONAL
TOTALA C I W A C I W MALE FEMALE
Top Management1 1 18 33 0 2 4 6 0 0 65
1.5% 1.5% 27.7% 50.8% 0.0% 3.1% 6.2% 9.2% 0.0% 0.0% 100.0%
Senior Management12 9 19 64 4 3 4 28 0 1 144
8.3% 6.3% 13.2% 44.4% 2.8% 2.1% 2.8% 19.4% 0.0% 0.7% 100.0%
���������� ����� �����33 21 30 94 21 19 24 89 2 0 333
9.9% 6.3% 9.0% 28.2% 6.3% 5.7% 7.2% 26.7% 0.6% 0.0% 100.0%
Skilled 202 61 46 166 177 78 35 134 1 0 900
22.4% 6.8% 5.1% 18.4% 19.7% 8.7% 3.9% 14.9% 0.1% 0.0% 100.0%
Semi-skilled 545 113 42 113 643 217 46 121 3 3 '"&$)
29.5% 6.1% 2.3% 6.1% 34.8% 11.8% 2.5% 6.6% 0.2% 0.2% 100.0%
Unskilled 551 61 19 57 565 43 4 18 4 6 '"#!&
41.5% 4.6% 1.4% 4.3% 42.5% 3.2% 0.3% 1.4% 0.3% 0.5% 100.0%
TOTAL PERMANENT'"#$$ 266 174 527 '"$'/ 362 117 396 10 10 $")')
29.1% 5.8% 3.8% 11.4% 30.5% 7.8% 2.5% 8.6% 0.2% 0.2% 100.0%
Temporary employees46 5 0 2 65 13 2 1 1 0 135
34.1% 3.7% 0.0% 1.5% 48.1% 9.6% 1.5% 0.7% 0.7% 0.0% 100.0%
GRAND TOTAL ����� 271 174 529 ����� 375 119 397 11 10 �����

85
TRANSPORT AND STORAGE
WORKFORCE PROFILE FOR ALL EMPLOYEES
MALE FEMALE FOREIGN NATIONAL
TOTALA C I W A C I W MALE FEMALE
Top Management516 155 425 !"'// 287 110 189 493 206 20 $"*/'
11.5% 3.4% 9.4% 46.7% 6.4% 2.4% 4.2% 11.0% 4.6% 0.4% 100.0%
Senior Management'"('$ 545 '"/)* #"(($ 913 323 501 '"(#$ 456 99 ''"'!$
15.4% 4.9% 9.6% 33.9% 8.2% 2.9% 4.5% 15.6% 4.1% 0.9% 100.0%
���������� ����� �����+"'!& !"#(# !"+)+ '/")+) *"/+$ '"#/+ '")/! *"/(( '"!#' 309 #+"(&&
22.9% 6.0% 7.5% 26.9% 12.8% 3.3% 4.0% 12.8% 3.1% 0.8% 100.0%
Skilled *)"#+! ''"'#+ )"+#) !/"$(( !("/*' )"!!* #"(** ''"'// !"*(* 431 '$)"/&'
38.6% 7.6% 4.7% 14.0% 18.5% 4.3% 2.6% 7.6% 1.8% 0.3% 100.0%
Semi-skilled +("##' '!"!+& $"''& *"((+ #+"($+ )"'$$ !"&'* *"$!* #"'#+ 331 '(("'!+
54.9% 6.9% 2.3% 3.3% 22.4% 3.5% 1.6% 3.1% 1.8% 0.2% 100.0%
Unskilled !+"$'* !"++! 400 525 '/"+'/ '"//+ 96 180 650 226 $)"$/#
63.4% 6.4% 0.9% 1.1% 23.5% 2.2% 0.2% 0.4% 1.4% 0.5% 100.0%
TOTAL PERMANENT'+$"$+) !+"*/! '*"+'# $#"#*' &$"//$ '*"'!/ &"+*& !$"//+ &"!*( '"$') $!*"/!)
45.8% 6.9% 3.7% 10.2% 19.8% 3.6% 2.1% 5.6% 1.9% 0.3% 100.0%
Temporary employees'/"(// 897 401 655 )"'*' 646 195 358 205 65 !/"!(#
52.8% 4.4% 2.0% 3.2% 30.3% 3.2% 1.0% 1.8% 1.0% 0.3% 100.0%
GRAND TOTAL ������� ������ ������ ������ ������ ������ ����� ������ ����� ����� �������
WORKFORCE PROFILE FOR PEOPLE WITH DISABILITIES ONLY
MALE FEMALE FOREIGN NATIONALTOTALA C I W A C I W MALE FEMALE
Top Management11 2 10 18 4 3 7 4 0 0 59
18.6% 3.4% 16.9% 30.5% 6.8% 5.1% 11.9% 6.8% 0.0% 0.0% 100.0%
Senior Management13 12 19 45 10 8 11 31 1 1 151
8.6% 7.9% 12.6% 29.8% 6.6% 5.3% 7.3% 20.5% 0.7% 0.7% 100.0%
���������� ����� �����79 35 28 153 39 15 19 65 2 2 437
18.1% 8.0% 6.4% 35.0% 8.9% 3.4% 4.3% 14.9% 0.5% 0.5% 100.0%
Skilled 573 117 79 447 545 76 45 183 5 2 !"/(!
27.7% 5.6% 3.8% 21.6% 26.3% 3.7% 2.2% 8.8% 0.2% 0.1% 100.0%
Semi-skilled 767 119 53 123 579 83 32 104 3 0 '"&)#
41.2% 6.4% 2.8% 6.6% 31.1% 4.5% 1.7% 5.6% 0.2% 0.0% 100.0%
Unskilled 326 47 17 20 380 55 9 4 3 0 861
37.9% 5.5% 2.0% 2.3% 44.1% 6.4% 1.0% 0.5% 0.3% 0.0% 100.0%
TOTAL PERMANENT'"()+ 332 206 806 '"**( 240 123 391 14 5 *"$$#
32.5% 6.1% 3.8% 14.8% 28.6% 4.4% 2.3% 7.2% 0.3% 0.1% 100.0%
Temporary employees319 31 16 3 383 37 16 1 0 0 806
39.6% 3.8% 2.0% 0.4% 47.5% 4.6% 2.0% 0.1% 0.0% 0.0% 100.0%
GRAND TOTAL ����� 363 222 809 ����� 277 139 392 14 5 �����

86
WHOLESALE TRADE, COMMERCIAL AGENTS AND ALLIED SERVICES
WORKFORCE PROFILE FOR ALL EMPLOYEES
MALE FEMALE FOREIGN NATIONAL
TOTALA C I W A C I W MALE FEMALE
Top Management340 198 769 $"/#) 201 100 268 '"/)$ 203 40 ("!'+
4.7% 2.7% 10.7% 55.9% 2.8% 1.4% 3.7% 14.7% 2.8% 0.6% 100.0%
Senior Management'"#!( 618 '"**! *"!)$ 777 518 681 !"&!) 318 86 '#"+)(
9.5% 4.4% 11.1% 37.7% 5.6% 3.7% 4.9% 20.2% 2.3% 0.6% 100.0%
���������� ����� �����*"'') '"(+* !"$#! &"+(+ #")+( '"*'' '"($/ )"+)& 682 205 ##"'!*
15.4% 5.4% 7.3% 27.1% 11.2% 4.6% 5.3% 21.0% 2.1% 0.6% 100.0%
Skilled !)"&&/ *"&$' $"()! '#"**' '&"$'+ )")$/ $"$++ '#"(#) '")(! 504 +)"*/$
27.9% 6.1% 4.9% 14.0% 19.1% 6.9% 4.7% 14.2% 1.7% 0.5% 100.0%
Semi-skilled &$"+$) '/"+/) #"(*' *"+)$ )("(*' '!"+'/ $"*++ &"&&! #"##* '"!'( !/$"!)'
41.6% 5.3% 1.8% 2.9% 33.2% 6.3% 2.3% 4.3% 1.6% 0.6% 100.0%
Unskilled *&"!(& ("!&) '"!'# '"#$/ */"#'$ )"#)( 988 779 !"#** 935 '!+"&**
44.9% 5.6% 0.9% 1.0% 38.7% 4.9% 0.8% 0.6% 1.8% 0.7% 100.0%
TOTAL PERMANENT'()"&&( !)")$$ '$"$(+ #+"'#$ '$'"'*+ !&"/$) '!"((* #$"!** &"*)* !"+&( $&$"+#'
36.5% 5.5% 3.0% 8.1% 29.1% 5.8% 2.6% 7.1% 1.8% 0.6% 100.0%
Temporary employees'*"/!# !"'#* 777 '"'&/ !/"$!! !")+* '"'!+ '"&$( 342 122 $*")(!
32.9% 4.7% 1.7% 2.6% 44.7% 5.9% 2.5% 4.0% 0.7% 0.3% 100.0%
GRAND TOTAL ������� ������ ������ ������ ������� ������ ������ ������ ����� ����� �������
WORKFORCE PROFILE FOR PEOPLE WITH DISABILITIES ONLY
MALE FEMALE FOREIGN NATIONALTOTALA C I W A C I W MALE FEMALE
Top Management6 3 14 34 1 3 7 11 3 0 82
7.3% 3.7% 17.1% 41.5% 1.2% 3.7% 8.5% 13.4% 3.7% 0.0% 100.0%
Senior Management10 4 21 42 17 6 5 24 2 0 131
7.6% 3.1% 16.0% 32.1% 13.0% 4.6% 3.8% 18.3% 1.5% 0.0% 100.0%
���������� ����� �����38 24 35 79 18 14 14 61 1 0 284
13.4% 8.5% 12.3% 27.8% 6.3% 4.9% 4.9% 21.5% 0.4% 0.0% 100.0%
Skilled 128 32 39 144 183 47 28 114 2 4 721
17.8% 4.4% 5.4% 20.0% 25.4% 6.5% 3.9% 15.8% 0.3% 0.6% 100.0%
Semi-skilled 403 63 43 98 367 110 33 88 6 2 '"!'#
33.2% 5.2% 3.5% 8.1% 30.3% 9.1% 2.7% 7.3% 0.5% 0.2% 100.0%
Unskilled 460 80 19 63 450 80 16 17 4 0 '"'&+
38.7% 6.7% 1.6% 5.3% 37.8% 6.7% 1.3% 1.4% 0.3% 0.0% 100.0%
TOTAL PERMANENT'"/$* 206 171 460 '"/#) 260 103 315 18 6 #")!/
28.9% 5.7% 4.7% 12.7% 28.6% 7.2% 2.8% 8.7% 0.5% 0.2% 100.0%
Temporary employees305 31 9 6 342 24 7 6 0 0 730
41.8% 4.2% 1.2% 0.8% 46.8% 3.3% 1.0% 0.8% 0.0% 0.0% 100.0%
GRAND TOTAL ����� 237 180 466 ����� 284 110 321 18 6 �����

87
D. WORKFORCE PROFILE BY OF ALL EMPLOYERS BY BUSINESS TYPE FOR 2018
ALL GOVERNMENT
ALL GOVERNMENT WORKFORCE PROFILE FOR ALL EMPLOYEES
MALE FEMALE FOREIGN NATIONAL
TOTALA C I W A C I W MALE FEMALE
Top Management927 118 80 115 484 45 32 50 3 2 '"&*)
49.9% 6.4% 4.3% 6.2% 26.1% 2.4% 1.7% 2.7% 0.2% 0.1% 100.0%
Senior Management*"'&* 600 494 '"/($ #"$($ 328 325 623 59 34 '!"'+)
42.5% 4.9% 4.1% 8.8% 28.5% 2.7% 2.7% 5.1% 0.5% 0.3% 100.0%
Professionally �� �����
#)"'$/ *"*(# !"&(+ +"+&+ $'"*'/ )"&&& #"*/* '/")#! '"#!# 608 ''+"/$(
30.4% 4.7% 2.4% 8.4% 34.9% 5.8% 2.9% 8.9% 1.1% 0.5% 100.0%
Skilled '$&"&)* !/"#*& *"+*( '&")+( '+$"!+$ !/"(*' *"+$# !)"/*$ '"#$! 662 $$!"+!#
33.6% 4.6% 1.3% 4.2% 43.9% 4.7% 1.3% 5.9% 0.3% 0.1% 100.0%
Semi-skilled '!("*'$ '&"+#/ !"+)# !"+'& '*!"!'$ '+"#!+ !")'+ )"/## 212 116 ##!"&$&
38.3% 5.7% 0.9% 0.9% 45.7% 5.8% 0.8% 1.8% 0.1% 0.0% 100.0%
Unskilled *!"&#/ &"$!$ 562 650 $#"*+( $"!/& 231 299 19 10 ''/"&#/
47.7% 7.6% 0.5% 0.6% 39.3% 3.8% 0.2% 0.3% 0.0% 0.0% 100.0%
TOTAL PERMANENT#('"$)' *$"//# '!"+#* ##"$$# $#*"*(# *'"*$+ '!")** $#")+' !"+*& '"$#! '"/'+"(//
36.4% 5.3% 1.3% 3.3% 42.7% 5.1% 1.2% 4.3% 0.3% 0.1% 100.0%
Temporary employees
!!"&#& '"*+& 382 '"''* *)")#+ !"!$$ 535 '"+!+ 568 232 &&"/&/
25.9% 1.8% 0.4% 1.3% 64.3% 2.5% 0.6% 2.2% 0.6% 0.3% 100.0%
GRAND TOTAL ������� ������ ������ ������ ������� ������ ������ ������ ����� ����� ���������
WORKFORCE PROFILE FOR ALL GOVERNMENT EMPLOYEES WITH DISABILITIES
MALE FEMALE FOREIGN NATIONAL
TOTALA C I W A C I W MALE FEMALE
Top Management9 0 2 3 4 1 0 1 0 0 20
45.0% 0.0% 10.0% 15.0% 20.0% 5.0% 0.0% 5.0% 0.0% 0.0% 100.0%
Senior Management55 6 7 45 23 5 7 13 0 0 161
34.2% 3.7% 4.3% 28.0% 14.3% 3.1% 4.3% 8.1% 0.0% 0.0% 100.0%
���������� ����� �����476 99 65 351 419 57 57 300 6 2 '"&#!
26.0% 5.4% 3.5% 19.2% 22.9% 3.1% 3.1% 16.4% 0.3% 0.1% 100.0%
Skilled '")*$ 331 96 885 '"($* 226 106 861 11 8 *"+!#
27.9% 5.6% 1.6% 14.9% 29.5% 3.8% 1.8% 14.5% 0.2% 0.1% 100.0%
Semi-skilled '"$)/ 282 71 127 '"'+& 202 38 221 1 0 #")//
40.6% 7.8% 2.0% 3.5% 33.3% 5.6% 1.1% 6.1% 0.0% 0.0% 100.0%
Unskilled 597 137 13 26 353 49 6 9 0 0 '"'+/
50.2% 11.5% 1.1% 2.2% 29.7% 4.1% 0.5% 0.8% 0.0% 0.0% 100.0%
TOTAL PERMANENT$"!*' 855 254 '"$#( #"($! 540 214 '"$/* 18 10 '!"(!)
33.4% 6.7% 2.0% 11.3% 29.4% 4.2% 1.7% 11.0% 0.1% 0.1% 100.0%
Temporary employees105 10 1 4 100 3 4 9 2 0 238
44.1% 4.2% 0.4% 1.7% 42.0% 1.3% 1.7% 3.8% 0.8% 0.0% 100.0%
GRAND TOTAL ����� 865 255 ����� ����� 543 218 ����� 20 10 ������

88
NATIONAL GOVERNMENT
WORKFORCE PROFILE FOR ALL EMPLOYEES
MALE FEMALE FOREIGN NATIONALTOTALA C I W A C I W MALE FEMALE
Top Management189 26 23 24 113 11 11 14 2 1 414
45.7% 6.3% 5.6% 5.8% 27.3% 2.7% 2.7% 3.4% 0.5% 0.2% 100.0%
Senior Management!"!(! 254 260 512 '"('! 147 194 377 33 30 *"(+'
39.2% 4.4% 4.5% 8.8% 29.6% 2.5% 3.4% 6.5% 0.6% 0.5% 100.0%
���������� ����� �����'$"**& '"+#& '"/(( $"(+( '#"$$* '"*/$ 859 #"$)( 330 172 $!"'$(
34.5% 4.6% 2.6% 11.4% 31.9% 3.6% 2.0% 8.2% 0.8% 0.4% 100.0%
Skilled (!"*** '/"+$& !"&$/ '!"!&/ *'")!/ ("!#+ '"(#$ '/"!(# 46 74 ')+")/+
42.8% 6.5% 1.7% 7.2% 30.4% 4.3% 1.0% 6.1% 0.0% 0.0% 100.0%
Semi-skilled )$"'(& ("'(' '"/)) '"!++ )*")&! ("!*) 989 !"&(* 76 44 '*/")#)
42.6% 4.8% 0.7% 0.9% 43.6% 4.8% 0.7% 1.9% 0.1% 0.0% 100.0%
Unskilled &"!// 769 73 112 +"!&! 737 16 36 1 4 '+"!#/
42.6% 4.0% 0.4% 0.6% 48.3% 3.8% 0.1% 0.2% 0.0% 0.0% 100.0%
TOTAL PERMANENT')'"+*! !'"'/) *"##+ '+"/!$ '$'"&*$ ')"&+$ #"&/# '("/$! 488 325 #&("&!(
41.8% 5.4% 1.4% 4.9% 36.6% 4.4% 1.0% 4.4% 0.1% 0.1% 100.0%
Temporary employees)"+'& 281 47 224 !'"($' 575 67 212 297 97 #/"$*+
22.7% 0.9% 0.2% 0.7% 71.4% 1.9% 0.2% 0.7% 1.0% 0.3% 100.0%
GRAND TOTAL ������� ������ ����� ������ ������� ������ ����� ������ 785 422 �������
WORKFORCE PROFILE FOR PEOPLE WITH DISABILITIES ONLY
MALE FEMALE FOREIGN NATIONALTOTALA C I W A C I W MALE FEMALE
Top Management2 0 0 1 1 0 0 0 0 0 4
50.0% 0.0% 0.0% 25.0% 25.0% 0.0% 0.0% 0.0% 0.0% 0.0% 100.0%
Senior Management26 2 3 20 14 3 7 10 0 0 85
30.6% 2.4% 3.5% 23.5% 16.5% 3.5% 8.2% 11.8% 0.0% 0.0% 100.0%
���������� ����� �����158 30 26 168 92 16 19 105 3 1 618
25.6% 4.9% 4.2% 27.2% 14.9% 2.6% 3.1% 17.0% 0.5% 0.2% 100.0%
Skilled 819 155 45 640 445 83 34 432 0 0 !")*#
30.9% 5.8% 1.7% 24.1% 16.8% 3.1% 1.3% 16.3% 0.0% 0.0% 100.0%
Semi-skilled 572 109 18 72 540 80 12 115 0 0 '"*'&
37.7% 7.2% 1.2% 4.7% 35.6% 5.3% 0.8% 7.6% 0.0% 0.0% 100.0%
Unskilled 45 9 0 8 33 6 1 2 0 0 104
43.3% 8.7% 0.0% 7.7% 31.7% 5.8% 1.0% 1.9% 0.0% 0.0% 100.0%
TOTAL PERMANENT'")!! 305 92 909 '"'!* 188 73 664 3 1 $"+&!
32.6% 6.1% 1.8% 18.2% 22.6% 3.8% 1.5% 13.3% 0.1% 0.0% 100.0%
Temporary employees6 1 0 1 9 2 0 2 0 0 21
28.6% 4.8% 0.0% 4.8% 42.9% 9.5% 0.0% 9.5% 0.0% 0.0% 100.0%
GRAND TOTAL ����� 306 92 910 ����� 190 73 666 3 1 �����

89
PROVINCIAL GOVERMENT
WORKFORCE PROFILE FOR ALL EMPLOYEES
MALE FEMALE FOREIGN NATIONALTOTALA C I W A C I W MALE FEMALE
Top Management186 22 8 20 106 14 7 13 0 1 377
49.3% 5.8% 2.1% 5.3% 28.1% 3.7% 1.9% 3.4% 0.0% 0.3% 100.0%
Senior Management'"!+* 157 84 170 913 110 74 112 14 2 !"+#'
44.2% 5.4% 2.9% 5.8% 31.1% 3.8% 2.5% 3.8% 0.5% 0.1% 100.0%
���������� ����� �����')"&#' !"$&+ '"$)' #")(& !$"$*$ $"(*) !"$*( )"$&* 962 424 )#"++(
26.3% 3.9% 2.3% 5.7% 38.2% 7.4% 3.8% 10.1% 1.5% 0.7% 100.0%
Skilled )/"/*/ $"/!& '"#!* #"$+$ '!+"$'+ '/"$$+ #"$/# '$"/+/ '"!$& 571 !!&"/((
26.3% 1.8% 0.6% 1.5% 56.7% 4.6% 1.5% 6.2% 0.5% 0.3% 100.0%
Semi-skilled #)"!/+ $"!$' 574 536 )+"/'+ ("#&+ 856 '"&&/ 127 65 '!/"&+)
30.0% 3.5% 0.5% 0.4% 57.1% 6.1% 0.7% 1.6% 0.1% 0.1% 100.0%
Unskilled '*"'+$ '"!)+ 87 211 '&"$)* '"!$) 82 172 10 6 #)"($!
41.4% 3.5% 0.2% 0.6% 50.3% 3.4% 0.2% 0.5% 0.0% 0.0% 100.0%
TOTAL PERMANENT'!+"()* '!"!/) #"*#+ &"'/+ !$!"#() !#"+)$ )"&(+ !!"(*! !"#)' '"/)+ $*#"/!/
28.6% 2.7% 0.8% 1.8% 53.5% 5.3% 1.5% 5.0% 0.5% 0.2% 100.0%
Temporary employees'/"(#( 428 263 792 !+"(#/ 943 402 '")!# 263 126 $*"#/(
23.7% 0.9% 0.6% 1.7% 65.6% 2.1% 0.9% 3.6% 0.6% 0.3% 100.0%
GRAND TOTAL ������� ������ ����� ����� ������� ������ ����� ������ ����� ����� �������
WORKFORCE PROFILE FOR PEOPLE WITH DISABILITIES ONLY
MALE FEMALE FOREIGN NATIONALTOTALA C I W A C I W MALE FEMALE
Top Management2 0 0 0 0 1 0 0 0 0 3
66.7% 0.0% 0.0% 0.0% 0.0% 33.3% 0.0% 0.0% 0.0% 0.0% 100.0%
Senior Management21 2 3 7 6 0 0 1 0 0 40
52.5% 5.0% 7.5% 17.5% 15.0% 0.0% 0.0% 2.5% 0.0% 0.0% 100.0%
���������� ����� �����272 40 34 139 307 32 36 184 3 1 '"/$&
26.0% 3.8% 3.2% 13.3% 29.3% 3.1% 3.4% 17.6% 0.3% 0.1% 100.0%
Skilled 698 72 25 149 '"!/+ 75 61 371 8 6 !")($
26.1% 2.7% 0.9% 5.6% 45.2% 2.8% 2.3% 13.9% 0.3% 0.2% 100.0%
Semi-skilled 614 52 26 15 509 42 18 47 1 0 '"#!$
46.4% 3.9% 2.0% 1.1% 38.4% 3.2% 1.4% 3.5% 0.1% 0.0% 100.0%
Unskilled 271 13 4 11 224 15 2 4 0 0 544
49.8% 2.4% 0.7% 2.0% 41.2% 2.8% 0.4% 0.7% 0.0% 0.0% 100.0%
TOTAL PERMANENT'"&(& 179 92 321 !"!** 165 117 607 12 7 *")##
33.3% 3.2% 1.6% 5.7% 40.0% 2.9% 2.1% 10.8% 0.2% 0.1% 100.0%
Temporary employees58 4 1 2 57 0 2 7 2 0 133
43.6% 3.0% 0.8% 1.5% 42.9% 0.0% 1.5% 5.3% 1.5% 0.0% 100.0%
GRAND TOTAL ����� 183 93 323 ����� 165 119 614 14 7 �����

90
LOCAL GOVERNMENT
WORKFORCE PROFILE FOR ALL EMPLOYEES
MALE FEMALE FOREIGN NATIONALTOTALA C I W A C I W MALE FEMALE
Top Management552 70 49 71 265 20 14 23 1 0 '"/)*
51.8% 6.6% 4.6% 6.7% 24.9% 1.9% 1.3% 2.2% 0.1% 0.0% 100.0%
Senior Management'")'& 189 150 392 849 71 57 134 12 2 #"$($
46.6% 5.4% 4.3% 11.3% 24.4% 2.0% 1.6% 3.9% 0.3% 0.1% 100.0%
���������� ����� �����$"(*' '"'$) 341 '"*'$ #")'' 628 189 680 31 12 '!"+/#
36.8% 8.9% 2.6% 11.7% 28.0% 4.9% 1.5% 5.3% 0.2% 0.1% 100.0%
Skilled ')"!)/ *"#&! '"(+! !"+!# '#"!** #"/)# 806 '")+' 48 17 $*"!#(
35.9% 11.9% 4.0% 6.5% 29.3% 6.8% 1.8% 3.7% 0.1% 0.0% 100.0%
Semi-skilled !("'!( ("*'& '"#!# '"/&# '("*'# $")&$ 774 '"!(& 9 7 )'"#')
44.2% 12.3% 2.2% 1.8% 28.6% 7.6% 1.3% 2.1% 0.0% 0.0% 100.0%
Unskilled !+"$#) )"#&) 402 327 '*"&*/ !"!!* 133 91 8 0 *$"&*&
53.7% 11.6% 0.7% 0.6% 28.9% 4.1% 0.2% 0.2% 0.0% 0.0% 100.0%
TOTAL PERMANENT(+"($$ !/")+' $"/*( )"#'/ *'"#$# '/")+' '"+(# #"&+( 109 38 '(&"&*#
44.6% 11.6% 2.3% 3.5% 28.7% 6.0% 1.1% 2.2% 0.1% 0.0% 100.0%
Temporary employees*"'&# 889 72 99 *"')& 726 66 94 8 9 '!"#'$
42.1% 7.2% 0.6% 0.8% 42.0% 5.9% 0.5% 0.8% 0.1% 0.1% 100.0%
GRAND TOTAL ������ ������ ����� ����� ������ ������ ����� ����� 117 47 �������
WORKFORCE PROFILE FOR PEOPLE WITH DISABILITIES
ONLY
MALE FEMALE FOREIGN NATIONALTOTALA C I W A C I W MALE FEMALE
Top Management5 0 2 2 3 0 0 1 0 0 13
38.5% 0.0% 15.4% 15.4% 23.1% 0.0% 0.0% 7.7% 0.0% 0.0% 100.0%
Senior Management8 2 1 18 3 2 0 2 0 0 36
22.2% 5.6% 2.8% 50.0% 8.3% 5.6% 0.0% 5.6% 0.0% 0.0% 100.0%
���������� ����� �����46 29 5 44 20 9 2 11 0 0 166
27.7% 17.5% 3.0% 26.5% 12.0% 5.4% 1.2% 6.6% 0.0% 0.0% 100.0%
Skilled 137 104 26 96 91 68 11 58 3 2 596
23.0% 17.4% 4.4% 16.1% 15.3% 11.4% 1.8% 9.7% 0.5% 0.3% 100.0%
Semi-skilled 274 121 27 40 149 80 8 59 0 0 758
36.1% 16.0% 3.6% 5.3% 19.7% 10.6% 1.1% 7.8% 0.0% 0.0% 100.0%
Unskilled 281 115 9 7 96 28 3 3 0 0 542
51.8% 21.2% 1.7% 1.3% 17.7% 5.2% 0.6% 0.6% 0.0% 0.0% 100.0%
TOTAL PERMANENT751 371 70 207 362 187 24 134 3 2 !"'''
35.6% 17.6% 3.3% 9.8% 17.1% 8.9% 1.1% 6.3% 0.1% 0.1% 100.0%
Temporary employees41 5 0 1 34 1 2 0 0 0 84
48.8% 6.0% 0.0% 1.2% 40.5% 1.2% 2.4% 0.0% 0.0% 0.0% 100.0%
GRAND TOTAL 792 376 70 208 396 188 26 134 3 2 �����

91
PRIVATE SECTOR
WORKFORCE PROFILE FOR ALL EMPLOYEES
MALE FEMALE FOREIGN NATIONAL
TOTALA C I W A C I W MALE FEMALE
Top Management
$"$$( '"&/+ #"+&# #'"*)/ !"'(! '"/*& '")'* ("#+' '")() 269 **"+&/
7.9% 3.2% 7.1% 56.4% 3.9% 1.9% 2.9% 13.2% 3.0% 0.5% 100.0%
Senior Management
'#"$*' *"+!( +")*' *'"'*' ("#(! $"/*# *"'!& !#"(&$ #"#/& 969 '!$"(+$
10.8% 4.7% 7.7% 41.0% 5.9% 3.2% 4.1% 19.1% 2.7% 0.8% 100.0%
Professionally �� �����
)$"!$+ !!"'+/ !$"&/* '/)"//* $*"*+! '&"$)! '&"#/) )("(#$ &"*+( !"+$$ #(&"&&$
17.0% 5.9% 6.5% 28.0% 12.0% 4.9% 4.8% 17.9% 2.3% 0.8% 100.0%
Skilled #+(")') (+"/// $#"##' '*/"($& !!+"**/ ('"**) #)"+'* '!/"#)) !/")+& *"**! '"'**"##!
34.4% 6.8% 3.8% 13.0% 19.9% 6.2% 3.2% 10.4% 1.8% 0.5% 100.0%
Semi-skilled +!&")/' ''*"!'# #/")'* */"''# *&("'$( '!'"&&# #'"()( )$"#+( $+"'(# ("!'! '"+&)"'!'
46.8% 5.8% 1.5% 2.5% 29.6% 6.1% 1.6% 3.2% 2.5% 0.4% 100.0%
Unskilled **'")'! )!"/*$ *"&() &"!+& #&'"'') *+"!*/ #"*+* #"))( #)"/!! +"$/( '"'!/"&+(
49.2% 5.5% 0.5% 0.7% 34.0% 5.3% 0.3% 0.3% 3.2% 0.8% 100.0%
TOTAL PERMANENT
'"+*+"+() !&)"'+# ''&"!)' #+("&(* '"!*!"+$+ !()"!)! +("#!) !&("##+ ''+"$($ !)"#*# $"&!!"//&
40.6% 5.9% 2.5% 8.3% 26.0% 5.7% 2.0% 6.0% 2.5% 0.5% 100.0%
Temporary employees
!*!"(*/ #$"/)* $"!#* ''"(*) !$*"+$# #+"!!( #"*&$ +"'/# '*")$# ("*#$ )!#"&$/
40.5% 5.5% 0.7% 1.9% 39.4% 6.3% 0.6% 1.5% 2.5% 1.2% 100.0%
GRAND TOTAL ��������� ������� ������� ������� ��������� ������� ������� ������� ������� ������ ���������
WORKFORCE PROFILE FOR PEOPLE WITH DISABILITIES ONLY
MALE FEMALE FOREIGN NATIONALTOTALA C I W A C I W MALE FEMALE
Top Management70 40 94 355 31 31 41 88 11 1 762
9.2% 5.2% 12.3% 46.6% 4.1% 4.1% 5.4% 11.5% 1.4% 0.1% 100.0%
Senior Management120 96 148 633 73 61 72 267 20 10 '"*//
8.0% 6.4% 9.9% 42.2% 4.9% 4.1% 4.8% 17.8% 1.3% 0.7% 100.0%
���������� ����� �����445 247 288 '"#$' 293 200 203 856 36 13 #"+!!
11.3% 6.3% 7.3% 34.2% 7.5% 5.1% 5.2% 21.8% 0.9% 0.3% 100.0%
Skilled #"('( 857 522 !"'+& !"''# 799 411 '"*+' 81 29 '!"#'&
30.2% 7.0% 4.2% 17.8% 17.2% 6.5% 3.3% 12.9% 0.7% 0.2% 100.0%
Semi-skilled )"&/! '"'(' 416 901 *"/') '"!*( 391 '"/(' 340 20 '("#&*
39.1% 6.7% 2.4% 5.2% 28.9% 7.2% 2.2% 6.2% 2.0% 0.1% 100.0%
Unskilled *"$$! 735 147 297 $"$#* 646 70 95 351 23 '!"!$'
44.5% 6.0% 1.2% 2.4% 36.2% 5.3% 0.6% 0.8% 2.9% 0.2% 100.0%
TOTAL PERMANENT')"*+) #"'$) '")'* *"(!* ''"+)' !"++$ '"'&& #"+)& 839 96 $&"'!&
34.5% 6.5% 3.4% 11.9% 24.9% 6.2% 2.5% 8.2% 1.7% 0.2% 100.0%
Temporary employees!"+'' 332 79 83 #"$($ 333 63 49 42 19 ("#&*
39.4% 4.5% 1.1% 1.1% 47.0% 4.5% 0.9% 0.7% 0.6% 0.3% 100.0%
GRAND TOTAL ������ ����� ����� ����� ������ ����� ����� ����� 881 115 ������

92
STATE OWN ENTERPRISE (SOE)
WORKFORCE PROFILE FOR ALL EMPLOYEES
MALE FEMALE FOREIGN NATIONALTOTALA C I W A C I W MALE FEMALE
Top Management327 33 56 142 202 24 25 59 9 4 881
37.1% 3.7% 6.4% 16.1% 22.9% 2.7% 2.8% 6.7% 1.0% 0.5% 100.0%
Senior Management'"#'' 190 301 623 924 107 153 306 70 22 $"//(
32.7% 4.7% 7.5% 15.5% 23.1% 2.7% 3.8% 7.6% 1.7% 0.5% 100.0%
���������� ����� �����&"&+$ '"!'& '"$#* *"'#* ("/#) 813 845 '"+#& 393 151 !("&*&
31.9% 4.4% 5.2% 18.4% 25.3% 2.9% 3.0% 7.0% 1.4% 0.5% 100.0%
Skilled ##"&*! $"'(* '"&') '/"#() !*"!&/ !"*(' '"'## #")+& 167 87 &#"'**
40.7% 5.0% 2.2% 12.5% 30.4% 3.1% 1.4% 4.4% 0.2% 0.1% 100.0%
Semi-skilled ##"('' #")!* 569 '"&&( '&"#'' !"/$! 396 '"$'+ 23 39 )!"/!!
54.4% 5.8% 0.9% 3.0% 29.5% 3.3% 0.6% 2.3% 0.0% 0.1% 100.0%
Unskilled ("/&$ 656 14 54 #"&+) 251 6 17 3 4 ''"+&*
59.1% 5.5% 0.1% 0.5% 32.5% 2.1% 0.1% 0.1% 0.0% 0.0% 100.0%
TOTAL PERMANENT&*"'(+ +"&+( $"'+' '&"!'( **")$+ *"&/& !"**& ("$#( 665 307 '&+"+/&
44.9% 5.2% 2.2% 9.6% 29.3% 3.1% 1.3% 3.9% 0.4% 0.2% 100.0%
Temporary employees!"'#/ 95 20 98 '"(*) 39 20 37 15 6 $"!')
50.5% 2.3% 0.5% 2.3% 41.7% 0.9% 0.5% 0.9% 0.4% 0.1% 100.0%
GRAND TOTAL ������ ����� ����� ������ ������ ����� ����� ����� 680 313 �������
WORKFORCE PROFILE FOR PEOPLE WITH DISABILITIES ONLY
MALE FEMALE FOREIGN NATIONALTOTALA C I W A C I W MALE FEMALE
Top Management2 0 2 5 2 0 0 1 0 0 12
16.7% 0.0% 16.7% 41.7% 16.7% 0.0% 0.0% 8.3% 0.0% 0.0% 100.0%
Senior Management9 2 2 15 8 4 1 7 0 0 48
18.8% 4.2% 4.2% 31.3% 16.7% 8.3% 2.1% 14.6% 0.0% 0.0% 100.0%
���������� ����� �����109 20 18 141 66 10 10 47 3 2 426
25.6% 4.7% 4.2% 33.1% 15.5% 2.3% 2.3% 11.0% 0.7% 0.5% 100.0%
Skilled 610 68 64 483 592 56 18 157 2 1 !"/*'
29.7% 3.3% 3.1% 23.5% 28.9% 2.7% 0.9% 7.7% 0.1% 0.0% 100.0%
Semi-skilled 647 92 16 86 331 34 11 66 0 0 '"!&#
50.4% 7.2% 1.2% 6.7% 25.8% 2.7% 0.9% 5.1% 0.0% 0.0% 100.0%
Unskilled 96 8 1 7 53 6 1 2 0 0 174
55.2% 4.6% 0.6% 4.0% 30.5% 3.4% 0.6% 1.1% 0.0% 0.0% 100.0%
TOTAL PERMANENT'"$(# 190 103 737 '"/*! 110 41 280 5 3 #"++$
36.9% 4.8% 2.6% 18.5% 26.3% 2.8% 1.0% 7.0% 0.1% 0.1% 100.0%
Temporary employees17 0 0 1 11 0 0 0 0 0 29
58.6% 0.0% 0.0% 3.4% 37.9% 0.0% 0.0% 0.0% 0.0% 0.0% 100.0%
GRAND TOTAL ����� 190 103 738 ����� 110 41 280 5 3 �����

93
NON-PROFIT ORGANISATION
WORKFORCE PROFILE FOR ALL EMPLOYEES
MALE FEMALE FOREIGN NATIONALTOTALA C I W A C I W MALE FEMALE
Top Management255 72 45 319 165 45 48 244 40 24 '"!*(
20.3% 5.7% 3.6% 25.4% 13.1% 3.6% 3.8% 19.4% 3.2% 1.9% 100.0%
Senior Management'"/&! 224 151 695 724 209 137 779 112 73 $"'&)
25.8% 5.4% 3.6% 16.6% 17.3% 5.0% 3.3% 18.6% 2.7% 1.7% 100.0%
���������� ����� �����#"*!$ '"'!& 317 '"(&/ #"(#+ 992 416 !"#$' 278 209 '$"(!$
23.9% 7.7% 2.2% 12.1% 25.4% 6.7% 2.8% 15.9% 1.9% 1.4% 100.0%
Skilled '#"'&+ *"!*$ 553 #"'*& '*"**+ ("!!$ 764 *"'!+ 226 212 *'"!)&
25.7% 10.2% 1.1% 6.2% 30.3% 14.1% 1.5% 10.0% 0.4% 0.4% 100.0%
Semi-skilled '("$## *"/!( 327 '"#!+ !'")/$ ''"*+( 494 *"/'/ 184 162 )#"')(
27.6% 8.0% 0.5% 2.1% 34.2% 18.4% 0.8% 7.9% 0.3% 0.3% 100.0%
Unskilled ''"#)$ #"(($ 19 240 '#"#() $"'&' 27 353 77 74 ##"$&*
33.9% 11.3% 0.1% 0.7% 39.9% 12.5% 0.1% 1.1% 0.2% 0.2% 100.0%
TOTAL PERMANENT$)"&$( '*"$(+ '"$'! ("*!' **"')( !$"!$& '"&&) '#"&*) 917 754 ')&"/&(
27.9% 9.2% 0.8% 4.5% 32.8% 14.4% 1.1% 8.2% 0.5% 0.4% 100.0%
Temporary employees$")!+ 340 64 300 *"$!* 595 84 328 35 27 ''"&!(
39.1% 2.9% 0.5% 2.5% 45.9% 5.0% 0.7% 2.8% 0.3% 0.2% 100.0%
GRAND TOTAL ������ ������ ����� ����� ������ ������ ����� ������ 952 781 �������
WORKFORCE PROFILE FOR PEOPLE WITH DISABILITIES ONLY
MALE FEMALE FOREIGN NATIONALTOTALA C I W A C I W MALE FEMALE
Top Management0 1 2 5 1 1 0 2 1 3 16
0.0% 6.3% 12.5% 31.3% 6.3% 6.3% 0.0% 12.5% 6.3% 18.8% 100.0%
Senior Management11 3 1 17 10 1 4 11 1 0 59
18.6% 5.1% 1.7% 28.8% 16.9% 1.7% 6.8% 18.6% 1.7% 0.0% 100.0%
���������� ����� �����28 9 10 31 31 9 7 34 0 1 160
17.5% 5.6% 6.3% 19.4% 19.4% 5.6% 4.4% 21.3% 0.0% 0.6% 100.0%
Skilled 90 33 6 54 65 17 7 59 1 0 332
27.1% 9.9% 1.8% 16.3% 19.6% 5.1% 2.1% 17.8% 0.3% 0.0% 100.0%
Semi-skilled 141 25 4 94 149 40 11 76 0 1 541
26.1% 4.6% 0.7% 17.4% 27.5% 7.4% 2.0% 14.0% 0.0% 0.2% 100.0%
Unskilled 115 34 1 35 95 27 1 40 0 2 350
32.9% 9.7% 0.3% 10.0% 27.1% 7.7% 0.3% 11.4% 0.0% 0.6% 100.0%
TOTAL PERMANENT385 105 24 236 351 95 30 222 3 7 '"$*&
26.4% 7.2% 1.6% 16.2% 24.1% 6.5% 2.1% 15.2% 0.2% 0.5% 100.0%
Temporary employees10 1 1 1 11 0 0 3 0 0 27
37.0% 3.7% 3.7% 3.7% 40.7% 0.0% 0.0% 11.1% 0.0% 0.0% 100.0%
GRAND TOTAL 395 106 25 237 362 95 30 225 3 7 �����

94
APPENDIX E: WORKFORCE PROFILE OF ALL EMPLOYERS BY RACE, GENDER AND ......... DISABILITY FOR 2016 AND 2017
WORKFORCE PROFILE FOR ALL EMPLOYEES BY POPULATION GROUP AND GENDER FOR 2017
MALE FEMALE FOREIGN NATIONAL
TOTALA C I W A C I W MALE FEMALE
Top Management*"&/$ !"//' $"'$' ##"'#/ !"&&# '"'!* '"**+ &"/!$ '"()( 321 )/"(**
9.6% 3.3% 6.8% 54.5% 4.7% 1.9% 2.6% 13.2% 2.9% 0.5% 100.0%
Senior Management
!/"$+* )"&)# '/"$// **"+** ''"+$$ $"*'! *"*(* !)"$#) #"*$$ '"'*# '$)"&((
14.0% 4.7% 7.1% 38.1% 8.1% 3.1% 3.8% 18.0% 2.4% 0.8% 100.0%
Professionally �� ����� ��experienced specialists and mid-management
'!&"*&& #'"#'# #/"(## '#!")+* '#)"*)! !+"#$! !$"$)$ +("'## '!"(+$ *"!)# )!&"&&(
20.4% 5.0% 4.9% 21.1% 21.7% 4.7% 3.9% 15.4% 2.0% 0.8% 100.0%
Skilled technical and academically �� �����workers, junior management, supervisors, foremen, and superintendents
)!!"!(/ '/+"(&! *$"&*# '+*"/&! **#"!'& '/*"('& *!"##! '(+"/)( !*"!$& ("#(# '"+/$"+$#
32.7% 5.8% 2.9% 10.2% 29.0% 5.5% 2.7% 9.4% 1.3% 0.4% 100.0%
Semi-skilled and discretionary decision making
'"'!/"//$ '$*"!/' #*")+* )/"+)/ &/'"&/) '*)"!+* #)"#!+ &*"#$' *'"*!& (")*' !"*//"&'/
44.8% 5.8% 1.4% 2.4% 32.1% 6.2% 1.5% 3.4% 2.1% 0.3% 100.0%
Unskilled and ��������:�����making
)*!"&&) ()"/++ )"(() '/"!/* $*!"*'& (/"($' $"/$/ *"//( #)"#$' +"#&# '"#!#"++)
49.3% 5.7% 0.5% 0.8% 34.2% 5.3% 0.3% 0.4% 2.7% 0.7% 100.0%
TOTAL PERMANENT
!"**/"/$( #('"!*+ '$!"*+& $&&"/!( '"+*&"+#' #)("(## '!$"!++ $/'"//& '#'"!!! #'"'$$ )"*))"!)&
38.8% 5.7% 2.2% 7.4% 29.8% 5.6% 1.9% 6.1% 2.0% 0.5% 100.0%
Temporary employees
!&&"+** $'"'** *"&!' '&"*+! !&*"+/! $!"*&+ *")&# '+"&)! '("#*( ("!$$ (##"')/
39.4% 5.6% 0.8% 2.5% 39.0% 5.8% 0.8% 2.7% 2.4% 1.0% 100.0%
GRAND TOTAL ��������� ������� ������� ������� ��������� ������� ������� ������� ������� ������ ���������

95
WORKFORCE PROFILE FOR PERSONS WITH DISABILITIES FOR 2017
MALE FEMALE FOREIGN NATIONAL
TOTALA C I W A C I W MALE FEMALE
Top Management71 45 97 354 32 23 32 99 15 2 770
9.2% 5.8% 12.6% 46.0% 4.2% 3.0% 4.2% 12.9% 1.9% 0.3% 100.0%
Senior Management216 109 149 823 97 73 81 324 14 5 '"&+'
11.4% 5.8% 7.9% 43.5% 5.1% 3.9% 4.3% 17.1% 0.7% 0.3% 100.0%
���������� ����� ����� ��experienced specialists and mid-management
'"!)/ 437 436 !"*$* '"/)# 365 333 '")+! 46 19 &"'+)
15.4% 5.3% 5.3% 31.1% 13.0% 4.5% 4.1% 20.6% 0.6% 0.2% 100.0%
Skilled technical and : ��;�: ����� �����workers, junior management, supervisors, foremen, and superintendents
)"/!) '"#$+ 742 #"&#' *"&*) '"!*$ 601 #"!+( 87 36 !#"/(+
26.1% 5.8% 3.2% 16.6% 25.4% 5.4% 2.6% 14.3% 0.4% 0.2% 100.0%
Semi-skilled and discretionary decision making
&"&/* '"*&( 505 '"!*+ )"$&& '"*!( 441 '"*/( 259 22 !!"$//
39.3% 7.1% 2.3% 5.6% 29.0% 6.8% 2.0% 6.7% 1.2% 0.1% 100.0%
<��=����� ��������decision making
*"&$' 888 158 350 $"!&( 711 57 127 366 24 '!"&/+
45.6% 6.9% 1.2% 2.7% 33.5% 5.6% 0.4% 1.0% 2.9% 0.2% 100.0%
TOTAL PERMANENT!!"!'+ $"$'* !"/&( +"')! '("&!# #"+*# '"*$* ("/$) 787 108 )+"'$*
32.1% 6.4% 3.0% 13.3% 25.8% 5.7% 2.2% 10.2% 1.1% 0.2% 100.0%
Temporary employees'"('$ 253 51 109 !"/($ 237 55 71 38 15 $")'(
37.1% 5.5% 1.1% 2.4% 44.9% 5.1% 1.2% 1.5% 0.8% 0.3% 100.0%
GRAND TOTAL ������ ����� ����� ����� ������ ����� ����� ����� 825 123 ������

96
WO
RKFO
RCE
PRO
FILE
FOR
ALL E
MPL
OYEE
S BY
POPU
LATI
ON
GRO
UP A
ND
GEND
ER FO
R 20
16M
ALE
FEM
ALE
FORE
IGN
NATI
ONA
LTO
TAL
AC
IW
AC
IW
MAL
EFE
MAL
E
Top
Man
agem
ent
*"+#&
'"+#&
#"+'$
##"##
+!"(
#''"/
#*'"$
/)("(
')'"(
/)31
460
037
9.9%
3.2%
6.5%
55.5
%4.
5%1.
7%2.
3%12
.9%
2.8%
0.5%
100.
0%
Senio
r Man
agem
ent
!/"'!
!)")
&!+"+
/)**
"+!#
''"!&
($"!
$!*"'
/#!)
"'++
#"!#/
'"/'!
143 7
06
14.0
%4.
6%6.
9%38
.9%
7.9%
3.0%
3.6%
18.2
%2.
2%0.
7%10
0.0%
����
�����
� ���
��
�����
��
�>��
����:
����
�:� �
���
��;
���;
� �
�;��
'!
'"#''
#/"$$
!!&
")#!
'#'"/
(('!
*"**&
!("!/
&!'
"(*/
+'"(#
!'!
"/#*
$"*(#
594 3
18
20.4
%5.
1%4.
8%22
.1%
21.1
%4.
6%3.
7%15
.4%
2.0%
0.8%
100.
0%
�=����
��
:?��:
� �
� :
��;
�: ���
��
�����
���
=���@
B����
�; �
��;
��@
supe
rviso
rs, fo
rem
en, a
nd su
perin
tend
ents
)/(")
!&''
/"$)&
**"&+
+!/
$"!$$
*''"#
/)'/
#"$*'
*/"++
#'&
!"'*&
!*"$'
)("!
(#1 8
58 83
6
32.7
%5.
9%3.
0%11
.0%
27.5
%5.
6%2.
7%9.
8%1.
4%0.
4%10
0.0%
Sem
i-skil
led an
d di
scre
tiona
ry d
ecisi
on m
aking
'"/&&
"''#
'$!"&
/)#)
"+**
)!"*'
'($
*"&'(
'*#"(
(&#)
"&/#
&("!*
&$&
"/#)
)"&&)
2 408
963
45.2
%5.
9%1.
5%2.
6%31
.0%
6.4%
1.5%
3.6%
2.0%
0.3%
100.
0%
<��=
�����
��
����
���
�:���
��;
=���
)#'"+
)((*
"'(#
)"()&
'/"!*
*$#
#")(/
(/"/&
#$"/
+'$"+
&$#$
"*&+
&"!*&
1 279
838
49.4
%5.
9%0.
5%0.
8%33
.9%
5.5%
0.3%
0.4%
2.7%
0.6%
100.
0%
TOTA
L PER
MAN
ENT
!"$(*
"/(+
#)("*
/+'$
!"/($
$+("#
$+'"&
#/"#)
+#*
+"(+(
'!/"'
$)$/
/"/$(
'!*"/
'!!&
"#')
6 345
698
39.0
%5.
8%2.
2%7.
8%28
.8%
5.7%
1.9%
6.3%
2.0%
0.4%
100.
0%
Tem
pora
ry em
ploy
ees
#/!"#
'/$$
"###
)"'!/
'&"+/
)!+
("$*)
$$"!&
'*"&
)('&
"!##
'*"+$
')"*
'(75
9 964
39.8
%5.
8%0.
8%2.
5%39
.1%
5.8%
0.8%
2.4%
2.1%
0.9%
100.
0%
GRAN
D TO
TAL
����
����
���
����
���
����
���
����
���
����
���
����
���
����
���
����
���
����
���
����
��7
105
662

97
WO
RKFO
RCE
PRO
FILE
FOR
PERS
ONS
WIT
H DI
SABI
LITIE
S FO
R 20
16M
ALE
FEM
ALE
FORE
IGN
NATI
ONA
LTO
TAL
AC
IW
AC
IW
MAL
EFE
MAL
E
Top
Man
agem
ent
7145
9735
432
2332
9915
277
0
9.2%
5.8%
12.6
%46
.0%
4.2%
3.0%
4.2%
12.9
%1.
9%0.
3%10
0.0%
Senio
r Man
agem
ent
216
109
149
823
9773
8132
414
5'"&
+'
11.4
%5.
8%7.
9%43
.5%
5.1%
3.9%
4.3%
17.1
%0.
7%0.
3%10
0.0%
����
�����
� ���
��
�����
��
�>��
����:
����
�:� �
���
��;
���;
� �
�;��
'"!
)/43
743
6!"*
$*'"/
)#36
533
3'")
+!46
19&"'
+)
15.4
%5.
3%5.
3%31
.1%
13.0
%4.
5%4.
1%20
.6%
0.6%
0.2%
100.
0%
�=����
��
:?��:
� �
� :
��;
�: ���
��
�����
���
=���@
B����
�; �
��;
��@
supe
rviso
rs, fo
rem
en, a
nd su
perin
tend
ents
)"/!)
'"#$+
742
#"&#'
*"&*)
'"!*$
601
#"!+(
8736
!#"/(
+
26.1
%5.
8%3.
2%16
.6%
25.4
%5.
4%2.
6%14
.3%
0.4%
0.2%
100.
0%
Sem
i-skil
led an
d di
scre
tiona
ry d
ecisi
on m
aking
&"&/*
'"*&(
505
'"!*+
)"$&&
'"*!(
441
'"*/(
259
22!!
"$//
39.3
%7.
1%2.
3%5.
6%29
.0%
6.8%
2.0%
6.7%
1.2%
0.1%
100.
0%
<��=
�����
��
����
���
�:���
��;
=���
*"&$'
888
158
350
$"!&(
711
5712
736
624
'!"&/
+
45.6
%6.
9%1.
2%2.
7%33
.5%
5.6%
0.4%
1.0%
2.9%
0.2%
100.
0%
TOTA
L PER
MAN
ENT
!!"!'
+$"$
'*!"/
&(+"'
)!'(
"&!#
#"+*#
'"*$*
("/$)
787
108
)+"'$
*
32.1
%6.
4%3.
0%13
.3%
25.8
%5.
7%2.
2%10
.2%
1.1%
0.2%
100.
0%
Tem
pora
ry em
ploy
ees
'"('$
253
5110
9!"/
($23
755
7138
15$")
'(
37.1
%5.
5%1.
1%2.
4%44
.9%
5.1%
1.2%
1.5%
0.8%
0.3%
100.
0%
GRAN
D TO
TAL
����
����
���
����
���
���
����
����
���
����
���
���
825
123
����
��

98
APP
END
IX F
: D
ESCR
IPTI
ON
OF
THE
SIX
OCC
UPA
TIO
NA
L LE
VEL
S A
PPEN
DIX
E: G
UID
ELIN
ES
(EEA
9)
OCC
UPAT
IONA
LPA
TTER
SON
CLAS
SIC
(LEV
ELS)
PATT
ERSO
N M
ODE
RN(B
ANDS
)RE
MEA
SURE
© (P
OIN
TS)
HAY
UNIT
S©
(PO
INTS
)HA
Y DE
CISI
ON
TREE
(©
POIN
TS)
PERO
MNE
S©
(PO
INTS
)TA
SK ©
(L
EVEL
S)JE
ASY
©(L
EVEL
S)
DESC
RIPT
ION
Top
Man
agem
ent/
Exec
utive
s
F+1 –
F+5
G Ba
nd
300-
349
3581
-716
01+
+
Cont
rols
the f
uncti
onal
integ
ratio
n of t
he b
usine
ss. D
eter
mine
s the
ov
erall
stra
tegy
and
objec
tives
of t
he b
usine
ss. D
irects
the c
ompa
ny
into
the f
utur
e. Th
e nat
ure o
f the
wor
k and
focu
s is l
ong-
term
. Sig
n-of
f on p
olicy
or s
trate
gyF1
– F5
F Low
er-F
Up
per
250-
299
1801
-358
022
5-27
51 t
o 1+
23-2
66a
-6e
Senio
r M
anag
emen
tE1
-E5
E Lo
wer-E
Up
per
200-
249
735-
1800
175-
224
4-2
18-2
25a
-5e
Know
ledge
of e
ntire
bus
iness
area
/BU/
com
pany
or g
roup
. Pro
vide
����
����
Q���;
��
����
�?�
�V�
� ���
�� �
�� ��
� ��
� �
��X
Trans
lates
the o
vera
ll stra
tegy
into
bus
iness
plan
s for
BU/
Func
tiona
l Un
it, th
ereb
y ope
ratio
naliz
ing o
rgan
izatio
nal s
trate
gy. Im
plem
ents
and
man
ages
bus
iness
plan
, goa
ls an
d ob
jectiv
es an
d en
sure
s the
:
?��V
�;��
���
V��
��=��
���
���
���
�QY<Q
[��:
���
���
���X
M
anag
es th
e dev
elopm
ent o
f inno
vatio
n and
chan
ge
Prof
essio
nally
\
� ���
�� �
�ex
perie
nced
sp
ecial
ists/m
id-
man
agem
ent
D1-D
5D
Lowe
r-D
Uppe
r15
0-19
937
1-73
412
5-17
47-
414
-18
4a-4
e
Prof
essio
nal k
nowl
edge
of s
ub-d
iscip
line o
r disc
iplin
e. Pr
ovid
e ���
���
?��
��;
��
����
����
���
���
�Q[��
:���
�<�
�]��
�����
pl
ans.
Form
ulat
e and
impl
emen
t dep
artm
enta
l/tea
m p
lans t
hat w
ill ��
����
?�
Y<
]����
����
� ��X
��
�;��
����
����
���:
��^�
� �:
��@
peop
le, m
ater
ial, in
form
atio
n and
tech
nolo
gy) t
o ac
hiev
e give
n ob
jectiv
es in
mos
t pro
ducti
ve an
d co
st ef
fecti
ve w
ay.
Skille
d Te
chnic
al an
d Ac
adem
ically
\
� ���
��Q`
����
�M
anag
emen
t/Su
perv
isors/
Fore
men
/Su
perin
tend
ents
C1-C
5C
Lowe
r-C
Uppe
r10
0-14
919
2-37
075
-124
11-7
9-13
3a-3
e
Appl
ies b
road
know
ledge
of p
rodu
cts, te
chniq
ues a
nd p
roce
sses
. Ev
aluat
es p
roce
dure
s and
appl
ies p
revio
us ex
perie
nce.
A go
od
solu
tion c
an us
ually
be f
ound
. Det
erm
ines o
wn p
riorit
ies. W
hat h
as
to b
e don
e is s
tipul
ated
; but
may
requ
ire in
itiativ
e in t
erm
s of h
ow it
shou
ld b
e don
e
Sem
i-Skil
led an
d di
scre
tiona
ryde
cisio
n-m
aking
B1-B
5B
Lowe
r-B
Uppe
r50
-99
85-1
9125
-74
15-1
14-
82a
-2e
Acco
unta
ble f
or d
irect
prod
uct, p
roce
ss o
r ser
vice q
uality
. In
crem
enta
l impr
ovem
ent o
f exis
ting
proc
esse
s and
pro
cedu
res
acco
rding
to cl
ear g
uideli
nes.
Choo
sing
of co
rrect
actio
n on t
he
basis
of s
et st
anda
rds,
traini
ng p
roce
dure
s and
pas
t exp
erien
ce
Unsk
illed
and
����
���
�:���
���
mak
ingA1
-A3
A20
-49
54-8
40-
2419
-16
1-3
1a-1
c�
���
� :
:�;
����?
���
=���
��:�
����
��:
�� ���
���
���
��
unde
rstoo
d. Ta
sks a
re so
met
imes
repe
titive
and
unco
mpl
icate
d an
d th
e wor
k cyc
le is
shor
t

9999
SCHEDULE 4
Turnover threshold applicable to designated employers
SECTOR OR SUBSECTORS IN ACCORDANCE WITH THE STANDARD INDUSTRIAL CLASSIFICATION TOTAL ANNUAL TURNOVER
Agriculture R6.00m
Mining and Quarrying R22.50m
Manufacturing R30.00m
Electricity, Gas and Water R30.00m
Construction R15.00m
Retail and Motor Trade and Repair Services R45.00m
Wholesale Trade, Commercial Agents and Allied Services R75.00m
Catering, Accommodation and other Trade R15.00m
Transport, Storage and Communications R30.00m
Finance and Business Services R30.00m
Community, Social and Personal Services R15.00m

100
NOTES

101

TRANSFORMATION MAKES BUSINESS SENSE
CEE
RP NumberRP135/2019
ISBN Number 978-0-621-47368-1