1996 STATISTICS - National Football League...1996 STATISTICS PASSING ATT COMP YARDS COMP% YDS/ATT TD...
54
BALTIMORERAVENS.COM 349 1996 STATISTICS RESULTS AND ATTENDANCE WON 4, LOST 12 09/01 W 19-14 Oakland 64,124 09/08 L 17-31 at Pittsburgh 57,241 09/15 L 13-29 at Houston 20,082 09/22 Bye Week 09/29 W 17-10 New Orleans 61,063 10/06 L 38-46 New England 63,569 10/13 L 21-26 at Indianapolis 56,978 10/20 L 34-45 at Denver 70,453 10/27 W 37-31 (OT) St. Louis 60,256 11/03 L 21-24 Cincinnati 60,743 11/10 L 27-30 at Jacksonville 64,628 11/17 L 20-38 at San Francisco 51,596 11/24 L 25-28 (OT) Jacksonville 57,384 12/01 W 31-17 Pittsburgh 51,822 12/08 L 14-21 at Cincinnati 43,022 12/15 L 16-27 at Carolina 70,075 12/22 L 21-24 Houston 52,704 TEAM STATISTICS RAVENS OPPONENT TOTAL FIRST DOWNS 338 351 Rushing 108 115 Passing 208 213 Penalty 22 23 3rd Down: Made/Att 88/201 108/224 3rd Down Pct. 43.8 48.2 4th Down: Made/Att 4/10 7/13 4th Down Pct. 40.0 53.8 TOTAL NET YARDS 5723 5889 Avg. Per Game 357.7 368.1 Total Plays 1024 1075 Avg. Per Play 5.6 5.5 NET YARDS RUSHING 1745 1920 Avg. Per Game 109.1 120.0 Total Rushes 416 508 NET YARDS PASSING 3978 3969 Avg. Per Game 248.6 248.1 Sacked/Yards Lost 38/296 30/146 Gross Yards 4274 4115 Att./Completions 570/335 537/350 Completion Pct. 58.8 65.2 Had Intercepted 20 15 PUNTS/AVERAGE 69/43.2 68/42.4 NET PUNTING AVG. 37.8 35.6 PENALTIES/YARDS 94/818 104/744 FUMBLES/BALL LOST 23/13 23/7 TOUCHDOWNS 45 50 Rushing 10 18 Passing 34 27 Returns 1 5 SCORE BY PERIODS 1 2 3 4 OT PTS RAVENS 70 129 64 102 6 371 Opponents 88 128 92 130 3 441 SCORING R P KR DR PAT FG 2R 2P S TP Stover 0 0 0 0 34/35 19/25 0 0 0 91 Jackson 0 14 0 0 0/0 0/0 0 2 0 88 Alexander 0 9 0 0 0/0 0/0 0 1 0 56 Byner 4 1 0 0 0/0 0/0 0 0 0 30 Morris 4 1 0 0 0/0 0/0 0 0 0 30 Testaverde 2 0 0 0 0/0 0/0 1 0 0 14 Turner 0 2 0 0 0/0 0/0 0 0 0 12 Arvie 0 1 0 0 0/0 0/0 0 0 0 6 Caldwell 0 0 0 1 0/0 0/0 0 0 0 6 Green 0 1 0 0 0/0 0/0 0 0 0 6 Jones 0 1 0 0 0/0 0/0 0 0 0 6 Kinchen 0 1 0 0 0/0 0/0 0 0 0 6 Lewis 0 1 0 0 0/0 0/0 0 0 0 6 Ogden 0 1 0 0 0/0 0/0 0 0 0 6 Williams 0 1 0 0 0/0 0/0 0 0 0 6 Gardner 0 0 0 0 0/0 0/0 1 0 0 2 RAVENS 10 34 0 1 34/35 19/25 2 3 0 371 Opponents 18 27 0 5 41/41 28/31 3 4 1 441 2-PT. CONVERSIONS: RAVENS 5-9; Opponents 7-9 SACKS: Caldwell 4.5, Pleasant 4.0, Croel 3.0, Burnett 3.0, Williams 3.0, Thompson 3.0, Goad 3.0, Lewis 2.5, Fortune 1.0, Jones 1.0, Lyle 1.0, Brady 0.5, Footman 0.5, RAVENS 30.0; Opponents: 38.0 RUSHING NO YDS AVG LG TD Morris 172 737 4.3 19 4 Byner 159 634 4.0 42 4 Testaverde 34 188 5.5 22 2 Gardner 26 108 4.2 19 0 Hoard 15 61 4.1 10 0 Turner 2 12 6.0 6 0 Zeier 2 8 4.0 5 0 Hunter 1 0 0.0 0 0 Montgomery 1 0 0.0 0 0 Alexander 3 0 0.0 12 0 Lewis 1 -3 -3.0 -3 0 RAVENS 416 1745 4.2 42 10 Opponents 508 1920 3.8 71t 18 RECEIVING NO YDS AVG LG TD Jackson 76 1201 15.8 86t 14 Alexander 62 1099 17.7 64t 9 Kinchen 55 581 10.6 29 1 Turner 38 461 12.1 27t 2 Byner 30 270 9.0 40 1 Morris 25 242 9.7 52t 1 Green 15 150 10.0 23 1 Williams 13 85 6.5 19 1 Gardner 7 28 4.0 7 0 Lewis 5 78 15.6 24 1 Ethridge 2 24 12.0 15 0 Bishop 2 22 11.0 13 0 Hunter 1 25 25.0 25 0 Hoard 1 4 4.0 4 0 Jones 1 2 2.0 2t 1 Ogden 1 1 1.0 1t 1 Arvie 1 1 1.0 1t 1 RAVENS 335 4274 12.8 86t 34 Opponents 350 4115 11.8 55 27 INTERCEPTIONS NO YDS AVG LG TD Langham 5 59 11.8 28 0 Turner 5 1 0.2 1 0 Caldwell 1 45 45.0 45t 1 Adams 1 16 16.0 16 0 Croel 1 16 16.0 16 0 Moore 1 10 10.0 10 0 Lewis 1 0 0.0 0 0 RAVENS 15 147 9.8 45t 1 Opponents 20 349 17.5 68t 3 PUNTING NO YDS AVG TB IN LG BLK Montgomery 68 2980 43.8 5 23 67 1 Team 1 0 0.0 0 0 0 0 RAVENS 69 2980 43.2 5 23 67 1 Opponents 68 2881 42.4 5 27 64 0 PUNT RETURNS RET FC YDS AVG LG TD Lewis 36 13 339 9.4 46 0 Alexander 1 0 15 15.0 15 0 Ethridge 1 0 3 3.0 3 0 Hunter 0 1 0 - 0 0 RAVENS 38 14 357 9.4 46 0 Opponents 27 14 273 10.1 47 0 KICKOFF RETURNS NO YDS AVG LG TD Lewis 41 883 21.5 44 0 Baldwin 20 405 20.3 34 0 Hunter 9 178 19.8 29 0 Ethridge 8 171 21.4 29 0 Byner 4 61 15.3 19 0 Kinchen 1 19 19.0 19 0 Alexander 1 13 13.0 13 0 Morris 1 3 3.0 3 0 Isaia 1 2 2.0 2 0 Frederick 0 -1 0.0 -1 0 RAVENS 86 1734 20.2 44 0 Opponents 70 1402 20.0 51 0 FIELD GOALS 1-19 20-29 30-39 40-49 50+ Stover 0/0 8/8 5/6 5/10 1/1 RAVENS 0/0 8/8 5/6 5/10 1/1 Opponents 0/0 11/11 10/11 5/7 2/2 Stover: (25,37); (29); (); (38,48SH,49WL); (); (); (45,33); (43WL,50,32WL); (); (21,21); (43,25); (21,29,41,33,49WR); (40); (45SH); (37,46,25); () Opponents: (); (35); (41,44); (23,38WL); (22,35,50); (27,30);(34); (50,38,36); (41,49,34); (23,33,24); (27); (29,41WL,34); (22); (49SH,23,26); (29,44); (37) PASSING ATT COMP YARDS COMP% YDS/ATT TD TD% INT INT% LG SACK/LOST RATING Testaverde 549 325 4177 59.2 7.61 33 6.0 19 3.5 86t 34/270 88.7 Zeier 21 10 97 47.6 4.62 1 4.8 1 4.8 15 4/26 57.0 RAVENS 570 335 4274 58.8 7.50 34 6.0 20 3.5 86t 38/296 87.6 Opponents 537 350 4115 65.2 7.66 27 5.0 15 2.8 55 30/146 93.4
Transcript of 1996 STATISTICS - National Football League...1996 STATISTICS PASSING ATT COMP YARDS COMP% YDS/ATT TD...

BALTIMORERAVENS.COM 349
1996 STATISTICS
GAM
E D
AY
RECORDS
HIS
TORY
2010
REVIE
W
PLAYERS
ORGANIZ
ATIO
N
329BALTIMORERAVENS.COM
RESULTS AND ATTENDANCEWON 4, LOST 1209/01 W 19-14 Oakland 64,12409/08 L 17-31 at Pittsburgh 57,24109/15 L 13-29 at Houston 20,08209/22 Bye Week09/29 W 17-10 New Orleans 61,06310/06 L 38-46 New England 63,56910/13 L 21-26 at Indianapolis 56,97810/20 L 34-45 at Denver 70,45310/27 W 37-31 (OT) St. Louis 60,25611/03 L 21-24 Cincinnati 60,74311/10 L 27-30 at Jacksonville 64,62811/17 L 20-38 at San Francisco 51,59611/24 L 25-28 (OT) Jacksonville 57,38412/01 W 31-17 Pittsburgh 51,82212/08 L 14-21 at Cincinnati 43,02212/15 L 16-27 at Carolina 70,07512/22 L 21-24 Houston 52,704
TEAM STATISTICS RAVENS OPPONENTTOTAL FIRST DOWNS 338 351 Rushing 108 115 Passing 208 213 Penalty 22 23 3rd Down: Made/Att 88/201 108/224 3rd Down Pct. 43.8 48.2 4th Down: Made/Att 4/10 7/13 4th Down Pct. 40.0 53.8TOTAL NET YARDS 5723 5889 Avg. Per Game 357.7 368.1 Total Plays 1024 1075 Avg. Per Play 5.6 5.5NET YARDS RUSHING 1745 1920 Avg. Per Game 109.1 120.0 Total Rushes 416 508NET YARDS PASSING 3978 3969 Avg. Per Game 248.6 248.1 Sacked/Yards Lost 38/296 30/146 Gross Yards 4274 4115 Att./Completions 570/335 537/350 Completion Pct. 58.8 65.2 Had Intercepted 20 15PUNTS/AVERAGE 69/43.2 68/42.4NET PUNTING AVG. 37.8 35.6PENALTIES/YARDS 94/818 104/744FUMBLES/BALL LOST 23/13 23/7TOUCHDOWNS 45 50 Rushing 10 18 Passing 34 27 Returns 1 5
SCORE BY PERIODS 1 2 3 4 OT PTSRAVENS 70 129 64 102 6 371Opponents 88 128 92 130 3 441
SCORING R P KR DR PAT FG 2R 2P S TPStover 0 0 0 0 34/35 19/25 0 0 0 91Jackson 0 14 0 0 0/0 0/0 0 2 0 88Alexander 0 9 0 0 0/0 0/0 0 1 0 56Byner 4 1 0 0 0/0 0/0 0 0 0 30Morris 4 1 0 0 0/0 0/0 0 0 0 30Testaverde 2 0 0 0 0/0 0/0 1 0 0 14Turner 0 2 0 0 0/0 0/0 0 0 0 12Arvie 0 1 0 0 0/0 0/0 0 0 0 6Caldwell 0 0 0 1 0/0 0/0 0 0 0 6Green 0 1 0 0 0/0 0/0 0 0 0 6Jones 0 1 0 0 0/0 0/0 0 0 0 6Kinchen 0 1 0 0 0/0 0/0 0 0 0 6Lewis 0 1 0 0 0/0 0/0 0 0 0 6Ogden 0 1 0 0 0/0 0/0 0 0 0 6Williams 0 1 0 0 0/0 0/0 0 0 0 6Gardner 0 0 0 0 0/0 0/0 1 0 0 2RAVENS 10 34 0 1 34/35 19/25 2 3 0 371Opponents 18 27 0 5 41/41 28/31 3 4 1 441
2-PT. CONVERSIONS: RAVENS 5-9; Opponents 7-9
SACKS: Caldwell 4.5, Pleasant 4.0, Croel 3.0, Burnett 3.0, Williams 3.0, Thompson 3.0, Goad 3.0, Lewis 2.5, Fortune 1.0, Jones 1.0, Lyle 1.0, Brady 0.5, Footman 0.5, RAVENS 30.0; Opponents: 38.0
RUSHING NO YDS AVG LG TDMorris 172 737 4.3 19 4Byner 159 634 4.0 42 4Testaverde 34 188 5.5 22 2Gardner 26 108 4.2 19 0Hoard 15 61 4.1 10 0Turner 2 12 6.0 6 0Zeier 2 8 4.0 5 0Hunter 1 0 0.0 0 0Montgomery 1 0 0.0 0 0Alexander 3 0 0.0 12 0Lewis 1 -3 -3.0 -3 0RAVENS 416 1745 4.2 42 10Opponents 508 1920 3.8 71t 18
RECEIVING NO YDS AVG LG TDJackson 76 1201 15.8 86t 14Alexander 62 1099 17.7 64t 9Kinchen 55 581 10.6 29 1Turner 38 461 12.1 27t 2Byner 30 270 9.0 40 1Morris 25 242 9.7 52t 1Green 15 150 10.0 23 1Williams 13 85 6.5 19 1Gardner 7 28 4.0 7 0Lewis 5 78 15.6 24 1Ethridge 2 24 12.0 15 0Bishop 2 22 11.0 13 0Hunter 1 25 25.0 25 0Hoard 1 4 4.0 4 0Jones 1 2 2.0 2t 1Ogden 1 1 1.0 1t 1Arvie 1 1 1.0 1t 1RAVENS 335 4274 12.8 86t 34Opponents 350 4115 11.8 55 27
INTERCEPTIONS NO YDS AVG LG TDLangham 5 59 11.8 28 0Turner 5 1 0.2 1 0Caldwell 1 45 45.0 45t 1Adams 1 16 16.0 16 0Croel 1 16 16.0 16 0Moore 1 10 10.0 10 0Lewis 1 0 0.0 0 0RAVENS 15 147 9.8 45t 1Opponents 20 349 17.5 68t 3
PUNTING NO YDS AVG TB IN LG BLKMontgomery 68 2980 43.8 5 23 67 1Team 1 0 0.0 0 0 0 0RAVENS 69 2980 43.2 5 23 67 1Opponents 68 2881 42.4 5 27 64 0
PUNT RETURNS RET FC YDS AVG LG TDLewis 36 13 339 9.4 46 0Alexander 1 0 15 15.0 15 0Ethridge 1 0 3 3.0 3 0Hunter 0 1 0 - 0 0RAVENS 38 14 357 9.4 46 0Opponents 27 14 273 10.1 47 0
KICKOFF RETURNS NO YDS AVG LG TDLewis 41 883 21.5 44 0Baldwin 20 405 20.3 34 0Hunter 9 178 19.8 29 0Ethridge 8 171 21.4 29 0Byner 4 61 15.3 19 0Kinchen 1 19 19.0 19 0Alexander 1 13 13.0 13 0Morris 1 3 3.0 3 0Isaia 1 2 2.0 2 0Frederick 0 -1 0.0 -1 0RAVENS 86 1734 20.2 44 0Opponents 70 1402 20.0 51 0
FIELD GOALS 1-19 20-29 30-39 40-49 50+Stover 0/0 8/8 5/6 5/10 1/1RAVENS 0/0 8/8 5/6 5/10 1/1Opponents 0/0 11/11 10/11 5/7 2/2
Stover: (25,37); (29); (); (38,48SH,49WL); (); (); (45,33); (43WL,50,32WL); (); (21,21); (43,25); (21,29,41,33,49WR); (40); (45SH); (37,46,25); ()
Opponents: (); (35); (41,44); (23,38WL); (22,35,50); (27,30);(34); (50,38,36); (41,49,34); (23,33,24); (27); (29,41WL,34); (22); (49SH,23,26); (29,44); (37)
1996 STATISTICS
PASSING ATT COMP YARDS COMP% YDS/ATT TD TD% INT INT% LG SACK/LOST RATINGTestaverde 549 325 4177 59.2 7.61 33 6.0 19 3.5 86t 34/270 88.7Zeier 21 10 97 47.6 4.62 1 4.8 1 4.8 15 4/26 57.0RAVENS 570 335 4274 58.8 7.50 34 6.0 20 3.5 86t 38/296 87.6Opponents 537 350 4115 65.2 7.66 27 5.0 15 2.8 55 30/146 93.4

2019 BALTIMORE RAVENS MEDIA GUIDE350
1996 STATISTICS
ORGANIZ
ATIO
N P
LAYERS 20
10 R
EVIE
W H
ISTORY R
ECORDS G
AM
E D
AY
330 BALTIMORE RAVENS FAN & MEDIA GUIDE 2011
PLAYER TT SOLO AS SACKS YDS PD FR FF INTLewis, Ray 142 104 38 2.5 8.5 6 0 0 1Turner, Eric 112 80 32 0.0 0.0 15 0 0 5Moore, Stevon 108 78 30 0.0 0.0 5 1 0 1Croel, Mike 81 56 25 3.0 11.0 1 0 2 1Caldwell, Mike 76 49 27 4.5 35.5 3 0 1 1Brady, Donny 66 53 13 0.5 4.5 10 1 0 0Jones, James 59 37 22 1.0 5.0 3 0 1 0Langham, Antonio 47 39 8 0.0 0.0 21 0 0 5Goganious, Keith 47 33 14 0.0 0.0 0 0 0 0Sutter, Ed 46 25 21 0.0 0.0 2 0 0 0Williams, Jerrol 43 30 13 3.0 8.0 0 1 2 0Goad, Tim 42 29 13 3.0 19.0 1 0 0 0Frederick, Mike 37 23 14 0.0 0.0 1 0 0 0Pleasant, Anthony 33 28 5 4.0 23.0 1 1 0 0Footman, Dan 32 22 10 0.5 1.5 1 0 2 0Adams, Vashone 29 23 6 0.0 0.0 4 0 0 1Burnett, Rob 29 20 9 3.0 17.0 0 0 1 0Jenkins, Deron 24 19 5 0.0 0.0 2 1 1 0Booth, Issac 18 15 3 0.0 0.0 6 0 0 0Fortune, Elliott 16 11 5 1.0 4.0 0 0 0 0Thompson, Bennie 15 10 5 3.0 5.0 2 0 0 0Lyle, Rick 12 7 5 1.0 4.0 0 0 0 0Brew, Dorian 4 4 0 0.0 0.0 0 0 0 0Turner, Floyd 0 0 0 0.0 0.0 0 0 1 0Powell, Craig 0 0 0 0.0 0.0 0 0 0 0
OFFENSE WR1 81 Michael Jackson WR2 82 Derrick Alexander LT 66 Tony Jones LG 75 Jonathan Ogden C 61 Steve Everitt 63 Wally Williams RG 69 Jeff Blackshear 63 Wally Williams RT 77 Orlando Brown TE 88 Brian Kinchen QB 12 Vinny Testaverde RB 33 Bam Morris 21 Earnest Byner FB 35 Carwell Gardner
DEFENSE LDE 90 Rob Burnett NT 97 James Jones RDE 99 Anthony Pleasant LOLB 51 Mike Croel LILB 52 Ray Lewis RILB 56 Mike Caldwell ROLB 57 Jerrol Williams 50 Keith Goganious LCB 38 Antonio Langham RCB 24 Donny Brady SS 27 Stevon Moore FS 29 Eric Turner
PLAYER TT SOLO AS FR FF BK
Thompson, Bennie 15 10 5 0 0 0Gardner, Carwell 13 8 5 0 0 0Sutter, Ed 11 8 3 1 0 0Adams, Vashone 11 6 5 0 0 0Jenkins, Deron 10 7 3 0 2 0Goganious, Keith 10 6 4 0 0 0Powell, Craig 8 7 1 0 0 0Langham, Antonio 7 4 3 0 1 0Clark, Sedric 6 5 1 0 0 0Kinchen, Brian 6 3 3 0 0 0Booth, Issac 5 4 1 0 0 0Daniels, Dexter 5 3 2 0 0 0Williams, Jerrol 5 2 3 0 0 0Byner, Earnest 4 4 0 0 0 0Dowden, Corey 4 2 2 0 0 0Brady, Donny 3 3 0 0 0 0Brew, Dorian 3 2 1 0 0 0Ethridge, Ray 2 2 0 1 0 0Lewis, Jermaine 2 2 0 0 0 0Baldwin, Randy 2 2 0 0 0 0Hartley, Frank 2 1 1 0 0 0Stover, Matt 1 1 0 0 0 0Lewis, Ray 1 1 0 0 0 0Moore, Stevon 1 0 1 0 0 0
Ted Marchibroda, Head Coach; Kirk Ferentz, Assistant Head Coach-
Offense; Marvin Lewis, Defensive Coordinator; Maxie Baughan,
Linebackers; Jacob Burney, Defensive Line; Pat Hill, Tight Ends/
Offensive Line; Al Lavan, Running Backs; Scott O’Brien, Special
Teams; Alvin Reynolds, Secondary; Mike Sheppard, Wide Receivers;
Jerry Simmons, Strength and Conditioning; Don Strock, Quarterbacks;
Eric Mangini, Quality Control/Offense; Jim Schwartz, Quality Control/
Defense; John Settle, Quality Control/Special Teams
SOLO SACKS FF FR PD 104 Ray Lewis 4.5 Mike Caldwell 2 Mike Croel 1 5 players tied 21 Antonio Langham 80 Eric Turner 4 Anthony Pleasant 2 Dan Footman 15 Eric Turner 78 Stevon Moore 5 3 players tied 2 Jerrol Williams 10 Donny Brady
Pro Bowl: S Eric Turner (2nd alternate, started); QB Vinny Testaverde (3rd QB)
All-Pro: LG Jonathan Ogden (SI, The Dallas Morning News)
Ravens Roost Unsung Hero: RB Earnest Byner
Ravens Roost Extra Effort Award: TE Brian Kinchen
Ed Block Courage Award: DE Anthony Pleasant
Record . . . . . . . . . . . . . . . . . . . . . . . . . . . . . . . . . . . . . . . . . . . . . . 4-12
vs. AFC Central . . . . . . . . . . . . . . . . . . . . . . . . . . . . . . . . . . . . . . . . 1-7
vs. AFC . . . . . . . . . . . . . . . . . . . . . . . . . . . . . . . . . . . . . . . . . . . . . 2-10
vs. NFC. . . . . . . . . . . . . . . . . . . . . . . . . . . . . . . . . . . . . . . . . . . . . . . 2-2
Home . . . . . . . . . . . . . . . . . . . . . . . . . . . . . . . . . . . . . . . . . . . . . . . . 4-4
Away . . . . . . . . . . . . . . . . . . . . . . . . . . . . . . . . . . . . . . . . . . . . . . . . . 0-8
On Grass . . . . . . . . . . . . . . . . . . . . . . . . . . . . . . . . . . . . . . . . . . . . . 4-8
Artificial Turf . . . . . . . . . . . . . . . . . . . . . . . . . . . . . . . . . . . . . . . . . . . 0-4
Outdoors. . . . . . . . . . . . . . . . . . . . . . . . . . . . . . . . . . . . . . . . . . . . . 4-10
Indoors . . . . . . . . . . . . . . . . . . . . . . . . . . . . . . . . . . . . . . . . . . . . . . . 0-2
Leading at Halftime. . . . . . . . . . . . . . . . . . . . . . . . . . . . . . . . . . . . . . 2-4
Trailing at Halftime . . . . . . . . . . . . . . . . . . . . . . . . . . . . . . . . . . . . . . 2-8
Leading After 3 Quarters. . . . . . . . . . . . . . . . . . . . . . . . . . . . . . . . . . 2-4
Trailing After 3 Quarters . . . . . . . . . . . . . . . . . . . . . . . . . . . . . . . . . . 2-8
Winning Coin Toss . . . . . . . . . . . . . . . . . . . . . . . . . . . . . . . . . . . . . . 2-6
Losing Coin Toss . . . . . . . . . . . . . . . . . . . . . . . . . . . . . . . . . . . . . . . 2-6
Decided by 7 Points or Less . . . . . . . . . . . . . . . . . . . . . . . . . . . . . . . 3-6
Decided by 3 Points or Less . . . . . . . . . . . . . . . . . . . . . . . . . . . . . . . 0-4
When Scoring First . . . . . . . . . . . . . . . . . . . . . . . . . . . . . . . . . . . . . . 3-5
When Not Scoring First. . . . . . . . . . . . . . . . . . . . . . . . . . . . . . . . . . . 1-7
Overtime. . . . . . . . . . . . . . . . . . . . . . . . . . . . . . . . . . . . . . . . . . . . . . 1-1
Preseason. . . . . . . . . . . . . . . . . . . . . . . . . . . . . . . . . . . . . . . . . . . . . 3-1
DEFENSIVE SPECIAL TEAMS
TOP THREE
SEASON TRENDS
USUAL STARTERS COACHES
RAVENS HONOR ROLL
FROM COACHES VIDEO FROM COACHES VIDEO

BALTIMORERAVENS.COM 351
1997 STATISTICS
GAM
E D
AY
RECORDS
HIS
TORY
2010
REVIE
W
PLAYERS
ORGANIZ
ATIO
N
331BALTIMORERAVENS.COM
1997 STATISTICS
RESULTS AND ATTENDANCEWON 6, LOST 9, TIED 108/31 L 27-28 Jacksonville 61,01809/07 W 23-10 Cincinnati 52,96809/14 W 24-23 at New York 69,76809/21 W 36-10 at Tennessee 17,73709/28 L 17-21 at San Diego 54,09410/05 L 34-42 Pittsburgh 64,42110/12 Bye Week10/19 L 13-24 Miami 64,35410/26 W 20-17 at Washington 75,06711/02 L 16-19 (OT) at New York Jets 77,71611/09 L 0-37 at Pittsburgh 56,66911/16 T 10-10 (OT) Philadelphia 63,54611/23 L 13-16 Arizona 53,97611/30 L 27-29 at Jacksonville 63,71212/07 W 31-24 Seattle 54,39512/14 W 21-19 Tennessee 60,55812/21 L 14-16 at Cincinnati 50,917
TEAM STATISTICS RAVENS OPPONENTTOTAL FIRST DOWNS 292 306 Rushing 99 101 Passing 176 180 Penalty 17 25 3rd Down: Made/Att 82/227 94/233 3rd Down Pct. 36.1 40.3 4th Down: Made/Att 12/21 7/14 4th Down Pct. 57.1 50.0TOTAL NET YARDS 5291 5363 Avg. Per Game 330.7 335.2 Total Plays 1043 1068 Avg. Per Play 5.1 5.0NET YARDS RUSHING 1589 1690 Avg. Per Game 99.3 105.6 Total Rushes 420 470NET YARDS PASSING 3702 3673 Avg. Per Game 231.4 229.6 Sacked/Yards Lost 37/227 42/293 Gross Yards 3929 3966 Att./Completions 586/338 556/332 Completion Pct. 57.7 59.7 Had Intercepted 16 17PUNTS/AVERAGE 83/42.7 82/44.0NET PUNTING AVG. 36.6 35.5PENALTIES/YARDS 101/777 106/822FUMBLES/BALL LOST 37/17 23/11TOUCHDOWNS 35 39 Rushing 7 17 Passing 25 20 Returns 3 2
SCORE BY PERIODS 1 2 3 4 OT PTSRAVENS 67 98 58 103 0 326 Opponents 89 92 81 80 3 345
SCORING R P KR DR PAT FG 2R 2P S TPStover 0 0 0 0 32/32 26/34 0 0 0 110Alexander 0 9 0 0 0/0 0/0 0 0 0 54Lewis 0 6 2 0 0/0 0/0 0 0 0 48Green 0 5 0 0 0/0 0/0 0 0 0 30Jackson 0 4 0 0 0/0 0/0 0 1 0 26Morris 4 0 0 0 0/0 0/0 0 0 0 24Graham 2 0 0 0 0/0 0/0 0 0 0 12Cotton 1 0 0 0 0/0 0/0 0 0 0 6Kinchen 0 1 0 0 0/0 0/0 0 0 0 6Langham 0 0 0 1 0/0 0/0 0 0 0 6Byner 0 0 0 0 0/0 0/0 0 1 0 2Team Stat 0 0 0 0 0/0 0/0 0 0 1 2RAVENS 7 25 2 1 32/32 26/34 0 2 1 326Opponents 17 20 1 1 33/35 24/34 1 1 1 345
2-PT. CONVERSIONS: RAVENS 2-3; OPPONENTS 2-4
SACKS: Boulware 11.5, McCrary 9.0, Jones 6.0, Burnett 4.0, Lewis 4.0, Sharper 3.0, Washington 2.0, Herring 1.0, Langham 1.0, Brown 0.5 RAVENS 42.0; Opponents: 37.0
RUSHING NO YDS AVG LG TDMorris 204 774 3.8 25 4Byner 84 313 3.7 19 0Graham 81 299 3.7 19 2Testaverde 34 138 4.1 16 0Lewis 3 35 11.7 24 0Zeier 10 17 1.7 12 0Montgomery 1 11 11.0 11 0Cotton 2 2 1.0 1t 1Alexander 1 0 0.0 0 0RAVENS 420 1589 3.8 25 7Opponents 470 1690 3.6 74t 17
RECEIVING NO YDS AVG LG TDJackson 69 918 13.3 54t 4Alexander 65 1009 15.5 92 9Green 65 601 9.2 37t 5Lewis 42 648 15.4 42t 6Morris 29 176 6.1 15 0Byner 21 128 6.1 17 0Yarborough 16 183 11.4 26 0Graham 12 51 4.3 19 0Kinchen 11 95 8.6 24t 1Roe 7 124 17.7 29 0Testaverde 1 -4 -4.0 -4 0RAVENS 338 3929 11.6 92 25Opponents 332 3966 11.9 77 20
INTERCEPTIONS NO YDS AVG LG TDMoore 4 56 14.0 38 0Daniel 3 60 20.0 43 0Langham 3 40 13.3 40t 1Staten 2 12 6.0 9 0Brown 1 21 21.0 21 0Lewis 1 18 18.0 18 0Jones 1 15 15.0 15 0Jenkins 1 15 15.0 15 0Sharper 1 4 4.0 0 0RAVENS 17 241 14.2 43 1Opponents 16 118 7.4 42 0
PUNTING NO YDS AVG TB IN LG BLKMontgomery 83 3540 42.7 2 24 60 0RAVENS 83 3540 42.7 2 24 60 0Opponents 82 3611 44.0 7 24 63 0
PUNT RETURNS RET FC YDS AVG LG TDLewis 28 13 437 15.6 89t 2Roe 8 0 72 9.0 14 0Ethridge 5 1 21 4.2 16 0Alexander 1 0 34 34.0 34 0RAVENS 42 14 564 13.4 89t 2Opponents 53 11 460 8.7 60 0
KICKOFF RETURNS NO YDS AVG LG TDLewis 41 905 22.1 51 0Roe 9 189 21.0 33 0Graham 6 115 19.2 24 0Brew 5 88 17.6 24 0Singleton 4 64 16.0 19 0Ethridge 2 37 18.5 22 0Morris 1 23 23.0 23 0Holmes 1 14 14.0 14 0McCloud 1 0 0.0 0 0Byner 1 0 0.0 0 0RAVENS 71 1435 20.2 51 0Opponents 59 1323 22.4 97t 0
FIELD GOALS 1-19 20-29 30-39 40-49 50+Stover 0/0 8/9 12/12 6/11 0/2RAVENS 0/0 8/9 12/12 6/11 0/2Opponents 0/0 10/10 6/6 7/16 1/2
Stover: (33,25);(37,32,41);(37);(38,46WL,42,49,34,36); (47,35,28);(34);(38,23);(48SH,34,28);(41,22,24);();(23,53WR);(46,34);();(24,45WR,42WR);(50BL,27BL); (44WR)
Opponents: (43WL);(46,51WL,43WL,46BL);(41WR,27,41WR);(45, 41WR);(49WL);();(23);(26);(47WR,28,33,31,37);(52,22,39);(33,40 WL);(22,27,43);(41,42,31,29,22); (); (25,40); (44)
PASSING ATT COMP YARDS COMP% YDS/ATT TD TD% INT INT% LG SACK/LOST RATINGTestaverde 470 271 2971 57.7 6.32 18 3.8 15 3.2 54t 20/129 75.9Zeier 116 67 958 57.8 8.26 7 6.0 1 0.9 92 17/98 101.1RAVENS 586 338 3929 57.7 6.70 25 4.3 16 2.7 92 37/227 80.9Opponents 556 332 3966 59.7 7.13 20 3.6 17 3.1 77t 42/293 80.8

2019 BALTIMORE RAVENS MEDIA GUIDE352
1997 STATISTICS
ORGANIZ
ATIO
N P
LAYERS 20
10 R
EVIE
W H
ISTORY R
ECORDS G
AM
E D
AY
332 BALTIMORE RAVENS FAN & MEDIA GUIDE 2011
Record . . . . . . . . . . . . . . . . . . . . . . . . . . . . . . . . . . . . . . . . . . . . . 6-9-1
vs. AFC Central . . . . . . . . . . . . . . . . . . . . . . . . . . . . . . . . . . . . . . . . 3-5
vs. AFC . . . . . . . . . . . . . . . . . . . . . . . . . . . . . . . . . . . . . . . . . . . . . . 4-8
vs. NFC. . . . . . . . . . . . . . . . . . . . . . . . . . . . . . . . . . . . . . . . . . . . . .2-1-1
Home . . . . . . . . . . . . . . . . . . . . . . . . . . . . . . . . . . . . . . . . . . . . . . 3-4-1
Away . . . . . . . . . . . . . . . . . . . . . . . . . . . . . . . . . . . . . . . . . . . . . . . . . 3-5
On Grass . . . . . . . . . . . . . . . . . . . . . . . . . . . . . . . . . . . . . . . . . . . 5-6-1
Artificial Turf . . . . . . . . . . . . . . . . . . . . . . . . . . . . . . . . . . . . . . . . . . . 1-3
Outdoors. . . . . . . . . . . . . . . . . . . . . . . . . . . . . . . . . . . . . . . . . . . . 6-9-1
Indoors . . . . . . . . . . . . . . . . . . . . . . . . . . . . . . . . . . . . . . . . . . . . . . . 0-0
Leading at Halftime. . . . . . . . . . . . . . . . . . . . . . . . . . . . . . . . . . . . .4-1-1
Tied at Halftime. . . . . . . . . . . . . . . . . . . . . . . . . . . . . . . . . . . . . . . . . 1-1
Trailing at Halftime . . . . . . . . . . . . . . . . . . . . . . . . . . . . . . . . . . . . . . 1-7
Tied After 3 Quarters . . . . . . . . . . . . . . . . . . . . . . . . . . . . . . . . . . . . 1-0
Leading After 3 Quarters. . . . . . . . . . . . . . . . . . . . . . . . . . . . . . . . 4-3-1
Trailing After 3 Quarters . . . . . . . . . . . . . . . . . . . . . . . . . . . . . . . . . . 1-6
Winning Coin Toss . . . . . . . . . . . . . . . . . . . . . . . . . . . . . . . . . . . . . . 2-4
Losing Coin Toss . . . . . . . . . . . . . . . . . . . . . . . . . . . . . . . . . . . . . 4-5-1
Decided by 8 Points or less . . . . . . . . . . . . . . . . . . . . . . . . . . . . . . . 4-7
Decided by 3 Points or less . . . . . . . . . . . . . . . . . . . . . . . . . . . . . 3-5-1
When Scoring First . . . . . . . . . . . . . . . . . . . . . . . . . . . . . . . . . . . . 4-3-1
When Not Scoring First. . . . . . . . . . . . . . . . . . . . . . . . . . . . . . . . . . . 2-6
Overtime. . . . . . . . . . . . . . . . . . . . . . . . . . . . . . . . . . . . . . . . . . . . .0-1-1
Preseason. . . . . . . . . . . . . . . . . . . . . . . . . . . . . . . . . . . . . . . . . . . . . 0-4
When Allowing a 100-Yard Rusher . . . . . . . . . . . . . . . . . . . . . . . . . . 1-3
When Allowing a 100-Yard Receiver . . . . . . . . . . . . . . . . . . . . . . . . . 1-6
When Not Allowing a 100-Yard Rusher. . . . . . . . . . . . . . . . . . . . . 5-6-1
When Not Allowing a 100-Yard Receiver . . . . . . . . . . . . . . . . . . . 5-3-1
PLAYER TT SOLO AS SACKS YDS PD FR FF INTLewis, Ray 210 163 47 4.0 27.0 9 0 1 1Moore, Stevon 86 63 23 0.0 0.0 9 0 2 4McCrary, Micheal 80 59 21 9.0 70.5 2 2 0 0Sharper, Jamie 79 57 22 3.0 24.0 3 0 1 1Jones, James 75 50 25 6.0 44.0 1 1 3 0Boulware, Peter 66 42 24 11.5 70.5 0 0 1 0Burnett, Rob 59 40 19 4.0 36.0 1 1 1 0Langham, Antonio 51 41 10 1.0 0.0 14 0 1 3Herring, Kim 51 34 17 1.0 4.0 1 0 1 0Jenkins, DeRon 44 40 4 0.0 0.0 7 1 0 1Siragusa, Tony 44 30 14 0.0 0.0 2 1 0 0Jones, Rondell 40 32 8 0.0 0.0 4 1 0 1Webster, Larry 34 25 9 0.0 0.0 0 0 0 0Brady, Donny 33 29 4 0.0 0.0 7 1 0 0Staten, Ralph 30 22 8 0.0 0.0 6 0 0 2Washington, Keith 24 17 7 2.0 16.0 1 0 1 0Brown, Cornell 17 12 5 0.5 1.0 2 0 2 1Daniel, Eugene 17 9 8 0.0 0.0 7 0 0 3Frederick, Mike 10 8 2 0.0 0.0 1 1 0 0McCloud, Tyrus 9 5 4 0.0 0.0 1 0 0 0Ward, Chris 3 3 0 0.0 0.0 0 0 0 0Thompson, Bennie 3 3 0 0.0 0.0 1 0 0 0Brew, Dorian 3 2 1 0.0 0.0 0 0 0 0Williams, John 2 2 0 0.0 0.0 2 0 0 0Taylor, Leland 1 0 1 0.0 0.0 0 0 0 0
OFFENSE WR1 81 Michael Jackson WR2 82 Derrick Alexander LT 75 Jonathan Ogden LG 65 Ben Cavil 62 Leo Goeas C 63 Wally Williams 67 Quentin Neujahr RG 69 Jeff Blackshear RT 77 Orlando Brown TE 86 Eric Green QB 12 Vinny Testaverde WR3 84 Jermaine Lewis RB 33 Bam Morris
DEFENSE LDE 90 Rob Burnett LDT 97 James Jones RDT 98 Tony Siragusa RDE 99 Michael McCrary LLB 58 Peter Boulware MLB 52 Ray Lewis RLB 55 Jamie Sharper LCB 38 Antonio Langham RCB 25 DeRon Jenkins 30 Eugene Daniel SS 27 Stevon Moore FS 31 Rondell Jones 20 Kim Herring
PLAYER TT SOLO AS FR FF BKBrady, Donny 19 17 2 0 0 0Thompson, Bennie 18 18 0 2 1 0Herring, Kim 10 9 1 1 0 0Vinson, Tony 9 9 0 0 0 0McCloud, Tyrus 9 7 2 1 0 0Brown, Cornell 8 8 0 0 0 0Williams, John 7 7 0 0 0 0Washington, Keith 5 5 0 0 0 0Jenkins, DeRon 5 4 1 0 0 0Kinchen, Brian 4 3 1 0 1 0Moore, Stevon 3 3 0 0 0 0Byner, Earnest 2 2 0 2 0 0Graham, Jay 2 2 0 1 0 0Sharper, Jamie 2 2 0 0 0 0Langham, Antonio 2 2 0 0 0 0Holmes, Priest 2 2 0 0 0 0Jones, Rondell 2 1 1 0 0 1Brew, Dorian 1 1 0 0 0 0Peters, Tyrell 1 1 0 0 0 0Montgomery, Greg 1 1 0 0 0 0Ethridge, Ray 1 1 0 0 0 0Stover, Matt 1 1 0 0 0 0Cotton, Kenyon 1 0 1 0 0 0Staten, Ralph 1 0 1 0 0 0Ofodile, A.J. 1 0 1 0 0 0Burnett, Rob 0 0 0 0 0 1
Ted Marchibroda, Head Coach; Kirk Ferentz, Assistant Head Coach-
Offense; Marvin Lewis, Defensive Coordinator; Maxie Baughan,
Linebackers; Jacob Burney, Defensive Line; Al Lavan, Running Backs;
Scott O’Brien, Special Teams; Alvin Reynolds, Secondary; Richard
Mann, Wide Receivers; Jerry Simmons, Strength and Conditioning;
Don Strock, Quarterbacks; Ken Whisenhunt, Tight Ends; Lester Erb,
Quality Control/Offense; Jim Schwartz, Quality Control/Defense; John
Settle, Quality Control/Special Teams
NFL Defensive Rookie of the Year: LB Peter Boulware
Pro Bowl: OT Jonathan Ogden (starter), Ray Lewis (1st alternate, played in game)
All-Pro: OT Jonathan Ogden (SI, TSN, PFW, CPFW, FD), LB Ray Lewis (SI, CPFW)
Ravens Roost Unsung Hero: S Stevon Moore
Ravens Roost Extra Effort Award: S Bennie Thompson
Ed Block Courage Award: OL Wally Williams
SOLO SACKS FF FR PD 163 Ray Lewis 11.5 Peter Boulware 3 James Jones 2 Michael McCrary 14 Antonio Langham 63 Stevon Moore 9.0 Michael McCrary 2 Cornell Brown 1 7 players tied 9 Ray Lewis 59 Michael McCrary 6.0 James Jones 2 Stevon Moore 9 Stevon Moore
DEFENSIVE SPECIAL TEAMS
TOP THREE
SEASON TRENDS
COACHES
RAVENS HONOR ROLL
USUAL STARTERS
FROM COACHES VIDEO FROM COACHES VIDEO

BALTIMORERAVENS.COM 353
1998 STATISTICS
GAM
E D
AY
RECORDS
HIS
TORY
2010
REVIE
W
PLAYERS
ORGANIZ
ATIO
N
333BALTIMORERAVENS.COM
1998 STATISTICS
RESULTS AND ATTENDANCEWON 6, LOST 1009/06 L 13-20 Pittsburgh 68,84709/13 W 24-10 at New York Jets 70,06309/20 L 10-24 at Jacksonville 67,06909/27 W 31-24 Cincinnati 68,15410/04 Bye Week10/11 L 8-12 Tennessee 68,56110/18 L 6-16 at Pittsburgh 58,62010/25 L 10-28 at Green Bay 59,86011/01 L 19-45 Jacksonville 68,91511/08 W 13-10 Oakland 69,03711/15 L 13-14 at San Diego 54,38811/22 W 20-13 at Cincinnati 52,57111/29 W 38-31 Indianapolis 68,89812/06 L 14-16 at Tennessee 31,12412/13 L 28-38 Minnesota 69,07412/20 L 3-24 at Chicago 40,85312/27 W 19-10 Detroit 68,045
TEAM STATISTICS RAVENS OPPONENTTOTAL FIRST DOWNS 243 298 Rushing 86 90 Passing 140 180 Penalty 17 28 3rd Down: Made/Att 64/207 93/237 3rd Down Pct. 30.9 39.2 4th Down: Made/Att 6/15 4/11 4th Down Pct. 40.0 36.4TOTAL NET YARDS 4498 5297 Avg. Per Game 281.1 331.1 Total Plays 926 1050 Avg. Per Play 4.9 5.0NET YARDS RUSHING 1629 1705 Avg. Per Game 101.8 106.6 Total Rushes 408 472NET YARDS PASSING 2869 3592 Avg. Per Game 179.3 224.5 Sacked/Yards Lost 41/283 39/286 Gross Yards 3152 3878 Att./Completions 477/272 539/316 Completion Pct. 57.0 58.6 Had Intercepted 15 17PUNTS/AVERAGE 92/42.9 86/42.5NET PUNTING AVG. 38.3 33.6PENALTIES/YARDS 113/908 123/1013FUMBLES/BALL LOST 31/15 17/6TOUCHDOWNS 29 37 Rushing 7 12 Passing 16 20 Returns 6 5
SCORE BY PERIODS 1 2 3 4 OT PTSRAVENS 79 63 41 86 0 269 Opponents 96 104 85 50 0 335
SCORING R P KR DR PAT FG 2R 2P S TPStover 0 0 0 0 24/24 21/28 0 0 0 87Lewis 0 6 2 0 0/0 0/0 0 0 0 48Holmes 7 0 0 0 0/0 0/0 0 0 0 42Turner 0 5 0 0 0/0 0/0 0 2 0 34Johnson 0 1 1 0 0/0 0/0 0 0 0 12Potts 0 2 0 0 0/0 0/0 0 0 0 12Woodson 0 0 0 2 0/0 0/0 0 0 0 12Green 0 1 0 0 0/0 0/0 0 0 0 6Harris 0 0 1 0 0/0 0/0 0 0 0 6Roe 0 1 0 0 0/0 0/0 0 0 0 6Burnett 0 0 0 0 0/0 0/0 0 0 1 2Stat 0 0 0 0 0/0 0/0 0 0 1 2RAVENS 7 16 4 2 24/24 21/28 0 2 2 269Opponents 12 20 3 2 35/35 26/30 0 0 0 335
2-PT. CONVERSIONS: RAVENS 2-5; OPPONENTS 0-2
SACKS: McCrary 14.5, Boulware 8.5, Jones 5.5, Lewis 3.0, Burnett 2.5, Brady 1.0, Harris 1.0, Sharper 1.0, Staten 1.0, Washington 1.0RAVENS 39.0; Opponents: 41.0
RUSHING NO YDS AVG LG TDHolmes 233 1008 4.3 56 7Rhett 44 180 4.1 46 0Harbaugh 40 172 4.3 15 0Potts 36 115 3.2 33 0Graham 35 109 3.1 12 0Lewis 5 20 4.0 9 0Zeier 11 17 1.5 7 0Cotton 2 8 4.0 7 0Mitchell 1 0 0.0 0 0Richardson, W. 1 0 0.0 0 0Richardson, K. 1 0 0.0 0 0RAVENS 408 1629 4.0 56 7Opponents 472 1705 3.6 68t 12
RECEIVING NO YDS AVG LG TDHolmes 43 260 6.0 25 0Lewis 41 784 19.1 73t 6Jackson 38 477 12.6 53 0Green 34 422 12.4 56 1Turner 32 512 16.0 66t 5Potts 30 168 5.6 18 2Kinchen 13 110 8.5 24 0Johnson 12 159 13.3 35 1Rhett 11 65 5.9 16 0Roe 8 115 14.4 27 1Graham 5 41 8.2 14 0Yarborough 4 39 9.8 18 0Atkins 1 0 0.0 0 0RAVENS 272 3152 11.6 73t 16Opponents 316 3878 12.3 78t 20
INTERCEPTIONS NO YDS AVG LG TDWoodson 6 108 18.0 60t 2Starks 5 3 0.6 2 0Staten 3 25 8.3 14 0Lewis 2 25 12.5 26 0Jenkins 1 0 0.0 0 0RAVENS 17 161 9.5 60t 2Opponents 15 148 9.9 43 0
PUNTING NO YDS AVG TB IN LG BLKMontgomery 83 3540 42.7 2 24 60 0RAVENS 83 3540 42.7 2 24 60 0Opponents 82 3611 44.0 7 24 63 0
PUNT RETURNS RET FC YDS AVG LG TDLewis 32 10 405 12.7 87t 2Roe 9 2 87 9.7 19 0Thompson 1 0 43 43.0 43 0Johnson 1 0 6 6.0 6 0RAVENS 43 12 541 12.6 87t 2Opponents 40 24 284 7.1 71t 1
KICKOFF RETURNS NO YDS AVG LG TDHarris 35 965 27.6 95t 1Johnson 16 399 24.9 97t 1Lewis 6 145 24.2 37 0Graham 3 52 17.3 22 0Roe 2 40 20.0 27 0Cotton 2 33 16.5 18 0Kinchen 2 33 16.5 21 0Holmes 2 30 15.0 19 0Potts 1 3 3.0 3 0RAVENS 69 1700 24.6 97t 2Opponents 57 1168 20.5 97t 2
FIELD GOALS 1-19 20-29 30-39 40-49 50+Stover 0/0 6/6 5/5 10/17 0/0RAVENS 0/0 6/6 5/5 10/17 0/0Opponents 0/0 8/9 6/6 11/12 1/3
Stover: (41,42WR,42WL,45WL,25);(29,44WR);(25);(46); (21,45);(41,40);(38,45WL);();(41WL,30,30);(42,42):(34,23); (43,48,47);();();(45BL,27);(30)
Opponents: (27,49);(60SH,20);(34,25BL);(48);(26,42WL,29);(41,42,40);():(33);(23);();(40,34);(53,52BL);(48,48,34); (43,31,45,24,46,20);(20);(39)
PASSING ATT COMP YARDS COMP% YDS/ATT TD TD% INT INT% LG SACK/LOST RATINGHarbaugh 293 164 1839 56.0 6.28 12 4.1 11 3.8 66t 23/145 72.9Zeier 181 107 1312 59.1 7.25 4 2.2 3 1.7 73t 18/138 82.0Richardson 2 1 1 50.0 0.50 0 0.0 0 0.0 1 0/0 56.3Holmes 1 0 0 0.0 0.00 0 0.0 1 100.0 0 0/0 0.0RAVENS 477 272 3152 57.0 6.61 16 3.4 15 3.1 73t 41/283 75.2Opponents 539 316 3878 58.6 7.19 20 3.7 17 3.2 78t 39/286 80.1

2019 BALTIMORE RAVENS MEDIA GUIDE354
1998 STATISTICS
ORGANIZ
ATIO
N P
LAYERS 20
10 R
EVIE
W H
ISTORY R
ECORDS G
AM
E D
AY
334 BALTIMORE RAVENS FAN & MEDIA GUIDE 2011
Record . . . . . . . . . . . . . . . . . . . . . . . . . . . . . . . . . . . . . . . . . . . . . . 6-10vs. AFC Central. . . . . . . . . . . . . . . . . . . . . . . . . . . . . . . . . . . . . . . . . 2-6vs. AFC . . . . . . . . . . . . . . . . . . . . . . . . . . . . . . . . . . . . . . . . . . . . . . 5-7vs. NFC. . . . . . . . . . . . . . . . . . . . . . . . . . . . . . . . . . . . . . . . . . . . . . . 1-3Home . . . . . . . . . . . . . . . . . . . . . . . . . . . . . . . . . . . . . . . . . . . . . . . . 4-4Away . . . . . . . . . . . . . . . . . . . . . . . . . . . . . . . . . . . . . . . . . . . . . . . . . 2-6On Grass . . . . . . . . . . . . . . . . . . . . . . . . . . . . . . . . . . . . . . . . . . . . . 4-8Artificial Turf . . . . . . . . . . . . . . . . . . . . . . . . . . . . . . . . . . . . . . . . . . . 2-2Outdoors. . . . . . . . . . . . . . . . . . . . . . . . . . . . . . . . . . . . . . . . . . . . . 6-10Indoors . . . . . . . . . . . . . . . . . . . . . . . . . . . . . . . . . . . . . . . . . . . . . . . 0-0Leading at Halftime. . . . . . . . . . . . . . . . . . . . . . . . . . . . . . . . . . . . . . 5-1Tied at Halftime. . . . . . . . . . . . . . . . . . . . . . . . . . . . . . . . . . . . . . . . . 0-2Trailing at Halftime . . . . . . . . . . . . . . . . . . . . . . . . . . . . . . . . . . . . . . 1-7Tied After 3 Quarters . . . . . . . . . . . . . . . . . . . . . . . . . . . . . . . . . . . . 0-0Leading After 3 Quarters. . . . . . . . . . . . . . . . . . . . . . . . . . . . . . . . . . 5-1Trailing After 3 Quarters . . . . . . . . . . . . . . . . . . . . . . . . . . . . . . . . . . 1-9
Winning Coin Toss . . . . . . . . . . . . . . . . . . . . . . . . . . . . . . . . . . . . . . 3-6Losing Coin Toss . . . . . . . . . . . . . . . . . . . . . . . . . . . . . . . . . . . . . . . 3-4Decided by 8 Points or less . . . . . . . . . . . . . . . . . . . . . . . . . . . . . . . 3-4Decided by 3 Points or less . . . . . . . . . . . . . . . . . . . . . . . . . . . . . . . 1-2When Scoring First . . . . . . . . . . . . . . . . . . . . . . . . . . . . . . . . . . . . . . 5-2When Not Scoring First. . . . . . . . . . . . . . . . . . . . . . . . . . . . . . . . . . . 1-8Overtime. . . . . . . . . . . . . . . . . . . . . . . . . . . . . . . . . . . . . . . . . . . . . . 0-0Preseason. . . . . . . . . . . . . . . . . . . . . . . . . . . . . . . . . . . . . . . . . . . . . 4-0With a 100-Yard Rusher . . . . . . . . . . . . . . . . . . . . . . . . . . . . . . . . . . 4-0With a 100-Yard Receiver . . . . . . . . . . . . . . . . . . . . . . . . . . . . . . . . . 1-3Without a 100-yard Rusher . . . . . . . . . . . . . . . . . . . . . . . . . . . . . . . 2-10Without a 100-yard Receiver. . . . . . . . . . . . . . . . . . . . . . . . . . . . . . . 5-7When Allowing a 100-Yard Rusher . . . . . . . . . . . . . . . . . . . . . . . . . . 2-3When Allowing a 100-Yard Receiver . . . . . . . . . . . . . . . . . . . . . . . . . 4-2When Not Allowing a 100-Yard Rusher. . . . . . . . . . . . . . . . . . . . . . . 4-7When Not Allowing a 100-Yard Receiver . . . . . . . . . . . . . . . . . . . . . 2-8
PLAYER TT SOLO AS SACKS YDS PD FR FF INT
Lewis, Ray 154 119 35 3.0 14.0 10 0 1 2McCrary, Michael 102 68 34 14.5 124.0 1 0 1 0Moore, Stevon 96 70 26 0.0 0.0 5 0 0 0Woodson, Rod 84 74 10 0.0 0.0 23 0 0 6Sharper, Jamie 84 49 35 1.0 14.0 3 0 0 0Boulware, Peter 83 41 42 8.5 49.5 6 1 0 0Jones, James 75 43 32 5.5 41.0 1 1 1 0Burnett, Rob 70 46 24 2.5 24.5 0 1 0 0Siragusa, Tony 68 40 28 0.0 0.0 2 1 1 0Harris, Corey 54 43 11 1.0 8.0 1 0 1 0Starks, Duane 50 43 7 0.0 0.0 19 0 2 5Jenkins, DeRon 42 38 4 0.0 0.0 17 0 0 1Staten, Ralph 35 27 8 1.0 3.0 8 0 0 3McCloud, Tyrus 26 20 6 0.0 0.0 1 0 0 0Herring, Kim 23 18 5 0.0 0.0 1 0 0 0Washington, Keith 15 12 3 1.0 7.0 1 0 0 0Webster, Larry 15 9 6 0.0 0.0 0 0 0 0Olsavsky, Jerry 13 9 4 0.0 0.0 0 0 1 0Brown, Cornell 10 6 4 0.0 0.0 0 0 0 0Brady, Donny 4 3 1 1.0 8.0 0 0 0 0Dalton, Lional 4 2 2 0.0 0.0 0 0 1 0Frederick, Mike 2 2 0 0.0 0.0 0 0 0 0Peters, Tyrell 1 0 1 0.0 0.0 0 0 0 0Williams, John 0 0 0 0.0 0.0 1 0 0 0
OFFENSE WR1 81 Michael Jackson WR2 84 Jermaine Lewis LT 75 Jonathan Ogden LG 63 Wally Williams 65 Ben Cavil C 60 Jeff Mitchell 63 Wally Williams RG 69 Jeff Blackshear RT 77 Orlando Brown TE 86 Eric Green QB 4 Jim Harbaugh RB 33 Priest Holmes FB 42 Roosevelt Potts
DEFENSE LDE 90 Rob Burnett LDT 97 James Jones RDT 98 Tony Siragusa RDE 99 Michael McCrary LLB 58 Peter Boulware MLB 52 Ray Lewis RLB 55 Jamie Sharper LCB 26 Rod Woodson RCB 25 DeRon Jenkins 22 Duane Starks SS 27 Stevon Moore FS 20 Kim Herring 45 Corey Harris
PLAYER TT SOLO AS FR FF BK
Thompson, Bennie 22 15 7 0 0 0Williams, John 20 15 5 1 0 0Brady, Donny 14 9 5 0 0 0Brown, Cornell 11 9 2 0 1 0Olsavsky, Jerry 8 4 4 0 0 0Kopp, Jeff 7 5 2 0 0 0Peters, Tyrell 7 4 3 0 0 0Starks, Duane 6 6 0 0 0 0Harris, Corey 6 5 1 0 1 0Washington, Keith 6 5 1 0 0 0Kinchen, Brian 6 3 3 0 0 0Holmes, Priest 5 2 3 0 0 0Herring, Kim 3 2 1 0 0 0Staten, Ralph 3 2 1 0 0 0Stover, Matt 2 2 0 0 0 0Sharper, Jamie 1 1 0 0 0 0McCloud, Tyrus 1 1 0 0 0 0LeBel, Harper 1 1 0 0 0 0Richardson, Kyle 1 1 0 0 0 0Yarborough, Ryan 1 1 0 0 0 0Rhett, Errict 1 1 0 0 0 0Cotton, Kenyon 1 0 1 0 0 0Woodson, Rod 0 0 0 0 0 2
Ted Marchibroda, Head Coach; Kirk Ferentz, Assistant Head Coach-
Offense; Marvin Lewis, Defensive Coordinator; Maxie Baughan,
Linebackers; Jacob Burney, Defensive Line; Al Lavan, Running Backs;
Scott O’Brien, Special Teams; Alvin Reynolds, Secondary; Richard
Mann, Wide Receivers; Jerry Simmons, Strength and Conditioning;
Don Strock, Quarterbacks; Ken Whisenhunt, Tight Ends; Lester Erb,
Quality Control/Offense; Jim Schwartz, Quality Control/Defense; Darrin
Simmons, Quality Control/Special Teams
SOLO SACKS FF FR PD 119 Ray Lewis 14.5 Michael McCrary 2 Duane Starks 1 4 players tied 23 Rod Woodson 74 Rod Woodson 8.5 Peter Boulware 1 7 players tied 19 Duane Starks 70 Stevon Moore 5.5 James Jones 17 DeRon Jenkins
Pro Bowl: OT Jonathan Ogden (starter); DE Michael McCrary (starter); LB Ray Lewis (2nd team); WR/PR Jermaine Lewis (selected as returner); S Bennie Thompson (selected as special teams performer), LB Peter Boulware (needs player)
All-Pro: WR Jermaine Lewis (AP, TSN); LB Ray Lewis (SI, TSN, USA, AP-2nd team); DE Michael McCrary (SI, TSN); OT Jonathan Ogden (SI, CPFW, AP-2nd team), S Bennie Thompson (PFW special teams)
Quarterback Club MVP: WR/RS Jermaine LewisRavens Roost Unsung Hero: OG Jeff Blackshear
Ravens Roost Extra Effort Award: DE Michael McCraryEd Block Courage Award: S Stevon Moore
DEFENSIVE SPECIAL TEAMS
TOP THREE
SEASON TRENDS
COACHES
RAVENS HONOR ROLL
USUAL STARTERS
FROM COACHES VIDEO FROM COACHES VIDEO

BALTIMORERAVENS.COM 355
1999 STATISTICS
GAM
E D
AY
RECORDS
HIS
TORY
2010
REVIE
W
PLAYERS
ORGANIZ
ATIO
N
335BALTIMORERAVENS.COM
1999 STATISTICS
RESULTS AND ATTENDANCEWON 8, LOST 809/12 L 10-27 at St. Louis 62,10009/19 L 20-23 Pittsburgh 68,96509/26 W 17-10 Cleveland 68,80310/03 W 19-13 (OT) at Atlanta 50,71210/10 L 11-14 at Tennessee 65,48610/17 Bye Week10/21 L 8-35 Kansas City 68,77110/31 L 10-13 Buffalo 68,67311/07 W 41- 9 at Cleveland 72,89811/14 L 3- 6 at Jacksonville 67,39111/21 W 34-31 at Cincinnati 43,27911/28 L 23-30 Jacksonville 68,42812/05 W 41-14 Tennessee 67,85412/12 W 31-24 at Pittsburgh 46,71512/19 W 31-8 New Orleans 67,59712/26 W 22-0 Cincinnati 68,03601/02 L 3-20 at New England 50,263
TEAM STATISTICS RAVENS OPPONENTTOTAL FIRST DOWNS 259 260 Rushing 87 70 Passing 148 158 Penalty 24 32 3rd Down: Made/Att 65/229 86/252 3rd Down Pct. 28.4 34.1 4th Down: Made/Att 3/11 7/15 4th Down Pct. 27.3 46.7TOTAL NET YARDS 4778 4222 Avg. Per Game 298.6 263.9 Total Plays 1033 1040 Avg. Per Play 4.6 4.1NET YARDS RUSHING 1754 1231 Avg. Per Game 109.6 76.9 Total Rushes 431 392NET YARDS PASSING 3024 2991 Avg. Per Game 189.0 186.9 Sacked/Yards Lost 56/336 49/291 Gross Yards 3360 3282 Att./Completions 546/270 599/328 Completion Pct. 49.5 54.8 Had Intercepted 20 21PUNTS/AVERAGE 104/41.9 115/42.2NET PUNTING AVG. 104/35.5 115/36.9PENALTIES/YARDS 125/1010 122/1118FUMBLES/BALL LOST 24/11 25/10TOUCHDOWNS 34 31 Rushing 9 6 Passing 21 20 Returns 4 5
SCORE BY PERIODS 1 2 3 4 OT PTSRAVENS 64 84 85 85 6 324 Opponents 47 71 51 108 0 277
SCORING TD RU PA RT K/PAT FG S PTSStover 0 0 0 0 32/32 28/33 0 116Rhett 7 5 2 0 0 42Ismail 6 0 6 0 0 36 Armour 4 0 4 0 0 24 Case 3 3 0 0 0 18 Johnson 3 0 3 0 0 18 Holmes 2 1 1 0 0 12J. Lewis 2 0 2 0 0 12Woodson 2 0 0 2 0 12Evans 1 0 1 0 0 8DeLong 1 0 1 0 0 6 Harris 1 0 0 1 0 6Starks 1 0 0 1 0 6Stokley 1 0 1 0 0 6R. Lewis 0 0 0 0 1 2RAVENS 34 9 21 4 32/32 28/33 1 324 Opponents 31 6 20 5 26/27 19/25 0 277
2-PT. CONVERSIONS: RAVENS 1-1; Opponents 4-4
SACKS: McCrary 11.5, Boulware 10.0, Burnett 6.5, Sharper 4.0, R. Lewis 3.5, Siragusa 3.5, Smith 2.0, Webster 2.0, Brown 1.0, Dalton 1.0, Harris 1.0, Jenkins 1.0, Trapp 1.0, Washington 1.0 RAVENS 49.0; Opponents 56.0
RUSHING NO YDS AVG LG TDRhett 236 852 3.6 52t 5Holmes 89 506 5.7 72 1Case 36 141 3.9 28 3Evans 38 134 3.5 12 0Banks 24 93 3.9 12 0Johnson 1 12 12.0 12 0J. Lewis 5 11 2.2 4 0Ismail 1 4 4.0 4 0S. Mitchell 1 1 1.0 1 0RAVENS 431 1754 4.1 72 9Opponents 392 1231 3.1 31 6
RECEIVING NO YDS AVG LG TDIsmail 68 1105 16.3 76t 6Armour 37 538 14.5 54t 4Evans 32 235 7.3 27 1Johnson 29 526 18.1 76t 3J. Lewis 25 281 11.2 46 2Rhett 24 169 7.0 20t 2Holmes 13 104 8.0 34t 1DeLong 13 52 4.0 9 1Pierce 11 102 9.3 26 0Davis 6 121 20.2 73 0Collins 4 62 15.5 28 0Ofodile 4 25 6.3 9 0Purnell 2 10 5.0 5 0Stokley 1 28 28.0 28t 1Ayanbadejo 1 2 2.0 2 0RAVENS 270 3360 12.4 76t 21Opponents 328 3282 10.0 61 20
INTERCEPTIONS NO YDS AVG LG TDWoodson 7 195 27.9 66t 2Starks 5 59 11.8 43t 1McAlister 5 28 5.6 21 0R. Lewis 3 97 32.3 60 0Harris 1 24 24.0 24t 1RAVENS 21 403 19.2 66t 4Opponents 20 220 11.0 56t 3
PUNTING NO YDS AVG TB IN LG BLKRichardson 103 4355 42.3 10 39 63 1Team 1 0 0 0 0 0 0RAVENS 104 4355 41.9 10 39 63 1Opponents 115 4854 42.2 8 24 59 0
PUNT RETURNS RET FC YDS AVG LG TDJ. Lewis 57 18 452 7.9 33 0 Woodson 2 2 0 0.0 7 0RAVENS 59 20 452 7.7 33 0Opponents 43 28 468 10.9 86t 1
KICKOFF RETURNS NO YDS AVG LG TDHarris 38 843 22.2 66 0 J. Lewis 8 158 19.8 25 0Ismail 4 55 13.8 19 0DeLong 1 11 11.0 11 0McAlister 1 12 12.0 12 0Pierce 1 7 7.0 7 0Washington 1 12 12.0 12 0RAVENS 54 1098 20.3 66 0Opponents 70 1479 21.1 54 0
FIELD GOALS 1-19 20-29 30-39 40-49 50+Stover 4/4 9/9 6/8 7/7 2/5RAVENS 4/4 9/9 6/8 7/7 2/5Opponents 1/1 6/7 7/9 3/6 2/2
Stover: (54N,25G,54N)(45G,28G)(44G)(38N,38G,26G)(44G,46G,50G)(37N)(37G,51B)(28G,44G)(23G)(25G,50G)(46G,31G,33G)(21G,27G)(19G)(36G)(24G,48G,19G,30G,19) (19G)
Opponents: (36G,51G)(32G,28G,36G)(49G)(33N,41G,35G)()(42N)(25G,40G)(25G)(28G,28G,41N)(39B,19G)()(39G,33G)(31G,46N)()(20B)(25G,51G)
PASSING ATT COMP YARDS COMP% YDS/ATT TD TD% INT INT% LG SACK/LOST RATINGBanks 320 169 2136 52.8 6.68 17 5.3 8 2.5 76t 33/190 81.2Case 170 77 988 45.3 5.81 3 1.8 8 4.7 54t 17/116 50.3S. Mitchell 56 24 236 42.9 4.21 1 1.8 4 7.1 28t 6/30 31.5Ravens 546 270 3360 49.5 6.15 21 3.8 20 3.7 76t 56/336 66.5Opponents 599 328 3282 54.8 5.48 20 3.3 21 3.5 61 49/291 67.1

2019 BALTIMORE RAVENS MEDIA GUIDE356
1999 STATISTICS
ORGANIZ
ATIO
N P
LAYERS 20
10 R
EVIE
W H
ISTORY R
ECORDS G
AM
E D
AY
336 BALTIMORE RAVENS FAN & MEDIA GUIDE 2011
PLAYER TT SOLO AS SACKS YDS PD FR FF INTLewis, Ray 198 131 67 3.5 20.5 8 0 1 3Sharper, Jamie 122 85 37 4.0 19.0 4 0 0 0McCrary, Michael 92 49 43 11.5 75.5 3 1 1 0Woodson, Rod 81 64 17 0.0 0.0 18 1 0 7Burnett, Rob 81 49 32 6.5 33.5 7 0 2 0Siragusa, Tony 68 44 24 3.5 19.5 2 1 0 0Jenkins, DeRon 66 54 12 1.0 9.0 13 0 2 0Herring, Kim 65 51 14 0.0 0.0 8 1 0 0McAlister, Chris 58 50 8 0.0 0.0 27 0 0 5Webster, Larry 44 32 12 2.0 6.0 0 0 0 0Boulware, Peter 42 29 13 10.0 64.0 2 0 3 0Starks, Duane 41 34 7 0.0 0.0 23 0 0 5Harris, Corey 38 33 5 1.0 8.0 4 0 1 1Smith, Fernando 37 16 21 2.0 15.0 2 3 0 0Brown, Cornell 32 20 12 1.0 0.0 1 0 0 0Dalton, Lional 32 16 16 1.0 2.0 0 0 1 0Washington, Keith 26 11 15 1.0 12.0 0 0 1 0Jackson, Brad 2 2 0 0.0 0.0 2 0 0 0Trapp, James 2 1 1 1.0 7.0 1 0 0 0Moore, Stevon 2 1 1 0.0 0.0 0 0 0 0Chase, Martin 2 0 2 0.0 0.0 0 0 0 0Peters, Tyrell 1 1 0 0.0 0.0 0 0 0 0
OFFENSE WR1 87 Qadry Ismail WR2 88 Justin Armour 84 Jermaine Lewis LT 75 Jonathan Ogden LG 61 Everett Lindsay 64 Edwin Mulitalo C 60 Jeff Mitchell RG 69 Jeff Blackshear RT 70 Harry Swayne 61 Everett Lindsay TE 81 Aaron Pierce 85 Greg DeLong QB 12 Tony Banks 10 Stoney Case RB 32 Errict Rhett FB 29 Charles Evans
DEFENSE LDE 90 Rob Burnett LDT 79 Larry Webster RDT 98 Tony Siragusa RDE 99 Michael McCrary LLB 58 Peter Boulware MLB 52 Ray Lewis RLB 55 Jamie Sharper LCB 21 Chris McAlister RCB 25 DeRon Jenkins 22 Duane Starks SS 20 Kim Herring FS 26 Rod Woodson
PLAYER TT SOLO AS FR FF BKThompson, Bennie 24 11 13 0 1 0Davis, Billy 21 14 7 1 0 0Ayanbadejo, Obafemi 19 12 7 0 0 0Brown, Cornell 15 13 2 0 0 0Trapp, James 14 13 1 0 0 0Jackson, Brad 13 7 6 1 0 0Harris, Corey 12 9 3 0 1 0Sharper, Jamie 10 8 2 0 1 0Peters, Tyrell 10 7 3 0 0 0Herring, Kim 8 7 1 1 0 0Armour, Justin 8 5 3 0 0 0Jenkins, DeRon 6 5 1 0 0 0Moore, Stevon 3 3 0 0 0 0Stover, Matt 3 3 0 0 0 0Wainright, Frank 3 3 0 0 0 0Richardson, Kyle 1 1 0 0 0 0Woodson, Rod 1 1 0 0 0 0Burnett, Rob 0 0 0 0 0 0Washington, Keith 0 0 0 0 0 2
Brian Billick, Head Coach; Matt Cavanaugh, Offensive Coordinator/
Quarterbacks; Marvin Lewis, Defensive Coordinator; Jim Colletto,
Offensive Line; Jack Del Rio, Linebackers; Jeff Friday, Strength and
Conditioning; Wade Harman, Tight Ends/Assistant Offensive Line;
Donnie Henderson, Assistant Defensive Backs; Milt Jackson, Wide
Receivers; Chip Morton, Assistant Strength and Conditioning; Russ
Purnell, Special Teams; Rex Ryan, Defensive Line; Steve Shafer,
Defensive Backs/Assistant Head Coach; Matt Simon, Running Backs;
Mike Smith, Defensive Assistant
SOLO SACKS FF FR PD 131 Ray Lewis 11.5 Michael McCrary 3 Peter Boulware 3 Fernando Smith 27 Chris McAlister 85 Jamie Sharper 10.0 Peter Boulware 2 Rob Burnett 1 4 players tied 23 Duane Starks 64 Rod Woodson 6.5 Rob Burnett 2 DeRon Jenkins 18 Rod Woodson
Pro Bowl: LB Peter Boulware (starter); LB Ray Lewis (starter); OT Jonathan Ogden (starter); DE Michael McCrary (2nd team); S Rod Woodson (2nd team) All Pro: LB Ray Lewis (SI, PFW, TSN, FN, FD, USA, AP-1st team); LB Peter Boulware (AP-2nd team, PFW-AFC, FN-AFC);
OT Jonathan Ogden (FD, PFW-AFC, AP-2nd team), S Rod Woodson (CPFW, FD-2nd team)NFL Alumni Linebacker of the Year: LB Ray Lewis
Quarterback Club MVP: LB Ray LewisRavens Roost Unsung Hero: DL Larry Webster
Ravens Nest Lineman of the Year: DE Rob BurnettRavens Roost Extra Effort Award: FB Charles Evans
Ed Block Courage Award: LB Peter Boulware
Record . . . . . . . . . . . . . . . . . . . . . . . . . . . . . . . . . . . . . . . . . . . . . . . 8-8vs. AFC Central . . . . . . . . . . . . . . . . . . . . . . . . . . . . . . . . . . . . . . . . 6-4vs. AFC . . . . . . . . . . . . . . . . . . . . . . . . . . . . . . . . . . . . . . . . . . . . . . 6-7vs. NFC. . . . . . . . . . . . . . . . . . . . . . . . . . . . . . . . . . . . . . . . . . . . . . . 2-1Home . . . . . . . . . . . . . . . . . . . . . . . . . . . . . . . . . . . . . . . . . . . . . . . . 4-4Away . . . . . . . . . . . . . . . . . . . . . . . . . . . . . . . . . . . . . . . . . . . . . . . . . 4-4On Grass . . . . . . . . . . . . . . . . . . . . . . . . . . . . . . . . . . . . . . . . . . . . . 5-7Artificial Turf . . . . . . . . . . . . . . . . . . . . . . . . . . . . . . . . . . . . . . . . . . . 3-1Outdoors. . . . . . . . . . . . . . . . . . . . . . . . . . . . . . . . . . . . . . . . . . . . . . 7-7Indoors . . . . . . . . . . . . . . . . . . . . . . . . . . . . . . . . . . . . . . . . . . . . . . . 1-1Leading at Halftime. . . . . . . . . . . . . . . . . . . . . . . . . . . . . . . . . . . . . . 5-2Trailing at Halftime . . . . . . . . . . . . . . . . . . . . . . . . . . . . . . . . . . . . . . 2-5Tied at Halftime. . . . . . . . . . . . . . . . . . . . . . . . . . . . . . . . . . . . . . . . . 1-1Tied After 3 Quarters . . . . . . . . . . . . . . . . . . . . . . . . . . . . . . . . . . . . 0-0Leading After 3 Quarters. . . . . . . . . . . . . . . . . . . . . . . . . . . . . . . . . . 7-2Trailing After 3 Quarters . . . . . . . . . . . . . . . . . . . . . . . . . . . . . . . . . . 1-6Winning Coin Toss . . . . . . . . . . . . . . . . . . . . . . . . . . . . . . . . . . . . . . 2-4Losing Coin Toss . . . . . . . . . . . . . . . . . . . . . . . . . . . . . . . . . . . . . . . 6-4
Decided by 8 Points or less . . . . . . . . . . . . . . . . . . . . . . . . . . . . . . 4-5Decided by 3 Points or less . . . . . . . . . . . . . . . . . . . . . . . . . . . . . . .1-4When Scoring First . . . . . . . . . . . . . . . . . . . . . . . . . . . . . . . . . . . . . 5-4When Not Scoring First. . . . . . . . . . . . . . . . . . . . . . . . . . . . . . . . . . 3-4Positive Turnover Ratio . . . . . . . . . . . . . . . . . . . . . . . . . . . . . . . . . . 6-2Negative Turnover Ratio . . . . . . . . . . . . . . . . . . . . . . . . . . . . . . . . . 0-5Winning Penalty Ratio . . . . . . . . . . . . . . . . . . . . . . . . . . . . . . . . . . 5-2Negative Penalty Ratio . . . . . . . . . . . . . . . . . . . . . . . . . . . . . . . . . . 0-5Overtime. . . . . . . . . . . . . . . . . . . . . . . . . . . . . . . . . . . . . . . . . . . . . .1-0Preseason. . . . . . . . . . . . . . . . . . . . . . . . . . . . . . . . . . . . . . . . . . . . 4-0With a 100-Yard Rusher . . . . . . . . . . . . . . . . . . . . . . . . . . . . . . . . . 5-1With a 100-Yard Receiver . . . . . . . . . . . . . . . . . . . . . . . . . . . . . . . . 3-1Without a 100-yard Rusher . . . . . . . . . . . . . . . . . . . . . . . . . . . . . . . 3-7Without a 100-yard Receiver. . . . . . . . . . . . . . . . . . . . . . . . . . . . . . 5-7When Allowing a 100-Yard Rusher . . . . . . . . . . . . . . . . . . . . . . . . . 0-0When Not Allowing a 100-Yard Rusher. . . . . . . . . . . . . . . . . . . . . . 8-8When Allowing a 100-Yard Receiver . . . . . . . . . . . . . . . . . . . . . . . . 0-1When Not Allowing a 100-Yard Receiver . . . . . . . . . . . . . . . . . . . . 8-7
TOP THREE
SEASON TRENDS
COACHES
RAVENS HONOR ROLL
USUAL STARTERS
DEFENSIVE SPECIAL TEAMSFROM COACHES VIDEO FROM COACHES VIDEO

BALTIMORERAVENS.COM 357
2000 STATISTICS
GAM
E D
AY
RECORDS
HIS
TORY
2010
REVIE
W
PLAYERS
ORGANIZ
ATIO
N
337BALTIMORERAVENS.COM
2000 STATISTICS
RESULTS AND ATTENDANCEWON 12, LOST 4 (WILD CARD/SUPER BOWL XXXV CHAMPIONS)09/03 W 16-0 at Pittsburgh 55,04909/10 W 39-36 Jacksonville 68,84309/17 L 6-19 at Miami 73,46409/24 W 37-0 Cincinnati 68,48110/01 W 12-0 at Cleveland 73,01810/08 W 15-10 at Jacksonville 65,19410/15 L 3-10 at Washington 83,25210/22 L 6-14 Tennessee 69,20010/29 L 6-9 Pittsburgh 69,40511/05 W 27-7 at Cincinnati 54,759 11/12 W 24-23 at Tennessee 68,490 11/19 W 27-0 Dallas 69,416 11/26 W 44-7 Cleveland 68,36112/02 Bye Week12/10 W 24-3 San Diego 68,805 12/17 W 13-7 at Arizona 37,452 12/24 W 34-20 New York Jets 69,184
TEAM STATISTICS RAVENS OPPONENTTOTAL FIRST DOWNS 288 216 Rushing 116 59 Passing 156 135 Penalty 16 22 3rd Down: Made/Att 95/236 72/211 3rd Down Pct. 40.3 34.1 4th Down: Made/Att 1/6 4/19 4th Down Pct. 16.7 21.1POSSESSION AVG. 33:19 26:41TOTAL NET YARDS 5014 3967 Avg. Per Game 313.4 247.9 Total Plays 1058 924 Avg. Per Play 4.7 4.3NET YARDS RUSHING 2199 970 Avg. Per Game 137.4 60.6 Total Rushes 511 361NET YARDS PASSING 2815 2997 Avg. Per Game 175.9 187.3 Sacked/Yards Lost 43/287 35/178 Gross Yards 3102 3175 Att./Completions 504/287 528/295 Completion Pct. 56.9 55.9 Had Intercepted 19 23PUNTS/AVERAGE 86/40.2 87/44.5NET PUNTING AVG. 86/33.9 87/33.1PENALTIES/YARDS 95/730 84/535FUMBLES/BALL LOST 26/7 45/26TOUCHDOWNS 32 18 Rushing 9 5 Passing 20 11 Returns 3 2
SCORE BY PERIODS 1 2 3 4 OT PTSRAVENS 62 134 67 70 0 333 Opponents 44 36 43 42 0 165
SCORING TD RU PA RT K/PAT FG S PTSStover 0 0 0 0 30/30 35/39 0 135Ja. Lewis 6 6 0 0 0 38Ismail 5 0 5 0 0 30Sharpe 5 0 5 0 0 30Je. Lewis 3 0 1 2 0 18Taylor 3 0 3 0 0 18Ayanbadejo 2 1 1 0 0 12Holmes 2 2 0 0 0 12Johnson 2 0 2 0 0 12Stokley 2 0 2 0 0 12Gash 1 0 1 0 0 6McAlister 1 0 0 1 0 6Coates 0 0 0 0 0 2McCrary 0 0 0 0 1 2RAVENS 32 9 20 3 30/30 35/39 1 333Opponents 18 5 11 2 15/18 14/19 0 165
2-PT. CONVERSIONS: Coates, Ja. Lewis RAVENS 1-1; Opponents 4-4
SACKS: Burnett 10.5, Boulware 7.0, McCrary 6.5, Brown 3.0, R. Lewis 3.0, Adams 2.0, Trapp 2.0, Herring 1.0, RAVENS 35.0; Opponents 43.0
RUSHING NO YDS AVG LG TDJa. Lewis 309 1364 4.4 45 6Holmes 137 588 4.3 21 2Dilfer 20 75 3.8 19 0Banks 19 57 3.0 10 0Je. Lewis 3 38 12.7 23 0Ayanbadejo 15 37 2.5 8 1Johnson 2 21 10.5 19 0Taylor 2 11 5.5 12 0Stokley 1 6 6.0 6 0Gash 2 2 1.0 1 0Redman 1 0 0.0 0 0RAVENS 511 2199 4.3 45 9Opponents 361 970 2.7 33t 56
RECEIVING NO YDS AVG LG TDSharpe 67 810 12.1 59t 5Ismail 49 655 13.4 53t 5Holmes 32 221 6.9 27 0 Taylor 28 276 9.9 40 3 Ja. Lewis 27 296 11.0 45 0 Ayanbadejo 23 168 7.3 26 1 Je. Lewis 19 161 8.5 26 1 Johnson 12 156 13.0 46t 2Stokley 11 184 16.7 32 2Coates 9 84 9.3 28 0 Gash 6 30 5.0 9 1B. Davis 3 62 20.7 28 0 Dilfer 1 -1 -1.0 -1 0 RAVENS 287 3102 10.8 59t 20 Opponents 295 3175 10.8 67 11
INTERCEPTIONS NO YDS AVG LG TDStarks 6 125 20.8 64 0McAlister 4 165 41.3 98t 1Woodson 4 20 5.0 18 0Herring 3 74 24.7 30 0Harris 2 44 22.0 42 0R. Lewis 2 1 0.5 1 0Sharper 1 45 45.0 45 0Burnett 1 3 3.0 3 0RAVENS 23 477 20.7 98t 1Opponents 19 234 12.3 87t 2
PUNTING NO YDS AVG TB IN LG BLKRichardson 86 3457 40.2 8 35 55 0RAVENS 86 3457 40.2 8 35 55 0Opponents 87 3872 44.5 14 17 67 0
PUNT RETURNS RET FC YDS AVG LG TDJe. Lewis 36 9 578 16.1 89t 2Starks 9 1 135 15.0 47 0RAVENS 45 10 713 15.8 89t 2Opponents 41 23 382 9.3 31 0
KICKOFF RETURNS NO YDS AVG LG TDHarris 39 907 23.3 41 0Ismail 2 51 25.5 38 0Brown 1 0 0.0 0 0Holmes 1 7 7.0 7 0Je. Lewis 1 23 23.0 23 0Washington 1 17 17.0 17 0RAVENS 45 1005 22.3 41 0Opponents 73 1558 21.3 52 0
FIELD GOALS 1-19 20-29 30-39 40-49 50+Stover 2/2 9/9 12/13 10/12 2/3RAVENS 2/2 9/9 12/13 10/12 2/3Opponents 1/1 2/2 3/ 4 8/12 0/0
Stover:(23G,26G,33G)(44G)(30B,27G,33G(30G,37G,19G(45G,30G,44G,51N,22G)(47G,32G,43G,21G,24G)(51G)(21G,38G)(51G,49G)(38G,32G)(45G)(25G,47N,19G)(39G,26G,38G)(32G)(42G,42G)(42G,45N)
Opponents: (45N)(36G,45G,48G,34G,48G)(42G,41G)()()(49G,31N)(37G)()(24G)()(23G,43N)(46N)()(47G)(46N)(40G,19G)
PASSING ATT COMP YARDS COMP% YDS/ATT TD TD% INT INT% LG SACK/LOST RATINGBanks 274 150 1578 54.7 5.76 8 2.9 8 2.9 53t 20/152 69.3 Dilfer 226 134 1502 59.3 6.65 12 5.3 11 4.9 59t 23/135 76.6 Redman 3 2 19 66.7 6.33 0 0.0 0 0.0 12 0/0 84.0 Je. Lewis 1 1 3 100.0 3.00 0 0.0 0 0.0 3 0/0 79.2 RAVENS 504 287 3102 56.9 6.15 20 4.0 19 3.8 59t 43/287 72.7 Opponents 528 295 3175 55.9 6.01 11 2.1 23 4.4 67 35/178 62.5

2019 BALTIMORE RAVENS MEDIA GUIDE358
2000 STATISTICS
ORGANIZ
ATIO
N P
LAYERS 20
10 R
EVIE
W H
ISTORY R
ECORDS G
AM
E D
AY
338 BALTIMORE RAVENS FAN & MEDIA GUIDE 2011
Reg. Post.Record . . . . . . . . . . . . . . . . . . . . . . . . . . . . . . . . . . . . . 12-4 . . . . . . 4-0vs. AFC Central . . . . . . . . . . . . . . . . . . . . . . . . . . . . . . . 8-2 . . . . . . 1-0vs. AFC . . . . . . . . . . . . . . . . . . . . . . . . . . . . . . . . . . . . 10-3 . . . . . . 3-0vs. NFC. . . . . . . . . . . . . . . . . . . . . . . . . . . . . . . . . . . . . . 2-1 . . . . . . 1-0Home . . . . . . . . . . . . . . . . . . . . . . . . . . . . . . . . . . . . . . . 6-2 . . . . . . 1-0Away . . . . . . . . . . . . . . . . . . . . . . . . . . . . . . . . . . . . . . . . 6-2 . . . . . . 3-0On Grass . . . . . . . . . . . . . . . . . . . . . . . . . . . . . . . . . . . 11-4 . . . . . . 4-0Artificial Turf . . . . . . . . . . . . . . . . . . . . . . . . . . . . . . . . . . 1-0 . . . . . . 0-0Outdoors. . . . . . . . . . . . . . . . . . . . . . . . . . . . . . . . . . . . 12-4 . . . . . . 4-0Indoors . . . . . . . . . . . . . . . . . . . . . . . . . . . . . . . . . . . . . . 0-0 . . . . . . 0-0Leading at Halftime. . . . . . . . . . . . . . . . . . . . . . . . . . . . 11-1 . . . . . . 3-0Trailing at Halftime . . . . . . . . . . . . . . . . . . . . . . . . . . . . . 1-2 . . . . . . 0-0Tied at Halftime. . . . . . . . . . . . . . . . . . . . . . . . . . . . . . . . 0-1 . . . . . . 1-0Tied After 3 Quarters . . . . . . . . . . . . . . . . . . . . . . . . . . . 0-1 . . . . . . 1-0Leading After 3 Quarters. . . . . . . . . . . . . . . . . . . . . . . . 11-0 . . . . . . 3-0Trailing After 3 Quarters . . . . . . . . . . . . . . . . . . . . . . . . . 1-3 . . . . . . 0-0Winning Coin Toss . . . . . . . . . . . . . . . . . . . . . . . . . . . . . 5-4 . . . . . . 1-0Losing Coin Toss . . . . . . . . . . . . . . . . . . . . . . . . . . . . . . 7-0 . . . . . . 3-0Decided by 8 Points or less . . . . . . . . . . . . . . . . . . . . . . 4-3 . . . . . . 0-0Decided by 3 Points or less . . . . . . . . . . . . . . . . . . . . . . 2-1 . . . . . . 0-0
Reg. Post.When Scoring First . . . . . . . . . . . . . . . . . . . . . . . . . . . . . 9-2 . . . . . . 3-0When Not Scoring First. . . . . . . . . . . . . . . . . . . . . . . . . . 3-2 . . . . . . 1-0Positive Turnover Ratio . . . . . . . . . . . . . . . . . . . . . . . . . 12-3 . . . . . . 4-0Negative Turnover Ratio . . . . . . . . . . . . . . . . . . . . . . . . . 0-1 . . . . . . 0-0Winning Penalty Ratio . . . . . . . . . . . . . . . . . . . . . . . . . . 3-1 . . . . . . 1-0Losing Penalty Ratio. . . . . . . . . . . . . . . . . . . . . . . . . . . . 5-3 . . . . . . 3-0Overtime. . . . . . . . . . . . . . . . . . . . . . . . . . . . . . . . . . . . . 0-0 . . . . . . 0-0Preseason. . . . . . . . . . . . . . . . . . . . . . . . . . . . . . . . . . . . 4-0 . . . . . . 0-0With a 100-Yard Rusher . . . . . . . . . . . . . . . . . . . . . . . . . 6-0 . . . . . . 2-0With a 100-Yard Receiver . . . . . . . . . . . . . . . . . . . . . . . . 2-1 . . . . . . 0-0Without a 100-yard Rusher . . . . . . . . . . . . . . . . . . . . . . . 6-4 . . . . . . 2-0Without a 100-yard Receiver. . . . . . . . . . . . . . . . . . . . . 10-3 . . . . . . 4-0When Allowing a 100-Yard Rusher . . . . . . . . . . . . . . . . . 0-0 . . . . . . 0-0When Not Allowing a 100-Yard Rusher. . . . . . . . . . . . . 12-4 . . . . . . 4-0When Allowing a 100-Yard Receiver . . . . . . . . . . . . . . . . 3-0 . . . . . . 3-0When Not Allowing a 100-Yard Receiver . . . . . . . . . . . . 9-4 . . . . . . 4-0With a 300-Yard Passer . . . . . . . . . . . . . . . . . . . . . . . . . 0-0 . . . . . . 0-0Without a 300-Yard Passer . . . . . . . . . . . . . . . . . . . . . . 12-4 . . . . . 4-0When Allowing a 300-Yard Passer . . . . . . . . . . . . . . . . . 2-0 . . . . . . 0-0When Not Allowing a 300-Yard Passer . . . . . . . . . . . . . 10-4 . . . . . . 4-0
PLAYER TT SOLO AS SACKS YDS INT PD FF FRLewis, Ray 187 120 67 3 33 2 10 0 3McCrary, Michael 103 60 43 6.5 35 0 2 2 3Sharper, Jamie 102 68 34 0 0 1 4 5 2Burnett, Rob 97 53 44 10.5 57 1 3 3 5Woodson, Rod 82 65 17 0 0 4 10 1 4Siragusa, Tony 75 40 35 0 0 0 2 0 1Adams, Sam 69 36 33 2 5 0 7 5 1Herring, Kim 66 54 12 1 5 3 12 2 0Starks, Duane 59 46 13 0 0 6 28 0 1McAlister, Chris 50 39 11 0 0 4 23 0 1Boulware, Peter 45 26 19 7 24 0 1 2 0Harris, Corey 37 31 6 0 0 2 8 1 0Dalton, Lional 33 21 12 0 0 0 2 0 0Washington, Keith 29 14 15 0 0 0 0 0 1Bailey, Robert 27 20 7 0 0 0 4 3 1Trapp, James 25 23 2 2 5 0 4 1 0Brown, Cornell 25 17 8 3 17 0 0 2 0Webster, Larry 10 8 2 0 0 0 0 0 1Davis, Anthony 5 2 3 0 0 0 0 0 0Jackson, Brad 4 2 2 0 0 0 0 0 0Powell, Carl 1 0 1 0 0 0 0 0 0Thomas, Adalius 1 0 1 0 0 0 0 0 0
OFFENSE WR 87 Qadry Ismail WR 83 Patrick Johnson LT 75 Jonathan Ogden LG 64 Edwin Mulitalo C 60 Jeff Mitchell RG 62 Mike Flynn RT 70 Harry Swayne TE 82 Shannon Sharpe QB 8 Trent Dilfer 12 Tony Banks RB 31 Jamal Lewis FB 32 Sam Gash
DEFENSE LDE 90 Rob Burnett LDT 95 Sam Adams RDT 98 Tony Siragusa RDE 99 Michael McCrary LLB 58 Peter Boulware MLB 52 Ray Lewis RLB 55 Jamie Sharper LCB 22 Duane Starks RCB 21 Chris McAlister SS 20 Kim Herring FS 26 Rod Woodson
PLAYER TT SOLO AS FF FR BKHarris, Corey 26 20 6 1 0 0Brigance, O.J. 25 16 9 2 1 0Mitchell, Anthony 18 14 4 0 0 0Davis, Billy 15 12 3 0 0 0Trapp, James 15 10 5 1 0 0Davis, Anthony 14 12 2 0 1 0Jackson, Brad 13 9 4 0 2 0Herring, Kim 11 10 1 0 0 0Poindexter, Anthony 11 8 3 1 0 0Brown, Cornell 9 6 3 0 0 0Bailey, Robert 7 4 3 0 0 0Sharper, Jamie 5 5 0 0 0 0Ayanbadejo, Obafemi 3 3 0 0 0 0Jones, John 3 2 1 0 0 0Johnson, Patrick 3 1 2 0 0 0Love, Clarence 2 2 0 1 0 0Richardson, Kyle 2 2 0 0 0 0Stover, Matt 2 2 0 0 0 0Powell, Carl 1 1 0 0 0 0Wainright, Frank 1 0 1 0 0 0
Brian Billick, Head Coach; Matt Cavanaugh, Offensive Coordinator/
Quarterbacks; Marvin Lewis, Defensive Coordinator; Jim Colletto,
Offensive Line; Jack Del Rio, Linebackers; Jeff Friday, Strength and
Conditioning; Wade Harman, Tight Ends/Assistant Offensive Line;
Donnie Henderson, Secondary; Milt Jackson, Wide Receivers; Chip
Morton, Assistant Strength and Conditioning; Russ Purnell, Special
Teams; Rex Ryan, Defensive Line; Steve Shafer, Assistant Head
Coach/Secondary; Matt Simon, Running Backs; Mike Smith, Defensive
Assistant
SOLO SACKS FF FR PD 120 Ray Lewis 10.5 Rob Burnett 5 Sam Adams 5 Rob Burnett 28 Duane Starks 68 Jamie Sharper 7.0 Peter Boulware 5 Jamie Sharper 4 Rod Woodson 23 Chris McAlister 65 Rod Woodson 6.5 Michael McCrary 3 2 players tied 3 2 players tied 12 Kim Herring
NFL Defensive Player of the Year: LB Ray LewisSuper Bowl XXXV MVP: LB Ray Lewis
Pro Bowl: DT Sam Adams (starter); LB Ray Lewis (starter); OT Jonathan Ogden (starter); K Matt Stover (starter); S Rod Woodson (starter)All Pro: DT Sam Adams (AP-2nd Team, PFW-AFC, FN); DE Rob Burnett (AP-2nd Team, SI, FN, FD); RB Jamal Lewis (PFW-Rookie Team, FN-
Rookie Team, FD); PR Jermaine Lewis (FN, FD); LB Ray Lewis (AP-1st Team, SI, PFW, CPFW, TSN, FN, FD, USA); CB Chris McAlister (FD-2nd Team); OT Jonathan Ogden (AP-1st Team, SI, PFW, CPFW, TSN, FN, FD, USA); CB Duane Starks (USA); K Matt Stover (AP-1st Team, PFW,
CPFW, TSN, FN, FD); FS Rod Woodson (AP-2nd Team, PFW-AFC, CPFW-2nd Team, FN)Quarterback Club MVP: LB Ray Lewis
Ravens Roost Unsung Hero: S Kim HerringRavens Nest Lineman of the Year: DE Rob BurnettRavens Roost Extra Effort Award: S Corey HarrisEd Block Courage Award: S Anthony Poindexter
DEFENSIVE SPECIAL TEAMS
TOP THREE
SEASON TRENDS
COACHES
RAVENS HONOR ROLL
USUAL STARTERS
FROM COACHES VIDEO FROM COACHES VIDEO

BALTIMORERAVENS.COM 359
2000 POSTSEASON STATISTICS
GAM
E D
AY
RECORDS
HIS
TORY
2010
REVIE
W
PLAYERS
ORGANIZ
ATIO
N
339BALTIMORERAVENS.COM
2000 POSTSEASON STATISTICS
RUSHING NO YDS AVG LG TDJa. Lewis 103 338 3.3 27t 4Holmes 18 45 2.5 11 0Dilfer 13 7 0.5 6 0Je. Lewis 3 7 2.3 5 0Gash 1 0 0.0 0 0Banks 1 -1 -1.0 -1 0Ismail 1 -4 -4.0 -4 0RAVENS 140 392 2.8 27t 4Opponents 84 258 3.1 27 1
RECEIVING NO YDS AVG LG TDIsmail 9 150 16.7 44 0Stokley 7 91 13.0 38t 1Sharpe 6 230 38.3 96t 2Ja. Lewis 5 40 8.0 15 0Coates 4 54 13.5 24 0Johnson 1 8 8.0 8 0Gash 1 7 7.0 7 0Je. Lewis 1 6 6.0 6 0Holmes 1 4 4.0 4 0RAVENS 35 590 16.9 96t 3Opponents 77 672 8.7 31 0
INTERCEPTIONS NO YDS AVG LG TDStarks 3 93 31.0 49t 1R. Lewis 2 54 27.0 50t 1Sharper 2 19 9.5 15 0McAlister 1 4 4.0 4 0Herring 1 2 2.0 2 0Bailey 1 0 0.0 0 0RAVENS 10 172 17.2 50t 2Opponents 1 2 2.0 2 0
PUNTING NO YDS AVG TB IN LG BLKRichardson 33 1318 39.9 3 14 66 2Team 2 0 0 0 0 0 0RAVENS 35 1318 37.7 3 14 66 2Opponents 32 1282 40.1 0 8 64 0
PUNT RETURNS RET FC YDS AVG LG TDJe. Lewis 11 9 122 11.1 38 0 RAVENS 11 9 122 11.1 38 0 Opponents 13 6 73 5.6 19 0
KICKOFF RETURNS NO YDS AVG LG TDJe. Lewis 5 189 37.8 84t 1Harris 3 51 17.0 20 0Coates 1 8 8.0 8 0RAVENS 9 248 27.6 84t 1Opponents 18 340 18.9 97t 1
FIELD GOALS 1-19 20-29 30-39 40-49 50+Stover 0/0 2/2 3/4 1/2 0/0RAVENS 0/0 2/2 3/4 1/2 0/0Opponents 0/0 2/2 1/3 0/1 0/0
Stover: ()(38G)(36N,31G,28G,21G)(47G,41N,34G)Opponents: (31G)(45B,31N,21G,37B)(24G)()
PLAYER TT SOLO AS SACKS YDS INT PD FF FRLewis, Ray 44 28 16 0 0 2 7 0 1Woodson, Rod 24 19 5 0 0 0 2 0 0Burnett, Rob 21 14 7 2 12 0 1 0 0Sharper, Jamie 20 14 6 2 10 2 2 1 0Starks, Duane 19 18 1 0 0 3 6 0 0McCrary, Michael 18 14 4 6 44 0 0 1 0Harris, Corey 18 13 5 0 0 0 2 0 0McAlister, Chris 17 15 2 0 0 1 8 0 0Boulware, Peter 17 12 4 2 14 0 0 0 0Siragusa, Tony 17 10 7 0 0 0 4 0 0Webster, Larry 10 7 3 0 0 0 1 0 0Washington, Keith 10 7 3 1 9 0 0 0 0Adams, Sam 9 7 2 1 4 0 3 1 0Dalton, Lional 5 5 0 0 0 0 0 0 0Bailey, Robert 5 4 1 0 0 1 1 0 0Trapp, James 3 2 1 0 0 0 1 0 0Brown, Cornell 1 1 0 0 0 0 0 0 0Davis, Anthony 1 1 0 0 0 0 0 0 0Herring, Kim 1 1 0 0 0 1 2 0 0Mitchell, Anthony 1 1 0 0 0 0 0 0 0
PLAYER TT SOLO AS FF FR BK
Brigance, O.J. 10 8 2 0 0 0
Jackson, Brad 8 7 1 0 0 0
Davis, Billy 8 6 2 0 0 0
Trapp, James 6 3 3 1 0 0
Mitchell, Anthony 4 3 1 0 0 0
Harris, Corey 4 2 2 0 0 0
Starks, Duane 2 2 0 0 0 0
Davis, Anthony 2 1 1 0 0 0
Herring, Kim 2 1 1 0 0 0
Bailey, Robert 1 1 0 0 1 0
Brown, Cornell 1 1 0 0 0 0
Poindexter, Anthony 1 1 0 0 0 0
Sharper, Jamie 1 1 0 0 0 0
Thomas, Adalius 1 1 0 0 0 0
Washington, Keith 0 0 0 0 0 2
RESULTS AND ATTENDANCEWON 4, LOST 0 (SUPER BOWL XXXV CHAMPIONS) 12/31 W 21-3 Denver 69,63801/07 W 24-10 at Tennessee 68,52701/14 W 16-3 at Oakland 62,78401/28 W 34-7 at New York Giants 71,921
TEAM STATISTICS RAVENS OPPONENTTOTAL FIRST DOWNS 44 55 Rushing 19 16 Passing 22 32 Penalty 3 7 3rd Down: Made/Att 15/60 12/60 3rd Down Pct. 25.0 20.0 4th Down: Made/Att 0/0 2/6 4th Down Pct. 0.0 33.3POSSESSION AVG. 30:10 29:51TOTAL NET YARDS 900 837 Avg. Per Game 225.0 209.3 Total Plays 226 259 Avg. Per Play 4.0 3.2NET YARDS RUSHING 392 258 Avg. Per Game 98.0 64.5 Total Rushes 140 84NET YARDS PASSING 508 579 Avg. Per Game 127.0 144.8 Sacked/Yards Lost 10/82 14/93 Gross Yards 590 672 Att./Completions 76/35 161/77 Completion Pct. 46.1 47.8 Had Intercepted 1 10PUNTS/AVERAGE 35/37.7 32/40.1NET PUNTING AVG. 35/33.9 32/36.3PENALTIES/YARDS 30/245 23/151FUMBLES/BALL LOST 5/1 4/2TOUCHDOWNS 11 2 Rushing 4 1 Passing 3 0 Returns 4 1
SCORE BY PERIODS 1 2 3 4 OT PTSRAVENS 7 34 27 27 0 95Opponents 7 3 13 0 0 23
SCORING TD RU PA RT K/PAT FG S PTSStover 0 0 0 0 11/11 6/8 0 29Ja. Lewis 4 4 0 0 0 24Sharpe 2 0 2 0 0 12Je. Lewis 1 0 0 1 0 6R. Lewis 1 0 0 1 0 6A. Mitchell 1 0 0 1 0 6Starks 1 0 0 1 0 6Stokley 1 0 1 0 0 6RAVENS 11 4 3 4 11/11 6/8 0 95Opponents 2 1 0 1 2/2 3/6 0 235
2-PT. CONVERSIONS: RAVENS 0-0; Opponents 0-0
SACKS: McCrary 6.0, Boulware 2.0, Burnett 2.0, Sharper 2.0, Adams 1.0, Washington 1.0, RAVENS 14.0, Opponents 10.0
PASSING ATT COMP YARDS COMP% YDS/ATT TD TD% INT INT% LG SACK/LOST RATINGDilfer 73 35 590 47.9 8.08 3 4.1 1 1.4 96t 10/82 83.7Banks 3 0 0 0.0 0.00 0 0.0 0 0.0 0 0/0 39.6RAVENS 76 35 590 46.1 7.76 3 3.9 1 1.3 96t 10/82 80.5Opponents 161 77 672 47.8 4.17 0 0.0 10 6.2 31 14/93 33.4
DEFENSIVE SPECIAL TEAMSFROM COACHES VIDEO FROM COACHES VIDEO

2019 BALTIMORE RAVENS MEDIA GUIDE360
2001 STATISTICS
ORGANIZ
ATIO
N P
LAYERS 20
10 R
EVIE
W H
ISTORY R
ECORDS G
AM
E D
AY
340 BALTIMORE RAVENS FAN & MEDIA GUIDE 2011
2001 STATISTICS
RESULTS AND ATTENDANCEWON 10, LOST 6 (WILD CARD)09/09 W 17-6 Chicago 69,36509/23 L 10-21 at Cincinnati 49,63209/30 W 20-13 at Denver 75,08210/07 W 26-7 Tennessee 69,49410/14 L 23-31 at Green Bay 59,86610/21 L 14-24 at Cleveland 72,81810/28 W 18-17 Jacksonville 69,43911/04 W 13-10 at Pittsburgh 62,90611/12 W 16-10 at Tennessee 68,79811/18 L 17-27 Cleveland 69,35311/25 W 24-21 at Jacksonville 53,53012/02 W 39-27 Indianapolis 69,38212/09 Bye Week12/16 L 21-26 Pittsburgh 69,50612/23 W 16-0 Cincinnati 68,98712/29 L 10-22 at Tampa Bay 65,61901/07 W 19-3 Minnesota 69,465
TEAM STATISTICS RAVENS OPPONENTTOTAL FIRST DOWNS 299 262 Rushing 92 81 Passing 180 161 Penalty 27 20 3rd Down: Made/Att 82/230 70/227 3rd Down Pct. 35.7 30.8 4th Down: Made/Att 3/13 6/15 4th Down Pct. 23.1 40.0POSSESSION AVG. 29:39 30:21TOTAL NET YARDS 5124 4446 Avg. Per Game 320.3 277.9 Total Plays 1080 1010 Avg. Per Play 4.7 4.4NET YARDS RUSHING 1810 1411 Avg. Per Game 113.1 88.2 Total Rushes 483 410NET YARDS PASSING 3314 3035 Avg. Per Game 207.1 189.7 Sacked/Yards Lost 40/281 45/290 Gross Yards 3595 3325 Att./Completions 557/320 555/321 Completion Pct. 57.5 57.8 Had Intercepted 20 16PUNTS/AVERAGE 87/38.0 98/41.6NET PUNTING AVG. 87/33.6 98/33.6PENALTIES/YARDS 89/728 105/903FUMBLES/BALL LOST 31/16 22/12TOUCHDOWNS 31 30 Rushing 11 10 Passing 18 16 Returns 2 4
SCORE BY PERIODS 1 2 3 4 OT PTSRAVENS 29 92 63 119 0 303Opponents 38 77 89 61 0 265
SCORING TD RU PA RT K/PAT FG S PTSStover 0 0 0 0 25/25 30/35 0 115Ismail 7 0 7 0 0 44Brookins 5 5 0 0 0 30Allen 3 3 0 0 0 18T. Taylor 3 0 3 0 0 18Ayanbadejo 2 1 1 0 0 12Sharpe 2 0 2 0 0 12Stokley 2 0 2 0 0 12Cunningham 1 1 0 0 0 6Gash 1 0 1 0 0 6Grbac 1 1 0 0 0 6Heap 1 0 1 0 0 6Johnson 1 0 1 0 0 6Sharper 1 0 0 1 0 6Woodson 1 0 0 1 0 6RAVENS 31 11 18 2 25/25 30/35 0 303Opponents 30 10 16 4 28/28 19/33 0 265
2-PT. CONVERSIONS: Ismail, RAVENS 1-6; Opponents 0-2
SACKS: Boulware 15.0, McCrary 7.5, Sharper 6.0, R. Lewis 3.5, A. Thomas 3.5, Adams 2.0, Siragusa 2.0, Douglas 1.0, Gregg 1.0, S. Taylor 1.0, Team 1.0, Trapp 1.0, Webster 0.5, RAVENS 44.0, Opponents 40.0
RUSHING NO YDS AVG LG TDAllen 168 658 3.9 26 3Brookins 151 551 3.6 25 5M. Williams 65 291 4.5 55 0Ayanbadejo 46 173 3.8 17 1T. Taylor 5 46 9.2 16 0Cunningham 14 40 2.9 15 1Je. Lewis 9 33 3.7 14 0Grbac 21 18 0.9 6 1Stokley 1 1 1.0 1 0Richardson 1 0 0.0 0 0Gash 2 -1 -.5 0 0RAVENS 483 1810 3.7 55 11Opponents 410 1411 3.4 38 10
RECEIVING NO YDS AVG LG TDIsmail 74 1059 14.3 77t 7Sharpe 73 811 11.1 37 2T. Taylor 42 560 13.3 63 3Stokley 24 344 14.3 46 2Ayanbadejo 24 121 5.0 18 1M. Williams 23 210 9.1 46 0Allen 17 68 4.0 11 0Heap 16 206 12.9 24t 1Gash 9 80 8.9 16 1Brookins 6 45 7.5 15 0Johnson 5 57 11.4 25 1Je. Lewis 4 32 8.0 12 0Jones 2 13 6.5 13 0A. Mitchell 1 -11 -11.0 -1 0RAVENS 320 3595 11.2 77t 1Opponents 321 3325 10.4 90t 16
INTERCEPTIONS NO YDS AVG LG TDStarks 4 9 2.3 9 0R. Lewis 3 115 38.3 64 0Woodson 3 57 19.0 47t 1Harris 2 1 0.5 1 0Trapp 1 15 15.0 15 0McCrary 1 1 1.0 1 0McAlister 1 0 0.0 0 0Porter 1 -3 -3.0 -3 0RAVENS 16 195 12.2 64 1Opponents 20 331 16.6 66t 3
PUNTING NO YDS AVG TB IN LG BLKRichardson 85 3309 38.9 10 29 65 2RAVENS 87 3309 38.0 10 29 65 2Opponents 98 4076 41.6 11 24 69 0
PUNT RETURNS RET FC YDS AVG LG TDJe. Lewis 42 9 519 12.4 62 0McAlister 5 1 44 8.8 24 0Lake 1 0 0 0.0 0 0RAVENS 48 10 563 11.7 62 0Opponents 33 22 183 5.5 30 0
KICKOFF RETURNS NO YDS AVG LG TDJe. Lewis 42 1039 24.7 76 0Harris 11 235 21.4 34 0Johnson 2 39 19.5 23 0Bobo 1 11 11.0 11 0Brookins 1 23 23.0 23 0RAVENS 57 1347 23.6 76 0Opponents 64 1393 21.8 51 0
FIELD GOALS 1-19 20-29 30-39 40-49 50+Stover 0/0 16/16 9/10 5/9 0/0RAVENS 0/0 16/16 9/10 5/9 0/0Opponents 0/0 7/7 6/11 6/15 0/0
Stover: (46N,37G)(38G)(29G,26G)(26G,25G)(28G)(21G,38G)(49G,28G)(25G,39G)(31G,33G,30G)(42G)(41G,41N)(26G,30G,29G,27G,46N)(48N)(43G,29G,433N,43G)(24G)(21G,20G,38G20G)
Opponents: (20G,43N,46G)(43N,39N,45N)(43G,49G)(46N)(33G,47N)(33G)(40G)(38G,41N,33N,48N,35)(48N,27G)(29G,42G)(38N)(33G,25G)(22G,33G,32N)()(42G,38G,24G,40N)(26G)
PASSING ATT COMP YARDS COMP% YDS/ATT TD TD% INT INT% LG SACK/LOST RATINGGrbac 467 265 3033 56.7 6.49 15 3.2 18 3.9 77t 28/215 71.1Cunningham 89 54 573 60.7 6.44 3 3.4 2 2.2 30 12/66 81.3Richardson 1 1 -11 100.0 -11.00 0 0.0 0 0.0 11 0/0 79.2RAVENS 557 320 3595 57.5 6.45 18 3.2 20 3.6 77t 40/281 72.7Opponents 555 321 3325 57.8 5.99 16 2.9 16 2.9 90t 45/290 72.8

BALTIMORERAVENS.COM 361
2001 STATISTICS
GAM
E D
AY
RECORDS
HIS
TORY
2010
REVIE
W
PLAYERS
ORGANIZ
ATIO
N
341BALTIMORERAVENS.COM
Reg. Post.Record . . . . . . . . . . . . . . . . . . . . . . . . . . . . . . . . . . . . . 10-6 . . . . . . 1-1vs. AFC Central . . . . . . . . . . . . . . . . . . . . . . . . . . . . . . . 6-4 . . . . . . 0-1vs. AFC . . . . . . . . . . . . . . . . . . . . . . . . . . . . . . . . . . . . . 8-4 . . . . . . 1-1vs. NFC. . . . . . . . . . . . . . . . . . . . . . . . . . . . . . . . . . . . . . 2-2 . . . . . . 0-0Home . . . . . . . . . . . . . . . . . . . . . . . . . . . . . . . . . . . . . . . 6-2 . . . . . . 0-0Away . . . . . . . . . . . . . . . . . . . . . . . . . . . . . . . . . . . . . . . . 4-4 . . . . . . 1-1On Grass . . . . . . . . . . . . . . . . . . . . . . . . . . . . . . . . . . . 10-6 . . . . . . 1-1Artificial Turf . . . . . . . . . . . . . . . . . . . . . . . . . . . . . . . . . . 0-0 . . . . . . 0-0Outdoors. . . . . . . . . . . . . . . . . . . . . . . . . . . . . . . . . . . . 10-6 . . . . . . 1-1Indoors . . . . . . . . . . . . . . . . . . . . . . . . . . . . . . . . . . . . . . 0-0 . . . . . . 0-0Leading at Halftime. . . . . . . . . . . . . . . . . . . . . . . . . . . . . 5-1 . . . . . . 1-0Trailing at Halftime . . . . . . . . . . . . . . . . . . . . . . . . . . . . . 2-5 . . . . . . 0-1Tied at Halftime. . . . . . . . . . . . . . . . . . . . . . . . . . . . . . . . 3-0 . . . . . . 0-0Tied After 3 Quarters . . . . . . . . . . . . . . . . . . . . . . . . . . . 2-0 . . . . . . 0-0Leading After 3 Quarters. . . . . . . . . . . . . . . . . . . . . . . . . 5-0 . . . . . . 1-0Trailing After 3 Quarters . . . . . . . . . . . . . . . . . . . . . . . . . 3-6 . . . . . . 0-1Winning Coin Toss . . . . . . . . . . . . . . . . . . . . . . . . . . . . . 6-2 . . . . . . 1-1Losing Coin Toss . . . . . . . . . . . . . . . . . . . . . . . . . . . . . . 4-4 . . . . . . 0-0Decided by 8 Points or less . . . . . . . . . . . . . . . . . . . . . . 5-2 . . . . . . 0-0Decided by 3 Points or less . . . . . . . . . . . . . . . . . . . . . . 3-0 . . . . . . 0-0
Reg. Post.When Scoring First . . . . . . . . . . . . . . . . . . . . . . . . . . . . . 5-2 . . . . . . 0-0When Not Scoring First. . . . . . . . . . . . . . . . . . . . . . . . . . 5-4 . . . . . . 1-1Positive or Even Turnover Ratio . . . . . . . . . . . . . . . . . . . 9-0 . . . . . . 1-0Negative Turnover Ratio . . . . . . . . . . . . . . . . . . . . . . . . . 1-6 . . . . . . 0-1Winning Penalty Ratio . . . . . . . . . . . . . . . . . . . . . . . . . . 7-3 . . . . . . 1-0Losing Penalty Ratio. . . . . . . . . . . . . . . . . . . . . . . . . . . . 3-2 . . . . . . 0-1Overtime. . . . . . . . . . . . . . . . . . . . . . . . . . . . . . . . . . . . . 0-0 . . . . . . 0-0Preseason. . . . . . . . . . . . . . . . . . . . . . . . . . . . . . . . . . . . 1-2 . . . . . . 0-0With a 100-Yard Rusher . . . . . . . . . . . . . . . . . . . . . . . . . 3-0 . . . . . . 1-0With a 100-Yard Receiver . . . . . . . . . . . . . . . . . . . . . . . . 1-0 . . . . . . 0-0Without a 100-yard Rusher . . . . . . . . . . . . . . . . . . . . . . . 7-6 . . . . . . 0-1Without a 100-yard Receiver. . . . . . . . . . . . . . . . . . . . . . 9-6 . . . . . . 1-1When Allowing a 100-Yard Rusher . . . . . . . . . . . . . . . . . 1-0 . . . . . . 0-0When Not Allowing a 100-Yard Rusher. . . . . . . . . . . . . . 9-6 . . . . . . 1-1When Allowing a 100-Yard Receiver . . . . . . . . . . . . . . . . 1-2 . . . . . . 0-0When Not Allowing a 100-Yard Receiver . . . . . . . . . . . . 9-4 . . . . . . 1-1With a 300-Yard Passer . . . . . . . . . . . . . . . . . . . . . . . . . 0-1 . . . . . . 0-0Without a 300-Yard Passer . . . . . . . . . . . . . . . . . . . . . . 10-5 . . . . . 1-1When Allowing a 300-Yard Passer . . . . . . . . . . . . . . . . . 2-2 . . . . . . 0-0When Not Allowing a 300-Yard Passer . . . . . . . . . . . . . . 8-4 . . . . . . 1-1
PLAYER TT SOLO AS SACKS YDS INT PD FF FRLewis, Ray 196 130 66 3.5 26 3 13 1 1
Sharper, Jamie 135 101 34 6 31 0 12 0 1
Woodson, Rod 93 70 23 0 0 3 13 1 1
Harris, Corey 91 70 21 0 0 2 12 3 4
Boulware, Peter 82 51 31 15 86.5 0 4 3 1
McAlister, Chris 69 59 10 0 0 1 11 0 0
McCrary, Michael 64 42 22 7.5 42.5 1 2 1 0
Starks, Duane 59 52 7 0 0 4 17 2 0
Siragusa, Tony 58 27 31 2 12 0 3 0 0
Adams, Sam 51 28 23 2 16 0 2 1 0
Burnett, Rob 50 28 22 0 0 0 6 0 1
Thomas, Adalius 39 27 12 3.5 32.5 0 8 3 0
Lake, Carnell 32 27 5 0 0 0 0 0 1
Trapp, James 31 25 6 1 8 1 4 0 0
Dalton, Lional 29 15 14 0 0 0 0 0 0
Webster, Larry 28 13 15 0.5 1.5 0 0 0 0
Jackson, Brad 25 13 12 0 0 0 1 1 0
Gregg, Kelly 19 10 9 1 7 0 1 0 0
Mitchell, Anthony 11 9 2 0 0 0 1 0 0
Porter, Alvin 8 8 0 0 0 1 1 0 0
Taylor, Shannon 5 2 3 1 6 0 0 0 1
Douglas, Marques 3 2 1 1 11 0 0 0 0
OFFENSE
WR 87 Qadry Ismail
WR 89 Travis Taylor
LT 75 Jonathan Ogden
LG 64 Edwin Mulitalo
C 62 Mike Flynn
RG 66 Bennie Anderson
RT 77 Kipp Vickers
TE 82 Shannon Sharpe
QB 18 Elvis Grbac
RB 29 Terry Allen
FB 32 Sam Gash
DEFENSE
LDE 90 Rob Burnett
LDT 95 Sam Adams
RDT 98 Tony Siragusa
RDE 99 Michael McCrary
LLB 58 Peter Boulware
MLB 52 Ray Lewis
RLB 55 Jamie Sharper
LCB 22 Duane Starks
RCB 21 Chris McAlister
SS 45 Corey Harris
FS 26 Rod Woodson
PLAYER TT SOLO AS FF FR BK
Thomas, Adalius 18 14 4 0 0 0
Mitchell, Anthony 18 12 6 0 0 0
Jackson, Brad 16 9 7 0 1 0
Porter, Alvin 14 11 3 1 0 0
Trapp, James 12 9 3 0 0 0
Taylor, Shannon 9 8 1 0 0 0
Hartwell, Edgerton 9 5 4 0 0 0
Baxter, Gary 8 8 0 0 0 0
Ayanbadejo, Obafemi 8 7 1 0 0 0
Jones, John 8 7 1 0 0 0
Lake, Carnell 7 4 3 0 0 0
Williams, Moe 5 4 1 0 0 0
Starks, Duane 4 4 0 0 0 0
Harris, Corey 4 3 1 0 0 0
Kight, Danny 2 2 0 0 0 0
Stover, Matt 2 2 0 0 0 0
Maese, Joe 1 1 0 0 0 0
McAlister, Chris 1 1 0 0 0 1
Ricard, Alan 1 1 0 0 0 0
Sharper, Jamie 1 1 0 0 0 0
Hellestrae, Dale 1 0 1 0 0 0*McAlister partially deflected a FG at Pittsburgh 11/4/01
Brian Billick, Head Coach; Matt Cavanaugh, Offensive Coordinator/
Quarterbacks; Marvin Lewis, Defensive Coordinator; Jim Colletto,
Offensive Line; Jack Del Rio, Linebackers; Jeff Friday, Strength and
Conditioning; Wade Harman, Tight Ends/Assistant Offensive Line;
Donnie Henderson, Secondary; Milt Jackson, Offensive Assistant;
Chip Morton, Assistant Strength and Conditioning; Mike Nolan, Wide
Receivers; Russ Purnell, Special Teams; Rex Ryan, Defensive Line;
Steve Shafer, Assistant Head Coach/Secondary; Matt Simon, Running
Backs; Mike Smith, Defensive Assistant/Defensive Line; Bennie
Thompson, Special Teams Assistant
SOLO SACKS FF FR PD 130 Ray Lewis 15.0 Peter Boulware 3 Peter Boulware 4 Corey Harris 17 Duane Starks 101 Jamie Sharper 7.5 Michael McCrary 3 Corey Harris 1 7 players tied 13 Ray Lewis 70 2 players tied 6.0 Jamie Sharper 3 Adalius Thomas 13 Rod Woodson
Pro Bowl: DT Sam Adams (2nd team); WR/KR Jermaine Lewis (2nd team); LB Ray Lewis (starter); OT Jonathan Ogden (starter); TE Shannon Sharpe (2nd team); S Rod Woodson (starter)
All-Pro: DT Sam Adams (PFW, FN, CPFW); WR/KR Jermaine Lewis (PFW, FD, TSN); TE Shannon Sharpe (CPFW); LB Ray Lewis (AP-1st team, SI, PFW, FD, FN, CPFW, TSN); OL Edwin Mulitalo (SI); OT Jonathan Ogden (AP-2nd team, PFW, FD, FN, CPFW, TSN)
Ravens Nest Lineman of the Year: OL Edwin MulitaloRavens Roost Extra Effort Award: WR Brandon Stokley
Ravens Roost Unsung Hero: LB Jamie SharperEd Block Courage Award: S Corey Harris
TOP THREE
SEASON TRENDS
COACHES
RAVENS HONOR ROLL
USUAL STARTERS
DEFENSIVE SPECIAL TEAMSFROM COACHES VIDEO FROM COACHES VIDEO

2019 BALTIMORE RAVENS MEDIA GUIDE362
2001 POSTSEASON STATISTICS
ORGANIZ
ATIO
N P
LAYERS 20
10 R
EVIE
W H
ISTORY R
ECORDS G
AM
E D
AY
342 BALTIMORE RAVENS FAN & MEDIA GUIDE 2011
2001 POSTSEASON STATISTICS
RESULTS AND ATTENDANCEWON 1, LOST 1 01/13 W 20- 3 at Miami 72,25101/20 L 10-27 at Pittsburgh 63,976
TEAM STATISTICS RAVENS OPPONENTTOTAL FIRST DOWNS 27 30 Rushing 12 12 Passing 13 14 Penalty 2 4 3rd Down: Made/Att 11/28 10/27 3rd Down Pct 39.3 37.0 4th Down: Made/Att 1/1 0/1 4th Down Pct. 100.0 0.0POSSESSION AVG. 28:35 31:26TOTAL NET YARDS 497 448 Avg. Per Game 248.5 224.0 Total Plays 120 119 Avg. Per Play 4.1 3.8NET YARDS RUSHING 248 200 Avg. Per Game 124.0 100.0 Total Rushes 61 64NET YARDS PASSING 249 248 Avg. Per Game 124.5 124.0 Sacked/Yards Lost 4/37 5/28 Gross Yards 286 276 Att./Completions 55/30 50/27 Completion Pct. 54.5 54.0 Had Intercepted 3 2PUNTS/AVERAGE 12/40.1 11/43.5NET PUNTING AVG. 12/32.1 11/30.6PENALTIES/YARDS 14/100 11/86FUMBLES/BALL LOST 2/2 6/2TOUCHDOWNS 3 3 Rushing 1 2 Passing 1 1 Returns 1 0
SCORE BY PERIODS 1 2 3 4 OT PTSRAVENS 0 10 14 6 0 30Opponents 13 10 0 7 0 30
SCORING TD RU PA RT K/PAT FG S PTSStover 0 0 0 0 3/3 3/4 0 12Allen 1 1 0 0 0 6Je. Lewis 1 0 0 1 0 6T. Taylor 1 0 1 0 0 6 RAVENS 3 1 1 1 3/3 3/4 0 30Opponents 3 2 1 0 3/3 3/4 0 30
2-PT. CONVERSIONS: RAVENS 0-0; Opponents 0-0
SACKS: Boulware 1.0, A. Mitchell 1.0, Sharper 1.0, Webster 1.0, Burnett 0.5, A. Thomas 0.5, RAVENS 5.0, Opponents 4.0
RUSHING NO YDS AVG LG TDAllen 29 120 4.1 13 1Brookins 14 71 5.1 18 0M. Williams 9 29 3.2 9 0T. Taylor 1 15 15.0 15 0Ayanbadejo 2 8 4.0 5 0Je. Lewis 2 4 2.0 5 0Grbac 2 3 1.5 4 0Redman 2 -2 -1.0 -1 0RAVENS 61 248 4.1 18 1Opponents 64 200 3.1 23 2
RECEIVING NO YDS AVG LG TDSharpe 9 79 8.8 27 0T. Taylor 6 76 12.7 45 1M. Williams 4 24 6.0 14 0Allen 3 11 3.7 6 0Stokley 2 38 19.0 27 0Ismail 2 24 12.0 16 0Gash 1 13 13.0 13 0Heap 1 11 11.0 11 0Ayanbadejo 1 7 7.0 7 0Brookins 1 3 3.0 3 0RAVENS 30 286 9.5 45 1Opponents 27 276 10.2 32t 1
INTERCEPTIONS NO YDS AVG LG TDStarks 1 26 26.0 26 0McAlister 1 18 18.0 18 0RAVENS 2 44 22.0 26 0Opponents 3 51 17.0 32 0
PUNTING NO YDS AVG TB IN LG BLKRichardson 12 481 40.1 1 1 52 0RAVENS 12 481 40.1 1 1 52 0Opponents 11 479 43.5 2 4 52 0
PUNT RETURNS RET FC YDS AVG LG TDJe. Lewis 5 2 102 20.4 88t 1RAVENS 5 2 102 20.4 88t 1Opponents 7 0 76 10.9 35 0
KICKOFF RETURNS NO YDS AVG LG TDJe. Lewis 6 104 17.3 28 0Harris 2 33 16.5 18 0RAVENS 8 137 17.1 28 0Opponents 8 187 23.4 32 0
FIELD GOALS 1-19 20-29 30-39 40-49 50+Stover 0/0 1/1 1/1 1/2 0/0RAVENS 0/0 1/1 1/1 1/2 0/0Opponents 0/0 1/1 1/2 1/1 0/0
Stover: (40N,35G,40G)(26G)Opponents: (33G)(21G,35N,46G)
PASSING ATT COMP YARDS COMP% YDS/ATT TD TD% INT INT% LG SACK/LOST RATINGGrbac 55 30 286 54.5 5.20 1 1.8 3 5.5 45 4/37 52.5RAVENS 55 30 286 54.5 5.20 1 1.8 3 5.5 45 4/37 52.5Opponents 50 27 276 54.0 5.52 1 2.0 2 4.0 32t 5/28 60.1
PLAYER TT SOLO AS SACKS YDS INT PD FF FRSharper, Jamie 20 12 8 1 0 0 1 1 0Lewis, Ray 15 9 6 0 0 0 0 2 0Woodson, Rod 14 11 3 0 0 0 2 0 0Harris, Corey 12 9 3 0 0 0 1 0 0Webster, Larry 12 8 4 1 8 0 1 0 0Starks, Duane 10 9 1 0 0 1 1 0 0Boulware, Peter 10 5 5 1 15 0 0 2 1Burnett, Rob 8 6 2 1 3 0 0 0 0Siragusa, Tony 8 5 3 0 0 0 0 0 0Adams, Sam 7 2 5 0 0 0 0 0 1McAlister, Chris 6 3 3 0 0 1 3 0 0Mitchell, Anthony 4 4 0 1 2 0 0 0 0Gregg, Kelly 4 3 1 0 0 0 0 0 0Lake, Carnell 4 3 1 0 0 0 1 0 0Thomas, Adalius 4 2 2 0 0 0 0 0 0Jackson, Brad 3 2 1 0 0 0 0 0 0Dalton, Lional 1 0 1 0 0 0 0 0 0
PLAYER TT SOLO AS FF FR BK
Porter, Alvin 6 4 2 1 0 0
Ayanbadejo, Obafemi 5 3 2 0 0 0
Baxter, Gary 3 2 1 0 0 0
Mitchell, Anthony 3 2 1 0 0 0
Starks, Duane 2 2 0 0 0 0
Harris, Corey 2 1 1 0 0 0
Hellestrae, Dale 1 1 0 0 0 0
Jackson, Brad 1 1 0 0 0 0
Richardson, Kyle 1 1 0 0 0 0
Thomas, Adalius 1 1 0 0 0 0
Hartwell, Edgerton 1 0 1 0 0 0
DEFENSIVE SPECIAL TEAMSFROM COACHES VIDEO FROM COACHES VIDEO

BALTIMORERAVENS.COM 363
2002 STATISTICS
GAM
E D
AY
RECORDS
HIS
TORY
2010
REVIE
W
PLAYERS
ORGANIZ
ATIO
N
343BALTIMORERAVENS.COM
2002 STATISTICS
RESULTS AND ATTENDANCEWON 7, LOST 909/08 L 7-10 at Carolina 70,386 09/15 L 0-25 Tampa Bay 69,30409/22 Bye Week09/30 W 34-23 Denver 69,538 10/06 W 26-21 at Cleveland 73,688 10/13 L 20-22 at Indianapolis 56,174 10/20 W 17-10 Jacksonville 69,173 10/27 L 18-31 Pittsburgh 69,638 11/03 L 17-20 at Atlanta 68,532 11/10 W 38-27 Cincinnati 69,024 11/17 L 7-26 at Miami 73,013 11/24 W 13-12 Tennessee 69,365 12/01 W 27-23 at Cincinnati 44,87812/08 L 25-37 New Orleans 69,33412/15 W 23-19 at Houston 70,10812/22 L 13-14 Cleveland 69,34812/29 L 31-34 at Pittsburgh 61,961
TEAM STATISTICS RAVENS OPPONENTTOTAL FIRST DOWNS 261 316 Rushing 90 95 Passing 145 190 Penalty 26 31 3rd Down: Made/Att 81/215 95/236 3rd Down Pct. 37.7 40.3 4th Down: Made/Att 7/13 15/21 4th Down Pct. 53.8 71.4POSSESSION AVG. 27:47 32:13TOTAL NET YARDS 4639 5353 Avg. Per Game 289.9 334.6 Total Plays 947 1077 Avg. Per Play 4.9 5.0NET YARDS RUSHING 1792 1762 Avg. Per Game 112.0 110.1 Total Rushes 427 471NET YARDS PASSING 2847 3591 Avg. Per Game 177.9 224.4 Sacked/Yards Lost 41/271 33/232 Gross Yards 3118 3823 Att./Completions 479/262 573/360 Completion Pct. 54.7 62.8 Had Intercepted 14 25PUNTS/AVERAGE 84/40.5 78/40.8NET PUNTING AVG. 84/33.7 78/34.1PENALTIES/YARDS 101/846 104/874FUMBLES/BALL LOST 34/18 24/6TOUCHDOWNS 36 38 Rushing 9 17 Passing 20 16 Returns 7 5
SCORE BY PERIODS 1 2 3 4 OT PTSRAVENS 53 123 82 58 0 316 Opponents 88 110 51 105 0 354
SCORING TD RU PA RT K/PAT FG S PTSStover 0 0 0 0 33/33 21/25 0 96J. Lewis 7 6 1 0 0 42 Heap 6 0 6 0 0 38 T. Taylor 6 0 6 0 0 36 Ricard 3 2 0 1 0 18 C. Taylor 2 0 2 0 0 14 R. Johnson 2 0 1 1 0 12 Stokley 2 0 2 0 0 12 Blake 1 1 0 0 0 6 Brightful 1 0 0 1 0 6 J. Jones 1 0 1 0 0 6T. Jones 1 0 1 0 0 6 McAlister 1 0 0 1 0 6 Reed 1 0 0 1 0 6 A. Thomas 1 0 0 1 0 6 Williams 1 0 0 1 0 6 Jenkins 0 0 0 0 0/0 0/1 0 0 RAVENS 36 9 20 7 33/33 21/26 0 316 Opponents 38 17 16 5 31/32 29/33 2 354
2-PT. CONVERSIONS: Heap, C. Taylor RAVENS 2-3; Opponents 2-6
SACKS: Boulware 7.0, Weaver 3.5, Hartwell 3.0, A. Thomas 3.0, Gregg 2.0, Harris 2.0, Kemoeatu 2.0, McCrary 2.0, Team 2.0, Brown 1.5, Demps 1.0, Douglas 1.0, Parker 1.0, Reed 1.0, Trapp 1.0, RAVENS 33.0, Opponents 41.0
RUSHING NO YDS AVG LG TDJ. Lewis 308 1327 4.3 75 6C. Taylor 33 122 3.7 17 0Blake 39 106 2.7 17 1T. Taylor 11 105 9.5 39 0Ricard 14 58 4.1 19t 2Heap 4 38 9.5 15 0Stokley 6 31 5.2 14 0J. Hunter 1 9 9.0 9 0Redman 10 8 0.8 6 0Zastudil 1 -12 -12.0 -12 0RAVENS 427 1792 4.2 75 9Opponents 471 1762 3.7 35t 17
RECEIVING NO YDS AVG LG TDHeap 68 836 12.3 43 6T. Taylor 61 869 14.2 64 6J. Lewis 47 442 9.4 77t 1Stokley 24 357 14.9 35t 2C. Taylor 14 129 9.2 20t 2T. Jones 11 106 9.6 27 1R. Johnson 10 114 11.4 33 1Ricard 10 60 6.0 17 0Hymes 6 123 20.5 43 0J. Jones 6 47 7.8 18t 1J. Hunter 5 35 7.0 8 0RAVENS 262 3118 11.9 77t 20Opponents 360 3823 10.6 54 16
INTERCEPTIONS NO YDS AVG LG TDReed 5 167 33.4 59 0Williams 3 98 32.7 98t 1A. Mitchell 3 62 20.7 32 0Trapp 3 26 8.7 11 0A. Thomas 2 57 28.5 32 1Harris 2 11 5.5 11 0R. Lewis 2 4 2.0 4 0Demps 1 18 18.0 18 0Boulware 1 6 6.0 6 0Baxter 1 0 0.0 0 0McAlister 1 0 0.0 0 0Scott 1 0 0.0 0 0RAVENS 25 449 18.0 98t 2Opponents 14 241 17.2 97t 1
PUNTING NO YDS AVG TB IN LG BLKZastudil 81 3368 41.6 5 31 61 2Stover 1 33 33.0 0 1 33 0RAVENS 84 3401 40.5 5 32 61 2Opponents 78 3184 40.8 7 27 69 3
PUNT RETURNS RET FC YDS AVG LG TDMcAlister 17 4 122 7.2 28 0Brightful 15 10 241 16.1 95t 1Je. Ogden 2 0 21 10.5 19 0RAVENS 34 14 384 11.3 95t 1Opponents 40 14 471 11.8 76t 2
KICKOFF RETURNS NO YDS AVG LG TDBrightful 34 701 20.6 54 0Tate 17 356 20.9 64 0C. Taylor 10 236 23.6 54 0J. Hunter 4 105 26.3 63 0R. Johnson 2 21 10.5 11 0Gash 1 14 14.0 14 0Ricard 0 0 --- --- 0A. Thomas 0 0 --- --- 0RAVENS 68 1433 21.1 67 0Opponents 67 1512 22.6 94t 1
FIELD GOALS 1-19 20-29 30-39 40-49 50+Stover 0/0 9/9 4/5 7/10 1/1Jenkins 0/0 0/0 0/0 0/0 0/1RAVENS 0/0 9/9 4/5 7/10 1/2Opponents 0/0 8/8 10/11 10/11 1/3
Stover:(47N)()(23G,41G)(43G,28G,27G,28G)(41G,51G)(46N,30G)(28G)(32G)(33G)()(26G,43G)(49N,38N)(26G)(22G,22G,47G)(31G,43G)(43G)Jenkins: ()(55B)()()()()()()()()()()()()()()Opponents: (27G,50N)(36G,30G,30G)(40G,57N,44N)()(39G,50G,43G,25G,38G)(39N,22G)(34G)(23G,40G)(43G,35G)(42G,49G)(32G,37G,40G,21G)(40G)(34G, 28G,28G)(41G)()(23G,48G)
PASSING ATT COMP YARDS COMP% YDS/ATT TD TD% INT INT% LG SACK/LOST RATINGBlake 295 165 2084 55.9 7.06 13 4.4 11 3.7 77t 30/203 77.3Redman 182 97 1034 53.3 5.68 7 3.8 3 1.6 36 11/68 76.1Heap 1 0 0 0.0 0.00 0 0.0 0 0.0 0 0/0 39.6Zastudil 1 0 0 0.0 0.00 0 0.0 0 0.0 0 0/0 39.6RAVENS 479 262 3118 54.7 6.51 20 4.2 14 2.9 77t 41/ 271 76.5Opponents 573 360 3823 62.8 6.67 16 2.8 25 4.4 54 33/ 232 73.4

2019 BALTIMORE RAVENS MEDIA GUIDE364
2002 STATISTICS
ORGANIZ
ATIO
N P
LAYERS 20
10 R
EVIE
W H
ISTORY R
ECORDS G
AM
E D
AY
344 BALTIMORE RAVENS FAN & MEDIA GUIDE 2011
Record . . . . . . . . . . . . . . . . . . . . . . . . . . . . . . . . . . . . . . . . . . . . . . . 7-9vs. AFC North . . . . . . . . . . . . . . . . . . . . . . . . . . . . . . . . . . . . . . . . . 3-3vs. AFC . . . . . . . . . . . . . . . . . . . . . . . . . . . . . . . . . . . . . . . . . . . . . . 7-5vs. NFC. . . . . . . . . . . . . . . . . . . . . . . . . . . . . . . . . . . . . . . . . . . . . . . 0-4Home . . . . . . . . . . . . . . . . . . . . . . . . . . . . . . . . . . . . . . . . . . . . . . . . 4-4Away . . . . . . . . . . . . . . . . . . . . . . . . . . . . . . . . . . . . . . . . . . . . . . . . . 3-5On Grass . . . . . . . . . . . . . . . . . . . . . . . . . . . . . . . . . . . . . . . . . . . . . 7-7Artificial Turf . . . . . . . . . . . . . . . . . . . . . . . . . . . . . . . . . . . . . . . . . . . 0-2Outdoors. . . . . . . . . . . . . . . . . . . . . . . . . . . . . . . . . . . . . . . . . . . . . . 7-7Indoors . . . . . . . . . . . . . . . . . . . . . . . . . . . . . . . . . . . . . . . . . . . . . . . 0-2Leading at Halftime. . . . . . . . . . . . . . . . . . . . . . . . . . . . . . . . . . . . . . 5-1Trailing at Halftime . . . . . . . . . . . . . . . . . . . . . . . . . . . . . . . . . . . . . . 1-8Tied at Halftime. . . . . . . . . . . . . . . . . . . . . . . . . . . . . . . . . . . . . . . . . 1-0Tied After 3 Quarters . . . . . . . . . . . . . . . . . . . . . . . . . . . . . . . . . . . . 0-1Leading After 3 Quarters. . . . . . . . . . . . . . . . . . . . . . . . . . . . . . . . . . 6-2Trailing After 3 Quarters . . . . . . . . . . . . . . . . . . . . . . . . . . . . . . . . . . 1-6Winning Coin Toss . . . . . . . . . . . . . . . . . . . . . . . . . . . . . . . . . . . . . . 3-1Losing Coin Toss . . . . . . . . . . . . . . . . . . . . . . . . . . . . . . . . . . . . . . . 4-8Decided by 7 Points or less . . . . . . . . . . . . . . . . . . . . . . . . . . . . . . . 4-5Decided by 3 Points or less . . . . . . . . . . . . . . . . . . . . . . . . . . . . . . . 1-5
When Scoring First . . . . . . . . . . . . . . . . . . . . . . . . . . . . . . . . . . . . . . 5-2When Not Scoring First. . . . . . . . . . . . . . . . . . . . . . . . . . . . . . . . . . . 2-7Positive or Even Turnover Ratio . . . . . . . . . . . . . . . . . . . . . . . . . . . . 7-1Negative Turnover Ratio . . . . . . . . . . . . . . . . . . . . . . . . . . . . . . . . . . 0-8Winning Penalty Ratio . . . . . . . . . . . . . . . . . . . . . . . . . . . . . . . . . . . 5-3Losing Penalty Ratio. . . . . . . . . . . . . . . . . . . . . . . . . . . . . . . . . . . . . 1-5Overtime. . . . . . . . . . . . . . . . . . . . . . . . . . . . . . . . . . . . . . . . . . . . . . 0-0Preseason. . . . . . . . . . . . . . . . . . . . . . . . . . . . . . . . . . . . . . . . . . . . . 2-2With a 100-Yard Rusher . . . . . . . . . . . . . . . . . . . . . . . . . . . . . . . . . . 4-1With a 100-Yard Receiver . . . . . . . . . . . . . . . . . . . . . . . . . . . . . . . . . 1-1Without a 100-yard Rusher . . . . . . . . . . . . . . . . . . . . . . . . . . . . . . . . 3-8Without a 100-yard Receiver. . . . . . . . . . . . . . . . . . . . . . . . . . . . . . . 6-8When Allowing a 100-Yard Rusher . . . . . . . . . . . . . . . . . . . . . . . . . . 2-3When Not Allowing a 100-Yard Rusher. . . . . . . . . . . . . . . . . . . . . . . 5-6When Allowing a 100-Yard Receiver . . . . . . . . . . . . . . . . . . . . . . . . . 2-1When Not Allowing a 100-Yard Receiver . . . . . . . . . . . . . . . . . . . . . 5-8With a 300-Yard Passer . . . . . . . . . . . . . . . . . . . . . . . . . . . . . . . . . . 0-2Without a 300-Yard Passer . . . . . . . . . . . . . . . . . . . . . . . . . . . . . . . . 7-7 When Allowing a 300-Yard Passer . . . . . . . . . . . . . . . . . . . . . . . . . . 2-1When Not Allowing a 300-Yard Passer . . . . . . . . . . . . . . . . . . . . . . . 5-8
PLAYER TT SOLO AS SACKS YDS INT PD FR FFHartwell, Ed 191 125 66 3 18.0 0 7 0 0Baxter, Gary 90 75 15 0 0 1 20 0 0Boulware, Peter 87 63 24 7 57.0 1 4 1 1Reed, Ed 86 69 17 1 3.0 5 13 0 1Lewis, Ray 85 57 28 0 0 2 2 1 1Gregg, Kelly 84 53 31 2 13.0 0 0 0 0Harris, Bernardo 73 47 26 2 23.0 2 4 0 0Thomas, Adalius 68 38 30 3 20.0 2 11 1 3Brown, Cornell 67 47 20 1.5 14.0 0 3 0 0McAlister, Chris 67 58 9 0 0 1 24 0 1Weaver, Anthony 65 43 22 3.5 33.0 0 4 0 1Demps, Will 64 51 13 1 2.0 1 7 0 1Williams, Chad 43 35 8 0 0 3 8 0 1Porter, Alvin 41 36 5 0 0 0 3 0 0Trapp, James 36 26 10 1 17.0 3 11 0 1Kemoeatu, Maake 32 20 12 2 6.0 0 0 0 0Mitchell, Anthony 31 25 6 0 0 3 2 0 0Parker, Riddick 29 17 12 1 5.0 0 0 0 2McCrary, Michael 16 10 6 2 6.0 0 1 0 0Douglas, Marques 15 9 6 1 9.0 0 0 0 0Nugent, David 15 8 7 0 0 0 0 0 0Tate, Robert 14 13 1 0 0 0 2 0 0Taylor, Shannon 14 8 6 0 0 0 0 0 1Scott, Bart 5 2 3 0 0 1 0 0 0
OFFENSE WR 89 Travis Taylor LT 75 Jonathan Ogden LG 64 Edwin Mulitalo C 62 Mike Flynn RG 66 Bennie Anderson RT 77 Ethan Brooks TE 86 Todd Heap WR 80 Brandon Stokley* 81 Randy Hymes QB 7 Chris Redman 11 Jeff Blake RB 31 Jamal Lewis FB 39 Alan Ricard *IR
DEFENSE DE 98 Anthony Weaver DT 97 Kelly Gregg DE 96 Adalius Thomas 99 Michael McCrary* LOLB 90 Cornell Brown LILB 56 Ed Hartwell RILB 52 Ray Lewis* 51 Bernardo Harris ROLB 58 Peter Boulware LCB 21 Chris McAlister RCB 28 Gary Baxter SS 20 Ed Reed FS 47 Will Demps 42 Anthony Mitchell
PLAYER TT SOLO AS FF FR BKScott, Bart 17 13 4 0 0 0Williams, Chad 17 12 5 1 0 1Thomas, Adalius 15 11 4 0 0 0Taylor, Shannon 14 12 2 0 0 0Mitchell, Anthony 12 10 2 0 0 0Trapp, James 12 9 3 0 0 0Jones, John 10 3 7 0 0 0Porter, Alvin 9 6 3 0 1 0Reed, Ed 8 5 3 0 0 2Brown, Cornell 7 4 3 0 0 0Demps, Will 6 3 3 0 0 0Johnson, Ron 3 3 0 0 1 0Maese, Joe 3 2 1 0 1 0Ricard, Alan 3 2 1 0 0 0Stover, Matt 3 3 0 0 0 0Tate, Robert 3 1 2 0 0 0Harris, Bernardo 2 2 0 0 0 0Jenkins, J.R. 2 2 0 0 0 0Perryman, Ray 2 1 1 0 0 0Hartwell, Ed 1 0 1 0 0 0Jones, Terry 1 0 1 0 0 0Zastudil, Dave 1 1 0 0 0 0Gash, Sam 0 0 0 0 1 0
Brian Billick, Head Coach; Matt Cavanaugh, Offensive Coordinator;
Mike Nolan, Defensive Coordinator; Gary Zauner, Special Teams
Coordinator; Mark Asanovich, Assistant Strength and Conditioning; Jim
Colletto, Offensive Line; Jeff Friday, Strength and Conditioning; Wade
Harman, Tight Ends/Assistant Offensive Line; Donnie Henderson,
Secondary; Paul Ricci, Assistant Strength and Conditioning; Rex Ryan,
Defensive Line; David Shaw, Quarterbacks/Wide Receivers; Matt Simon,
Running Backs; Mike Smith, Linebackers; Bennie Thompson, Special
Teams Assistant; Phil Zacharias, Defensive Assistant/Defensive Line
SOLO SACKS FF FR PD 125 Ed Hartwell 7.0 Peter Boulware 3 Adalius Thomas 1 Peter Boulware 24 Chris McAlister 75 Gary Baxter 3.5 Anthony Weaver 2 Riddick Parker 1 Ray Lewis 20 Gary Baxter 69 Ed Reed 3.0 2 players tied 1 Adalius Thomas 13 Ed Reed
Pro Bowl: LB Peter Boulware (2nd team); TE Todd Heap (2nd team); OT Jonathan Ogden (starter)All-Pro: OT Jonathan Ogden (AP-1st team, PFW, FD-2nd team, TSN)
Comeback Player of the Year: RB Jamal Lewis (FD)All-Rookie Team: S Ed Reed (PFW), P Dave Zastudil (PFW)
Ravens Nest Lineman of Year: DE Adalius ThomasRavens Roost Extra Effort Award: LB Edgerton Hartwell
Ravens Roost Unsung Hero: NT Kelly GreggEd Block Courage Award: OT Ethan Brooks
TOP THREE
COACHES
RAVENS HONOR ROLL
USUAL STARTERS
DEFENSIVE SPECIAL TEAMS
SEASON TRENDS
FROM COACHES VIDEO FROM COACHES VIDEO

BALTIMORERAVENS.COM 365
2003 STATISTICS
GAM
E D
AY
RECORDS
HIS
TORY
2010
REVIE
W
PLAYERS
ORGANIZ
ATIO
N
345BALTIMORERAVENS.COM
2003 STATISTICS
RESULTS AND ATTENDANCEWON 10, LOST 6 (AFC NORTH CHAMPIONS)9/07 L 15-34 at Pittsburgh 63,1579/14 W 33-13 Cleveland 69,4739/21 W 24-10 at San Diego 52,0289/28 L 10-17 Kansas City 69,45910/05 Bye Week10/12 W 26-18 at Arizona 24,19310/19 L 26-34 at Cincinnati 53,55310/26 W 26-6 Denver 69,72111/02 W 24-17 Jacksonville 69,48611/09 L 22-33 at St. Louis 66,08511/16 L 6-9 (OT) at Miami 73,33311/23 W 44-41 (OT) Seattle 69,47711/30 W 44-6 San Francisco 69,54912/07 W 31-13 Cincinnati 69,468 12/14 L 12-20 at Oakland 45,39812/21 W 35-0 at Cleveland 72,54812/28 W 13-10 (OT) Pittsburgh 70,001
TEAM STATISTICS RAVENS OPPONENTTOTAL FIRST DOWNS 259 248 Rushing 115 78 Passing 121 144 Penalty 23 26 3rd Down: Made/Att 72/226 69/235 Down Pct. 31.9 29.4 4th Down: Made/Att 7/11 5/17 Down Pct. 63.6 29.4POSSESSION AVG. 30:14 29:46TOTAL NET YARDS 4929 4341 Per Game 308.1 271.3 Total Plays 1009 1026 Avg. Per Play 4.9 4.2NET YARDS RUSHING 2674 1536 Avg. Per Game 167.1 96.0 Total Rushes 552 448NET YARDS PASSING 2255 2805 Avg. Per Game 140.9 175.3 Sacked/Yards Lost 42/262 47/353 Gross Yards 2517 3158 Att./Completions 415/217 531/296 Completion Pct. 52.3 55.7 Had Intercepted 19 24PUNTS/AVERAGE 91/40.8 105/40.1NET PUNTING AVG. 91/34.9 105/34.7PENALTIES/YARDS 126/970 106/935FUMBLES/BALL LOST 37/19 29/17TOUCHDOWNS 41 28 Rushing 18 6 Passing 16 19 Returns 7 3
SCORE BY PERIODS 1 2 3 4 OT PTSRAVENS 61 90 84 150 6 391Opponents 63 73 77 65 3 281
SCORING TD RU PA RT K/PAT FG S PTSStover 0 0 0 0 35/35 33/38 0 134J. Lewis 14 14 0 0 0 84Robinson 6 0 6 0 0 36Heap 3 0 3 0 0 26T. Jones 3 0 3 0 0 18Reed 3 0 0 3 0 18T. Taylor 3 0 3 0 0 18M. Smith 2 2 0 0 0 12C. Taylor 2 2 0 0 0 12R. Lewis 1 0 0 1 0 6McAlister 1 0 0 1 0 6Ogden 1 0 1 0 0 6Ricard 1 0 0 1 0 6Williams 1 0 0 1 0 6Richey 0 0 0 0 0/0 1/ 2 0 3RAVENS 41 18 16 7 35/35 34/40 0 391Opponents 28 6 19 3 27/27 28/31 0 281
2-PT. CONVERSIONS: Heap 4, RAVENS 4-6; Opponents 1-1
SACKS: Suggs 12.0, Boulware 8.5, Weaver 5.0, Douglas 4.5, A. Thomas 4.0, Gregg 3.0, Hartwell 3.0, R. Lewis 1.5, Baxter 1.0, C. Brown 1.0, Kemoeatu 1.0, Reed 1.0, Slaughter LG 1.0, Williams 1.0, Knight 0.5 RAVENS 47.0, Opponents 42.0
RUSHING NO YDS AVG LG TDJ. Lewis 387 2066 5.3 82t 14C. Taylor 63 276 4.4 32 2Ricard 19 79 4.2 30 0Wright 28 73 2.6 17 0Boller 30 62 2.1 15 0T. Taylor 11 62 5.6 16 0M. Smith 9 31 3.4 11t 2Heap 3 21 7.0 9 0Redman 2 4 2.0 4 0RAVENS 552 2674 4.8 82t 18Opponents 448 1536 3.4 36 6
RECEIVING NO YDS AVG LG TDHeap 57 693 12.2 33t 3T. Taylor 39 632 16.2 73t 3Robinson 31 451 14.5 50t 6J. Lewis 26 205 7.9 26 0C. Taylor 20 132 6.6 23 0T. Jones 19 159 8.4 25 3Sanders 14 170 12.1 44 0Ricard 9 62 6.9 15 0R. Johnson 1 12 12.0 12 0Ogden 1 1 1.0 1t 1Boller 0 0 --- 0 0Ward 0 0 --- 0 0RAVENS 217 2517 11.6 73t 16Opponents 296 3158 10.7 82t 19
INTERCEPTIONS NO YDS AVG LG TDReed 7 132 18.9 54t 1R. Lewis 6 99 16.5 37 1McAlister 3 93 31.0 83t 1Baxter 3 41 13.7 34 0Demps 2 57 28.5 54 0Williams 1 52 52.0 52t 1Hartwell 1 26 26.0 26 0Suggs 1 11 11.0 11 0RAVENS 24 511 21.3 83t 4Opponents 19 269 14.2 45 0
PUNTING NO YDS AVG TB IN LG BLKZastudil 89 3649 41.0 8 21 67 0Boller 1 29 29.0 0 0 29 0Stover 1 34 34.0 1 0 34 0RAVENS 91 3712 40.8 9 21 67 0Opponents 105 4211 40.1 8 28 68 2
PUNT RETURNS RET FC YDS AVG LG TDBrightful 45 20 351 7.8 44 0Reed 5 3 33 6.6 19 0Ward 3 0 26 8.7 16 0RAVENS 53 23 410 7.7 44 0Opponents 42 18 354 8.4 44 0
KICKOFF RETURNS NO YDS AVG LG TDBrightful 29 716 24.7 75 0C. Taylor 23 448 19.5 29 0M. Smith 2 17 8.5 15 0A. Thomas 1 21 21.0 21 0Walls 1 0 0.0 0 0Ward 1 20 20.0 20 0RAVENS 57 1222 21.4 75 0Opponents 70 1495 21.4 97t 1
FIELD GOALS 1-19 20-29 30-39 40-49 50+Stover 0/0 16/16 6/6 11/14 0/2Richey 0/0 0/0 0/0 0/0 1/2RAVENS 0/0 16/16 6/6 11/14 1/4Opponents 0/0 9/9 5/6 13/14 1/2
Stover: ()(45N,20G,40G,21G)(49G)(29G)(31G,22G,29G,37G)(25G)(45N,25G,39G,22G,29G)(23G,32G,23G)(41G,25G,41G)(39G,45G)(21G,40G,42G)(28G,47G,41G)(22G)(32G,28G,50N)(46N)(46G,52N,47G)Richey:()(56G)()()()()()()()()()()()()()(51N)
Opponents: (29G,31G)(44G,35G)(24G,50N)(46G)(46G)(44G,37G)(28G,22G)(24G)(49G,46G,48G,27G)(23G,52G,48N,43G)(45G,46G)(48G,40G)(25G,38G)(37G,23G)(37N)(42G)
PASSING ATT COMP YARDS COMP% YDS/ATT TD TD% INT INT% LG SACK/LOST RATINGBoller 224 116 1260 51.8 5.63 7 3.1 9 4.0 73t 17/92 62.4Wright 178 94 1199 52.8 6.74 9 5.1 8 4.5 64 19/125 72.3Redman 13 7 58 53.8 4.46 0 0.0 2 15.4 16 6/45 26.0RAVENS 415 217 2517 52.3 6.07 16 3.9 19 4.6 73t 42/262 64.7Opponents 531 296 3158 55.7 5.95 19 3.6 24 4.5 82t 47/353 66.4

2019 BALTIMORE RAVENS MEDIA GUIDE366
2003 STATISTICS
ORGANIZ
ATIO
N P
LAYERS 20
10 R
EVIE
W H
ISTORY R
ECORDS G
AM
E D
AY
346 BALTIMORE RAVENS FAN & MEDIA GUIDE 2011
Record . . . . . . . . . . . . . . . . . . . . . . . . . . . . . . . . . . . . . . . . . . . . . . 10-6vs. AFC North . . . . . . . . . . . . . . . . . . . . . . . . . . . . . . . . . . . . . . . . . 4-2vs. AFC . . . . . . . . . . . . . . . . . . . . . . . . . . . . . . . . . . . . . . . . . . . . . . 7-5vs. NFC. . . . . . . . . . . . . . . . . . . . . . . . . . . . . . . . . . . . . . . . . . . . . . . 3-1Home . . . . . . . . . . . . . . . . . . . . . . . . . . . . . . . . . . . . . . . . . . . . . . . . 7-1Away . . . . . . . . . . . . . . . . . . . . . . . . . . . . . . . . . . . . . . . . . . . . . . . . . 3-5On Grass . . . . . . . . . . . . . . . . . . . . . . . . . . . . . . . . . . . . . . . . . . . . . 3-4Artificial Turf . . . . . . . . . . . . . . . . . . . . . . . . . . . . . . . . . . . . . . . . . . . 7-2Outdoors. . . . . . . . . . . . . . . . . . . . . . . . . . . . . . . . . . . . . . . . . . . . . 10-5Indoors . . . . . . . . . . . . . . . . . . . . . . . . . . . . . . . . . . . . . . . . . . . . . . . 0-1Leading at Halftime. . . . . . . . . . . . . . . . . . . . . . . . . . . . . . . . . . . . . . 9-0Trailing at Halftime . . . . . . . . . . . . . . . . . . . . . . . . . . . . . . . . . . . . . . 1-5Tied at Halftime. . . . . . . . . . . . . . . . . . . . . . . . . . . . . . . . . . . . . . . . . 0-1Tied After 3 Quarters . . . . . . . . . . . . . . . . . . . . . . . . . . . . . . . . . . . . 0-1Leading After 3 Quarters. . . . . . . . . . . . . . . . . . . . . . . . . . . . . . . . . . 8-1Trailing After 3 Quarters . . . . . . . . . . . . . . . . . . . . . . . . . . . . . . . . . . 2-5Winning Coin Toss . . . . . . . . . . . . . . . . . . . . . . . . . . . . . . . . . . . . . . 4-4Losing Coin Toss . . . . . . . . . . . . . . . . . . . . . . . . . . . . . . . . . . . . . . . 6-2Decided by 7 Points or less . . . . . . . . . . . . . . . . . . . . . . . . . . . . . . . 3-2Decided by 3 Points or less . . . . . . . . . . . . . . . . . . . . . . . . . . . . . . . 2-1
When Scoring First . . . . . . . . . . . . . . . . . . . . . . . . . . . . . . . . . . . . . . 5-1When Not Scoring First. . . . . . . . . . . . . . . . . . . . . . . . . . . . . . . . . . . 5-5Positive or Even Turnover Ratio . . . . . . . . . . . . . . . . . . . . . . . . . . . 10-0Negative Turnover Ratio . . . . . . . . . . . . . . . . . . . . . . . . . . . . . . . . . . 0-6Winning Penalty Ratio . . . . . . . . . . . . . . . . . . . . . . . . . . . . . . . . . . . 5-4Losing Penalty Ratio. . . . . . . . . . . . . . . . . . . . . . . . . . . . . . . . . . . . . 5-2Overtime. . . . . . . . . . . . . . . . . . . . . . . . . . . . . . . . . . . . . . . . . . . . . . 1-1Preseason. . . . . . . . . . . . . . . . . . . . . . . . . . . . . . . . . . . . . . . . . . . . . 1-3With a 100-Yard Rusher . . . . . . . . . . . . . . . . . . . . . . . . . . . . . . . . . . 8-4With a 100-Yard Receiver . . . . . . . . . . . . . . . . . . . . . . . . . . . . . . . . . 2-1Without a 100-yard Rusher . . . . . . . . . . . . . . . . . . . . . . . . . . . . . . . . 2-2Without a 100-yard Receiver. . . . . . . . . . . . . . . . . . . . . . . . . . . . . . . 8-5When Allowing a 100-Yard Rusher . . . . . . . . . . . . . . . . . . . . . . . . . . 1-1When Not Allowing a 100-Yard Rusher. . . . . . . . . . . . . . . . . . . . . . . 9-5When Allowing a 100-Yard Receiver . . . . . . . . . . . . . . . . . . . . . . . . . 1-2When Not Allowing a 100-Yard Receiver . . . . . . . . . . . . . . . . . . . . . 9-4With a 300-Yard Passer . . . . . . . . . . . . . . . . . . . . . . . . . . . . . . . . . . 1-1Without a 300-Yard Passer . . . . . . . . . . . . . . . . . . . . . . . . . . . . . . . . 9-5When Allowing a 300-Yard Passer . . . . . . . . . . . . . . . . . . . . . . . . . . 1-1When Not Allowing a 300-Yard Passer . . . . . . . . . . . . . . . . . . . . . . . 9-5
PLAYER TT SOLO AS SACKS YDS INT PD FF FRLewis, Ray 225 160 65 1.5 11 6 13 2 2Hartwell, Ed 140 89 51 3 20.5 1 5 2 0Baxter, Gary 106 88 18 1 5 3 16 0 0Gregg, Kelly 104 78 26 3 15 0 0 0 1Reed, Ed 92 77 15 1 12 7 19 1 0Douglas, Marques 89 62 27 4.5 32.5 0 3 1 0Boulware, Peter 79 56 23 8.5 71 0 2 2 1Weaver, Anthony 63 43 20 5 38 0 7 2 2Demps, Will 59 41 18 0 0 2 11 1 0McAlister, Chris 52 43 9 0 0 3 16 0 0Fuller, Corey 41 37 4 0 0 0 8 0 0Thomas, Adalius 34 26 8 4 21 0 8 1 0Williams, Chad 34 27 7 1 7 1 8 1 0Brown, Cornell 33 19 14 1 5 0 3 0 0Suggs, Terrell 33 26 7 12 97 1 3 6 4Kemoeatu, Maake 24 14 10 1 7 0 1 0 0Knight, Tom 18 17 1 0.5 5 0 1 0 1Johnson, Jarret 18 9 9 0 0 0 1 0 0Parker, Riddick 12 8 4 0 0 0 0 0 0Scott, Bart 9 7 2 0 0 0 0 0 1Walls, Ray 5 5 0 0 0 0 2 0 0Brightful, Lamont 2 2 0 0 0 0 0 0 0Franklin, Aubrayo 1 1 0 0 0 0 0 0 0
OFFENSE WR 89 Travis Taylor TE 82 Terry Jones LT 75 Jonathan Ogden LG 64 Edwin Mulitalo C 62 Mike Flynn RG 66 Bennie Anderson RT 77 Orlando Brown TE 86 Todd Heap QB 8 Kyle Boller 2 Anthony Wright RB 31 Jamal Lewis FB 39 Alan Ricard *IR
DEFENSE DE 98 Anthony Weaver NT 97 Kelly Gregg DE 94 Marques Douglas LOLB 96 Adalius Thomas* 90 Cornell Brown LILB 56 Ed Hartwell RILB 52 Ray Lewis ROLB 58 Peter Boulware LCB 21 Chris McAlister RCB 26 Corey Fuller 28 Gary Baxter SS 20 Ed Reed FS 28 Gary Baxter 47 Will Demps
PLAYER TT SOLO AS FF FR BKThomas, Adalius 23 17 6 1 0 1Scott, Bart 19 12 7 0 0 0Sapp, Gerome 16 9 7 0 1 0Walls, Ray 12 9 3 0 0 0Jones, John 11 8 3 0 0 0Smith, Musa 10 8 2 0 0 0Demps, Will 9 8 1 0 0 0Morrow, Harold 9 5 4 0 0 0Taylor, Chester 8 8 0 0 1 0Brown, Cornell 8 5 3 0 0 0Williams, Chad 6 4 2 0 2 0Brightful, Lamont 5 3 2 0 1 0Maese, Joe 5 3 2 0 1 0Mughelli, Ovie 5 5 0 0 0 0Jones, Terry 3 3 0 1 0 0Johnson, Ron 2 1 1 0 0 0Slaughter, TJ 2 1 0 0 0 0Fuller, Corey 1 1 0 0 0 0Ricard, Alan 1 1 0 0 0 0Zastudil, Dave 1 0 0 0 0 0Ogden, Jonathan 0 0 0 0 1 0Reed, Ed 0 0 0 0 0 2
Brian Billick, Head Coach; Matt Cavanaugh, Offensive Coordinator;
Mike Nolan, Defensive Coordinator; Gary Zauner, Special Teams
Coordinator; Jim Colletto, Offensive Line; Jeff Friday, Strength and
Conditioning; Wade Harman, Tight Ends/Offensive Line; Donnie
Henderson, Secondary; Mike Pettine, Coaching Assistant/Quality
Control; Paul Ricci, Assistant Strength and Conditioning; Rex Ryan,
Defensive Line; David Shaw, Quarterbacks/Wide Receivers; Matt
Simon, Running Backs; Mike Singletary, Linebackers; Bennie
Thompson, Special Teams Assistant; Dennis Thurman, Assistant
Defensive Backs; Phil Zacharias, Defensive Assistant/Outside
Linebackers
SOLO SACKS FF FR PD 160 Ray Lewis 12.0 Terrell Suggs 6 Adalius Thomas 4 Terrell Suggs 19 Ed Reed 89 Ed Hartwell 8.5 Peter Boulware 3 Peter Boulware 2 Ray Lewis 16 Gary Baxter 88 Gary Baxter 5.0 Anthony Weaver 2 3 players tied 2 Anthony Weaver 16 Chris McAlister
AP Offensive Player of the Year: RB Jamal LewisAP Defensive Player of the Year: LB Ray Lewis
AP Defensive Rookie of the Year: LB Terrell SuggsPro Bowl: LB Peter Boulware (2nd team), TE Todd Heap (2nd team), RB Jamal Lewis (starter), LB Ray Lewis
(starter), CB Chris McAlister (starter), T Jonathan Ogden (starter), S Ed Reed (starter), LB Adalius Thomas (ST)All-Pro: LB Peter Boulware (FD-2nd team), TE Todd Heap (AP-2nd team, FD-2nd team), RB Jamal Lewis (AP-1st team, FD-1st team, PFW, TSN), LB Ray Lewis (AP-1st team, FD-1st team, PFW, SI, TSN), CB Chris McAlister (AP-1st team, FD-1st team, PFW), T Jonathan Ogden (AP-1st team,
PFW, FD-1st team, SI, TSN), S Ed Reed (AP-2nd team, FD-2nd team, SI, TSN)Pro Football Weekly Most Valuable Player: RB Jamal Lewis
Pro Football Weekly Defensive Most Valuable Player: LB Ray LewisPro Football Weekly Defensive Rookie of the Year: LB Terrell Suggs
Pro Football Weekly All-Rookie Team: LB Terrell SuggsPro Football Weekly All-AFC: RB Jamal Lewis, T Jonathan Ogden, LB Ray Lewis, S Ed Reed, LB Adalius Thomas (ST)
Football Digest Defensive Player of the Year: LB Ray LewisFootball Digest Assistant Coach of the Year: Defensive Coordinator Mike Nolan
Ravens Nest Lineman of the Year: DE Anthony WeaverRavens Roost Extra Effort Award: NT Kelly GreggRavens Roost Unsung Hero: LB Edgerton Hartwell
Ed Block Courage Award: DE Marques Douglas
TOP THREE
COACHES
RAVENS HONOR ROLL
USUAL STARTERS
DEFENSIVE SPECIAL TEAMS
SEASON TRENDS
FROM COACHES VIDEOFROM COACHES VIDEO

BALTIMORERAVENS.COM 367
2003 POSTSEASON STATISTICS
GAM
E D
AY
RECORDS
HIS
TORY
2010
REVIE
W
PLAYERS
ORGANIZ
ATIO
N
347BALTIMORERAVENS.COM
2003 POSTSEASON STATISTICS
RESULTS AND ATTENDANCEWON 0, LOST 101/03 L 17-20 Tennessee 69,452
TEAM STATISTICS RAVENS OPPONENTTOTAL FIRST DOWNS 12 16 Rushing 1 10 Passing 11 6 Penalty 0 0 3rd Down: Made/Att 3/12 6/15 3rd Down Pct. 25.0 40.0 4th Down: Made/Att 0/0 0/0 4th Down Pct. 0.0 0.0POSSESSION AVG. 24:52 35:08TOTAL NET YARDS 255 324 Avg. Per Game 255.0 324.0 Total Plays 55 63 Avg. Per Play 4.6 5.1NET YARDS RUSHING 54 165 Avg. Per Game 54.0 165.0 Total Rushes 16 40NET YARDS PASSING 201 159 Avg. Per Game 201.0 159.0 Sacked/Yards Lost 2/13 0/0 Gross Yards 214 159 Att./Completions 37/20 23/14 Completion Pct. 54.1 60.9 Had Intercepted 2 3PUNTS/AVERAGE 8/48.8 6/44.7NET PUNTING AVG. 8/40.0 6/44.3PENALTIES/YARDS 8/70 6/55FUMBLES/BALL LOST 1/0 0/0TOUCHDOWNS 2 2 Rushing 0 1 Passing 1 1 Returns 1 0
SCORE BY PERIODS 1 2 3 4 OT PTSRAVENS 7 3 0 7 0 17Opponents 7 0 7 6 0 20
SCORING TD RU PA RT K/PAT FG S PTSDemps 1 0 0 1 0 6Heap 1 0 1 0 0 6Stover 0 0 0 0 2/2 1/1 0 5 RAVENS 2 0 1 1 2/2 1/1 0 17Opponents 2 1 1 0 2/2 2/2 0 20
2-PT. CONVERSIONS: RAVENS 0-0; Opponents 0-0
SACKS: RAVENS 0.0, Opponents 2.0
RUSHING NO YDS AVG LG TDJ. Lewis 14 35 2.5 8 0Wright 2 19 9.5 11 0RAVENS 16 54 3.4 11 0Opponents 40 165 4.1 16 1
RECEIVING NO YDS AVG LG TDT. Taylor 7 82 11.7 30 0Heap 6 80 13.3 35t 1C. Taylor 2 19 9.5 16 0T. Jones 2 16 8.0 9 0J. Lewis 2 4 2.0 6 0Robinson 1 13 13.0 13 0RAVENS 20 214 10.7 35t 1Opponents 14 159 11.4 49t 1
INTERCEPTIONS NO YDS AVG LG TDDemps 1 56 56.0 56t 1Reed 1 23 23.0 23 0McAlister 1 0 0.0 0 0RAVENS 3 79 26.3 56t 1Opponents 2 1 0.5 1 0
PUNTING NO YDS AVG TB IN LG BLKZastudil 8 390 48.8 0 0 56 0RAVENS 8 390 48.8 0 0 56 0Opponents 6 268 44.7 0 4 63 0
PUNT RETURNS RET FC YDS AVG LG TDBrightful 2 2 2 1.0 2 0RAVENS 2 2 2 1.0 2 0Opponents 6 1 70 11.7 17 0
KICKOFF RETURNS NO YDS AVG LG TDBrightful 2 34 17.0 26 0C. Taylor 2 45 22.5 26 0RAVENS 4 79 19.8 26 0Opponents 4 61 15.3 24 0
FIELD GOALS 1-19 20-29 30-39 40-49 50+Stover 0/0 0/0 0/0 1/1 0/0RAVENS 0/0 0/0 0/0 1/1 0/0Opponents 0/0 0/0 0/0 2/2 0/0
Stover: (43G)Opponents: (45G,46G)
PASSING ATT COMP YARDS COMP% YDS/ATT TD TD% INT INT% LG SACK/LOST RATINGWright 37 20 214 54.1 5.78 1 2.7 2 5.4 35t 2/13 57.7RAVENS 37 20 214 54.1 5.78 1 2.7 2 5.4 35t 2/13 57.7Opponents 23 14 159 60.9 6.91 1 4.3 3 13.0 49t 0/0 56.5
PLAYER TT SOLO AS SACKS YDS INT PD FF FRLewis, Ray 18 12 6 0 0 0 0 0 0Douglas, Marques 10 7 3 0 0 0 0 0 0Hartwell, Ed 10 7 3 0 0 0 0 0 0Demps, Will 8 7 1 0 0 1 1 0 0Gregg, Kelly 6 2 4 0 0 0 0 0 0Weaver, Anthony 6 5 1 0 0 0 0 0 0Baxter, Gary 5 5 0 0 0 0 0 0 0McAlister, Chris 3 3 0 0 0 1 2 0 0Parker, Riddick 3 3 0 0 0 0 0 0 0Reed, Ed 3 3 0 0 0 1 2 0 0Brown, Cornell 2 2 0 0 0 0 0 0 0Kemoeatu, Maake 2 2 0 0 0 0 0 0 0Suggs, Terrell 2 1 1 0 0 0 0 0 0Johnson, Jarret 1 0 1 0 0 0 0 0 0Knight, Tom 1 1 0 0 0 0 0 0 0Williams, Chad 1 1 0 0 0 0 0 0 0
PLAYER TT SOLO AS FF FR BK
Smith, Musa 4 2 2 0 0 0
Morrow, Harold 3 1 2 0 0 0
Brightful, Lamont 1 1 0 0 0 0
Brown, Cornell 1 1 0 0 0 0
Demps, Will 1 1 0 0 0 0
Jones, Terry 1 1 0 0 0 0
Knight, Tom 1 1 0 0 0 0
Maese, Joe 1 1 0 0 0 0
Mughelli, Ovie 1 1 0 0 0 0
Scott, Bart 1 1 0 0 0 0
Franklin, Aubrayo 1 1 0 0 0 0
DEFENSIVE SPECIAL TEAMSFROM COACHES VIDEO FROM COACHES VIDEO
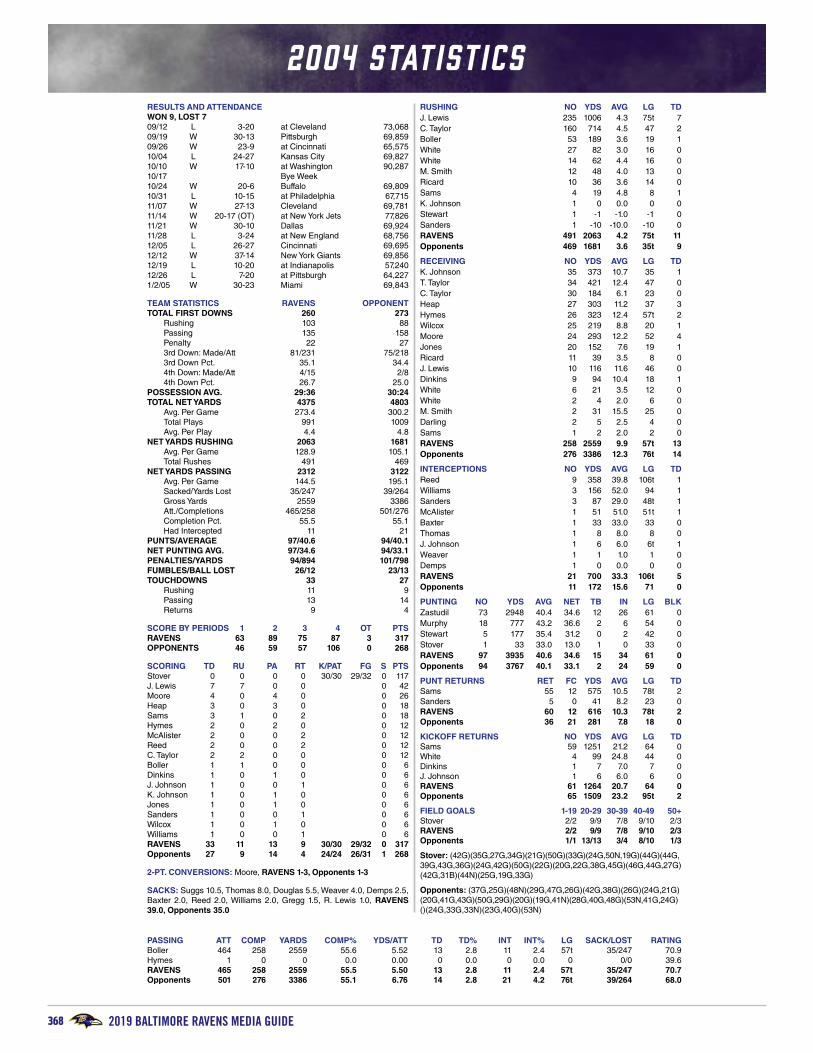
2019 BALTIMORE RAVENS MEDIA GUIDE368
2004 STATISTICS
ORGANIZ
ATIO
N P
LAYERS 20
10 R
EVIE
W H
ISTORY R
ECORDS G
AM
E D
AY
348 BALTIMORE RAVENS FAN & MEDIA GUIDE 2011
2004 STATISTICS
RESULTS AND ATTENDANCEWON 9, LOST 709/12 L 3-20 at Cleveland 73,06809/19 W 30-13 Pittsburgh 69,85909/26 W 23-9 at Cincinnati 65,57510/04 L 24-27 Kansas City 69,82710/10 W 17-10 at Washington 90,28710/17 Bye Week10/24 W 20-6 Buffalo 69,80910/31 L 10-15 at Philadelphia 67,71511/07 W 27-13 Cleveland 69,78111/14 W 20-17 (OT) at New York Jets 77,82611/21 W 30-10 Dallas 69,92411/28 L 3-24 at New England 68,75612/05 L 26-27 Cincinnati 69,69512/12 W 37-14 New York Giants 69,85612/19 L 10-20 at Indianapolis 57,24012/26 L 7-20 at Pittsburgh 64,2271/2/05 W 30-23 Miami 69,843
TEAM STATISTICS RAVENS OPPONENTTOTAL FIRST DOWNS 260 273 Rushing 103 88 Passing 135 158 Penalty 22 27 3rd Down: Made/Att 81/231 75/218 3rd Down Pct. 35.1 34.4 4th Down: Made/Att 4/15 2/8 4th Down Pct. 26.7 25.0POSSESSION AVG. 29:36 30:24TOTAL NET YARDS 4375 4803 Avg. Per Game 273.4 300.2 Total Plays 991 1009 Avg. Per Play 4.4 4.8NET YARDS RUSHING 2063 1681 Avg. Per Game 128.9 105.1 Total Rushes 491 469NET YARDS PASSING 2312 3122 Avg. Per Game 144.5 195.1 Sacked/Yards Lost 35/247 39/264 Gross Yards 2559 3386 Att./Completions 465/258 501/276 Completion Pct. 55.5 55.1 Had Intercepted 11 21PUNTS/AVERAGE 97/40.6 94/40.1NET PUNTING AVG. 97/34.6 94/33.1PENALTIES/YARDS 94/894 101/798FUMBLES/BALL LOST 26/12 23/13TOUCHDOWNS 33 27 Rushing 11 9 Passing 13 14 Returns 9 4
SCORE BY PERIODS 1 2 3 4 OT PTSRAVENS 63 89 75 87 3 317OPPONENTS 46 59 57 106 0 268
SCORING TD RU PA RT K/PAT FG S PTSStover 0 0 0 0 30/30 29/32 0 117J. Lewis 7 7 0 0 0 42Moore 4 0 4 0 0 26Heap 3 0 3 0 0 18Sams 3 1 0 2 0 18Hymes 2 0 2 0 0 12McAlister 2 0 0 2 0 12Reed 2 0 0 2 0 12C. Taylor 2 2 0 0 0 12Boller 1 1 0 0 0 6Dinkins 1 0 1 0 0 6J. Johnson 1 0 0 1 0 6K. Johnson 1 0 1 0 0 6Jones 1 0 1 0 0 6Sanders 1 0 0 1 0 6Wilcox 1 0 1 0 0 6Williams 1 0 0 1 0 6RAVENS 33 11 13 9 30/30 29/32 0 317Opponents 27 9 14 4 24/24 26/31 1 268
2-PT. CONVERSIONS: Moore, RAVENS 1-3, Opponents 1-3
SACKS: Suggs 10.5, Thomas 8.0, Douglas 5.5, Weaver 4.0, Demps 2.5, Baxter 2.0, Reed 2.0, Williams 2.0, Gregg 1.5, R. Lewis 1.0, RAVENS 39.0, Opponents 35.0
RUSHING NO YDS AVG LG TDJ. Lewis 235 1006 4.3 75t 7C. Taylor 160 714 4.5 47 2Boller 53 189 3.6 19 1White 27 82 3.0 16 0White 14 62 4.4 16 0M. Smith 12 48 4.0 13 0Ricard 10 36 3.6 14 0Sams 4 19 4.8 8 1K. Johnson 1 0 0.0 0 0Stewart 1 -1 -1.0 -1 0Sanders 1 -10 -10.0 -10 0RAVENS 491 2063 4.2 75t 11Opponents 469 1681 3.6 35t 9
RECEIVING NO YDS AVG LG TDK. Johnson 35 373 10.7 35 1T. Taylor 34 421 12.4 47 0C. Taylor 30 184 6.1 23 0Heap 27 303 11.2 37 3Hymes 26 323 12.4 57t 2Wilcox 25 219 8.8 20 1Moore 24 293 12.2 52 4Jones 20 152 7.6 19 1Ricard 11 39 3.5 8 0J. Lewis 10 116 11.6 46 0Dinkins 9 94 10.4 18 1White 6 21 3.5 12 0White 2 4 2.0 6 0M. Smith 2 31 15.5 25 0Darling 2 5 2.5 4 0Sams 1 2 2.0 2 0RAVENS 258 2559 9.9 57t 13Opponents 276 3386 12.3 76t 14
INTERCEPTIONS NO YDS AVG LG TDReed 9 358 39.8 106t 1Williams 3 156 52.0 94 1Sanders 3 87 29.0 48t 1McAlister 1 51 51.0 51t 1Baxter 1 33 33.0 33 0Thomas 1 8 8.0 8 0J. Johnson 1 6 6.0 6t 1Weaver 1 1 1.0 1 0Demps 1 0 0.0 0 0RAVENS 21 700 33.3 106t 5Opponents 11 172 15.6 71 0
PUNTING NO YDS AVG NET TB IN LG BLKZastudil 73 2948 40.4 34.6 12 26 61 0Murphy 18 777 43.2 36.6 2 6 54 0Stewart 5 177 35.4 31.2 0 2 42 0Stover 1 33 33.0 13.0 1 0 33 0RAVENS 97 3935 40.6 34.6 15 34 61 0Opponents 94 3767 40.1 33.1 2 24 59 0
PUNT RETURNS RET FC YDS AVG LG TDSams 55 12 575 10.5 78t 2Sanders 5 0 41 8.2 23 0RAVENS 60 12 616 10.3 78t 2Opponents 36 21 281 7.8 18 0
KICKOFF RETURNS NO YDS AVG LG TDSams 59 1251 21.2 64 0White 4 99 24.8 44 0Dinkins 1 7 7.0 7 0J. Johnson 1 6 6.0 6 0RAVENS 61 1264 20.7 64 0Opponents 65 1509 23.2 95t 2
FIELD GOALS 1-19 20-29 30-39 40-49 50+Stover 2/2 9/9 7/8 9/10 2/3RAVENS 2/2 9/9 7/8 9/10 2/3Opponents 1/1 13/13 3/4 8/10 1/3
Stover: (42G)(35G,27G,34G)(21G)(50G)(33G)(24G,50N,19G)(44G)(44G,39G,43G,36G)(24G,42G)(50G)(22G)(20G,22G,38G,45G)(46G,44G,27G)(42G,31B)(44N)(25G,19G,33G)
Opponents: (37G,25G)(48N)(29G,47G,26G)(42G,38G)(26G)(24G,21G)(20G,41G,43G)(50G,29G)(20G)(19G,41N)(28G,40G,48G)(53N,41G,24G)()(24G,33G,33N)(23G,40G)(53N)
PASSING ATT COMP YARDS COMP% YDS/ATT TD TD% INT INT% LG SACK/LOST RATINGBoller 464 258 2559 55.6 5.52 13 2.8 11 2.4 57t 35/247 70.9Hymes 1 0 0 0.0 0.00 0 0.0 0 0.0 0 0/0 39.6RAVENS 465 258 2559 55.5 5.50 13 2.8 11 2.4 57t 35/247 70.7Opponents 501 276 3386 55.1 6.76 14 2.8 21 4.2 76t 39/264 68.0

BALTIMORERAVENS.COM 369
2004 STATISTICS
GAM
E D
AY
RECORDS
HIS
TORY
2010
REVIE
W
PLAYERS
ORGANIZ
ATIO
N
349BALTIMORERAVENS.COM
Record . . . . . . . . . . . . . . . . . . . . . . . . . . . . . . . . . . . . . . . . . . . . . . . 9-7 vs. AFC North . . . . . . . . . . . . . . . . . . . . . . . . . . . . . . . . . . . . . . . . . 3-3vs. AFC . . . . . . . . . . . . . . . . . . . . . . . . . . . . . . . . . . . . . . . . . . . . . . 6-6 vs. NFC . . . . . . . . . . . . . . . . . . . . . . . . . . . . . . . . . . . . . . . . . . . . . . 3-1Home . . . . . . . . . . . . . . . . . . . . . . . . . . . . . . . . . . . . . . . . . . . . . . . . 6-2 Away . . . . . . . . . . . . . . . . . . . . . . . . . . . . . . . . . . . . . . . . . . . . . . . . 3-5On Grass . . . . . . . . . . . . . . . . . . . . . . . . . . . . . . . . . . . . . . . . . . . . . 1-4 On Artificial Turf . . . . . . . . . . . . . . . . . . . . . . . . . . . . . . . . . . . . . . . . 8-3Outdoors . . . . . . . . . . . . . . . . . . . . . . . . . . . . . . . . . . . . . . . . . . . . . 9-6 Indoors . . . . . . . . . . . . . . . . . . . . . . . . . . . . . . . . . . . . . . . . . . . . . . . 0-1Leading at Halftime . . . . . . . . . . . . . . . . . . . . . . . . . . . . . . . . . . . . . 6-1 Trailing at Halftime . . . . . . . . . . . . . . . . . . . . . . . . . . . . . . . . . . . . . . 3-3Tied at Halftime . . . . . . . . . . . . . . . . . . . . . . . . . . . . . . . . . . . . . . . . 0-3 Leading After 3 Quarters . . . . . . . . . . . . . . . . . . . . . . . . . . . . . . . . . 7-1Tied After 3 Quarters . . . . . . . . . . . . . . . . . . . . . . . . . . . . . . . . . . . . 0-0 Trailing After 3 Quarters . . . . . . . . . . . . . . . . . . . . . . . . . . . . . . . . . . 2-6Winning Coin Toss . . . . . . . . . . . . . . . . . . . . . . . . . . . . . . . . . . . . . . 4-4 Losing Coin Toss . . . . . . . . . . . . . . . . . . . . . . . . . . . . . . . . . . . . . . . 5-3Decided by 7 Points or Less . . . . . . . . . . . . . . . . . . . . . . . . . . . . . . 3-3 Decided By 3 Points or Less . . . . . . . . . . . . . . . . . . . . . . . . . . . . . . 1-2
When Scoring First . . . . . . . . . . . . . . . . . . . . . . . . . . . . . . . . . . . . . 3-2 When Not Scoring First . . . . . . . . . . . . . . . . . . . . . . . . . . . . . . . . . . 6-5Positive or Even Turnover Ratio . . . . . . . . . . . . . . . . . . . . . . . . . . . . 8-3 Negative Turnover Ratio . . . . . . . . . . . . . . . . . . . . . . . . . . . . . . . . . 1-4Winning or even Penalty Ratio . . . . . . . . . . . . . . . . . . . . . . . . . . . . . 5-6 Losing Penalty Ratio . . . . . . . . . . . . . . . . . . . . . . . . . . . . . . . . . . . . 4-1With a 100-Yard Rusher . . . . . . . . . . . . . . . . . . . . . . . . . . . . . . . . . . 4-2 With a 100-Yard Receiver . . . . . . . . . . . . . . . . . . . . . . . . . . . . . . . . 0-0Without a 100-Yard Rusher . . . . . . . . . . . . . . . . . . . . . . . . . . . . . . . 5-5 Without a 100-Yard Receiver . . . . . . . . . . . . . . . . . . . . . . . . . . . . . . 9-7When Allowing a 100-Yard Rusher . . . . . . . . . . . . . . . . . . . . . . . . . . 1-3 When Not Allowing a 100-Yard Rusher. . . . . . . . . . . . . . . . . . . . . . . 8-4When Allowing a 100-Yard Receiver . . . . . . . . . . . . . . . . . . . . . . . . . 4-2 When Not Allowing a 100-Yard Receiver . . . . . . . . . . . . . . . . . . . . . 6-5With a 300-Yard Passer . . . . . . . . . . . . . . . . . . . . . . . . . . . . . . . . . . 0-0 Without a 300-Yard Passer . . . . . . . . . . . . . . . . . . . . . . . . . . . . . . . 9-7Allowing a 300-Yard (net) Passer . . . . . . . . . . . . . . . . . . . . . . . . . . . 0-1 Not Allowing a 300-Yard (net) Passer . . . . . . . . . . . . . . . . . . . . . . . 9-6Overtime . . . . . . . . . . . . . . . . . . . . . . . . . . . . . . . . . . . . . . . . . . . . . 1-0 Preseason . . . . . . . . . . . . . . . . . . . . . . . . . . . . . . . . . . . . . . . . . . . . 3-1
PLAYER TT SOLO AS SACKS YDS INT YDS PD FF FRLewis, Ray 200 122 78 1 9 0 0 3 1 2Hartwell, Ed 141 83 58 0 0 0 0 0 1 0Douglas, Marques 92 47 45 5.5 37.5 0 0 2 1 0Gregg, Kelly 89 54 35 1.5 5.5 0 0 2 1 1Reed, Ed 89 80 9 2 28 9 358 17 3 2Baxter, Gary 86 78 8 2 8 1 33 14 2 0Demps, Will 86 72 14 2.5 23.5 1 0 8 2 2Thomas, Adalius 80 48 32 8 28 1 8 5 4 0Suggs, Terrell 72 48 24 10.5 83.5 0 0 1 1 2Weaver, Anthony 61 35 26 4 23 1 1 5 0 1Kemoeatu, Maake 48 27 21 0 0 0 0 0 0 0McAlister, Chris* 44 38 6 0 0 1 51 8 0 2Williams, Chad 32 31 1 2 18 3 158 6 0 0Johnson, Jarret 30 17 13 0 0 1 6 1 0 1Fuller, Corey 14 13 1 0 0 0 0 0 0 0Walls, Ray 12 10 2 0 0 0 0 2 0 0Brown, Cornell 10 6 4 0 0 0 0 0 0 0Sanders, Deion 9 8 1 0 0 3 87 7 0 0Franklin, Aubrayo 7 3 4 0 0 0 0 1 0 0Slaughter, T.J. 7 4 3 0 0 0 0 0 0 0Scott, Bart 5 3 2 0 0 0 0 0 0 0Edwards, Dwan 4 1 3 0 0 0 0 0 0 0Green, Roderick 1 1 0 0 0 0 0 0 0 0Totals 1219 829 390 39.0 264.0 21 700 82 16 13* McAlister recovered an Ed Reed fumble vs. Cin. (12/5) after Reed intercepted a pass
OFFENSE WR 89 Travis Taylor LT 75 Jonathan Ogden LG 64 Edwin Mulitalo C 62 Casey Rabach RG 66 Bennie Anderson RT 78 Orlando Brown TE 86 Todd Heap 82 Terry Jones WR 80 Randy Hymes QB 7 Kyle Boller RB 31 Jamal Lewis FB 39 Alan Ricard
DEFENSE DE 98 Anthony Weaver NT 97 Kelly Gregg DE 94 Marques Douglas LOLB 55 Terrell Suggs LILB 56 Edgerton Hartwell RILB 52 Ray Lewis ROLB 96 Adalius Thomas LCB 21 Chris McAlister RCB 28 Gary Baxter SS 20 Ed Reed FS 47 Will Demp
PLAYER TT SOLO AS FF FR BKMorrow, Harold 21 15 6 0 0 0Scott, Bart 17 10 7 0 1 0Thomas, Adalius 16 15 1 0 0 0Williams, Chad 14 10 4 0 0 0Brown, Cornell 8 6 2 0 0 0Slaughter, T.J. 8 7 1 1 0 0Smith, Musa 8 8 0 0 0 0Wilcox, Daniel 8 8 0 0 0 0Fuller, Corey 7 5 2 0 0 0Taylor, Chester 7 6 1 0 0 0Walls, Ray 7 5 2 0 1 0Green, Rod 5 4 1 0 0 0Demps, Will 4 4 0 0 0 0Dinkins, Darnell 3 2 1 0 0 0White, Jamel 3 3 0 0 0 0Maese, Joe 2 2 0 0 0 0Mughelli, Ovie 2 2 0 0 0 0Sams, B.J. 2 2 0 0 0 0Hartwell, Ed 1 0 1 0 1 0Richey, Wade 1 1 0 0 0 0Totals 144 115 29 1 3 0
Brian Billick, Head Coach; Matt Cavanaugh, Offensive Coordinator;
Mike Nolan, Defensive Coordinator; Gary Zauner, Special Teams
Coordinator; Jim Fassel, Senior Consultant/Offense; Jim Colletto,
Offensive Line; Jedd Fisch, Offensive Assistant; Jeff FitzGerald,
Outside Linebackers; Jeff Friday, Strength and Conditioning; Wade
Harman, Tight Ends/Asst. Offensive Line; Johnnie Lynn, Secondary;
Mike Pettine, Defensive Assistant; Paul Ricci, Asst. Strength and
Conditioning; Rex Ryan, Defensive Line; David Shaw, Wide Receivers;
Mike Singletary, Inside Linebackers; Matt Simon, Running Backs;
Bennie Thompson, Special Teams Assistant; Dennis Thurman,
Secondary; Phil Zacharias, Defensive Assistant
SOLO SACKS FF FR PD 122 Ray Lewis 10.5 Terrell Suggs 4 Adalius Thomas 2 5 tied 17 Ed Reed 83 Ed Hartwell 8.0 Adalius Thomas 3 Ed Reed 1 3 tied 14 Gary Baxter 80 Ed Reed 5.5 Marques Douglas 2 2 tied 8 2 tied
Pro Bowl: LB Ray Lewis (starter), CB Chris McAlister (starter), T Jonathan Ogden (starter), S Ed Reed (starter), LB Terrell SuggsAP Defensive Player of the Year: S Ed Reed
All-Pro: LB Ray Lewis (AP-1st team, FD-1st team, PFW, SI, TSN), CB Chris McAlister (AP-2nd team, FD-1st team, PFW), T Jonathan Ogden (AP-2nd team, PFW, FD-1st team, SI, TSN), S Ed Reed (AP-1st team, FD-2nd team, SI, TSN)
Pro Football Weekly Defensive Most Valuable Player: S Ed ReedPro Football Weekly All-AFC: RB Jamal Lewis, T Jonathan Ogden, LB Ray Lewis, S Ed Reed, LB Adalius Thomas (ST)
Football Digest Defensive Player of the Year: S Ed ReedFootball Digest Assistant Coach of the Year: Defensive Coordinator Mike Nolan
NFL Players of the Month/Week: RS B.J. Sams (Oct.) – Special Teams, S Ed Reed (Nov.) – Defense, CB Deion Sanders (Week 7) – Defense, S Ed Reed (Week 9) – Defense, QB Kordell Stewart (Week 10) – Special Teams, QB Kyle Boller (Week 14) – Offense
Ravens Nest Lineman of the Year: DT Ma’ake KemoeatuRavens Roost Extra Effort Award: QB Kyle BollerRavens Roost Unsung Hero: C/G Casey Rabach
Ed Block Courage Award: T Orlando Brown
TOP THREE
COACHES
RAVENS HONOR ROLL
USUAL STARTERS
DEFENSIVE SPECIAL TEAMS
SEASON TRENDS
FROM COACHES VIDEO FROM COACHES VIDEO

2019 BALTIMORE RAVENS MEDIA GUIDE370
2005 STATISTICS
ORGANIZ
ATIO
N P
LAYERS 20
10 R
EVIE
W H
ISTORY R
ECORDS G
AM
E D
AY
350 BALTIMORE RAVENS FAN & MEDIA GUIDE 2011
2005 STATISTICS
RESULTS AND ATTENDANCEWON 6, LOST 1009/11 L 7-24 Indianapolis 70,50109/18 L 10-25 at Tennessee 69,14909/25 Bye Week10/02 W 13-3 NY Jets 70,47910/09 L 17-35 at Detroit 61,20110/16 W 16-3 Cleveland 70,19610/23 L 6-10 at Chicago 62,10210/31 L 19-20 at Pittsburgh 64,17811/06 L 9-21 Cincinnati 70,54011/13 L 3-30 at Jacksonville 66,10711/20 W 16-13 (OT) Pittsburgh 70,60111/27 L 29-42 at Cincinnati 65,68012/04 W 16-15 Houston 69,90912/11 L 10-12 at Denver 75,65112/19 W 48-3 Green Bay 70,60412/25 W 30-23 Minnesota 70,24601/06 L 16-20 at Cleveland 69,871
TEAM STATISTICS RAVENS OPPONENTTOTAL FIRST DOWNS 286 277 Rushing 97 79 Passing 163 161 Penalty 26 37 3rd Down: Made/Att 95/243 79/219 3rd Down Pct. 39.1 36.1 4th Down: Made/Att 11/19 4/12 4th Down Pct. 57.9 33.3POSSESSION AVG. 30:22 29:38TOTAL NET YARDS 4693 4555 Avg. Per Game 293.3 284.7 Total Plays 1056 998 Avg. Per Play 4.4 4.6NET YARDS RUSHING 1605 1591 Avg. Per Game 100.3 99.4 Total Rushes 452 431NET YARDS PASSING 3088 2964 Avg. Per Game 193.0 185.3 Sacked/Yards Lost 42/293 41/264 Gross Yards 3381 3228 Att./Completions 562/335 526/296 Completion Pct. 59.6 56.3 Had Intercepted 21 11PUNTS/AVERAGE 86/42.8 89/40.5NET PUNTING AVG. 86/35.6 89/33.0PENALTIES/YARDS 139/1067 110/844FUMBLES/BALL LOST 28/15 27/14TOUCHDOWNS 25 30 Rushing 5 8 Passing 17 18 Returns 3 4
SCORE BY PERIODS 1 2 3 4 OT PTSRAVENS 50 77 44 91 3 265OPPONENTS 54 75 90 80 0 299
SCORING TD RU PA RT K/PAT FG S PTSStover 0 0 0 0 23/23 30/34 0 113Heap 7 0 7 0 0 42J. Lewis 4 3 1 0 0 24Clayton 3 1 2 0 0 18Mason 3 0 3 0 0 18Thomas 3 0 0 3 0 18Hymes 2 0 2 0 0 12Boller 1 1 0 0 0 6Taylor 1 0 1 0 0 6Wilcox 1 0 1 0 0 6J. Green 0 0 0 0 0 2Elling 0 0 0 0 0/0 0/1 0 0RAVENS 25 5 17 3 23/23 30/35 0 265Opponents 30 8 18 4 28/29 29/31 1 299
2-PT. CONVERSIONS: J. Green, RAVENS 1-2; Opponents 1-1
SACKS: Thomas 9.0, Suggs 8.0, Polley 4.0, Scott 4.0, Boulware 2.5, Gregg 2.5, R. Green 2.0, Weaver 2.0, (group) 2.0, J. Johnson 1.5, Williams 1.5, Franklin 1.0, Kemoeatu 1.0, R. Lewis 1.0 RAVENS 42.0; Opponents 42.0
RUSHING NO YDS AVG LG TDJ. Lewis 269 906 3.4 25 3Taylor 117 487 4.2 52 0Wright 18 68 3.8 22 0Boller 23 66 2.9 9 1Clayton 8 33 4.1 11t 1Stewart 4 24 6.0 13 0White 6 17 2.8 5 0J. Green 5 4 0.8 4 0Sanders 1 0 0.0 0 0Zastudil 1 0 0.0 0 0RAVENS 452 1605 3.6 52 5Opponents 431 1591 3.7 77t 8
RECEIVING NO YDS AVG LG TDMason 86 1073 12.5 39t 3Heap 75 855 11.4 48 7Clayton 44 471 10.7 47t 2Taylor 41 292 7.1 20 1J. Lewis 32 191 6.0 15t 1Wilcox 20 154 7.7 17t 1Hymes 11 132 12.0 21 2J. Green 7 32 4.6 8 0Dinkins 6 55 9.2 15 0Moore 3 59 19.7 24 0Mughelli 3 13 4.3 6 0Mu. Smith 3 5 1.7 4 0P. Johnson 2 31 15.5 19 0Ricard 2 18 9.0 11 0RAVENS 335 3381 10.1 48 17Opponents 296 3228 10.9 56 18
INTERCEPTIONS NO YDS AVG LG TDSanders 2 57 28.5 33 0Thomas 2 48 24.0 28 1Suggs 2 38 19.0 38 0Reed 1 23 23.0 23 0Williams 1 14 14.0 14 0Rolle 1 11 11.0 11 0Polley 1 2 2.0 2 0R. Lewis 1 0 0.0 0 0McAlister 1 0 0.0 0 0RAVENS 12 193 16.1 48 1Opponents 21 256 12.2 37 3
PUNTING NO YDS AVG NET TB IN LG BLKZastudil 84 3653 43.5 35.7 7 11 60 1Elling 1 32 32.0 32.0 0 1 32 0RAVENS 86 3685 42.8 35.6 7 12 60 1Opponents 89 3605 40.5 33.0 12 30 61 0
PUNT RETURNS RET FC YDS AVG LG TDSams 33 10 401 12.2 51 0Clayton 6 2 30 5.0 10 0Sanders 0 1 0 --- --- 0RAVENS 39 13 431 11.1 51 0Opponents 55 12 481 8.7 62t 1
KICKOFF RETURNS NO YDS AVG LG TDSams 44 998 22.7 87 0Taylor 12 253 21.1 45 0White 2 18 9.0 9 0Dinkins 1 10 10.0 10 0J. Green 1 10 10.0 10 0RAVENS 60 1289 21.5 87 0Opponents 62 1352 21.8 59 0
FIELD GOALS 1-19 20-29 30-39 40-49 50+Stover 1/1 8/8 10/11 11/14 0/0Elling 0/0 0/0 0/0 0/0 0/1RAVENS 1/1 8/8 10/11 11/14 0/1Opponents 0/0 12/12 9/9 8/10 0/0
Stover: (38N,47N,45N)(30)(42,25)(46)(39,27,38)(40,29)(22,43N,40,49,47)(34,32,31)(41)(47,25,44)()(38)(29)(23,40)(37,38,19)(21,43,31)Elling: ()()()()()()()()()()(54N)()()()()()Opponents: (20)(39,29,47)(21)()(24)(23,47N)(42,37)(48N)(48,33,26)(44,37)(26,31)(39,26,22,29,39)(47,48)(27)(36,40,46)(21,39)
PASSING ATT COMP YARDS COMP% YDS/ATT TD TD% INT INT% LG SACK/LOST RATINGBoller 293 171 1799 58.4 6.14 11 3.8 12 4.1 47t 23/146 71.8Wright 266 164 1582 61.7 5.95 6 2.3 9 3.4 48 19/147 71.7Hymes 2 0 0 0.0 0.00 0 0.0 0 0.0 0 0/0 39.6Clayton 1 0 0 0.0 0.00 0 0.0 0 0.0 0 0/0 39.6RAVENS 562 335 3381 59.6 6.02 17 3.0 21 3.7 48 42/293 71.3Opponents 526 296 3228 56.3 6.14 18 3.4 11 2.3 56 41/264 76.4
01/01

BALTIMORERAVENS.COM 371
2005 STATISTICS
GAM
E D
AY
RECORDS
HIS
TORY
2010
REVIE
W
PLAYERS
ORGANIZ
ATIO
N
351BALTIMORERAVENS.COM
PLAYER TT SOLO AS SACKS YDS INT YDS PD FF FRPolley, Tommy 134 95 39 4 29 0 0 2 2 1Scott, Bart 119 77 42 4 24.5 0 0 5 1 1Thomas, Adalius 104 70 34 9 75 2 48 9 3 4Gregg, Kelly 102 61 41 2.5 15 0 0 4 0 0Suggs, Terrell 86 65 21 8 64.5 2 38 3 6 1Lewis, Ray 77 47 30 1 1 1 0 3 0 1Demps, Will 70 56 14 0 0 0 0 3 0 2Kemoeatu, Maake 70 44 26 1 2 0 0 0 0 1Johnson, Jarret 61 37 24 1.5 4 0 0 2 0 1McAlister, Chris 53 47 6 0 0 1 0 20 1 0Williams, Chad 47 34 13 1.5 12 1 14 3 2 0Weaver, Anthony 46 35 11 2 11 0 0 2 0 1Rolle, Samari 45 40 5 0 0 1 11 14 1 0Reed, Ed 40 36 4 0 0 1 23 12 0 0Sanders, Deion 40 30 10 0 0 2 57 7 0 0Edwards, Dwan 38 23 15 0 0 0 0 0 0 0Franklin, Aubrayo 34 18 16 1 1 0 0 1 0 0Carter, Dale 18 17 1 0 0 0 0 1 0 0Boulware, Peter 15 6 9 2.5 18 0 0 1 0 0Green, Roderick 4 4 0 2 4 0 0 0 0 0Ward, B.J. 4 4 0 0 0 0 0 0 0 1Totals 1207 846 361 42 261 11 191 92 16 14
OFFENSE WR 89 Mark Clayton LT 75 Jonathan Ogden LG 64 Edwin Mulitalo C 62 Mike Flynn RG 68 Keydrick Vincent RT 77 Orlando Brown TE 86 Todd Heap WR 85 Derrick Mason QB 7 Kyle Boller RB 31 Jamal Lewis FB 34 Ovie Mughelli
DEFENSE LDE 98 Anthony Weaver DT 97 Kelly Gregg NT 92 Maake Kemoeatu RDE 55 Terrell Suggs LLB 96 Adalius Thomas MLB 50 Tommy Polley RLB 57 Bart Scott LCB 21 Chris McAlister RCB 22 Samari Rolle SS 20 Ed Reed FS 47 Will Demps
PLAYER TT SOLO AS FF FR BKWilcox, Daniel 18 12 6 0 1 0Green, Roderick 17 12 5 0 1 0Ward, B.J. 17 11 6 1 0 0Mughelli, Ovie 16 15 1 0 0 0Scott, Bart 15 12 3 2 0 0Taylor, Chester 13 10 3 0 0 0Williams, Chad 12 10 2 0 0 0Carter, Dale 10 10 0 1 0 0Dinkins, Darnell 10 9 1 0 0 0Katula, Matt 10 7 3 0 0 0Demps, Will 7 3 4 0 0 0Green, Justin 4 3 1 0 0 0Thomas, Adalius 4 4 0 0 0 0Polley, Tommy 3 1 2 0 0 0Clayton, Mark 2 2 0 0 0 0Haley, Dennis 2 2 0 0 0 0Oglesby, Evan 2 1 1 0 0 0Smith, Mike 2 1 1 0 0 0Smith, Musa 2 2 0 0 0 0Elling, Aaron 1 1 0 0 0 0Nelson, Jim 1 1 0 0 0 0Stover, Matt 1 1 0 0 0 0Woodfin, Zac 1 1 0 0 0 0Zastudil, Dave 1 1 0 0 0 0Totals 171 132 39 4 2 0
Brian Billick, Head Coach; Jim Fassel, Offensive Coordinator; Rex
Ryan, Defensive Coordinator; Gary Zauner, Special Teams Coordinator;
Clarence Brooks, Defensive Line; John Fassel, Offensive Assistant;
Jedd Fisch, Asst. Quarterbacks/Wide Receivers; Jeff FitzGerald,
Linebackers; Chris Foerster, Asst. Head Coach/Offensive Line;
Jeff Friday, Strength and Conditioning; Wade Harman, Tight Ends/
Asst. Offensive Line; Johnnie Lynn, Secondary; Rick Neuheisel,
Quarterbacks; Mike Pettine, Outside Linebackers; Paul Ricci, Asst.
Strength and Conditioning; David Shaw, Wide Receivers; Matt Simon,
Running Backs; Bennie Thompson, Asst. Special Teams; Dennis
Thurman, Secondary
SOLO SACKS FF FR PD 95 Tommy Polley 9 Adalius Thomas 6 Terrell Suggs 4 Adalius Thomas 20 Chris McAlister 77 Bart Scott 8 Terrell Suggs 3 Adalius Thomas 2 Will Demps 14 Samari Rolle 70 Adalius Thomas 4 2 Tied 2 2 Tied 1 8 Tied 12 Ed Reed
Pro Bowl: LT Jonathan Ogden (starter); TE Todd Heap and S Ed Reed (alternates)FedEx Air Player of the Week: QB Kyle Boller (Week 16)
Pro Football Weekly/PFWA All-Rookie Team: WR Mark ClaytonThe Sporting News All-Pro: PR B.J. SamsUSA Today All-Joe Team: DT Kelly Gregg
NFL Players of the Week: K Matt Stover (Week 11) – Special Teams; LB Terrell Suggs (Week 13) – DefenseRavens Nest Player of the Year: LB Bart Scott
Ravens Roost Extra Effort Award: DE Jarret JohnsonRavens Roost Unsung Hero: LB Adalius Thomas
Ed Block Courage Award: CB Dale Carter
Record . . . . . . . . . . . . . . . . . . . . . . . . . . . . . . . . . . . . . . . . . . . . . . 6-10vs. AFC North . . . . . . . . . . . . . . . . . . . . . . . . . . . . . . . . . . . . . . . . . 2-4vs. AFC . . . . . . . . . . . . . . . . . . . . . . . . . . . . . . . . . . . . . . . . . . . . . . 4-8vs. NFC . . . . . . . . . . . . . . . . . . . . . . . . . . . . . . . . . . . . . . . . . . . . . . 2-2Home . . . . . . . . . . . . . . . . . . . . . . . . . . . . . . . . . . . . . . . . . . . . . . . . 6-2Away . . . . . . . . . . . . . . . . . . . . . . . . . . . . . . . . . . . . . . . . . . . . . . . . 0-8On Grass . . . . . . . . . . . . . . . . . . . . . . . . . . . . . . . . . . . . . . . . . . . . . 0-6On Artificial Turf . . . . . . . . . . . . . . . . . . . . . . . . . . . . . . . . . . . . . . . . 6-4Outdoors . . . . . . . . . . . . . . . . . . . . . . . . . . . . . . . . . . . . . . . . . . . . . 6-9Indoors . . . . . . . . . . . . . . . . . . . . . . . . . . . . . . . . . . . . . . . . . . . . . . . 0-1Leading at Halftime . . . . . . . . . . . . . . . . . . . . . . . . . . . . . . . . . . . . . 5-1Trailing at Halftime . . . . . . . . . . . . . . . . . . . . . . . . . . . . . . . . . . . . . . 1-8Tied at Halftime . . . . . . . . . . . . . . . . . . . . . . . . . . . . . . . . . . . . . . . . 0-1Leading After 3 Quarters . . . . . . . . . . . . . . . . . . . . . . . . . . . . . . . . . 5-0Tied After 3 Quarters . . . . . . . . . . . . . . . . . . . . . . . . . . . . . . . . . . . . 0-0Trailing After 3 Quarters . . . . . . . . . . . . . . . . . . . . . . . . . . . . . . . . . 1-10Winning Coin Toss . . . . . . . . . . . . . . . . . . . . . . . . . . . . . . . . . . . . . . 3-5Losing Coin Toss . . . . . . . . . . . . . . . . . . . . . . . . . . . . . . . . . . . . . . . 3-5Decided by 7 Points or Less . . . . . . . . . . . . . . . . . . . . . . . . . . . . . . 3-4 Decided By 3 Points or Less . . . . . . . . . . . . . . . . . . . . . . . . . . . . . . 2-2
When Scoring First . . . . . . . . . . . . . . . . . . . . . . . . . . . . . . . . . . . . . 4-4When Not Scoring First . . . . . . . . . . . . . . . . . . . . . . . . . . . . . . . . . . 1-6Positive or Even Turnover Ratio . . . . . . . . . . . . . . . . . . . . . . . . . . . . 4-4Negative Turnover Ratio . . . . . . . . . . . . . . . . . . . . . . . . . . . . . . . . . 2-6Winning or Even Penalty Ratio . . . . . . . . . . . . . . . . . . . . . . . . . . . . 3-2Losing Penalty Ratio . . . . . . . . . . . . . . . . . . . . . . . . . . . . . . . . . . . . 3-8With a 100-Yard Rusher . . . . . . . . . . . . . . . . . . . . . . . . . . . . . . . . . . 1-1With a 100-Yard Receiver . . . . . . . . . . . . . . . . . . . . . . . . . . . . . . . . 2-1Without a 100-Yard Rusher . . . . . . . . . . . . . . . . . . . . . . . . . . . . . . . 5-9Without a 100-Yard Receiver . . . . . . . . . . . . . . . . . . . . . . . . . . . . . . 4-9When Allowing a 100-Yard Rusher . . . . . . . . . . . . . . . . . . . . . . . . . . 0-4When Not Allowing a 100-Yard Rusher. . . . . . . . . . . . . . . . . . . . . . . 5-7When Allowing a 100-Yard Receiver . . . . . . . . . . . . . . . . . . . . . . . . . 0-3When Not Allowing a 100-Yard Receiver . . . . . . . . . . . . . . . . . . . . . 6-7With a 300-Yard Passer . . . . . . . . . . . . . . . . . . . . . . . . . . . . . . . . . . 0-0Without a 300-Yard Passer . . . . . . . . . . . . . . . . . . . . . . . . . . . . . . 6-10Allowing a 300-Yard (net) Passer . . . . . . . . . . . . . . . . . . . . . . . . . . . 0-1Not Allowing a 300-Yard (net) Passer . . . . . . . . . . . . . . . . . . . . . . . 6-9Overtime . . . . . . . . . . . . . . . . . . . . . . . . . . . . . . . . . . . . . . . . . . . . . 1-0Preseason . . . . . . . . . . . . . . . . . . . . . . . . . . . . . . . . . . . . . . . . . . . . 2-2
TOP THREE
COACHES
RAVENS HONOR ROLL
USUAL STARTERS
DEFENSIVE SPECIAL TEAMS
SEASON TRENDS
FROM COACHES VIDEOFROM COACHES VIDEO
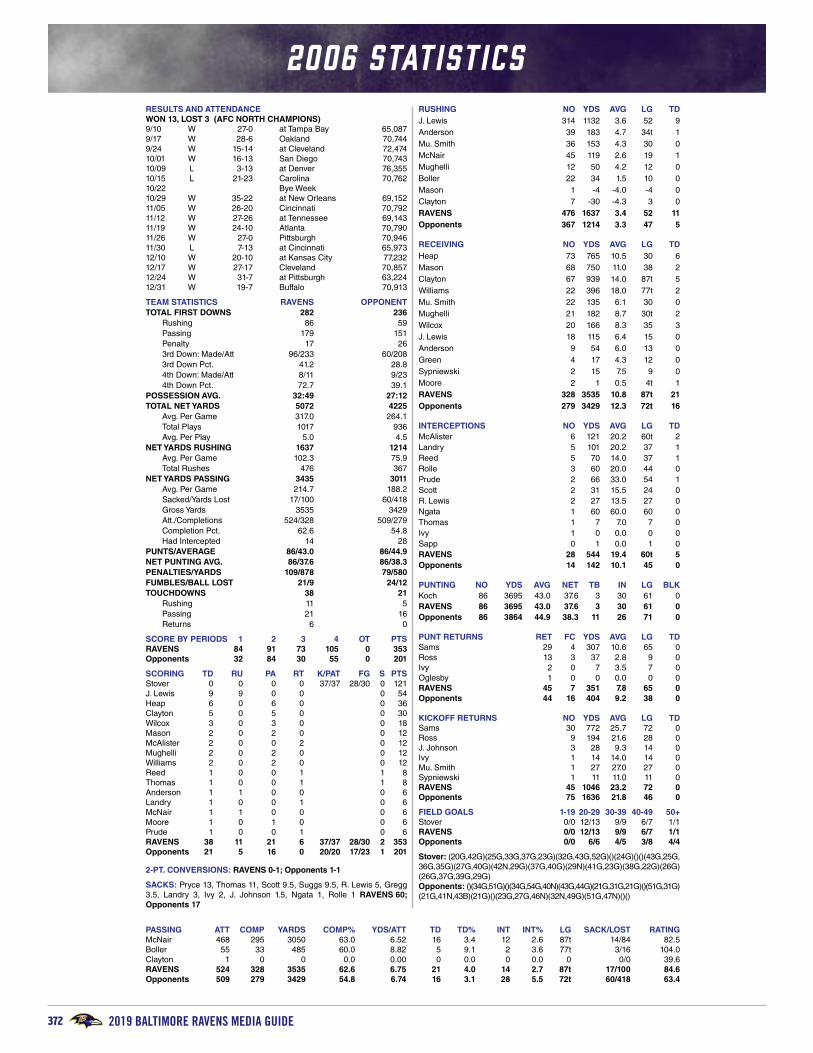
2019 BALTIMORE RAVENS MEDIA GUIDE372
2006 STATISTICS
ORGANIZ
ATIO
N P
LAYERS 20
10 R
EVIE
W H
ISTORY R
ECORDS G
AM
E D
AY
352 BALTIMORE RAVENS FAN & MEDIA GUIDE 2011
2006 STATISTICS
RESULTS AND ATTENDANCEWON 13, LOST 3 (AFC NORTH CHAMPIONS)9/10 W 27-0 at Tampa Bay 65,0879/17 W 28-6 Oakland 70,7449/24 W 15-14 at Cleveland 72,47410/01 W 16-13 San Diego 70,74310/09 L 3-13 at Denver 76,35510/15 L 21-23 Carolina 70,76210/22 Bye Week10/29 W 35-22 at New Orleans 69,15211/05 W 26-20 Cincinnati 70,79211/12 W 27-26 at Tennessee 69,14311/19 W 24-10 Atlanta 70,79011/26 W 27-0 Pittsburgh 70,94611/30 L 7-13 at Cincinnati 65,97312/10 W 20-10 at Kansas City 77,23212/17 W 27-17 Cleveland 70,85712/24 W 31-7 at Pittsburgh 63,22412/31 W 19-7 Buffalo 70,913
TEAM STATISTICS RAVENS OPPONENTTOTAL FIRST DOWNS 282 236 Rushing 86 59 Passing 179 151 Penalty 17 26 3rd Down: Made/Att 96/233 60/208 3rd Down Pct. 41.2 28.8 4th Down: Made/Att 8/11 9/23 4th Down Pct. 72.7 39.1POSSESSION AVG. 32:49 27:12TOTAL NET YARDS 5072 4225 Avg. Per Game 317.0 264.1 Total Plays 1017 936 Avg. Per Play 5.0 4.5NET YARDS RUSHING 1637 1214 Avg. Per Game 102.3 75.9 Total Rushes 476 367NET YARDS PASSING 3435 3011 Avg. Per Game 214.7 188.2 Sacked/Yards Lost 17/100 60/418 Gross Yards 3535 3429 Att./Completions 524/328 509/279 Completion Pct. 62.6 54.8 Had Intercepted 14 28PUNTS/AVERAGE 86/43.0 86/44.9NET PUNTING AVG. 86/37.6 86/38.3PENALTIES/YARDS 109/878 79/580FUMBLES/BALL LOST 21/9 24/12TOUCHDOWNS 38 21 Rushing 11 5 Passing 21 16 Returns 6 0
SCORE BY PERIODS 1 2 3 4 OT PTSRAVENS 84 91 73 105 0 353Opponents 32 84 30 55 0 201
SCORING TD RU PA RT K/PAT FG S PTSStover 0 0 0 0 37/37 28/30 0 121J. Lewis 9 9 0 0 0 54Heap 6 0 6 0 0 36Clayton 5 0 5 0 0 30Wilcox 3 0 3 0 0 18Mason 2 0 2 0 0 12McAlister 2 0 0 2 0 12Mughelli 2 0 2 0 0 12Williams 2 0 2 0 0 12Reed 1 0 0 1 1 8Thomas 1 0 0 1 1 8Anderson 1 1 0 0 0 6Landry 1 0 0 1 0 6McNair 1 1 0 0 0 6Moore 1 0 1 0 0 6Prude 1 0 0 1 0 6RAVENS 38 11 21 6 37/37 28/30 2 353Opponents 21 5 16 0 20/20 17/23 1 201
2-PT. CONVERSIONS: RAVENS 0-1; Opponents 1-1
SACKS: Pryce 13, Thomas 11, Scott 9.5, Suggs 9.5, R. Lewis 5, Gregg 3.5, Landry 3, Ivy 2, J. Johnson 1.5, Ngata 1, Rolle 1 RAVENS 60; Opponents 17
RUSHING NO YDS AVG LG TDJ. Lewis 314 1132 3.6 52 9Anderson 39 183 4.7 34t 1Mu. Smith 36 153 4.3 30 0McNair 45 119 2.6 19 1Mughelli 12 50 4.2 12 0Boller 22 34 1.5 10 0Mason 1 -4 -4.0 -4 0Clayton 7 -30 -4.3 3 0RAVENS 476 1637 3.4 52 11Opponents 367 1214 3.3 47 5
RECEIVING NO YDS AVG LG TDHeap 73 765 10.5 30 6Mason 68 750 11.0 38 2Clayton 67 939 14.0 87t 5Williams 22 396 18.0 77t 2Mu. Smith 22 135 6.1 30 0Mughelli 21 182 8.7 30t 2Wilcox 20 166 8.3 35 3J. Lewis 18 115 6.4 15 0Anderson 9 54 6.0 13 0Green 4 17 4.3 12 0Sypniewski 2 15 7.5 9 0Moore 2 1 0.5 4t 1RAVENS 328 3535 10.8 87t 21Opponents 279 3429 12.3 72t 16
INTERCEPTIONS NO YDS AVG LG TDMcAlister 6 121 20.2 60t 2Landry 5 101 20.2 37 1Reed 5 70 14.0 37 1Rolle 3 60 20.0 44 0Prude 2 66 33.0 54 1Scott 2 31 15.5 24 0R. Lewis 2 27 13.5 27 0Ngata 1 60 60.0 60 0Thomas 1 7 7.0 7 0Ivy 1 0 0.0 0 0Sapp 0 1 0.0 1 0RAVENS 28 544 19.4 60t 5Opponents 14 142 10.1 45 0
PUNTING NO YDS AVG NET TB IN LG BLKKoch 86 3695 43.0 37.6 3 30 61 0RAVENS 86 3695 43.0 37.6 3 30 61 0Opponents 86 3864 44.9 38.3 11 26 71 0
PUNT RETURNS RET FC YDS AVG LG TDSams 29 4 307 10.6 65 0Ross 13 3 37 2.8 9 0Ivy 2 0 7 3.5 7 0Oglesby 1 0 0 0.0 0 0RAVENS 45 7 351 7.8 65 0Opponents 44 16 404 9.2 38 0
KICKOFF RETURNS NO YDS AVG LG TDSams 30 772 25.7 72 0Ross 9 194 21.6 28 0J. Johnson 3 28 9.3 14 0Ivy 1 14 14.0 14 0Mu. Smith 1 27 27.0 27 0Sypniewski 1 11 11.0 11 0RAVENS 45 1046 23.2 72 0Opponents 75 1636 21.8 46 0
FIELD GOALS 1-19 20-29 30-39 40-49 50+Stover 0/0 12/13 9/9 6/7 1/1RAVENS 0/0 12/13 9/9 6/7 1/1Opponents 0/0 6/6 4/5 3/8 4/4
Stover: (20G,42G)(25G,33G,37G,23G)(32G,43G,52G)()(24G)()()(43G,25G,36G,35G)(27G,40G)(42N,29G)(37G,40G)(29N)(41G,23G)(38G,22G)(26G)(26G,37G,39G,29G)Opponents: ()(34G,51G)()(34G,54G,40N)(43G,44G)(21G,31G,21G)()(51G,31G)(21G,41N,43B)(21G)()(23G,27G,46N)(32N,49G)(51G,47N)()()
PASSING ATT COMP YARDS COMP% YDS/ATT TD TD% INT INT% LG SACK/LOST RATINGMcNair 468 295 3050 63.0 6.52 16 3.4 12 2.6 87t 14/84 82.5Boller 55 33 485 60.0 8.82 5 9.1 2 3.6 77t 3/16 104.0Clayton 1 0 0 0.0 0.00 0 0.0 0 0.0 0 0/0 39.6RAVENS 524 328 3535 62.6 6.75 21 4.0 14 2.7 87t 17/100 84.6Opponents 509 279 3429 54.8 6.74 16 3.1 28 5.5 72t 60/418 63.4

BALTIMORERAVENS.COM 373
2006 STATISTICS
GAM
E D
AY
RECORDS
HIS
TORY
2010
REVIE
W
PLAYERS
ORGANIZ
ATIO
N
353BALTIMORERAVENS.COM
Record . . . . . . . . . . . . . . . . . . . . . . . . . . . . . . . . . . . . . . . . . . . . . . 13-3 vs. AFC North . . . . . . . . . . . . . . . . . . . . . . . . . . . . . . . . . . . . . . . . . 5-1vs. AFC . . . . . . . . . . . . . . . . . . . . . . . . . . . . . . . . . . . . . . . . . . . . . 10-2 vs. NFC . . . . . . . . . . . . . . . . . . . . . . . . . . . . . . . . . . . . . . . . . . . . . . 3-1Home . . . . . . . . . . . . . . . . . . . . . . . . . . . . . . . . . . . . . . . . . . . . . . . . 7-1 Away . . . . . . . . . . . . . . . . . . . . . . . . . . . . . . . . . . . . . . . . . . . . . . . . 6-2On Grass . . . . . . . . . . . . . . . . . . . . . . . . . . . . . . . . . . . . . . . . . . . . . 5-1 On Artificial Turf . . . . . . . . . . . . . . . . . . . . . . . . . . . . . . . . . . . . . . . . 8-2Outdoors . . . . . . . . . . . . . . . . . . . . . . . . . . . . . . . . . . . . . . . . . . . . 12-3 Indoors . . . . . . . . . . . . . . . . . . . . . . . . . . . . . . . . . . . . . . . . . . . . . . . 1-0Leading at Halftime . . . . . . . . . . . . . . . . . . . . . . . . . . . . . . . . . . . . . 9-0 Trailing at Halftime . . . . . . . . . . . . . . . . . . . . . . . . . . . . . . . . . . . . . . 4-2Tied at Halftime . . . . . . . . . . . . . . . . . . . . . . . . . . . . . . . . . . . . . . . . 0-1 Leading After 3 Quarters . . . . . . . . . . . . . . . . . . . . . . . . . . . . . . . . 10-0Tied After 3 Quarters . . . . . . . . . . . . . . . . . . . . . . . . . . . . . . . . . . . . 0-1 Trailing After 3 Quarters . . . . . . . . . . . . . . . . . . . . . . . . . . . . . . . . . . 3-2Winning Coin Toss . . . . . . . . . . . . . . . . . . . . . . . . . . . . . . . . . . . . . . 5-2 Losing Coin Toss . . . . . . . . . . . . . . . . . . . . . . . . . . . . . . . . . . . . . . . 8-1Decided by 7 Points or Less . . . . . . . . . . . . . . . . . . . . . . . . . . . . . . 4-2 Decided By 3 Points or Less . . . . . . . . . . . . . . . . . . . . . . . . . . . . . . 3-1
When Scoring First . . . . . . . . . . . . . . . . . . . . . . . . . . . . . . . . . . . . . 9-1 When Not Scoring First . . . . . . . . . . . . . . . . . . . . . . . . . . . . . . . . . . 4-2Positive or Even Turnover Ratio . . . . . . . . . . . . . . . . . . . . . . . . . . . . 9-1 Negative Turnover Ratio . . . . . . . . . . . . . . . . . . . . . . . . . . . . . . . . . 4-2Winning or Even Penalty Ratio . . . . . . . . . . . . . . . . . . . . . . . . . . . . 6-1 Losing Penalty Ratio . . . . . . . . . . . . . . . . . . . . . . . . . . . . . . . . . . . . 8-2With a 100-Yard Rusher . . . . . . . . . . . . . . . . . . . . . . . . . . . . . . . . . . 2-0 With a 100-Yard Receiver . . . . . . . . . . . . . . . . . . . . . . . . . . . . . . . . 5-1Without a 100-Yard Rusher . . . . . . . . . . . . . . . . . . . . . . . . . . . . . . 11-3 Without a 100-Yard Receiver . . . . . . . . . . . . . . . . . . . . . . . . . . . . . . 8-2When Allowing a 100-Yard Rusher . . . . . . . . . . . . . . . . . . . . . . . . . . 2-0 When Not Allowing a 100-Yard Rusher. . . . . . . . . . . . . . . . . . . . . . 11-3When Allowing a 100-Yard Receiver . . . . . . . . . . . . . . . . . . . . . . . . . 4-2 When Not Allowing a 100-Yard Receiver . . . . . . . . . . . . . . . . . . . . . 9-1With a 300-Yard Passer . . . . . . . . . . . . . . . . . . . . . . . . . . . . . . . . . . 1-0 Without a 300-Yard Passer . . . . . . . . . . . . . . . . . . . . . . . . . . . . . . 12-3Allowing a 300-Yard (net) Passer . . . . . . . . . . . . . . . . . . . . . . . . . . . 1-1 Not Allowing a 300-Yard (net) Passer . . . . . . . . . . . . . . . . . . . . . . 12-2Overtime . . . . . . . . . . . . . . . . . . . . . . . . . . . . . . . . . . . . . . . . . . . . . 0-0 Preseason . . . . . . . . . . . . . . . . . . . . . . . . . . . . . . . . . . . . . . . . . . . . 2-2
PLAYER TT SOLO AS SACKS YDS INT YDS PD FF FRLewis, Ray 164 106 58 5 36.5 2 27 9 1 1Scott, Bart 135 93 42 9.5 66 2 31 9 1 0Thomas, Adalius 106 75 31 11 59 1 7 9 1 1Gregg, Kelly 101 61 40 3.5 23 0 0 1 1 3Landry, Dawan 89 55 34 3 16 5 101 13 0 0Suggs, Terrell 86 63 23 9.5 64.5 0 0 7 3 2Pryce, Trevor 73 49 24 13 113.5 0 0 3 2 0Reed, Ed 66 61 5 0 0 5 70 16 1 1Rolle, Samari 60 55 5 1 7 3 60 13 0 0McAlister, Chris 56 51 5 0 0 6 121 25 0 2Ngata, Haloti 51 28 23 1 3 1 60 3 0 0Johnson, Jarret 35 23 12 1.5 16.5 0 0 2 0 0Franklin, Aubrayo 23 13 10 0 0 0 0 1 0 0Bannan, Justin 20 13 7 0 0 0 0 0 1 0Ivy, Corey 17 14 3 2 13 1 0 6 2 0Edwards, Dwan 12 7 5 0 0 0 0 1 0 0Sapp, Gerome 12 10 2 0 0 0 1 2 1 0Haley, Dennis 11 6 5 0 0 0 0 2 0 0Oglesby, Evan 9 8 1 0 0 0 0 2 0 0Prude, Ronnie 4 4 0 0 0 2 66 5 0 0Stills, Gary 2 2 0 0 0 0 0 0 1 1Cody, Dan 1 0 1 0 0 0 0 0 0 0Martin, Derrick 1 1 0 0 0 0 0 0 0 0Smith, Mike 1 0 1 0 0 0 0 0 0 0Totals 1135 798 337 60 418 28 544 129 15 11
OFFENSE WR 89 Mark Clayton LT 75 Jonathan Ogden LG 60 Jason Brown C 62 Mike Flynn RG 68 Keydrick Vincent RT 79 Tony Pashos TE 86 Todd Heap WR 85 Derrick Mason QB 9 Steve McNair RB 31 Jamal Lewis FB 34 Ovie Mughelli
DEFENSE LDT 90 Trevor Pryce NT 97 Kelly Gregg RDT 92 Haloti Ngata LOLB 55 Terrell Suggs LILB 57 Bart Scott RILB 52 Ray Lewis ROLB 96 Adalius Thomas LCB 21 Chris McAlister RCB 22 Samari Rolle SS 26 Dawan Landry FS 20 Ed Reed
PLAYER TT SOLO AS FF FR BKStills, Gary 44 29 15 0 1 0 Wilcox, Daniel 20 13 7 0 0 0Oglesby, Evan 17 9 8 0 0 0Ivy, Corey 14 11 3 0 0 0Mughelli, Ovie 14 10 4 0 0 0Green, Justin 12 6 6 0 0 0Sapp, Gerome 10 7 3 0 0 0Haley, Dennis 9 3 6 0 0 0Johnson, Jarret 6 5 1 0 0 0Prude, Ronnie 6 5 1 0 0 0Smith, Mike 6 2 4 1 0 0Katula, Matt 5 1 4 0 0 0Johnson, Tim 4 4 0 0 0 0Landry, Dawan 4 3 1 0 0 0Martin, Derrick 4 3 1 0 0 0Smith, Musa 4 2 2 0 1 0Bannister, Alex 2 2 0 0 0 0Koch, Sam 2 2 0 0 0 0Sypniewski, Quinn 2 1 1 0 0 0Winborne, Jamaine 2 1 1 0 0 0Anderson, Mike 1 0 1 0 0 0Stover, Matt 1 1 0 0 0 0Thomas, Adalius 1 0 1 0 0 0Totals 190 120 70 1 2 0
Brian Billick, Head Coach; Rex Ryan, Defensive Coordinator; Frank
Gansz Jr, Special Teams Coordinator; Clarence Brooks, Defensive
Line; Mark Carrier, Secondary; Vic Fangio, Special Assistant; Jim
Fassel, Offensive Coordinator (games 1-4); John Fassel, Special
Teams Assistant; Jedd Fisch, Asst. Quarterbacks/Wide Receivers; Jeff
FitzGerald, Linebackers; Chris Foerster, Asst. Head Coach/Offensive
Line; Jeff Friday, Strength and Conditioning; Wade Harman, Tight
Ends/Asst. Offensive Line; Mike Johnson, Wide Receivers; Tony
Nathan, Running Backs; Rick Neuheisel, Quarterbacks; Mike Pettine,
Outside Linebackers; Paul Ricci, Asst. Strength and Conditioning; Greg
Roman, Asst. Offensive Line; Dennis Thurman, Secondary
SOLO SACKS FF FR PD 106 Ray Lewis 13 Trevor Pryce 3 Terrell Suggs 3 Kelly Gregg 25 Chris McAlister 93 Bart Scott 11 Adalius Thomas 2 Corey Ivy 2 Chris McAlister 16 Ed Reed 75 Adalius Thomas 9.5 2 Players 2 Trevor Pryce 2 Terrell Suggs 13 2 Players
Pro Bowl: LB Ray Lewis, CB Chris McAlister, QB Steve McNair; LT Jonathan Ogden (starter), S Ed Reed (starter), LB Bart Scott, LB Terrell Suggs, LB Adalius Thomas (starter)
NFL Alumni Association’s TE of the Year: Todd HeapPro Football Weekly Asst. Coach of the Year: Rex Ryan
USA Today’s All-Joe Team: NT Kelly Gregg, TE Todd Heap, FB Ovie Mughelli, DE Trevor Pryce, LB Bart Scott, K Matt StoverNFL Players of the Month/Week: LB Bart Scott (Sept.) - Defense, K Matt Stover (Sept.) - Special Teams, LB Ray Lewis (Week 1) - Defense,
CB Chris McAlister (Week 17) - Defense, DT Trevor Pryce (Week 10) - Special Teams, RB B.J. Sams (Week 11) - Special Teams Ed Block Courage Award: CB Corey Ivy
Ravens Roost Unsung Hero: CB Corey IvyRavens Roost Extra Effort: TE Daniel Wilcox
Ravens Nest Player of the Year: NT Kelly Gregg
TOP THREE
COACHES
RAVENS HONOR ROLL
USUAL STARTERS
DEFENSIVE SPECIAL TEAMS
SEASON TRENDS
FROM COACHES VIDEO FROM COACHES VIDEO

2019 BALTIMORE RAVENS MEDIA GUIDE374
2006 POSTSEASON STATISTICS
ORGANIZ
ATIO
N P
LAYERS 20
10 R
EVIE
W H
ISTORY R
ECORDS G
AM
E D
AY
354 BALTIMORE RAVENS FAN & MEDIA GUIDE 2011
2006 POSTSEASON STATISTICS
RESULTS AND ATTENDANCEWON 0, LOST 101/13 L 6-15 Indianapolis 71,162
TEAM STATISTICS RAVENS OPPONENTTOTAL FIRST DOWNS 13 15 Rushing 5 6 Passing 6 9 Penalty 2 0 3rd Down: Made/Att 2/11 8/19 3rd Down Pct. 18.2 42.1 4th Down: Made/Att 0/0 0/0 4th Down Pct. 0.0 0.0POSSESSION AVG. 28:36 31:24TOTAL NET YARDS 244 261 Avg. Per Game 244.0 261.0 Total Plays 51 66 Avg. Per Play 4.8 4.0NET YARDS RUSHING 83 100 Avg. Per Game 83.0 100.0 Total Rushes 20 35NET YARDS PASSING 161 161 Avg. Per Game 161.0 161.0 Sacked/Yards Lost 2/12 1/9 Gross Yards 173 170 Att./Completions 29/18 30/15 Completion Pct. 62.1 50.0 Had Intercepted 2 2PUNTS/AVERAGE 5/38.0 4/45.0NET PUNTING AVG. 5/27.4 4/32.5PENALTIES/YARDS 6/39 3/19FUMBLES/BALL LOST 2/2 3/0TOUCHDOWNS 0 0 Rushing 0 0 Passing 0 0 Returns 0 0
SCORE BY PERIODS 1 2 3 4 OT PTSRAVENS 0 3 0 3 0 6Opponents 6 3 3 3 0 15
SCORING TD RU PA RT K/PAT FG S PTSStover 0 0 0 0 0/0 2/2 0 6 RAVENS 0 0 0 0 0/0 2/2 0 6Opponents 0 0 0 0 0/0 5/5 0 15
2-PT. CONVERSIONS: RAVENS 0-0; Opponents 0-0
SACKS: Gregg 0.5, Thomas 0.5 RAVENS 1.0; Opponents 2.0
RUSHING NO YDS AVG LG TDJ. Lewis 13 53 4.1 18 0Anderson 4 18 4.5 8 0McNair 1 6 6.0 6 0Mughelli 2 6 3.0 3 0RAVENS 20 83 4.2 18 0Opponents 35 100 2.9 25 0
RECEIVING NO YDS AVG LG TDClayton 6 73 12.2 21 0Heap 3 28 9.3 23 0J. Lewis 3 24 8.0 13 0Mason 2 16 8.0 9 0Mughelli 2 11 5.5 9 0Wilcox 1 15 15.0 15 0Anderson 1 6 6.0 6 0RAVENS 18 173 9.6 23 0Opponents 15 170 11.3 27 0
INTERCEPTIONS NO YDS AVG LG TDReed 2 0 0.0 0 0RAVENS 2 0 0.0 0 0Opponents 2 9 4.5 9 0
PUNTING NO YDS AVG NET TB IN LG BLKKoch 5 190 38.0 27.4 1 1 47 0RAVENS 5 190 38.0 27.4 1 1 47 0Opponents 4 180 45.0 32.5 1 1 51 0
PUNT RETURNS RET FC YDS AVG LG TDRoss 2 0 30 15.0 18 0RAVENS 2 0 30 15.0 18 0Opponents 3 1 33 11.0 21 0
KICKOFF RETURNS NO YDS AVG LG TDRoss 6 124 20.7 27 0RAVENS 6 124 20.7 27 0Opponents 3 48 16.0 18 0
FIELD GOALS 1-19 20-29 30-39 40-49 50+Stover 0/0 0/0 0/0 1/1 1/1RAVENS 0/0 0/0 0/0 1/1 1/1Opponents 0/0 1/1 1/1 2/2 1/1
Stover: (40G,51G)Opponents: (23G,42G,51G,48G,35G)
PASSING ATT COMP YARDS COMP% YDS/ATT TD TD% INT INT% LG SACK/LOST RATINGMcNair 29 18 173 62.1 5.97 0 0.0 2 6.9 23 2/12 49.9RAVENS 29 18 173 62.1 5.97 0 0.0 2 6.9 23 2/12 49.9Opponents 30 15 170 50.0 5.67 0 0.0 2 6.7 27 1/9 39.6
PLAYER TT SOLO AS SACKS LOST INT YDS PD FF FR
Lewis, Ray 23 13 10 0 0 0 0 3 0 0
Scott, Bart 12 5 7 0 0 0 0 0 0 0
Suggs, Terrell 10 9 1 0 0 0 0 0 1 0
Pryce, Trevor 8 3 5 0 0 0 0 0 0 0
Thomas, Adalius 8 5 3 0 0 0 0 0 0 0
Gregg, Kelly 7 5 2 1 9 0 0 0 0 0
Ngata, Haloti 7 3 4 0 0 0 0 0 0 0
Rolle, Samari 4 3 1 0 0 0 0 1 0 0
McAlister, Chris 3 3 0 0 0 0 0 1 0 0
Ivy, Corey 2 2 0 0 0 0 0 0 0 0
Johnson, Jarret 2 2 0 0 0 0 0 0 0 0
Reed, Ed 2 2 0 0 0 2 0 3 0 0
Franklin, Aubrayo 1 0 1 0 0 0 0 0 0 0
Landry, Dawan 1 0 1 0 0 0 0 0 0 0
Totals 90 55 35 1 9 2 0 8 1 0
PLAYER TT SOLO AS FF FR BK
Haley, Dennis 1 1 0 0 0 0
Johnson, Tim 1 1 0 0 0 0
Katula, Matt 1 1 0 0 0 0
Landry, Dawan 1 1 0 0 0 0
Oglesby, Evan 1 1 0 0 0 0
Sapp, Gerome 1 1 0 0 0 0
Totals 6 6 0 0 0 0
DEFENSIVE SPECIAL TEAMSFROM COACHES VIDEO FROM COACHES VIDEO

BALTIMORERAVENS.COM 375
2007 STATISTICS
GAM
E D
AY
RECORDS
HIS
TORY
2010
REVIE
W
PLAYERS
ORGANIZ
ATIO
N
355BALTIMORERAVENS.COM
2007 STATISTICS
RESULTS AND ATTENDANCE WON 5, LOST 119/10 L 20-27 at Cincinnati 66,0939/16 W 20-13 New York Jets 71,2469/23 W 26-23 Arizona 71,3729/30 L 13-27 at Cleveland 73,02410/07 W 9-7 at San Francisco 67,88510/14 W 22-3 St. Louis 71,17510/21 L 14-19 at Buffalo 70,72711/05 L 7-38 at Pittsburgh 63,45711/11 L 7-21 Cincinnati 71,13011/18 L 30-33 (OT) Cleveland 71,05511/25 L 14-32 at San Diego 63,33712/03 L 24-27 New England 71,38212/09 L 20-44 Indianapolis 70,51312/16 L 16-22 (OT) at Miami 70,28712/23 L 6-27 at Seattle 68,16412/30 W 27-21 Pittsburgh 71,353
TEAM STATISTICS RAVENS OPPONENTTOTAL FIRST DOWNS 291 258 Rushing 96 69 Passing 175 162 Penalty 20 27 3rd Down: Made/Att 90/234 82/224 3rd Down Pct. 38.5 36.6 4th Down: Made/Att 11/21 7/13 4th Down Pct. 52.4 53.8POSSESSION AVG. 30:46 29:14TOTAL NET YARDS 4832 4825 Avg. Per Game 302.0 301.6 Total Plays 1042 968 Avg. Per Play 4.6 5.0NET YARDS RUSHING 1797 1268 Avg. Per Game 112.3 79.3 Total Rushes 446 446NET YARDS PASSING 3035 3557 Avg. Per Game 189.7 222.3 Sacked/Yards Lost 39/273 32/183 Gross Yards 3308 3740 Att./Completions 557/341 490/293 Completion Pct. 61.2 59.8 Had Intercepted 14 17PUNTS/AVERAGE 79/43.0 76/43.1NET PUNTING AVG. 79/36.0 76/37.4PENALTIES/YARDS 107/873 84/728FUMBLES/BALL LOST 35/26 12/6TOUCHDOWNS 28 39 Rushing 11 9 Passing 13 27 Returns 4 3
SCORE BY PERIODS 1 2 3 4 OT PTSRAVENS 33 110 44 88 0 275Opponents 69 136 87 83 9 384
SCORING TD RU PA RT K/PAT FG S PTSStover 0 0 0 0 26/26 27/32 0 107 McGahee 8 7 1 0 0 48 Mason 5 0 5 0 0 30 Darling 3 0 3 0 0 18 Figurs 2 0 0 2 0 12 Mu. Smith 2 2 0 0 0 12 Heap 1 0 1 0 0 6 Lewis 1 0 0 1 0 6 McClain 1 0 1 0 0 6Reed 1 0 0 1 0 6 Ross 1 1 0 0 0 6 T. Smith 1 1 0 0 0 6 Sypniewski 1 0 1 0 0 6 Wilcox 1 0 1 0 0 6RAVENS 8 11 13 4 26/26 27/32 0 275 Opponents 39 9 27 3 35/36 37/43 1 384
2-PT. CONVERSIONS: RAVENS 0-2, Opponents 1-2
SACKS: Suggs 5, Gregg 3, Ivy 3, Ngata 3, Bannan 2, Barnes 2, Johnson 2, Lewis 2, Pryce 2, Sapp 2, Edwards 1, Jones 1, Landry 1, Scott 1, Stills 1, (group) 1, RAVENS 32, Opponents 39
FUM/LOST: McNair 8/7, Boller 5/4, Figurs 4/1, McGahee 4/3, T. Smith 3/2, Anderson 2/2, Reed 2/2, Ross 2/2, Mason 1/1, McClain 1/1, Pittman 1/0, Mu. Smith 1/0, Sypniewski 1/1
RUSHING NO YDS AVG LG TDMcGahee 294 1207 4.1 46t 7Mu. Smith 75 264 3.5 24 2Boller 19 89 4.7 15 0Ross 12 72 6.0 32t 1Anderson 15 62 4.1 16 0T. Smith 12 54 4.5 14 1McNair 10 32 3.2 13 0McClain 8 18 2.3 4 0Figurs 1 -1 -1.0 -1 0RAVENS 446 1797 4.0 46t 11Opponents 446 1268 2.8 36 9
RECEIVING NO YDS AVG LG TDMason 103 1087 10.6 79t 5Clayton 48 531 11.1 52 0McGahee 43 231 5.4 30 1Sypniewski 34 246 7.2 13 1Mu. Smith 27 192 7.1 29 0Heap 23 239 10.4 37 1Williams 20 290 14.5 34 0Darling 18 326 18.1 53 3McClain 9 55 6.1 13t 1Wilcox 6 18 3.0 7 1Anderson 4 26 6.5 10 0Green 2 16 8.0 10 0Vickers 2 4 2.0 5 0Figurs 1 36 36.0 36 0Willis 1 11 11.0 11 0RAVENS 341 3308 9.7 79t 13Opponents 293 3740 12.8 78t 27
INTERCEPTIONS NO YDS AVG LG TDReed 7 130 18.6 32 0Lewis 2 35 17.5 35t 1Pittman 2 21 10.5 29 0Martin 2 3 1.5 3 0Ivy 1 22 22.0 22 0Edwards 1 1 1.0 1 0McAlister 1 0 0.0 0 0Rolle 1 0 0.0 0 0RAVENS 17 212 12.5 35t 1Opponents 14 293 20.9 100t 1
PUNTING NO YDS AVG NET TB IN LG BLKKoch 78 3397 43.6 36.0 9 20 64 1RAVENS 79 3397 43.0 36.0 9 20 64 1Opponents 76 3277 43.1 37.4 5 26 74 0
PUNT RETURNS RET FC YDS AVG LG TDFigurs 16 9 171 10.7 75t 1Reed 10 3 94 9.4 63t 1Ross 5 0 36 7.2 15 0Sams 4 0 37 9.3 16 0RAVENS 35 12 338 9.7 75t 2Opponents 38 16 375 9.9 49 0
KICKOFF RETURNS NO YDS AVG LG TDFigurs 46 1138 24.7 94t 1Ross 9 148 16.4 25 0Sams 5 140 28.0 47 0Mu. Smith 3 89 29.7 52 0Anderson 2 10 5.0 10 0RAVENS 65 1525 23.5 94t 1Opponents 61 1444 23.7 50 0
FIELD GOALS 1-19 20-29 30-39 40-49 50+Stover 1/1 11/11 7/7 8/12 0/1RAVENS 1/1 11/11 7/7 8/12 0/1Opponents 1/1 14/14 10/12 10/11 2/5
Stover: (36G,23G)(28G,46N,43G)(21G,28G,43G,46G)(46N,21G, 29G,41N)(26G,32G,49G)(43G,42G,23G,31G,36G)()()()(34G,41G,47G)()(29G)()(27G,39G,50B,18G,44N)()(28G,31G)Opponents: (53N,23G,40G)(50G,52N,21G)(48G,47N,40G,41G)(41G,20G)(52N)(35N,32G)(29G,26G,35G,41G)(22G)(34G,19G,22G,35G,35G,21G,33G)(35N,28G,39G,51G,33G)(27G,46G,41G,41G)(21G,38G)()(23G,22G,29G)(42G,39G)()
PASSING ATT COMP YARDS COMP% YDS/ATT TD TD% INT INT% LG SACK/LOST RATINGBoller 275 168 1743 61.1 6.34 9 3.3 10 3.6 53 24/159 75.2McNair 205 133 1113 64.9 5.43 2 1.0 4 2.0 30 11/85 73.9T. Smith 76 40 452 52.6 5.95 2 2.6 0 0.0 79t 4/29 79.5Clayton 1 0 0 0.0 0.00 0 0.0 0 0.0 0 0/0 39.6RAVENS 557 341 3308 61.2 5.94 13 2.3 14 2.5 79t 39/273 75.2Opponents 490 293 3740 59.8 7.63 27 5.5 17 3.5 78t 32/183 87.6

2019 BALTIMORE RAVENS MEDIA GUIDE376
2007 STATISTICS
ORGANIZ
ATIO
N P
LAYERS 20
10 R
EVIE
W H
ISTORY R
ECORDS G
AM
E D
AY
356 BALTIMORE RAVENS FAN & MEDIA GUIDE 2011
Record . . . . . . . . . . . . . . . . . . . . . . . . . . . . . . . . . . . . . . . . . . . . . . 5-11vs. AFC North . . . . . . . . . . . . . . . . . . . . . . . . . . . . . . . . . . . . . . . . . 1-5vs. AFC . . . . . . . . . . . . . . . . . . . . . . . . . . . . . . . . . . . . . . . . . . . . . 2-10vs. NFC . . . . . . . . . . . . . . . . . . . . . . . . . . . . . . . . . . . . . . . . . . . . . . 3-1Home . . . . . . . . . . . . . . . . . . . . . . . . . . . . . . . . . . . . . . . . . . . . . . . . 4-4Away . . . . . . . . . . . . . . . . . . . . . . . . . . . . . . . . . . . . . . . . . . . . . . . . 1-7On Grass . . . . . . . . . . . . . . . . . . . . . . . . . . . . . . . . . . . . . . . . . . . . . 1-4On Artificial Turf . . . . . . . . . . . . . . . . . . . . . . . . . . . . . . . . . . . . . . . . 4-7Outdoors . . . . . . . . . . . . . . . . . . . . . . . . . . . . . . . . . . . . . . . . . . . . 5-11Indoors . . . . . . . . . . . . . . . . . . . . . . . . . . . . . . . . . . . . . . . . . . . . . . . 0-0Leading at Halftime . . . . . . . . . . . . . . . . . . . . . . . . . . . . . . . . . . . . . 5-1Trailing at Halftime . . . . . . . . . . . . . . . . . . . . . . . . . . . . . . . . . . . . . . 0-9Tied at Halftime . . . . . . . . . . . . . . . . . . . . . . . . . . . . . . . . . . . . . . . . 0-1Leading After 3 Quarters . . . . . . . . . . . . . . . . . . . . . . . . . . . . . . . . . 5-1Tied After 3 Quarters . . . . . . . . . . . . . . . . . . . . . . . . . . . . . . . . . . . . 0-1Trailing After 3 Quarters . . . . . . . . . . . . . . . . . . . . . . . . . . . . . . . . . . 0-9Winning Coin Toss . . . . . . . . . . . . . . . . . . . . . . . . . . . . . . . . . . . . . . 4-3Losing Coin Toss . . . . . . . . . . . . . . . . . . . . . . . . . . . . . . . . . . . . . . . 1-8Decided by 7 Points or Less . . . . . . . . . . . . . . . . . . . . . . . . . . . . . . 4-5Decided By 3 Points or Less . . . . . . . . . . . . . . . . . . . . . . . . . . . . . . 2-2
When Scoring First . . . . . . . . . . . . . . . . . . . . . . . . . . . . . . . . . . . . . 5-1When Not Scoring First . . . . . . . . . . . . . . . . . . . . . . . . . . . . . . . . . 0-10Positive or Even Turnover Ratio . . . . . . . . . . . . . . . . . . . . . . . . . . . . 5-1Negative Turnover Ratio . . . . . . . . . . . . . . . . . . . . . . . . . . . . . . . . 0-10Winning or Even Penalty Ratio . . . . . . . . . . . . . . . . . . . . . . . . . . . . 3-5Losing Penalty Ratio . . . . . . . . . . . . . . . . . . . . . . . . . . . . . . . . . . . . 2-6With a 100-Yard Rusher . . . . . . . . . . . . . . . . . . . . . . . . . . . . . . . . . . 0-5With a 100-Yard Receiver . . . . . . . . . . . . . . . . . . . . . . . . . . . . . . . . 0-2Without a 100-Yard Rusher . . . . . . . . . . . . . . . . . . . . . . . . . . . . . . . 5-6Without a 100-Yard Receiver . . . . . . . . . . . . . . . . . . . . . . . . . . . . . . 5-9When Allowing a 100-Yard Rusher . . . . . . . . . . . . . . . . . . . . . . . . . . 0-0When Not Allowing a 100-Yard Rusher. . . . . . . . . . . . . . . . . . . . . . 5-11When Allowing a 100-Yard Receiver . . . . . . . . . . . . . . . . . . . . . . . . . 2-4When Not Allowing a 100-Yard Receiver . . . . . . . . . . . . . . . . . . . . . 3-7With a 300-Yard Passer . . . . . . . . . . . . . . . . . . . . . . . . . . . . . . . . . . 0-1Without a 300-Yard Passer . . . . . . . . . . . . . . . . . . . . . . . . . . . . . . 5-10Allowing a 300-Yard (net) Passer . . . . . . . . . . . . . . . . . . . . . . . . . . . 0-1Not Allowing a 300-Yard (net) Passer . . . . . . . . . . . . . . . . . . . . . . 5-10Overtime . . . . . . . . . . . . . . . . . . . . . . . . . . . . . . . . . . . . . . . . . . . . . 0-2Preseason . . . . . . . . . . . . . . . . . . . . . . . . . . . . . . . . . . . . . . . . . . . . 1-3
OFFENSE WR 89 Mark Clayton LT 75 Jonathan Ogden LG 60 Jason Brown C 62 Mike Flynn RG 66 Ben Grubbs RT 73 Marshal Yanda TE 88 Quinn Sypniewski WR 85 Derrick Mason QB 9 Steve McNair 7 Kyle Boller RB 23 Willis McGahee FB 39 Le’Ron McClain
DEFENSE LDT 93 Dwan Edwards NT 97 Kelly Gregg RDT 92 Haloti Ngata LOLB 95 Jarret Johnson LILB 52 Ray Lewis RILB 57 Bart Scott ROLB 55 Terrell Suggs LCB 21 Chris McAlister RCB 35 Corey Ivy SS 26 Dawan Landry FS 20 Ed Reed
PLAYER TT SOLO AS FF FR BKStills, Gary 26 25 1 1 0 0Winborne, Jamaine 21 21 0 0 0 0Green, Justin 19 18 1 0 0 0Martin, Derrick 17 17 0 0 1 0Greisen, Nick 13 13 0 0 0 0McClain, Le’Ron 12 12 0 0 0 0Prude, Ronnie 8 8 0 0 0 0Barnes, Antwan 8 7 1 1 0 0Burgess, Prescott 7 7 0 0 0 0Katula, Matt 7 7 0 0 0 0Smith, Musa 7 7 0 0 0 0Sapp, Gerome 5 5 0 0 0 0Wilcox, Daniel 5 5 0 0 0 0Landry, Dawan 5 5 0 0 0 0Anderson, Mike 4 3 1 0 0 0McCune, Robert 3 2 1 0 0 0Darling, Devard 2 2 0 0 1 0Haley, Dennis 2 2 0 0 0 0Ivy, Corey 2 2 0 0 0 0Jones, Edgar 2 2 0 0 0 0Willis, Matt 2 2 0 0 0 0Gaston, Willie 1 1 0 0 0 0Koch, Sam 1 1 0 0 0 0Edwards, Dwan 0 0 0 0 0 1Totals 179 174 5 2 2 1
Brian Billick, Head Coach; Rick Neuheisel, Offensive Coordinator/
Quarterbacks; Rex Ryan, Defensive Coordinator; Frank Gansz Jr.,
Special Teams Coordinator; Clarence Brooks, Defensive Line; Mark
Carrier, Secondary; Vic Fangio, Special Assistant to the Head Coach/
Defense; John Fassel, Special Teams Assistant; Jedd Fisch, Asst.
Quarterbacks; Jeff FitzGerald, Linebackers; Chris Foerster, Asst.
Head Coach/Offensive Line; Jeff Friday, Strength and Conditioning;
Wade Harman, Tight Ends/Asst. Offensive Line; Mike Johnson, Wide
Receivers; Tony Nathan, Running Backs; Mike Pettine, Outside
Linebackers; Paul Ricci, Asst. Strength and Conditioning; Greg Roman,
Asst. Offensive Line; Dennis Thurman, Secondary
SOLO SACKS FF FR PD 108 Ray Lewis 5 Terrell Suggs 2 Jarret Johnson 1 5 Players 16 Corey Ivy 84 Bart Scott 3 3 Players 2 Ray Lewis 13 Ed Reed 78 Kelly Gregg 2 6 Players 1 4 Players 10 2 Players
Pro Bowl: LB Ray Lewis, RB Willis McGahee, LT Jonathan Ogden, S Ed Reed (starter)Pro Bowl (1st Alternate): LB Terrell Suggs, ST Gary Stills
Pro Football Weekly’s All-Rookie Team: G Ben Grubbs, RS Yamon FigursUSA Today’s All-Joe Team: NT Kelly Gregg, DT Haloti Ngata
NFL Players of the Week: K Matt Stover (Week 6) - Special Teams, RS Yamon Figurs (Week 3) - Special Teams Ed Block Courage Award: CB Samari Rolle
Ravens Roost Unsung Hero: NT Kelly GreggRavens Roost Extra Effort: G Ben Grubbs
Ravens Nest Player of the Year: LB Jarret Johnson
PLAYER TT SOLO AS SACKS YDS INT YDS PD FF FRLewis, Ray 184 108 76 2 7 2 35 10 2 1Scott, Bart 131 84 47 1 2 0 0 3 0 0Gregg, Kelly 111 78 33 3 15 0 0 4 0 1Suggs, Terrell 95 51 44 5 34 0 0 7 1 0Johnson, Jarret 94 59 35 2 19 0 0 2 2 0Ngata, Haloti 94 58 36 3 14 0 0 2 1 0Landry, Dawan 91 73 18 1 9 0 0 7 0 0Ivy, Corey 63 55 8 3 21 1 22 16 1 1Edwards, Dwan 58 30 28 1 8 1 1 1 0 0Reed, Ed 45 36 9 0 0 7 130 13 0 1Greisen, Nick 38 22 16 0 0 0 0 0 0 1Bannan, Justin 37 19 18 2 4 0 0 0 1 0Martin, Derrick 26 23 3 0 0 2 3 8 0 0Rolle, Samari 25 23 2 0 0 1 0 5 0 0McAlister, Chris 23 19 4 0 0 1 0 10 0 0Pryce, Trevor 19 9 10 2 8 0 0 0 0 0Pittman, David 10 8 2 0 0 2 21 4 0 0Gaston, Willie 9 8 1 0 0 0 0 1 0 0Sapp, Gerome 9 8 1 2 15 0 0 0 0 0Barnes, Antwan 8 4 4 2 20 0 0 0 0 0Prude, Ronnie 6 6 0 0 0 0 0 3 0 0Winborne, Jamaine 6 5 1 0 0 0 0 3 0 0Jones, Edgar 5 2 3 1 0 0 0 0 0 0Gordon, Amon 3 2 1 0 0 0 0 0 0 0Stills, Gary 3 1 2 1 5 0 0 0 0 0Totals 1193 791 402 32* 181 17 212 99 8 5*Includes a team sack
TOP THREE
COACHES
RAVENS HONOR ROLL
USUAL STARTERS
DEFENSIVE SPECIAL TEAMS
SEASON TRENDS
FROM COACHES VIDEOFROM COACHES VIDEO

BALTIMORERAVENS.COM 377
2008 STATISTICS
GAM
E D
AY
RECORDS
HIS
TORY
2010
REVIE
W
PLAYERS
ORGANIZ
ATIO
N
357BALTIMORERAVENS.COM
RESULTS AND ATTENDANCEWON 11, LOST 5WILD CARD/AFC CHAMPIONSHIP GAME09/07 W 17-10 Cincinnati 70,97809/21 W 28-10 Cleveland 71,10409/29 L 20-23 OT at Pittsburgh 64,03810/05 L 10-13 Tennessee 71,13110/12 L 3-31 at Indianapolis 66,15310/19 W 27-13 at Miami 64,97210/26 W 29-10 Oakland 71,25411/02 W 37-27 at Cleveland 73,07811/09 W 41-13 at Houston 70,55211/16 L 10-30 at New York Giants 78,84911/23 W 36-7 Philadelphia 71,37911/30 W 34-3 at Cincinnati 63,87112/07 W 24-10 Washington 71,43812/14 L 9-13 Pittsburgh 71,50212/20 W 33-24 at Dallas 63,80012/28 W 27-7 Jacksonville 71,366
TEAM STATISTICS RAVENS OPPONENTTOTAL FIRST DOWNS 300 228 Rushing 132 58 Passing 147 152 Penalty 21 18 3rd Down: Made/Att 95/232 71/212 3rd Down Pct. 40.9 33.5 4th Down: Made/Att 7/11 3/16 4th Down Pct. 63.6 18.8POSSESSION AVG. 33:10 26:50TOTAL NET YARDS 5184 4177 Avg. Per Game 324.0 261.1 Total Plays 1058 928 Avg. Per Play 4.9 4.5NET YARDS RUSHING 2376 1302 Avg. Per Game 148.5 81.4 Total Rushes 592 366NET YARDS PASSING 2808 2875 Avg. Per Game 175.5 179.7 Sacked/Yards Lost 33/277 34/257 Gross Yards 3085 3132 Att./Completions 433/261 528/276 Completion Pct. 60.3 52.3 Had Intercepted 12 26PUNTS/AVERAGE 84/45.0 92/42.8NET PUNTING AVG. 84/39.9 92/37.0PENALTIES/YARDS 103/785 114/792FUMBLES/BALL LOST 28/9 21/8TOUCHDOWNS 42 26 Rushing 20 4 Passing 16 17 Returns 6 5
SCORE BY PERIODS 1 2 3 4 OT PTSRAVENS 58 115 97 115 0 385Opponents 57 58 66 60 3 244
SCORING TD RU PA RT K/PAT FG S PTSStover 0 0 0 0 41/41 27/33 0 122L. McClain 11 10 1 0 0 66McGahee 7 7 0 0 0 42D. Mason 5 0 5 0 0 32Clayton 4 1 3 0 0 24Heap 3 0 3 0 0 18Reed 3 0 0 3 0 18Flacco 2 2 0 0 0 12Suggs 2 0 0 2 0 12Wilcox 2 0 2 0 0 12Figurs 1 0 1 0 0 6Leonhard 1 0 0 1 0 6D. Williams 1 0 1 0 0 6J. McClain 0 0 0 0 2 4Hauschka 0 0 0 0 0/0 1/2 0 3RAVENS 42 20 16 6 41/41 28/35 3 385Opponents 26 4 17 5 25/25 21/22 0 244
2-PT. CONVERSIONS: D. Mason, RAVENS 1-1, Opponents 0-1
SACKS: Suggs 8, J. Johnson 5, Pryce 4.5, Lewis 3.5, Ivy 2.5, J. McClain 2.5, Scott 1.5, Ayanbadejo 1, Bannan 1, Leonhard 1, Ngata 1, Reed 1, (group) 1, Jones 0.5, RAVENS 34, Opponents 33
FUM/LOST: Flacco 11/2, L. McClain 4/1, Figurs 3/0, McGahee 3/3, D. Mason 2/1, Brown 1/0, Heap 1/1, Leonhard 1/0, Reed 1/0, Rice 1/1
RUSHING NO YDS AVG LG TDL. McClain 232 902 3.9 82t 10McGahee 170 671 3.9 77t 7Rice 107 454 4.2 60 0Flacco 52 180 3.5 38t 2Clayton 6 81 13.5 42t 1Parmele 2 27 13.5 31 0Neal 12 25 2.1 5 0T. Smith 9 24 2.7 8 0Koch 1 9 9.0 9 0D. Mason 1 3 3.0 3 0RAVENS 592 2376 4.0 82t 20Opponents 366 1302 3.6 77 4
RECEIVING NO YDS AVG LG TDD. Mason 80 1037 13.0 54 5Clayton 41 695 17.0 70t 3Heap 35 403 11.5 30 3Rice 33 273 8.3 40 0McGahee 24 173 7.2 35 0L. McClain 19 123 6.5 25 1D. Williams 13 180 13.8 70t 1Neal 7 35 5.0 13 0Wilcox 5 19 3.8 8 2Figurs 1 43 43.0 43t 1Flacco 1 43 43.0 43 0T. Smith 1 36 36.0 36 0Jones 1 25 25.0 25 0RAVENS 261 3085 11.8 70t 16Opponents 276 3132 11.3 67t 17
INTERCEPTIONS NO YDS AVG LG TDReed 9 264 29.3 107t 2Lewis 3 43 14.3 29 0McAlister 3 28 9.3 16 0Rolle 3 5 1.7 3 0Suggs 2 86 43.0 44t 2Ngata 2 8 4.0 7 0Leonhard 1 35 35.0 35t 1Washington 1 12 12.0 12 0Walker 1 0 0.0 0 0Bannan 1 -4 -4.0 -4 0RAVENS 26 477 18.3 107t 5Opponents 12 104 8.7 50t 1
PUNTING NO YDS AVG NET TB IN LG BLKKoch 84 3777 45.0 39.9 9 34 74 0RAVENS 84 3777 45.0 39.9 9 34 74 0Opponents 92 3938 42.8 37.0 8 21 59 1
PUNT RETURNS RET FC YDS AVG LG TDFigurs 23 11 138 6.0 35 0Leonhard 20 9 232 11.6 46 0Reed 1 0 8 8.0 8 0RAVENS 44 20 378 8.6 46 0Opponents 38 12 245 6.4 33 0
KICKOFF RETURNS NO YDS AVG LG TDFigurs 29 608 21.0 39 0Leonhard 8 163 20.4 30 0Rice 7 161 23.0 30 0Copper 2 35 17.5 18 0Zbikowski 2 48 24.0 26 0Clayton 1 12 12.0 12 0J. Johnson 1 13 13.0 13 0Jones 1 0 0.0 0 0Neal 1 2 2.0 2 0RAVENS 50 1007 20.1 39 0Opponents 76 1720 22.6 100t 2
FIELD GOALS 1-19 20-29 30-39 40-49 50+Stover 0/0 11/11 11/12 5/9 0/1Hauschka 0/0 0/0 0/0 0/0 1/2RAVENS 0/0 11/11 11/12 5/9 1/3Opponents 2/2 7/7 6/6 5/6 1/1
Stover: (47N,21G)(48N)(33G,20G)(38G,45N)(37G)(47G,28G)(38G,30G)(41G,32G,22G)(50N)(32B,38G)(44G,42G)(27G,21G)(32G)(28G,26G,28G)(26G,29G,37G,35G)(32G,48N,41G)
Hauschka: ()()()()()()()()(54G)()(53N)()()()()()
Opponents: (43G)(38G)(49G,19G,46G)(35G,26G)(37G)(21G,26G)(22G)(23G,54G)(23G,48G)(19G)()(21G)(48N,43G)(31G,30G)(35G)()
2008 STATISTICS
PASSING ATT COMP YARDS COMP% YDS/ATT TD TD% INT INT% LG SACK/LOST RATINGFlacco 428 257 2971 60.0 6.94 14 3.3 12 2.8 70t 32/276 80.3T. Smith 4 3 82 75.0 20.50 1 25.0 0 0.0 43 1/1 156.3Clayton 1 1 32 100.0 32.00 1 100.0 0 0.0 32t 0/0 158.3RAVENS 433 261 3085 60.3 7.12 16 3.7 12 2.8 70t 33/277 82.8Opponents 528 276 3132 52.3 5.93 17 3.2 26 4.9 67t 34/257 60.6

2019 BALTIMORE RAVENS MEDIA GUIDE378
2008 STATISTICS
ORGANIZ
ATIO
N P
LAYERS 20
10 R
EVIE
W H
ISTORY R
ECORDS G
AM
E D
AY
358 BALTIMORE RAVENS FAN & MEDIA GUIDE 2011
Reg. Post.Record . . . . . . . . . . . . . . . . . . . . . . . . . . . . . . . . . . . . . 11-5 . . . . . . 2-1vs. AFC North . . . . . . . . . . . . . . . . . . . . . . . . . . . . . . . . 4-2 . . . . . . 0-1vs. AFC . . . . . . . . . . . . . . . . . . . . . . . . . . . . . . . . . . . . . 8-4 . . . . . . 2-1vs. NFC. . . . . . . . . . . . . . . . . . . . . . . . . . . . . . . . . . . . . . 3-1 . . . . . . 0-0Home . . . . . . . . . . . . . . . . . . . . . . . . . . . . . . . . . . . . . . . 6-2 . . . . . . 0-0Away . . . . . . . . . . . . . . . . . . . . . . . . . . . . . . . . . . . . . . . . 5-3 . . . . . . 2-1On Grass . . . . . . . . . . . . . . . . . . . . . . . . . . . . . . . . . . . . 3-1 . . . . . . 2-1Artificial Turf . . . . . . . . . . . . . . . . . . . . . . . . . . . . . . . . . . 8-4 . . . . . . 0-0Outdoors. . . . . . . . . . . . . . . . . . . . . . . . . . . . . . . . . . . . . 9-4 . . . . . . 2-1Indoors . . . . . . . . . . . . . . . . . . . . . . . . . . . . . . . . . . . . . . 2-1 . . . . . . 0-0Leading at Halftime. . . . . . . . . . . . . . . . . . . . . . . . . . . . . 9-2 . . . . . . 1-0Trailing at Halftime . . . . . . . . . . . . . . . . . . . . . . . . . . . . . 1-2 . . . . . . 0-1Tied at Halftime. . . . . . . . . . . . . . . . . . . . . . . . . . . . . . . . 1-1 . . . . . . 1-0Tied After 3 Quarters . . . . . . . . . . . . . . . . . . . . . . . . . . . 0-0 . . . . . . 1-0Leading After 3 Quarters. . . . . . . . . . . . . . . . . . . . . . . . 10-2 . . . . . . 1-0Trailing After 3 Quarters . . . . . . . . . . . . . . . . . . . . . . . . . 1-3 . . . . . . 0-1Winning Coin Toss . . . . . . . . . . . . . . . . . . . . . . . . . . . . . 1-3 . . . . . . 0-1Losing Coin Toss . . . . . . . . . . . . . . . . . . . . . . . . . . . . . 10-2 . . . . . . 2-0Decided by 7 Points or less . . . . . . . . . . . . . . . . . . . . . . 1-3 . . . . . . 1-0Decided by 3 Points or less . . . . . . . . . . . . . . . . . . . . . . 0-2 . . . . . . 1-0
Reg. Post.When Scoring First . . . . . . . . . . . . . . . . . . . . . . . . . . . . . 8-2 . . . . . . 0-0When Not Scoring First. . . . . . . . . . . . . . . . . . . . . . . . . . 3-3 . . . . . . 2-1Positive Turnover Ratio . . . . . . . . . . . . . . . . . . . . . . . . . 11-3 . . . . . . 2-0Negative Turnover Ratio . . . . . . . . . . . . . . . . . . . . . . . . . 0-2 . . . . . . 0-1Winning Penalty Ratio . . . . . . . . . . . . . . . . . . . . . . . . . . 8-2 . . . . . . 1-0Losing Penalty Ratio. . . . . . . . . . . . . . . . . . . . . . . . . . . . 3-3 . . . . . . 1-0Overtime. . . . . . . . . . . . . . . . . . . . . . . . . . . . . . . . . . . . . 0-1 . . . . . . 0-0Preseason. . . . . . . . . . . . . . . . . . . . . . . . . . . . . . . . . . . . 1-3 . . . . . .N/AWith a 100-Yard Rusher . . . . . . . . . . . . . . . . . . . . . . . . . 4-0 . . . . . . 0-0With a 100-Yard Receiver . . . . . . . . . . . . . . . . . . . . . . . . 3-1 . . . . . . 0-0Without a 100-yard Rusher . . . . . . . . . . . . . . . . . . . . . . . 7-5 . . . . . . 2-1Without a 100-yard Receiver. . . . . . . . . . . . . . . . . . . . . . 8-4 . . . . . . 2-1When Allowing a 100-Yard Rusher . . . . . . . . . . . . . . . . . 0-0 . . . . . . 0-0When Not Allowing a 100-Yard Rusher. . . . . . . . . . . . . 11-5 . . . . . . 2-1When Allowing a 100-Yard Receiver . . . . . . . . . . . . . . . . 0-2 . . . . . . 1-0When Not Allowing a 100-Yard Receiver . . . . . . . . . . . 11-3 . . . . . . 1-1With a 300-Yard Passer . . . . . . . . . . . . . . . . . . . . . . . . . 0-0 . . . . . . 0-0Without a 300-Yard Passer . . . . . . . . . . . . . . . . . . . . . . 11-5 . . . . . 2-1When Allowing a 300-Yard Passer . . . . . . . . . . . . . . . . . 0-0 . . . . . . 0-0When Not Allowing a 300-Yard Passer . . . . . . . . . . . . . 11-5 . . . . . . 2-1
YDS RET.PLAYER TT SOLO AS SACKS LOST INT YDS PD FF FR
Lewis, Ray 160 84 76 3.5 32.5 3 43 12 1 2Scott, Bart 104 54 50 1.5 12 0 0 5 0 0Suggs, Terrell 102 62 40 8 69.5 2 86 11 2 1Leonhard, Jim 85 61 24 1 7 1 35 6 0 0Johnson, Jarret 82 46 36 5 32 0 0 4 2 1Ngata, Haloti 77 43 34 1 8 2 8 4 0 0Bannan, Justin 56 30 26 1 6 1 -4 3 0 0Ivy, Corey 46 39 7 2.5 7 0 0 5 1 0Douglas, Marques 43 24 19 0 0 0 0 0 0 0Reed, Ed 40 32 8 1 9 9 264 14 1 2Pryce, Trevor 35 20 15 4.5 23 0 0 6 0 0Washington, Fabian 34 30 4 0 0 1 12 19 0 0Walker, Frank 33 28 5 0 0 1 0 14 2 0Rolle, Samari 27 22 5 0 0 3 5 13 1 0McAlister, Chris 19 17 2 0 0 3 28 7 0 1McKinney, Brandon 19 12 7 0 0 0 0 0 0 1Landry, Dawan 14 9 5 0 0 0 0 0 0 0McClain, Jameel 8 8 0 2.5 26.5 0 0 0 0 0Barnes, Antwan 5 3 2 0 0 0 0 0 0 0Greisen, Nick 5 5 0 0 0 0 0 0 0 0Ogelsby, Evan 4 4 0 0 0 0 0 0 0 1Nakamura, Haruki 3 2 1 0 0 0 0 1 0 0Ayanbadejo, Brendon 2 1 1 1 9 0 0 0 0 0Jones, Edgar 1 1 0 0.5 4.5 0 0 0 0 0Zbikowski, Tom 1 1 0 0 0 0 0 0 0 0Stone, Daren 0 0 0 0 0 0 0 1 0 0TOTALS 1005 638 367 33 246 26 477 125 10 9
OFFENSE WR 89 Mark Clayton LT 71 Jared Gaither LG 66 Ben Grubbs C 60 Jason Brown RG 65 Chris Chester RT 79 Willie Anderson TE 86 Todd Heap WR 85 Derrick Mason QB 5 Joe Flacco RB 23 Willis McGahee FB 33 Le’Ron McClain
DEFENSE LDT 94 Justin Bannan NT 92 Haloti Ngata RDT 90 Trevor Pryce LOLB 95 Jarret Johnson LILB 52 Ray Lewis RILB 57 Bart Scott ROLB 55 Terrell Suggs LCB 31 Fabian Washington RCB 22 Samari Rolle SS 36 Jim Leonhard FS 20 Ed Reed
PLAYER TT SOLO AS FF FR BKAyanbadejo, Brendon 30 18 12 0 1 0Zbikowski, Tom 23 19 4 1 0 0McClain, Jameel 17 8 9 0 0 1Nakamura, Haruki 14 11 3 0 0 0Greisen, Nick 12 5 7 0 0 0Barnes, Antwan 9 7 2 0 0 0Stone, Daren 8 4 4 0 1 0Ivy, Corey 7 7 0 0 0 0Wilcox, Daniel 7 5 2 0 0 0Gooden, Tavares 6 6 0 0 0 0Jones, Edgar 6 4 2 0 1 0Figurs, Yamon 5 4 1 0 0 0Oglesby, Evan 5 4 1 0 0 0Koch, Sam 3 3 0 0 0 0Smith, Marcus 3 3 0 0 0 0Stover, Matt 2 2 0 0 0 0Walker, Frank 2 2 0 0 0 0Copper, Terrance 1 1 0 0 0 0Hauschka, Steve 1 1 0 0 0 0Landry, Dawan 1 1 0 0 0 0Leonhard, Jim 1 1 0 0 0 0McCune, Robert 1 1 0 0 0 0Martin, Derrick 1 1 0 0 0 0TOTALS 165 118 47 1 3 1
John Harbaugh, Head Coach; Rex Ryan, Asst. Head Coach/Defensive Coordinator; Cam Cameron, Offensive Coordinator; Jerry Rosburg, Special Teams Coordinator; Clarence Brooks, Defensive Line; Mark Carrier, Defensive Backs; John Dunn, Asst. Strength and Conditioning; Vic Fangio, Special Assistant to the Head Coach/Defense; Wade Harman, Tight Ends; Jim Hostler, Wide Receivers; Hue Jackson, Quarterbacks; Marwan Maalouf, Assistant Special Teams; John Matsko, Offensive Line; Greg Mattison, Linebackers; Andy Moeller, Assistant Offensive Line; Wilbert Montgomery, Running Backs; Chuck Pagano, Secondary; Mike Pettine, Outside Linebackers; Bob Rogucki, Strength and Conditioning; Craig Ver Steeg, Offensive Assistant
SOLO SACKS FF FR PD 84 Ray Lewis 8 Terrell Suggs 2 3 Players 2 Ray Lewis 19 Fabian Washington 62 Terrell Suggs 5 Jarret Johnson 1 4 Players 2 Ed Reed 14 Ed Reed 61 Jim Leonhard 4.5 Trevor Pryce 1 5 Players 14 Frank Walker
Pro Bowl: ST Brendon Ayanbadejo, LB Ray Lewis (starter), FB Le’Ron McClain (starter), S Ed Reed (starter), OLB Terrell SuggsPro Bowl Alternates: DT Haloti Ngata (1st); LB Bart Scott (2nd); WR Derrick Mason (3rd)
Diet Pepsi Rookie of the Year: QB Joe FlaccoUSA Today’s All-Joe Team: C Jason Brown, P Sam Koch, T Jared Gaither, DT Haloti Ngata
NFL Players of the Month: QB Joe Flacco (Rookie, November) - Offense, S Ed Reed (December) - DefenseNFL Players of the Week: QB Joe Flacco (Week 9) - Offense, P Sam Koch (Week16) - Special Teams,
LB Ray Lewis (Week 10) - Defense, S Ed Reed (Weeks 12, 14) - Defense, OLB Terrell Suggs (Week7) - DefenseEd Block Courage Award: S Ed Reed
Ravens Roost Unsung Hero: C Jason BrownRavens Roost Extra Effort: P Sam Koch
Ravens Nest Player of the Year: WR Derrick Mason
TOP THREE
COACHES
RAVENS HONOR ROLL
USUAL STARTERS
DEFENSIVE SPECIAL TEAMS
SEASON TRENDS
FROM COACHES VIDEOFROM COACHES VIDEO

BALTIMORERAVENS.COM 379
2008 POSTSEASON STATISTICS
GAM
E D
AY
RECORDS
HIS
TORY
2010
REVIE
W
PLAYERS
ORGANIZ
ATIO
N
359BALTIMORERAVENS.COM
2008 POSTSEASON STATISTICS
YDS RET.PLAYER TT SOLO AS SACKS LOST INT YDS PD FF FR
Lewis, Ray 29 23 6 0 0 0 0 1 2 0Scott, Bart 26 22 4 0 0 0 0 0 0 0Leonhard, Jim 16 14 2 0.5 5 1 20 1 1 2Washington, Fabian 15 13 2 0 0 1 12 3 0 1Ngata, Haloti 12 10 2 1 8 0 0 0 0 0Bannan, Justin 11 9 2 0 0 0 0 0 0 0Suggs, Terrell 11 10 1 4 35 0 0 0 0 1Douglas, Marques 8 4 4 1 7 0 0 0 1 0Reed, Ed 7 6 1 0 0 2 76 3 0 0Johnson, Jarret 6 6 0 0 0 0 0 0 1 0Rolle, Samari 6 4 2 0 0 1 3 2 0 0Ivy, Corey 5 5 0 0 0 0 0 1 0 0Walker, Frank 5 5 0 0 0 0 0 2 0 0Nakamura, Haruki 4 3 1 0.5 5 0 0 0 0 0McKinney, Brandon 3 2 1 0 0 0 0 0 0 0Pryce, Trevor 3 3 0 1 6 0 0 1 0 0Oglesby, Evan 2 2 0 0 0 0 0 0 0 0Zbikowski, Tom 2 1 1 0 0 0 0 0 0 0McClain, Jameel 1 1 0 0 0 0 0 0 0 0TOTALS 172 143 29 8 66 5 111 14 5 4
PLAYER TT SOLO AS FF FR BK
Ayanbadejo, Brendon 3 3 0 0 0 0
Greisen, Nick 3 3 0 0 0 0
McClain, Jameel 3 2 1 0 0 0
Nakamura, Haruki 3 3 0 0 0 0
Smith, Marcus 3 3 0 0 0 0
Stone, Daren 2 1 1 0 0 0
Jones, Edgar 1 1 0 0 0 0
Katula, Matt 1 1 0 0 0 0
Oglesby, Evan 1 0 1 0 0 0
Walker, Frank 1 1 0 0 0 1
Wilcox, Daniel 1 0 1 0 0 0
Zbikowski, Tom 1 0 1 0 0 0
Leonhard, Jim 0 0 0 0 1 0
TOTALS 23 18 5 0 1 1
RESULTS AND ATTENDANCEWON 2, LOST 101/04 W 27-9 at Miami 74,24001/10 W 13-10 at Tennessee 69,14301/18 L 14-23 at Pittsburgh 65,350
TEAM STATISTICS RAVENS OPPONENTTOTAL FIRST DOWNS 38 50 Rushing 16 10 Passing 18 36 Penalty 4 4 3rd Down: Made/Att 11/38 13/42 3rd Down Pct. 28.9 31.0 4th Down: Made/Att 0/1 0/3 4th Down Pct. 0.0 0.0POSSESSION AVG. 26:26 33:34TOTAL NET YARDS 695 942 Avg. Per Game 231.7 314.0 Total Plays 166 198 Avg. Per Play 4.2 4.8NET YARDS RUSHING 274 220 Avg. Per Game 91.3 73.3 Total Rushes 88 77NET YARDS PASSING 421 722 Avg. Per Game 140.3 240.7 Sacked/Yards Lost 3/16 8/66 Gross Yards 437 788 Att./Completions 75/33 `113/67 Completion Pct. 44.0 59.3 Had Intercepted 3 5PUNTS/AVERAGE 20/42.3 14/43.5NET PUNTING AVG. 20/38.1 14/32.4PENALTIES/YARDS 21/152 22/190FUMBLES/BALL LOST 4/2 9/4TOUCHDOWNS 6 4 Rushing 4 1 Passing 1 2 Returns 1 1
SCORE BY PERIODS 1 2 3 4 OT PTSRAVENS 10 17 7 20 0 54OPPONENTS 16 7 3 16 0 42
SCORING TD RU PA RT K/PAT FG S PTSStover 0 0 0 0 6/6 4/4 0 18McGahee 2 2 0 0 0 12Flacco 1 1 0 0 0 6D. Mason 1 0 1 0 0 6L. McClain 1 1 0 0 0 6Reed 1 0 0 1 0 6RAVENS 6 4 1 1 6/6 4/4 0 54Opponents 4 1 2 1 3/4 5/6 0 42
2-PT. CONVERSIONS: RAVENS 0-0, Opponents 0-0
SACKS: Suggs 4, Douglas 1, Ngata 1, Pryce 1, Leonhard 0.5, Nakamura 0.5, RAVENS 8, Opponents 3
FUM/LOST: Leonhard 2/0, L. McClain 1/1, McGahee 1/1
RUSHING NO YDS AVG LG TDMcGahee 39 154 3.9 48 2L. McClain 32 90 2.8 11 1Clayton 1 16 16.0 16 0Flacco 12 5 0.4 5t 1Neal 2 5 2.5 4 0Rice 1 2 2.0 2 0T. Smith 1 2 2.0 2 0RAVENS 88 274 3.1 48 4Opponents 77 220 2.9 32 1
RECEIVING NO YDS AVG LG TDD. Mason 12 190 15.8 48t 1Clayton 6 79 13.2 37 0Heap 5 80 16.0 31 0McGahee 4 26 6.5 11 0Rice 3 43 14.3 22 0Neal 2 15 7.5 8 0Wilcox 1 4 4.0 4 0RAVENS 33 437 13.2 48t 1Opponents 67 788 11.8 65t 2
INTERCEPTIONS NO YDS AVG LG TDReed 2 76 38.0 64t 1Leonhard 1 20 20.0 20 0Washington 1 12 12.0 12 0Rolle 1 3 3.0 3 0RAVENS 5 111 22.2 64t 1Opponents 3 47 15.7 40t 1
PUNTING NO YDS AVG NET TB IN LG BLKKoch 20 845 42.3 38.1 2 7 52 0RAVENS 20 845 42.3 38.1 2 7 52 0Opponents 14 609 43.5 32.4 2 1 66 0
PUNT RETURNS RET FC YDS AVG LG TDLeonhard 9 2 115 12.8 45 0RAVENS 9 2 115 12.8 45 0Opponents 10 4 44 4.4 25 0
KICKOFF RETURNS NO YDS AVG LG TDZbikowski 3 68 22.7 31 0Figurs 2 19 9.5 18 0Rice 2 31 15.5 17 0L. McClain 1 23 23.0 23 0Wilcox 1 14 14.0 14 0RAVENS 9 155 17.2 31 0Opponents 10 237 23.7 34 0
FIELD GOALS 1-19 20-29 30-39 40-49 50+Stover 0/0 2/2 1/1 1/1 0/0RAVENS 0/0 2/2 1/1 1/1 0/0Opponents 1/1 1/1 1/1 2/2 0/1
Stover: (23G,31G)(21G,43G)()RAVENS: (23G,31G)(21G,43G)()Opponents: (19G)(51N,27G)(34G,42G,46G)
PASSING ATT COMP YARDS COMP% YDS/ATT TD TD% INT INT% LG SACK/LOST RATINGFlacco 75 33 437 44.0 5.83 1 1.3 3 4.0 48t 3/16 50.8RAVENS 75 33 437 44.0 5.83 1 1.3 3 4.0 48t 3/16 50.8Opponents 113 67 788 59.3 6.97 2 1.8 5 4.4 65t 8/66 68.0
DEFENSIVE SPECIAL TEAMSFROM COACHES VIDEOFROM COACHES VIDEO

2019 BALTIMORE RAVENS MEDIA GUIDE380
2009 STATISTICS
ORGANIZ
ATIO
N P
LAYERS 20
10 R
EVIE
W H
ISTORY R
ECORDS G
AM
E D
AY
360 BALTIMORE RAVENS FAN & MEDIA GUIDE 2011
RESULTS AND ATTENDANCEWON 9, LOST 7WILD CARD/AFC DIVISIONAL GAME09/13 W 38-24 Kansas City 71,09909/20 W 31-26 at San Diego 66,88209/27 W 34-3 Cleveland 70,95010/04 L 21-27 at New England 68,75610/11 L 14-17 Cincinnati 71,16110/18 L 31-33 at Minnesota 63,68911/01 W 30-7 Denver 71,13211/08 L 7-17 at Cincinnati 64,31311/16 W 16-0 at Cleveland 69,02311/22 L 15-17 Indianapolis 71,32011/29 W 20-17 OT Pittsburgh 71,31412/07 L 14-27 at Green Bay 70,28612/13 W 48-3 Detroit 70,67312/20 W 31-7 Chicago 71,01112/27 L 20-23 at Pittsburgh 64,06801/03 W 21-13 at Oakland 38,400
TEAM STATISTICS RAVENS OPPONENTTOTAL FIRST DOWNS 320 280 Rushing 115 82 Passing 187 164 Penalty 18 34 3rd Down: Made/Att 89/214 80/218 3rd Down Pct. 41.6% 36.7% 4th Down: Made/Att 6/13 7/17 4th Down Pct. 46.2% 41.2%POSSESSION AVG. 29:18 30:42TOTAL NET YARDS 5619 4808 Avg. Per Game 351.2 300.5 Total Plays 1014 991 Avg. Per Play 5.5 4.9NET YARDS RUSHING 2200 1492 Avg. Per Game 137.5 93.3 Total Rushes 468 435NET YARDS PASSING 3419 3316 Avg. Per Game 213.7 207.3 Sacked/Yards Lost 36/218 32/190 Gross Yards 3637 3506 Attempts/Completions 510/321 524/306 Completion Pct. 62.9% 58.4% Had Intercepted 13 22PUNTS/AVERAGE 74/43.1 79/43.4NET PUNTING AVG. 37.9 37.2PENALTIES/YARDS 115/1094 88/741FUMBLES/BALL LOST 19/9 20/10TOUCHDOWNS 47 27 Rushing 22 8 Passing 21 17 Returns 4 2
SCORE BY PERIODS 1 2 3 4 OT PTSRAVENS 77 81 123 107 3 391Opponents 57 95 47 62 0 261
SCORING TD RU PA RT K/PAT FG S PTSMcGahee 14 12 2 0 0/0 0/0 0 84Cundiff 0 0 0 0 19/19 12/17 0 55Hauschka 0 0 0 0 27/28 9/13 0 54Rice 8 7 1 0 0/0 0/0 0 48Mason 7 0 7 0 0/0 0/0 0 42Heap 6 0 6 0 0/0 0/0 0 36Clayton 2 0 2 0 0/0 0/0 0 12L. McClain 2 2 0 0 0/0 0/0 0 12K. Washington 2 0 2 0 0/0 0/0 0 12Edwards 1 0 0 1 0/0 0/0 0 6Landry 1 0 0 1 0/0 0/0 0 6Reed 1 0 0 1 0/0 0/0 0 6T. Smith 1 1 0 0 0/0 0/0 0 6Webb 1 0 0 1 0/0 0/0 0 6D. Williams 1 0 1 0 0/0 0/0 0 6RAVENS 47 22 21 4 46/47 21/30 0 391Opponents 27 8 17 2 27/27 24/27 0 261
2-PT. CONVERSIONS: RAVENS 0-0, Opponents 0-0
SACKS: Pryce 6.5, J. Johnson 6, Suggs 4.5, Barnes 3, Gregg 3, Lewis 3, Carr 1.5, Ngata 1.5, Ayanbadejo 1, Edwards 1, Webb 1, RAVENS 32, Opponents 36
FUM/LOST: Flacco 8/2, Reed 3/1, Rice 3/3, Carr 2/1, Clayton 1/1, Heap 1/0, McGahee 1/1
RUSHING NO YDS AVG LG TDRice 254 1339 5.3 59t 7McGahee 109 544 5.0 77t 12L. McClain 46 180 3.9 20 2Flacco 35 56 1.6 10 0T. Smith 8 31 3.9 15t 1Clayton 4 28 7.0 12 0Parmele 5 17 3.4 7 0Heap 1 2 2.0 2 0Mason 1 2 2.0 2 0K. Washington 1 1 1.0 1 0Lawrence 4 0 0.0 4 0RAVENS 468 2200 4.7 77t 22Opponents 435 1492 3.4 58 8
RECEIVING NO YDS AVG LG TDRice 78 702 9.0 63 1Mason 73 1028 14.1 72t 7Heap 53 593 11.2 31 6Clayton 34 480 14.1 54 2K. Washington 34 431 12.7 28 2L. McClain 21 141 6.7 19 0McGahee 15 85 5.7 14 2D. Williams 8 142 17.8 34 1L. Smith 2 31 15.5 26 0Jones 1 8 8.0 8 0Lawrence 1 4 4.0 4 0Oher 1 -8 -8.0 -8 0RAVENS 321 3637 11.3 72t 21Opponents 306 3506 11.5 81t 17
INTERCEPTIONS NO YDS AVG LG TDLandry 4 89 22.3 48t 1Foxworth 4 34 8.5 19 0Reed 3 111 37.0 52t 1Carr 2 24 12.0 13 0Zbikowski 2 13 6.5 21 0Johnson 2 8 4.0 8 0Ellerbe 1 28 28.0 28 0Kruger 1 26 26.0 26 0Barnes 1 4 4.0 4 0Ayanbadejo 1 0 0.0 0 0Walker 1 0 0.0 0 0Lewis 0 9 ---- 9 0RAVENS 22 346 15.7 52t 2Opponents 13 195 15.0 70 0
PUNTING NO YDS AVG NET TB IN LG BLKKoch 73 3188 43.7 37.9 5 26 60 1RAVENS 74 3188 43.1 37.9 5 26 60 1Opponents 79 3426 43.4 37.2 10 24 61 0
PUNT RETURNS RET FC YDS AVG LG TDCarr 32 17 262 8.2 34 0Reed 7 1 29 4.1 9 0Webb 0 0 -1 ---- -1 0RAVENS 39 18 290 7.4 34 0Opponents 38 12 287 7.6 49t 1
KICKOFF RETURNS NO YDS AVG LG TDWebb 35 918 26.2 95t 1Carr 13 315 24.2 41 0Parmele 9 283 31.4 53 0Edwards 1 14 14.0 14 0L. McClain 1 17 17.0 17 0RAVENS 59 1547 26.2 95t 1Opponents 77 1565 20.3 53 0
FIELD GOALS 1-19 20-29 30-39 40-49 50+Cundiff Bal. 0/0 5/5 4/7 3/3 0/2Hauschka 0/0 1/1 5/7 3/5 0/0RAVENS 0/0 6/6 9/14 6/8 0/2Opponents 0/0 12/12 9/11 2/3 1/1
Cundiff: (games 10-16) (46G, 44G, 38G, 36G, 30N, 20G) (24G, 56N, 29G) () (38G, 25G) (30N, 40G) (27G, 35G) (37N, 51N)Hauschka: (games 1-9) (44G, 41N) (33G) (36G, 33G) () () (29G, 44N) (43G, 35G, 31G) (38N) (36N, 44G)Opponents: (53G) (29G, 22G, 23G, 25G) (29G) (32G, 33G) (32B, 32G) (40G, 22G, 29G, 31G) () (23G) () (25G) (44G) (28G, 38N, 32G)(45N, 22G) () (26G, 39G, 38G) (37G, 39G)
2009 STATISTICS
PASSING ATT COMP YARDS COMP% YDS/ATT TD TD% INT INT% LG SACK/LOST RATINGFlacco 499 315 3613 63.1% 7.2 21 4.2% 12 2.4% 72t 36/218 88.9T.Smith 9 5 24 55.6% 2.7 0 0.0% 1 11.1% 9 0/0 21.3Clayton 1 1 0 100.0% 0.0 0 0.0% 0 0.0% 0 0/0 79.2Rice 1 0 0 0.0% 0.0 0 0.0% 0 0.0% ---- 0/0 39.6RAVENS 510 321 3637 62.9% 7.1 21 4.1% 13 2.5% 72t 36/218 87.4Opponents 524 306 3506 58.4% 6.7 17 3.2% 22 4.2% 81t 32/190 71.9

BALTIMORERAVENS.COM 381
2009 STATISTICS
GAM
E D
AY
RECORDS
HIS
TORY
2010
REVIE
W
PLAYERS
ORGANIZ
ATIO
N
361BALTIMORERAVENS.COM
Reg. Post.Record . . . . . . . . . . . . . . . . . . . . . . . . . . . . . . . . . . . . . . 9-7 . . . . . . 1-1vs. AFC North . . . . . . . . . . . . . . . . . . . . . . . . . . . . . . . . 3-3 . . . . . . 0-0vs. AFC . . . . . . . . . . . . . . . . . . . . . . . . . . . . . . . . . . . . . 7-5 . . . . . . 1-1vs. NFC. . . . . . . . . . . . . . . . . . . . . . . . . . . . . . . . . . . . . . 2-2 . . . . . . 0-0Home . . . . . . . . . . . . . . . . . . . . . . . . . . . . . . . . . . . . . . . 6-2 . . . . . . 0-0Away . . . . . . . . . . . . . . . . . . . . . . . . . . . . . . . . . . . . . . . . 3-5 . . . . . . 1-1On Grass . . . . . . . . . . . . . . . . . . . . . . . . . . . . . . . . . . . . 3-2 . . . . . . 0-0Artificial Turf . . . . . . . . . . . . . . . . . . . . . . . . . . . . . . . . . . 6-5 . . . . . . 1-1Outdoors. . . . . . . . . . . . . . . . . . . . . . . . . . . . . . . . . . . . . 9-6 . . . . . . 1-0Indoors . . . . . . . . . . . . . . . . . . . . . . . . . . . . . . . . . . . . . . 0-1 . . . . . . 0-1Leading at Halftime. . . . . . . . . . . . . . . . . . . . . . . . . . . . . 8-1 . . . . . . 1-0Trailing at Halftime . . . . . . . . . . . . . . . . . . . . . . . . . . . . . 0-6 . . . . . . 0-1Tied at Halftime. . . . . . . . . . . . . . . . . . . . . . . . . . . . . . . . 1-0 . . . . . . 0-0Tied After 3 Quarters . . . . . . . . . . . . . . . . . . . . . . . . . . . 0-1 . . . . . . 0-0Leading After 3 Quarters. . . . . . . . . . . . . . . . . . . . . . . . . 9-0 . . . . . . 1-0Trailing After 3 Quarters . . . . . . . . . . . . . . . . . . . . . . . . . 0-6 . . . . . . 0-1Decided by 7 Points or less . . . . . . . . . . . . . . . . . . . . . . 2-5 . . . . . . 0-0Decided by 3 Points or less . . . . . . . . . . . . . . . . . . . . . . 1-4 . . . . . . 0-0
Reg. Post.When Scoring First . . . . . . . . . . . . . . . . . . . . . . . . . . . . . 8-1 . . . . . . 1-0When Not Scoring First. . . . . . . . . . . . . . . . . . . . . . . . . . 1-6 . . . . . . 0-1Positive or even Turnover Ratio . . . . . . . . . . . . . . . . . . . 7-3 . . . . . . 1-0Negative Turnover Ratio . . . . . . . . . . . . . . . . . . . . . . . . . 2-4 . . . . . . 0-1Winning Penalty Ratio . . . . . . . . . . . . . . . . . . . . . . . . . . 1-1 . . . . . . 1-0Losing Penalty Ratio. . . . . . . . . . . . . . . . . . . . . . . . . . . . 7-6 . . . . . . 0-1Overtime. . . . . . . . . . . . . . . . . . . . . . . . . . . . . . . . . . . . . 1-0 . . . . . . 0-0With a 100-Yard Rusher . . . . . . . . . . . . . . . . . . . . . . . . . 3-2 . . . . . . 1-0With a 100-Yard Receiver . . . . . . . . . . . . . . . . . . . . . . . . 2-2 . . . . . . 0-0Without a 100-yard Rusher . . . . . . . . . . . . . . . . . . . . . . . 6-5 . . . . . . 0-1Without a 100-yard Receiver. . . . . . . . . . . . . . . . . . . . . . 7-5 . . . . . . 1-1When Allowing a 100-Yard Rusher . . . . . . . . . . . . . . . . . 0-3 . . . . . . 0-0When Not Allowing a 100-Yard Rusher. . . . . . . . . . . . . . 9-4 . . . . . . 1-1When Allowing a 100-Yard Receiver . . . . . . . . . . . . . . . . 1-2 . . . . . . 0-0When Not Allowing a 100-Yard Receiver . . . . . . . . . . . . 8-5 . . . . . . 1-1With a 300-Yard Passer . . . . . . . . . . . . . . . . . . . . . . . . . 2-1 . . . . . . 0-0Without a 300-Yard Passer . . . . . . . . . . . . . . . . . . . . . . . 7-6 . . . . . 1-1When Allowing a 300-Yard Passer . . . . . . . . . . . . . . . . . 1-0 . . . . . . 0-0When Not Allowing a 300-Yard Passer . . . . . . . . . . . . . . 8-7 . . . . . . 1-1
YDS RET.PLAYER TT SOLO AS SACKS LOST INT YDS PD FF FRLewis, Ray 164 100 64 3 16 0 9 6 3 1Landry, Dawan 82 74 8 0 0 4 89 11 0 0Johnson, Jarret 70 49 21 6 45 2 8 4 1 0Gregg, Kelly 64 40 24 3 3 0 0 0 0 0Foxworth, Domonique 62 51 11 0 0 4 34 21 0 1Suggs, Terrell 58 41 17 4.5 33 0 0 5 1 1Ellerbe, Dannell 55 37 18 0 0 1 28 4 0 1Reed, Ed 54 50 4 0 0 3 111 6 3 1Gooden, Tavares 52 29 23 0 0 0 0 2 0 0Edwards, Dwan 50 30 20 1 2 0 0 1 0 2Ngata, Haloti 41 23 18 1.5 13 0 0 0 1 1Washington, Fabian 41 33 8 0 0 0 0 8 0 0Carr, Chris 39 31 8 1.5 13.5 2 24 9 2 0Bannan, Justin 37 23 14 0 0 0 0 0 0 0Pryce, Trevor 37 23 14 6.5 40.5 0 0 0 1 0Webb, Lardarius 36 25 11 1 4 0 0 6 0 0McClain, Jameel 29 17 12 0 0 0 0 0 0 0Ayanbadejo, Brendon 22 14 8 1 5 1 0 1 0 0Zbikowski, Tom 16 15 1 0 0 2 13 4 0 0Walker, Frank 14 8 6 0 0 1 0 4 0 1Kruger, Paul 12 4 8 0 0 1 26 4 0 0Barnes, Antwan 7 6 1 3 15 1 4 1 1 0McKinney, Brandon 3 1 2 0 0 0 0 0 0 0Burgess, Prescott 2 0 2 0 0 0 0 0 0 0Nakamura, Haruki 1 1 0 0 0 0 0 0 0 0Talavou, Kelly 1 1 0 0 0 0 0 0 0 0Williams, Cary 1 1 0 0 0 0 0 0 0 0Ivy, Corey 0 0 0 0 0 0 0 1 0 0Totals 1050 727 323 32 190 22 346 98 13 9
OFFENSE WR 89 Mark Clayton LT 71 Jared Gaither LG 66 Ben Grubbs C 77 Matt Birk RG 73 Marshal Yanda RT 74 Michael Oher TE 86 Todd Heap WR 85 Derrick Mason QB 5 Joe Flacco RB 27 Ray Rice FB 33 Le’Ron McClain
DEFENSE DT 92 Haloti Ngata NT 97 Kelly Gregg DE 93 Dwan Edwards SLB 95 Jarret Johnson MIKE 52 Ray Lewis JACK 56 Tavares Gooden RLB 55 Terrell Suggs LCB 31 Fabian Washington RCB 24 Domonique Foxworth SS 26 Dawan Landry FS 20 Ed Reed
PLAYER TT SOLO AS FF FR BKBurgess, Prescott 34 18 16 0 0 0McClain, Jameel 33 16 17 1 0 0Zbikowski, Tom 28 19 9 0 0 0Jones, Edgar 19 12 7 0 0 0Lawrence, Matt 16 7 9 1 0 0Gooden, Tavares 13 8 5 0 0 0Webb, Lardarius 11 6 5 0 0 0Carr, Chris 10 7 3 0 0 0Landry, Dawan 10 9 1 0 0 0Tyree, David 10 9 1 0 0 0Ellerbe, Dannell 8 8 0 0 0 0Barnes, Antwan 7 5 2 0 0 0Nakamura, Haruki 7 4 3 1 0 0Parmele, Jalen 7 5 2 0 1 0Ayanbadejo, Brendon 6 6 0 0 0 0Williams, Cary 5 4 1 2 0 0Katula, Matt 4 2 2 0 0 0Walker, Frank 3 3 0 0 0 0Gerard, K.J. 2 2 0 0 0 0Hauschka, Steve 2 2 0 0 0 0Harper, Justin 1 0 1 0 0 0McClain, Le’Ron 1 1 0 0 0 0Paschal, Marcus 1 0 1 0 0 0Washington, Kelley 1 1 0 0 0 0Gregg, Kelly 0 0 0 0 0 1Totals 241 155 86 5 1 2
John Harbaugh, Head Coach; Jerry Rosburg, Asst. Head Coach/Special Teams Coordinator; Cam Cameron, Offensive Coordinator; Greg Mattison, Defensive Coordinator; Roy Anderson, Defensive Asst.; Clarence Brooks, Defensive Line; Jason Brooks, Asst. to the Offense; Mark Carrier, Defensive Backs; John Dunn, Asst. Strength and Conditioning; Vic Fangio, Linebackers; Wade Harman, Tight Ends; Jim Hostler, Wide Receivers; Hue Jackson, Quarterbacks; Marwan Maalouf, Asst. Special Teams; John Matsko, Offensive Line; Andy Moeller, Asst. Offensive Line; Wilbert Montgomery, Running Backs; Chuck Pagano, Secondary; Bob Rogucki, Strength and Conditioning; Craig Ver Steeg, Offensive Asst.; Matt Weiss, Head Coach’s Asst.
SOLO SACKS FF FR PD 100 Ray Lewis 6.5 Trevor Pryce 3 Ray Lewis 2 Dwan Edwards 21 Domonique Foxworth 74 Dawan Landry 6 Jarret Johnson Ed Reed 1 7 Players 11 Dawan Landry 51 Domonique Foxworth 4.5 Terrell Suggs 2 Chris Carr 9 Chris Carr
AP All-Pro: LB Ray Lewis (1st Team), FB Le’Ron McClain (2nd Team), DT Haloti Ngata (2nd Team), S Ed Reed (2nd Team), RB Ray Rice (2nd Team)Pro Bowl: LB Ray Lewis (starter), FB Le’Ron McClain (starter), DT Haloti Ngata (starter), S Ed Reed (starter), RB Ray Rice
Pro Bowl Alternate: G Ben Grubbs (first)Pro Football Weekly/PFWA’s All-NFL Team: DT Haloti Ngata; T Michael Oher (Rookie)
USA Today’s All-Joe Team: QB Joe Flacco, T Michael OherNFL Players of the Week/Month: LB Brendon Ayanbadejo (Week 3) - Defense, CB Domonique Foxworth (Week 15) - Defense,
RB Willis McGahee (Week 17) - Offense, T Michael Oher (Rookie, December)Ed Block Courage Award: S Dawan LandryRavens Roost Unsung Hero: C Matt Birk
Ravens Roost Extra Effort: CB Domonique FoxworthRavens Nest Player of the Year: DT Haloti Ngata
TOP THREE
COACHES
RAVENS HONOR ROLL
USUAL STARTERS
DEFENSIVE SPECIAL TEAMS
SEASON TRENDS
FROM COACHES VIDEOFROM COACHES VIDEO
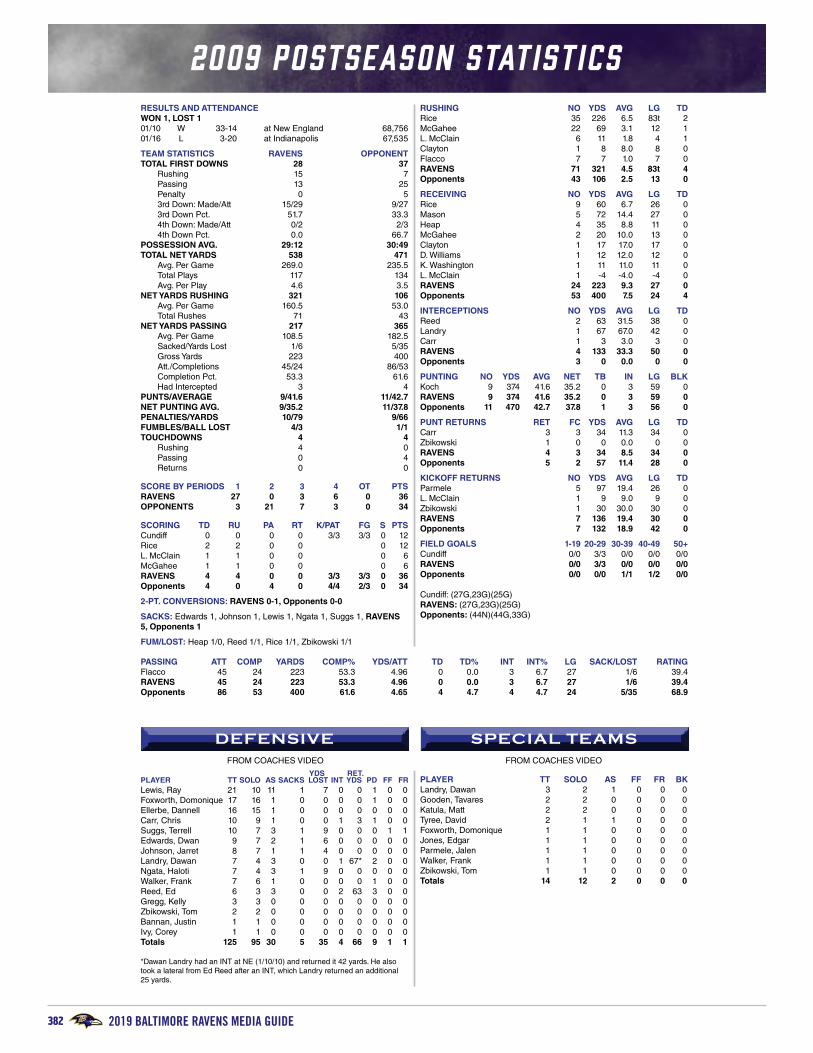
2019 BALTIMORE RAVENS MEDIA GUIDE382
2009 POSTSEASON STATISTICS
ORGANIZ
ATIO
N P
LAYERS 20
10 R
EVIE
W H
ISTORY R
ECORDS G
AM
E D
AY
362 BALTIMORE RAVENS FAN & MEDIA GUIDE 2011
2009 POSTSEASON STATISTICS
YDS RET.PLAYER TT SOLO AS SACKS LOST INT YDS PD FF FRLewis, Ray 21 10 11 1 7 0 0 1 0 0Foxworth, Domonique 17 16 1 0 0 0 0 1 0 0Ellerbe, Dannell 16 15 1 0 0 0 0 0 0 0Carr, Chris 10 9 1 0 0 1 3 1 0 0Suggs, Terrell 10 7 3 1 9 0 0 0 1 1Edwards, Dwan 9 7 2 1 6 0 0 0 0 0Johnson, Jarret 8 7 1 1 4 0 0 0 0 0Landry, Dawan 7 4 3 0 0 1 67* 2 0 0Ngata, Haloti 7 4 3 1 9 0 0 0 0 0Walker, Frank 7 6 1 0 0 0 0 1 0 0Reed, Ed 6 3 3 0 0 2 63 3 0 0Gregg, Kelly 3 3 0 0 0 0 0 0 0 0Zbikowski, Tom 2 2 0 0 0 0 0 0 0 0Bannan, Justin 1 1 0 0 0 0 0 0 0 0Ivy, Corey 1 1 0 0 0 0 0 0 0 0Totals 125 95 30 5 35 4 66 9 1 1
*Dawan Landry had an INT at NE (1/10/10) and returned it 42 yards. He also took a lateral from Ed Reed after an INT, which Landry returned an additional 25 yards.
PLAYER TT SOLO AS FF FR BKLandry, Dawan 3 2 1 0 0 0Gooden, Tavares 2 2 0 0 0 0Katula, Matt 2 2 0 0 0 0Tyree, David 2 1 1 0 0 0Foxworth, Domonique 1 1 0 0 0 0Jones, Edgar 1 1 0 0 0 0Parmele, Jalen 1 1 0 0 0 0Walker, Frank 1 1 0 0 0 0Zbikowski, Tom 1 1 0 0 0 0Totals 14 12 2 0 0 0
RESULTS AND ATTENDANCEWON 1, LOST 101/10 W 33-14 at New England 68,75601/16 L 3-20 at Indianapolis 67,535
TEAM STATISTICS RAVENS OPPONENTTOTAL FIRST DOWNS 28 37 Rushing 15 7 Passing 13 25 Penalty 0 5 3rd Down: Made/Att 15/29 9/27 3rd Down Pct. 51.7 33.3 4th Down: Made/Att 0/2 2/3 4th Down Pct. 0.0 66.7POSSESSION AVG. 29:12 30:49TOTAL NET YARDS 538 471 Avg. Per Game 269.0 235.5 Total Plays 117 134 Avg. Per Play 4.6 3.5NET YARDS RUSHING 321 106 Avg. Per Game 160.5 53.0 Total Rushes 71 43NET YARDS PASSING 217 365 Avg. Per Game 108.5 182.5 Sacked/Yards Lost 1/6 5/35 Gross Yards 223 400 Att./Completions 45/24 86/53 Completion Pct. 53.3 61.6 Had Intercepted 3 4PUNTS/AVERAGE 9/41.6 11/42.7NET PUNTING AVG. 9/35.2 11/37.8PENALTIES/YARDS 10/79 9/66FUMBLES/BALL LOST 4/3 1/1TOUCHDOWNS 4 4 Rushing 4 0 Passing 0 4 Returns 0 0
SCORE BY PERIODS 1 2 3 4 OT PTSRAVENS 27 0 3 6 0 36OPPONENTS 3 21 7 3 0 34
SCORING TD RU PA RT K/PAT FG S PTSCundiff 0 0 0 0 3/3 3/3 0 12Rice 2 2 0 0 0 12L. McClain 1 1 0 0 0 6McGahee 1 1 0 0 0 6RAVENS 4 4 0 0 3/3 3/3 0 36Opponents 4 0 4 0 4/4 2/3 0 34
2-PT. CONVERSIONS: RAVENS 0-1, Opponents 0-0
SACKS: Edwards 1, Johnson 1, Lewis 1, Ngata 1, Suggs 1, RAVENS 5, Opponents 1
FUM/LOST: Heap 1/0, Reed 1/1, Rice 1/1, Zbikowski 1/1
RUSHING NO YDS AVG LG TDRice 35 226 6.5 83t 2McGahee 22 69 3.1 12 1L. McClain 6 11 1.8 4 1Clayton 1 8 8.0 8 0Flacco 7 7 1.0 7 0RAVENS 71 321 4.5 83t 4Opponents 43 106 2.5 13 0
RECEIVING NO YDS AVG LG TDRice 9 60 6.7 26 0Mason 5 72 14.4 27 0Heap 4 35 8.8 11 0McGahee 2 20 10.0 13 0Clayton 1 17 17.0 17 0D. Williams 1 12 12.0 12 0K. Washington 1 11 11.0 11 0L. McClain 1 -4 -4.0 -4 0RAVENS 24 223 9.3 27 0Opponents 53 400 7.5 24 4
INTERCEPTIONS NO YDS AVG LG TDReed 2 63 31.5 38 0Landry 1 67 67.0 42 0Carr 1 3 3.0 3 0RAVENS 4 133 33.3 50 0Opponents 3 0 0.0 0 0
PUNTING NO YDS AVG NET TB IN LG BLKKoch 9 374 41.6 35.2 0 3 59 0RAVENS 9 374 41.6 35.2 0 3 59 0Opponents 11 470 42.7 37.8 1 3 56 0
PUNT RETURNS RET FC YDS AVG LG TDCarr 3 3 34 11.3 34 0Zbikowski 1 0 0 0.0 0 0RAVENS 4 3 34 8.5 34 0Opponents 5 2 57 11.4 28 0
KICKOFF RETURNS NO YDS AVG LG TDParmele 5 97 19.4 26 0L. McClain 1 9 9.0 9 0Zbikowski 1 30 30.0 30 0RAVENS 7 136 19.4 30 0Opponents 7 132 18.9 42 0
FIELD GOALS 1-19 20-29 30-39 40-49 50+Cundiff 0/0 3/3 0/0 0/0 0/0RAVENS 0/0 3/3 0/0 0/0 0/0Opponents 0/0 0/0 1/1 1/2 0/0
Cundiff: (27G,23G)(25G)RAVENS: (27G,23G)(25G)Opponents: (44N)(44G,33G)
PASSING ATT COMP YARDS COMP% YDS/ATT TD TD% INT INT% LG SACK/LOST RATINGFlacco 45 24 223 53.3 4.96 0 0.0 3 6.7 27 1/6 39.4RAVENS 45 24 223 53.3 4.96 0 0.0 3 6.7 27 1/6 39.4Opponents 86 53 400 61.6 4.65 4 4.7 4 4.7 24 5/35 68.9
DEFENSIVE SPECIAL TEAMSFROM COACHES VIDEO FROM COACHES VIDEO

BALTIMORERAVENS.COM 383
2010 STATISTICS
GAM
E D
AY
RECORDS
HIS
TORY
2010
REVIE
W
PLAYERS
ORGANIZ
ATIO
N
265BALTIMORERAVENS.COM
RESULTS AND ATTENDANCEWON 12, LOST 4WILD CARD/DIVISIONAL GAME09/13 W 10-9 at New York Jets 78,12709/19 L 10-15 at Cincinnati 64,07109/26 W 24-17 Cleveland 71,11910/03 W 17-14 at Pittsburgh 64,72910/10 W 31-17 Denver 71,24610/17 L 20-23 OT at New England 68,75610/24 W 37-34 OT Buffalo 71,22011/07 W 26-10 Miami 71,30511/11 L 21-26 at Atlanta 68,47411/21 W 37-13 at Carolina 73,02111/28 W 17-10 Tampa Bay 70,98912/05 L 10-13 Pittsburgh 71,41812/13 W 34-28 OT at Houston 71,11312/19 W 30-24 New Orleans 71,43212/26 W 20-10 at Cleveland 65,02801/02 W 13-7 Cincinnati 71,008
TEAM STATISTICS RAVENS OPPONENTTOTAL FIRST DOWNS 303 284 Rushing 97 79 Passing 175 187 Penalty 31 18 3rd Down: Made/Att 82/210 87/229 3rd Down Pct. 39.0 38.0 4th Down: Made/Att 4/10 6/12 4th Down Pct. 40.0 50.0POSSESSION AVG. 30:42 29:18TOTAL NET YARDS 5166 5102 Avg. Per Game 322.9 318.9 Total Plays 1018 1007 Avg. Per Play 5.1 5.1NET YARDS RUSHING 1831 1503 Avg. Per Game 114.4 93.9 Total Rushes 487 384NET YARDS PASSING 3335 3599 Avg. Per Game 208.4 224.9 Sacked/Yards Lost 40/294 27/190 Gross Yards 3629 3789 Att./Completions 491/308 596/349 Completion Pct. 62.7 58.6 Had Intercepted 10 19PUNTS/AVERAGE 81/43.6 89/43.5NET PUNTING AVG. 81/39.2 89/39.1PENALTIES/YARDS 90/673 117/984FUMBLES/BALL LOST 22/10 24/8TOUCHDOWNS 40 27 Rushing 11 5 Passing 25 22 Returns 4 0
SCORE BY PERIODS 1 2 3 4 OT PTSRAVENS 61 132 75 80 9 357Opponents 51 73 24 119 3 270
SCORING TD RU PA RT K/PAT FG S PTSCundiff 0 0 0 0 39/39 26/29 0 117Boldin 7 0 7 0 0 42Mason 7 0 7 0 0 42McGahee 6 5 1 0 0 36Rice 6 5 1 0 0 36Heap 5 0 5 0 0 30Houshmandzadeh 3 0 3 0 0 18Dickson 1 0 1 0 0 6Flacco 1 1 0 0 0 6Landry 1 0 0 1 0 6Lewis 1 0 0 1 0 6D. Reed 1 0 0 1 0 6Wilson 1 0 0 1 0 6RAVENS 40 11 25 4 39/39 26/29 0 357Opponents 27 5 22 0 25/25 27/32 0 270
2-PT. CONVERSIONS: RAVENS 0-0, Opponents 1-2
SACKS: Suggs 11, Ngata 5.5, Redding 3, Lewis 2, Johnson 1.5, Ellerbe 1, Kruger 1, Landry 1, J. McClain 1, RAVENS 27, Opponents 40
FUM/LOST: Flacco 9/4, McGahee 2/2, E. Reed 2/0, Webb 2/1, Boldin 1/1, Heap 1/0, Houshmandzadeh 1/0, Koch 1/0, Parmele 1/0, Stallworth 1/1, Wilson 1/1
RUSHING NO YDS AVG LG TDRice 307 1220 4.0 50 5McGahee 100 380 3.8 30t 5L. McClain 28 85 3.0 16 0Flacco 43 84 2.0 14 1Stallworth 5 45 9.0 19 0D. Reed 1 15 15.0 15 0Boldin 2 2 1.0 3 0Koch 1 0 0.0 0 0RAVENS 487 1831 3.8 50 11Opponents 384 1503 3.9 48 5
RECEIVING NO YDS AVG LG TDBoldin 64 837 13.1 61 7Rice 63 556 8.8 34 1Mason 61 802 13.1 42 7Heap 40 599 15.0 65t 5Houshmandzadeh 30 398 13.3 56t 3L. McClain 21 134 6.4 19 0McGahee 14 55 3.9 32t 1Dickson 11 152 13.8 58 1Stallworth 2 82 41.0 67 0Williams 1 13 13.0 13 0Pitta 1 1 1.0 1 0RAVENS 308 3629 11.8 67 25Opponents 349 3789 10.9 88t 22
INTERCEPTIONS NO YDS AVG LG TDE. Reed 8 183 22.9 44 0Wilson 3 12 4.0 12t 1Webb 2 32 16.0 32 0Lewis 2 26 13.0 24t 1Carr 2 13 6.5 12 0Hamlin 1 0 0.0 0 0Redding 1 0 0.0 0 0Landry 0 23 --- 23t 1RAVENS 19 289 15.2 44 3Opponents 10 191 19.1 66 0
PUNTING NO YDS AVG NET TB IN LG BLKKoch 81 3530 43.6 39.2 4 39 60 0RAVENS 81 3530 43.6 39.2 4 39 60 0Opponents 89 3875 43.5 39.1 4 26 65 0
PUNT RETURNS RET FC YDS AVG LG TDWebb 21 12 199 9.5 35 0Zbikowski 16 8 101 6.3 20 0Carr 3 0 8 2.7 10 0E. Reed 3 6 11 3.7 9 0RAVENS 43 26 319 7.4 35 0Opponents 34 22 275 8.1 32 0
KICKOFF RETURNS NO YDS AVG LG TDParmele 24 562 23.4 39 0D. Reed 21 616 29.3 103t 1Wilson 6 117 19.5 26 0Zbikowski 3 48 16.0 20 0Carr 1 14 14.0 14 0Nakamura 0 0 --- --- 0RAVENS 55 1357 24.7 103t 1Opponents 38 987 26.0 64 0
FIELD GOALS 1-19 20-29 30-39 40-49 50+Cundiff 0/0 11/11 8/9 7/8 0/1RAVENS 0/0 11/11 8/9 7/8 0/1Opponents 2/2 8/9 8/8 7/10 2/3
Cundiff: (25G) (38G) (51N, 49G) (46N, 33G) (37G) (26G, 25G) (41G, 48G, 38G) (26G, 39G, 37N, 20G, 24G) () (22G, 33G, 49G) (45G) (24G) () (33G, 32G, 27G) (27G, 40G) (25G, 47G)Opponents: (23G, 28G, 48G) (36G, 30G, 46G, 38G, 25G) (38G) (49N, 45N) (38G) (38G, 24G, 35G) (21G, 50G) (19G, 46N) (28G, 51G) (45G, 40G) (22G) (45G, 19G) (52N, 24G, 42G) (47G) (30G) (29N)
2010 STATISTICS
PASSING ATT COMP YARDS COMP% YDS/ATT TD TD% INT INT% LG SACK/LOST RATINGFlacco 489 306 3622 62.6 7.41 25 5.1 10 2.0 67 40/294 93.6Boldin 1 1 -6 100.0 -6.00 0 0.0 0 0.0 -6 0/0 79.2Koch 1 1 13 100.0 13.00 0 0.0 0 0.0 13 0/0 118.8RAVENS 491 308 3629 62.7 7.39 25 5.1 10 2.0 67 40/294 93.6Opponents 596 349 3789 58.6 6.36 22 3.7 19 3.2 88t 27/190 76.4

2019 BALTIMORE RAVENS MEDIA GUIDE384
2010 STATISTICS
ORGANIZ
ATIO
N P
LAYERS 20
10 R
EVIE
W H
ISTORY R
ECORDS G
AM
E D
AY
266 BALTIMORE RAVENS FAN & MEDIA GUIDE 2011
OFFENSE WR 85 Derrick Mason LT 74 Michael Oher LG 66 Ben Grubbs C 77 Matt Birk RG 65 Chris Chester RT 73 Marshal Yanda TE 86 Todd Heap WR 81 Anquan Boldin QB 5 Joe Flacco RB 27 Ray Rice FB 33 Le’Ron McClain
DEFENSE DT 92 Haloti Ngata NT 97 Kelly Gregg DE 93 Cory Redding SAM 95 Jarret Johnson MIKE 52 Ray Lewis WILL 53 Jameel McClain RUSH 55 Terrell Suggs LCB 25 Chris Carr RCB 37 Josh Wilson SS 26 Dawan Landry FS 20 Ed Reed
John Harbaugh, Head Coach; Jerry Rosburg, Asst. Head Coach/Special Teams Coordinator; Cam Cameron, Offensive Coordinator; Greg Mattison, Defensive Coordinator; Roy Anderson, Defensive Asst./Secondary; Clarence Brooks, Defensive Line; Jason Brooks, Asst. to the Offense; John Dunn, Asst. Strength and Conditioning; Wade Harman, Tight Ends; Jim Hostler, Wide Receivers; Marwan Maalouf, Asst. Special Teams; John Matsko, Offensive Line; Andy Moeller, Asst. Offensive Line; Ted Monachino, Outside Linebackers; Wilbert Montgomery, Running Backs; Chuck Pagano, Secondary; Dean Pees, Linebackers; Bob Rogucki, Strength and Conditioning; Al Saunders, Senior Offensive Asst.; Craig Ver Steeg, Offensive Asst.; Matt Weiss, Head Coach’s Asst.; Jim Zorn, Quarterbacks
AP All-Pro:LB Ray Lewis (1st Team), FB Le’Ron McClain (2nd Team) DT Haloti Ngata (2nd Team), S Ed Reed (2nd Team)RB Ray Rice (2nd Team)
Pro Bowl:K Billy Cundiff (starter), LB Ray Lewis (starter), DT Haloti Ngata (starter), S Ed Reed (starter), LB Terrell Suggs
Pro Bowl Alternate:G Ben Grubbs (first), P Sam Koch (first)
Pro Football Weekly/PFWA’s All-NFL Team:K Billy Cundiff, DT Haloti Ngata, S Ed Reed
Pro Football Weekly Golden Toe: K Billy Cundiff
USA Today’s All-Joe Team: DE Cory Redding
NFL Players of the Week:WR Anquan Boldin (Week 4) - OffenseDT Haloti Ngata (Week 9) - DefenseWR/RS David Reed (Week 14) - Special TeamsRB Ray Rice (Week 15) - OffenseS Ed Reed (Week 16) - Defense
NFL Players of the Month:S Ed Reed (Defense, December)LB Terrell Suggs (Defense, November)
Ed Block Courage Award: WR Donte’ Stallworth
Ravens Roost Unsung Hero: K Billy Cundiff
Ravens Roost Extra Effort: LB Terrell Suggs
Reg. Post.Record . . . . . . . . . . . . . . . . . . . . . . . . . . . . . . . . . . . . . 12-4 . . . . . . 1-1vs. AFC North . . . . . . . . . . . . . . . . . . . . . . . . . . . . . . . . 4-2 . . . . . . 0-1vs. AFC . . . . . . . . . . . . . . . . . . . . . . . . . . . . . . . . . . . . . . 9-3 . . . . . . 1-1vs. NFC. . . . . . . . . . . . . . . . . . . . . . . . . . . . . . . . . . . . . . 3-1 . . . . . . 0-0Home . . . . . . . . . . . . . . . . . . . . . . . . . . . . . . . . . . . . . . . 7-1 . . . . . . 0-0Away . . . . . . . . . . . . . . . . . . . . . . . . . . . . . . . . . . . . . . . . 5-3 . . . . . . 1-1On Grass . . . . . . . . . . . . . . . . . . . . . . . . . . . . . . . . . . . . 4-0 . . . . . . 1-1Artificial Turf . . . . . . . . . . . . . . . . . . . . . . . . . . . . . . . . . . 8-4 . . . . . . 0-0Outdoors. . . . . . . . . . . . . . . . . . . . . . . . . . . . . . . . . . . . 11-3 . . . . . . 1-1Indoors . . . . . . . . . . . . . . . . . . . . . . . . . . . . . . . . . . . . . . 1-1 . . . . . . 0-0Leading at Halftime. . . . . . . . . . . . . . . . . . . . . . . . . . . . 11-2 . . . . . . 1-1Trailing at Halftime . . . . . . . . . . . . . . . . . . . . . . . . . . . . . 1-2 . . . . . . 0-0Tied at Halftime. . . . . . . . . . . . . . . . . . . . . . . . . . . . . . . . 0-0 . . . . . . 0-0Tied After 3 Quarters . . . . . . . . . . . . . . . . . . . . . . . . . . . 0-0 . . . . . . 0-1Leading After 3 Quarters. . . . . . . . . . . . . . . . . . . . . . . . 12-2 . . . . . . 1-0Trailing After 3 Quarters . . . . . . . . . . . . . . . . . . . . . . . . . 0-2 . . . . . . 0-0Decided by 7 Points or less . . . . . . . . . . . . . . . . . . . . . . 8-4 . . . . . . 0-1Decided by 3 Points or less . . . . . . . . . . . . . . . . . . . . . . 3-2 . . . . . . 0-0
Reg. Post.When Scoring First . . . . . . . . . . . . . . . . . . . . . . . . . . . . . 7-2 . . . . . . 1-0When Not Scoring First. . . . . . . . . . . . . . . . . . . . . . . . . . 5-2 . . . . . . 0-1Positive or even Turnover Ratio . . . . . . . . . . . . . . . . . 91-21 . . . . . . 1-0Negative Turnover Ratio . . . . . . . . . . . . . . . . . . . . . . . . . 3-2 . . . . . . 0-1Winning Penalty Ratio . . . . . . . . . . . . . . . . . . . . . . . . . 18-2 . . . . . . 1-1Losing Penalty Ratio. . . . . . . . . . . . . . . . . . . . . . . . . . . . 3-1 . . . . . . 0-0Overtime. . . . . . . . . . . . . . . . . . . . . . . . . . . . . . . . . . . . . 2-1 . . . . . . 0-0With a 100-Yard Rusher . . . . . . . . . . . . . . . . . . . . . . . . . 2-0 . . . . . . 0-0With a 100-Yard Receiver . . . . . . . . . . . . . . . . . . . . . . . . 2-2 . . . . . . 1-0Without a 100-yard Rusher . . . . . . . . . . . . . . . . . . . . . . 10-4 . . . . . . 1-1Without a 100-yard Receiver. . . . . . . . . . . . . . . . . . . . . 10-2 . . . . . . 0-1When Allowing a 100-Yard Rusher . . . . . . . . . . . . . . . . . 3-0 . . . . . . 0-0When Not Allowing a 100-Yard Rusher. . . . . . . . . . . . . . 9-4 . . . . . . 1-1When Allowing a 100-Yard Receiver . . . . . . . . . . . . . . . . 4-1 . . . . . . 0-0When Not Allowing a 100-Yard Receiver . . . . . . . . . . . . 8-3 . . . . . . 1-1With a 300-Yard Passer . . . . . . . . . . . . . . . . . . . . . . . . . 1-0 . . . . . . 0-0Without a 300-Yard Passer . . . . . . . . . . . . . . . . . . . . . . 11-4 . . . . . 1-1When Allowing a 300-Yard Passer . . . . . . . . . . . . . . . . . 4-1 . . . . . . 0-0When Not Allowing a 300-Yard Passer . . . . . . . . . . . . . . 8-3 . . . . . . 1-1
YDS RET.PLAYER TT SOLO AS SACKS LOST INT YDS PD FF FRLewis, Ray 145 103 42 2 8 2 26 4 2 3Landry, Dawan 111 83 28 1 10 0 23 3 1 1McClain, Jameel 91 58 33 1 3 0 0 2 0 1Johnson, Jarret 77 50 27 1.5 10 0 0 2 2 0Carr, Chris 67 56 11 0 0 2 13 8 3 0Ngata, Haloti 65 48 17 5.5 43 0 0 5 0 1Webb, Lardarius 60 56 4 0 0 2 32 11 0 1Suggs, Terrell 58 38 20 11 73 0 0 2 2 0Gregg, Kelly 39 22 17 0 0 0 0 0 0 0Reed, Ed 39 29 10 0 0 8 183 16 1 0Redding, Cory 38 29 9 3 21 1 0 4 0 0Wilson, Josh 36 35 1 0 0 3 12 15 0 0Washington, Fabian 31 27 4 0 0 0 0 8 0 0Ellerbe, Dannell 29 22 7 1 13 0 0 1 0 0Nakamura, Haruki 16 12 4 0 0 0 0 1 0 0Zbikowski, Tom 16 11 5 0 0 0 0 1 0 0Gooden, Tavares 14 11 3 0 0 0 0 0 0 0Cody, Terrence 13 5 8 0 0 0 0 0 0 0McKinney, Brandon 9 5 4 0 0 0 0 0 0 0Hamlin, Ken 3 2 1 0 0 1 0 1 0 0Ayanbadejo, Brendon 2 2 0 0 0 0 0 0 1 0Burgess, Prescott 2 0 2 0 0 0 0 0 0 0Pryce, Trevor 1 0 1 0 0 0 0 0 0 0Kruger, Paul 1 1 0 1 9 0 0 2 0 0Totals 963 705 258 27 190 19 289 86 12 7
PLAYER TT SOLO AS FF FR BKBurgess, Prescott 15 13 2 0 0 0Nakamura, Haruki 13 13 0 0 0 0Parmele, Jalen 12 10 2 1 0 0Reed, David 11 10 1 1 0 0Ellerbe, Dannell 6 3 3 0 0 0McClain, Jameel 6 3 3 0 0 0Phillips, Jason 6 4 2 1 0 0Williams, Cary 6 6 0 0 0 0Landry, Dawan 5 3 2 0 0 0Smith, Marcus 5 4 1 0 0 0Ayanbadejo, Brendon 4 2 2 0 0 0Dickson, Ed 3 3 0 0 0 0Gooden, Tavares 3 2 1 0 0 0Cox, Morgan 2 1 1 0 0 0Cundiff, Billy 2 2 0 0 0 0Jones, Edgar 2 2 0 1 0 0Wilson, Josh 2 2 0 0 1 0Hamlin, Ken 1 0 1 0 1 0Koch, Sam 1 1 0 0 0 0Pitta, Dennis 1 1 0 0 0 0Stallworth, Donte 1 1 0 0 0 0Washington, Fabian 1 1 0 0 0 0Totals 108 87 21 4 2 0
DEFENSIVE SPECIAL TEAMS
SEASON TRENDS
COACHES
RAVENS HONOR ROLL
USUAL STARTERS
FROM COACHES VIDEO FROM COACHES VIDEO

BALTIMORERAVENS.COM 385
2010 POSTSEASON STATISTICS
GAM
E D
AY
RECORDS
HIS
TORY
2010
REVIE
W
PLAYERS
ORGANIZ
ATIO
N
267BALTIMORERAVENS.COM
2010 POSTSEASON STATISTICS
YDS RET.PLAYER TT SOLO AS SACKS LOST INT YDS PD FF FRLandry, Dawan 14 7 7 0.5 2 1 9 2 0 0Lewis, Ray 13 9 4 1 10 0 0 0 1 0Suggs, Terrell 10 9 1 5 25 0 0 0 1 0McClain, Jameel 9 4 5 0 0 0 0 0 0 0Carr, Chris 8 7 1 0 0 0 0 0 0 1Ellerbe, Dannell 7 5 2 0 0 0 0 0 1 0Reed, Ed 7 6 1 0 0 0 0 0 0 1Webb, Lardarius 5 5 0 0 0 0 0 0 0 0Gregg, Kelly 4 0 4 0 0 0 0 0 0 0Johnson, Jarret 4 2 2 0 0 0 0 0 0 0Ngata, Haloti 4 3 1 0.5 2 0 0 1 0 0Wilson, Josh 4 4 0 0 0 1 0 3 0 0McKinney, Brandon 3 2 1 0 0 0 0 1 0 1Cody, Terrence 2 1 1 0 0 0 0 0 1 0Nakamura, Haruki 2 2 0 1 3 1 3 1 0 0Redding, Cory 2 0 2 0.5 4.5 0 0 0 0 1Kruger, Paul 1 0 1 0.5 4.5 0 0 0 0 0Totals 99 66 33 9 51 3 12 8 4 4
PLAYER TT SOLO AS FF FR BKAyandadejo, Brendan 4 1 3 0 0 0Burgess, Prescott 3 2 1 0 0 0Ellerbe, Dannell 2 1 1 0 0 0Gooden, Tavares 2 2 0 0 0 0McClain, Jameel 2 2 0 0 0 0Parmele, Jalen 2 1 1 0 0 0Cundiff, Billy 1 1 0 0 0 0Dickson, Ed 1 0 1 0 0 0Landry, Dawan 1 1 0 0 0 0Nakamura, Haruki 1 0 1 0 0 0Smith, Marcus 1 0 1 0 0 0Totals 20 11 9 0 0 0
RESULTS AND ATTENDANCEWON 1, LOST 101/09 W 30-7 at Kansas City 72,19001/15 L 24-31 at Pittsburgh 64,879
TEAM STATISTICS RAVENS OPPONENTTOTAL FIRST DOWNS 28 37 Rushing 6 13 Passing 27 13 Penalty 5 3 3rd Down: Made/Att 14/29 8/22 3rd Down Pct. 48.3 36.4 4th Down: Made/Att 1/2 1/3 4th Down Pct. 50.0 33.3POSSESSION AVG. 33:38 26:22TOTAL NET YARDS 516 424 Avg. Per Game 258.0 212.0 Total Plays 131 109 Avg. Per Play 3.9 3.9NET YARDS RUSHING 177 179 Avg. Per Game 88.5 89.5 Total Rushes 58 50NET YARDS PASSING 339 245 Avg. Per Game 169.5 122.5 Sacked/Yards Lost 9/51 9/51 Gross Yards 390 296 Att./Completions 64/41 50/28 Completion Pct. 64.1 56.0 Had Intercepted 1 3PUNTS/AVERAGE 6/46.2 7/49.6NET PUNTING AVG. 6/39.2 7/35.7PENALTIES/YARDS 8/94 14/133FUMBLES/BALL LOST 5/4 4/4TOUCHDOWNS 6 5 Rushing 2 3 Passing 3 2 Returns 1 0
SCORE BY PERIODS 1 2 3 4 OT PTSRAVENS 7 14 13 10 0 54OPPONENTS 14 0 14 10 0 38
SCORING TD RU PA RT K/PAT FG S PTSCundiff 0 0 0 0 6/6 4/4 0 18Rice 2 1 1 0 0 12Boldin 1 0 1 0 0 6Heap 1 0 1 0 0 6McGahee 1 1 0 0 0 6Redding 1 0 0 1 0 6RAVENS 6 2 3 1 6/6 4/4 0 54OPPONENTS 5 3 2 0 5/5 1/2 0 38
2-PT. CONVERSIONS: RAVENS 0-1, Opponents 0-0
SACKS: Suggs 5, Lewis 1, Nakamura 1, Kruger 0.5, Landry 0.5, Ngata 0.5, Redding 0.5, RAVENS 9, OPPONENTS 9
FUM/LOST: Flacco 3/2, Nakamura 1/1, Rice 1/1
RUSHING NO YDS AVG LG TDRice 29 89 3.1 14t 1McGahee 14 48 3.4 25t 1Flacco 9 25 2.8 13 0Parmele 4 13 3.3 6 0L. McClain 1 1 1.0 1 0Stallworth 1 1 1.0 1 0RAVENS 58 177 3.1 25t 2OPPONENTS 50 179 3.6 41t 3
RECEIVING NO YDS AVG LG TDHeap 13 151 11.6 21 1Rice 12 74 6.2 11 1Boldin 6 62 10.3 27 1Houshmandzadeh 4 66 16.5 28 0McGahee 4 24 6.0 10 0Mason 1 11 11.0 11 0Dickson 1 2 2.0 2 0RAVENS 41 390 9.5 28 3OPPONENTS 28 296 10.6 58 2
INTERCEPTIONS NO YDS AVG LG TDLandry 1 9 9.0 9 0Nakamura 1 3 3.0 3 0Wilson 1 0 0.0 0 0RAVENS 3 12 4.0 9 0OPPONENTS 1 17 17.0 17 0
PUNTING NO YDS AVG NET TB IN LG BLKKoch 6 277 46.2 39.2 1 4 61 0RAVENS 6 277 46.2 39.2 1 4 61 0Opponents 7 347 49.6 35.7 3 2 55 0
PUNT RETURNS RET FC YDS AVG LG TDWebb 2 1 37 18.5 36 0RAVENS 2 1 37 18.5 36 0Opponents 3 1 22 7.3 12 0
KICKOFF RETURNS NO YDS AVG LG TDParmele 3 65 21.7 29 0L. McClain 2 22 11.0 12 0Webb 2 59 29.5 38 0RAVENS 7 146 20.9 38 0Opponents 9 184 20.4 36 0
FIELD GOALS 1-19 20-29 30-39 40-49 50+Cundiff 1/1 3/3 0/0 0/0 0/0RAVENS 1/1 3/3 0/0 0/0 0/0OPPONENTS 0/0 0/0 1/1 0/1 0/0
Cundiff: (19G,29G,29G)(24G)OPPONENTS: ()(43N,35G)
PASSING ATT COMP YARDS COMP% YDS/ATT TD TD% INT INT% LG SACK/LOST RATINGFlacco 64 41 390 64.1 6.09 3 4.7 1 1.6 28 9/51 90.0RAVENS 64 41 390 64.1 6.09 3 4.7 1 1.6 28 9/51 90.0OPPONENTS 50 28 296 56.0 5.92 2 4.0 3 6.0 58 9/51 61.8
DEFENSIVE SPECIAL TEAMSFROM PRESS BOX STATS FROM PRESS BOX STATS

2019 BALTIMORE RAVENS MEDIA GUIDE386
2011 STATISTICSRESULTS AND ATTENDANCEWON 12, LOST 4 (AFC NORTH CHAMPIONS)AFC CHAMPIONSHIP GAME09/11 W 35-7 Pittsburgh 71,43409/18 L 13-26 at Tennessee 69,14309/25 W 37-7 at St. Louis 56,28910/02 W 34-17 New York Jets 71,24710/16 W 29-14 Houston 71,15410/24 L 7-12 at Jacksonville 62,97610/30 W 30-27 Arizona 71,02211/06 W 23-20 at Pittsburgh 64,85111/13 L 17-22 at Seattle 66,52211/20 W 31-24 Cincinnati 71,32011/24 W 16-6 San Francisco 71,34512/04 W 24-10 at Cleveland 63,64812/11 W 24-10 Indianapolis 71,18712/18 L 14-34 at San Diego 67,24212/24 W 20-14 Cleveland 71,08301/01 W 24-16 at Cincinnati 63,439
TEAM STATISTICS RAVENS OPPONENTTOTAL FIRST DOWNS 312 269 Rushing 98 79 Passing 181 166 Penalty 33 24 3rd Down: Made/Att 97/229 71/221 3rd Down Pct. 42.4% 32.1% 4th Down: Made/Att 4/7 10/21 4th Down Pct. 57.1% 47.6%POSSESSION AVG. 30:35 29:25TOTAL NET YARDS 5419 4622 Avg. Per Game 338.7 288.9 Total Plays 1036 1002 Avg. Per Play 5.2 4.6NET YARDS RUSHING 1996 1482 Avg. Per Game 124.8 92.6 Total Rushes 459 419NET YARDS PASSING 3423 3140 Avg. Per Game 213.9 196.3 Sacked/Yards Lost 33/206 48/290 Gross Yards 3629 3430 Attempts/Completions 544/314 535/288 Completion Pct. 57.7% 53.8% Had Intercepted 12 15PUNTS/AVERAGE 73/46.5 86/43.6NET PUNTING AVG. 38.6 38.4PENALTIES/YARDS 92/742 103/1032FUMBLES/BALL LOST 24/12 27/11TOUCHDOWNS 41 26 Rushing 15 10 Passing 21 11 Returns 5 5
SCORE BY PERIODS 1 2 3 4 OT PTSRAVENS 95 110 78 95 0 378Opponents 43 86 71 66 0 266SCORING TD RU PA RT K/PAT FG S PTSCundiff 0 0 0 0 38/38 28/37 0 122Rice 15 12 3 0 0/0 0/0 0 90T. Smith 7 0 7 0 0/0 0/0 0 42Dickson 5 0 5 0 0/0 0/0 0 30Boldin 3 0 3 0 0/0 0/0 0 18Pitta 3 0 3 0 0/0 0/0 0 18Webb 2 0 0 2 0/0 0/0 0 12R. Williams 2 2 0 0 0/0 0/0 0 12Graham 0 0 0 0 2/2 2/2 0 8 Flacco 1 1 0 0 0/0 0/0 0 6Johnson 1 0 0 1 0/0 0/0 0 6McClain 1 0 0 1 0/0 0/0 0 6Ngata 1 0 0 1 0/0 0/0 0 6Koch 0 0 0 0 0/0 0/0 0 2RAVENS 41 15 21 5 40/40 30/39 0 378Opponents 26 10 11 5 26/26 28/31 0 2662-PT. CONVERSIONS: Koch 1, RAVENS 1-1, Opponents 0-0SACKS: Suggs 14, McPhee 6, Kruger 5.5, Ngata 5, Redding 4.5, Johnson 2.5, Lewis 2, Pollard 2, Ayanbadejo 1.5, Carr 1, McClain 1, E. Reed 1, Webb 1, Zbikowski 1, RAVENS 48, Opponents 33FUM/LOST: Flacco 11/6, D. Reed 3/2, Rice 2/2, Webb 2/0, R. Williams 2/2, L. Williams 2/0, J. Smith 1/0, T. Smith 1/0
PASSING ATT COMP YARDS COMP% YDS/ATT TD TD% INT INT% LG SACK/LOST RATINGFlacco 542 312 3610 57.6% 6.7 20 3.7% 12 2.2% 74t 31/203 80.9Rice 1 1 1 100.0% 1.0 1 100.0% 0 0.0% 1t 0/0 118.8Taylor 1 1 18 100.0% 18.0 0 0.0% 0 0.0% 18 2/3 118.8RAVENS 544 314 3629 57.7% 6.7 21 3.9% 12 2.2% 74t 33/206 81.7Opponents 535 288 3430 53.8% 6.4 11 2.1% 15 2.8% 66 48/290 68.8
RUSHING NO YDS AVG LG TDRice 291 1364 4.7 70t 12R. Williams 108 444 4.1 28 2Flacco 39 88 2.3 33 1T. Smith 4 39 9.8 16 0Leach 12 35 2.9 6 0D. Reed 1 16 16.0 16 0Allen 3 8 2.7 3 0Taylor 1 2 2.0 2 0RAVENS 459 1996 4.3 70t 15Opponents 419 1482 3.5 25t 10
RECEIVING NO YDS AVG LG TDRice 76 704 9.3 52 3Boldin 57 887 15.6 56 3Dickson 54 528 9.8 25 5T. Smith 50 841 16.8 74t 7Pitta 40 405 10.1 39 3Leach 15 69 4.6 11 0R. Williams 13 83 6.4 18 0Evans 4 74 18.5 32 0L. Williams 4 46 11.5 15 0Flacco 1 -8 -8.0 -8 0RAVENS 314 3629 11.6 74t 21Opponents 288 3430 11.9 66 11
INTERCEPTIONS NO YDS AVG LG TDWebb 5 81 16.2 73t 1E. Reed 3 25 8.3 16 0J. Smith 2 48 24.0 32 0Suggs 2 9 4.5 9 0McClain 1 8 8.0 8 0Lewis 1 4 4.0 4 0Pollard 1 0 0.0 0 0RAVENS 15 175 11.7 73t 1Opponents 12 159 13.3 45 1
PUNTING NO YDS AVG NET TB IN LG BLKKoch 73 3393 46.5 38.6 9 21 63 0RAVENS 73 3393 46.5 38.6 9 21 63 0Opponents 86 3746 43.6 38.4 5 25 65 0
PUNT RETURNS RET FC YDS AVG LG TDWebb 30 20 301 10.0 68t 1E. Reed 3 5 29 9.7 16 0Carr 2 2 15 7.5 8 0L. Williams 1 0 0 0.0 0 0RAVENS 36 27 345 9.6 68t 1Opponents 33 11 392 11.9 84t 2
KICKOFF RETURNS NO YDS AVG LG TDD. Reed 18 534 29.7 77 0Zbikowski 9 209 23.2 30 0L. Williams 5 109 21.8 37 0Leach 2 29 14.5 15 0McCann 2 53 26.5 27 0Webb 2 59 29.5 37 0Carr 1 20 20.0 20 0E. Jones 1 0 0.0 0 0Nakamura 1 8 8.0 8 0T. Smith 1 24 24.0 24 0Mattison 0 2 0.0 2 0RAVENS 42 1047 24.9 77 0Opponents 36 1050 29.2 107t 1
FIELD GOALS 1-19 20-29 30-39 40-49 50+Cundiff 1/1 9/9 10/12 7/9 1/6Graham 0/0 0/0 0/0 2/2 0/0RAVENS 1/1 9/9 10/12 9/11 1/6Opponents 0/0 8/8 9/12 7/7 4/4
Cundiff: (29G,30G) (41G,29G) (51N,51N,21G,31G,38G) (38G,38G)(43G,48G, 25G,33G,40G) (52N) (26G,47G,25G) (18G,40N,43G,51G)(50N,52N,35G) (22G) (39G,23G,39G) (34N,41N,21G) (36G) (36N) () (42G)Graham: ()()()()()()()()()()()()()()(48G,43G)()Opponents: () (34N,25G,43G,39G,33G) () (40G) () (54G,54G,22G,51G) (32G,45G) (36G,30G) (22G,38G,39G,35G,30G) (27G) (45G,52G) (21G) (22G)(45G,37N,28G) () (46G,36N,46G,23G)

BALTIMORERAVENS.COM 387
2011 STATISTICS
OFFENSE WR 81 Anquan Boldin LT 78 Bryant McKinnie LG 66 Ben Grubbs C 77 Matt Birk RG 73 Marshal Yanda RT 74 Michael Oher TE 84 Ed Dickson WR 82 Torrey Smith QB 5 Joe Flacco RB 27 Ray Rice FB 44 Vonta Leach
DEFENSE DT 92 Haloti Ngata NT 62 Terrence Cody DE 93 Cory Redding SAM 95 Jarret Johnson MIKE 52 Ray Lewis WILL 53 Jameel McClain RUSH 55 Terrell Suggs LCB 21 Lardarius Webb RCB 29 Cary Williams SS 31 Bernard Pollard FS 20 Ed Reed
John Harbaugh, Head Coach; Jerry Rosburg, Assistant Head Coach/Special Teams Coordinator; Cam Cameron, Offensive Coordinator; Chuck Pagano, Defensive Coordinator; Roy Anderson, Defensive Assistant/Secondary; Teryl Austin, Secondary; Clarence Brooks, Defensive Line; Jason Brooks, Offensive Quality Control; Randy Brown, Kicking Consultant; John Dunn, Assistant Strength and Conditioning; Wade Harman, Tight Ends; Jim Hostler, Wide Receivers; Marwan Maalouf, Assistant Special Teams; Andy Moeller, Offensive Line; Ted Monachino, Outside Linebackers; Wilbert Montgomery, Running Backs; Dean Pees, Linebackers; Bob Rogucki, Strength and Conditioning; Craig Ver Steeg, Offensive Assistant/Quarterbacks; Todd Washington, Assistant Offensive Line; Matt Weiss, Head Coach’s Assistant
Def. Player of the Year (AP): OLB Terrell SuggsDef. Player of the Year (PFW/PFWA): OLB Terrell Suggs Def. Player of the Year (KC NFL 101): OLB Terrell Suggs
AP All-Pro: OLB Terrell Suggs (1st Team), DT Haloti Ngata (1st Team), S Ed Reed (2nd Team), RB Ray Rice (2nd Team)
Pro Bowl: G Ben Grubbs, FB Vonta Leach (starter), LB Ray Lewis (starter), DT Haloti Ngata (starter), S Ed Reed (starter), RB Ray Rice (starter), OLB Terrell Suggs (starter), G Marshal Yanda
Pro Football Weekly/PFWA’s All-NFL Team:DT Haloti Ngata, OLB Terrell Suggs
AFC Players of the Week:OLB Terrell Suggs (Week 1) - DefenseLB Ray Lewis (Week 3) - DefenseOLB Jarret Johnson (Week 4) - DefenseWR Torrey Smith (Week 11) - OffenseOLB Terrell Suggs (Week 12) - DefenseRB Ray Rice (Week 13) - OffenseOLB Terrell Suggs (Week 14) - DefenseRB Ray Rice (Week 17) - Offense
AFC Player of the Month:OLB Terrell Suggs (Defense, December/January)
Walter Payton NFL Man of the Year: C Matt Birk
Ed Block Courage Award: LS Morgan Cox
Ravens Roost Unsung Hero: G Marshal Yanda
Ravens Roost Extra Effort: WR Torrey Smith
Reg. Post.Record ...................................................................................................12-4 ........... 1-1vs. AFC North .........................................................................................6-0 ...........0-0vs. AFC ....................................................................................................9-3 ........... 1-1vs. NFC ....................................................................................................3-1 ...........0-0Home .......................................................................................................8-0 ........... 1-0Away ........................................................................................................4-4 ...........0-1On Grass .................................................................................................2-3 ...........0-0Artificial Turf ...........................................................................................10-1 ........... 1-1Outdoors ................................................................................................ 11-4 ........... 1-1Indoors .....................................................................................................1-0 ...........0-0Leading at Halftime ................................................................................ 11-0 ........... 1-0Trailing at Halftime ...................................................................................1-3 ...........0-1Tied at Halftime ........................................................................................0-1 ...........0-0Tied After 3 Quarters ...............................................................................1-0 ...........0-0Leading After 3 Quarters ........................................................................10-0 ........... 1-1Trailing After 3 Quarters ...........................................................................1-4 ...........0-0Decided by 7 Points or less .....................................................................3-2 ........... 1-1Decided by 3 Points or less .....................................................................2-0 ...........0-1
Reg. Post.When Scoring First ................................................................................10-0 ...........0-0When Not Scoring First ............................................................................2-4 ........... 1-1Positive or even Turnover Ratio ...............................................................9-0 ........... 1-1Negative Turnover Ratio ..........................................................................3-4 ...........0-0Winning Penalty Ratio .............................................................................6-1 ........... 1-0Losing Penalty Ratio ................................................................................4-2 ...........0-1Overtime ..................................................................................................0-0 ...........0-0With a 100-Yard Rusher ...........................................................................6-0 ...........0-0Without a 100-yard Rusher ......................................................................6-4 ........... 1-1With a 100-Yard Receiver ........................................................................4-0 ...........0-1Without a 100-yard Receiver....................................................................8-4 ........... 1-0With a 300-Yard Passer ...........................................................................4-0 ...........0-1Without a 300-Yard Passer ......................................................................8-4 ........... 1-0When Allowing a 100-Yard Rusher ..........................................................1-2 ........... 1-0When Not Allowing a 100-Yard Rusher .................................................. 11-2 ...........0-1When Allowing a 100-Yard Receiver ........................................................3-1 ........... 1-0When Not Allowing a 100-Yard Receiver .................................................9-3 ...........0-1When Allowing a 300-Yard Passer ...........................................................2-1 ...........0-0When Not Allowing a 300-Yard Passer ....................................................9-3 ........... 1-1
YDS RET.PLAYER TT SOLO AS SACKS LOST INT YDS PD FF FRLewis, Ray 95 72 23 2 16 1 4 7 2 0McClain, Jameel 81 47 34 1 4 1 8 5 0 2Williams, Cary 77 61 16 0 0 0 0 18 2 0Pollard, Bernard 75 55 20 2 14 1 0 13 3 1Suggs, Terrell 70 50 20 14 91 2 9 6 7 0Webb, Lardarius 68 55 13 1 5.5 5 81 20 1 0Ngata, Haloti 65 37 28 5 21 0 0 5 2 3Johnson, Jarret 56 40 16 2.5 20.5 0 0 3 1 1Reed, Ed 52 44 8 1 4 3 25 8 1 0Redding, Cory 43 29 14 4.5 25 0 0 2 0 1Cody, Terrence 34 21 13 0 0 0 0 1 0 0Ayanbadejo, Brendon 27 23 4 1.5 9 0 0 2 0 1McPhee, Pernell 23 16 7 6 31 0 0 2 1 1Carr, Chris 19 16 3 1 9 0 0 3 0 0Jones, Arthur 18 12 6 0 0 0 0 0 0 0Smith, Jimmy 18 18 0 0 0 2 48 8 0 0Ellerbe, Dannell 17 13 4 0 0 0 0 0 0 0Zbikowski, Tom 16 14 2 1 1 0 0 0 0 0Kruger, Paul 15 12 3 5.5 39 0 0 2 0 2McKinney, Brandon 14 8 6 0 0 0 0 0 1 0McClellan, Albert 7 5 2 0 0 0 0 0 0 0Brown, Chykie 3 3 0 0 0 0 0 1 0 0Gorrer, Danny 3 3 0 0 0 0 0 4 0 0Nakamura, Haruki 3 2 1 0 0 0 0 2 0 0Foxworth, Domonique 2 1 1 0 0 0 0 0 0 0Burgess, Prescott 1 0 1 0 0 0 0 0 0 0Totals 902 657 245 48 290 15 175 112 21 12
PLAYER TT SOLO AS FF FR BKMcClellan, Albert 12 10 2 0 0 0Ayanbadejo, Brendon 9 9 0 0 1 0Nakamura, Haruki 9 8 1 0 0 0Zbikowski, Tom 7 7 0 0 0 0Reed, David 4 3 1 0 0 0Williams, LaQuan 4 3 1 0 0 0Wilson, Kris 4 4 0 0 0 0Jones, Edgar 3 3 0 0 0 0Burgess, Prescott 2 2 0 0 0 0Cook, Emanuel 2 2 0 0 0 0Gorrer, Danny 2 2 0 0 0 0McClain, Jameel 2 2 0 0 0 0Pitta, Dennis 2 1 1 0 0 0Smith, Jimmy 2 2 0 0 0 0Williams, Chavis 2 1 1 0 0 0Brown, Chykie 1 1 0 0 0 0Ellerbe, Dannell 1 1 0 0 0 0Jones, Arthur 1 1 0 0 0 0Koch, Sam 1 1 0 0 0 0McCann, Bryan 1 0 1 0 0 0Totals 71 63 8 0 1 0
Defensive and special teams statistics reflect press box stats.
DEFENSIVE STATISTICS SPECIAL TEAMS STATISTICS
USUAL STARTING L INEUPS RAVENS COACHES
RAVENS HONOR ROLL
RAVENS SEASON TRENDS

2019 BALTIMORE RAVENS MEDIA GUIDE388
2011 POSTSEASON STATISTICS
YDS RET.PLAYER TT SOLO AS SACKS LOST INT YDS PD FF FRLewis, Ray 20 12 8 0 0 0 0 1 0 0Pollard, Bernard 17 10 7 0 0 0 0 1 0 0Suggs, Terrell 11 7 4 0 0 0 0 1 0 0Reed, Ed 10 9 1 0 0 1 0 6 0 0Webb, Lardarius 10 8 2 0 0 3 1 5 0 0Williams, Cary 10 5 5 0 0 0 0 0 0 0Cody, Terrence 8 3 5 0 0 0 0 0 0 0Ellerbe, Dannell 6 3 3 0 0 0 0 0 0 0Johnson, Jarret 6 3 3 0 0 0 0 0 0 0Ngata, Haloti 6 2 4 0 0 0 0 1 1 0Redding, Cory 5 3 2 0 0 0 0 1 0 0Kruger, Paul 3 2 1 1 5 0 0 0 0 0McClain, Jameel 3 2 1 0 0 0 0 0 0 0McKinney, Brandon 3 1 2 0 0 0 0 0 0 0Smith, Jimmy 3 1 2 0 0 1 39 1 0 0Ayanbadejo, Brendon 2 0 2 0 0 0 0 0 0 0Nakamura, Haruki 1 0 1 0 0 0 0 0 0 0Jones, Art 1 0 1 0 0 0 0 0 0 0McPhee, Pernell 0 0 0 0 0 0 0 1 0 0Totals 125 71 54 1 5 5 40 18 1 0
PLAYER TT SOLO AS FF FR BKNakamura, Haruki 4 2 2 0 0 0Cook, Emanuel 2 2 0 0 1 0Jones, Edgar 2 2 0 0 0 0McClellan, Albert 2 2 0 0 1 0Zbikowski, Tom 2 1 1 0 0 0Ayanbadejo, Brendon 1 1 0 0 0 0Gorrer, Danny 1 1 0 0 0 0McClain, Jameel 1 0 1 0 0 0Williams, Cary 1 1 0 1 0 0Williams, LaQuan 1 1 0 1 0 0Smith, Jimmy 0 0 0 0 1 0Totals 17 13 4 2 3 0
Defensive and special teams statistics reflect press box stats.
RESULTS AND ATTENDANCEWON 1, LOST 101/15 W 20-13 Houston (Div.) 71,54701/22 L 20-23 at New England (AFC Champ.) 68,756
TEAM STATISTICS RAVENS OPPONENTTOTAL FIRST DOWNS 30 41 Rushing 8 13 Passing 22 26 Penalty 0 2 3rd Down: Made/Att 13/33 10/26 3rd Down Pct. 39.4 38.5 4th Down: Made/Att 0/2 1/2 4th Down Pct. 0.0 50.0POSSESSION AVG. 32:26 27:34TOTAL NET YARDS 625 645 Avg. Per Game 312.5 322.5 Total Plays 133 131 Avg. Per Play 4.7 4.9NET YARDS RUSHING 203 227 Avg. Per Game 101.5 113.5 Total Rushes 62 59NET YARDS PASSING 422 418 Avg. Per Game 211.0 209.0 Sacked/Yards Lost 8/60 1/5 Gross Yards 482 423 Att./Completions 63/36 71/39 Completion Pct. 57.1 54.9 Had Intercepted 1 5PUNTS/AVERAGE 13/47.6 7/42.4NET PUNTING AVG. 43.7 39.0PENALTIES/YARDS 6/33 4/25FUMBLES/BALL LOST 4/0 5/2TOUCHDOWNS 4 3 Rushing 0 3 Passing 4 0 Returns 0 0
SCORE BY PERIODS 1 2 3 4 OT PTSRAVENS 17 10 10 3 0 40Opponents 6 20 3 7 0 36
SCORING TD RU PA RT K/PAT FG S PTSCundiff 0 0 0 0 4/4 4/5 0 16Boldin 1 0 1 0 0 6Pitta 1 0 1 0 0 6T. Smith 1 0 1 0 0 6Wilson 1 0 1 0 0 6RAVENS 4 0 4 0 4/4 4/5 0 40Opponents 3 3 0 0 3/3 5/6 0 36
2-PT. CONVERSIONS: RAVENS 0-0, Opponents 0-0SACKS: Kruger 1, RAVENS 1, Opponents 8FUM/LOST: Boldin 1/0, Flacco 1/0, Rice 1/0, Webb 1/0
PASSING ATT COMP YARDS COMP% YDS/ATT TD TD% INT INT% LG SACK/LOST RATINGFlacco 63 36 482 57.1 7.65 4 6.3 1 1.6 42 8/60 96.1RAVENS 63 36 482 57.1 7.65 4 6.3 1 1.6 42 8/60 96.1Opponents 71 39 423 54.9 5.96 0 0.0 5 7.0 23 1/5 43.3
RUSHING NO YDS AVG LG TDRice 42 127 3.0 12 0R. Williams 12 49 4.1 9 0Flacco 6 26 4.3 14 0Leach 2 1 0.5 1 0RAVENS 62 203 3.3 14 0Opponents 59 227 3.8 28 3
RECEIVING NO YDS AVG LG TDBoldin 10 174 17.4 37 1Pitta 7 70 10.0 16 1Rice 5 31 6.2 20 0T. Smith 4 91 22.8 42 1Evans 4 69 17.3 30 0Dickson 3 37 12.3 16 0Leach 2 9 4.5 6 0Wilson 1 1 1.0 1t 1RAVENS 36 482 13.4 42 4Opponents 39 423 10.8 23 0
INTERCEPTIONS NO YDS AVG LG TDWebb 3 1 0.3 1 0J. Smith 1 39 39.0 39 0E. Reed 1 0 0.0 0 0RAVENS 5 40 8.0 39 0Opponents 1 19 19.0 19 0
PUNTING NO YDS AVG NET TB IN LG BLKKoch 13 619 47.6 43.7 2 2 64 0RAVENS 13 619 47.6 43.7 2 2 64 0Opponents 7 297 42.4 39.0 1 0 53 0
PUNT RETURNS RET FC YDS AVG LG TDWebb 1 4 4 4.0 4 0RAVENS 1 4 4 4.0 4 0Opponents 9 1 11 1.2 10 0
KICKOFF RETURNS NO YDS AVG LG TDWebb 1 25 25.0 25 0Zbikowski 1 20 20.0 20 0RAVENS 2 45 22.5 25 0Opponents 7 234 33.4 60 0
FIELD GOALS 1-19 20-29 30-39 40-49 50+Cundiff 0/0 1/1 1/2 2/2 0/0RAVENS 0/0 1/1 1/2 2/2 0/0Opponents 0/0 2/2 2/2 1/1 0/1
Cundiff: (48G,44G)(20G,39G,32N)Opponents: (40G,33G,50N)(29G,35G,24G)
DEFENSIVE STATISTICS SPECIAL TEAMS STATISTICS

BALTIMORERAVENS.COM 389
2012 STATISTICSRESULTS AND ATTENDANCEWON 10, LOST 6 (AFC NORTH CHAMPIONS)SUPER BOWL XLVII CHAMPIONS09/10 W 44-13 Cincinnati 71,06409/16 L 23-24 at Philadelphia 69,14409/23 W 31-30 New England 71,26909/27 W 23-16 Cleveland 70,94410/07 W 9-6 at Kansas City 68,80310/14 W 31-29 Dallas 71,38410/21 L 13-43 at Houston 71,70811/04 W 25-15 at Cleveland 65,44911/11 W 55-20 Oakland 71,33911/18 W 13-10 at Pittsburgh 63,44611/25 W 16-13 OT at San Diego 57,88212/02 L 20-23 Pittsburgh 71,44212/09 L 28-31 OT at Washington 81,17812/16 L 17-34 Denver 71,31712/23 W 33-14 New York Giants 71,47012/30 L 17-23 at Cincinnati 61,565
TEAM STATISTICS RAVENS OPPONENTTOTAL FIRST DOWNS 314 326 Rushing 98 105 Passing 182 187 Penalty 34 34 3rd Down: Made/Att 80/217 83/232 3rd Down Pct. 36.9 35.8 4th Down: Made/Att 6/14 6/12 4th Down Pct. 42.9 50.0POSSESSION AVG. 28:09 31:51TOTAL NET YARDS 5640 5615 Avg. Per Game 352.5 350.9 Total Plays 1042 1086 Avg. Per Play 5.4 5.2NET YARDS RUSHING 1901 1965 Avg. Per Game 118.8 122.8 Total Rushes 444 492NET YARDS PASSING 3739 3650 Avg. Per Game 233.7 228.1 Sacked/Yards Lost 38/257 37/250 Gross Yards 3996 3900 Att./Completions 560/334 557/335 Completion Pct. 59.6 60.1 Had Intercepted 11 13PUNTS/AVERAGE 83/47.1 89/46.2NET PUNTING AVG. 83/40.8 89/41.2PENALTIES/YARDS 121/1127 107/929FUMBLES/BALL LOST 14/5 23/12TOUCHDOWNS 44 33 Rushing 17 15 Passing 22 15 Returns 5 3
SCORE BY PERIODS 1 2 3 4 OT PTSRAVENS 88 108 98 101 3 398Opponents 70 103 86 82 3 344SCORING TD RU PA RT K/PAT FG S PTSTucker 0 0 0 0 42/42 30/33 0 132Rice 10 9 1 0 0 60T. Smith 8 0 8 0 0 48Pitta 7 0 7 0 0 42 Boldin 4 0 4 0 0 26J. Jones 4 0 1 3 0 24Flacco 3 3 0 0 0 18Allen 1 1 0 0 0 6Doss 1 0 1 0 0 6Koch 1 1 0 0 0 6Leach 1 1 0 0 0 6Pierce 1 1 0 0 0 6E. Reed 1 0 0 1 0 6Taylor 1 1 0 0 0 6C. Williams 1 0 0 1 0 6RAVENS 44 17 22 5 42/42 30/33 0 398Opponents 33 15 15 3 31/31 37/39 1 3442-PT. CONVERSIONS: Boldin, RAVENS 1-2, Opponents 1-2SACKS: Kruger 9, Ngata 5, Ellerbe 4.5, A. Jones 4.5, Pollard 2, Suggs 2, McPhee 1.5, Upshaw 1.5, Ayanbadejo 1, O. Brown 1, Ihedigbo 1, Kemoeatu 1, Lewis 1, McClellan 1, C. Williams 1, RAVENS 37, Opponents 38FUM/LOST: Flacco 9/4, J. Jones 2/0, Gradkowski 1/0, Rice 1/0, D. Thompson 1/1
PASSING ATT COMP YARDS COMP% YDS/ATT TD TD% INT INT% LG SACK/LOST RATINGFlacco 531 317 3817 59.7% 7.19 22 4.1% 10 1.9% 61t 35/227 87.7Taylor 29 17 179 58.6% 6.17 0 0.0% 1 3.4% 25 3/30 62.3RAVENS 560 334 3996 59.6% 7.14 22 3.9% 11 2.0% 61t 38/257 86.4Opponents 557 335 3900 60.1% 7.00 15 2.7% 13 2.3% 59 37/250 80.6
RUSHING NO YDS AVG LG TDRice 257 1143 4.4 46 9Pierce 108 532 4.9 78 1 Taylor 14 73 5.2 28 1Allen 16 61 3.8 20 1 Leach 9 32 3.6 6 1 Flacco 32 22 0.7 16 3 Koch 2 17 8.5 10 1T. Smith 3 9 3.0 13 0 J. Jones 1 6 6.0 6 0 Boldin 1 3 3.0 3 0 Considine 1 3 3.0 3 0 RAVENS 444 1901 4.3 78 17 Opponents 492 1965 4.0 31t 15
RECEIVING NO YDS AVG LG TDBoldin 65 921 14.2 43 4Pitta 61 669 11.0 61t 7Rice 61 478 7.8 43 1 T. Smith 49 855 17.4 54 8 J. Jones 30 406 13.5 47 1 Dickson 21 225 10.7 40 0 Leach 21 143 6.8 18 0 Doss 7 123 17.6 39 1 Pierce 7 47 6.7 11 0 D. Reed 5 66 13.2 23 0D. Thompson 5 51 10.2 25 0Allen 2 12 6.0 7 0 RAVENS 334 3996 12.0 61t 22Opponents 335 3900 11.6 59 15
INTERCEPTIONS NO YDS AVG LG TDC. Williams 4 90 22.5 63t 1 E. Reed 4 78 19.5 34t 1 Graham 2 20 10.0 20 0Webb 1 8 8.0 8 0Kruger 1 0 0.0 0 0 Pollard 1 0 0.0 0 0 RAVENS 13 196 15.1 63t 2 Opponents 11 231 21.0 98t 3
PUNTING NO YDS AVG NET TB IN LG BLKKoch 83 3911 47.1 40.8 7 28 60 0 RAVENS 83 3911 47.1 40.8 7 28 60 0Opponents 89 4113 46.2 41.2 2 32 63 0
PUNT RETURNS RET FC YDS AVG LG TDJ. Jones 37 16 341 9.2 63t 1Doss 4 4 53 13.3 40 0 E. Reed 1 1 1 1.0 1 0 Webb 1 5 9 9.0 9 0 RAVENS 43 26 404 9.4 63t 1 Opponents 49 13 383 7.8 64 0
KICKOFF RETURNS NO YDS AVG LG TDJ. Jones 38 1167 30.7 108t 2 D. Thompson 15 389 25.9 49 0 Allen 3 56 18.7 20 0 Gradkowski 1 12 12.0 12 0Graham 1 7 7.0 7 0Pitta 1 0 0.0 0 0 L. Williams 1 5 5.0 5 0 RAVENS 60 1636 27.3 108t 2 Opponents 37 859 23.2 42 0
FIELD GOALS 1-19 20-29 30-39 40-49 50+Tucker 0/0 8/8 8/8 10/13 4/4 RAVENS 0/0 8/8 8/8 10/13 4/4 Opponents 1/1 7/7 14/14 12/13 3/4
Tucker: (46G,40G,39G)(56G,51G,48G)(27G)(45G,47N)(28G,26G,39G)(38G)(51G,54G)(43G)(48G,34G)(26G,41N,39G)(43G,38G,38G)(45G,23G)()(45G)(23G,21G,30G,29G)(45N,49G)Opponents: (34G,19G)(23G)(37G,49G,20G)(51G,50G,52G)(30G,31G)(42G,43G,34G,51N)(33G,29G)(32G,28G,29G,33G,41G)(32G,47G)(22G)(47G,30G)(46G,41G,42G)(48G,49G,34G)(27G,36G,45N)()(47G,32G,38G)

2019 BALTIMORE RAVENS MEDIA GUIDE390
2012 STATISTICS
John Harbaugh, Head Coach; Jerry Rosburg, Assistant Head Coach/Special Teams Coordinator; Jim Caldwell, Offensive Coordinator; Dean Pees, Defensive Coordinator; Teryl Austin, Secondary; Juney Barnett, Assistant Strength and Conditioning; Clarence Brooks, Defensive Line; Jason Brooks, Offensive Quality Control; Randy Brown, Kicking Consultant; Juan Castillo, Special Consultant; Wade Harman, Tight Ends; Chris Hewitt, Assistant Special Teams; Jim Hostler, Wide Receivers; Don Martindale, Inside Linebackers; Andy Moeller, Offensive Line; Ted Monachino, Linebackers; Wilbert Montgomery, Running Backs; Bob Rogucki, Strength and Conditioning; Craig Ver Steeg, Senior Offensive Assistant; Todd Washington, Assistant Offensive Line; Matt Weiss, Defensive Quality Control
AP All-Pro: WR/RS Jacoby Jones (1st Team), FB Vonta Leach (1st Team), DT Haloti Ngata (2nd Team), G Marshal Yanda (2nd Team)
Pro Bowl: WR/RS Jacoby Jones (starter), FB Vonta Leach (starter), DT Haloti Ngata, S Ed Reed (starter), RB Ray Rice, G Marshal Yanda (starter)
Super Bowl XVLII MVP: QB Joe Flacco
Pro Football Weekly/PFWA’s All-NFL Team:WR/RS Jacoby Jones, G Marshal Yanda
AFC Players of the Week:QB Joe Flacco (Week 1) - OffenseWR/RS Jacoby Jones (Week 6) - Special TeamsRB Ray Rice (Week 16) - Offense
AFC Player of the Month:WR/RS Jacoby Jones (Special Teams, November)
NFL Play of the Year:RB Ray Rice’s 4th-and-29 conversion at SD
USA Today All-Joe Team:QB Joe Flacco, S Bernard Pollard, K Justin Tucker
Ed Block Courage Award: OLB Terrell Suggs
Ravens Roost Unsung Hero: K Justin Tucker
Ravens Roost Extra Effort: CB Corey Graham
Reg. Post.Record ...................................................................................................10-6 ...........4-0vs. AFC North .........................................................................................4-2 ...........0-0vs. AFC ....................................................................................................8-4 ...........3-0vs. NFC ....................................................................................................2-2 ........... 1-0Home .......................................................................................................6-2 ........... 1-0Away ........................................................................................................4-4 ...........2-0On Grass .................................................................................................4-3 ........... 1-0Artificial Turf .............................................................................................6-3 ...........3-0Outdoors ................................................................................................10-5 ...........3-0Indoors .....................................................................................................0-1 ........... 1-0Leading at Halftime .................................................................................. 7-3 ...........2-0Tied at Halftime ........................................................................................1-1 ........... 1-0Trailing at Halftime ...................................................................................2-2 ........... 1-0Leading After 3 Quarters ..........................................................................8-2 ...........3-0Tied After 3 Quarters ...............................................................................0-1 ........... 1-0Trailing After 3 Quarters ...........................................................................2-3 ...........0-0Decided by 7 Points or less .....................................................................6-4 ...........2-0Decided by 3 Points or less .....................................................................5-3 ...........2-0
Reg. Post.When Scoring First .................................................................................. 7-2 ...........2-0When Not Scoring First ............................................................................3-4 ...........2-0Positive or even Turnover Ratio ...............................................................9-2 ...........4-0Negative Turnover Ratio ..........................................................................1-4 ...........0-0Winning Penalty Ratio .............................................................................4-2 ...........2-0Losing Penalty Ratio ................................................................................6-2 ...........2-0Overtime ..................................................................................................1-1 ........... 1-0With a 100-Yard Rusher ...........................................................................3-1 ...........2-0Without a 100-yard Rusher ...................................................................... 7-5 ...........2-0With a 100-Yard Receiver ........................................................................3-1 ...........2-0Without a 100-yard Receiver.................................................................... 7-5 ...........2-0With a 300-Yard Passer ...........................................................................5-0 ........... 1-0Without a 300-Yard Passer ......................................................................5-6 ...........3-0When Allowing a 100-Yard Rusher ..........................................................2-2 ........... 1-0When Not Allowing a 100-Yard Rusher ....................................................8-4 ...........3-0When Allowing a 100-Yard Receiver ........................................................1-2 ...........2-0When Not Allowing a 100-Yard Receiver .................................................9-4 ...........2-0When Allowing a 300-Yard Passer ...........................................................3-1 ...........2-0When Not Allowing a 300-Yard Passer .................................................... 7-5 ...........2-0
YDS RET.PLAYER TT SOLO AS SACKS LOST INT YDS PD FF FRPollard, Bernard 98 71 27 2 14 1 0 6 0 0Ellerbe, Dannell 89 66 23 4.5 29.5 0 0 2 0 0McClain, Jameel 79 57 22 0 0 0 0 3 0 0Williams, Cary 75 67 8 1 9 4 90 17 0 0Reed, Ed 58 49 9 0 0 4 78 15 0 3Lewis, Ray 57 44 13 1 0 0 0 1 1 1Upshaw, Courtney 55 34 21 1.5 10 0 0 2 0 2Graham, Corey 54 36 18 0 0 2 20 8 0 0Ngata, Haloti 51 33 18 5 50 0 0 1 0 0Jones, Arthur 47 27 20 4.5 29.5 0 0 0 1 0Kruger, Paul 42 30 12 9 46 1 0 6 1 1McClellan, Albert 42 29 13 1 11 0 0 2 0 2Bynes, Josh 31 18 13 0 0 0 0 2 0 0Smith, Jimmy 31 27 4 0 0 0 0 3 0 0Ayanbadejo, Brendon 30 16 14 1 7 0 0 1 0 0Kemoeatu, Ma’ake 29 15 14 1 1 0 0 2 1 0Cody, Terrence 25 12 13 0 0 0 0 1 0 0Webb, Lardarius 25 24 1 0 0 1 8 6 1 1Suggs, Terrell 22 17 5 2 15 0 0 4 0 0McPhee, Pernell 21 18 3 1.5 12 0 0 0 0 0Ihedigbo, James 19 12 7 1 7 0 0 1 0 0Brown, Chykie 14 12 2 0 0 0 0 6 0 0Tyson, DeAngelo 11 3 8 0 0 0 0 2 0 0Johnson, Chris 7 7 0 0 0 0 0 0 1 0Brown, Omar 3 2 1 1 9 0 0 0 0 0Hall, Bryan 3 1 2 0 0 0 0 0 0 0Considine, Sean 2 1 1 0 0 0 0 0 0 0Kindle, Sergio 1 1 0 0 0 0 0 0 0 0Totals 1021 729 292 37 250 13 196 91 6 10
PLAYER TT SOLO AS FF FR BKAyanbadejo, Brendon 14 12 2 0 1 0Allen, Anthony 12 11 1 0 0 0Brown, Chykie 11 9 2 0 0 0Considine, Sean 7 6 1 0 0 0McCellan, Albert 7 7 0 1 0 0Graham, Corey 6 6 0 0 0 0Ihedigbo, James 6 6 0 0 0 0Upshaw, Courtney 5 4 1 1 0 0Williams, LaQuan 5 4 1 0 0 0Reed, David 4 3 1 0 0 0Bynes, Josh 3 1 2 0 0 0Ellerbe, Dannell 3 3 0 1 0 0Koch, Sam 3 2 1 0 0 0Smith, Jimmy 3 3 0 0 0 0Cox, Morgan 2 1 1 0 0 0Dickson, Ed 1 1 0 0 0 0Hamilton, Adrian 1 1 0 0 0 0Jackson, Asa 1 1 0 0 0 0Levine, Anthony 1 1 0 0 0 0Tucker, Justin 1 1 0 0 0 0Brown, Omar 0 0 0 0 1 0McClain, Jameel 0 0 0 0 1 0Totals 96 83 13 3 3 0
Defensive and special teams statistics reflect press box stats.
WR LT LG C RG RT TE WR QB RB FB Offense: A. Boldin M. Oher J. Reid M. Birk M. Yanda K. Osemele E. Dickson T. Smith J. Flacco R. Rice V. Leach
DT DE NT SAM MIKE WILL RUSH RCB LCB SS FS Defense: H. Ngata A. Jones M. Kemoeatu A. McClellan Lewis/McClain D. Ellerbe T. Suggs C. Williams C. Graham B. Pollard E. Reed
DEFENSIVE STATISTICS SPECIAL TEAMS STATISTICS
RAVENS HONOR ROLL
RAVENS SEASON TRENDS
RAVENS COACHES
USUAL STARTING L INEUPS

BALTIMORERAVENS.COM 391
2012 POSTSEASON STATISTICSRESULTS AND ATTENDANCEWON 4, LOST 0 (SUPER BOWL XLVII CHAMPIONS)01/06 W 24-9 Indianapolis 71,37901/12 W 38-35 2OT at Denver 76,73201/20 W 28-13 at New England 68,75602/03 W 34-31 vs. San Francisco 71,024TEAM STATISTICS RAVENS OPPONENTTOTAL FIRST DOWNS 85 106 Rushing 25 30 Passing 53 63 Penalty 7 13 3rd Down: Made/Att 25/55 25/60 3rd Down Pct. 45.5 41.7 4th Down: Made/Att 0/3 2/6 4th Down Pct. 0.0 33.3POSSESSION AVG. 28:39 31:21TOTAL NET YARDS 1641 1713 Avg. Per Game 410.3 428.3 Total Plays 271 316 Avg. Per Play 6.1 5.4NET YARDS RUSHING 539 567 Avg. Per Game 134.8 141.8 Total Rushes 139 128NET YARDS PASSING 1102 1146 Avg. Per Game 275.5 286.5 Sacked/Yards Lost 6/38 9/54 Gross Yards 1140 1200 Att./Completions 126/73 179/101 Completion Pct. 57.9 56.4 Had Intercepted 0 6PUNTS/AVERAGE 22/46.0 17/45.6NET PUNTING AVG. 22/34.3 17/37.5PENALTIES/YARDS 24/206 24/197FUMBLES/BALL LOST 6/4 5/4TOUCHDOWNS 16 9 Rushing 3 2 Passing 11 5 Returns 2 2
SCORE BY PERIODS 1 2 3 4 OT 2OT PTSRAVENS 21 38 28 34 0 3 124Opponents 20 26 27 15 0 0 88
SCORING TD RU PA RT K/PAT FG S PTSTucker 0 0 0 0 16/16 4/4 0 28Boldin 4 0 4 0 0 24J. Jones 3 0 2 1 0 18Pitta 3 0 3 0 0 18Rice 2 2 0 0 0 12T. Smith 2 0 2 0 0 12Graham 1 0 0 1 0 6Leach 1 1 0 0 0 6RAVENS 16 3 11 2 16/16 4/4 0 124Opponents 9 2 5 2 8/8 8/10 1 882-PT. CONVERSIONS: RAVENS 0-0, Opponents 0-1SACKS: Kruger 4.5, Suggs 2, A. Jones 1, McPhee 1, Graham 0.5, RAVENS 9, Opponents 6
PASSING ATT COMP YARDS COMP% YDS/ATT TD TD% INT INT% LG SACK/LOST RATINGFlacco 126 73 1140 57.9 9.05% 11 8.7% 0 0.0% 70t 6/38 117.2RAVENS 126 73 1140 57.9 9.05% 11 8.7% 0 0.0% 70t 6/38 117.2Opponents 179 101 1200 56.4 6.70% 5 2.8% 6 3.4% 36 9/54 72.4
RUSHING NO YDS AVG LG TDRice 84 306 3.6 32 2Pierce 39 202 5.2 43 0Flacco 8 16 2.0 14 0Leach 5 15 3.0 5 1Tucker 1 8 8.0 8 0T. Smith 1 0 0.0 0 0Koch 1 -8 -8.0 -8 0RAVENS 139 539 3.9 43 3Opponents 128 567 4.4 33 2
RECEIVING NO YDS AVG LG TDBoldin 22 380 17.3 50 4Pitta 14 163 11.6 24 3T. Smith 11 233 21.2 59t 2Rice 8 88 11.0 47 0Dickson 6 90 15.0 24 0Leach 6 31 5.2 17 0J. Jones 5 147 29.4 70t 2Pierce 1 8 8.0 8 0RAVENS 73 1140 15.6 70t 11Opponents 101 1200 11.9 36 5
INTERCEPTIONS NO YDS AVG LG TDC. Williams 2 41 20.5 41 0Graham 2 39 19.5 39t 1E. Reed 1 6 6.0 6 0Ellerbe 1 2 2.0 2 0RAVENS 6 88 14.7 41 1Opponents 0 0 --- --- 0
PUNTING NO YDS AVG NET TB IN LG BLKKoch 22 1013 46.0 34.3 4 8 60 0RAVENS 22 1013 46.0 34.3 4 8 60 0Opponents 17 776 45.6 37.5 1 7 59 0
PUNT RETURNS RET FC YDS AVG LG TDJ. Jones 8 2 110 13.8 34 0Doss 1 0 8 8.0 8 0E. Reed 1 3 0 0.0 0 0RAVENS 10 5 118 11.8 34 0Opponents 8 3 178 22.3 90t 1
KICKOFF RETURNS NO YDS AVG LG TDJ. Jones 14 362 25.9 108t 1RAVENS 14 362 25.9 108t 1Opponents 12 366 30.5 104t 1
FIELD GOALS 1-19 20-29 30-39 40-49 50+Tucker 1/1 1/1 1/1 1/1 0/0RAVENS 1/1 1/1 1/1 1/1 0/0Opponents 0/0 3/3 3/3 1/2 1/2Tucker: (23G)(47G)()(19G,38G)Opponents: (47G,52G,26G,40N)(52N)(31G,25G)(36G,27G,34G)FUM/LOST: Rice 3/3, Flacco 1/1, J. Jones 1/0, Leach 1/0
YDS RET.PLAYER TT SOLO AS SACKS LOST INT YDS PD FF FRLewis, Ray 51 29 22 0 0 0 0 1 0 0Ellerbe, Dannell 32 25 7 0 0 1 2 2 0 0Graham, Corey 32 20 12 0.5 3 2 39 7 0 0Williams, Cary 25 19 6 0 0 2 41 6 0 0Suggs, Terrell 21 13 8 2 8 0 0 1 1 0Pollard, Bernard 17 11 6 0 0 0 0 4 1 0Reed, Ed 15 14 1 0 0 1 6 3 0 0Kruger, Paul 14 9 5 4.5 28 0 0 1 1 1Ngata, Haloti 13 10 3 0 0 0 0 1 0 0Kemoeatu, Ma’ake 10 5 5 0 0 0 0 0 0 0Brown, Chykie 9 7 2 0 0 0 0 2 0 0Jones, Arthur 9 5 4 1 6 0 0 0 0 2Upshaw, Courtney 9 7 2 0 0 0 0 0 1 0Tyson, DeAngelo 5 2 3 0 0 0 0 0 0 0McPhee, Pernell 4 2 2 1 9 0 0 2 1 1Cody, Terrence 3 2 1 0 0 0 0 0 0 0Smith, Jimmy 3 3 0 0 0 0 0 2 0 0Ayanbadejo, Brendon 2 2 0 0 0 0 0 0 0 0Ihedigbo, James 1 1 0 0 0 0 0 0 0 0McClellan, Albert 1 1 0 0 0 0 0 0 0 0Totals 276 187 89 9 54 6 88 32 5 4
PLAYER TT SOLO AS FF FR BKConsidine, Sean 4 3 1 0 0 0Allen, Anthony 3 3 0 0 0 0Brown, Chykie 2 1 1 0 0 0Bynes, Josh 2 2 0 0 0 0McCellan, Albert 2 2 0 0 0 0Ihedigbo, James 1 1 0 0 0 0Koch, Sam 1 1 0 0 0 0Reed, David 1 1 0 0 0 0Smith, Jimmy 1 1 0 0 0 0Totals 17 15 2 0 0 0
Defensive and special teams statistics reflect press box stats.
DEFENSIVE STATISTICS SPECIAL TEAMS STATISTICS

2019 BALTIMORE RAVENS MEDIA GUIDE392
2013 STATISTICSRESULTS AND ATTENDANCEWON 8, LOST 809/05 L 27-49 at Denver 76,977 09/15 W 14-6 Cleveland 71,09809/22 W 30-9 Houston 71,16809/29 L 20-23 at Buffalo 68,296 10/06 W 26-23 at Miami 68,342 10/13 L 17-19 Green Bay 71,31910/20 L 16-19 at Pittsburgh 62,29511/03 L 18-24 at Cleveland 71,513 11/10 W 20-17 OT Cincinnati 70,99211/17 L 20-23 OT at Chicago 62,36711/24 W 19-3 New York Jets 71,14811/28 W 22-20 Pittsburgh 71,00512/08 W 29-26 Minnesota 70,92112/16 W 18-16 at Detroit 64,74212/22 L 7-41 New England 71,43312/29 L 17-34 at Cincinnati 62,406
TEAM STATISTICS RAVENS OPPONENTTOTAL FIRST DOWNS 295 284 Rushing 68 79 Passing 189 176 Penalty 38 29 3rd Down: Made/Att 92/253 78/233 3rd Down Pct. 36.4 33.5 4th Down: Made/Att 6/16 8/14 4th Down Pct. 37.5 57.1POSSESSION AVG. 29:51 30:09TOTAL NET YARDS 4918 5368 Avg. Per Game 307.4 335.5 Total Plays 1090 1032 Avg. Per Play 4.5 5.2NET YARDS RUSHING 1328 1687 Avg. Per Game 83.0 105.4 Total Rushes 423 440NET YARDS PASSING 3590 3681 Avg. Per Game 224.4 230.1 Sacked/Yards Lost 48/324 40/257 Gross Yards 3914 3938 Att./Completions 619/363 552/314 Completion Pct. 58.6 56.9 Had Intercepted 23 16PUNTS/AVERAGE 91/45.5 98/45.8NET PUNTING AVG. 91/38.9 98/37.5PENALTIES/YARDS 112/942 126/1196FUMBLES/BALL LOST 15/6 21/8TOUCHDOWNS 29 37 Rushing 7 7 Passing 19 25 Returns 3 5
SCORE BY PERIODS 1 2 3 4 OT PTSRAVENS 59 79 64 115 3 320 OPPONENTS 63 89 63 134 3 352
SCORING TD RU PA RT K/PAT FG S PTSTucker 0 0 0 0 26/26 38/41 0 140 M. Brown 7 0 7 0 0 44 Rice 4 4 0 0 0 26 T. Smith 4 0 4 0 0 26 Clark 3 0 3 0 0 18 J. Jones 3 0 2 1 0 18Pierce 2 2 0 0 0 12 Dickson 1 0 1 0 0 6 Doss 1 0 0 1 0 6Flacco 1 1 0 0 0 6 Leach 1 0 1 0 0 6 Pitta 1 0 1 0 0 6 D. Smith 1 0 0 1 0 6RAVENS 29 7 19 3 26/26 38/41 0 320Opponents 37 7 25 5 34/34 32/35 0 352
2-PT. CONVERSIONS: M. Brown, Rice, T. Smith, RAVENS 3-3, Opponents 0-3SACKS: Suggs 10, Dumervil 9.5, D. Smith 5, A. Jones 4, Canty 2, McPhee 2, Tyson 2, Ngata 1.5, Upshaw 1.5, Graham 1, B. Williams 1, A. Brown 0.5, RAVENS 40, Opponents 48
FUM/LOST: Flacco 8/2, Gradkowski 2/1, Rice 2/2, Doss 1/1, Leach 1/0, T. Smith 1/0
PASSING ATT COMP YARDS COMP% YDS/ATT TD TD% INT INT% LG SACK/LOST RATINGFlacco 614 362 3912 59.0 6.37 19 3.1 22 3.6 74 48/324 73.1Taylor 5 1 2 20.0 0.40 0 0.0 1 20.0 2 0/0 0.0RAVENS 619 363 3914 58.6 6.32 19 3.1 23 3.7 74 48/324 72.0Opponents 552 314 3938 56.9 7.13 25 4.5 16 2.9 79t 40/257 82.2
RUSHING NO YDS AVG LG TDRice 214 660 3.1 47 4 Pierce 152 436 2.9 28 2 Flacco 27 131 4.9 22 1 Taylor 8 64 8.0 25 0 Leach 11 23 2.1 6 0 Scott LG 4 14 3.5 9 0 Scott TM 4 14 3.5 9 0 Draughn 4 2 0.5 3 0 J. Jones 2 0 0.0 4 0 M. Brown 1 -2 -2.0 -2 0 TEAM 423 1328 3.1 47 7 OPPONENTS 440 1687 3.8 43 7
RECEIVING NO YDS AVG LG TDT. Smith 65 1128 17.4 74 4 Rice 58 321 5.5 22 0 M. Brown 49 524 10.7 59 7 J. Jones 37 455 12.3 66t 2 Clark 31 343 11.1 45 3 Dickson 25 273 10.9 43 1 Pitta 20 169 8.5 18 1 Pierce 20 104 5.2 15 0 Doss 19 305 16.1 63 0 Stokley 13 115 8.8 18 0 Leach 11 47 4.3 12 1 D. Thompson 10 96 9.6 33 0 Bajema 2 18 9.0 18 0 Scott LG 2 10 5.0 8 0 Scott TM 2 10 5.0 8 0 Taylor 1 6 6.0 6 0 RAVENS 363 3914 10.8 74 19Opponents 314 3938 12.5 79t 25
INTERCEPTIONS NO YDS AVG LG TDGraham 4 28 7.0 28 0Ihedigbo 3 54 18.0 37 0D. Smith 3 41 13.7 37t 1Webb 2 19 9.5 19 0J. Smith 2 0 0.0 0 0Elam 1 18 18.0 18 0Tyson 1 0 0.0 0 0RAVENS 16 160 10.0 37t 1Opponents 23 219 9.5 74t 4
PUNTING NO YDS AVG NET TB IN LG BLKKoch 90 4138 46.0 38.9 9 27 69 1RAVENS 91 4138 45.5 38.9 9 27 69 1Opponents 98 4484 45.8 37.5 10 34 67 0
PUNT RETURNS RET FC YDS AVG LG TDDoss 23 7 359 15.6 82t 1 J. Jones 19 2 237 12.5 37 0Webb 1 7 13 13.0 13 0RAVENS 43 16 609 14.2 82T 1Opponents 46 14 419 9.1 27 0
KICKOFF RETURNS NO YDS AVG LG TDJ. Jones 31 892 28.8 77t 1 D. Thompson 7 201 28.7 47 0 Draughn 2 53 26.5 31 0 Juszczyk 2 17 8.5 9 0 Dickson 1 0 0.0 0 0 Leach 1 0 0.0 0 0 RAVENS 44 1163 26.4 77t 1 Opponents 38 873 23.0 44 0
FIELD GOALS 1-19 20-29 30-39 40-49 50+Tucker 0/0 10/10 12/13 10/11 6/7RAVENS 0/0 10/10 12/13 10/11 6/7 Opponents 0/0 11/11 10/10 9/11 2/3
Tucker: (25G,30G)(50N,44N)(28G,45G,43G)(35G,24G)(42G,50G,25G,44G)(23G)(46G,38G,32G)(51G)(36G,46G)(52G,21G)(30G,26G,33G,53G)(43G,34G,38G,45G,48G)()(29G,24G,32G,49G,53G,61G)(37N)(38G,22G,34G)
Opponents: ()(21G,51G)(27G,29G,47G)(27G,27G,22G)(37G,25G,48G,57N) (45G,44N,31G,50G,31G)(34G,28G,38G,42G)(22G)(42N,32G)(20G,46G,38G)(27G)()(39G,40G)(40G)(45G,42G)(39G,38G)

BALTIMORERAVENS.COM 393
2013 STATISTICS
John Harbaugh, Head Coach; Jerry Rosburg, Assistant Head Coach/Special Teams Coordinator; Jim Caldwell, Offensive Coordinator; Dean Pees, Defensive Coordinator; Teryl Austin, Secondary; Juney Barnett, Assistant Strength and Conditioning; Clarence Brooks, Defensive Line; Randy Brown, Kicking Consultant; Juan Castillo, Run Game Coordinator; Jay Harbaugh, Offensive Quality Control; Wade Harman, Tight Ends; Chris Hewitt, Assistant Special Teams; Jim Hostler, Wide Receivers; Don Martindale, Inside Linebackers; Andy Moeller, Offensive Line; Ted Monachino, Linebackers; Wilbert Montgomery, Running Backs; Bob Rogucki, Strength and Conditioning; Steve Spagnuolo, Senior Defensive Assistant; Craig Ver Steeg, Senior Offensive Assistant; Todd Washington, Assistant Offensive Line; Matt Weiss, Defensive Quality Control
AP All-Pro: K Justin Tucker (1st Team)
PFWA All-Pro:K Justin Tucker (1st Team)
Sporting News All-Pro:K Justin Tucker, G Marshal Yanda (1st Teams)
Pro Bowl: DT Haloti Ngata, OLB Terrell Suggs, K Justin Tucker, G Marshal Yanda
USA Today All-Joe Team:CB Lardarius Webb
AFC Players of the Week:K Justin Tucker (Week 10) - Special TeamsK Justin Tucker (Week 12) - Special TeamsK Justin Tucker (Week 15) - Special Teams
AFC Player of the Month:K Justin Tucker (Special Teams, November)
Pepsi NEXT Rookie of the Week (Week 14): WR Marlon Brown
GMC Never Say Never Moment (Week 14): QB Joe Flacco
GMC Never Say Never Moment of the Week (Week 15):K Justin Tucker
Ed Block Courage Award: LB Jameel McClain
Ravens Roost Unsung Hero: S James Ihedigbo
Ravens Roost Extra Effort: WR Marlon Brown
RecordRecord .....................................................................................................................8-8vs. AFC North .........................................................................................................3-3vs. AFC ....................................................................................................................6-6vs. NFC ....................................................................................................................2-2Home .......................................................................................................................6-2Away ........................................................................................................................2-6On Grass ................................................................................................................. 1-4Artificial Turf ............................................................................................................. 7-4Outdoors .................................................................................................................. 7-8Indoors ..................................................................................................................... 1-0Leading at Halftime ..................................................................................................6-2Tied at Halftime ........................................................................................................0-0Trailing at Halftime ...................................................................................................2-6Leading After 3 Quarters ..........................................................................................8-1Tied After 3 Quarters ...............................................................................................0-0Trailing After 3 Quarters ...........................................................................................0-7Decided by 7 Points or less .....................................................................................5-5Decided by 3 Points or less .....................................................................................5-4When Scoring First ..................................................................................................4-3When Not Scoring First ............................................................................................4-5
RecordPositive or Even Turnover Ratio ...............................................................................5-4Negative Turnover Ratio ..........................................................................................3-4Winning Penalty Ratio .............................................................................................6-5Losing Penalty Ratio ................................................................................................2-3Overtime .................................................................................................................. 1-1With a 100-Yard Rusher ...........................................................................................0-1Without a 100-yard Rusher ......................................................................................8-7With a 100-Yard Receiver ........................................................................................2-1Without a 100-yard Receiver....................................................................................6-7With a 300-Yard Passer ...........................................................................................0-3Without a 300-Yard Passer ......................................................................................8-5When Allowing a 100-Yard Rusher ..........................................................................0-1When Not Allowing a 100-Yard Rusher ....................................................................8-7When Allowing a 100-Yard Receiver ........................................................................3-3When Not Allowing a 100-Yard Receiver .................................................................5-5When Allowing a 300-Yard Passer ........................................................................... 1-2When Not Allowing a 300-Yard Passer .................................................................... 7-6When Recording 3 or more sacks............................................................................5-4When Holding an Opponent Under 250 Net Yards .................................................. 1-0When Holding an Opponent Under 21 Points ..........................................................6-2When Holding an Opponent Under 15 Points ..........................................................4-0
YDS RET.PLAYER TT SOLO AS SACKS LOST INT YDS PD FF FRSmith, Daryl 123 57 66 5 43.5 3* 41 19 2 0Ihedigbo, James 99 62 37 0 0 3 54 11 2 1Suggs, Terrell 80 47 33 10 48 0 0 0 0 1Elam, Matt 76 53 23 0 0 1 18 3 0 2Webb, Lardarius 74 63 11 0 0 2 19 22 0 0Graham, Corey 68 51 17 1 0 4 28 12 1 0Smith, Jimmy 58 49 9 0 0 2 0 16 2 0Jones, Arthur 53 28 25 4 27 0 0 0 0 0Ngata, Haloti 52 23 29 1.5 12 0 0 3 0 0McClain, Jameel 50 27 23 0 0 0 0 0 1 0Bynes, Josh 41 19 22 0 0 0 0 3 0 0Dumervil, Elvis 31 18 13 9.5 64 0 0 3 2 0Canty, Chris 30 20 10 2 22 0 0 4 2 0Upshaw, Courtney 29 18 11 1.5 13 0 0 2 0 0McPhee, Pernell 21 13 8 2 13 0 0 1 1 0Cody, Terrence 15 7 8 0 0 0 0 0 0 0Brown, Arthur 12 8 4 0.5 4.5 0 0 0 1 0Spears, Marcus 10 5 5 0 0 0 0 0 0 0Tyson, DeAngelo 10 9 1 2 5 1 0 1 0 0Williams, Brandon 6 3 3 1 5 0 0 0 0 1Huff, Michael 4 3 1 0 0 0 0 0 0 0Brown, Chykie 2 1 1 0 0 0 0 1 0 0Miles, Jeromy 1 1 0 0 0 0 0 0 0 0Totals 945 585 360 40 257 16 160 101 14 5
*Daryl Smith returned an INT 37 yards for a TD vs. Hou. (9/22)
PLAYER TT SOLO AS FF FR BKMcClellan, Albert 12 12 0 0 0 0Levine, Anthony 11 10 1 0 0 0Brown, Chykie 8 7 1 0 0 0Miles, Jeromy 8 8 0 0 0 0Trawick, Brynden 8 8 0 0 0 0Graham, Corey 5 4 1 0 0 0Juszcyk, Kyle 5 3 2 0 1 0Bynes, Josh 4 3 1 0 0 0Simon, John 4 4 0 0 0 0Brown, Arthur 3 3 0 0 0 0Dickson, Ed 3 2 1 0 0 0Bajema, Billy 2 2 0 0 0 0Cox, Morgan 2 2 0 0 1 0Huff, Michael 2 2 0 0 0 0Ihedigbo, James 2 1 1 0 1 0McClain, Jameel 2 2 0 0 0 0Doss, Tandon 1 1 0 0 0 0Elam, Matt 1 1 0 0 0 0Koch, Sam 1 1 0 0 0 0Upshaw, Courtney 1 1 0 0 0 0Totals 85 77 8 0 3 0
Defensive and special teams statistics reflect press box stats.
WR LT LG C RG RT TE WR QB RB FB Offense: J. Jones/M. Brown E. Monroe A. Shipley G. Gradkowski M. Yanda M. Oher E. Dickson T. Smith J. Flacco R. Rice V. Leach
DT DE NT SAM MIKE WILL RUSH RCB LCB SS FS Defense: A. Jones C. Canty H. Ngata C. Upshaw D.. Smith J. McClain T. Suggs J. Smith L. Webb J. Ihedigbo M. Elam
DEFENSIVE STATISTICS SPECIAL TEAMS STATISTICS
RAVENS HONOR ROLL
RAVENS SEASON TRENDS
RAVENS COACHES
USUAL STARTING L INEUPS

2019 BALTIMORE RAVENS MEDIA GUIDE394
2014 STATISTICSRESULTS AND ATTENDANCEWON 10, LOST 6WILD CARD/AFC DIVISIONAL GAME09/07 L 16-23 Cincinnati 70,92509/11 W 26-6 Pittsburgh 71,18109/21 W 23-21 at Cleveland 67,40709/28 W 38-10 Carolina 71,21810/05 L 13-20 at Indianapolis 65,25810/12 W 48-17 at Tampa Bay 60,04110/19 W 29-7 Atlanta 71,18410/26 L 24-27 at Cincinnati 55,71111/02 L 23-43 at Pittsburgh 63,97111/09 W 21-7 Tennessee 70,91411/24 W 34-27 at New Orleans 73,37311/30 L 33-34 San Diego 71,06012/07 W 28-13 at Miami 70,24412/14 W 20-12 Jacksonville 70,80112/21 L 13-25 at Houston 71,77112/28 W 20-10 Cleveland 71,070
TEAM STATISTICS RAVENS OPPONENTTOTAL FIRST DOWNS 345 311 Rushing 113 75 Passing 194 205 Penalty 38 31 3rd Down: Made/Att 84/205 89/221 3rd Down Pct. 41.0 40.3 4th Down: Made/Att 9/18 5/14 4th Down Pct. 50.0 35.7POSSESSION AVG. 29:40 30:20TOTAL NET YARDS 5838 5391 Avg. Per Game 364.9 336.9 Total Plays 1022 1034 Avg. Per Play 5.7 5.2NET YARDS RUSHING 2019 1412 Avg. Per Game 126.2 88.3 Total Rushes 448 390NET YARDS PASSING 3819 3979 Avg. Per Game 238.7 248.7 Sacked/Yards Lost 19/167 49/362 Gross Yards 3986 4341 Att./Completions 555/344 595/382 Completion Pct. 62.0 64.2 Had Intercepted 12 11PUNTS/AVERAGE 60/47.4 76/45.9NET PUNTING AVG. 60/43.3 76/40.5PENALTIES/YARDS 111/870 110/1007FUMBLES/BALL LOST 16/8 22/11TOUCHDOWNS 46 30 Rushing 16 8 Passing 27 22 Returns 3 0
SCORE BY PERIODS 1 2 3 4 OT PTSRAVENS 76 96 91 146 0 409OPPONENTS 63 79 60 100 0 302
SCORING TD RU PA RT K/PAT FG S PTSTucker 0 0 0 0 42/42 29/34 0 129 T. Smith 11 0 11 0 0 66Forsett 8 8 0 0 0 50 S. Smith Sr. 6 0 6 0 0 36Aiken 4 0 3 1 0 24 Daniels 4 0 4 0 0 24Taliaferro 4 4 0 0 0 24Flacco 2 2 0 0 0 12 Pierce 2 2 0 0 0 12Campanaro 1 0 1 0 0 6Gillmore 1 0 1 0 0 6 Hill 1 0 0 1 0 6 J. Jones 1 0 0 1 0 6 Juszczyk 1 0 1 0 0 6Suggs 0 0 0 0 1 2RAVENS 46 16 27 3 42/42 29/34 1 409Opponents 30 8 22 0 28/28 30/36 0 302
2-PT. CONVERSIONS: Forsett RAVENS 1-4, Opponents 2-2
SACKS: Dumervil 17, Suggs 12, McPhee 7.5, Jernigan 4, Mosley 3, Ngata 2, D. Smith 1, Tyson 1, Walker LG 1, Canty 0.5, Elam 0.5, B. Williams 0.5 RAVENS 49, Opponents 19
PASSING ATT COMP YARDS COMP% YDS/ATT TD TD% INT INT% LG SACK/LOST RATINGFlacco 554 344 3986 62.1 7.18 27 4.9 12 2.2 80t 19/167 91.0RAVENS 554 344 3986 62.1 7.18 27 4.9 12 2.2 80t 19/167 91.0Opponents 595 382 4341 64.2 7.30 22 3.7 11 1.8 77t 49/362 90.6
RUSHING NO YDS AVG LG TDForsett 235 1266 5.4 52 8 Pierce 93 366 3.9 28 2 Taliaferro 68 292 4.3 31 4 Flacco 39 70 1.8 15 2 J. Jones 3 16 5.3 11 0 Toussaint 6 12 2.0 12 0 T. Taylor 4 -3 -0.8 0 0 RAVENS 448 2019 4.5 52 16 OPPONENTS 390 1412 3.6 67 8
RECEIVING NO YDS AVG LG TDS. Smith Sr. 79 1065 13.5 80t 6T. Smith 49 767 15.7 53 11 Daniels 48 527 11.0 39 4Forsett 44 263 6.0 26 0Aiken 24 267 11.1 24 3 M. Brown 24 255 10.6 22 0 Juszczyk 19 182 9.6 33 1 Pitta 16 125 7.8 24 0 Gillmore 10 121 12.1 22 1J. Jones 9 131 14.6 31 0Taliaferro 8 114 14.3 29 0Campanaro 7 102 14.6 19t 1Supernaw 2 27 13.5 29 0 Toussaint 3 27 9.0 15 0 Pierce 2 13 6.5 7 0 RAVENS 344 3986 11.6 80t 27Opponents 382 4341 11.4 77t 22
INTERCEPTIONS NO YDS AVG LG TDMosley 2 23 11.5 18 0Ngata 2 16 8.0 13 0Hill 1 44 44.0 44t 1J. Smith 1 31 31.0 31 0Gorrer 1 15 15.0 15 0 Miles 1 6 6.0 6 0D. Smith 1 0 0.0 0 0Stewart 1 0 0.0 0 0Webb 1 0 0.0 0 0RAVENS 11 135 12.3 44t 1Opponents 12 149 12.4 30 0
PUNTING NO YDS AVG NET TB IN LG BLKKoch 60 2841 47.4 43.3 4 26 73 0RAVENS 60 2841 47.4 43.3 4 26 73 0Opponents 76 3489 45.9 40.5 6 18 69 1
PUNT RETURNS RET FC YDS AVG LG TDJ. Jones 30 17 275 9.2 45 0Campanaro 2 1 17 8.5 9 0Webb 0 5 0 --- --- 0RAVENS 32 23 292 9.1 45 0Opponents 23 14 166 7.2 45 0
KICKOFF RETURNS NO YDS AVG LG TDJ. Jones 32 978 30.6 108t 1 Juszczyk 2 28 14.0 16 0 Toussaint 2 41 20.5 23 0 Gillmore 1 15 15.0 15 0 Taliaferro 1 15 15.0 15 0 RAVENS 38 1077 28.3 108t 1 Opponents 26 601 23.1 36 0
FIELD GOALS 1-19 20-29 30-39 40-49 50+Tucker 0/0 10/10 11/11 4/4 4/9RAVENS 0/0 10/10 11/11 4/4 4/9 Opponents 0/0 7/7 13/14 7/10 3/5
Tucker: (55N,38G)(30G,23G,22G,20G)(38G,21G,32G)(57N,30G)(52G,27G)(46G,64B,49G)(38G,38G)(45G,50G,53G)(46G)()(31G,55G)(33G,21G,29G,31G)()(22G,54N,54N,33G)()(25G,28G)
Opponents: (49G,22G,28G,46G,38G,45B)(25G,43G)(50N,36B)(37G)(38G,34G)(45N,47G)(57N)(32G,33G)()()(20G,34G)(52G,26G)(46G,34G)(53G,45G,53G,42N,45G)(35G, 25G,30G,20G,39G,33G)(38G)
FUM/LOST: Flacco 5/0, J. Jones 4/2, Juszczyk 2/2, Forsett 1/0, Gradkowski 1/1, Pierce 1/1, S. Smith 1/1, Taliaferro 1/1

BALTIMORERAVENS.COM 395
2014 STATISTICS
John Harbaugh, Head Coach; Jerry Rosburg, Special Teams Coordinator/Associate Head Coach; Gary Kubiak, Offensive Coordinator; Dean Pees, Defensive Coordinator; Juney Barnett, Assistant Strength and Conditioning; Clarence Brooks, Defensive Line; Randy Brown, Kicking Consultant; Juan Castillo, Offensive Line; Billy DeLorbe, Cross Training Specialist; Rick Dennison, Quarterbacks; Bobby Engram, Wide Receivers; Thomas Hammock, Running Backs; Jay Harbaugh, Offensive Quality Control; Chris Hewitt, Assistant Secondary Coach; Don Martindale, Inside Linebackers; Ted Monachino, Linebackers; Brian Pariani, Tight Ends; Bob Rogucki, Strength and Conditioning; Steve Spagnuolo, Secondary/Assitant Head Coach; Craig Ver Steeg, Senior Offensive Assistant; Todd Washington, Assistant Offensive Line; Matt Weiss, Defensive Quality Control/Linebackers Assistant
AP All-Pro:OLB Elvis Dumervil (1st Team), LB C.J. Mosley (2nd Team), DT Haloti Ngata (2nd Team), G/T Marshal Yanda (1st Team)
PFWA Awards:RB Justin Forsett (All-AFC), DT Timmy Jernigan (All-Rookie), LB C.J. Mosley (All-AFC, All-Rookie), G/T Marshal Yanda (All-NFL, All-AFC)
Sporting News All-Pro:WR/RS Jacoby Jones (1st Team)G/T Marshal Yanda (1st Team)
Pro Bowl: OLB Elvis Dumervil, RB Justin Forsett, LB C.J. Mosley, G/T Marshal Yanda
AFC Players of the Week:OLB Elvis Dumervil (Week 14) - DefenseQB Joe Flacco (Week 6) - OffenseRB Justin Forsett (Week 10, Week 12) - OffenseK Justin Tucker (Week 3) - Special Teams
AFC Player of the Month:K Justin Tucker (November) - Special Teams
FedEx Air NFL Player of the Week:QB Joe Flacco (Week 6, Week 17)
NFL Defensive Rookie of the Month:LB C.J. Mosley (October, December)
Ed Block Courage Award: CB/RS Lardarius Webb
Ravens Roost Unsung Hero: RB Justin Forsett
Ravens Roost Extra Effort: DT Brandon Williams
RecordRecord ................................................................................................................... 10-6vs. AFC North .........................................................................................................3-3vs. AFC ....................................................................................................................6-6vs. NFC ....................................................................................................................4-0Home .......................................................................................................................6-2Away ........................................................................................................................4-4On Grass .................................................................................................................3-2Artificial Turf ............................................................................................................. 7-4Outdoors ..................................................................................................................9-5Indoors ..................................................................................................................... 1-1Leading at Halftime ..................................................................................................5-1Tied at Halftime ........................................................................................................2-0Trailing at Halftime ...................................................................................................3-5Leading After 3 Quarters ..........................................................................................8-1Tied After 3 Quarters ...............................................................................................0-0Trailing After 3 Quarters ...........................................................................................2-5Decided by 7 Points or less .....................................................................................2-4Decided by 3 Points or less ..................................................................................... 1-3When Scoring First ..................................................................................................8-2When Not Scoring First ............................................................................................2-4
RecordPositive or Even Turnover Ratio ............................................................................... 7-3Negative Turnover Ratio ..........................................................................................3-3Winning Penalty Ratio .............................................................................................4-2Losing Penalty Ratio ................................................................................................6-3Overtime ..................................................................................................................0-0With a 100-Yard Rusher ...........................................................................................4-1Without a 100-yard Rusher ......................................................................................6-5With a 100-Yard Receiver ........................................................................................3-1Without a 100-yard Receiver.................................................................................... 7-5With a 300-Yard Passer ...........................................................................................3-2Without a 300-Yard Passer ...................................................................................... 7-4When Allowing a 100-Yard Rusher ..........................................................................0-0When Not Allowing a 100-Yard Rusher .................................................................. 10-6When Allowing a 100-Yard Receiver ........................................................................ 1-4When Not Allowing a 100-Yard Receiver .................................................................9-2When Allowing a 300-Yard Passer ...........................................................................2-4When Not Allowing a 300-Yard Passer ....................................................................8-2When Recording 3 or more sacks............................................................................ 7-1When Holding an Opponent Under 250 Net Yards ..................................................3-0When Holding an Opponent Under 21 Points ..........................................................8-1When Holding an Opponent Under 15 Points .......................................................... 7-0
YDS RET.PLAYER TT SOLO AS SACKS LOST INT YDS PD FF FRMosley, C.J. 129 85 44 3 16 2 23 8 1 1Smith, Daryl 127 67 60 1 7 1 0 9 2 1Suggs, Terrell 61 36 25 12 87 0 0 1 0 1Stewart, Darian 53 37 16 0 0 1 0 4 1 0Williams, Brandon 48 25 23 0.5 4.5 0 0 0 2 1Elam, Matt 47 29 18 0.5 3 0 0 5 1 0Webb, Lardarius 46 36 10 0 0 1 0 8 0 0Upshaw, Courtney 42 25 17 0 0 0 0 1 0 0Hill, Will 39 27 12 0 0 1* 44 4 0 0Dumervil, Elvis 35 24 11 17 127.5 0 0 1 2 1Canty, Chris 33 13 20 0.5 3 0 0 2 1 0Ngata, Haloti 32 19 13 2 28 2 16 7 2 0Smith, Jimmy 28 22 6 0 0 1 31 8 0 0Jackson, Asa 27 22 5 0 0 0 0 3 0 0McPhee, Pernell 27 17 10 7.5 50 0 0 4 1 0Jernigan, Timmy 23 11 12 4 27 0 0 0 0 0Levine, Anthony 23 16 7 0 0 0 0 4 0 0Miles, Jeromy 23 14 9 0 0 1 6 1 0 1Tyson, DeAngelo 21 7 14 1 9 0 0 0 0 2Brooks, Terrence 19 16 3 0 0 0 0 2 0 1Melvin, Rashaan 17 13 4 0 0 0 0 1 1 0Gorrer, Danny 16 16 0 0 0 1 15 1 0 0Guy, Lawrence 16 2 14 0 0 0 0 1 0 1Franks, Dominique 13 12 1 0 0 0 0 5 0 0Brown, Chykie 9 8 1 0 0 0 0 0 0 0McClellan, Albert 4 1 3 0 0 0 0 0 0 0Bilukidi, Christo 3 0 3 0 0 0 0 0 0 0Trawick, Brynden 3 2 1 0 0 0 0 0 0 0Walker, Casey 1 0 1 0 0 0 0 0 0 0Orr, Zachary 1 0 1 0 0 0 0 0 0 0Totals 966 602 364 49 362 11 135 80 14 10
*Will Hill returned an INT 44 yards for a TD at NO (11/24)
PLAYER TT SOLO AS FF FR BKMcClellan, Albert 13 11 2 1 1 0Orr, Zachary 7 6 1 0 0 0Levine, Anthony 6 5 1 0 0 0Miles, Jeromy 5 5 0 1 0 1Aiken, Kamar 4 2 2 0 0 0Mosley, C.J. 4 3 1 0 0 0Taliaferro, Lorenzo 4 3 1 0 0 0Trawick, Brynden 4 3 1 0 0 0Juszczyk, Kyle 3 3 0 0 0 0Elam, Matt 2 2 0 0 0 0Hill, Will 2 2 0 0 0 0Brown, Marlon 1 1 0 0 0 0Gorrer, Danny 1 1 0 0 0 0Jackson, Asa 1 0 1 0 0 1Urschel, John 1 1 0 0 0 0Webb, Lardarius 1 0 1 0 0 0Stewart, Darian 0 0 0 0 0 1Totals 59 48 11 2 1 3
Defensive and special teams statistics reflect press box stats.
WR LT LG C RG RT TE WR QB RB FB Offense: S. Smith E. Monroe K. Osemele J. Zuttah M. Yanda R. Wagner O. Daniels T. Smith J. Flacco J. Forsett K. Juszczyk DT DE NT SAM MIKE WILL RUSH RCB LCB SS FS Defense: H. Ngata C. Canty B. Williams C. Upshaw D. Smith C. Mosley T. Suggs J. Smith L. Webb M. Elam D. Stewart
DEFENSIVE STATISTICS SPECIAL TEAMS STATISTICS
RAVENS HONOR ROLL
RAVENS SEASON TRENDS
RAVENS COACHES
USUAL STARTING L INEUPS

2019 BALTIMORE RAVENS MEDIA GUIDE396
2014 POSTSEASON STATISTICSRESULTS AND ATTENDANCEWON 1 LOST 101/03 W 30-17 at Pittsburgh 62,78001/10 L 31-35 at New England 68,756
TEAM STATISTICS RAVENS OPPONENTTOTAL FIRST DOWNS 47 51 Rushing 15 9 Passing 27 37 Penalty 5 5 3rd Down: Made/Att 5/20 11/27 3rd Down Pct. 25.0% 40.7% 4th Down: Made/Att 4/4 2/3 4th Down Pct. 100.0% 66.7%POSSESSION AVG. 28:41 31:19TOTAL NET YARDS 727 809 Avg. Per Game 363.5 404.5 Total Plays 128 138 Avg. Per Play 5.7 5.9NET YARDS RUSHING 189 82 Avg. Per Game 94.5 41.0 Total Rushes 53 32NET YARDS PASSING 538 727 Avg. Per Game 269.0 363.5 Sacked/Yards Lost 1/13 7/47 Gross Yards 551 774 Attempts/Completions 74/46 99/67 Completion Pct. 62.2% 67.7% Had Intercepted 2 3PUNTS/AVERAGE 6/41.7 8/38.0NET PUNTING AVG. 6/34.2 8/34.9PENALTIES/YARDS 9/79 15/174FUMBLES/BALL LOST 3/1 4/1TOUCHDOWNS 7 6 Rushing 1 1 Passing 6 5 Returns 0 0
SCORE BY PERIODS 1 2 3 4 OT PTSRAVENS 14 17 17 13 0 61Opponents 10 13 14 15 0 52
SCORING TD RU PA RT K/PAT FG S PTSTucker 0 0 0 0 7/7 4/4 0 19Aiken 1 0 1 0 0 6Daniels 1 0 1 0 0 6Forsett 1 0 1 0 0 6Gillmore 1 0 1 0 0 6Pierce 1 1 0 0 0 6T. Smith 1 0 1 0 0 6S. Smith Sr. 1 0 1 0 0 6RAVENS 7 1 6 0 7/7 4/4 0 61Opponents 6 1 5 0 5/5 3/3 1 52
2-PT. CONVERSIONS: RAVENS 0-0, Opponents 0-1
SACKS: Dumervil 2, Jernigan 1, Ngata 1, Upshaw 1, B. Williams 1, McPhee 0.5, Suggs 0.5, RAVENS 7, Opponents 1
FUM/LOST: Flacco 1/0, Forsett 1/1, Juszczyk 1/0
PASSING ATT COMP YARDS COMP% YDS/ATT TD TD% INT INT% LG SACK/LOST RATINGFlacco 74 46 551 62.2% 7.45 6 8.1% 2 2.7% 40 1/13 100.7RAVENS 74 46 551 62.2% 7.45 6 8.1% 2 2.7% 40 1/13 100.7Opponents 99 67 774 67.7% 7.82 5 5.1% 3 3.0% 51t 7/47 95.3
RUSHING NO YDS AVG LG TDForsett 40 169 4.2 19 0Flacco 8 8 1.0 9 0Pierce 2 7 3.5 5t 1Toussaint 2 5 2.5 3 0Campanaro 1 0 0.0 0 0RAVENS 53 189 3.6 19 1Opponents 32 82 2.6 16 1
RECEIVING NO YDS AVG LG TDS. Smith Sr. 8 145 18.1 40 1Daniels 8 111 13.9 23 1M. Brown 6 48 8.0 13 0Juszczyk 6 45 7.5 11 0T. Smith 5 90 18.0 35 1Campanaro 4 39 9.8 16 0Forsett 3 24 8.0 16t 1Gillmore 2 30 15.0 21t 1Aiken 2 23 11.5 19t 1J. Jones 1 3 3.0 3 0Toussaint 1 -7 -7.0 -7 0RAVENS 46 551 12.0 40 6Opponents 67 774 11.6 51t 5
INTERCEPTIONS NO YDS AVG LG TDSuggs 1 3 3.0 3 0D. Smith 1 0 0.0 0 0Stewart 1 0 0.0 0 0RAVENS 3 3 1.0 3 0Opponents 2 0 0.0 0 0
PUNTING NO YDS AVG NET TB IN LG BLKKoch 5 250 50.0 34.2 0 0 53 1RAVENS 6 250 41.7 34.2 0 0 53 1Opponents 8 304 38.0 34.9 0 3 49 0
PUNT RETURNS RET FC YDS AVG LG TDJ. Jones 3 1 20 6.7 9 0Cason 1 0 5 5.0 5 0Campanaro 0 1 0 --- --- 0RAVENS 4 2 25 6.3 9 0Opponents 3 0 45 15.0 19 0
KICKOFF RETURNS NO YDS AVG LG TDJ.Jones 11 265 24.1 29 0RAVENS 11 265 24.1 29 0Opponents 9 203 22.6 28 0
FIELD GOALS 1-19 20-29 30-39 40-49 50+Tucker 0/0 2/2 0/0 1/1 1/1RAVENS 0/0 2/2 0/0 1/1 1/1Opponents 0/0 1/1 0/0 2/2 0/0
Tucker: (28G,45G,52G) (25G)Opponents: (45G, 22G, 47G) ()
YDS RET.PLAYER TT SOLO AS SACKS LOST INT YDS PD FF FRMosley, C.J. 19 12 7 0 0 0 0 0 1 0Melvin, Rashaan 18 15 3 0 0 0 0 0 0 0Smith, Daryl 16 13 3 0 0 1 0 1 2 0Webb, Lardarius 9 8 1 0 0 0 0 0 0 0Suggs, Terrell 8 3 5 0.5 2 1 3 1 0 0Williams, Brandon 7 5 2 1 9 0 0 0 0 0Hill, Will 6 5 1 0 0 0 0 2 0 0McPhee, Pernell 4 0 4 0.5 2 0 0 0 0 0Upshaw, Courtney 4 3 1 1 7 0 0 0 0 0Dumervil, Elvis 3 3 0 2 18 0 0 0 0 0Levine, Anthony 3 3 0 0 0 0 0 0 0 0Miles, Jeromy 3 2 1 0 0 0 0 0 0 0Ngata, Haloti 3 1 2 1 3 0 0 1 0 0Stewart, Darian 3 3 0 0 0 1 0 2 0 1Canty, Chris 2 2 0 0 0 0 0 0 0 0Jernigan, Timmy 2 2 0 1 6 0 0 0 0 0Cason, Antoine 1 1 0 0 0 0 0 0 0 0Elam, Matt 1 1 0 0 0 0 0 0 0 0Guy, Lawrence 1 0 1 0 0 0 0 0 0 0Totals 113 82 31 7 47 3 3 7 3 1
PLAYER TT SOLO AS FF FR BKJuszczyk, Kyle 4 0 4 0 0 0Aiken, Kamar 3 2 1 0 0 0Miles, Jeromy 3 2 1 1 0 0Orr, Zachary 3 1 2 0 0 0Brown, Marlon 2 1 1 0 0 0McClellan, Albert 2 1 1 0 0 0Elam, Matt 1 1 0 0 0 0Totals 18 8 10 1 0 0
Defensive and special teams statistics reflect press box stats.
DEFENSIVE STATISTICS SPECIAL TEAMS STATISTICS
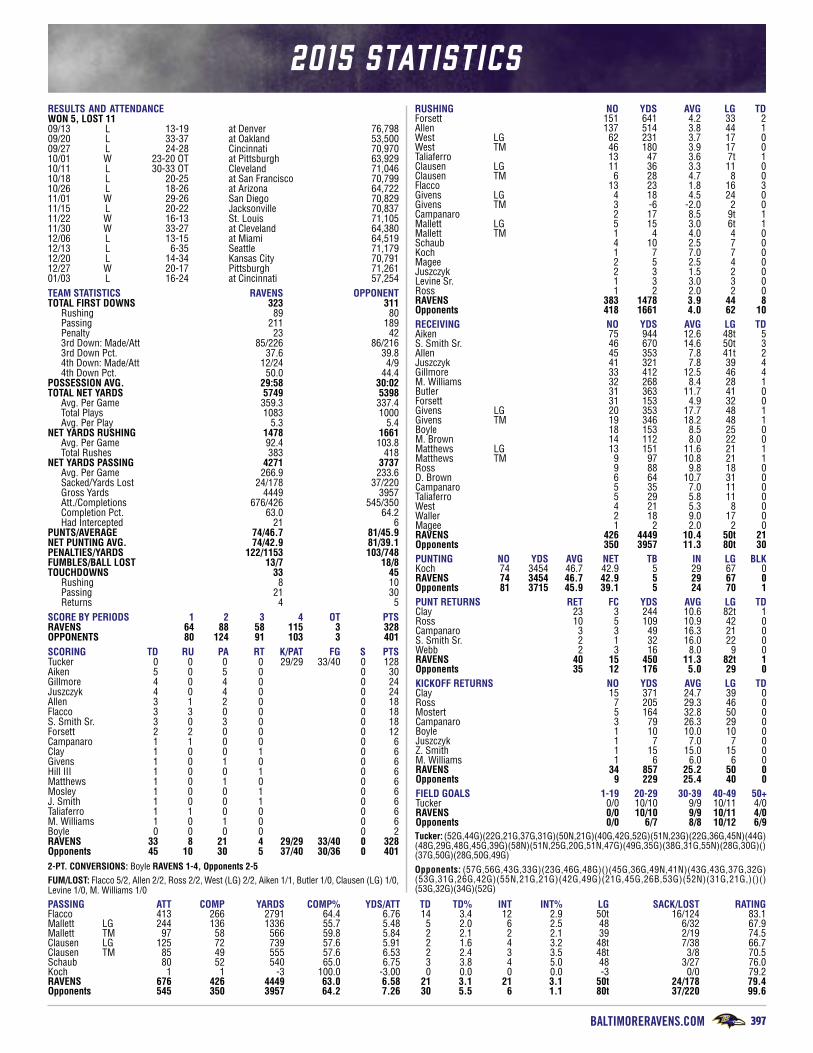
BALTIMORERAVENS.COM 397
2015 STATISTICSRESULTS AND ATTENDANCEWON 5, LOST 1109/13 L 13-19 at Denver 76,79809/20 L 33-37 at Oakland 53,50009/27 L 24-28 Cincinnati 70,97010/01 W 23-20 OT at Pittsburgh 63,92910/11 L 30-33 OT Cleveland 71,04610/18 L 20-25 at San Francisco 70,79910/26 L 18-26 at Arizona 64,72211/01 W 29-26 San Diego 70,82911/15 L 20-22 Jacksonville 70,83711/22 W 16-13 St. Louis 71,10511/30 W 33-27 at Cleveland 64,38012/06 L 13-15 at Miami 64,51912/13 L 6-35 Seattle 71,17912/20 L 14-34 Kansas City 70,79112/27 W 20-17 Pittsburgh 71,26101/03 L 16-24 at Cincinnati 57,254TEAM STATISTICS RAVENS OPPONENTTOTAL FIRST DOWNS 323 311 Rushing 89 80 Passing 211 189 Penalty 23 42 3rd Down: Made/Att 85/226 86/216 3rd Down Pct. 37.6 39.8 4th Down: Made/Att 12/24 4/9 4th Down Pct. 50.0 44.4POSSESSION AVG. 29:58 30:02TOTAL NET YARDS 5749 5398 Avg. Per Game 359.3 337.4 Total Plays 1083 1000 Avg. Per Play 5.3 5.4NET YARDS RUSHING 1478 1661 Avg. Per Game 92.4 103.8 Total Rushes 383 418NET YARDS PASSING 4271 3737 Avg. Per Game 266.9 233.6 Sacked/Yards Lost 24/178 37/220 Gross Yards 4449 3957 Att./Completions 676/426 545/350 Completion Pct. 63.0 64.2 Had Intercepted 21 6PUNTS/AVERAGE 74/46.7 81/45.9NET PUNTING AVG. 74/42.9 81/39.1PENALTIES/YARDS 122/1153 103/748FUMBLES/BALL LOST 13/7 18/8TOUCHDOWNS 33 45 Rushing 8 10 Passing 21 30 Returns 4 5SCORE BY PERIODS 1 2 3 4 OT PTSRAVENS 64 88 58 115 3 328OPPONENTS 80 124 91 103 3 401SCORING TD RU PA RT K/PAT FG S PTSTucker 0 0 0 0 29/29 33/40 0 128 Aiken 5 0 5 0 0 30Gillmore 4 0 4 0 0 24 Juszczyk 4 0 4 0 0 24Allen 3 1 2 0 0 18 Flacco 3 3 0 0 0 18S. Smith Sr. 3 0 3 0 0 18Forsett 2 2 0 0 0 12Campanaro 1 1 0 0 0 6Clay 1 0 0 1 0 6Givens 1 0 1 0 0 6Hill III 1 0 0 1 0 6Matthews 1 0 1 0 0 6Mosley 1 0 0 1 0 6J. Smith 1 0 0 1 0 6Taliaferro 1 1 0 0 0 6M. Williams 1 0 1 0 0 6Boyle 0 0 0 0 0 2RAVENS 33 8 21 4 29/29 33/40 0 328Opponents 45 10 30 5 37/40 30/36 0 4012-PT. CONVERSIONS: Boyle RAVENS 1-4, Opponents 2-5FUM/LOST: Flacco 5/2, Allen 2/2, Ross 2/2, West (LG) 2/2, Aiken 1/1, Butler 1/0, Clausen (LG) 1/0, Levine 1/0, M. Williams 1/0PASSING ATT COMP YARDS COMP% YDS/ATT TD TD% INT INT% LG SACK/LOST RATINGFlacco 413 266 2791 64.4 6.76 14 3.4 12 2.9 50t 16/124 83.1Mallett LG 244 136 1336 55.7 5.48 5 2.0 6 2.5 48 6/32 67.9Mallett TM 97 58 566 59.8 5.84 2 2.1 2 2.1 39 2/19 74.5Clausen LG 125 72 739 57.6 5.91 2 1.6 4 3.2 48t 7/38 66.7Clausen TM 85 49 555 57.6 6.53 2 2.4 3 3.5 48t 3/8 70.5Schaub 80 52 540 65.0 6.75 3 3.8 4 5.0 48 3/27 76.0Koch 1 1 -3 100.0 -3.00 0 0.0 0 0.0 -3 0/0 79.2RAVENS 676 426 4449 63.0 6.58 21 3.1 21 3.1 50t 24/178 79.4Opponents 545 350 3957 64.2 7.26 30 5.5 6 1.1 80t 37/220 99.6
RUSHING NO YDS AVG LG TDForsett 151 641 4.2 33 2 Allen 137 514 3.8 44 1 West LG 62 231 3.7 17 0 West TM 46 180 3.9 17 0 Taliaferro 13 47 3.6 7t 1Clausen LG 11 36 3.3 11 0Clausen TM 6 28 4.7 8 0Flacco 13 23 1.8 16 3Givens LG 4 18 4.5 24 0Givens TM 3 -6 -2.0 2 0Campanaro 2 17 8.5 9t 1Mallett LG 5 15 3.0 6t 1Mallett TM 1 4 4.0 4 0Schaub 4 10 2.5 7 0Koch 1 7 7.0 7 0Magee 2 5 2.5 4 0Juszczyk 2 3 1.5 2 0Levine Sr. 1 3 3.0 3 0Ross 1 2 2.0 2 0RAVENS 383 1478 3.9 44 8Opponents 418 1661 4.0 62 10RECEIVING NO YDS AVG LG TDAiken 75 944 12.6 48t 5S. Smith Sr. 46 670 14.6 50t 3Allen 45 353 7.8 41t 2Juszczyk 41 321 7.8 39 4Gillmore 33 412 12.5 46 4M. Williams 32 268 8.4 28 1Butler 31 363 11.7 41 0Forsett 31 153 4.9 32 0 Givens LG 20 353 17.7 48 1Givens TM 19 346 18.2 48 1Boyle 18 153 8.5 25 0M. Brown 14 112 8.0 22 0Matthews LG 13 151 11.6 21 1Matthews TM 9 97 10.8 21 1Ross 9 88 9.8 18 0D. Brown 6 64 10.7 31 0Campanaro 5 35 7.0 11 0Taliaferro 5 29 5.8 11 0West 4 21 5.3 8 0Waller 2 18 9.0 17 0Magee 1 2 2.0 2 0RAVENS 426 4449 10.4 50t 21Opponents 350 3957 11.3 80t 30 PUNTING NO YDS AVG NET TB IN LG BLKKoch 74 3454 46.7 42.9 5 29 67 0RAVENS 74 3454 46.7 42.9 5 29 67 0Opponents 81 3715 45.9 39.1 5 24 70 1PUNT RETURNS RET FC YDS AVG LG TDClay 23 3 244 10.6 82t 1Ross 10 5 109 10.9 42 0Campanaro 3 3 49 16.3 21 0S. Smith Sr. 2 1 32 16.0 22 0Webb 2 3 16 8.0 9 0RAVENS 40 15 450 11.3 82t 1Opponents 35 12 176 5.0 29 0KICKOFF RETURNS NO YDS AVG LG TDClay 15 371 24.7 39 0Ross 7 205 29.3 46 0Mostert 5 164 32.8 50 0Campanaro 3 79 26.3 29 0Boyle 1 10 10.0 10 0Juszczyk 1 7 7.0 7 0Z. Smith 1 15 15.0 15 0M. Williams 1 6 6.0 6 0RAVENS 34 857 25.2 50 0Opponents 9 229 25.4 40 0FIELD GOALS 1-19 20-29 30-39 40-49 50+Tucker 0/0 10/10 9/9 10/11 4/0RAVENS 0/0 10/10 9/9 10/11 4/0Opponents 0/0 6/7 8/8 10/12 6/9Tucker: (52G,44G)(22G,21G,37G,31G)(50N,21G)(40G,42G,52G)(51N,23G)(22G,36G,45N)(44G)(48G,29G,48G,45G,39G)(58N)(51N,25G,20G,51N,47G)(49G,35G)(38G,31G,55N)(28G,30G)()(37G,50G)(28G,50G,49G)Opponents: (57G,56G,43G,33G)(23G,46G,48G)()(45G,36G,49N,41N)(43G,43G,37G,32G)(53G,31G,26G,42G)(55N,21G,21G)(42G,49G)(21G,45G,26B,53G)(52N)(31G,21G,)()()(53G,32G)(34G)(52G)

2019 BALTIMORE RAVENS MEDIA GUIDE398
2015 STATISTICS
John Harbaugh, Head Coach; Jerry Rosburg, Special Teams Coordinator/Associate Head Coach; Dean Pees, Defensive Coordinator; Marc Trestman, Offensive Coordinator; Richard Angulo, Tight Ends; Juney Barnett, Asst. Strength and Conditioning; Andy Bischoff, Offensive Quality Control; Clarence Brooks, Defensive Line; Randy Brown, Kicking Consultant; Juan Castillo, Offensive Line; Scott Cohen, Coaching Consultant; John Egorugwu, Staff Assistant – Defense; Bobby Engram, Wide Receivers; Thomas Hammock, Running Backs; Chris Hewitt, Defensive Backs; Chris Horton, Staff Asst. – Special Teams; Mike Macdonald, Defensive Asst.; Don Martindale, Inside Linebackers; Megan McLaughlin, Football Information Mgr.; Ted Monachino, Linebackers; Marty Mornhinweg, Quarterbacks; Torrey Myers, Staff Asst. – Offense; Dan Parsons, Asst. to the Head Coach; Bob Rogucki, Strength and Conditioning; Eugene Shen, Director of Coaching Analytics; Martin Streight, Staff Asst. - Strength and Conditioning; Lonnie Teasley, Staff Asst. – Offense/Strength and Conditioning; Craig Ver Steeg, Senior Offensive Asst.; Todd Washington, Asst. Offensive Line; Matt Weiss, Cornerbacks; Drew Wilkins, Defensive Coaching Asst.
AP All-Pro:P Sam Koch (2nd Team), G/T Marshal Yanda (1st Team)PFWA Awards:P Sam Koch (All-AFC). G/T Marshal Yanda (All-NFL, All-AFC)Sporting News All-Pro:G/T Marshal Yanda
Pro Bowl:LS Morgan Cox, LB Elvis Dumervil, P Sam Koch, G Marshal YandaAFC Players of the Week:S Will Hill III (Week 12) - Special TeamsK Justin Tucker (Week 4, Week 8) - Special TeamsAFC Player of the Month:K Justin Tucker (November) - Special Teams
Ed Block Courage Award: TE Dennis PittaRavens Roost Unsung Hero & Extra Effort: P Sam KochTeam MVP (Baltimore Media): G/T Marshal Yanda
RecordRecord ..................................................................................................................................5-11vs. AFC North .........................................................................................................................3-3vs. AFC ....................................................................................................................................4-8vs. NFC ....................................................................................................................................1-3Home ......................................................................................................................................3-5Away .......................................................................................................................................2-6On Grass .................................................................................................................................2-5Artificial Turf ...........................................................................................................................3-6Outdoors ...............................................................................................................................5-10Indoors ...................................................................................................................................0-1Leading at Halftime .................................................................................................................2-3Tied at Halftime .......................................................................................................................0-1Trailing at Halftime ..................................................................................................................3-7Leading After 3 Quarters .........................................................................................................2-2Tied After 3 Quarters ...............................................................................................................0-0Trailing After 3 Quarters ..........................................................................................................3-9Decided by 7 Points or less .....................................................................................................5-7Decided by 3 Points or less .....................................................................................................4-3When Scoring First .................................................................................................................3-3When Not Scoring First ...........................................................................................................2-8
RecordPositive or Even Turnover Ratio ..............................................................................................3-2Negative Turnover Ratio ..........................................................................................................2-9Winning Penalty Ratio .............................................................................................................1-4Losing Penalty Ratio ...............................................................................................................3-6Overtime .................................................................................................................................1-1With a 100-Yard Rusher ..........................................................................................................1-1Without a 100-yard Rusher ...................................................................................................4-10With a 100-Yard Receiver .......................................................................................................1-5Without a 100-yard Receiver ...................................................................................................4-6With a 300-Yard Passer ..........................................................................................................1-5Without a 300-Yard Passer .....................................................................................................4-6When Allowing a 100-Yard Rusher .........................................................................................2-2When Not Allowing a 100-Yard Rusher ...................................................................................3-9When Allowing a 100-Yard Receiver .......................................................................................0-5When Not Allowing a 100-Yard Receiver .................................................................................5-6When Allowing a 300-Yard Passer ..........................................................................................1-4When Not Allowing a 300-Yard Passer ...................................................................................4-7When Recording 3 or more sacks ...........................................................................................2-6When Holding an Opponent Under 250 Net Yards ..................................................................1-2When Holding an Opponent Under 21 Points ..........................................................................3-2When Holding an Opponent Under 15 Points ..........................................................................1-1
YDS RET.PLAYER TT SOLO AS SACKS LOST INT YDS PD FF FRSmith, Daryl 121 72 49 3 19.5 1 -1 3 0 0Mosley, C.J. 115 75 40 4 18 0 0 7 1 1Hill III, Will 64 48 16 1 8 1 25 7 0 0Lewis, Kendrick 62 40 22 0 0 0 0 6 1 0Webb, Lardarius 56 48 8 0 0 1 3 11 0 0Smith, Jimmy 54 48 6 1 0 3* 24 10 0 0Williams, Brandon 54 36 18 2 19 0 0 2 1 0Upshaw, Courtney 51 27 24 2 13 0 0 3 2 3Dumervil, Elvis 48 29 19 6 33 0 0 1 1 2Guy, Lawrence 46 29 17 4.5 20.5 0 0 1 0 0Jernigan, Timmy 37 18 19 4 36.5 0 0 0 0 0Wright, Shareece 35 31 4 0 0 0 0 4 0 0Smith, Za’Darius 32 20 12 5.5 24.5 0 0 1 0 0Arrington, Kyle 28 22 6 0 0 0 0 3 1 0Canty, Chris 20 11 9 1 8 0 0 1 0 0Orr, Zachary 17 14 3 1 8 0 0 1 0 0Davis, Carl 11 4 7 0 0 0 0 2 0 0McClellan, Albert 11 7 4 1 9 0 0 1 0 1Urban, Brent 10 5 5 1 3 0 0 0 0 0Brooks, Terrence 7 6 1 0 0 0 0 1 0 0Trawick, Brynden 7 4 3 0 0 0 0 1 0 0Lewis-Moore, Kapron 3 3 0 0 0 0 0 0 0 0Davis, Will 1 1 0 0 0 0 0 1 0 0Levine Sr., Anthony 1 1 0 0 0 0 0 0 0 0Melvin, Rashaan 1 1 0 0 0 0 0 0 0 0Rolle, Jumal 1 1 0 0 0 0 0 0 0 0Walker, Tray 1 1 0 0 0 0 0 0 0 0Team 1 1 0 0 0 0 0 0 0 0Totals 895 603 292 37 220 6 51 67 7 7*Jimmy Smith returned an INT 24 yards for a TD at Den. (9/13)
INTERCEPTIONS NO YDS AVG LG TDJ. Smith 3 24 8.0 24t 1Hill III 1 25 25.0 25 0Webb 1 3 3.0 3 0D. Smith 1 -1 -1.0 -1 0RAVENS 6 51 8.5 25 1Opponents 21 340 16.2 90t 4SACKS: Dumervil 6, Z. Smith 5.5, Guy 4.5, Jernigan 4, Mosley 4, D. Smith 3, Upshaw 2, B. Williams 2, Canty 1, Hill 1, McClellan 1, Orr 1, J. Smith 1, Urban 1 RAVENS 37, Opponents 24
PLAYER TT SOLO AS FF FR BK Trawick, Brynden 9 9 0 0 0 0Levine Sr., Anthony 6 6 0 1 0 0McClellan, Albert 6 6 0 0 0 0Orr, Zachary 5 5 0 0 0 0Waller, Darren 3 3 0 0 0 0Brown, Arthur 2 2 0 0 0 0Brooks, Terrence 1 1 0 0 0 0Brown, Marlon 1 1 0 0 0 0Jackson, Asa 1 1 0 0 0 2Juszczyk, Kyle 1 1 0 0 0 0Koch, Sam 1 1 0 0 0 0Lewis, Kendrick 1 1 0 0 0 0Matthews, Chris 1 1 0 0 0 0Mosley, C.J. 1 1 0 0 0 0Mostert, Raheem 1 1 0 0 0 0Ross, Jeremy 1 1 0 0 0 0Taliaferro, Lorenzo 1 1 0 0 0 0Tucker, Justin 1 1 0 0 0 0Walker, Tray 1 1 0 0 0 0Guy, Lawrence 0 0 0 0 0 1Smith, Za’Darius 0 0 0 0 0 1Urban, Brent 0 0 0 0 0 1Totals 44 44 0 1 0 5Defensive and special teams statistics reflect press box stats.
WR LT LG C RG RT TE WR QB RB FB Offense: S. Smith E. Monroe/J. Hurst K. Osemele J. Zuttah M. Yanda R. Wagner C. Gillmore K. Aiken J. Flacco J. Forsett K. Juszczyk DT DE NT SAM MIKE WILL RUSH RCB LCB SS FS Defense: T. Jernigan C. Canty B. Williams C. Upshaw D. Smith C. Mosley E. Dumervil J. Smith L. Webb W. Hill III K. Lewis
DEFENSIVE STATISTICS SPECIAL TEAMS STATISTICS
RAVENS HONOR ROLL
RAVENS SEASON TRENDS
RAVENS COACHES
USUAL STARTING L INEUPS

BALTIMORERAVENS.COM 399
2016 STATISTICSRESULTS AND ATTENDANCEWON 8, LOST 809/11 W 13-7 Buffalo 71,10409/18 W 25-20 at Cleveland 67,43109/25 W 19-17 at Jacksonville 60,12710/02 L 27-28 Oakland 71,15210/09 L 10-16 Washington 71,31810/16 L 23-27 at NY Giants 78,48710/23 L 16-24 at NY Jets 78,16011/06 W 21-14 Pittsburgh 71,28611/10 W 28-7 Cleveland 70,92111/20 L 17-27 at Dallas 93,05611/27 W 19-14 Cincinnati 70,90312/04 W 38-6 Miami 70,91612/12 L 23-30 at New England 66,82912/18 W 27-26 Philadelphia 71,22312/25 L 27-31 at Pittsburgh 66,27601/01 L 10-27 at Cincinnati 54,944TEAM STATISTICS RAVENS OPPONENTTOTAL FIRST DOWNS 316 294 Rushing 79 74 Passing 205 190 Penalty 32 30 3rd Down: Made/Att 86/233 75/214 3rd Down Pct. 36.9 35.0 4th Down: Made/Att 8/19 11/16 4th Down Pct. 42.1 68.8POSSESSION AVG. 30:46 29:14TOTAL NET YARDS 5563 5154 Avg. Per Game 347.7 322.1 Total Plays 1079 993 Avg. Per Play 5.2 5.2NET YARDS RUSHING 1463 1430 Avg. Per Game 91.4 89.4 Total Rushes 367 384NET YARDS PASSING 4100 3724 Avg. Per Game 256.3 232.8 Sacked/Yards Lost 33/243 31/223 Gross Yards 4343 3947 Att./Completions 679/439 578/369 Completion Pct. 64.7 63.8 Had Intercepted 16 18PUNTS/AVERAGE 80/45.8 91/44.9NET PUNTING AVG. 80/39.9 91/40.5PENALTIES/YARDS 125/1111 95/900FUMBLES/BALL LOST 19/7 26/10TOUCHDOWNS 32 39 Rushing 10 10 Passing 20 28 Returns 2 1SCORE BY PERIODS 1 2 3 4 OT PTSRAVENS 93 82 62 106 0 343Opponents 73 79 60 109 0 321SCORING TD RU PA RT K/PAT FG S PTSTucker 0 0 0 0 27/27 38/39 0 141 West 6 5 1 0 0 36S. Smith 5 0 5 0 0 34 Wallace 4 0 4 0 0 26Dixon 3 2 1 0 0 18Perriman 3 0 3 0 0 18 Flacco 2 2 0 0 0 12Moore 2 0 0 2 0 12Pitta 2 0 2 0 0 12Waller 2 0 2 0 0 12Aiken 1 0 1 0 0 6Gillmore 1 0 1 0 0 6Juszczyk 1 1 0 1 0 6Young 0 0 0 0 0 2RAVENS 32 10 20 2 27/27 38/39 0 343Opponents 39 10 28 1 33/36 16/22 2 3212-PT. CONVERSIONS: S. Smith 2, Juszczyk, Wallace RAVENS 4-5, Opponents 1-3FUM/LOST: Flacco 5/3, Hester 5/1, West 2/0, Cox 1/0, Dixon 1/0, Jernigan 1/1, Moore 1/0, Mosley 1/1, Pitta 1/1, Wallace 1/0
SACKS: Suggs 8, Jernigan 5, Judon 4, Dumervil 3, Pierce 2, Urban 2, Guy 1, McClellan 1, Powers 1, Z. Smith 1, Webb 1, Weddle 1, B. Williams 1, TEAM 31, Opponents 33
PASSING ATT COMP YARDS COMP% YDS/ATT TD TD% INT INT% LG SACK/LOST RATINGFlacco 672 436 4317 64.9 6.42 20 3.0 15 2.2 95t 33/243 83.5Mallett 6 3 26 50.0 4.33 0 0.0 1 16.7 12 0/0 22.2Tucker 1 0 0 0.0 0.00 0 0.0 0 0.0 0 0/0 39.6RAVENS 679 439 4343 64.7 6.40 20 2.9 16 2.4 95t 33/243 82.6Opponents 578 369 3947 63.8 6.83 28 4.8 18 3.1 79t 31/223 86.9
RUSHING NO YDS AVG LG TDWest 193 774 4.0 41 5Dixon 88 382 4.3 20 2 Forsett TM 31 98 3.2 11 0Campanaro 3 72 24.0 39 0Flacco 21 58 2.8 16 2Allen 9 34 3.8 7 0Wallace 5 31 6.2 13 0Juszczyk 5 22 4.4 10t 1Moore 3 19 6.3 10 0Perriman 1 2 2.0 2 0Taliaferro 1 0 0.0 0 0Mallett 5 -6 -1.2 -1 0Koch 2 -23 -11.5 0 0RAVENS 367 1463 4.0 41 10Opponents 384 1430 3.7 85t 10
RECEIVING NO YDS AVG LG TDPitta 86 729 8.5 30 2Wallace 72 1017 14.1 95t 4S.Smith 70 799 11.4 52t 5Juszczyk 37 266 7.2 40 0West 34 236 6.9 17 1Perriman 33 499 15.1 53t 3Dixon 30 162 5.4 16 1Aiken 29 328 11.3 29 1Forsett TM 11 36 3.3 10 0Waller 10 85 8.5 15 2Gillmore 8 71 8.9 22 1Moore 7 46 6.6 13 0Boyle 6 44 7.3 20 0Allen 3 15 5.0 8 0Taliaferro 3 10 3.3 8 0D. Brown 6 64 10.7 31 0Campanaro 5 35 7.0 11 0Taliaferro 5 29 5.8 11 0RAVENS 439 4343 9.9 95t 20Opponents 369 3947 10.7 79t 28INTERCEPTIONS NO YDS AVG LG TDWeddle 4 92 23.0 53 0Mosley 4 40 10.0 28 0Orr 3 23 7.7 14 0Young 2 22 11.0 16 0Powers 2 1 0.5 1 0Lewis-Harris LG 1 11 11.0 11 0W. Davis 1 0 0.0 0 0Jernigan 1 0 0.0 0 0Webb 1 0 0.0 0 0RAVENS 18 178 9.9 53 0Opponents 16 169 10.6 51 0PUNTING NO YDS AVG NET TB IN LG BLKKoch 80 3665 45.8 39.9 5 37 68 0RAVENS 80 3665 45.8 39.9 5 37 68 0Opponents 91 4089 44.9 40.5 8 31 63 1PUNT RETURNS RET FC YDS AVG LG TDHester 25 15 180 7.2 28 0Campanaro 5 3 63 12.6 17 0Webb 2 3 3 1.5 3 0RAVENS 32 21 246 7.7 28 0Opponents 33 14 375 11.4 85t 0KICKOFF RETURNS NO YDS AVG LG TDHester 19 466 24.5 60 0Moore 7 162 23.1 34 0Webb 1 8 8.0 8 0Boyle 1 0 0.0 0 0RAVENS 28 636 22.7 60 0Opponents 27 559 20.7 45 0FIELD GOALS 1-19 20-29 30-39 40-49 50+Tucker 0/ 0 4/ 4 10/ 11 14/ 14 10/ 10RAVENS 0/ 0 4/ 4 10/ 11 14/ 14 10/ 10Opponents 0/ 0 9/ 9 5/ 5 2/ 4 0/ 4Tucker: (50G,37G)(52G,49G,41G)(43G,42G,37G,53G)(24G,43G)(31G)(23G,39G,35G)(50G,49G,44G)(49G,42G)(25G,40G)(46G)(52G,57G,54G,36G)(55G)(34B,50G,38G,37G) (53G,47G)(41G,38G,46G,23G)(30G) Opponents: (49N)(52N)(49G,52B)()(56N,27G)(21G,31G)(22G,51B)()()(30G,21G)(23G,36G)(46N)()(45G,34G,27G,29G)(36G)(23G,24G)

2019 BALTIMORE RAVENS MEDIA GUIDE400
2016 STATISTICS
John Harbaugh, Head Coach; Jerry Rosburg, Special Teams Coordinator/Associate Head Coach; Marty Mornhinweg, Offensive Coordinator; Dean Pees, Defensive Coordinator; Richard Angulo, Tight Ends; Juney Barnett , Assistant Strength & Conditioning; Andy Bischoff, Offensive Assistant; Randy Brown, Kicking Consultant; Juan Castillo, Offensive Line; Scott Cohen, Coaching Consultant; John Egorugwu, Staff Assistant-Defense; Joe Cullen, Defensive Line; Bobby Engram, Wide Receivers; Leslie Frazier, Secondary; Thomas Hammock, Running Backs; Chris Hewitt, Defensive Backs; Chris Horton, Assistant Special Teams; Mike Macdonald, Defensive Assistant; Don Martindale, Linebackers; Megan McLaughlin, Executive Assistant/Football Information Manager; Torrey Myers, Staff Assistant-Offense; Dan Parsons, Assistant to the Head Coach; Bob Rogucki, Strength and Conditioning; Eugene Shen, Director of Coaching Analytics; Steve Saunders, Director of Performance & Recovery; Martin Streight, Staff Assistant-Strength and Conditioning; Lonnie Teasley, Staff Assistant-Offense/Strength and Conditioning; Craig Ver Steeg, Senior Offensive Assistant; Todd Washington, Assistant Offensive Line; Matt Weiss, Offensive Assistant; Drew Wilkins, Defensive Coaching Assistant
AP All-Pro:K Justin Tucker (1st Team)ILB Zachary Orr (2nd Team)G Marshal Yanda (2nd Team)PFWA Awards:K Justin Tucker (All-NFL)Sporting News All-Pro:G Marshal Yanda; K Justin Tucker
Pro Bowl:LS Morgan Cox, FB Kyle Juszczyk, ILB C.J. Mosley, K Justin Tucker, S Eric Weddle, G Marshal Yanda, C Jeremy ZuttahAFC Players of the Week:DE Lawrence Guy (Week 2) - Special TeamsK Justin Tucker (Week 12) - Special TeamsAFC Player of the Month:K Justin Tucker (September) - Special Teams
FedEx Air Player of the Week: QB Joe FlaccoEd Block Courage Award: S Matt ElamRavens Roost Unsung Hero: LB Zachary OrrRavens Roost Extra Effort: K Justin TuckerTeam MVP (Baltimore Media): K Justin Tucker
RecordRecord ....................................................................................................................................8-8vs. AFC North .........................................................................................................................4-2vs. AFC ....................................................................................................................................7-5vs. NFC ....................................................................................................................................1-3Home ......................................................................................................................................6-2Away .......................................................................................................................................2-6On Grass .................................................................................................................................8-3Artificial Turf ...........................................................................................................................0-5Outdoors .................................................................................................................................8-7Indoors ...................................................................................................................................0-1Leading at Halftime .................................................................................................................7-3Tied at Halftime .......................................................................................................................0-1Trailing at Halftime ..................................................................................................................1-4Leading After 3 Quarters .........................................................................................................7-1Tied After 3 Quarters ...............................................................................................................0-0Trailing After 3 Quarters ..........................................................................................................1-7Decided by 7 Points or less .....................................................................................................6-5Decided by 3 Points or less .....................................................................................................2-1When Scoring First .................................................................................................................7-4When Not Scoring First ...........................................................................................................1-4
RecordPositive or Even Turnover Ratio ..............................................................................................6-6Negative Turnover Ratio ..........................................................................................................2-2Winning Penalty Ratio .............................................................................................................3-1Losing Penalty Ratio ...............................................................................................................4-6Overtime .................................................................................................................................0-0With a 100-Yard Rusher ..........................................................................................................0-1Without a 100-yard Rusher .....................................................................................................8-7With a 100-Yard Receiver .......................................................................................................2-2Without a 100-yard Receiver ...................................................................................................6-6With a 300-Yard Passer ..........................................................................................................2-2Without a 300-Yard Passer .....................................................................................................6-6When Allowing a 100-Yard Rusher .........................................................................................2-3When Not Allowing a 100-Yard Rusher ...................................................................................6-5When Allowing a 100-Yard Receiver .......................................................................................2-2When Not Allowing a 100-Yard Receiver .................................................................................6-6When Allowing a 300-Yard Passer ..........................................................................................0-3When Not Allowing a 300-Yard Passer ...................................................................................8-5When Recording 3 or more sacks ...........................................................................................4-1When Holding an Opponent Under 250 Net Yards ..................................................................3-0When Holding an Opponent Under 21 Points ..........................................................................7-1When Holding an Opponent Under 15 Points ..........................................................................5-0
YDS RET.PLAYER TT SOLO AS SACKS LOST INT YDS PD FF FROrr, Zach 130 89 41 0 0 3 23 5 1 2Mosley, C.J. 92 56 36 0 0 4 40 8 1 0Weddle, Eric 89 48 41 1 5 4 92 13 1 0Webb, Lardarius 73 59 14 1 10 1 0 5 0 0McClellan, Albert 52 31 21 1 2 0 0 0 0 0Williams, Brandon 51 34 17 1 3 0 0 1 0 0Wright, Shareece 50 42 8 0 0 0 0 6 0 0Young, Tavon 50 41 9 0 0 2 22 8 0 1Pierce, Michael 35 19 16 2 9 0 0 1 0 0Suggs, Terrell 35 28 7 8 62 0 0 4 3 0Powers, Jerraud 33 26 7 1 11 2 1 5 0 0Smith, Jimmy 32 29 3 0 0 0 0 4 0 0Jernigan, Timmy 31 16 15 5 36 1 0 3 0 1Guy, Lawrence 28 14 14 1 9 0 0 0 1 1Judon, Matthew 27 12 15 4 34 0 0 2 0 1Smith, Za’Darius 20 10 10 1 9 0 0 1 1 0Dumervil, Elvis 11 9 2 3 24 0 0 0 2 1Onwuasor, Patrick 10 1 9 0 0 0 0 0 0 0Urban, Brent 10 7 3 2 9 0 0 2 0 0Levine Sr., Anthony 7 4 3 0 0 0 0 1 0 0Davis, Will 4 1 3 0 0 1 0 1 0 0Beyer, Brennen 3 2 1 0 0 0 0 0 0 0Correa, Kamalei 3 2 1 0 0 0 0 1 1 0Lewis-Harris, Chris 1 0 1 0 0 0 0 0 0 0Lewis, Kendrick 1 1 0 0 0 0 0 0 0 0Elam, Matt 1 1 0 0 0 0 0 0 0 0Moore, Chris 0 0 0 0 0 0 0 0 0 *1Totals 879 582 297 31 223 18 178 71 11 8*Chris Moore recovered a muffed snap on a punt for a TD at NYJ (10/23)
INTERCEPTIONS NO YDS AVG LG TDWeddle 4 92 23.0 53 0Mosley 4 40 10.0 28 0Orr 3 23 7.7 14 0Young 2 22 11.0 16 0Powers 2 1 0.5 1 0Lewis-Harris LG 1 11 11.0 11 0W. Davis 1 0 0.0 0 0Jernigan 1 0 0.0 0 0Webb 1 0 0.0 0 0RAVENS 18 178 9.9 53 0Opponents 16 169 10.6 51 0
PLAYER TT SOLO AS FF FR BKOnwuasor, Patrick 10 8 2 1 0 0Waller, Darren 6 6 0 0 0 0Lewis, Kendrick 5 5 0 1 0 0Juszczyk, Kyle 4 3 1 0 0 0Levine Sr., Anthony 4 3 1 0 0 0Moore, Chris 4 3 1 0 1 0Elam, Matt 3 3 0 0 0 0Huff, Marqueston 3 3 0 0 1 0McClellan, Albert 3 3 0 0 0 0Orr, Zach 3 3 0 0 0 0Young, Tavon 3 3 0 0 0 0Aiken, Kamar 2 2 0 0 0 0Boyle, Nick 2 2 0 0 0 0Canady, Maurice 2 2 0 0 0 0Carter, Chris 2 2 0 0 0 0Wright, Shareece 2 2 0 0 1 0Correa, Kamalei 1 1 0 0 0 0Cox, Morgan 1 1 0 0 0 0Hester Sr., Devin 1 1 0 0 0 0Koch, Sam 1 1 0 0 0 0Williams, Maxx 1 1 0 0 0 0Allen, Javorius 0 0 0 0 0 1Guy, Lawrence 0 0 0 0 0 1Urban, Brent 0 0 0 0 0 1Williams, Brandon 0 0 0 0 0 1Totals 63 58 5 2 3 4Defense and special teams statistics reflect press box stats.
WR LT LG C RG RT TE WR QB RB FB Offense: Wallace Stanley M. Yanda J. Zuttah V. Ducasse R. Wagner D. Pitta S. Smith Sr. J. Flacco T. West K. Juszczyk DT DE NT SAM MIKE WILL RUSH RCB LCB SS FS Defense: T. Jernigan L. Guy B. Williams A. McClellan C. Mosley C. Mosley T. Suggs J. Smith T. Young E. Weddle L. Webb
DEFENSIVE STATISTICS SPECIAL TEAMS STATISTICS
RAVENS HONOR ROLL
RAVENS SEASON TRENDS
RAVENS COACHES
USUAL STARTING L INEUPS

BALTIMORERAVENS.COM 401
2017 STATISTICSRESULTS AND ATTENDANCEWON 9, LOST 709/10 W 20-0 at Cincinnati 55,25409/17 W 24-10 Cleveland 70,60509/24 L 7-44 at Jacksonville (London) 84,59210/01 L 9-26 Pittsburgh 71,12610/08 W 30-17 at Oakland 54,98010/15 L 24-27 OT Chicago 70,61610/22 L 16-24 at Minnesota 66,75110/26 W 40-0 Miami 70,40811/05 L 20-23 at Tennessee 67,32211/19 W 23-0 at Green Bay 77,94511/27 W 23-16 Houston 70,35712/03 W 44-20 Detroit 70,50012/10 L 38-39 at Pittsburgh 60,06912/17 W 27-10 at Cleveland 56,43412/23 W 23-16 Indianapolis 70,59012/31 L 27-31 Cincinnati 70,507TEAM STATISTICS RAVENS OPPONENTTOTAL FIRST DOWNS 311 296 Rushing 111 87 Passing 168 179 Penalty 32 30 3rd Down: Made/Att 76/223 82/222 3rd Down Pct. 34.1 36.9 4th Down: Made/Att 10/16 6/16 4th Down Pct. 62.5 37.5POSSESSION AVG. 30:38 29:22TOTAL NET YARDS 4886 5201 Avg. Per Game 305.4 325.1 Total Plays 1054 1045 Avg. Per Play 4.6 5.0NET YARDS RUSHING 1856 1780 Avg. Per Game 116.0 111.3 Total Rushes 460 435NET YARDS PASSING 3030 3421 Avg. Per Game 189.4 213.8 Sacked/Yards Lost 27/205 41/280 Gross Yards 3235 3701 Att./Completions 567/363 569/333 Completion Pct. 64.0 58.5 Had Intercepted 13 22PUNTS/AVERAGE 85/44.3 77/44.6NET PUNTING AVG. 85/40.3 77/40.2PENALTIES/YARDS 91/749 96/807FUMBLES/BALL LOST 19/4 22/12TOUCHDOWNS 42 32 Rushing 14 12 Passing 20 18 Returns 8 2SCORE BY PERIODS 1 2 3 4 OT PTSRAVENS 46 148 66 135 0 395Opponents 50 108 69 73 3 303SCORING TD RU PA RT K/PAT FG S PTSTucker 0 0 0 0 39/39 34/37 0 141 Allen 6 4 2 0 0 36Collins 6 6 0 0 0 36 Moore 4 0 3 1 0 24Wallace 4 0 4 0 0 24Watson 4 0 4 0 0 24 Maclin 3 0 3 0 0 18Campanaro 2 0 1 1 0 12Ricard 2 0 2 0 0 12J. Smith 2 0 0 2 0 12West 2 2 0 0 0 12Flacco 1 1 0 0 0 6Mayle 1 1 0 0 0 6Mosley 1 0 0 1 0 6Rainey 1 0 0 1 0 6Weddle 1 0 0 1 0 6B. Williams 1 0 0 1 0 6M. Williams 1 0 1 0 0 6Boyle 0 0 0 0 0 2RAVENS 42 14 20 8 39/39 34/37 0 395Opponents 32 12 18 2 27/30 28/33 0 3032-PT. CONVERSIONS: Boyle, RAVENS 1-3, Opponents 0-2FUM/LOST: Flacco 6/0, Campanaro 4/0, Collins 4/2, Jensen 1/0, Mallett 1/0, Watson 1/0, West 1/1, M. Williams 1/1
SACKS: Suggs 11, Judon 8, Henry 3.5, Z. Smith 3.5, Bowser 3, Levine 3, Jefferson 2.5, Webb 2, Mosley 1, Onwuasor 1, Pierce 1, Weddle 1, Davis 0.5, RAVENS 41, Opponents 27
PASSING ATT COMP YARDS COMP% YDS/ATT TD TD% INT INT% LG SACK/LOST RATINGFlacco 549 352 3141 64.1 5.72 18 3.3 13 2.4 66 27/205 80.4Mallett 16 9 56 56.3 3.50 2 12.5 0 0.0 12 0/0 103.1Koch 2 2 38 100.0 19.00 0 0.0 0 0.0 22 0/0 118.8RAVENS 567 363 3235 64.0 5.71 20 3.5 13 2.3 66 27/205 81.4Opponents 569 333 3701 58.5 6.50 18 3.2 22 3.9 57 41/280 72.4
RUSHING NO YDS AVG LG TDCollins 212 973 4.6 50 6Allen 153 591 3.9 37 4 West 39 138 3.5 13 2Woodhead 14 56 4.0 10 0Flacco 25 54 2.2 25 1Campanaro 5 42 8.4 19 0M. Williams 2 6 3.0 4 0Wallace 1 4 4.0 4 0Mayle 2 2 1.0 2t 1Rainey 1 2 2.0 2 0Mallett 4 -3 -.8 0 0Moore 2 -9 -4.5 -4 0RAVENS 460 1856 4.0 50 14Opponents 435 1780 4.1 59 12RECEIVING NO YDS AVG LG TDWatson 61 522 8.6 33t 4Wallace 52 748 14.4 66 4Allen 46 250 5.4 20 2Maclin 40 440 11.0 48t 3Woodhead 33 200 6.1 22 0Boyle 28 203 7.3 16 0Collins 23 187 8.1 37 0Campanaro 19 173 9.1 18 1Moore 18 248 13.8 30t 3M. Williams 15 86 5.7 17 1Perriman 10 77 7.7 14 0Rainey 5 18 3.6 12 0Whalen 4 23 5.8 9 0Ricard 4 12 3.0 6t 2Matthews 3 25 8.3 12 0West 2 23 11.5 15 0RAVENS 363 3235 8.9 66 20Opponents 333 3701 11.1 57 18INTERCEPTIONS NO YDS AVG LG TDWeddle 6 85 14.2 45t 1Carr 4 57 14.3 33 0J. Smith 3 58 19.3 50t 1Mosley 2 94 47.0 63t 1Humphrey 2 33 16.5 18 0Webb 2 10 5.0 10 0Bowser 1 27 27.0 27 0Jefferson 1 13 13.0 13 0Levine Sr. 1 8 8.0 8 0RAVENS 22 385 17.5 63t 3Opponents 13 340 26.2 90t 2PUNTING NO YDS AVG NET TB IN LG BLKKoch 84 3765 44.8 40.3 3 40 67 1RAVENS 85 3765 44.3 40.3 3 40 67 1Opponents 77 3438 44.6 40.2 1 12 67 0PUNT RETURNS RET FC YDS AVG LG TDCampanaro 27 18 291 10.8 77t 1Rainey 2 0 22 11.0 13 0Webb 2 8 7 3.5 7 0Whalen 1 1 2 2.0 2 0RAVENS 32 27 322 10.1 77t 1Opponents 34 18 277 8.1 46 0KICKOFF RETURNS NO YDS AVG LG TDMoore 13 346 26.6 87 0Rainey 11 338 30.7 96t 1Campanaro 6 159 26.5 40 0Collins 2 50 25.0 27 0Mayle 2 43 21.5 29 0RAVENS 34 936 27.5 96t 1Opponents 33 615 18.6 37 0FIELD GOALS 1-19 20-29 30-39 40-49 50+Tucker 0/0 7/7 11/11 11/12 5/7RAVENS 0/0 7/7 11/11 11/12 5/7Opponents 0/0 5/5 10/11 10/12 3/5Tucker: (25G, 25G)(58N, 28G)()(62N, 42G)(22G, 21G, 44G)(27G, 31G, 50G)(48G, 57G, 47G)(55G, 48G, 46B)(30G, 49G)(32G, 39G, 23G)(53G, 31G, 49G)(38G, 46G, 51G)(47G)(31G, 43G)(30G, 39G, 36G)(46G, 34G)Opponents: ()(38G)(23G, 45G, 29G)(31G, 49G, 44N)(32G)(24G, 40G)(52G, 51G, 43G, 43G, 43G, 34G, 32G)(50N)(48G)()(25G, 36G, 37G)(43N)(52G, 43G, 24G, 46G)(45G)(38B, 60N, 48G, 38G, 30G)(32G)

2019 BALTIMORE RAVENS MEDIA GUIDE402
2017 STATISTICS
John Harbaugh, Head Coach; Jerry Rosburg, Special Teams Coordinator/Associate Head Coach; Marty Mornhinweg, Offensive Coordinator; Dean Pees, Defensive Coordinator; Richard Angulo, Assistant Offensive Line; Juney Barnett , Strength & Conditioning; Andy Bischoff, Offensive Assistant; Randy Brown, Kicking Consultant; Scott Cohen, Opponent Analyst; Joe Cullen, Defensive Line; Joe D’Alessandris, Offensive Line; Bobby Engram, Wide Receivers; Thomas Hammock, Running Backs; Chris Hewitt, Secondary; Chris Horton, Assistant Special Teams; Sterling Lucas, Admin. Assistant-Defense; Mike Macdonald, Defensive Backs; Don Martindale, Linebackers; Megan McLaughlin, Football Information Manager; Jesse Minter, Admin. Assistant-Defense; Dan Parsons, Assistant to the Head Coach; Greg Roman, Senior Offensive Assistant/Tight Ends; Eugene Shen, Director of Coaching Analytics; Steve Saunders, Director of Performance; Ron Shrift, Admin. Assistant-Performance; Travis Switzer, Admin. Assistant-Performance; Craig Ver Steeg, Offensive Assistant/Quarterbacks; Matt Weiss, Offensive Assistant; Drew Wilkins, Asst. Defensive Line
AP All-Pro:ILB C.J. Mosley (2nd Team)K Justin Tucker (2nd Team)
PFWA Awards:WR/RS Michael Campanaro (All-AFC, punt returner), G/T Jermaine Eluemunor (All-Rookie Team), LB C.J. Mosley (All-AFC), K Justin Tucker (All-AFC), S Eric Weddle (All-AFC)
Pro Bowl:ILB C.J. Mosley, OLB Terrell Suggs, S Eric Weddle
AFC Players of the Week:P Sam Koch (Week 12 & 15) - Special TeamsOLB Matthew Judon (Week 11) - Defense
AFC Player of the Month:K Justin Tucker (November) - Special Teams
NFL Walter Payton Man of the Year Finalist: TE Benjamin Watson
Bart Starr NFL Award Winner: TE Benjamin Watson
Pepsi Rookie of the Week: OLB Tyus Bowser (Week 2)
Team MVP (Baltimore Media): OLB Terrell Suggs
Media Good Guy (Baltimore Media): S Eric Weddle
Ed Block Courage Award: TE Benjamin Watson
Ravens Roost Unsung Hero: OLB Matthew Judon
Ravens Roost Extra Effort: GM Ozzie Newsome
RecordRecord ....................................................................................................................................9-7vs. AFC North ..........................................................................................................................3-3vs. AFC ....................................................................................................................................7-5vs. NFC ....................................................................................................................................2-2Home ......................................................................................................................................5-3Away .......................................................................................................................................4-4On Grass .................................................................................................................................8-6Artificial Turf ...........................................................................................................................1-1Outdoors .................................................................................................................................9-6Indoors ...................................................................................................................................0-1Leading at Halftime .................................................................................................................9-0Trailing at Halftime ..................................................................................................................0-7Tied at Halftime .......................................................................................................................0-0Tied After 3 Quarters ...............................................................................................................0-0Leading After 3 Quarters .........................................................................................................9-1Trailing After 3 Quarters ..........................................................................................................0-6Decided by 7 Points or Less ...................................................................................................2-4Decided by 3 Points or Less ...................................................................................................0-3When Scoring First .................................................................................................................8-1When Not Scoring First ...........................................................................................................1-6
RecordPositive or Even Turnover Ratio ..............................................................................................9-2Negative Turnover Ratio ..........................................................................................................0-5Winning Penalty Ratio .............................................................................................................5-4Losing Penalty Ratio ...............................................................................................................4-3Overtime .................................................................................................................................0-1With a 100-Yard Rusher ..........................................................................................................1-1Without a 100-Yard Rusher .....................................................................................................8-6With a 100-Yard Receiver .......................................................................................................2-0Without a 100-Yard Receiver ..................................................................................................7-7With a 300-Yard Passer ..........................................................................................................0-0Without a 300-Yard Passer .....................................................................................................9-7When Allowing a 100-Yard Rusher .........................................................................................0-3When Not Allowing a 100-Yard Rusher ...................................................................................9-4When Allowing a 100-Yard Receiver .......................................................................................3-1When Not Allowing a 100-Yard Receiver .................................................................................6-6When Allowing a 300-Yard Passer ..........................................................................................0-1When Not Allowing a 300-yard Passer ....................................................................................9-6When Recording 3 or More Sacks ..........................................................................................6-3When Holding an Opponent Under 250 Net Yards ..................................................................3-0When Holding an Opponent Under 21 Points ..........................................................................9-0When Holding an Opponent Under 15 Points ..........................................................................5-0
YDS RET.PLAYER TT SOLO AS SACKS LOST INT YDS PD FF FRMosley, C.J. 132 96 36 1 13 2 94 7 3 3Onwuasor, Patrick 88 65 23 1 1 0 0 2 1 1Jefferson, Tony 79 56 23 2.5 13.5 1 13 2 1 0Weddle, Eric 63 49 14 1 7 6 85 8 2 1Judon, Matthew 58 50 8 8 70 0 0 3 2 1Carr, Brandon 56 50 6 0 0 4 57 12 0 0Pierce, Michael 49 32 17 1 5 0 0 0 0 2Suggs, Terrell 49 37 12 11 71.5 0 0 4 4 0Webb, Lardarius 37 35 2 2 13 2 10 4 1 0Humphrey, Marlon 34 30 4 0 0 2 33 11 0 0Henry, Willie 32 23 9 3.5 23 0 0 5 0 1Williams, Brandon 30 18 12 0 0 0 0 2 0 1Smith, Jimmy 28 26 2 0 0 3 58 9 0 1Canady, Maurice 24 19 5 0 0 0 0 1 0 0Smith, Za’Darius 24 15 9 3.5 22 0 0 1 1 0Levine Sr., Anthony 20 18 2 3 21 1 8 3 0 1Davis, Carl 19 12 7 0.5 7 0 0 1 0 0Bowser, Tyus 9 7 2 3 13 1 27 3 0 0Correa, Kamalei 8 6 2 0 0 0 0 1 0 0Williams, Tim 6 5 1 0 0 0 0 0 0 0Clark, Chuck 5 5 0 0 0 0 0 2 0 0Ricard, Patrick 5 3 2 0 0 0 0 0 0 0Wormley, Chris 5 5 0 0 0 0 0 0 0 0Kaufusi, Bronson 4 1 3 0 0 0 0 0 0 0Urban, Brent 4 3 1 0 0 0 0 1 0 0Hill, Jaylen 1 1 0 0 0 0 0 1 0 0Totals 869 667 202 41 280 22 385 83 15 12
PLAYER TT SOLO AS FF FR BKLevine Sr., Anthony 9 5 4 0 0 0Allen, Javorius 8 7 1 0 0 0Clark, Chuck 8 7 1 0 0 0Mayle, Vince 8 8 0 0 0 0Correa, Kamalei 7 4 3 0 0 0Johnson, Steven 5 4 1 0 0 0Matthews, Chris 4 4 0 0 0 0Canady, Maurice 3 3 0 0 0 0Judon, Matthew 3 1 2 0 0 0Tucker, Justin 3 3 0 0 0 0Bowser, Tyus 2 2 0 0 0 0Freeny, Jonathan 2 2 0 0 0 0Hill, Jaylen 2 1 1 0 0 0Onwuasor, Patrick 2 2 0 0 0 0Webb, Lardarius 2 2 0 0 0 0Cox, Morgan 1 1 0 0 0 0Henry, Willie 1 1 0 0 0 0Jean-Baptiste, Stanley 1 1 0 0 0 0Kaufusi, Bronson 1 1 0 0 0 0McRae, Tony 1 1 0 0 0 0Moore, Chris 1 1 0 0 0 0Jefferson, Tony 0 0 0 0 0 1Totals 74 61 13 0 0 1
Defense and special teams statistics reflect press box stats.
WR LT LG C RG RT TE WR QB RB OTHER Offense: J. Maclin R. Stanley J. Hurst R. Jensen M. Skura A. Howard B. Watson M. Wallace J. Flacco A. Collins M. Williams (TE) DT DE NT SAM MIKE WILL RUSH RCB LCB SS FS Defense: B. Williams C. Davis M. Pierce M. Judon C. Mosley P. Onwuasor T. Suggs J. Smith B. Carr T. Jefferson E. Weddle
DEFENSIVE STATISTICS SPECIAL TEAMS STATISTICS
RAVENS HONOR ROLL
RAVENS SEASON TRENDS
RAVENS COACHES
USUAL STARTING L INEUPS