(1996). Judgments of correlation in scatter plots
17
HIROSHLII-| J()('RS')L OF- '1t.17-flE.llATIC.S Á1]¿'C'AI'IO\' 4 I2¡--11, 199b 25 JUDGMEI\TS OF CORRELATION II{ SCATTER PLOTS: STUDBNTS' INTUITIVE STRATEGIES AND PRECOIVCEPTIONS Antonio Esrnpr. Utiiversit¡' of Jaért, Spaitr Carmen Brtlxnno Universit)'of Granada,Spain (Rt'teirtd lluy 16, 1995) Abstract In this paper\\'edescribe art experimental s1ud1 of 3l.j pre univer- sit¡' students' strategies u'he-n assessing correlation in scatter plots. \\'e present an original classification of students' strategies fronr a mathe- nraticalpoint of vieu',r'hich allou'sus to determine concepts and theo- rer-ns in action. Correspondence anall'sis is trsedto shou' the effect <tf task rariablesof the itenrson studertts' strategies arrd. finalll'. ue describe three differentstudents' rnisconceptions currcerning statistical associatiorr. INTRODUCTION The concepts of correlation and regressi.ln, and,in general of association. ertend functirinal dependence and are fundamental for manl'statistical methc¡cls that are used in making predictior-rs and taliing decisions in such areas as politics. econonrics, medicine and edLrcation. Nlarlvof these applications intend to find causalexplana- tions that allou' us tcl understand our environment. Ho'ur.ever, although research niethodolog¡' artd decisionn-raking is sr"rpported by' the stLrdi'of association betu'een the relel'ant variables,the existe¡rce of associa- tion doesnot necessaril¡'implv a causeeffect relationship. but merelv the existence of a co variationbetrveen variables. Sometinres it is possible to find a high coefficient of correlation iu variables in rvhich thereis lio causal link (llllet and Erickson, 19t16). Besides this epistemological difficulty'. ps1'chological research has shorvnthat juclging association is not ¿ir-r intnitive capabilitl'. Adults soruetiures prefer to base their judgment on their previous beliefs aboutthe tl'pe of associatior-r that oughttcr be
Transcript of (1996). Judgments of correlation in scatter plots
HIROSHLII-| J()( 'RS')L OF- '1t.17-flE.l lATIC.S Á1]¿'C'AI'IO\' 4 I2¡--11, 199b 25
JUDGMEI\TS OF CORRELATION II{ SCATTER PLOTS:STUDBNTS' INTUITIVE STRATEGIES
AND PRECOIVCEPTIONS
Antonio Esrnpr.Uti iversi t¡ ' of Jaért , Spaitr
Carmen BrtlxnnoUnivers i t ) ' o f Granada,Spa in
(Rt'teirtd lluy 16, 1995)
AbstractIn th is paper \ \ 'e descr ibe ar t exper imenta l s1ud1 o f 3 l . j p re un iver -
sit¡' students' strategies u'he-n assessing correlation in scatter plots. \\ 'e
present an or iginal c lassi f icat ion of students' strategies fronr a mathe-
nrat ical point of v ieu' , r 'h ich al lou's us to determine concepts and theo-
rer-ns in action. Correspondence anall'sis is trsed to shou' the effect <tf
task ra r iab les o f the i tenrs on s tuder t ts ' s t ra teg ies ar rd . f ina l l l ' . ue
describe three di f ferent students' rnisconcept ions currcerning stat ist ical
associat iorr .
INTRODUCTION
The concepts of correlat ion and regressi . ln, and, in general of associat ion. ertend
funct ir inal dependence and are fundamental for manl 'stat ist ical methc¡cls that are used
in making predict ior-rs and tal i ing decisions in such areas as pol i t ics. econonrics,
medicine and edLrcat ion. Nlar lv of these appl icat ions intend to f ind causal explana-
t ions that al lou' us tc l understand our environment.
Ho'ur.ever, although research niethodolog¡' artd decision n-raking is sr"rpported by'
the stLrdi 'of associat ion betu'een the relel 'ant var iables,the existe¡rce of associa-
t ion does not necessari l ¡ ' implv a cause effect relat ionship. but merelv the existence
of a co var iat ion betrveen variables. Sometinres i t is possible to f ind a high coeff ic ient
of correlat ion iu var iables in rvhich there is l io causal l ink ( l l l let and Erickson, 19t16).
Besides this epistemological di f f icul ty ' . ps1'chological research has shorvn that
juclging associat ion is not ¿ir-r intni t ive capabi l i t l ' . Adults soruet iures prefer to base
their judgment on their previous bel iefs about the t l 'pe of associat ior-r that ought tcr be
26 Arrtonio Estepa and Carrnen Bat¿urrr(,
betrn'een the var iables that are going to be studied than on t l - re cnrpir i t ; r . r , 'nt ingencies
presented in the data.
Psychological research in this area has mainly concentrated on ls l cont ingencl '
tables and provides us 'uvi th valuable information concerning students' I )crf()nrance
and strategies when judging associat ion in this t1 'pe of task. Nevertheless, f rr im the
point of v ielv of Mathematics Educat ion. the ident i f icat ion of students' preconcept ior-rs
(Artigue, 1990; Confrey, 1990) is needed to plan adequate instruction. As Cor-rfrey
(1990) pointed out, the relevance of the research on students' conceptious is because
sometimes these conceptions differ in fundamental aspects fron-r the scientific con-
cepts that rve try to teach and thel 'are resistant to chauge in spi te of instruct ion.
In this paper an experimental study with pre-universi ty students is descr ibed,
whose aim q'as to ident i fy students'preconcept ions concerning correlat ion in scatter
plots. Students' judgments of association and strategies n'ere used as empirical indica-
tors of their concept ions. We present an or iginal c lassi f icat ion of the strategies,
from a mathematical point of v ierv, in r i 'h ich rve haveident i f iedconceptsandtheo-
rems in action as described by Vergnaud (1982). Correspondence analysis (Greenacre,
1984) is used to show the strllcture of students' strategies and the relationship betrveen
the strategies and the task var iables.
PSYCHOLOGICAL RESEARCH ON STATISTICAL ASSOCIATION
Research on this topic has mainl l ' concentrated in cont ingencl ' tables, al though
there is some research concerning scatter plot, such as those from Erlick and N'Iil ls
(1967) and Lane and cols. (1985).
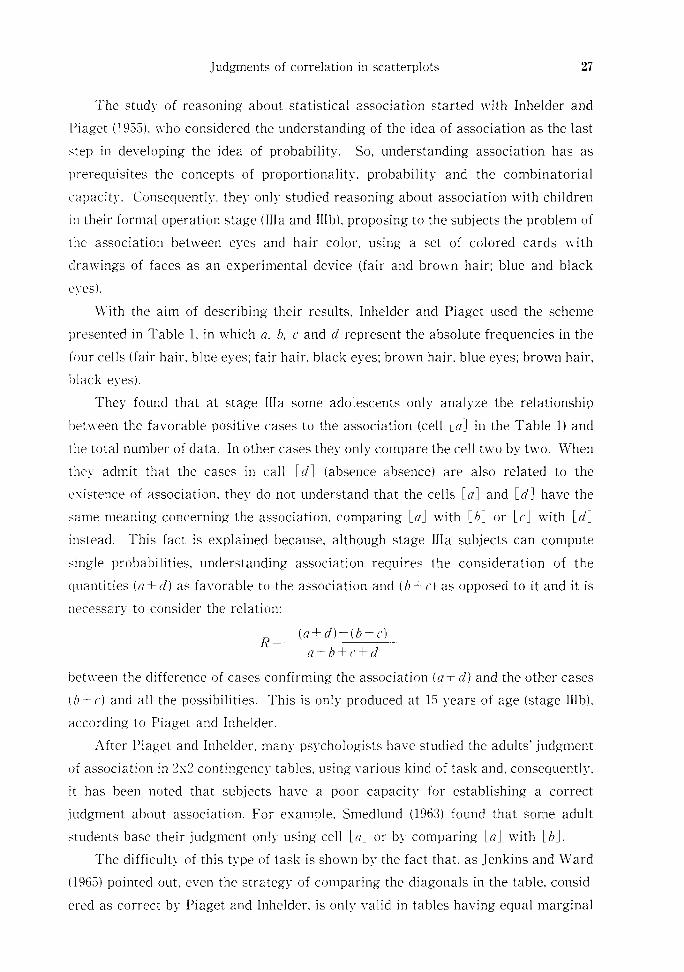
A cont ingency table or cross-tabulat ion is used to present, in a sunrnrar ized lva¡ ' .
the frequencies in a populat ion or sample. c lassi f ied b¡ ' tu 'o stat ist ical var iables. In
its simplest form, u'hen the variables onl1, involr,e trvo different categories. it takes the
format oresented in Table 1.
Table 1. Tvpical format for the 2x2 cont ingencl, table
Not B 'I'otal
A
Nt i t A
a
('
b
¿
u t b
c l t l
To ta l 0 + ( b+d d + h l _ r + ¿
Judgments of correlation in scatterplots
The stLrdl' of reasor.ring about statistical association started lr.' ith Inhelder and
l ' ] iaget (1955), u 'ho considered the understanding of the idea of associat ion as the last
step in developing the idea of probabi l i ty. So, understanding associat ion has as
prerequisi tes the concepts of proport ional i t l ' . probabi l i ty and the combinator ial
ca¡raci t l ' . L lonsecluent l l ' , thel ' onl l 'studied reasoning about associat ion rvi th chi ldren
in their fornlal operat ion stage ( l l la and I I Ib), proposing to t l - re subjects the problem of
the associat ion betu.een eyes and hair color, using a set of colored cards u' i th
clrarvings of faces as an experimental device ( fair and brou'n hair ; blue aud black
e] 'es).
With the aim of describing their results, Inhelder and Piaget used the scheme
presented in Table f , in u,hich a, b, c and d represent the altsolute frequencies in the
four cel ls ( fair hair , blue e1.gs, fair hair , black e-ves; brorvn hair , blue e) 'es; brorvn hair ,
black e1'es).
They' fotrnd that at stage I I Ia some adolescents onl1, analyze the relat ionship
betrveen the favorable posit ive cases to the associat ion (cel l [¿] in the Table 1) and
the total number of data. In other cases thel' onll ' compare the cell tu,o by tu'o. When
thev admit that the cases in cal l [ r / ] (absence absence) are also related to the
eristence of associat ion, thel 'do not understand that the cel ls [¿] and [¿1] have the
san-)e meaning concerning the associat ion, comparing [ru] rv i th [ó] or Ic] with Ir / ]
instead. This fact is explained because, al though stage I I Ia subjects can compute
single probabi l i t ies, understanding associatíou requires the cor-rsiderat ion of the
cl trant i t ies (a-tc l) as favorable to the associat ion and (óf c) as opposed to i t and i t is
luecessar],- to consider the relation:
^ ( r t t d \ - ( b - i \K -
, t ' b - r + , 1 -
i retr leen the cl i f ference of cases conf irming the associat ion (¿¿t d) and the other cases
(ó+c) and a l l the poss ib i l i t i es . Th is i s on l i ' p roduced a t 15 1 'ears o f age (s tage I I Ib ) ,
accord i r rs lo P iagef and Inhc lder .
After Piaget and hrhelder, man). ps1'cholcigists har.e studied the adults' judgment
of associat ion in ?x2 cont ingencl ' tables, rrs ing r .ar ious kind of task and, con,sequent l l ' ,
i t has been noted that subjects har,e a poor capacit l ' for establ ishing a correct
judgmer-rt about associat ion. For example, Smedlund (196,1) found that some adult
students base their judgnent onl l ,using cel l [¿] or b1'comparing [¿] r ,v i th [á] .
The di f f icul t t ' of this tvpe of task is shou'r .r b: ' the fact that. as Jenkins a¡rd \ \ ¡ard
(1965) pointed out, even the strategy.of cornparing the diagonals in the table, consid-
ered as correct bl ' Piaget and Inhelder, is onl .v val id in tables har, ing equal marginal
27
28 Antonio Estepa and Carnren Batanero
frequencies for the independent variable. Nevertheless. in the researcl.r of Allar-r ancl
Jenk ins (1983) and Shak lee and Tucker (198( ) ) th is s t ra teg l 'u 'as u ' ide l i ' used b1 'adr - r l t s .
For the general case, Jenliins and \\'-ard have proposecl, as the correct strategl', the
comparison of the di f ference betu'een the t t 'o condit ional probabi l i t ies, P(B A) and I '
(B lÁl :
oa i b t ' + d
Another point of interest in this topic is that Chapman and Chapman (1967)
showed that there are conrnron expectat ions and bel iefs about the relat ionship
between the var iables that cause the impression of enrpir ical cort ingencies. This
phenomenon has been described as " i l lusor l . correlat ion." because people maintain
their bel iefs in spi te of evidence of the independence of var iables. Vi tal experience
and cultural environment of the subject contr ibute to the formation of these theories
that are used in interpreting data and facts around us. .Tennings, Ar-nabile and Rciss
(1982), Wright and NIurphl ' (1984) and Al lo¡ 'and Tabachnik (198'1), among others, have
studied the effect that prei'ious theories about the context of the problem have on
judging associat ion.
The general conclusion is that u'hen there is agreement betu.een data ar-rd previ-
ous expectat ion people increase their conf idence in the attr ibut ion of co var iat ion, but
when data do not coincide rvith these theories there is a cogr-ritive conflict and the
accuracy in the perception of co variation depends on the relative strength of the tu-cr
sources of information.
As regards to sca t te r p lo t , Lane e t a l . (1985) a rgued tha t u 'hen a var iab le \ - i s
linearly related to a variable X, then the relation betu'een Y and X can be represented
as Y: bXIe . ln th is equat ion ó i s the s lope o f the regress ion l ine and ¿ ' i s a random
error lvhose mean value is ec¡ual to zero. The squared I)earsc-u-r's corre]ation betu,eelr
X and Y (r') is determined from the follou'ine identitr':
A 2 q 2, . ¿ -
u ' ' r - r r \'
á ,s1 rs í r r /
In this expressiotr Si is the var iance of X and S¿ the error var iance, therefore
Pearson's correlat ion is affected by the cornponents of s lope, error var iance, and
variance of X.
These three components of Pearson's correlat ion and the presentat ion format
(graphical and tabular) u,ere manipulated in three experiments b-v Laue et al . (1985) .
The f i rst two experiments used naive subjects, and the third experiment used
experts. The major conclusions u,ere:
.Tuclgnrents of correl¿rtion in -scatterplots
(l) scatter plclts u'ith the sar-ne r'¿ilue of Pearson's correlatior-r ,,vere judged to
posses differerlt degrees of correlation 'ulhen the correlations n'as besed on
ciifferent contbinations of the threc contpolteltrs;
0 $ 'het l Pearsot . t 's corre lat ior t u 'as helc l constant , the error vanance , , l ,as the
nta in cornponent af fect ing people ' ,s responses.
(3) graphical for t r ta ts lead to h igher per fornrance than c l id tabular formats. T l - r is
effect u-as larger fc¡r naive people than experts.
Er l ic l i and \ I i l ls (1967) presented to thei r s tudents a ser ies c¡ f X and Y coorc l ina¡es
i t l sec l t tence, ask ing them for an est imat ion of the corre lat ion coef f ic ient . Thei r resul ts
i r ld icate a greater accurac) ' in est imat ing posi t ive corre lat ions, and posi t ive b ias r ¡ f
est i l .nates u 'hen the sequel tce inc luded a ferv large and manl , smal l deviat ions thal l
u'hen the data u.ere homoqeneous.
METHOD
The u'orli $'e presettt here is part of ri ' ider research concerning the effect of ateaching experi t r tet t t , based on problenr solving and on the use of conrputers, on thelearning of stat ist ical associat i , tn (Estepa, 199J, Estepa et al . , 199-1; Batanero et al . .1996) .
Sample
The sanlple cor ls isted of 213 students in the last 1-ear of secondarl 'school (18 1'earold studerl ts). I t is at this ler,el u,here the topic of associat ion is introduced in theSpanish curr iculum. The qr.rest ionnaire rvas given to the studeuts before the instruc-tion n'as started. So this stttd¡'can be cclnsiclerecl as a research ol.r students preconcep-
t iuns concernir-rg stzrt ist ical assc¡ciat ion (Art igue, 1990; Confre¡. ' , 1gg0). About half thestudents (111i) u 'ere males and half females (100); 124 students had fol lou'ed a scient i f i -calll ' oriellted scottclarl' curriculum and the rest a humanitl"s curric¡lluur before ther.ansn'ered the qrrest ionnaire.
Questionnaire
The quest ionnaire inclLrded 3 i tems concerning scatter plots and is presented as a¡apperrcl ix. A pi lot studl ' of the quest ionnaire n'as performecl rv i th an aclcl i t iorral sampleof 51 stlrdeltts, ri 'hich served to check the reliabilit¡, ' and the coding sl.stem of thestttdents' alls\\'ers altd to improve the final version. Since factor anall'sis of stuclents'ans\\'er t(] the complete c¡uestionnzrire had shriu.n a niultidintensional structure, ageneral izabi l i t l ' st t tdr ' (Brennan. 1982) u'as performeci, instead of computing a¡ index
29
30 Antonio Estepa and Carmen Batanercl
of internal consistenc)'. For the complete questionnaire, cornposed b1' 1() itenrs.
including scatter plots, contingerrcy tables and comparison of tu'o sar-nples, \\¡e
obtained a general izabi l i ty index G-0.86 as a nreasure of possibi l i ty of extendiug our
conclusions to the hypothet ical i tem populat ion and another inder G:t1.94 of general-
izabi l i ty to subjects populat ion.
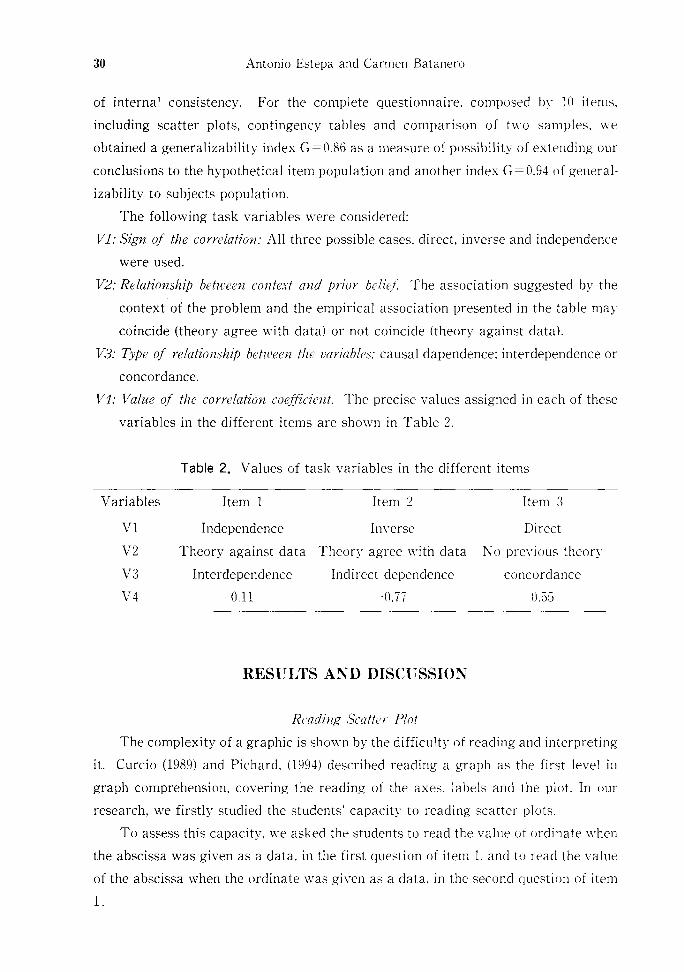
The follorving task variables u'ere considered:
V1:Sign of the correlation: All three possible cases, direct, inverse and independence
were used.
V2: Relationship between context and prior bcliel. The association suggested b1' the
context of the problem and the empir ical associat ion presented in the table may
coincide (theory agree n' i th data) or not coincide (theory against data).
V3: Type of relationship beht,een the t;ariables.' causal dapendence; ir-rterdependence or
concordance.
V4: Value of the correlation coffit-iertt. The precise values assigned in each of these
variables in the different items are shorvn in Table 2.
f able 2. Values of task variables in the different items
Variables Item 1 I tem 2 Iter-n 3
V1
v2V3
\.4
Independerrce
Theory against data
Interdependence
0 . 1 1
hrverse
Theorr agree $' i th data
Indirect deperrdence
0.7 i
Direct
No previous t l teor l
concordance
0.55
RESULTS AND DISCUSSION
Rcaclittg Scctttt,r Plc¡l
The complexi t l , of a graphic is shoq'n b1' the di f f icul t¡ ' of reading and interpret ing
i t . Curcio (1989) and Pichard, (1994) descr ibed reading a graph as the f i rst level in
graph comprehension, covering the reading of the axes, iabels and the piot. In our
research, r , l 'e f i rst ly studied the students'capacity to reading scatter plots.
To assess this capacity, rve asked the students to read the value <¡f ordinate u'hen
the abscissa was given as a data, in the first question of item 1. and to reacl the r.altre
of the abscissa u'hen the ordinate rvas given as a data, in the second question of iten-r
1
Iudgments of correlation in scatterplots
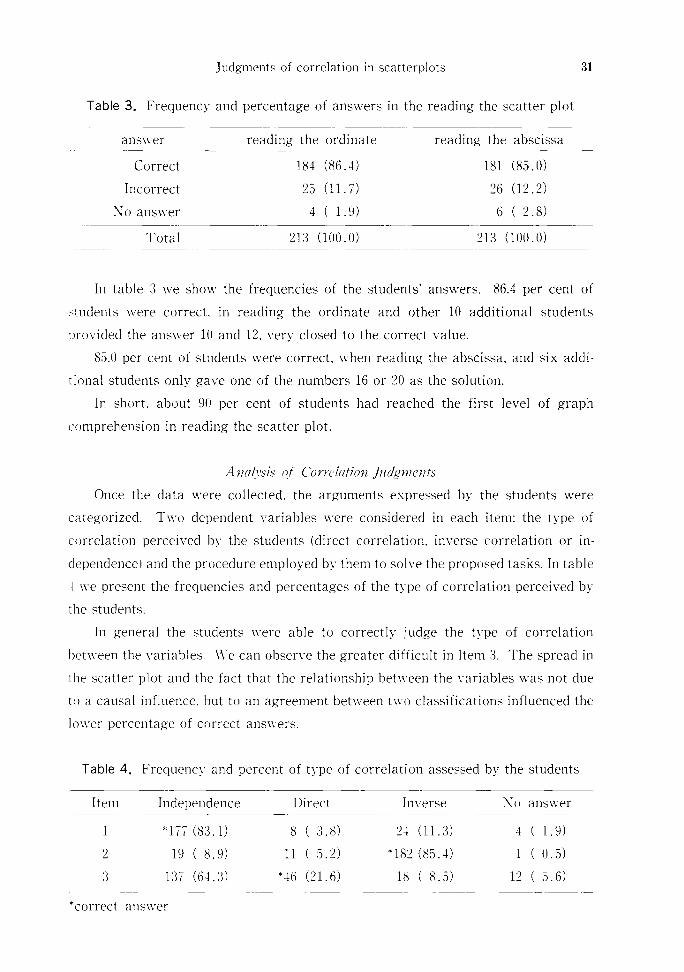
Table 3. Frequencl 'and percentage of answers i r- i the reading the scatter plot
a lls\\'er reading the ord inate reading the abscissa
31
Correct
Inccirrect
Nc¡ ansrver
( 8 6 . . 1 )
( 1 1 . 7 )
( 1 . 9 )
( 85 .0 )
(12.2)
( 2 .8 )
181
26
6
lB.1
L J
4
Tota l 213 (100 .0 ) 213 ( l 00 .0 )
In table 3 u,e shclu' the frequencies of the students' ansu'ers. 86.4 per cent of
students were correct, in reading the ordinate and other 10 addit ional students
pror, ided the ansu'er 10 and 12, ver l 'c losed to the correct value.
85.0 per cent cif students \\'ere correct, r'u'hen reading the abscissa, and six addi-
t ional students only gave one of the numbers 16 or 20 as the solut ion.
In short. about 90 per cent c¡f students had reached the first level of graph
comprehension in reading the scatter plot .
Anolysi< o.f Corrclotion ltdgntcuts
Once the data u'ere collected, the argunrents erpressed bl' the studer-rts \\'ere
categorized. Tu'o deper-rdent variables u'ere considered in each item: the t-vpe of
correlat ior.r perceived bl ' the students (direct correlat ion. inverse correlat icxr or in-
clependence) and the procedure enrplol 'ed bi ' them to solve the proposed tasks. In table
1 u'e present the frequencies and percentages of the t)'pe of correlation perceived b-v
the students.
hr general the students \\'ere able to cc-rrrectll ' judge the t1'pe of correlation
betu'een the r .ar iables. \ \ Ie can obsen'e the greater di f f icLr l t in l tem l l . The spread in
t l re scatter plot and the fact that the relat ionsl-r ip betu'een the var iables \ . 'as not due
to a causal influence, but to an agreement betlr.een tu'o classifications inflr-renced the
Iou'er percentage of correct ans\\-ers.
Table 4. Frequencl ' and percent of t ¡ 'pe of correlat ion assessed b1. the students
Iterlr Independence Direct Inrrerse No ansn'er
I'2
3
- 1 7 7 ( 8 3 . 1 )
1e ( 8 .e )1 3 i ( 6 4 . 3 )
8 ( l i . 8 )
1 1 ( 5 . 2 ). . 1 6 ( 2 1 . 6 )
21 01 .3 ).182 (95. ,1)
18 ( 8 .5 )
I ( 1 . 9 )
l ( 0 .s )12 ( s .6 )
tc<l r rect ar lswer
32 Antor.rio Estepa ancl Carnten Batanerrr
Classification o.i Stud(nts' Strategies in ScattcÍ pl,,í,
-front ct Xlulltt,matiL'ul Poiut t¡.f l'it:tt,
In the previous anal l 's is, \ \ 'e have shou'n hou' conre students have . , )r¡rct l ) '
perceived the ty 'pe of correlat ion in the data, n 'hich is an indicator of corrcct cor lcep-
t ions concerning correlat ion. But the idea of correlat ior-r , as is the case of nta¡¡.mathematical cot lcepts, is not a sinrple ic lea. So, some students ma1- have correctintui t ive concept ions concerning sonre propert ies related to the ic lea of correlat ionmixed lv i th some incorrect concept ions concerning di f ferent propert ies u-hich har,e led
them to choose an incorrect or partiall)' c()rrect strategt'. All these concepticins neecl
to be ident i f ied, to plan adequate instrucr ion.
With the aim of identify'ir-rg rvhich of the properties linked to the co¡cept ofcorrelation lvere intuitivell ' used correctll ' or incorrectll ' b¡' our students, u,e anal]'zedthe mathematical concepts and theorems in act iol . l that could be impl ied in thedifferent procedures and the type of errors relatecl to the sarle.
This task is, in the opinion of \ /ergnaud (1982; 1990) essent ial to the didact icanalysis. Hou'ever, Vergnaud reco!{uizes that a theoren i¡r act ion is r-rot alu 'ar.s atheorem, because then the student 's recognit ion of the pert inence ancl t ruth of thetheorem q'ottld be needed. But he also sr.rggests that " cxplicit cortcepts tturl tltcort,t¡tsare only the tisible part o.i tlu' itcbt:rg t¿f conc'eptttctli¿utit¡tt; tt,itltottt tlrc hiclclen purt,
constituted b)'the operatiL'c it¿t'aríants, tlrc t:ísible purt tutulcl bt ttotling." (\"ergpaud,
1990, p. 145). Taking this analy 's is as a base for c lassi f icat ion, u 'e har.e ident i f ied thefollowing students' strategies, u'hich u'ilt be clescribed in the follou,ing paragraphs (a
code will be included in bracliets for each strategl', to be enplol'ed in the frequencl'table 5 and in the correspondence anall'sis of these strategies).
Correct strategies:
51: Global comparison (GLOBAL): The student performed a correct global cor-npari-son of the relationships betlveen the tu,o variables. Students rvho enplol'ed thisstrategy could implicitly be using the follou,ing theoren TI: " Inclefendence til(ensthe inuariance of the distributiott of tlte dependent t:ctriuble )' u'hen concliti6ttccltt' ith a ualue of X". For example, in itenr 3 some students argued that both judges
give simi lar punctuat ion to each student to just i f l . c lependence.
52: Increasins ( INCREASE): Using the increasing, decreasir-rg or constant shape 9fthe scatter plot to just i fy the type of depeuderrce. Here, students inipl ic i t l l ' coulduse the theorem T2: "The int'reosiug,/ rlt,crcasitrg -shope o.f thc scattcr plol slntrsthe existence o_f a dircct /in¿,ct.sc (orn,luÍiott ()Í roriublL.s."
Judgr.ner-rts of correlation in scatterplots
lellt4Uruo tI94 qlratesies :
Sll: Pattern comparison (PA'I'1'ERN): hr itenr lJ the studer-rt compared the scatter plot
u- i th a l inear funct ion to correct l l 'argument the associat ion betu'een the r .ar i -
ables. hr this strategl' the thec¡rem 'f3
could be implicit: " Il ' lun \'ott c(tn .find rt
good.fit t¡.f tltt 'st'uttcr plot ltL a.ñutt'tít¡tt, tJrcre ís u motlcrutt'or ltigh t'orrclutit¡n
bctu'ct'u tltt, ttt 't¡ ruriublt's". llori'ever, if the relatior-rship is not linear, the coeffi-
c ient ma1' have lou' \ 'a lue.
S-1: Correct interpretat ion of isolated points (CORRtrCTP): f rorn rvhich thel '
deduced the correct t1-pe of correlat ion. For example. comparing the f i rst and last
point in item 2. Hou'er,er the-v do not use the complete information provided in
the scatter plot shou' ing a lc lcal ist concept ion of correlat ion.
Incorrect strategies:
S5: Incorrect interpretat ion of isolated points ( INCOITRECTP). For example,
conparir-rg the drau-n matches of the tearns in first and in nineteenth place in item
1. Here u,as also shou'n the local ist concept ion of the correlat ion.
56: Previous theories (PTHEORY): The student based his judgments on previous
beliefs about the relationshop betrveer-r the r.ariables, ir-r spite of evidence of the
data concerning a di f ferent type of correlat ion. Here' ,r ,e can ident i fy the " i l lusory.
correlat ion" mechanisn.
S7: Other variables (OTHER\'): \Vhen, besides the independent r,ariable, there are
other var iables that could effect the value of the dependent var iable, as in i ten 1,
some students considered there \\.as no dependence betrveen the trvo variables.
These students interpreted the question concerning the dependence in a causal
\\'a)'. So, the¡' shorv a causalist conceptior-r of correlation and required the
el iminat ior-r of r ival explanat ions in order to admit dependence.
S8: [Jni formity (UNIFORNI): Students expected sir-rgle-valued ccirrespondence
betu'een the variables to consider the dependence, that is, they. shorved a deter-
minist ic concept ion of correlat ion.
59: Causal i ty (CAUSALTY): \ \ rhen in spi te of empir ical correlat ion the students
argumented that there \\'as no correlation because, as in item 3, the independent
r-ar iable could not cal lse a direct inf luence on the dependent var iable. We
consider this ansrver as an indicator of a causal ist concept ion of correlat ion.
S10: Other wrong arguments (OTHER): Other mistakes not included in the previous
cateqories.
34 Antonio Estepa and Carnren Batanero
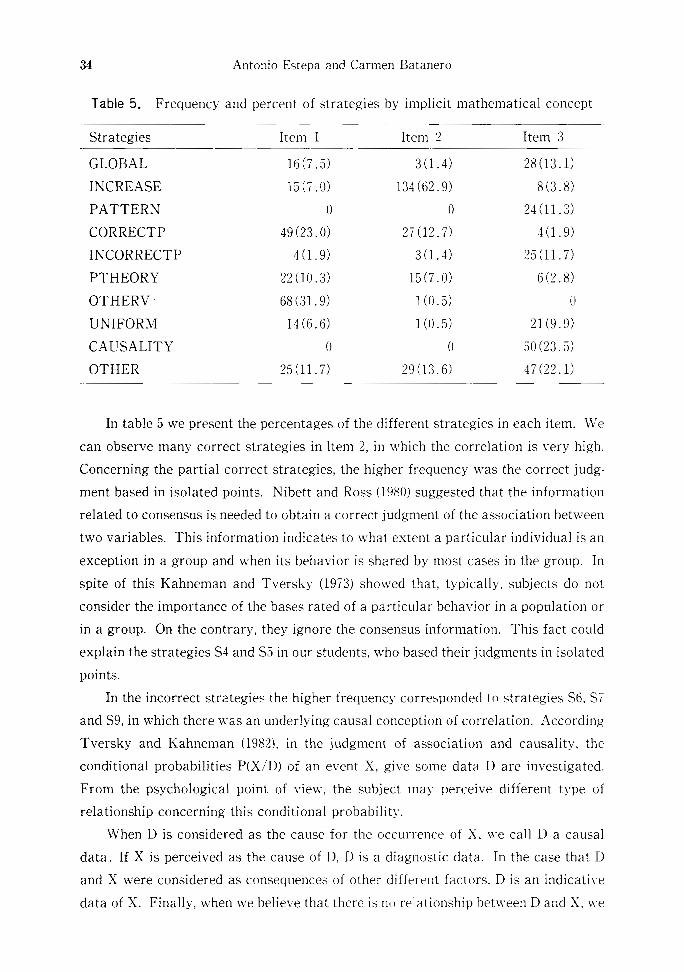
Table 5. Frequency and perceut of s t rategies by impl ic i t mathemat ica l cor- rcept
Strategies Itenl I I t em l I tem 3
GLOBAL
INCREASE
PATTERN
CORRECTP
INCORRECTP
PTHEORY
OTHERV
IJNIFORM
CAUSALITY
OTHER
16 (7 . s )
15 (7 .0 )
0
49 (23 .0 )
4 (1 .e )
22 ( \ 0 .3 )
68 (31 .9 )
14 (6 .6 )
0
25 ( r r .7 )
3 ( 1 . 4 )
134 (62 .9 )
0
2 i ( r2 .7 )
3 ( 1 . ' 1 )
1 5 ( 7 . 0 )
1 ( 0 . 5 )
1 ( 0 . 5 )
0
2 9 ( 1 3 . 6 )
2 8 ( 1 3 . 1 )
B ( 3 . B )
2 , 1 ( 1 1 . 3 )
4 ( 1 . 9 )
25( r r . i )6 (2 .8 )
0
21 (9 .9 )
50 (23. 5)
47 (22 . r )
In table 5 we present the percentages of the different strategies in each item. \\¡e
can observe many correct strategies in ltem 2, in which the correlation is very high.
Concerning the partial correct strategies, the higher frequency rvas the correct judg-
ment based in isolated points. Nibett and Ross (1980) suggested that the information
related to consensus is needed to obtain a correct judgrnent of the association betu'een
two variables. This information indicates to rvhat extent a part icular individual is an
exception in a group and when its behavior is shared b1' most cases in the group. In
spite of this Kahneman and Tversky (1973) shorved that, t1'pically, subjects do not
consider the importance of the bases rated of a part icular behavior in a populat ion or
in a group. On the contrary, they ignore the consensus information. 'I 'his fact could
explain the strategies 54 and S5 in our students, rvho based their judgments in isolated
points.
In the incorrect strategies the higher frequencS'corresponded to strategies 56, S7
and S9, in which there r¡r'as an underl¡ring causal conception of correlation. According
Tversky and Kahneman (1982), in the judgment of association and causalit-v-, the
conditional probabilities P(X/D) of an er.'ent X, give some data D are investigated.
From the psychological point of vier¡,', the subject ma1' perceive different ti 'pe of
relat ionship concerning this condit ional probabi l i t l ' .
When D is considered as the cause for the occurrence of X. u 'e cal l D a causal
data. If X is perceived as the cause of D, D is a diagnostic data. In the case that I)
and X u'ere considered as consequences of other di f ferent factors. D is an indicat ive
data of X. Finally, r'u'hen rve belier-e that there is no relationship bet"r'een D and X, u'e
Judgments of correlatiun in scatterplots
cal l D an incidental data. In the normative studl ' of condit ional probabi l i ty ' and of
associat ion is not needed to dist inguish anrong these t1 'pes of relat ionships. Neverthe-
less, these differences may be important from a psy'chological point of vierv.
I l t our opinion, some of our students did not at tr ibute a symmetr ical role to both
variables. Instead, they used treir expectations concerning the t-vpe of relationship
that ought to be betrveen the var iables, shou' ing a causal ist concept ion of correlat ion.
Corrcspondence attal-t'sis betu,eett strategies ond itetns
According to Vergnaud (1990), part of the meaning of mathematical concepts
cleper-rds on the situations in "r'hich
these concepts are applied. So, rve can expect a-hi f t in the sir l t ject strategies in our studl ' , depending on the task tc¡ be solved. As the
Itlain task variables in our research har,e a mathematical nature. rve must exoect a
clependence of the students' strategies on these variables.
To describe this dependence, a correspondence analysis (Greenacre, 1984) of' l 'able
5 l r 'as performed, using BN{DP package. Task var iables of the i tems were used
as supplenrentar-v variables, u'ith the aim of improving the interpretation.
The Chi sqlrare statistic value u'as highly' singr-rificant a¡rd result of the analysis
shon'ed a bidimensional strLlct l l re. Representat ional qr,ral i t l 'of rorvs and colnmns rvas
greater than 0.707, ri 'hich is r.erv high; this fact validates the categorization chosen tcr
describe the structttre of the strategies that the sttrdents in our sample have used to
solve the proposed problems. In the follou-ing paragraphs u'e u,ill describe the result
, r f the anal l -s is of the tr i 'o factors that u 'ere ident i f ied. For each rou'and colunrns of' l 'able
15, u 'e u' i l1 denote b-v x the value of the coordinate of this rou. on the factor and
b¡ ' r the value of the correlat ion coeff ic ient betrveen the ron' and the factor.
The f i rst factor (54j% of the total inert ia) showed the di f ferent iat ion of student 's
strategies in I tem 3 (x = 1.008; r - 0.958) ¡ ' i th respect to the 6ther tg 'o i tems that had
negat ive c<lordinates on the axis. Iu this i tems the nrost f reqr-rent strategies u'ere the
conrparison rvi th a pattern (PATTERN; x = 1.368; r = 0.9'12); the causal argumentat ior-rs
(CAUSAL; x = 1.368; r = 0.952), emplo¡ ' ing isolated bad interpreted points ( INCOR-
RECTP; x - 0.927, r - 0.960) and considering a uniform graph (UNIFORN{; x= 0.717, r- () .806).
On the contrarl', in lents 1 and 2 students har-e preferred the correct interpretation
of isolated points (CORRECT; x = 0.506, r = 0.5117): looking to the increasing or
decreasing of the scatter plot ( INCREASE; r = 0.506, r = 0.¡37 and prer, ious theories(x = -0.355, r = 0.598). For us this is an evidence of the causal ist concept ion of
associat iot t , because the students have shif ted their strateg¡ ' for l tent 3, in n'hich the
35
36 Antonio Estepa and Carmen B¿¡tanero
correlaticln \\ras not due to causal influence. but to concorclance.
The second factor (127o r>f inert ia) opposes indepenclernce ( l tem l ; r l . ¡ i l : r - 0.
895) to the other t i r .o i tenls. u. i th negat ives coordinates on this ar is. The str ' : r tegies of
considering that the existence of other var iables t l - rat coulcl inf l r"rence the depenclent
var iable proved not associat ion (OTHER\' ; x = 1.323;r - () .915) and correct interpreta-
t ion of isolated points (CORRECTI' , x = 0.170; r = 0.-163) r i 'ere l inked to the indepen-
dence. On the contrarl', there .,vas a greater use of strateg]' of stud¡-ing the increase
of the graph (INCREASE; x = -0.756: r = 0.17t i) in case of associat ion, because this is
a property of the scatter plot easi l l ' grasped b¡- the students in case of high or
moderate correlat ion.
CONCLUSIONS
hl the previous sections u-e have presented an experimental str-rd-v of students'
strategies in judging correlat ion in scatter plots. The classi f icat ion of these strat-
egies, f rom a mathematical point of v ieu-, has al lou,ed us to ident i f ) , intui t ivelv correct
and part ial ly correct strategies that are indicators of cc¡rrect or part ial ly correct
concept ions concerning stat ist ical associat ion, in part icular:-using the increasing, decreasing or constant shape of the scatter plot to just i f l -
the type of dependence;-comparing the scatter plot n i th a knou'n funct ion for example l ineal - tcr
correct ly argument the associat ion between the var iables.
In the same way, i¡rcorrect strategies and judgments har.e sen ed to identifl ' the
three following incorrect conceptions:-Determinist concept ion of correlat ion: some students did not admit except ions
to the existence of a relat ionship betrveen the r-ar iables. The expected a
correspondence that assigns onll' a value in the dependent variable for each
value of the independent variable. When this is not so, thel'considered there u,as
not dependence betneen the var iables.-Localist conception of correlation: Str-rdents often based their judgment in onl-v
part of the data provided in the scatter plot . I f th is part ial infornrat ior. l ser led to
conf i rm a g iven t ¡ 'pe o f cor re la t i c ,n . the¡ 'adopted th is t i ' pe c , f assoc ia t ion in the i r
answer.-Causalistic conception of correlation: '"r'hen the students identified correlation
arrd causal i ty.
Judgrnents of correlation in scatterplots
The corresponclence anal1's is perforn.]ed to relate strategies ar-rd task var iables oi
the items have shon'n tri 'o different factors. The first factor pclir-rts to the confusion
iretu'een correlat i r i l l ancl causal i tv that has pror-ol<ed manl, iucorrect strategies in t l - re
¡oncorc lance case, as A nrcAr )s to jL rs t i f l ' the s tnde l l t s 'p re l ious be l ie fs aboaut the
.-orrelatiou sr"lggr.stecl b¡' the context of the itern. The secoud factor differentiates the
.trategies used for justifving independence frolr those used to admit correlatior-r.
Al l these' f i r -rc l ings shon' the conrplexi t¡ ' of a topic sinrple' in appearance. Because
,, f this fact and the relevance of understanding the idea cl f associat iol l , \ \ 'e deduce the
need to reinforce the teaching of this topic in universit-v level and in the last ),ears of
secondar¡- educat ion. This u' i l l require inforrning teachers of the nrathematical ,
, -pístenrological , ps¡ 'chological artd educat ional aspects of the topic, including infor-
inat iot- t about students' preconcept ions as enunciate in this paper. Also needed is an
;rclequate desigr-r of didactical situations ir-r u'hich students need to n-rake explicit their
tr isconcept ions, n ' i th the aim of pror.oking in them a cognit ive conf l ict tc i overcome
these misconcept ions.
Acknowledgment: This report forns part of the Project PS91-011.1.1,
granted bv Dirección General de Invest igacion Cient i f ica l - Técnica (M. E. C.).
\ ladr ic l . And Group Jaén of Dicl¿rct ic, cocle 13.19, Junta de Andal¡-rcía.
REFERENCES
-\1lan, L. G. & Jenkins, H. N1., (1983), The effect of representat ions of binary var iables
on judgment of inf luence. Leurning und ntot iuat ion, 11, 381 405.
^{ l lo1' , L. B. & Tabachnik, N.,(1984), Assessrnent of covariat ion b1' humans and
animals: the joínt inf luence of pr ior expectat ions and current si tuat ional imforn-ra-
tion. P¡'r'/rologicul retit,¿t', 91. ll l '¿ 149.
.\rtigue, \1.,(1990), Epistemologie et Didactique. Rechcrt'ltt 's eu Diclactiqut, cles
llathématitlues, ]0(2 3),'2.11 286.
I latanero, C., Estepa.4., Godino, J D Y Green, D. R., (1996), Judgments of associa-
tion in contingencl' tables. .lottntal .for Rcseart'h in llatltematiL'.s Educotiott,
27(2) .151-169.
Brennan, R. L.,(1982), Elemettts o.f Generctlizubility Tlrcory. ACT I'ublications, Iou'a.
Chapman, L. j . & Chapman, J. P..(1967), l l lusor¡r correlat ion as an obstacle to the use
of valid psl'chocliagnostic signs..lottrnal ttl ' ubnortna/ ltsychology, 7,1.27I '280.
Confrel ' , J. , (1990), A rer. ieu'of the research ir t students concept ions in mathematics,
,17
Antonio Estepa and Carmen Batanero
science and programming. Reuieut of Research iyt Edttcation, 16, 3 35.
Curcio, F. R.,(1989), Deuelobing Graph Comprehension. Reston: (Virginia): Mational
Council of Teachers of Mathernatucs.
El let , F. S. & Erickson, D. P.,(1986), Correlat ion, part ial correlat ion and causat ion.
Synthese, 67, I57-173.
Erl ick, E. & Mi l ls, R. G,(1967), Perceptual quant i f icat ion of condit ional dependency.
Journal of Expermental Psycholog¡'. 73(1), 9-l'1
Estepa, A.,(1994), Concepciones iniciales sobre la asociación estadística y su euolución
como consecuencia de una enseñanza basada en el uso de ordenadorzs. (Preconcep-
tions on statistical association and their evolution as result of a comouter based
teaching). Ph. D. Universi ty of Granada (Spain).
Estepa, A. & et al.(1994), Judgments of association in contingency tables: an empirical
study of students' strategies and preconceptions. In F. Matos and J. F. Ponte
(Eds.). (1994). Proceedittg of Eighteenth Annual Conference o.f the lnternational
Croup for the Psychology of Mathematics Education (PME 1B). Vol 2,312-320.
Lisbon: Program Committee.
Greenacre, M. J., (1984), Theory arud applications of corresfondence analltsis. Academic
Press, London.
Inhelder, B. & Piaget, J.,(1955), De la logique de l'eztfant ó la logique de I'adolescent
(From the logic of the chid to the logic oc the adolescent). Presses Universitaries
de France, Paris.
Jenkins, H. M. & Ward, W. C.,(1965), Judgment of cont ingency between responses and
outcomes. Psychological Monogaraphs, 79.
Jennings, D. L., Amabile, M. T. & Ross, L.,(1982), lnformal covariation assessment:
data-based versus theory based judgments. In D. Kahneman, P. Slovic and A.
Tversky (Eds.), Judgment under uncertainty: Heuristics and biases. Neu' York:
Cambridge University Press. 2II 230.
Kahneman, D. & Tversky, A.,(1973), On the psychology of prediction. In D. Kahneman,
P. Slovic & A. Tverskv (Ed.), tudgment under uttcartaintl,: Heuristics and bios¿,s,
New York: Cambridge Universitl ' Press. 48 68.
Lane D. M., Anderson, C. A. & Kel lan, K. L. ,(1985), Judging the relatedness of
variables: The psychophisics of covariation detection. Journal o.f Experimantal
Psychology. Perception and Per.fort'nance, 11, 5. 6,10 649.
Nisbett, R. & Ross, L.,(1980), Htunan in.ference: stratcgies and sltortcoming ctl social
judgments. Prentice Hall, Neu' Jersel'.
Pichard, J F.(1994). Approche epistenrologique de la complexi te des graphiques
Judgments of correlation in sc:itterplots
statistiques. Proceeding of Fottrth International Con.l'erettce on Teuching Stcttistics,
486. Rabat (MOROCCO): The National lnst i tute of Stat ist ics and Appl ied Eco-
nomics.
Shaklee, t I . & Tucker, D.,(1980), A rule analysis judgments of covariat ion betu'een
events. tr'Ictnrtry nnd Cogttititnt, .9. 459 467.
Srnedlund, J,(1963), The concept of correlat ion in adults. Scandinauian Jountal o. f
PsYchologl', ,1, 165 I73.
Tversky' , A. c l¿ Kahnenia¡r, D.,(1982), Causal schemes in judgments under uncertainty.
In D. Iiahneman, P. Slovic & A. Tversky (Eds.), Judgment tutder ttncertaintl':
Hettrislics cmd bictses. Nerv York: Carnbridge Universitary Press. \17 l2B.
Vergnaud, (1.,(1982), Cognit ive and developmental psl 'chology and research in math-
ematics educat ion: some theoret ical and methodological issues. For the Leant ing
o,f Xlalhenatics, Jl(2), 3l-,11.
\-ergnaud, (1.,(1990). La théorie des champs conceptuells. Rechercltcs en Didnctir¡ues
dt's AIathématiqut's, Vol. 10(2 3), 133 I70.
\ \ -r ight, J. C. & N{urph1', G L.,(1984), The ut i l i ty of theories in intui t ive stat ist ics: the
robustness of theorl' based judgments. .lournal o,f Experimt'ntal P$,cht¡logy,
113e). 30r 32' ,2.
Dcpartamentrt cla Diddctica dc la Ciencios
Facultad de Humctnidatlt:s l' Ciencias dc la
Educación.
C /I:irgen de la Cabeza, ?t. .I
(.rniuersirlad dt Jaén
23{)08 Jacn
Spain
39
40 Antonio Estepa and Caruren Flatancr , ,
APPENDIX: QUESTIONNAIRE
oRAl^ñ¡I¡ATCHES
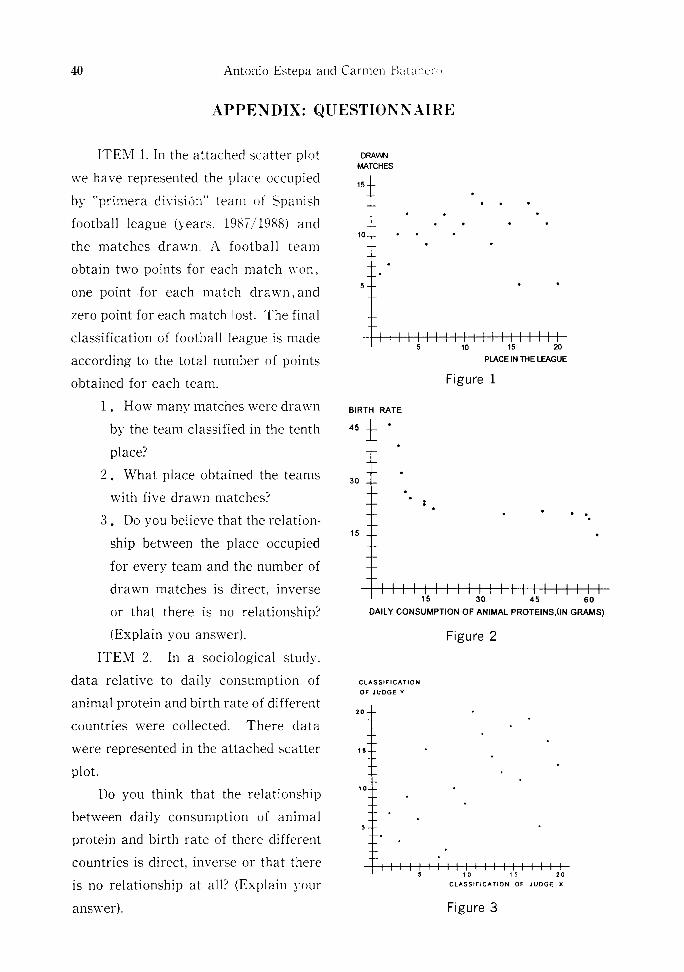
ITEM 1. In the attached scatter plot
u'e have represented the place occr.rpied
b5' "pr imera divis ión" teanr of Spanish
footbal l league (years, 19i i7, /1988) and
the matches drau'n. A footbal l teaur
obtain trvo points for each match u'on,
one point for each match drau,n,and
zero point for each match lost. The f inal
classi f icat ion of footbal l league is made
according to the total number of points
obtained for each team.
I . How manl,matches were drau'n
by the team classified in the tenth
place?
2. What place obtained the teams
with five dra'uvn matches?
3. Do you bel ieve that the relat ion-
ship brtrn 'een the place occupied
for every team and the number of
drawn matches is direct, inverse
or that there is no relationship?
(Explain you answer).
ITEM 2. In a sociological studl ' ,
data relat ive to dai ly consumption of
animal protein and birth rate of different
countries vu'ere collected. There data
were represented in the attached scatter
plot.
Do you think that the relat ionship
betrveen dai ly consumption of aninral
protein and birth rate of there different
countries is direct, inverse or that there
is no relat ionship at al l? (Explain 1'our
answer).
PTACE IN THE LFAGUE
F igure 1
EIRTH RATE
4 5
Figure 2
! 0 t 5
C L A S S I F I C A T I O N O F
F igure 3
2 0J U O G € X
DAILY CONSUMPTION OF ANIMAL PROTEINS,(|N GRAMS)

Judgnrents of corre lat ion in scat terp lots
ITE\f 3. ' l 'u 'o judges ( juclge X, j rrdge \-)qual i f ied trr-ent¡-students u'ho to<ih p:rr t
in a project conrpet i t ion in accordance u' i th their c lpinion. \ \ 'e have representecl iu this
lr lot the place t l - rat each student \ \ -as given iu both jLrclges' c lassi f icat ion. \ \ 'e u 'ould
l ike to studv i f there is sonre relat ionship betrveen the place assignecl to the sanre
part ic ipant bl ' the tu 'o judges ( i f the j r-rdgr-r-rent of both juclges is ur not related).
Obserr.e the cliaqranr and ansg'er:
Do 1'ou bel ieve that the relat ionship betu'een the place assinged to the same
student bf ' both j r . rdges is direct. iuverse or that there is nu relat ionship at al l? (Explain
1'our ansu'er).
41