1993 Some analytical applications of chemically modified ...
253
University of Wollongong Research Online University of Wollongong esis Collection University of Wollongong esis Collections 1993 Some analytical applications of chemically modified electrodes Peter John Riley University of Wollongong Research Online is the open access institutional repository for the University of Wollongong. For further information contact the UOW Library: [email protected] Recommended Citation Riley, Peter John, Some analytical applications of chemically modified electrodes, Doctor of Philosophy thesis, Department of Chemistry, University of Wollongong, 1993. hp://ro.uow.edu.au/theses/1173
Transcript of 1993 Some analytical applications of chemically modified ...

University of WollongongResearch Online
University of Wollongong Thesis Collection University of Wollongong Thesis Collections
1993
Some analytical applications of chemicallymodified electrodesPeter John RileyUniversity of Wollongong
Research Online is the open access institutional repository for theUniversity of Wollongong. For further information contact the UOWLibrary: [email protected]
Recommended CitationRiley, Peter John, Some analytical applications of chemically modified electrodes, Doctor of Philosophy thesis, Department ofChemistry, University of Wollongong, 1993. http://ro.uow.edu.au/theses/1173


SOME ANALYTICAL APPLICATIONS
OF
CHEMICALLY MODIFIED ELECTRODES
A thesis submitted in fulfilment of the requirements for the award of the degree
DOCTOR OF PHILOSOPHY
from
THE UNIVERSITY OF WOLLONGONG
by
PETER JOHN RILEY, BSc (Hons)
Department of Chemistry
1993

To my wife,
Beth
and my parents,
Arthur and Jean Riley

Tfe concCusion, when ali has been fteard, is:fear
Çod and fceep Olis commandments, because this
appâes to every person
'EccCesiastes 12:13

ACKNOWLEDGMENTS*
I wish to thank ali of those who assisted in the completíon of this thesis. First of
ali I wish to thank my supervisor Professor Gordon Wallace for his advise, support,
Mendship and encouragement throughout the duration of this project My thanks also go
to the other members of the IPRL especially Mark Imisides, Norni Barisci, Kerry
Gilmorc, Peter Teasdale, Richard John, Chee on Too, Karin Maxwell, Lin Yuping and
Zhao Huijin for their friendship during my time in the laboratory. To my proof readers
Will Price and Gill Middleton I extend my heartfelt thanks for diligence in an enormous
task.
Finally, I wish to thank my family for their love and support. To my wife, Beth, I owe a
great debt for the many hours spent typing and editing this work and holding the fort
whilst I was away from home, ali too often. To my children, Erin, Joel and Thomas,
thanks for your patience. To my entire family, this thesis is as much yours as it is mine.
* I wish also to thank m y current cmploycr B H P Coated Product Divbion. Research and Technology Centre for their flexibility in, wherever possible, allowing m e the time required to finally complete this work.

i
PUBLICATIONS
1 A New Electrochemical Sampling Device.
Manthey, M., Riley, P. J. and Wallace, G. G.
Amer. Lab., July, 21, (1988).
2 Controlled Release of the Dithiocarbamate Ligand from a Polypyrrole
Polymer: A Basis for On-line Electrochemically Controlled Derivatisation.
Lin, Y. P., Riley P. J. and Wallace, G. G.
Anal. Lett., 22 (3), 669-681, (1989).
3 Ion Exchange Based Chemically Modified Electrodes
Riley P. J., and Wallace, G. G.
New Developments in Electrode Materials and their Applications
A. Jones and L. W o o d (eds.)
DITAC Publication. March, 1990, 295-301.
4 Determination of Gold using Anion Exchange Based Chemically Modified
Electrodes.
Riley, P. J.and Wallace, G. G.
Electroanalysis, 3, 191-195, (1991).
5 The use of Electropolymerisation to Produce New Sensing Surfaces - A
review emphasising electrodeposition of heteroaromatic compounds.
Imisides, M. D.; John, R.; Riley, P. J. and Wallace, G. G.
Electroanalysis, 3, 879-889, (1991).
6 Intelligent Polymers
Riley, P. J. and Wallace, G. G.
Chemistry in Austrália, 58 (1), 32-36, (1991).
7 Use of Authoring Tools in the Development of Instructional Resources for
Scientific Equipment.
Harper, B. M., Harper, A. M., Imisides, M. D., Wallace, G. G., Hodgson, A.
J. and Riley, P. J.
Interactive Learning International. 7, 199-207, (1991).
8 Intelligent Chemical Sensors Based on Conductive Electroactive Polymers.
Riley, P.J. and Wallace, G.G.
Journal of Intelligent Materials, Systems and Structures, 2, 228-237, (1991).

ii
9 Conductive Polymeric Systems.
Riley, P.J. and Wallace, G.G.
Materials Australasia, 23, 12-13, (1991).
10 A Computerized Electrochemical System for Teaching and Analysis.
Riley, P.J., Hodgson, A.J., Imisides, M.D., Wallace, G.G. and Harper, B.M.
Chemistry in Austrália, 58,495-497, (1991).
11 ElectroLab. A New Electrochemical Workstation.
Barisci, J.N.; Hodgson, A.J; Riley, P.J. and Wallace, G.G.
Amer. Lab. In Press

iii
A B S T R A C T
The continued advancement of electrochemical sensing is inextricably linked with the
development of modified electrodes. N e w preconcentration schemes, utilising analyte-
electrode interactions not normally employed in conventional sensors, open up a number
of potential applications for these electrodes. One flexible route to the generation of
electrode modifiers is through the use of electrochemically generated polymers to
functionalise the electrode surface.
This work has investigated the use of a number of monomers for electrode modification.
Monomers studied include pyrrole, thiophene, 3-methylthiophene, 2,2'-bithiophene, N-
ethyltyramine and 4-vinylpyridine. The electrochemical generation of polymers from
these monomers was studied and those found to deposit as reproducible coherent
modifier layers were further investigated with a view to practical applications. Of the
polymers studied polypyrrole was found to provide the greatest scope for use as an
electrode modifier. This was due to the fact that, during the oxidation of the monomer to
form the polymer, anions from the polymerisation solution are incorporated into the
polymer matrix. As polypyrrole may be generated from either aqueous or acetonitrile
solutions of the monomer and supporting electrolyte it is possible to incorporate a
number of water soluble and water insoluble anions into the polymer matrix during
electrosynthesis. None of the other monomers studied give this degree of flexibility in
polymer growth.
The application of polypyrrole modified electrodes for sensing purposes and polypyrrole
modified Reticulated Vitreous Carbon for sampling purposes has been the focus of this
study. The interaction of mercury(II) with a dithiocarbamate functionalised polypyrrole
has formed the basis of a preconcentration device for this cation. Gold has also been
preconcentrated onto polypyrrole coated R V C . The mode of interaction in this
application appears to be a redox reaction between the polymer and the analyte.
Polypyrrole was found to be unsuitable for sensing applications that required modifiers
with a low background signal. In this case polymers formed from either 4-(vinyl
pyridine) [gold sensor] or N-Ethyltyramine [methylmercury sensor] were employed.
The mode of electrode-analyte interaction with these electrodes was thought to be ion-
exchange and complexation respectively.
The effect of applied potential on the electrode-analyte interaction was studied and it was
found that in some cases it could be used to enhance this interaction.
iv
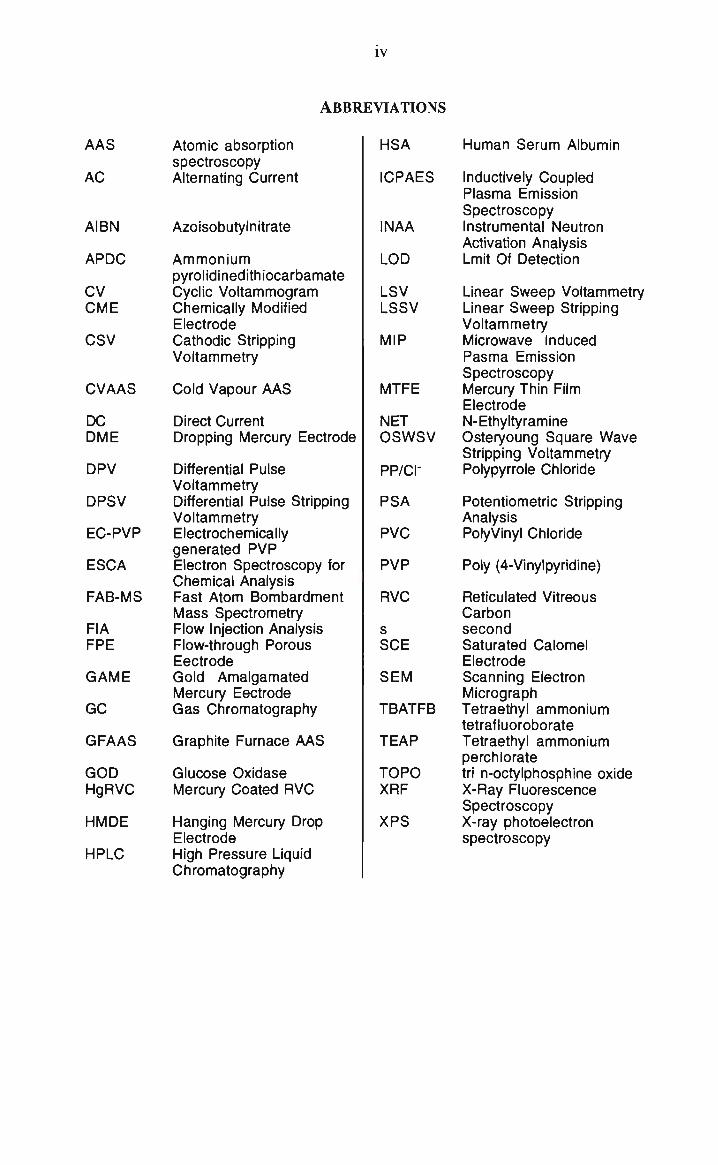
AAS
AC
AIBN
APDC
CV CME
CSV
CVAAS
DC DME
DPV
DPSV
EC-PVP
ESCA
FAB-MS
FIA FPE
GAME
GC
GFAAS
GOD HgRVC
HMDE
HPLC
ABBREVIATIONS
Atomic absorption spectroscopy Alternating Current
Azoisobutylnitrate
Ammonium pyrolidinedithiocarbamate Cyclic Voltammogram Chemically Modified Electrode Cathodic Stripping Voltammetry
Cold Vapour AAS
Direct Current Dropping Mercury Eectrode
Differential Pulse Voltammetry Differential Pulse Stripping Voltammetry Electrochemically generated PVP Electron Spectroscopy for Chemical Analysis Fast Atom Bombardment Mass Spectrometry Flow Injection Analysis Flow-through Porous Eectrode Gold Amalgamated Mercury Eectrode Gas Chromatography
Graphite Furnace AAS
Glucose Oxidase Mercury Coated RVC
Hanging Mercury Drop Electrode High Pressure Liquid Chromatography
HSA
ICPAES
INAA
LOD
LSV LSSV
MIP
MTFE
NET OSWSV
PP/CI"
PSA
PVC
PVP
RVC
s SCE
S E M
TBATFB
TEAP
T O P O XRF
XPS
Human Serum Albumin
Inductívely Coupled Plasma Emission Spectroscopy Instrumental Neutron Activation Analysis Lmit Of Detection
Linear Sweep Voltammetry Linear Sweep Stripping Voltammetry Microwave Induced Pasma Emission Spectroscopy Mercury Thin Film Electrode N-Ethyltyramine Osteryoung Square Wave Stripping Voltammetry Polypyrrole Chloride
Potentiometric Stripping Analysis PolyVinyl Chloride
Poly (4-Vinylpyridine)
Reticulated Vitreous Carbon second Saturated Calomel Electrode Scanning Electron Micrograph Tetraethyl ammonium tetrafluoroborate Tetraethyl ammonium perchlorate tri n-octylphosphine oxide X-Ray Fluorescence Spectroscopy X-ray photoelectron spectroscopy

V
TABLE OF CONTENTS Publications i Abstract iii Abbreviations iv
CHAPTER 1
GENERALINTRODUCTION 1
1.1 TRACE METAL SAMPLING l 1.1.1 Solid phase adsorbents 2 1.1.1.1 Iminodiacetate resins 4 1.1.1.2 8-Hydroxyquinoline functionalised adsorbent. 6 1.1.1.3 Dithiocarbamate functionalised adsorbents 9 1.1.1.4 Other sorbents 13 1.1.2. Electrochemical preconcentration 16 1.1.2.1 Reticulated vitreous carbon 19
1.2 ELECTROCHEMICAL SENSORS 23 1.2.1 Chemically modified electrodes (CMEs) 24 1.2.1.1 Physical admixing 25 1.2.1.2 Chemical binding 26 1.2.1.3 Coating with preformed polymers 27 1.2.1.4 Electropolymerisation 27
1.3 A I M A N D S C O P E O F THIS W O R K 31
CHAPTER 2
POLYMER GENERATION AND RVC MODIFICATION 34
2.1 INTRODUCTION 34 2.1.1 Electrochemically generated conducting polymers 35 2.1.1.1 Polypyrrole 35 2.1.1.2 Polythiophenes 37 2.1.1.3 Electropolymerisation techniques 38 2.1.2 Polymer characterisation techniques 41 2.1.2.1 Electrochemical characterisation methods 42 2.1.2.2 Spectroscopic and spectrometric techniques 45 2.1.3 Aim and scope of this work 47
2.2 E X P E R I M E N T A L 48
2.2.1 Reagents 48 2.2.2 Polymerisation solutions 48 2.2.3 Equipment 49 2.2.3.1 Electrodes 49 2.2.4 Polymer Growth 51
2.3 R E S U L T S A N D DISCUSSION 52
2.3.1 Pyrrole polymerisation 52 2.3.1.1 Pyrrole electropolymerisation techniques 52 2.3.1.2 Effect of anion on polymer properties 57 2.3.1.4 Polypyrrole functionaüsation 63 2.3.1.5 Polymerisation of pyrrole onto R V C 72 2.3.2 Thiophene polymerisation 74 2.3.2.1 TWophenes: electropolymerisation techniques 74 2.3.2.2 Polymerisation of thiophenes onto R V C 80
2.4 CONCLUSION 80
vi
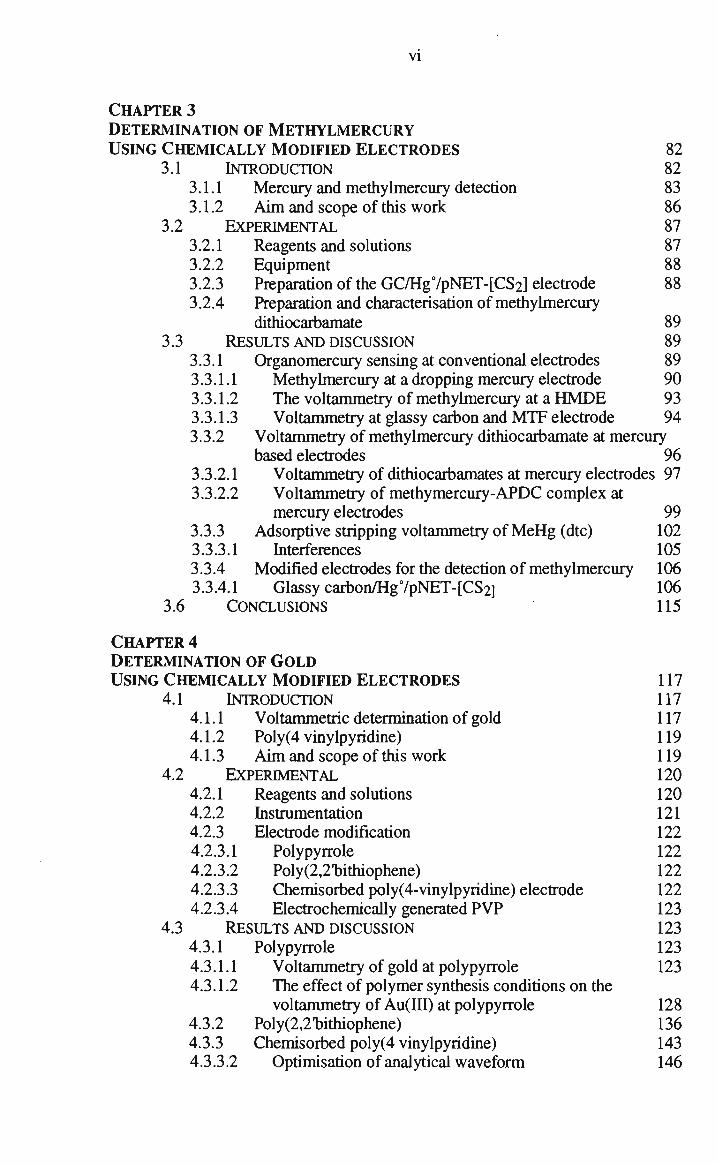
CHAPTER 3 DETERMINATION OF METHYLMERCURY USING CHEMICALLY MODIFIED ELECTRODES 82
3.1 INTRODUCTION 82 3.1.1 Mercury and methylmercury detection 83 3.1.2 Aim and scope of this work 86
3.2 EXPERIMENTAL 87 3.2.1 Reagents and solutions 87 3.2.2 Equipment 88 3.2.3 Preparation of the GC/Hg7pNET-[CS2] electrode 88 3.2.4 Preparation and characterisation of methylmercury
dithiocarbamate 89 3.3 RESULTS AND DISCUSSION 89
3.3.1 Organomercury sensing at conventional electrodes 89 3.3.1.1 Methylmercury at a dropping mercury electrode 90 3.3.1.2 The voltammetry of methylmercury at a H M D E 93 3.3.1.3 Voltammetry at glassy carbon and M T F electrode 94 3.3.2 Voltammetry of methylmercury dithiocarbamate at mercury
based electrodes 96 3.3.2.1 Voltammetry of dithiocarbamates at mercury electrodes 97 3.3.2.2 Voltammetry of methymercury-APDC complex at
mercury electrodes 99 3.3.3 Adsorptive stripping voltammetry of M e H g (dtc) 102 3.3.3.1 Interferences 105 3.3.4 Modified electrodes for the detection of methylmercury 106 3.3.4.1 Glassy carbon/Hg7pNET-[CS2] 106
3.6 C O N C L U S I O N S 1 1 5
CHAPTER 4 DETERMINATION OF GOLD USING CHEMICALLY MODIFIED ELECTRODES 117
4.1 INTRODUCTION 117 4.1.1 Voltammetric determination of gold 117 4.1.2 Poly(4 vinylpyridine) 119 4.1.3 Aim and scope of this work 119
4.2 EXPERIMENTAL 120 4.2.1 Reagents and solutions 120 4.2.2 Instrumentation 121 4.2.3 Electrode modification 122 4.2.3.1 Polypyrrole 122 4.2.3.2 Poly(2,2hithiophene) 122 4.2.3.3 Chemisorbed poly(4-vinylpyridine) electrode 122 4.2.3.4 Electrochemically generated P V P 123
4.3 RESULTS AND DISCUSSION 123 4.3.1 Polypyrrole 123 4.3.1.1 Voltammetry of gold at polypyrrole 123 4.3.1.2 The effect of polymer synthesis conditions on the
voltammetry of Àu(III) at polypyrrole 128 4.3.2 Poly(2,2hithiophene) 136 4.3.3 Chemisorbed poly(4 vinylpyridine) 143 4.3.3.2 Optimisation of analytical waveform 146

vii
4.3.3.3 Optimisation of analytical conditions for Chemisorbed P V P 149
4.3.3.4 Optimisation of electrode preparation 150 4.3.3.5 Calibration studies 151 4.3.3.6 Copper interference 153 4.3.4 Electrochemically generated P V P (EC-PVP) 154 4.3.4.1 Electrode preparation 154 4.3.4.2 Ion exchange properties 157 4.3.4.3 Gold determination - optimisation of potential
waveform 159 4.3.4.4 Optimisation of analytical conditions 162 4.3.4.5 Optimisation of electrode preparation 163 4.3.4.6 Calibration studies 165 4.3.4.7 Copper interference 169
4.4 CONCLUSION 172
CHAPTER 5 COLLECTION OF M E R C U R Y AT CHEMICALLY MODIFIED R V C 174
5.1 INTRODUCTION 174 5.1.1 Sampling of mercury from aqueous systems 174 5.1.2 Aim and scope 176
5.2 EXPERIMENTAL 177 5.2.1 Reagents and solutions 177 5.2.2 Equipment 177 5.2.3 Cartridge modification 179
5.3 RESULTS AND DISCUSSION 180 5.3.1 Sampler development 180 5.3.2 Collection at R V C 180 5.3.3 Collection at polypyrrole modified electrodes 183 5.3.4 Elutionof mercury from cartridges 189 5.3.5 Collection of Real Sample 190
5.4 CONCLUSIONS 192
CHAPTER 6 COLLECTION OF G O L D AT POLYPYRROLE MODIFIED R V C 194
6.1 INTRODUCTION 194 6.1.1 Preconcentration techniques 194 6.1.2 Aim and scope of this work 196
6.2 EXPERIMENTAL 197 6.2.1 Reagents and solutions 197 6.2.2 Instrumentation 197 6.2.3 Cartridge modification 197 6.2.4 Modification o f R V C with polypyrrole 198 6.2.5 Analysis of gold 198
6.3 RESULTS AND DISCUSSION 199 6.3.1 Collection of gold at polypyrrole modified R V C 199 6.3.1.1 The effect of the anion present during synthesis on the collection of gold at polypyrrole 200 6.3.1.2 Characterisation of gold-polypyrrole interaction 203 6.3.1.3 Elution and quantification 206
6.4 CONCLUSIONS 207

viii
CHAPTER 7 ELECTROLAB 209
7.1 INTRODUCTION 209
7.1.1 Aim and scope 212 7.2 EXPERIMENTAL 213
7.2.1 Reagents 213 7.2.2 Hardware components 213
7.3 RESULTS AND DISCUSSION 214 7.3.1 Hardware development 214 7.3.1.1 Thecomputer 214 7.3.1.2 The interface 214 7.3.1.3 The potentiostat 215 7.3.1.4 The cell stand 215 7.3.2 Design a Waveform 215 7.3.2.1 Waveform set up 217 7.3.2.2 Current sampling 218 7.3.3 Constructing conventional voltammetric stimuli using
Design a Waveform 219 7.3.3.1 Staircase voltammetry 219 7.3.3.2 Differential staircase voltammetry 222 7.3.3.3 Differential pulse voltammetry 225 7.3.3.4 Square wave voltammetry 229 7.3.3.5 Normal pulse voltammetry 231 7.3.4 Simplifying waveform definition dialogues 234
7.4 CONCLUSIONS 236
CHAPTER 8 CONCLUSIONS 237
REFERENCES 240

ÇetteraC Introduction
CHAPTER 1 GENERAL INTRODUCTION
The current awareness of the impact of many anthropogenic pollutants has led to a
renewed interest in the determination of these pollutants in the biosphere[l-3].
Determination of these metais is often a complex task. A task that can be made more
difficult if the sample collection point and analytical laboratory are separated by
significant distances or if a significant time elapses between sample collection and
analysis. To provide meaningful information the analysis obtained must accurately
reflect the composition of the bulk sampled.
There are two approaches to obtaining the required information [4]:
a) Collect the sample in a manner that preserves the sample integrity (including
speciation) or,
b) Perform the analysis at the sampling site with sensors capable of directly
measuring the species of interest.
Either approach is viable and both suffer from a number of limitations.
This introductory chapter will evaluate each approach, review Chemically Modified
Electrodes (CMEs) and delineate the proposed benefits of using C M E s to add a new
dimension to each of the above approaches when sampling aqueous systems.
1.1 TRACE METAL SAMPLING
The difficulties encountered in sample collection and storage have been reported by a
number of workers [4-14]. These problems are particularly evident when sampling
aqueous systems for trace metal analysis [4-10]. It is an often stated fact that many early
studies of heavy metal concentration in deep ocean waters suffered from a significant
<Pagel
ÇeneraC Introduction
positive bias caused by severe contamination of the water during sample collection and
manipulation [11,15,16]. This fact is evidenced in dramatic changes in baseline metal
concentrations recorded over a number of decades (Tables 1.1 and 1.2*).
To minimise these effects the materiais used for sample containers must be carefully
chosen [4, 17] and containers must be scrupulously cleaned prior to use [8]. Sample
acidification is often necessary to prevent losses due to adsorption or precipitation of the
analyte [4,9]. Such pretreatment regimes may affect both the chemical form or oxidation
state of the analyte [4]. Coupled with this, there is often a need to obtain large volumes of
sample which must be transported and stored until analysis.
Following transportation to the laboratory a sample pretreatment step is often required to
remove matrix interferences and raise analyte concentrations to a levei above the limit of
detection of the method chosen for analyte quantification.
A variety of laboratory methods have been devised to achieve this. Solvent extraction,
ion exchange, complexation, precipitation and electrodeposition have ali been used in
sample pretreatment. It is those techniques based upon the immobilisation of the analyte
on the surface of a solid preconcentration médium that are of interest here.
1.1.1 SOLID PHASE ADSORBENTS
Solvent extraction techniques provide a useful, but often complex, method of analyte
preconcentration and interference removal. A more convenient approach uses solid phase
adsorbent to collect the analytes of interest [18]. With this technique a variety of
preconcentration mechanisms are available, the most popular of which involve either
adsorption or chemisorption (where the analyte forms a chemical bond with the surface
* Both tables taken from reference 16
Vage. 2

ÇeneraC Introduction
to which it has been adsorbed). It is this latter phenomenon of chemisorption that will be
the focus of this section.
Tabk 1.1 Trace, metal concentrations in seawater
Cd Cu
Element*
(H9-L"1)
Pb Zn Ni
Reference
Compiled data
Sverdrup et al.(1942) Goldberg (1965) Brewer (1975)
present 0.11 0.1
10 3 0.5
4 0.03 0.03
5 10 4.9
0.1 -
1.7
Original Data
•Chester and Stoner (1974) 0.07 0.8 *Bruland et al.(1979) 0.015 0.11 *Schaule and Patterson (1981) •Spencer et ai. (1982) 0.004 0.10 Boyle and Huested (1983) 0.002 0.06 Berman et ai. (1983) 0.03 0.10 *Jones and Murray 0.011 0.19
Surface water samples Ali concentrations expressed in ug.L" *
0.013 0.027 0.021 0.04
1.4 0.007
0.01
0.16
0.31
0.12 0.26 0.32
Taí>íel2 Trace metaC concentrations in Lak& íHuron *
1965 1970 1971 1974 1976 1977 1978 1980
* Filtered
Fe -
6.3 3.2 2.7 2.0
1.7
samples coll
Cd <5 1.0 0.71
0.057
0.0038
ected at I m
Cu <5 3.5 3.7 2.1 0.78
0.72 0.30
depth.
Cr <5 1
0.72 0.30
Pb <5 1.7 2.3 1.3 1.0 0.23 0.20
Ni <5 1.4 1.5 2.5 2.3
0.11 0.019 0.64
Ali concentrations expressed
Zn <5 6.8 7.3 5.1 2.4 1.5 2.2 0.26
in Hg-L"1
Mn -
1 0.31 0.43
0.27
Hq
0.17 0.32 0.052
0.050
Given the wealth of information available concerning liquid phase extraction it was an
obvious extension of this work to design solid phase extractants that mimic the liquid-
<Pa0e3
ÇeneraC Introduction
liquid systems. There are several approaches to the production of these functionalised
phases. The first involves the generation of a phase containing the appropriate functional
group on the surface of the sorbent, for example, an ion exchange resin that contains
surface bound sulphonate groups [19]. Alternatively, a relatively inert substrate may be
chemically functionalised to provide the desired characteristics. This approach has been
used extensively and quite successfully with silica based materiais [20]. Other methods
involve the use of an inert binding agent to fix the active reagent to the substrate surface
[21] or the adsorption of the complexing agent onto a suitable support [22]. Each solid
phase adsorbent to be discussed here will be classified according to the type of
interactions involved in analyte immobilisation, rather than the mode of attaching the
functional group to the substrate.
1.1.1.1 Iminodiacetate resins
Resins containing the iminodiacetic acid group have been the subject of extensive studies
for many years. Since as early as 1965 [23] workers have been evaluating the suitability
of this type of resin for the preconcentration of various metais. T w o most commonly
used and commercially available forms of this material are Dowex-Al and Chelex 100
(50 -100), a sized and purified form of Dowex-Al [23]. Muromac A-l [24] is another
commercially available iminodiacetate resin. Iminodiacetate resins have been reported to
form complexes with a variety of metais [23 - 25] however, the complexation reactions
have been shown to be very p H dependant [23,26,27].
The ability of the iminodiacetate resins to form complexes with a wide variety of metais
has resulted in the development of a number of applications utilising this resin. One of
the earliest applications of Chelex 100 to environmental samples was the work of Riley
and Taylor [28]. In this study seawater samples were passed through a 60 x 120 m m
bed of resin that had been converted to the hydrogen form. Eighteen of the thirty metais
studied were successfully collected and re-eluted. A characteristic of chelex noticed by
(Page4

ÇeneraC Introduction
these workers was the dramatic change in resin volume with significant changes in pH.
This is, in fact, one of the major problems with Chelex 100 and will be discussed later.
Other workers [27] have also found that both the pH and ionic strength of the samples
have a dramatic effect on the effíciency of uptake of metais on the resin. Sample p H has
been shown to dramatically effect the nature of metal-resin binding with alkaline earth
ions. Ion exchange is the predominant mechanism at p H < 4 and chelation at pH>6 with
mixed mode interactions at p H values between these. A survey of the literature shows no
universally accepted procedure for the use of Chelex.
It should be noted that there is a great diversity of opinion regarding the suitability of this
technique for the collection of M n , Cr [29, 30, 37] and to a lesser extent Fe [37]. The
reason for this variation may be the geometry of the columns used. A study by Su [40]
showed that both M n and Fe are distributed throughout a bank of 10 columns arranged in
series, whereas the other metais studies were restricted to the first 2 or 3 cartridges,
except Cd (5 cartridges) and Cr (no retention).
Chelex resin has been employed in flow injection analysis (FIA) with AAS detection
providing a rapid technique for metal preconcentration and detection. The tendency of
Chelex to swell with changes in p H causes problems with sample flow rate [33]. As the
resin swells it restricts sample flow. To circumvent this problem the resin is converted to
the appropriate form, usually the ammonium form [33, 25] or the magnesium form [40],
and packed to 7 5 % of the column volume [33]. Despite it's limitations Chelex 100 has
found application with a variety of matrices. These are listed in Table 1.3.
TageS

ÇeneraC Introduction
TaèCe 13 JíppCications of Iminodiacetate resins
Metals collected
Cd, Fe, Ni, Pb, Zn
Ni
Cd, Co, Cu, Fe, Ni,
Zn
Cd, Co, Cu, Fe, Mn,
Ni, Pb, Zn
Cd, Co, Cr, Cu, Mn,
Ni, Pb, Zn
Cd, Hg, Pb, Zn
Cd, Cu, Pb, Zn
Cd, Cu, Pb, Zn
Cd, Cu, Ni, Pb
Co, Cr, Cu, Fe, Mn,
Ni.Zn
Cd, Cu, Fe, Mn, Ni,
Pb, Zn
Cd, Co, Pb, Zn
Heavy metais
Al, Cd, Cu, Mn, Ni,
Zn
Cd, Cu, Co, Mn, Ni,
Pb, Zn
Cd, Cu, Mn, Pb, Zn
Cd, Cu, Ni, Zn
* A A S - Atomic abso FIA-AAS - Flow inj ICPAES - Inductivel
Sample matrix
Industrial waste-
water
—
Seawater
Estuarine and
seawater
Seawater
Water
Polluted seawater
Seawater
Water
Seawater
Estuarine and
seawater
Seawater
Seawater
Water
Seawater
Seawater
Water
rption spectroscopy ection analysis-AAS y coupled atomic emission
Determination method*
AAS
AAS
GFAAS
GFAAS
XRF
FIA-AAS
FIA-AAS
FIA-AAS
GFAAS
GFAAS
ICPAES
ICPAES
AAS
ICPAES
AAS
AAS
AAS
G F A A S - Graphite furnace AAS X R F - X-ray fluorescence spectroscopy
Reference
23
26
28
29
30
31
32
33
34
35
36
37
38
39
40
25
41
1.1.1.2 8-Hydroxyquinoline functionalised adsorbent
The immobilisation of 8-Hydroxyquinoline (oxine) and its derivatives onto various
supports has provided a wide range of efficient preconcentration phases. By far the most
'Page 6

ÇeneraC Introduction
popular support material has been silica [42-47]. Attachment of the reagent to silica is
generally achieved by silation of the silica surface with an appropriate reagent which
subsequently couples with the oxine via a diazo coupling route [42,44,46].
Silica provides a support with mechanical properties superior to macroporous resins.
Swelling of the support does not occur (compare with Chelex 100), and the material is
readily available in a selection of particle sizes and porosity. This latter characteristic has
a significant effect on the performance of the adsorbent. It has been found that pore size
affects preconcentration effíciency with the optimum pore size being about 6 n m [45].
Alternate approaches involve the immobilisation of oxine by adsorption onto
macroporous resins or silica [22,48], or the collection of metal-oxine complexes, formed
in solution, onto appropriate resins [49, 50]. A recent publication details the use of an
oxine functionalised water-soluble polymer gel to collect metais from solution. The gel
forms complexes with the metais to be removed and is subsequently collected by
filtration through a suitable size exclusion membrane [51].
As with the iminodiacetate resins, the attraction of oxine based phases is their selectivity
towards transition metais. These generally form stable 1:1 complexes [43] with high
binding coefficients, whereas alkali and alkaline earth metal ions form complexes with
low binding coefficients [47].
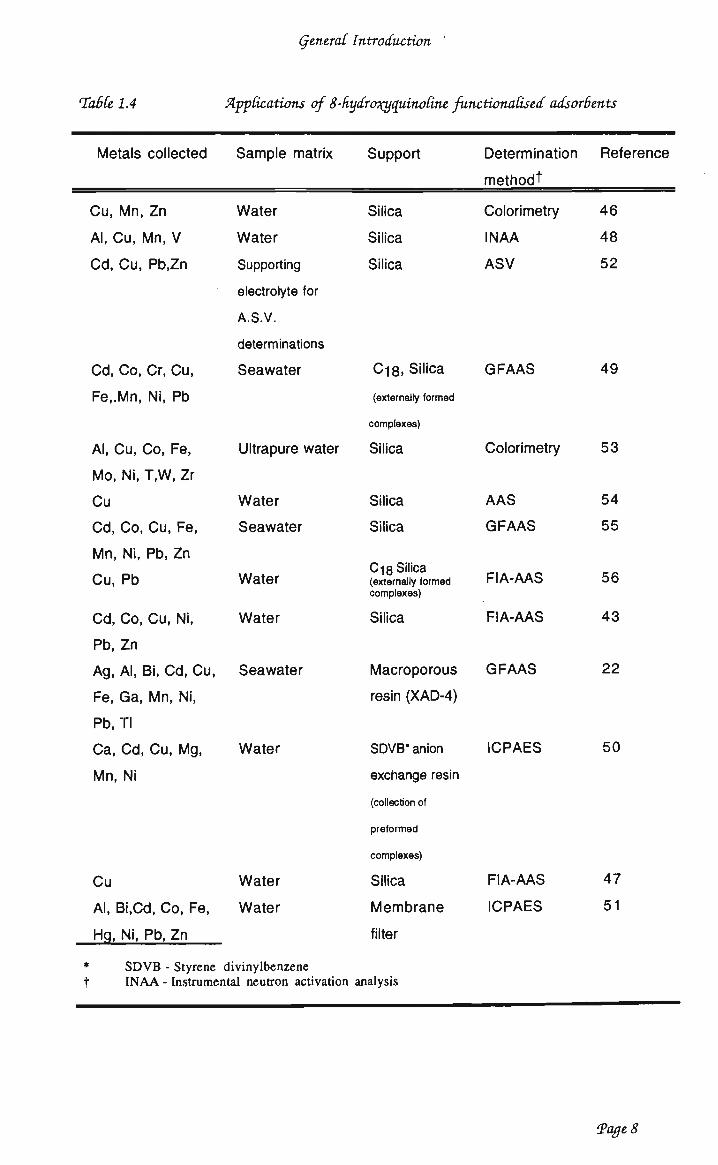
A number of applications utilising immobilised 8-hydroxyquinoline phases are listed in
Table 1.4.
<Page7
ÇeneraC Introduction
TabCe 1.4 SlppCications of 8-kydroxyquinoCine functionalised adsorbents
Metals collected
Cu, Mn, Zn
Al, Cu, Mn, V
Cd, Cu, Pb,Zn
Cd, Co, Cr, Cu,
Fe,.Mn, Ni, Pb
Al, Cu, Co, Fe,
Mo, Ni, T,W, Zr
Cu
Cd, Co, Cu, Fe,
Mn, Ni, Pb, Zn
Cu, Pb
Cd, Co, Cu, Ni,
Pb, Zn
Ag, Al, Bi, Cd, Cu,
Fe, Ga, Mn, Ni,
Pb, TI
Ca, Cd, Cu, Mg,
Mn, Ni
Cu
Al, Bi.Cd, Co, Fe,
Hq, Ni, Pb, Zn
Sample matrix
Water
Water
Supporting
electrolyte for
A.S.V.
determinations
Seawater
Ultrapure water
Water
Seawater
Water
Water
Seawater
Water
Water
Water
* S D V B - Styrene divinylbenzene t I N A A - Instrumental neutron activation
Support
Silica
Silica
Silica
C-|8, Silica
(externally formed
complexes)
Silica
Silica
Silica
Ci 8 Silica (externally formed complexes)
Silica
Macroporous
resin (XAD-4)
SDVB* anion
exchange resin
(collection of
preformed
complexes)
Silica
Membrane
filter
analysis
Determination
methodt
Colorimetry
INAA
ASV
GFAAS
Colorimetry
AAS
GFAAS
FIA-AAS
FIA-AAS
GFAAS
ICPAES
FIA-AAS
ICPAES
Reference
46
48
52
49
53
54
55
56
43
22
50
47
51
Vage 8
ÇeneraC Introduction
1.1.1.3 Dithiocarbamate functionalised adsorbents
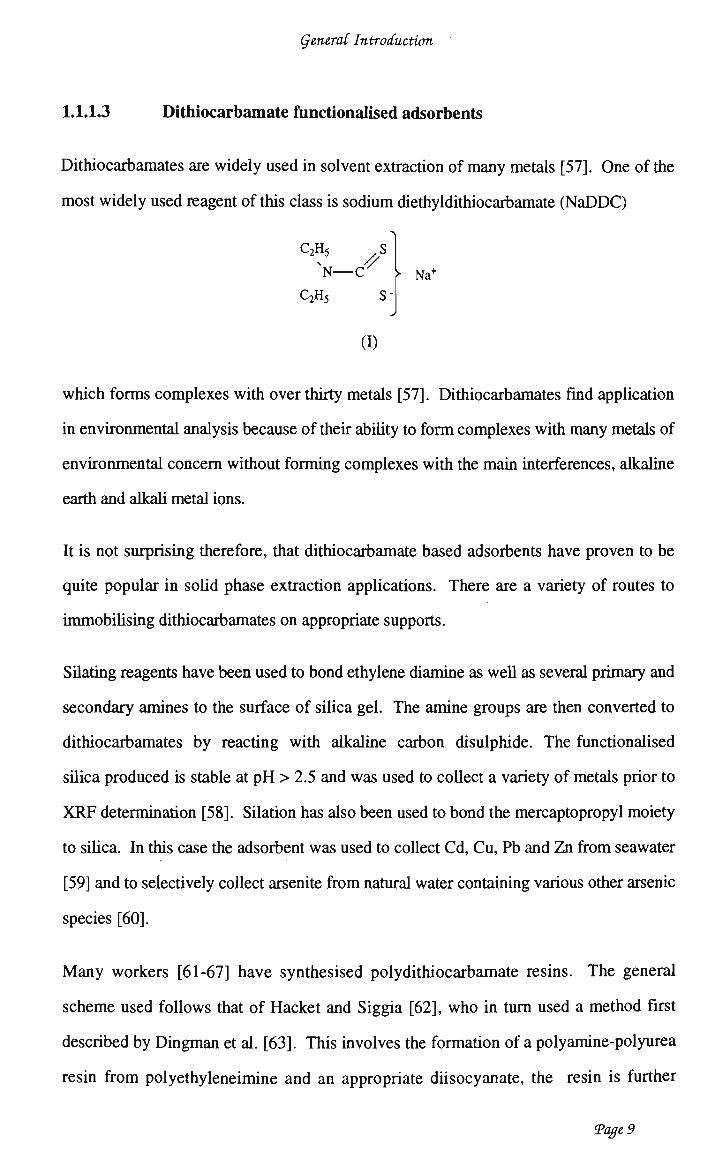
Dithiocarbamates are widely used in solvent extraction of many metais [57]. One of the
most widely used reagent of this class is sodium diethyldithiocarbamate (NaDDC)
C2H5 s N N — C X ,- Na+
C2H5 S"
(D
which forms complexes with over thirty metais [57]. Dithiocarbamates find application
in environmental analysis because of their ability to form complexes with many metais of
environmental concern without forming complexes with the main interferences, alkaline
earth and alkali metal ions.
It is not surprising therefore, that dithiocarbamate based adsorbents have proven to be
quite popular in solid phase extraction applications. There are a variety of routes to
immobilising dithiocarbamates on appropriate supports.
Silating reagents have been used to bond ethylene diamine as well as several primary and
secondary amines to the surface of silica gel. The amine groups are then converted to
dithiocarbamates by reacting with alkaline carbon disulphide. The functionalised
silica produced is stable at p H > 2.5 and was used to collect a variety of metais prior to
X R F determination [58]. Silation has also been used to bond the mercaptopropyl moiety
to silica. In this case the adsorbent was used to collect Cd, Cu, Pb and Zn from seawater
[59] and to selectively collect arsenite from natural water containing various other arsenic
species [60].
Many workers [61-67] have synthesised polydithiocarbamate resins. The general
scheme used folio ws that of Hacket and Siggia [62], who in turn used a method first
described by Dingman et ai. [63]. This involves the formation of a polyamine-polyurea
resin from polyethyleneimine and an appropriate diisocyanate, the resin is further
'Page 9

ÇeneraC Introduction
derivatised with alkaline carbon disulphide to form the dithiocarbamate resin. The
derivatisation period initially used was three weeks [63], however, Miyazaki and Barnes
[66] indicate that overnight derivatisation is sufficient. Despite this, most authors follow
the initial method [61, 67]. Applications of these resins are listed in Table 1.5.
As with other chelating resins pH control is an important parameter in achieving
quantitative preconcentration. In an extensive study, Miyazaki and Barnes [66] have
shown that at the optimum p H it is possible to collect 22 metais, including 14 rare earth,
on polydithiocarbamate resin. This study has also shown that it is possible to separate
Cr(VI) and Fe(III) from Cr(III) and Fe(II), as the former are collected on the resin
whereas the lower oxidation state metal ions are not. Barnes and co-workers have used
polydithiocarbamate resins to preconcentrate heavy metais from urine [65, 68-70,]. The
metais of interest were collected whereas magnesium and calcium were not retained on
the resin.
There appears to be only one commercially available dithiocarbamate resin, Sumichetate
Q-10. This has been used by 2 groups [71, 72] for the collection of mercury
compounds. Quantitation was achieved by cold vapour A A S in the former study and
head space gas chromatography in the latter.
The functionalisation of other supports provides yet another route to dithiocarbamate
resins. Chen et ai. [64] have functionalised polystyrene beads which were subsequently
used to collect a number of metais.
Various cellulose substrates have also been derivatised [73] to dithiocarbamates or
xanthates and the adsorption behaviour of 15 different metais studied. The resins
produced had a relatively high capacity for Ag, Cr(VI), Cu, Hg, Pb and Se(IV).
'PagelO

ÇeneraC Introduction
TabCe 1.5 JZppCications of' dithiocarbamate functionalised adsorbent (andreCated
adsorbent)
species
collected
Ag, Cu,
Cr.Hg.Mn, Zn
Cd.Pb, Zn, Cu
arsenite
Au, Pd, Pt, Ag
22 metais
Ag, Cd, Cu, Hg.Pb, Sb, Co, Ni Bi, Cd, Cu, Hg, Ni, Pb, Se, Sn, Te, U
Hg, Cu, Zn,
Cd.Co, Au, Ag,
Pb
Au, Pt, Ir, Ru
CH 3 Hg+
Hg
CH3Hg+,
C 6H 5Hg+, Hg
Pb
Sample matrix
Water
Seawater
Water with
other arsenic
species
present
Digested
geological
samples
Water
Water
Urine
Water
Digested Ore
Natural waters
Water
Natural waters
water
Support
Silica
Silica
Silica
Polydithiocarbamate
resin
Polyd ith iocarbam ate
resin
Polydithiocarbamate
resin
Polydithiocarbamate
resin
Polystyrene
Polydith iocarbamate
resin
Commercial resin
Commercial
Polyurethane
Determination
methodt
XRF
AAS
AAS
ICPAES
ICPAES
AAS
ICPAES
uptake study
INAA
Headspace
GC
Cold vapour
AAS
XRF
ESCA
Reference
58
59
82
61
66
63
65
64
83
72
71
78
79
84
(Page 11

ÇeneraC Introduction
TabCe 1.5
species
collected
Bi, Co, Cr, Cu,
Hg, Ni, Pt
Cd, Co, Cu, Pb,
Ni, Sb, Zn
Cr(lll), Cr(VI)
speciation
Be, Co, Cu,
Fe.Hg, Mn, Mo,
Te.Ti, V, Zn
Cd, Co, Cu, Fe,
Mo, V, Zn
Cr(lll), Cr(VI)
speciation
As, Bi, Sb.Se,
Te
Cd, Co, Cu,
Mo.Ni, Ti, V
Cu, Pb
Co, Cu, Hg.Mn,
Pb, Zn Ca, Fe, Mn, Co.Ni, Cu, Zn, Ag.Cd, Hg, Pb, U 0 2
2 +
As, Sb, Se, Te
CH3Hg+
t GC - gas chro
(Continue d)
Sample matrix
Water
Snow.tap-water
milk.seawater
river water
Water
Urine
Serum
Urine and
dextrose
Urine
B o n é
Water
Ultrapure water
Lake water
Water
Water
Natural waters
matography ICPMS •
Support
XAD-4
Polydithiocarbamate
resin
Polydithiocarbamate
resin
Polydithiocarbamate
resin
Polydithiocarbamate
resin
Polydithiocarbamate
and
Polyacrylarnidoxime
resins
Polydithiocarbamate
resin
Polydithiocarbamate
resin
C-|8-silica
Silica
Thiol
functionalised
hydrophilic resin
Thiol Cotton
Sulphydryl cotton
• Inductively coupled mass
Determination
methodt
ICPMS
AAS
ICPAES
ICPAES
Hydride
generation
ICPAES
ICPAES
ICPAES
ICPAES
FIA-AAS
XRF
FIA
AAS
GC
spectrometry
Reference
80
62
85
68
46
70
69
86
56
87
77
74
76
Closely related to the dithiocarbamate resins is the sulphydryl cotton adsorbent. This has
been produced by various workers [74-76] and used for the collection of precious metais,
'Page 12

ÇeneraC Introduction
methyl mercury, As, Sb, Se, and TI. Thiol functionalised resins have also been studied
for the immobilisation of selected heavy metais [77].
Finally, two other approaches involved the use of solid phase adsorbents and
dithiocarbamates. The first involves loading diethylammonium dithiocarbamate onto
polyurethane foam disks [78,79]. This technique was used to collect methyl, phenyl and
inorganic mercury from natural waters. Quantification was achieved by XRF.
The second approach uses the formation of metal dithiocarbamate complexes in solution.
These are subsequently collected onto a suitable sorbent after which they are eluted and
determined [80, 81]. For example, Plantz et ai. have used
bis(carboxymethyl)dithiocarbamate to complex Bi, Co, Cr, Cu, Hg, Ni, Pt and V. The
complexes were collected onto a styrene-divinylbenzene resin, the metal complexes are
then eluted with an alkaline solution and determined by ICPES. This technique provides
a twofold concentration factor with a concomitant reduction in alkali and alkaline earth
metal ions.
1.1.1.4 Other sorbents
Although the three classes of adsorbents listed previously account for a large portion of
the published literature on metal preconcentration with solid phase adsorbents, there
remains a significant body of work investigating the use of other functional groups for
metal preconcentration. A brief discussion of these follows, the grouping of references
reflects the approach to reagent immobilisation rather than any group classification.
The simplest materiais used are untreated adsorbents such as activated carbon [75, 88].
These however have limited applications, and have been applied primarily to the
preconcentration of gold.
A convenient method of incorporating functional groups onto relatively inert substrates
has been to utilise the adsorption of the reagent onto the support material. To achieve this
the desired reagents is usually loaded onto the support from a non-aqueous system and
Vage 13

ÇeneraC Introduction
the solvent allowed to evaporate leaving the immobilised reagent. For the successful
implementation of this approach both the chelating agent and metal-chelate complexes
need to be insoluble in water or they will be eluted during sample collection.
Utilising this approach dithizone has been coated onto activated carbon [89], 2-
mercaptobenzothiozole cellulose acetate [90] loaded onto silica and controlled pore glass
[21] and l-(2-Pyridylazo)-z-napthol coated onto X A D - 4 [95]. A major problem with
this approach is that the complexing agent is also eluted during sample elution. The
extent of this effect varies, but limits the scope for reuse of the adsorbents.
To circumvent these problems many workers have immobilised reagents to the surface
of the support by various chemical reactions. The most popular approach has been the
use of silanising reagents to immobilise collectors onto silica. This method has been
employed with a variety of amines, attaching them to either silica gel or controlled pore
glass [55, 58, 87, 91, 92]. Other workers have used this technique to graft 2-[(2-
(triethoxysüyl)ethyl)ttóo]aniline [93] and sakcaldimine [94] to silica.
A similar approach to this is the use of other chemical reactions to graft collectors onto
supports. The carbodiimide reaction has been used to attach a chelating agent to
sepharose gel [96], ring opening reactions to derivatise a polymethacrylate copolymer
[97], cyanuric chloride to bind anthranilic acid to a cellulose support [98]. Picolinic acid
[99] and dithizone [100,101] have been attached to polystyrene-divinylbenzene polymers
utilising the appropriate synthetic route. A summary of the aforementioned approaches
and the metais collected is found in Table 1.6. A more extensive review of the various
chelating polymers used for metal preconcentration can be found in references 18 and
102.
Vage 14

ÇeneraC Introduction
TabCe 1.6 AppCications of alternative soCidpüase adsorbents
Species
collected
Au
Ag, Bi,
Cd.Cu,
Hg,
Pb.Zn
Cd, Co,
Cu.Ni.Zn
Au.Pt, Pd
Ag, Cd,
Co, Cr,
Cu, Fe
Co, Cu,
Hg.Mn,
Pb, Zn
Co.Cu,
Hg.Zn
oxyanion
s
Cu
Co, Cu,
Ni,Zn
Cd, Co,
Cr, Cu,
Fe, Mn,
Ni, Pb
Matrix
Natural
water
Acidic
samples
Water
Acid
matrix
Water
Water
Water
Water
Seawater
Seawater
and fresh
water
Purê
water
Substrate
Activated
carbon
Activated
carbon
Methacrylate
polymer
Silica
Silica
Silica
Silica
Silica
Sepharose
4B gel
Polyamine-
polyurea
Acrylic ester
resin
Functional
qroup
Dithizone
Imidazole
groups
v-Arninopropyl
triethyloxysilane
Z 6020
Z 6020
Z 6020
Z 6020
Diethylenetriamine
-N.N.N/N/N' -
pentaacetic acid
Amine
Determination
method
GFAAS
GFAAS
AAS
AAS
XRF
XRF
XRF
XRF
AAS
GFAAS
AAS
GFAAS
Reference
103
89
97
91
58
87
92
55
96
104
105
Vage 15

ÇeneraC Introduction
TabCe 1.6 (continued)
species
collected
Cd, Cu,
Pb, Zn
Cd, Cu,
Pb.Zn
Cd, Co,
Cu.Pb,
Zn
Cd, Cu,
Fe, Ni,
Pb, Zn
Pd
Ag,
Au.Pd
Cu
Hg
Au and
Pt group
metais
Z 6020 =
Matrix
Water
Water
Seawater
Water
Water
Water
Water
Water
Water
(3-Aminoethyl •
Substrate
Phenol-
formaldehyde
resin
Silica
Cellulose
acetate
XAD-4
Silica
Silica
Silica
Polystyrene
Polystyrene
Functional
qroup
Salicylic acid
2-Mercapto
benzothiazole
Dithizone
1-(2 Pyridylazo)-
2-napthol
2-[(2-(Triethyloxysilyl)
ethyl)thio]aniline
2,2'-Dipyridyl-3-{(4-amino-
5-meroapto)-1,2,4-
triazolyl]hydrazone
Salicaldimine
Picolinic acid
Dithizone and
dehydrodithizone
v aminopropyl trimethoxysilane
Determination
method
FIA-AAS
AAS
Polarography
A A S
Colorimetry
AAS
AAS
A A S /
colorimetry
de plasma
emission
spectroscopy
Reference
46
21
90
95
93
106
94
99
101
1.1.2 ELECTROCHEMICAL PRECONCENTRATION
A n alternative method of immobilising analytes onto a solid collection médium is to
utilise an electrochemical reaction. To achieve this the collector must posses sufficient
conductivity to enable it to be used as the working electrode in an electrochemical cell.
This in turn puts a number of restrictions on the materiais that can be employed in
Vage 16

ÇeneraC Introduction
electrochemical preconcentration. Despite these limitations electrochemical
preconcentration techniques are in theory, a very attractive approach to metal
preconcentration. A H they require is a clean substrate onto which the metais of interest
can be deposited, an appropriate holder (cell) for the solution and electrodes. Control is
achieved by a suitable voltage or current source. The addition of other reagents is often
unnecessary, as samples usually have sufficient ionic conductivity to allow the passage of
current. Thus, the only reagent added to the system is electrons and hence not a source of
contamination, provided the electrode is inert in the sample solution.
The most common form of electrochemical preconcentration involves electrodeposition
of the metais of interest. Metals may be deposited directly as metallic films onto a solid
electrode such as graphite [107,108] or platinum wire [109]. Alternatively, some metais
may be deposited onto mercury electrodes where they form amalgams [110]. Another
immobilisation route available with mercury based electrodes is the formation of
insoluble mercury-analyte films. Recent reviews of the subject [111, 112] provide an
extensive discussion of electrolytic preconcentration methods.
It is evident from the available literature that although electrolytic methods possess many
desirable characteristics they are not used extensively in analyte collection and
preconcentration. There appears to be several reasons for this:
• Only a limited number of metais may be successfully collected
• only labile metais may be collected
• organic materiais may foul the electrode and reduce collection effíciency
• 1 0 0 % collection effíciency is extremely difficult to achieve, particularly for
dilute solutions
As a result of these limitations only one group of routinely used instrumental techniques
have an electrochemical preconcentration step prior to quantification. These techniques,
collectively known as stripping analysis [113] have an electrochemical preconcentration
Vage 17
ÇeneraC Introduction
step, followed by a voltammetric detennination step. During this determination step the
current flowing at the electrode is monitored as a function of applied potential. This
technique is known as stripping voltammetry (SV). W h e n the applied potential is
ramped in a positive direction the technique is known as anodic stripping voltammetry
(ASV). W h e n applied in a negative direction the technique is known as cathodic
stripping voltammetry (CSV). Alternatively, the potential of the electrode is monitored
as a function of time. This is known as potentiometric stripping analysis (PSA). With
either technique the requirement is not 1 0 0 % collection effíciency, but rather reproducible
collection effíciency that is independent of analyte concentration. This requirement is
usually met over a limited range of analyte concentrations depending both on the metal to
be determined and the experimental conditions used.
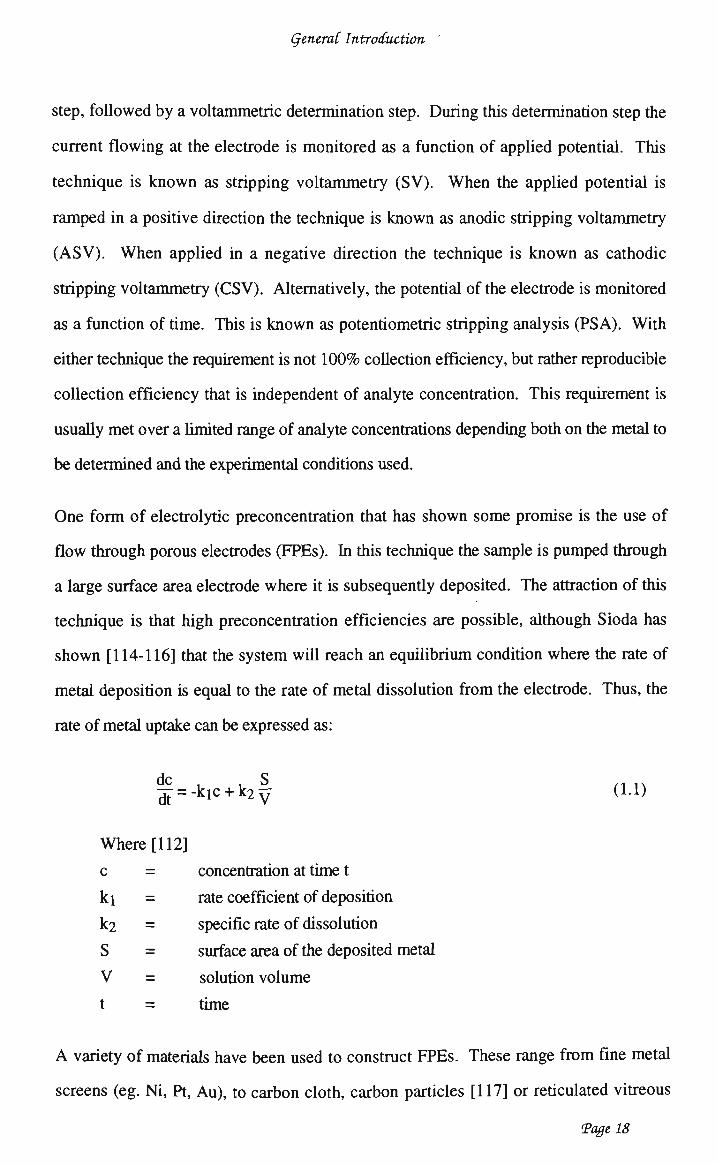
One form of electrolytic preconcentration that has shown some promise is the use of
flow through porous electrodes (FPEs). In this technique the sample is pumped through
a large surface área electrode where it is subsequently deposited. The attraction of this
technique is that high preconcentration efficiencies are possible, although Sioda has
shown [114-116] that the system will reach an equilibrium condition where the rate of
metal deposition is equal to the rate of metal dissolution from the electrode. Thus, the
rate of metal uptake can be expressed as:
de . . S ,« tv ^ = -kic + k 2 y (1.1)
Where [112]
c = concentration at time t
ki = rate coefficient of deposition
k2 = specific rate of dissolution
S = surface área ofthe deposited metal
V = solution volume
t = time
A variety of materiais have been used to construct FPEs. These range from fine metal
screens (eg. Ni, Pt, Au), to carbon cloth, carbon particles [117] or reticulated vitreous
Vage 18

ÇeneraC Introduction
carbon ( R V C ) [112]. O f these, R V C possesses both the mechanical and chemical
properties that make it a superior preconcentration médium. A s such it is worthy of
further investigation.
1.1.2.1 Reticulated vitreous carbon
Reticulated vitreous carbon is particularly attractive for sample preconcentration because:
• it is chemically inert
• it is supplied clean and easily cleaned if contaminated
• it has high surface area/volume ratio
• it is amenable to chemical modification
• it has high mechanical strength.
These properties make the material very suitable for manufacture into analyte
preconcentration cartridges that can be used both in the field and the laboratory.
RVC is manufactured by the pyrolysis of reticulated polyurethane in an inert atmosphere
[118] and it is essentially a honeycomb of glassy carbon like material (Figure 1.1), it has
been suggested [118] that, like glassy carbon, R V C possesses a crosslinked turbostratic
structure.
figwe 1.1 'ECectron micrograph ofÜtyC
Vage 19

ÇeneraC Introduction
The physical properties that make R V C attractive are [119]:*
Density 0.048 (g.cm-3)
Void volume 9 7 %
Hardness 6 - 7 (mohs)
Specific resistivity 0.47 - 0.69 (ohm/cm @ 25° C)
Tensile strength 3-12 (kg.cnr2)
From this data it can be seen that RVC possesses both mechanical stability and very good
electrical conductivity. Coupled with this, R V C is chemically and electrochemically very
stable, it is only effected by severe chemical attack and has a potential range of +1.2 to -
1.0V(vsSCE)atpH7[120].
The first reported use of RVC in an electrochemical application was as part of an optically
transparent electrode, in this case the extremely high surface área to volume ratio of 65
cm2.cm"3 [120] meant that thin slices of R V C could be fabricated into low dead volume
(400 - 550 |ll) cells.
The first use of RVC as a flow through electrode was reported by Curran and Strohl
[121]. These workers [121-124] and W a n g et ai. [125-129] have extensively studied
R V C in flowing systems. Both groups reported extremely high conversion efficiencies
(>95%) for the oxidation of ferrocyanide, ascorbic acid and catechol at relatively low flow
rates.
In the work of Strohl and Curran, RVC electrodes were used as the detection electrode in
an FIA system for the oxidative determination of ascorbic acid, epinephrine, catechol,
hydroquinone, ferrocyanide and L-dopa [121-123]. The authors reported very low limits
of detection and high reproducibility of analyses. Tougas and Curran [124, 130]
improved on the design of the cell used in the previous work and produced an R V C
electrode based coulometric detector with a low (150 |nl) dead volume.
Vage 20

ÇeneraC Introduction
W a n g and co-workers have used an R V C electrode for solution clean up in on-line
stripping analysis [128, 129]. In this application a coulometric cell using an R V C
electrode, was placed, in a flow system, downstream of the voltammetric cell. The
coulometric cell was set at a potential to remove species that were interfering with the
analysis being performed in the voltammetric cell. Using this system, copper was
removed from a solution being analysed for zinc, thus preventing the formation of the
copper-zinc intermetallic. In a similar application oxygen was removed from a solution
to be analysed for cadmium, lead and zinc.
Wang and Blaedel have also used mercury coated RVC (HgRVC) for the construction of
a rotating porous carbon electrode and have used it in flow systems for A S V
measurements of Cd, Cu, Pb and Zn [131]. In a similar study Alzand and Langford
[132] investigated the use of H g R V C as an electrode for the stripping voltammetry of
Copper in natural water. These authors also investigated the feasibility of collecting the
samples onto H g R V C , in the field, with simple instrumentation. Quantification of the
copper was performed in the laboratory at a later date, using more sophisticated
electrochemical instrumentation.
The results of this study showed that although labile copper could be collected onto
H g R V C cartridges, subsequent analysis indicated that some of this copper was lost on
storage. They concluded that field sampling with H g R V C was plausible but probably
only with some form of on-line sample digestion.
Other workers have studied the use of RVC or HgRVC as electrodes for voltammetric
analysis. Osteryoung [133] has used an inert epoxy to fill the voids in the R V C . The
electrode produced when polished, behaved like a microelectrode array. Zampori et ai.
[134] used a H g R V C electrode for the determination of Cd and Pb.
Apart from coating with mercury, there have been few attempts to chemically modify
R V C . Anderson and Lung [118] used a variety of reactions to covalently bond ferrocene
to the surface of R V C . Wieck et ai. have used R V C as a support for the immobilisation
Vage 21

ÇeneraC Introduction
of glucose oxidase and used this in a FIA system for the determination of glucose [135].
More recently [136] Heider et ai. electrochemically platinized R V C and attached glucose
oxidase to the partially platinised surface to form a glucose sensor with enhanced
sensitivity. Only one report to date has used electropolymerisation techniques to modify
the R V C surface [137]. In this work the electropolymerised 1,2 diaminobenzene was
used to both stabilise an enzyme attached to the surface of platinised R V C and to provide
a layer that prevents electrode fouling.
This lack of work on RVC is somewhat surprising given that RVC is essentially a
porous glassy carbon electrode and that much work has been performed attaching
electrochemically generated polymers to glassy carbon. It is this literature that provides
much background information regarding the techniques of polymer synthesis and the
properties of the polymers generated. It should be noted however, that many of these
studies concentrate on the physical, electrical and to a lesser extent, electrochemical
properties of the polymers produced.
The only reported use of R V C for the preconcentration of metais prior to a non-
voltammetric determination step has been reported by Oragam and Snook [118]. In this
work they used a specially designed cell to preconcentrate copper and release it on-line
into the nebuliser of an inductively coupled atomic emission spectrometer (ICPAES).
Using a sample flow rate of 3.4 mL.min-1 they achieved a 3 5 % plating effíciency for
copper at -400 m V . This lowered the limit of detection (LOD) for copper, using a 5
minute plating time, from 20 ng.mL"1 to 100 pg.mL-1. To date, ali work performed
using electrochemical techniques as a means of quantitative analyte preconcentration have
been restricted to the use of unmodified conventional electrode materiais. Chemically
modified electrodes are yet to find application in this área
Vage 22

ÇeneraC Introduction
1.2 ELECTROCHEMICAL SENSORS
As stated in the introduction, there are 2 approaches to the selective determination of
analytes. The first, selective sampling, has been reviewed in the previous section. In this
next section the use of selective sensors will be evaluated.
One requirement for performing analyses at the sampling site is that any instrumentation
used must be portable and robust. Consequenüy, many laboratory based techniques are
not suitable for use in on-site analysis because they lack portability. The portability and
size requirement have become so important that in a recent review Wolfbeis [138] gives
the following definition for a chemical sensor;
"small sized devices comprising a recognition element, a transduction
element, a n d a signal processor capable of continuously and reversibly
reporting a chemical concentration".
The author then stated that only electrochemical or optical (particularly those based on
fibre optics) techniques successfully fulfilled this requirement.
It is electrochemical techniques that are the focus of this work, however the working
definition of sensor used throughout this study does not relate to the whole instrument
but rather the most important component of it - The Recognition Element; as the
electronics required to convert the signal into a chemical concentration are readily
available.
The advent of low power electronics has enabled the development of portable
electrochemical instruments. Portable, even pocket size, p H meters are readily available
and portable voltammetric instruments have been described in the literature [139]. At
least one of these, the Chemtronics P D V 2000 is now commercially available.
Only a limited number of electrodes are suitable for use with portable voltammetric
instruments. As a result of this only a limited number of analytes can readily be detected,
Vage 23

ÇeneraC Introduction
specifically those that are detenninable by stripping voltammetry. The most c o m m o n
technique used is A S V , although some elements may be determined by C S V . The range
of elements detectable may be expanded by the use of adsorptive stripping voltammetry
[140, 141]. However, it is often difficult to achieve reproducible results using this
technique as the instruments use a mercury thin film electrode ( M T F E ) as the sensing
element. This problem may be circumvented by stripping the mercury film from the
electrode at the completion of each analysis and replating it either prior to the next
determination or in-situ during the determination [142].
If electrochemical instruments are to find widespread use, the range of compounds that
can be detected must be expanded. Also, recognition elements must be developed that
are more resistant to fouling and able to preferentially detect one species in the presence
of others. T o achieve this it is necessary to develop electrodes that possess new
preconcentration schemes, different signal generation mechanisms or have improved
stability. It is with this aim in mind that many workers in recent years have investigated
and developed chemically modified electrodes for use as sensing elements.
1.2.1 CHEMICALLY MODIFIED ELECTRODES (CMEs)
As with stripping voltammetric techniques, voltammetry with CMEs often involves
specific application of selective preconcentration. Similarly it is an application requiring
not 1 0 0 % collection effíciency but rather reproducible collection effíciency.
When considering the operation of CMEs it is convenient to consider the action of an
electrochemical sensor as a combination of several steps:
• movement of analyte to the sensing element
• selective binding of the analyte to the sensor surface
• signal generation at the sensor surface
transmission of that signal through the bulk of the sensor to the
electrochemical instrument
Vage 24

ÇeneraC Introduction
Chemically modified electrodes add a new dimension to both the binding and signal
generation steps.
The modification of electrode surfaces can be achieved by a number of approaches. In
the past few years a variety of reviews dealing with modified electrodes have appeared in
the literature [138, 143-152]. Consequenüy, this section will only provide an overview
of modification techniques used and review recent advances in the áreas that are relevant
to this study.
To successfully produce a modified electrode it is necessary to impart analyte recognition
properties to the electrode surface. This may be achieved in a variety of ways. It can be
as simple as adding the modifier to the sample solution and relying on adsorption of the
modifier onto the electrode, as is done in adsorptive stripping voltammetry [140, 141].
Alternatively, the modifier m a y be added to the electrode prior to electroanalysis by
techniques such as spin coating, dip coating, evaporative coating, physical admixing,
surface immobilisation and electrochemical generation of modifier layers [150]. Once
present either in or on the electrode surface, the modifier makes the electrode capable of
determining or collecting specific analytes.
1.2.1.1 Physical admixing
With this method of electrode modification the chemically active agent is mixed with the
electrode material prior to electrode manufacture. This technique of electrode preparation
is particularly suited to the modification of carbon paste electrodes, as the carbon powder
is mulled with a binding agent as part of electrode construction. To modify these
electrodes it is simply a matter of adding the modifier to the binding mixture during the
mulling operation. A recent publication by Kalcher [151] reviews this technique in detail.
The main consideration when producing this type of electrode is to obtain a homogenous
mixture. A number of different modifiers have been used including resin based ion-
Vage25

ÇeneraC Introduction
exchangers [153, 154-157], liquid ion exchangers [158], complexing agents [159-164],
coupling reagents [165], zeolites or other minerais [166] and crown ethers [167].
The major advantage of this approach to electrode modification is the ease with which the
modifier is incorporated into the electrode. This facilitates rapid production of modified
electrodes and allows the experimenter to readily vary the amount and type of reagent
used.
Although carbon paste based electrodes are the most popular composite electrodes used
there is another type of composite electrode that warrants mention. This was reported by
Shaw and co-workers [168, 169] and involves the formation of a composite electrode
produced by the polymerisation of a mixture containing a monomer (eg styrene), cross
linking agent (divinylbenzene), an initiator (azoisobutylnitrile), the modifier (either
vinylpyridine or vinylferrocene) and carbon black. Electrodes prepared in this manner
were reported to be robust and reproducible and have a better signal/noise ratio than
glassy carbon [168], This approach is yet to be used by other workers despite providing
the advantage of reusable electrodes.
1.2.1.2 Chemical binding
The use of surface functional groups as anchoring points for modifiers has also found
application in modified electrode synthesis.
Silanization reactions have been used extensively to immobilise reagents onto silica
substrates (see section 1.1.2) and it is an obvious extension of this principie to use this
method of attachment to bind modifiers to glassy carbon electrodes. In this technique,
the silanizing reagent reacts with the surface hydroxyl groups of the substrate to produce
a modified surface [149] which may be used as is or further modified. This approach
has been used by a number of researchers who have successfully attached reagents to
glassy carbon [170]. Other surface immobilisation reactions used include the
Vage 26

ÇeneraC Introduction
Carbodiimide reaction [149], the thionyl chloride reaction [149] and the Williamson
reaction [149].
1.2.13 Coating with preformed polymers
The techniques of spin coating, dip coating and evaporative coating belong to this class of
modification scheme. Using this technique the modifier, usually a polymer, is dissolved
in a suitable volatile solvent. The solution is then applied to the electrode surface by one
of the techniques mentioned above and the solvent allowed to evaporate leaving only the
modifier on the electrode surface. Film thickness is controlled by the contact time of the
electrode with the solution or by the volume of solution dispersed onto the electrode
surface.
Using this method a number of modifiers, including poly(4-vinylpyridine) [171-174],
nafion [175-177] tri-n-octylphosphine in P V C [178] and poly(ester-sulfonic) acid [179]
have been applied to electrodes. Electrodes prepared this way however have been found
to lack robustness and as a result some workers have tried to stabilise these by either
treating them with heat to promote cross linking in the modifier [173] or by coating with
a more stable polymer layer [180]. The stabilisation methods have increased electrode
life but not to the extent that they would be suitable for long term use.
The use of preformed polymers, although possessing limited reproducibility provides a
simple method for screening the activity of various modifiers. Ali that is required is that
the modifier be soluble in a volatile solvent but insoluble in the supporting electrolyte to
be used for analysis.
1.2.1.4 Electropolymerisation
Electropolymerisation provides a convenient route to electrode modification. In its
simplest form ali that is required is a voltage applied to two electrodes immersed in a
solution containing a monomer amenable to electropolymerisation. In practice however,
Vage 27
ÇeneraC Introduction
there are many other criteria to be considered when modifying an electrode with
electrochemically generated polymers.
The review articles previously cited (section 1.2.2) provide a general overview of the
topic. A detailed evaluation of the electrodeposition of polymers is given in a review
article by F. Beck [181] and more recently by Imisides et ai. [152], in a review of the use
of electropolymerisation to produce new sensing surfaces.
Historically, the first electrochemically generated polymers were those produced by
electro-reductive means. These were synthesised primarily from vinyl containing
monomers [181] and have found little application in sensor development.
Most current interest in electrochemically generated modifiers is focussed on those that
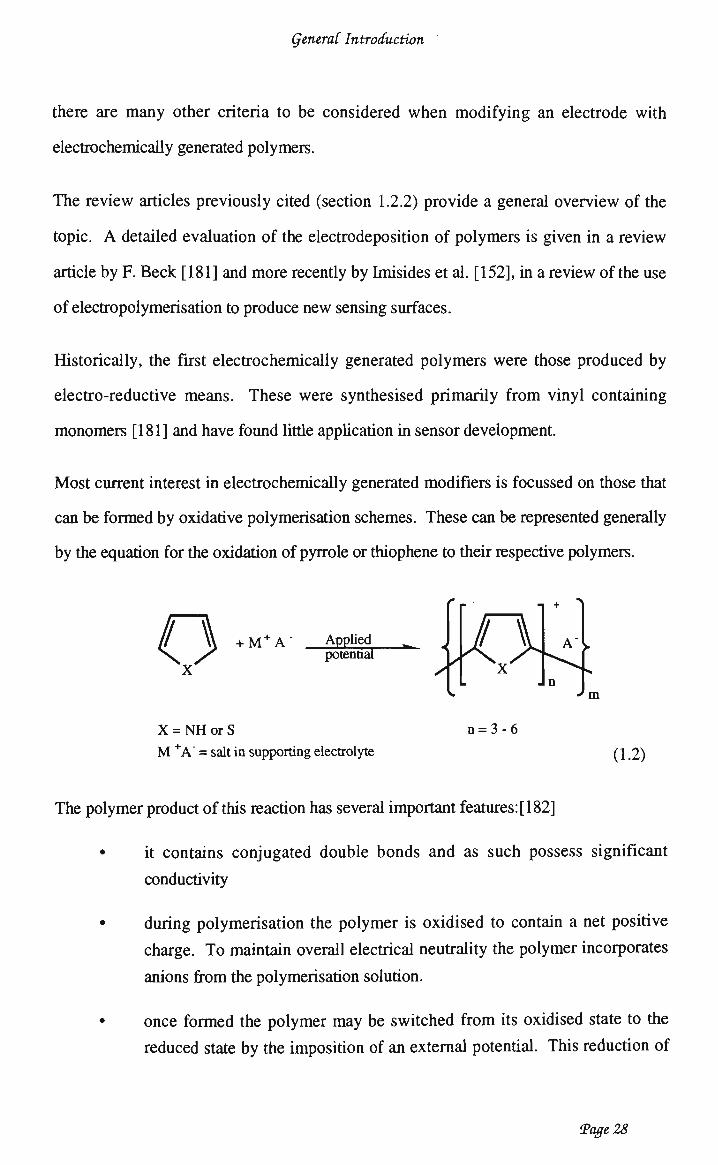
can be formed by oxidative polymerisation schemes. These can be represented generally
by the equation for the oxidation of pyrrole or thiophene to their respective polymers.
( ) •
X = NH or S
M + A " = salt ii
•M+A" Applied potential
í supporting electrolyte
«'m
n = 3-6
(1.2)
The polymer product of this reaction has several important features:[182]
• it contains conjugated double bonds and as such possess significant
conductivity
• during polymerisation the polymer is oxidised to contain a net positive
charge. To maintain overall electrical neutrality the polymer incorporates
anions from the polymerisation solution.
• once formed the polymer may be switched from its oxidised state to the
reduced state by the imposition of an externai potential. This reduction of
Vage 28

ÇeneraC Introduction
the polymer backbone is accompanied by an expulsion of anion
incorporated during synthesis.
It is the combination of these characteristics that makes conducting polymers so suitable
for sensor development. The inherent conductivity means that potentials are easily
applied to the sensor surface. The ability to incorporate anions during synthesis has been
investigated by many workers as a means of incorporating reagents into the electrode
[152 and references contained therein] and the ability to release anions under potential
control has been used to release reagents from electrodes [184,185].
It is the ability to incorporate specific chemically active agents during
electropolymerisation that has been most often used in the fabrication of sensors from
these polymers. A n excellent example of the flexibility of this approach is the variety of
glucose sensors developed with polymer modified electrodes. These sensors use glucose
oxidase ( G O D ) immobilised in a conducting polymer membrane composed of either
polyaniline [186] or polypyrrole [187-189,]. Glucose concentration is estimated by
measuring oxygen consumption [190], hydrogen peroxide formation [191], reduction of
iodine [192] orthe oxidation of a reduced mediator [193,194].
In the above mentioned cases the polymer layer serves only to immobilise the active
agents [191] and prevent electrode fouling. This approach has also been used in the
fabrication of glucose sensor employing immunoglobulin immobilised in polytyramine
[195] and a human serum albumin (HSA) sensor based on anti H S A entrapped within a
polypyrrole film [196].
The use of reagent entrapment is not restricted to biological molecules, Wallace and Lin
[197] have incorporated complexing agents into polypyrrole to form the basis of a silver
sensor.
Interaction with the polymer backbone has been used by various workers. Phom et ai.
[153, 198] have polymerised 8-hydroxyquinolines and studied the interaction of both
cobalt and copper (II) and cobalt (II) with the polymer produced. Wallace et ai. have
Vage 29

ÇeneraC Introduction
derivatised polypyrrole to form dithiocarbamate modified electrodes suitable for the
determination of copper [199, 200] and mercury [201]. Also reported is the use of
Poly(3-methylthiophene) modified electrode for the determination of chromium (VI)
[202], in this case the analytical signal is derived from non-faradaic signal that occurs as
the Cr (VI) anion is expelled from the polymer matrix.
Electrodes exhibiting size exclusion characteristics have been developed [203,204], the
various selectivities were achieved by controlling electropolymerisation conditions.
Similarly, over oxidised polypyrrole films have been shown to exhibit anion exclusion
properties [205]. In this application an electrode coated with an over oxidised polypyrrole
film was shown to be suitable for the determination of dopamine whereas no response
was seen for the ascorbate anion at the same electrode. W a n g and Li [206] have used
poly(3-methylthiophene) as a protective layer to prevent the fouling of glassy carbon
electrode during the voltammetric and amperometric determination of phenolic
compounds. The mechanism of protection is not given but it appears that the phenols are
oxidised at the polymer film. The poly(3-methylthiophene) film exhibits a greater
resistance to fouling than unmodified glassy carbon.
The anion exchange properties of conducting polymers have been an área of great
interest. Both polypyrrole [207] and polyaniline [208] modified electrodes has been used
for the determination of electroinactive anions. In both cases the analytical signal
observed is attributed to doping/undoping processes in the polymer. Other workers have
developed ion exchange polymers [209], although these polymers have not been used in
sensor design it is feasible that they will eventually be utilised, particularly when they can
be made to exhibit the type of ion exchange specificity seen with ion exchange based
carbon paste electrodes.
Vage 30

ÇeneraC Introduction
1.3 AIM AND SCOPE OF THIS WORK
Chemically modified electrodes have increased the scope of electrochemical sensing by
providing improvements in electrode selectivity and enabling the detection of a number of
electroinactive materiais. Both of these benefits are a result of the modifiers present at the
electrode surface, modifier which enable the use of a wide range of analyte-electrode
interactions in the generation of an analytical signal. These interactions can be further
utilised in analyte preconcentration steps, both electrolytic and non-electrolytic, to enable
the use of C M E s in stripping voltammetry. The generation of an analytical signal is no
longer restricted to redox reactions but n o w may include changes in the electronic
properties of the electrodes. This may be evidenced as changes in electrode capacitance
or resistance [210].
Therefore, with these advantages in mind, the objective of this work has been to
investigate a number of chemically modified electrodes with the aim of developing
sensors and sampling electrodes. Specifically, sensing electrodes for the detection of
gold and methylmercury were investigated. Sampling electrodes studied were developed
for the collection of gold and inorganic mercury(II) from solution.
The detection and collection of the various mercury species was studied because of the
environmental significance of these compounds. The detection of gold, on the other
hand, finds application in geochemical exploration and the processing of gold bearing
ores.
The use of electrochemical techniques for the detection of methylmercury has only been
studied by a small number of workers (reviewed in chapter 3) and the use of C M E s for
the detection of gold by electrochemical techniques has been the subject of investigation
almost since the development of polarography. Various electrodes have been used for
the detection of gold (see chapter 4 for a review) yet the only modified electrodes studied
have been those based on modified carbon paste electrodes. In either case, ie.
Vage 31

ÇeneraC Introduction
methylmercury or gold, the development of an appropriate C M E would enhance the
apphcability of electrochemical techniques for the detection of each species.
An extension of the study of interactions at the polymer modified electrodes has been to
investigate the suitability of utilising these interactions, on a larger scale, in the
development of sampling electrodes. This application requires the use of porous, large
surface área electrodes that are amenable to further modification.
Reticulated vitreous carbon was chosen as the electrode material for this aspect of the
study. R V C combines the requisite physical robustness with the appropriate chemical
and electrochemical characteristics to make it particularly well suited to electrochemical
preconcentration applications. Interest in the use of R V C in this type of application has
waned dramatically since the early reports of this application. This is due, to the fact that
the only collection mechanisms available with unmodified R V C is electrodeposition.
There appears, however, to be a facet of electrochemical sampling with RVC or any other
porous electrode that has not been investigated, that is the use of chemically modified
electrodes. These introduce a further dimension to sample collection with the ability to
use both chemical and electrochemical interactions for analyte collection. In this study w e
have sought to modify R V C and investigate the collection of various metais at these
modified electrodes. The modification schemes investigated have ranged from simple
mercury coating through modification with conducting polymers to polymer
modification foliowed by chemical derivatisation of the modified electrode. M a n y
approaches used have been borrowed from sensor applications and adapted to sampling.
The modification of the electrode surfaces was achieved by the electropolymerisation of
the appropriate aromatic monomers. Electropolymerisation was chosen as the electrode
modification technique because it allows the operator to maintain fairly tight control over
the properties of the polymers generated. This is achieved by limiting either the potential
or current drawn at the electrode during the electropolymerisation step.
Vage 32

ÇeneraC Introduction
Finally, application of a potential to conducting polymers has been shown to change both
the oxidation state and hydrophobicity of these polymers [211]. Such changes can be
expected to affect the polymer-analyte interactions. It is feasible that these changes at the
solution/electrode interface may be used to improve analyte collection effíciency and
specificity. As such, the effect of applied potential upon both the preconcentration
effíciency of sampling electrodes and the sensitivity of sensors has been studied.
To deal with the separate áreas covered in this work the thesis has been divided into 3
major sections. Part 1 (chapters 3 and 4) deals with the development of chemically
modified electrode sensors for methylmercury and gold respectively. Part 2 (chapters 5
and 6) details investigations into the use of chemically modified R V C for the collection of
mercury and gold. Parts 1 and 2 are preceded by chapter 2, dealing with the generation
and characterisation of the polymers studied in parts 1 and 2 of the thesis. The third
component of this work is dealt with in chapter 7. This chapters deal with the
development of ElectroLab, an electrochemical workstation. Specifically, it deals with
development of Design-a-waveform, a new waveform definition protocol that m a y find
application in the development of C M E based sensors. Finally, chapter 8 reviews the
entire work and delineates the conclusions reached.
Vage 33

VoCymer Çeneration andütyc Modification
CHAPTER 2 POLYMER GENERATION AND RVC MODIFICATION
2.1 INTRODUCTION
The generation and characterisation of conducting polymers has been the focus of
considerable research effort in the past 10 -15 years. This work has been driven by the
desire to produce "synthetic metais" for utilisation in a diverse range of applications
including light weight batteries, electromagnetic shielding, sensing devices, biomedical
applications, non metallic electronic circuits and many other applications.
The field of conducting polymer research has its gênesis in studies on polysulphurnitride
[182], this rather unstable material can be regarded as the first intrinsically conducting
polymer, the study of which marked the beginning of this dynamic field of research.
Research which was given further impetus with the discovery that polyacetylene could
readily be doped from an insulating state to a conductivity approaching that of metais
[182,183]. T o achieve this the polymer was first prepared in the dedoped form and then
exposed to iodine vapours, other halogens or oxidising agents to induce conductivity in
the polymer.
Finally, the report of a useable electrochemical method for the production of a doped,
conducting polymer from a solution containing a pyrrole monomer and supporting
electrolyte [212] led to the current interest in the preparation of polypyrroles. This work
has been quickly followed by studies involving the oxidation of other heterocyclic
monomers including thiophenes, furans and Índole or aromatic monomers such as
phenylene and aniline.
Vage 34

VoCymer Çeneration and %J/C Modification
It is those polymers, prepared by the oxidative polymerisation of heterocyclic monomers,
that have been the primary focus of this work.
2.1.1 ELECTROCHEMICALLY GENERATED CONDUCTING POLYMERS
Since the first report [212] of the useable electrochemical synthesis of a conducting
polymer, research in this área has increased rapidly. The most studied of these polymers
appears to be those based on pyrrole, with thiophene and aniline based polymers also
attracting a great deal of attention.
The oxidation of many other aromatic monomers have also been investigated by various
workers. Monomers that have been successfully polymerised include índole [213], furan
[214], azulene as well as pyrrole and thiophene [214]. The conductivity of the films
formed which varied from 5 x IO"3 ( Q c m ) - 1 (polyindole) to IO2 ( Q c m ) - 1
(polythiophene or polypyrrole). Other monomers polymerised include fused thiophene
rings [215, 216], benzo-b-thiophene [217], aniline [204, 208, 218, 219], diphenylamine
[220], dibenzofuran [221], N-3-thienylphthalimide [222], thianapthene-indole [223] and
many others [152, 224-228]. It should be noted however that most of the polymers
mentioned above were studied for their electrical properties only, with little interest in
their chemical function.
2.1.1.1 Polypyrrole
Although the first preparation of a pyrrole polymer was achieved by Dali Olio et ai.
[230], it was not until the work of Diaz and co workers, who a decade later carried out the
first systematic studies of pyrrole based polymers, that this material attracted significant
attention [212,231-233].
In their first study [212] they found that films grown from acetonitrile had higher
conductivity than those grown from aqueous media, although 1 % water was added to the
acetonitrile solutions to improve both adhesion and uniformity of the films produced.
Vage 35

VoCymer Çeneration and^J/C Modification
The effect of water in the electropolymerisation solutions was later studied by Downard
and Pletcher [234] who, like others, confirmed the improved film characteristics. They
attribute this to the influence of water on the initial nucleation and growth steps during
polymerisation.
Diaz also found that the use of very high current density yielded films with very rough
surfaces and recommended ramping the current density from zero to 1 mA.cnr2 over a
period of three minutes during the polymer growth. This produced films with improved
adherence and morphology. These workers also proposed a mechanism of
polymerisation involving a - a coupling of the pyrrole rings, an observation supported
by the fact that monomers substituted in the a position fail to form films whereas those
substituted in the P position are readily polymerised. The incorporation of anions during
synthesis was confirmed by elemental analysis, with the ratio of monovalent anion to
pyrrole being 1:4, both infrared and Raman spectroscopic studies support this hypothesis.
In subsequent studies Diaz et ai. investigated the effect of N substitution of pyrrole on
polymer formation [231], this was found to adversely effect film conductivity. Studies
of the electrochemistry of a substituted pyrroles [232] showed that although these
monomers were amenable to oxidation they did not form polymer films. In a
complementary study Cross et ai. [235] investigated the electrochemistry of twelve
pyrrole based monomers and the polymers formed from these. The monomers were
chosen such that ali substituem permutations were studied, ie N substitution, a
substitution, a,a substitution, a,p\fJ substitution and p\|5 substitution. Their results
indicate that it is possible to form films with monomers that were restricted to oc-P
linkages only, although the films formed exhibited poor conductivity. Monomers
restricted to J3-|3 coupling were found to form soluble oligomers only.
Mono-a-substituted pyrroles were found to form films with very low conductivity. This
was attributed to the effect of a-p1 coupling. These observations were taken to indicate
that some a-ji coupling may be possible in polypyrrole.
Vage 36

VoCymer Çeneration and'RJ/C Modification
Another variable studied by Diaz's group at I B M was the effect of changing the anion
present in the electropolymerisation solution [233]. This was found to have significant
effect on both the physical and electrical properties of the polymers formed. Again,
conductivity provides a suitable yardstick for film performance, with films prepared
containing FSO3" as the counter ion having a conductivity of 0.01 (Q c m ) - 1 whereas
those prepared from CIO4" had conductivities in the range 60-200 (Q cm)- 1.
This effect has subsequently been studied by other workers [236-243]. The most recent
of these [243] investigated the effect of the anion on film conductivity, smoothness and
redox behaviour. These workers varied the anion studied to include chloride, perchlorate,
p-toluenesulphonate and mono, di and trisulphonated benzene. They found that 1,3,5
benzentrisulphonate produced films with the highest conductivity whereas chloride and
perchlorate films possessed the lowest conductivity. One feature that held true for ali
anions was that increased current density during polymerisation caused decreased
conductivity. The rate of polymer discharge and charge was found to decrease with anion
size (for monovalent anions). Similarly, it was found to approach the fastest monovalent
behaviour as the charge on the large sulphonated benzene species was increased; i.e. it
increased from mono to di to tri sulphonated benzene.
Shimidzu et ai. [237] synthesised polypyrrole with an anionic polyelectrolyte as the
counter ion. This could not be expelled from the polymer during the reduction process
and hence the polymer incorporated cations to maintain electrical neutrality. This formed
the bases of a cation exchange membrane.
Other functionalised pyrroles polymerised include 3 substituted pyrroles [244-246], N-
methylpyrrole [231, 247, 248], other N substituted pyrroles [209, 232] and 3-
methylpyrrole-4-carboxylic acid [249]. The last 2 groups have been used to form anion
and cation exchange polymers respectively [209,249].
Vage 37

VoCymer Çeneration andíRJ/C Modification
2.1.1.2 Polythiophenes
A second group of conducting polymers that have been extensively studied are those
based on the thiophene monomer [250-257]. Waltman, Bargon and Diaz reported the
electropolymerisation of a series of P substituted thiophenes, many of which formed
conductive polymer films [251]. A particularly interesting observation from this study
was that 2,2'-bithiophene polymerised at a much lower potential (1.32 V vs SSCE) than
thiophene (2.06 V vs SSCE). This effect was further studied by Heinze et ai. [258] who
found a similar trend for the polymerisation of thiophene, a bithienyl and a quaterthienyl
(Ep = 1.9, 1.2 and 0.8 V vs Ag/AgCI respectively). These authors also give evidence
from cyclic voltammetric data that the quaterthienyl films have a regular structure
(primarily cc-a' linkages] and low molecular weight distributions, whereas the thiophene
derived films have a complex cross linked structure involving a-a, a~P and P~P
linkages. Krische and Zagorska have studied this phenomenon along with other
characteristics of polythiophene and polybithiophene [259-261] and attribute increased
cross linking to the fact that the thiophene monomer is oxidised at a potential greater than
that required to oxidise the polythiophene polymer formed. Thus, the potential for
polymerisation leads to the generation of more active nucleophiles, hence more side
reactions, and the formation of a partially oxidised polymer [259].
Thiophene is amenable to substitution in the 3 position and the polymerisation of a wide
variety of 3 substituted monomers have been studied [251]. Substituents studied include
short length alkyl chains [215, 251, 262-265], aromatic substituents [266, 267] ethers
[268, 264] and sulphonated sidechains [267, 269]. T w o of these proved particularly
interesting, the sulphonated monomers possess a flexible anionic side chain which has
been shown to self dope the polymer and uptake cations during potential cycling [269].
The ether substituted thiophene has been shown to polymerise to form a poly pseudo-
crown ether [270].
Vage 38

VoCymer Çeneration and^yc Modification
2.1.1.3 Electropolymerisation techniques
There are three main modes of electropolymerisation:
Galvanostatic (constant current) polymerisation
In this mode a constant current is applied between the working and auxiliary electrodes.
The voltage at the working electrode reaches a potential that allows the required current to
flow. This potential usually corresponds to that required to oxidise or reduce one or more
of the species present in solution. If w e consider that the redox reactions occuring must
gain or lose electrons to maintain the current flow then it is evident that the reaction rate
will be directly effected by the current drawn and that the total charge consumed will be
proportional to the amount of active species reacted. Thus, by controlling current, or
more specifically current density, it is possible to control the rate of polymer growth and
by controlling the total charge passed during polymerisation it is possible to control the
amount of polymer formed and hence polymer thickness. The current density affects the
surface morphology of the resultant material [271], polymer conductivity [272] and
potential drawn during polymerisation.
Another advantage of galvanostatic polymerisation is the ability to obtain qualitative
information on the polymer quality during the polymerisation process. This is achieved
by monitoring the potential at the working electrode during polymerisation. As soon as
the current is applied the potential at the electrode rises to a levei required to initiate the
nucleation process [271] after which it either continues to rise, indicating that the polymer
formed has a significant iR drop across the polymer film, alternatively it may plateau or
even decrease a little indicating that there is negligible iR drop across the polymer film.
Galvanostatic polymerisation, although the method of choice in most cases, is not
suitable for ali applications. This is a particular problem when one solution component is
oxidised at a potential less anodic or reduced at a potential less cathodic than that required
Vage 39

VoCymer Çeneration and!RJ/C Modification
to initiate polymerisation. Under these conditions polymerisation can only be achieved
by controlled potential techniques.
Potentiostatic (constant potential) polymerisation
To achieve potentiostatic polymerisation the potential at the working electrode is set at a
predetermined value. This value is usually chosen such that the reaction of interest is
occurring whilst undesirable side reactions are minimised.
The hardware required to achieve this is a constant voltage source. This usually takes the
form of a potentiostat, although some workers simply apply a D C voltage across the two
electrodes. A potentiostatic system provides much better voltage control than that
achievable with a simple D C voltage source.
In a potentiostat the voltage difference between the working and auxiliary electrode is set
such that the actual potential at the working electrode is maintained at the required value.
To achieve this a third electrode, a sensing or reference electrode, is placed adjacent to the
working electrode. The potential at the working electrode is monitored with any changes
in the working electrode potential being fed back into the control loop. A s a result of this
the voltage at the auxiliary electrode is altered to restore the working electrode to the
required potential. Thus, this system will automatically compensate for any changes in
solution conditions that may effect the working electrode.
Potentiodynamic (sweeping/pulsed potential) polymerisation
There are some applications where unwanted side reactions occur at potentials much
lower than that required to initiate polymerisation. In this case a suitable method of
polymer synthesis m a y be to repeatedly sweep the potential at the electrode past the
polymerisation potential and back to a potential at which no unwanted reactions occur. In
this way, if the rate of polymerisation is faster than the rate of the unwanted side reaction,
polymerisation is achieved and the unwanted reactions are minimised. A feature of
controlled potential polymerisation is that the current flow is not regulated. Therefore
Vage 40

VoCymer Çeneration andÚtyC Modification
there is little control on both reaction rate and total charge consumed, although the latter
may be monitored. Hence, properties such as polymer thickness, conductivity and
morphology are not readily controlled. This in turn makes obtaining reproducible
electrodes a difficult task.
2.1.2 POLYMER CHARACTERISATION TECHNIQUES
To develop reproducible electrode surfaces requires an understanding of the chemistry
and physical characteristics of these surfaces. This can only be achieved by accurate
characterisation of the polymer surfaces, an extremely difficult task due, primarily to the
amorphous nature and intractabiüty of conducting polymers. B y far the most widely
used tool for characterising conducting polymers is dry state conductivity measurements.
This, however, gives no indication of chemical activity of the polymer or of the effect of
potential on this activity.
Electrochemical methods have found widespread application in the characterisation of
conducting polymers [225, 273-275], scanning electron microscopy has been used to
probe the physical structure [233], and X-ray photoemission spectroscopy (XPS) has
been used to investigate both the electronic structure and anion content of conducting
polymers [193, 276-278].
Other characterisation techniques used include Infra-red spectroscopy [276, 279], Cross
Polarisation Magic Angle Spinning N M R Spectroscopy (Solid State N M R ) [279],
thermogravimetric methods [279, 280] and scanning electrochemical microscopy [281].
Quartz crystal microbalance has been employed to monitor the incorporation and
expulsion of ions from polypyrrole during the doping/dedoping cycle under
electrochemical control [282,283].
In the following section of work a brief overview of the various characterisation
techniques used in this work will be given.
Vage 41

VoCymer Çeneration andíRyC Modification
2.1.2.1 Electrochemical characterisation methods
Electrochemical methods have found extensive application in the characterisation of
conducting polymers [225, 273-275]. Cyclic voltammetry [225, 248] has been used to
probe both the polymerisation mechanism and redox activity of conducting polymers.
A C impedance studies have been used to study the electronic structure and ionic transport
in a polypyrrole based polymer [284, 285] and chronoamperometry has found
application in the study of doping/dedoping processes of polymers [286].
Cyclic voltammetry
Cyclic voltammetry (CV) is probably one of the most versatile techniques available for
the study of redox systems [287] and, as such, is often the method chosen to conduct
initial studies of these. In one experiment the researcher is able to determine the potential
of the redox reactions of interest and obtain qualitative data pertaining to both the
electrochemical reversibility and kinetics of electron transfer for the reactions of interest.
In cyclic voltammetry the potential applied to the electrode is swept repeatedly between
two potential limits, with the current flowing at the working electrode being monitored
and plotted as a function of applied potential. A cyclic voltammogram for an ideal,
electrochemically reversible single electron transfer reaction is shown in Figure 2.1.
•c
e 9»
£ o s
0.8 0.6 0.4 0.2 Potential V vs SCE
figure 2.1 CycCic voCtammogram of an ideal system [from reference 287]
Vage 42

VoCymer Çeneration and^VC Modification
There are several terms used in the figure that require definition. The first of these, Epc is
the potential at which the reduction reaction occurs. Similarly Epa is the potential at
which the oxidation reaction occurs, ipc and ipa are the reduction and oxidation peaks
currents respectively. The relative position, magnitude and scan rate dependence of these
parameters provide useful insights into nature of the redox couple under investigation
[287].
The use of cyclic voltammetry to characterise conducting polymers has been the subject
of a number of publications [274, 225]. Using this technique it is possible to determine
the potential at which the polymer is reversibly oxidised or reduced, the potential at which
irreversible oxidation of the polymer occurs and any changes to the polymer
electrochemistry caused by interaction with analyte species in solution.
A typical polypyrrole voltammogram is shown in Figure 2.2. There are two distinct
features in the voltammogram that are characteristic of polypyrrole [274]. The first of
these is the reversible oxidation of the reduced polymer as the potential is swept from
-1000 m V vs Ag/AgCI to the positive limit of 700 m V . The transition commences at
-500 m V and is associated with the change in the polymer from the reduced or non-
conducting* form to the oxidised or conducting form. This step is electrochemically
reversible as can be seen from the second feature, the reduction response seen at -300 to -
500 m V on the reverse scan. This redox response has been shown to be due to changes
in the oxidation state of the polymer [274, 282, 283] and for polymers incorporating
small mobile anions can be represented by equation (2.1).
+ nX' Oxidation
Reduction
n, = 3-6 (2.1)
It should be noted here that the terms conducting and non-conducting are used in a relative sense, for if the pyrrole was truly non-conducting it would be impossible to electrochemically oxidise the reduced polymer due to its insulating nature.
Vage 43
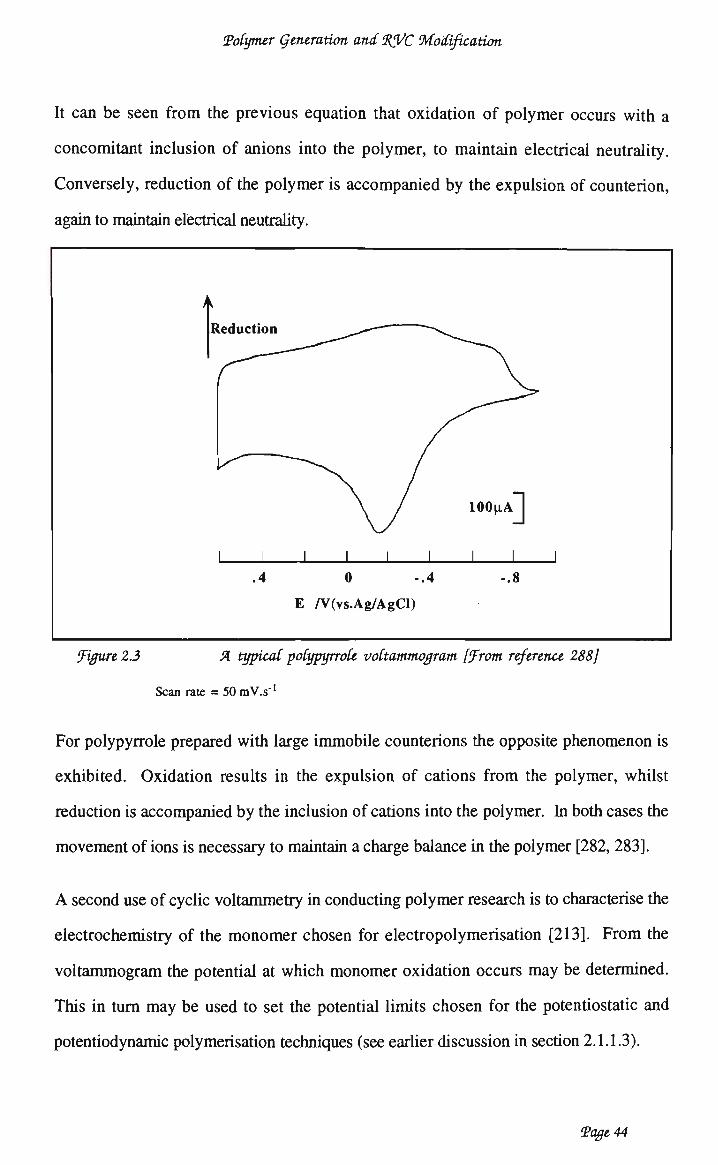
VoCymer Çeneration and %$/C Modification
It can be seen from the previous equation that oxidation of polymer occurs with a
concomitant inclusion of anions into the polymer, to maintain electrical neutrality.
Conversely, reduction of the polymer is accompanied by the expulsion of counterion,
again to maintain electrical neutrality.
A
Reduction
\ / lOOuA
I I I I I I I I I .4 0 -.4 -.8
E /V(vs.Ag/AgCl)
figure 2.3 A typical poCypyrroCe voCtammogram [from reference 288]
Scan rate = 50 mV.s"1
For polypyrrole prepared with large immobile counterions the opposite phenomenon is
exhibited. Oxidation results in the expulsion of cations from the polymer, whilst
reduction is accompanied by the inclusion of cations into the polymer. In both cases the
movement of ions is necessary to maintain a charge balance in the polymer [282,283].
A second use of cyclic voltammetry in conducting polymer research is to characterise the
electrochemistry of the monomer chosen for electropolymerisation [213]. From the
voltammogram the potential at which monomer oxidation occurs may be detenriined.
This in turn m a y be used to set the potential limits chosen for the potentiostatic and
potentiodynamic polymerisation techniques (see earlier discussion in section 2.1.1.3).
Vage 44

VoCymer Çeneration and 'RJ/C Modification
Chronopotentiometry
This technique is used to monitor the potential of the working electrode during
galvanostatic polymerisation. In brief, it provides a qualitative measure of the
conductivity of the polymer formed.
The trends evident in the chronopotentiograms give a good indication of the conductivity
of the polymer formed. If the potential drawn at the working electrode remains constant
throughout the polymerisation process it can be inferred that the polymer layer adds no
extra resistance to the circuit and as such will be conducting. In contrast, if the polymer
synthesised at the electrode has a significant resistance it will add to the overall resistance
of the electrochemical cell. The changes in resistance will manifest themselves in a
chronopotentiogram with a rising potential transient throughout the polymerisation
process [197].
There is a significant body of theory relating to the time and current dependence of
chronopotentiometric data acquired during galvanostatic experiments [289]. However
this theory has been developed to deal with solution responses and is not valid for the
case of electropolymerisation. This is because with electropolymerisation w e are dealing
with deposition onto the electrode, not solution responses.
2.1.2.2 Spectroscopic and spectrometric techniques
A number of researchers have investigated the use of spectroscopic and spectrometric
techniques for the characterisation of conducting polymers. Optical spectroscopy [231,
246, 290], Raman spectroscopy [231] and infra red spectroscopic techniques [214, 231,
276, 279, 290-293] have ali found application in both identifying reagents incorporated
into these polymers and monitoring any changes in the polymer.
X-ray photoelectron spectroscopy (XPS) has been used to study anion exchange
processes in polypyrrole [193,294, 295], to probe the structure of polypyrrole [193, 277]
and to investigate the interaction of copper with polypyrrole [296]. Finally, mass
Vage 45

VoCymer Çeneration andíRJ^C Modification
spectrometry has been used to characterise polymers, although not conducting polymers.
Fragmentation is usually achieved by either fast atom bombardment or field desorption
techniques [297]. Only those techniques used in the experimental work are described
here.
Fast atom bombardment mass spectrometry (FAB-MS)
Fast atom bombardment mass spectrometry is a technique that is extremely useful for the
identification of species included in the polymer, particularly cations and anions.
Both positive ion and negative ion spectra of conducting polymers can be recorded. In
general the spectra are far too complex to provide definitive information on the polymer
structure, the presence of cations in the polymer can be confirmed using this technique.
However, the negative ion spectra of these polymers has proven a very useful tool in the
identification of anions present in the polymer.
Scanning electron microscopy/ EDX
Scanning electron microscopy (SEM) provides an extremely powerful method for the
determination of the morphology and surface topography of conducting polymers.
Changes in surface morphology brought about by altering polymerisation conditions
[212] or altering the anions present during polymerisation [233] have been detected by
S E M studies. Electron microscopy has also been used for studies of the comparative
morphology of different polymers.
The conductivity of the polymers studied is generally too low to permit direct analysis of
the polymer surface without charging problems. Therefore samples are generally coated
with a gold layer prior to electron microscopy.
Sample for microanalysis (EDX) are not gold coated prior to analysis. This technique
has been used to identify the presence of various elements at the surface of the polymers.
Vage 46

VoCymer Çeneration and'RJ/C Modification
One limitation of this technique is that elements lighter than nitrogen cannot be detected
and that the detection limits for some metais is quite poor.
2.1.3 AIM AND SCOPE OF THIS WORK
The objective of this component of the research work has been to determine the
appropriate techniques for polymer generation, characterise the polymers formed and,
wherever necessary, apply the polymer generation techniques to the modification of
RVC.
Preliminary polymerisation studies and electrochemical characterisation of the polymers
formed were conducted using either platinum or glassy carbon electrodes. During these
studies the electrochemical characteristics of the polymers were determined. Once this
was completed the polymers were used for either sensor development or solid phase
sampling applications discussed in later chapters.
Whilst there are a number of monomers suitable for electropolymerisation, the focus of
this study has been those polymers based upon either pyrrole or thiophenes. Pyrrole
based polymers were chosen for these studies because it is possible to polymerise pyrrole
in both aqueous and non aqueous solutions. This ability to polymerise the monomer in
both types of solution increases the scope for inclusion of reagents into the polymer as
the chance of finding a suitable solvent for the required reagent is much greater when
either aqueous or non-aqueous systems can be used. Unlike pyrrole, thiophenes can only
be polymerised from non-aqueous solutions and as such are more restricted terms of the
supporting electrolytes that may be used during polymerisation. Interest in these
polymers was primarily due to the claims that they have a more positive working
potential limit than polypyrroles [182].
Vage 47

VoCymer Çeneration and'RJ/C Modification
2.2 EXPERIMENTAL
2.2.1 REAGENTS
Unless otherwise stated, ali supporting electrolytes were used as received (generally LR
or A R grade), ali solvents used were analytical reagent (AR) grade and ali water used was
Milli Q grade deionised water.
Liquid monomers (ie pyrrole, thiophene, furan and 3-methylthiophene) were distilled just
prior to use. Typically, approximately 10 m L of monomer was distilled, with the first
1 m L of distillate being discarded. The next 5-7 m L of distilled monomer was collected
and stored under refrigeration when not in use. Ali solid monomers were used as
received without further pretreatment.
2.2.2 POLYMERISATION SOLUTIONS
Unless otherwise stated, ali pyrrole solutions were prepared with a pyrrole concentration
of 0.5 M and a salt concentration of 1.0 M . Polymers generated from aqueous solution
were prepared using NaCl as the supporting electrolyte unless other electrolytes were
used for specific studies. Non-aqueous solutions were prepared using similar monomer
and counterion concentrations in acetonitrile solution. 1% v/v water was added to ali
acetonitrile solutions.
Thiophene solutions were prepared in dry acetonitrile using a monomer concentration of
0.5 M and an electrolyte concentration of 1.0 M . The salts used in the preparation of
these supporting electrolytes were dried envacuo prior to use.
3-Methylthiophene solutions were prepared in dry acetonitrile using a monomer
concentration of 0.5 M and an electrolyte concentration of 1.0 M . The salts used in the
preparation of these supporting electrolytes were dried envacuo prior to use.
Vage 48

VoCymer Çeneration and%J/C Modification
2,2'-bithiophene polymerisation solutions were prepared with a monomer solution
concentration of 0.5 M and a supporting electrolyte concentration of 1.0 M . Ali solutions
were prepared in acetonitrile.
2.2.3 EQUIPMENT
Voltammetric experiments were performed on either a Bioanalytical Systems (BAS)
100A Electrochemical analyser or a B A S C V 27 voltammograph connected to a Houston
2000 X - Y recorder.
Galvanostatic experiments were performed using either a Princeton Applied Research
(PAR) 173 constant current source or a purpose built constant current source (Science
Faculty Workshop). Chronopotentiograms were recorded with an ICIDP600 y -1 chart
recorder.
Scanning electron microscopy and EDX analyses were performed with a JEOL JSM
840 scanning microscope.
Fast atom bombardment mass spectroscopy (FAB-MS) was performed on a VG model
M M 12-12 mass spectrometer fitted with a purpose built electrode holder to enable
modified electrodes to be placed in the spectrometer sample chamber for analysis.
X-ray photoelectron spectroscopy was performed on a Perkin Elmer Physical Electronics
Industries model 551 X-ray photoelectron spectrometer/scanning Auger microprobe
spectrometer.
2.23.1 Electrodes
Platinum wire electrodes were prepared by sealing 0.5 mm diameter Pt wire in soda
glass. Electrical connection was achieved by the use of Wood's metal and copper wire.
Electrode length was generally maintained at 1 cm, thus most electrodes had the same
surface área; 0.157 cm2. Electrodes were pretreated by soaking in chromosulphuric acid
Vage 49

VoCymer Çeneration and 'RJ/C Modification
prior to use. This treatment was also used to remove polymer films after each
experiment.
Glassy carbon electrodes used were BAS 3 mm diameter glassy carbon electrodes.
These were polished on 0.3 |im y alumina coated pad and ultrasonicated prior to use.
Polymer films were removed by polishing on y alumina coated pads.
Reference electrodes used were either a BAS Ag/AgCI (3M KCI) electrode, for aqueous
work, or a Metrohm Ag/Ag + electrode for non-aqueous work. Ali reference electrodes
were isolated from the working solution by a vycor tipped salt bridge containing the
supporting electrolyte being used in the working solution.
Reticulated Vitreous Carbon (RVC) was obtained from Energy Research and Generation
(ERG). Cylindrical R V C working electrodes were punched out of the R V C sheet with a
laboratory cork borer. The electrodes prepared were 9 m m diameter and 19 m m long.
These were initially flushed with acetone to facilitate wetting the surface of the R V C , after
which they were flushed with Milli Q water. The wetted electrodes were then boiled for a
minimum of 10 minutes in 1:1 H N O 3 to remove any metal contamination present on the
surface as a result of the electrode fabrication process. Acid treated electrodes were then
rinsed several times with Milli Q water and subsequently stored in Milli Q water.
As these electrodes possess a large surface área a specially designed electrochemical cell
was produced for use with R V C electrodes. This cell (Figure 2.3) uses a large surface
área platinum gauze cylinder as the auxiliary electrode. This has sufficient surface área to
be used with R V C and, as the R V C electrode is located in the centre of the gauze cylinder
it is subject to an even electric field at ali points on the cylinder surface. This promotes
even polymer growth on the R V C .
Vage 50

VoCymer Çeneration and 'RJ/C Modification
Reference electiodel
Puige
inlet\V^
AuxiHaoy electrode
R V C working electrode
figure 23 Ceílconfiguration used for aã stationary ceCCwork.with 'RJ/C
cartridges
2.2.4 P O L Y M E R G R O W T H
To investigate the polymerisation of the monomers studied and the modification of R V C
with these polymers the following experimental protocol was followed:
(i) Using cyclic voltammetry at either a platinum wire or glassy carbon disc
working electrode the electrochemistry of the monomer and the monomer
oxidation potential were determined.
(ii) Wherever possible galvanostatic polymerisation was used to achieve
polymer growth
(iii) Investigate the electrochemistry of any polymer formed to determine the
potential window within which the polymer is stable.
(iv) Attempt polymer growth at RVC using constant current conditions
(v) If (iv) is unsuccessful attempt to achieve polymerisation at RVC by
potentiostatic techniques.
Vage 51

VoCymer Çeneration and 'RJ/C Modification
Polymers produced were studied by cyclic voltammetry and any other relevant
characterisation technique as required.
2.3 RESULTS AND DISCUSSION
2.3.1 PYRROLE POLYMERISATION
The polymerisation of pyrrole was extensively studied because this monomer is easily
oxidised and polymerisation can be performed in both aqueous and non aqueous media
thus allowing a wider range of counterions to be incorporated into the polymers
produced.
23.1.1 Pyrrole electropolymerisation techniques
Initial studies investigated the polymerisation of pyrrole in acetonitrile with
tetraethylammonium perchlorate as the supporting electrolyte. A cyclic voltammogram
recorded during pyrrole electropolymerisation is shown in Figure 2.4a. O n the first
oxidative scan the current begins to increase at 400 mV(vs Ag/Ag +), the current
continues to rise until the upper potential limit is reached, at which time the scan direction
is reversed and the current drawn begins to decrease. The reverse current crosses the
forward current forming a hysteresis loop typical of a process involving nucleation and
growth [225, 234, 298]. This trend continued with subsequent scans. Formation of the
polymer is evidenced by the production of a black deposit on the electrode and the
emergence of a C V partem typical of polypyrrole (Figure 2.4b). A n upper potential of
700 m V is required to achieve polymer growth on the electrodes used (Table 2.1).
Vage 52

VoCymer Çeneration and 'RJ/C Modification
TabU 2.1 'Effect of upper potential Cimit on poCymer formation
Potential
Upper limit (mV)
+500
+700
+900
+1200
Conditions: Einitial=
Observation
No polymer deposited after 3 cycles
Small amount of polymer deposited
Polymer deposited
Polymer deposited but over oxidised
-1000 mV; Elower= -1000 mV, Scan rate = 100 mV.s"1
Number of cycles: 3 Solution: 0.5 M pyrrole. 1.0M NaC104 in 99% CH3CN, 1% H2O Electrode: Glassy Carbon Reference electrode: Ag/Ag+
200uA
a
1 1 700 500
<^ ..«
* ~~ S
1
0
E(mV v. Ag/AgCI)
* .
1 -500 -1000
figure 2.4 Cyclic voCtammogram recorded during poCymerisation of pyrroCe
a) Scan 1
6) Scan 7
Conditions:
Solution: Electrode:
Einitial = -1000 m V
Eupper = 700 m V
Elower = - 1 0 ° 0 m V : Scan rate = lOOmV.s"1
Number of cycles: 7 0.5 M pyrrole, 1.0 M NaCICvt in 99% CH3CN, 1% H2O Glassy Carbon
Vage 53

VoCymer Çeneration and 'RJ/C Modification
Constant current (galvanostatic) polymerisation of pyrrole was also investigated as a
means of polymer growth. Polymers were produced using current densities of at least
0.1 mA.cm- 2 (Table 2.2). The effect of varying the current density on polymer properties
was investigated and it was found that, for a given charge consumption, higher current
densities produced rougher polymers. This is seen in Figure 2.5 (a - b) which shows the
surface topography of 2 polymers grown at differing current densities.
Apart from surface characteristics, ali other attributes of the polymers are essentially the
same. Table 2.2 lists the effect of current density on the polymerisation of pyrrole and
the electrochemical characteristics of the polymer formed.
The potential at the working electrode was monitored during the electropolymerisation
experiment and it can be seen from table 2.2 that the increase in current density causes an
increase in the potential at the working electrode. This is due to the need to drive the
electrode reaction at a greater rate in order to maintain the required current density.
Despite the higher final potential reached chronopotentiograms recorded during
polymerisation (Figure 2.6) have the same general trend for ali current densities.
figure 2.5 Scanning TLlectron micrographs of poCypyrroCe produced at various
current densities
a) 0.25mSL.cm'2
B) 3.0 mA.cm;2
(Both polymers synthesised with the same total charge)
Vage 54

VoCymer Çeneration amdRJ^C Modification
They rise initially then settle to a potential which is maintained during the entire
electropolymerisation. This indicates that the polymer formed is conductive.
TabCe 2.2 'Effect of current density on poCymerisation of pyrroCe *
Current Density
(mA.cnv2)
0.10
0.50
1.0
2.5
5.0
10
Time
(min)
30
6
3
1.2
0.6
0.3
Polymerisation
potential
(mV)
380
380
400
460
540
540
Cyclic
Voltammetry*
Epa ^pc
-250 -810
-360 -860
-300 -790
-300 -810
-320 -720
-320 -620
•Conditions: Polymerisation Solution: 0.5 M pyrrole/1.0 M NaClC<4 9 9 % CH3CN, 1% H 2 O Supporting electrolyte: M NaCl Electrode: Pt wire # Peak notarion as in Figure 2.2
Cyclic voltammograms of the polymer coated electrode indicate that ali polymers are
oxidised (ie change from insulating to conducting state) at -300 mV. Whereas the
reverse reaction, polymer reduction, is achieved at a more positive potential for polymers
synthesised at higher current density. This may be due to the fact that for a given quantity
of polymer, those polymers grown at a higher current density are more porous and hence
have a greater surface área of polymer exposed to solution, therefore the change from the
oxidised to reduced state occurs more rapidly.
Vage 55

VoCymer Çeneration and 'RJ/C Modification
1.2-
1.0-
0.8-
E(volts) °"6' V ^ , .
0.4-
0.2- |
0.0-
-0.2 | • | • | i | i | i | i | i | i | •—|
-5 0 5 10 15 20 25 30 35 40
t (seconds) a
1.2-J
1.0"
0.8-|
0.6-
E(volts) 0.4- , L . _ >
0.2-
0.0-
-0.2-1 1——| 1 1 i \ 1 1 1 1
-100 0 100 200 300 400
t (seconds)
b
figure 2.6 Chronopotentiograms for the poCymerisation of pyrroCe at various
current densities
a) 10 m!A.. cm'1
6) 0.5 mA. cm'2
Solution 0.5M pyrrole and 1.0M NaCl in H20
The polymerisation of pyrrole from aqueous solutions of pyrrole was also investigated.
In ali cases polymerisation was achieved galvanostatically from a 0.5 M solution of
Vage 56

VoCymer Çeneration and 'RJ/C Modification
pyrrole in water with 1.0 M NaC104 as a supporting electrolyte. Chronopotentiograms
recorded during polymerisation again indicate that a polymer with adequate conductivity
was formed. A cyclic voltammogram recorded after polymerisation shows the typical
polypyrrole cyclic voltammogram with well defined oxidation and reduction responses.
Some authors have indicated that growth of polymers from aqueous solution adversely
effects their dry state conductivity [234] however, for the purpose of this work no
significant differences were seen in the performance of polymer grown from either
solutions.
2.3.1.2 Effect of anion on polymer properties
Changes in the physical properties of polypyrrole brought about by varying the anion
incorporated during polymerisation, have been the subject of a number of studies [236-
240, 242, 243]. This interest has arisen primarily because the parameter of greatest
concern to most investigations, conductivity, is dramatically effected by the anion
incorporated into the polymer. Reports indicate that the polymer conductivity can vary
over 3 or 4 orders of magnitude depending upon the anion incorporated during
polymerisation [233, 243]. Polymer electroactivity is also dramatically effected by the
anion incorporated into the polymer [237].
Given the significance of the anion in determining both the physical and electrochemical
characteristics of polypyrrole a series of experiments were undertaken to ascertain the
differences between the polymers to be used in later studies. To achieve this, a number
of anions were studied, in ali cases the sodium salt was used in electrolyte preparation
and polymerisation was conducted using aqueous solutions of the desired anions.
The first characteristic of interest was the effect of the anion on the polymerisation
process. This was determined in a similar manner to the cation studies with the
polymerisation of each solution being achieved using galvanostatic techniques at a current
density of 0.5 mA.cnr2. In contrast to the cation study, the various anions investigated
Vage 57

VoCymer Çeneration and RJ/C Modification
caused significantly different polymerisation potentials to be drawn at the electrode during
polymer growth. These data (Table 2.3) indicate that the larger organic anions, for
example salicylate, require a higher polymerisation potential than the smaller inorganic
anions such as chloride.
TabCe 23 VoCymerisation potentiaC and CJ/ data for poCypyrroCe prepared nrith
various anions
Anion Polymerisation Cyclic Voltammetry data* AEt
potential (mV)
Epa
(mV)
-100
-19
-375
433*
-66
-22
'pa
ÍUA)
83
154
138
38
123
207
Epc
(mV)
-177
-100
-600
-600
-128
-200
ipc
(UA)
67
69
169
46
88
92
Ox-Red
(mV)
71
81
225
1033
62
178
Cl"
N03-
SDS"
Sal"
BF4
CIO4
CH3COO-
580
530
580
640
530
520
4280 *Conditions: As in Table 2.3 # Oxidation peak broad and indistinct - value indicative only t A measure of peak-peak separation between E^, and E ^
Cyclic voltammograms recorded for each polymer also exhibit significant differences in
voltammetric responses. This is evident in both the shape and potential of the redox
changes in the cyclic voltammograms. The chronopotentiogram for polypyrrole-
salicylate (Figure 2.7) shows an increase in potential throughout the polymerisation
process and the resulting voltammogram is very poorly defined with broad oxidation and
reduction peaks. Whereas Polypyrrole chloride has a chronopotentiogram that remains
constant throughout polymerisation and the polymer voltammogram is well defined with
distinct redox peaks attributable to the polymer switching between the oxidised to reduced
form as shown in Figure 2.8.
Vage 58

VoCymer Çeneration and 'RJ/C Modification
t (min)
1
700
i
500
i
0
E(mV v. Ag/AgCI)
1 -500
1 -1000
Chronopotentiogram and cycCic voCtammogram of
poCypyrroCe/saCicyCate shoiving reduced eCectroactivity
figure 2.7
Conditions: a) b)
current density = 0.5 mAxm" 2
Eiower = -1000 m V ] Supporting electrolyte: Eiower = -1000 m V Eupper = 700 m V
MNaCl Scan rate = lOOmV.s"1
Vage 59

VoCymer Çeneration and 'RJ/C Modification
E(volts)
0.5 -
— r t (min)
1
00
— 1
500
•~r
0
E(mV v. Ag/AgCI)
1
-500
1
-1000
figure 2.8 Chronopotentiogram and cyclic voCtammogram of eCectroactive
poCypyrroCe(W/Cl-).
Conditions: As in Figure 2.7
Thus, cyclic voltammetry and chronopotentiometric data indicate that the anion present
during polymer synthesis has a marked effect on the properties of the polymers
produced, particularly the electroactivity of the resultant polymer. This in turn m a y have
Vage 60

VoCymer Çeneration and RJ/C Modification
an effect on the applicability of a particular polymer to a sensing or sampling application
and as such this aspect must be borne in mind when choosing polymers for these
particular applications.
The second aspect of this study was to ascertain the effect of the anion used during
polymerisation on the resulting surface morphology of polypyrrole. This has been well
documented by other authors. Therefore, the object of this investigation was to gain an
appreciation of the differences between the polymers studied and the potential impact of
these differences on sampling and sensing applications. Electron microscopy was used to
determine the surface characteristics of the polymers studied. The electron micrographs
recorded are shown in Figure 2.9 (a-f) respectively and indicate significant variations in
the surface morphology of the polymers produced.
From these Figures it can be seen that the polymers produced containing either Cl" or
BF4" as the counterion have very similar surface morphology, typified by an underlying
bulk phase that exhibits a moderate degree of granularity. This phase is covered with a
moderate density of nodular outbursts of polymer growth, this is probably slightly
greater in the case of the BF4- polymer.
Polypyrrole/N03" has a slightly less granular surface and a lower density of the nodules.
The polypyrrole/C10"4 polymer has a relatively smooth surface that is essentially devoid
of any granularity. However, the nodular outbursts of polymer growth are still present
on the surface of this polymer, albeit at a lower density than on the previous 3 polymers.
Vage 61
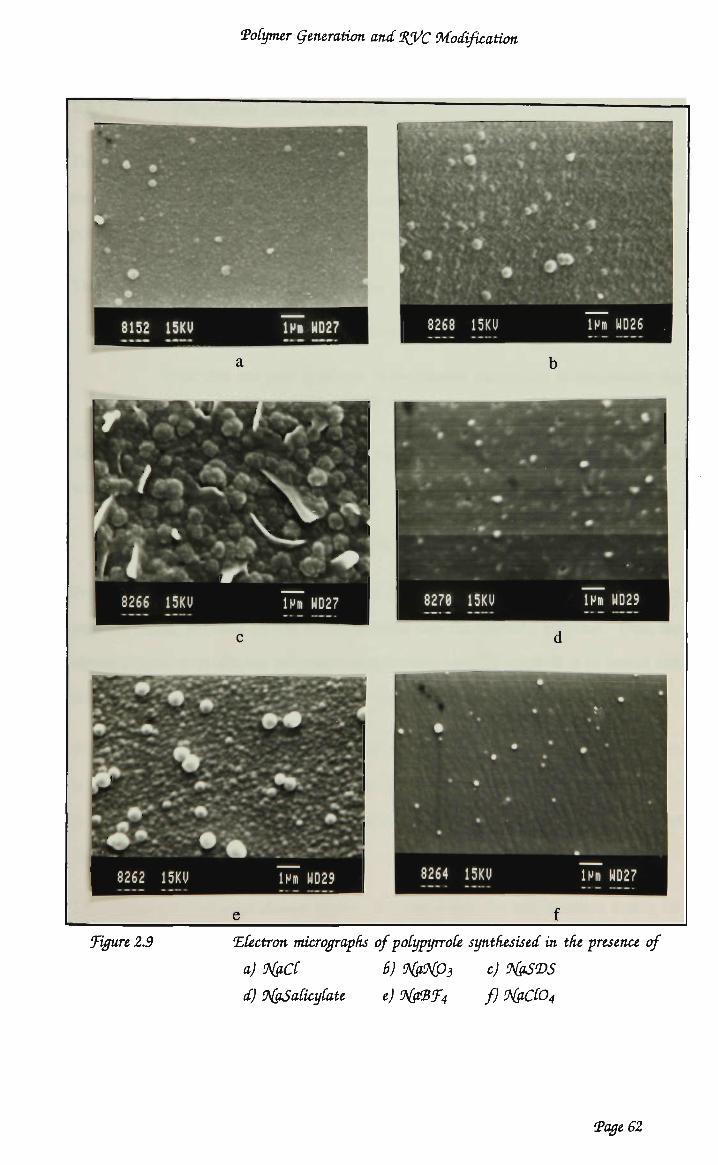
VoCymer Çeneration and 'RJ/C Modification
• •
• • •
• •
•
•
8264 15KU lh» WD27
figure 2.9 Electron micrographs of poCypyrroCe synthesised in the presence of
a) 'HaCC b) 9{aO^Ç3 c) 'XgSVS
d) <HaSaücyCate e) <Hg.(Bf^ f) 9{aCC04
Vage 62

VoCymer Çeneration and^C Modification
2.3.1.4 Polypyrrole functionalisation
The desire to produce polymers functionalised with specific chemically active groups has
meant that a number of synthesis routes have been investigated in order to produce
polymers functionalised with the appropriate reagents.
The techniques used can be classified into two groups:
those that achieve functionalisation during polymer synthesis and;
those that use post synthesis derivatisation techniques to incorporate the
desired functional group into the polymer.
Both techniques have been investigated as means of preparing modified electrodes in this
work.
Polypyrrole: functionalisation during synthesis
Previous studies [197,236-238,] have shown that the anion present in the polymerisation
solution during polymer growth is incorporated into the resulting polymer. Thus, the
simplest route to producing polymers incorporating specific reagents is to ensure that
these reagents are the anions present in the polymerisation solution.
Table 2.4 lists some of the combinations of supporting electrolytes and solvents
investigated throughout this study. Also listed in this table is the polymerisation
technique investigated to achieve polymer growth and some observations of the polymer
characteristics.
The electrolyte used were chosen to provide a counterion for incorporation during the
polymerisation process that would impart specific chemical properties to the polymer. In
particular anionic complexing agents were used because these are amenable to inclusion
as a result of their anionic charge. The specific use and evaluation of R V C cartridges
modified with these polymers is dealt with in the following chapters. A number of
polymers listed in this table were not used in further studies, primarily because the
Vage 63

VoCymer Çeneration and RJ/C Modification
modification of R V C with these polymers was not possible. The discussion of several of
these is warranted here.
The incorporation of the dithiocarbamate anion into polypyrrole is of particular interest, as
the dithiocarbamates are known to form stable complexes with a significant number of
metais [57]. Solid phase adsorbents utilising the dithiocarbamate moiety have also found
widespread use in the collection of metais from aqueous samples (see 1.1.2.3).
In order to ascertain whether it is possible to use electrochemically enhanced techniques
to improve the collection effíciency of the dithiocarbamate group it was necessary to
produce polymers containing various dithiocarbamates. However, as can be seen from
Table 2.4, it was not possible to form polymers when dithiocarbamates were present.
This is due to the fact that the dithiocarbamate is oxidised at a potential lower than that
required for pyrrole oxidation.
Dithiocarbamates are known to oxidise to thiuram disulphide according to:
* \-c( üü: ^ \_c' V-V R1 s Ri \ / R1 (22)
The oxidation potential of a number of dithiocarbamate salts was investigated and is
given in Table 2.5. A s can be seen from these data in ali cases the potential required to
oxidise the dithiocarbamate to the corresponding thiuram disulphide is lower than that of
pyrrole oxidation. However, as this oxidation potential approaches the pyrrole oxidation
potential the chance of polymer formation increases. For example Zn(HDTC)3~ is
oxidised at 560 m V and can be used to form polymers at platinum wire electrodes.
These polymers can only be prepared by potentiodynamic methods, are rather patchy and
have poor electrochemical properties but this example is a useful indication of the
approach necessary to directly incorporate dithiocarbamate ligands into polypyrrole.
Vage 64

VoCymer Çeneration and 'RJ/C Modification
TabCe 2.4 Supporting eCectroCyte/soCvent combinations investigated for pyrroCe
poCymerisation
Electrolyte*
NaCl
KCI
ÜCI
CsCI
NH4CI
NaSdS
NaCIO*
Na Saiicyiate
NaN0 3
Nadtc
mpa
Oxalic Acid
TBABF4
Zn(BHDC)3-
K3Fe(CN)6
NaBF4
NaCIO^Quinone
HgCI2
Solvent
H2O
H2O
H2O
H2O
H 2 0
H2O
H20
H20
H20
H2O
H2O
H2O
CH3CN
MeOH/H20
H2O
H2O
H2O
pyridine
Polymerisation*
technique
G
G
G
G
G
G
G
G
G
PS/G
PD
G
G
PS/G
PD
G
PD
PD
Comment
Effect of
varying cation.
Effect of
varying anion.
No polymer due to oxidation of
the dithiocarbamate.
Patchy Polymer.
Presence of quinone confirmed by Cyclic Voltammetry
only on Pt wire
*G = galvanostatic polymerisation, PS = potentiostatic polymerisation, PD = potentiodynamic polymerisation #mpa = mercaptopropanoic acid, sds = sodium dodecylsulphate, T B A = Tetrabutyl ammonium, Nadtc = sodium diethyldithiocarbamate, Zn(BHDC)3- = Zinc (bis 2 hydroxydiethyl dithiocarbamate)
anion.
Vage 65

VoCymer Çeneration and RJ/C Modification
TabCe 2.5 Op(idation potential of dithiocarbamate saCts
Oxidation
Salt used Abbreviation Potential
(mV)
Sodium díethyl dithiocarbamate Nadtc 270
Pyrrolidine dithiocarbamate A P D C 320
ammonium salt
Ammonium bis-2-hydroxyethyl B H D C 325
dithiocarbamate
*Zn(bis-2 hydroxyethyl Zn(BHDC)3* 560
dithiocarbamate)3" Conditions: Electrode: glassy carbon Scan rate = lOmV.s"1
Solution: 10"2M dtc in M NaN0 3
*saturated solution of Zn(BHDC)3" in NaN03
For sampling purposes the use of other metal dithiocarbamate complexes, except
cadmium, is precluded both because of the relative stability of these complexes and
because zinc is one of the few metais to form anionic dithiocarbamate complexes. Zinc
dithiocarbamates are known to be relatively labile and the zinc ion is readily displaced by
most metais. Cadmium dithiocarbamates were not used because the sampling of C d 2 +
from aqueous systems was a potential use for the modified electrodes produced. Other
metais are not as easily displaced which would mean that any dithiocarbamate
incorporated would not be readily available for metal collection.
The incorporation of metallic mercury centres into polypyrrole was achieved by
polymerising the pyrrole monomer from a solution containing H g 2 + ions. It was not
possible to achieve this in aqueous solution as the mercury salts used were sufficiently
strong oxidants to cause spontaneous polymerisation in solution.
The use of pyridine as a solvent enabled the combination of Hg2+ and pyrrole without the
formation of a polymer. Using this solution it was possible to achieve polymerisation by
Vage 66

VoCymer Çeneration and RJ/C Modification
the potentiodynamic technique. The potential limits used were such that on the oxidative
cycle monomer oxidation could occur, as would the oxidation of metallic mercury that is
on the electrode surface. During the reductive scan mercury (II) ions are reduced and
deposited onto the polymer surface.
The judicious choice of potential limits and scan rate enable the deposition of a
polypyrrole layer into which centres of metallic mercury are dispersed. This is confirmed
by the cyclic voltammogram of the polymer which has a mercury response
superimposed onto a typical polypyrrole voltammogram. The polymer formed by this
technique combines the electrochemical activity of mercury with the added advantages of
polymer electrodes. However, the potentiodynamic preparation technique renders it
unsuitable as a means of R V C cartridge modification.
Whilst the examples shown above demonstrate the feasibility of incorporating functional
groups into the polymer during the polymerisation process it is also evident from this
work that there are instances where this approach is not suitable. To achieve the desired
polymer functionalisation and alternative approach is required. Such an approach is post
synthesis functionalisation.
Polypyrrole: post synthesis functionalisation
The need to investigate the use of post synthesis reactions as a means of modifying
polypyrrole came about as a result of the inability to directly incorporate various
dithiocarbamate groups into the polymer. As stated earlier, the reason for this was
investigated and it was found that in ali cases the dithiocarbamate oxidation potential was
significantly lower than that required to oxidise the pyrrole monomer (500 - 700 m V ) .
Thus, an alternate method for the production of polypyrrole-dithiocarbamate electrodes
was required.
To achieve this two approaches were investigated. The first involved utilising the anion
exchange capabilities of the polymer to exchange the anion incorporated during
Vage 67

VoCymer Çeneration and 'RJ/C Modification
polymerisation for a dithiocarbamate anion. This was achieved by soaking cartridges in
saturated solutions of the required anion.
The second approach involved the post-synthesis chemical derivatisation of the polymer
backbone. This approach has been used previously for sensor application [201] but has
not been used in metal sampling with polypyrrole, although it is similar to the approach
normally employed for the generation of dithiocarbamate functionalised resins.
Ion exchange derivatisation
Conducting polymers are known to incorporate anions during polymerisation [233,241,
243], various studies have also shown that this anion in expelled when the polymer is
reduced from its conducting to non-conducting state [300]. In this work the use of this
phenomenon was investigated to ascertain whether dithiocarbamates could be exchanged
under electrochemical control. It was also desirable to achieve ion exchange by non-
electrochemical methods and the effect of simply soaking the electrodes in saturated
dithiocarbamate solution was studied.
Initial investigations focused on the general aspects of the ion exchange phenomenon.
From these studies it was found that it was possible to use ion exchange to replace the
chloride in the polymer with a dithiocarbamate anion.
Given that it is possible to exchange the chloride anion for a dithiocarbamate anion the
next investigations were aimed at determining the possibility of carrying out this ion
exchange reaction without applied potential. This reaction is thought to occur through the
displacement of the chloride anion, incorporated into the polymer during synthesis, with
the diethyldithiocarbamate anion from solution. This process may be depicted
schematically by the following equation:
Vage 68

VoCymer Çeneration and'RJ/C Modification
r\ H
\ ) r\ .dtc
\ //
J n
Soak in a saturated dithiocarbamate SOlUÜOD
(2.3)
This was achieved by soaking polypyrrole electrodes in a saturated dithiocarbamate
solution for various times. Table 2.6 lists the results of this investigation, it can be seen
that the dithiocarbamate anion is exchanged into the polymer and that the time required to
achieve a significant levei of exchange into polypyrrole is several hours, thus for ali
sampling applications P P / R V C cartridges were soaked in the saturated dithiocarbamate
solution for a minimum of 24 hours.
TabCe 2.6 'Dithiocarbamate oòdation response at various soaking tines for W
electrodes *
time (min)
10
15
30
60
120
Dithiocarbamate oxidation
response
(A)
Not detected
1.6x10"5
3.8 x 10"5
5.8 x 10'5
3.6 x 10'4
* Conditions: Polypyrrole Electrode soaked in saturated Nadtc CVin M N a N 0 3
Einitial = 0 raV; E W r = -1000 m V
= 700 m V Scan Rate = 100 mV.s1 "upper
Vage 69

VoCymer Çeneration and RJ/C Modification
Electrochemical investigation of the derivatised electrodes shows two significant features.
The first, seen on the forward scan, is the oxidation of the incorporated dithiocarbamate.
This oxidation peak is seen at 285 m V was attributed to the oxidation of the
dithiocarbamate anion. This potential is close to that seen for the oxidation of the free
dithiocarbamate (Table 2.5). If however a negative going scan is performed first a
significant reduction peak is seen at approximately "800 m V . This peak corresponds to
the expulsion of the dithiocarbamate anion from the polymer. This has been confirmed
by adding C u 2 + to a solution in which a PP/dtc electrode had been cycled. The solution
turned bright yellow characteristic of the presence of the copper dithiocarbamate complex.
This characteristic has since been developed into a device for the controlled release of
dithiocarbamate [184]. For sampling applications however, this restricts the negative
potential that may be applied to PP/dtc to approximately -800mV. This approach proved
quite successful for the incorporation of several dithiocarbamate anions (Table 2.7). The
specific applications of the dithiocarbamate derivatised electrodes will be discussed in
chapter 5.
Table 2.7 'Dithiocarbamate anions incorporated by ion e7(çhange
Dithiocarbamate Incorporated
diethyldithiocarbamate
bis-2-hydroxydiethyldithiocarbamate
pyrollidine dithiocarbamate
Salt used
Sodium Salt
Ammonium salt
Ammonium salt
Confirmation that the dithiocarbamate was incorporated was achieved by F A B - M S ,
Figure 2.10 shows the F A B - M S spectrum for diethyldithiocarbamate incorporated into
polypyrrole.
Vage 70

VoCymer Çeneration and RJ/C Modification
100%
s n
s
J..I
C2H5-N-C-S
H
i. líli L , .L. .1
i/
r . |-T| r T i-r-T -r-f r-y-r | r "| . |
20 40 60 80 100
/
-j
QH5^ s ,N-C
J 1 . ..
C 2 H 5 , ,s
C2H5' S
1 120 140 160 180 200 220 240
íF̂ urc 2.10 fSVBMS spectra ofW/dtc
Chemical derivatisation
A n altemate approach to electrode derivatisation involved the functionalisation of the
polymer backbone to produce a polymer that has the dithiocarbamate group grafted to the
polymer backbone. Secondary amines are known [301] to undergo reaction with alkaline
carbon disulphide according to:
\ / 2 Ri^ /v2
N'
H
Alkaline C S ?
RV2
A (2.4)
This approach has been used to produce sensors for mercury determination [201, 288,
302] and as the first step in the production of a novel mercury thin film electrode [303].
In this work w e have used the synthesis conditions reported by Imisides and Wallace
[201] to produce dithiocarbamate derivatised polypyrrole electrodes.
Vage 71

VoCymer Çeneration and 'RJ/C Modification
One significant advantage of this approach is that the dithiocarbamate group is securely
attached to the electrode surface and is not expelled at negative potentials, thus offering a
more negative potential limit for the polymer use. The addition of copper into a solution
in which this electrode had been cycled gives no evidence of the presence of
dithiocarbamate in solution.
23.1.5 Polymerisation of pyrrole onto RVC
The synthesis of polypyrrole at planar glassy carbon and platinum wire electrodes has
been demonstrated in the previous section. However, these electrodes do not possess
sufficient surface área to be useful for sampling purposes. Therefore, polymerisation
onto a R V C support was investigated as a means of producing large surface área
modified electrodes.
Polymerisation onto RVC provides a number of challenges, caused primarily by the
physical properties of the substrate. The large surface área to volume ratio of the R V C
dictates that very large surface área auxiliary electrodes are used during polymerisation
and the 3 dimensional nature of the electrode causes difficulties in obtaining even
potential/charge density over the entire electrode surface. A s such, the polymerisation of
monomers onto R V C has been dealt with as a separate issue to the formation of
polymers on platinum or glassy carbon.
This study was carried out using RVC cartridges in the electrochemical cell described
previously (2.2.3.1) and a solution of pyrrole in acetonitrile/water(99:l) with N a C K U as
the supporting electrolyte. Initial studies focused on the use of potentiodynamic
polymerisation techniques. This approach was quickly abandoned as the uneven voltage
profile across the cartridge resulted in the deposition of an uneven polymer layer.
Electrodes coated in this manner tended to have dense polymer coatings on the outer
surface of the cylinder with little or no polymer at the centre of the cartridge.
Vage 72

VoCymer Çeneration and RJ/C Modification
Galvanostatic polymerisation proved to be much more successful, producing R V C
electrodes with an even coating of polypyrrole on ali surfaces. Chronopotentiograms
recorded during polymerisation (Figure 2.11) indicate that a conducting layer is being
formed. The modification of R V C with polypyrrole generated from aqueous systems
was also achieved using galvanostatic polymerisation, the polymers formed were
uniform and conducting.
The presence of pyrrole on the surface of the electrode can be confirmed visually by the
fact that the derivatised electrode appears matt black whereas the non-derivatised R V C
has a black/grey appearance.
l.o —
E(volts)
0.5 -
I 1 o 'í™»0) 10
figure 2.11 Chronopotentiogram for the poCymerisation of pyrroCe at RJ/C
tCectrode
Conditions: 20 mA; 10 min polymerisation Solution 0.5 M pyrrole and 1.0 M NaCl in H 2 0
Electron microscopy also confirmed the presence of the polymer on the electrode surface.
Figure 2.12a shows the electrode surface photographed at 50 times magnification. The
presence of fibrous polymer growths at some places on the electrode is clearly evident.
A photograph taken at 10,000 times magnification (Figure 2.12b) shows a polymer
morphology very similar to that seen for PP/CIO4" on glassy carbon.
Vage 73

VoCymer Çeneration and RJ/C Modification
figure 2.12 Scanning eCectron micrographs of poCypyrroCe on 'RJ/C
Polymerisation conditions: 0.5 M pyrrole; 1.0 M NaC104, 20 mA for 10 min
Ali attempts to synthesis polymers onto RVC by potentiodynamic or potentiostatic
techniques failed with the polymerisation inevitably occurring at the outside of the
cartridge only.
2.3.2 THIOPHENE POLYMERISATION
The polymerisation of various thiophenes has also been the subject of a number of
studies [250-257]. It was felt that the higher anodic potential hmit available with this
group of polymers may offer advantages in sampling applications, particular for those
applications requiring higher positive potentials to achieve analyte collection.
2.3.2.1 Thiophenes: electropolymerisation techniques
As with the pyrrole based systems, both potentiodynamic and galvanostatic
polymerisation protocols were attempted with each monomer studied. The results of
these studies are detailed in the following sections.
Thiophene polymerisation
The polymerisation of thiophene was studied and it was found that in solutions
containing 0.5 M thiophene polymerisation could only be achieved at potentials greater
Vage 74

VoCymer Çeneration and 'RJ/C Modification
than 1500 mV(vs Ag/Ag+). If the thiophene concentration was decreased to 0.1 M the
potential required to achieve polymerisation was increased. This dependence of
polymerisation potential on thiophene concentration has been reported previously [260,
261, 304].
The potential required to achieve thiophene polymerisation is significantly greater than
that required to oxidise the polymer formed. This phenomenom, known as the thiophene
paradox [261], causes the polymers formed to have poor electrochemical properties. It
was felt that this would lead to a lack of reproducibility in sensor generation.
Consequenüy, thiophene was deemed to be unsuitable for this application.
3-Methylthiophene polymerisation
Given that thiophene was unsuitable for electrode modification the polymerisation of 3-
methylthiophene was investigated as an altemate route to thiophene based C M E s .
Various reports [262, 305] indicate that the oxidation potential of this monomer is
significantly lower than that of thiophene and hence the thiophene paradox may be
avoided. To study this a cyclic voltammogram of 3-methylthiophene in C H 3 C N was
recorded and it was found that monomer oxidation commences at 1200 m V (Figure
2.13). At potentials above this, black polymeric films were seen to form on the electrode
surface. The presence of the polymer layer was also confirmed by the appearance of a
voltammetric response for poly(3-methylthiophene) in the polymerisation cyclic
voltammogram (Figure 2.13).
Vage 75

VoCymer Çeneration and RJ/C Modification
| I | i I I I | I I I I | I I I I | I I I I | 1 7 0 0 1 0 0 0 0 -500
E ( m V v. Ag/AgCI)
figure 2.13 CycCic voCtammogram of 3-methyCthiophene soCution
Conditions: Einitiai =-500 mV Elower = _500 mV
Eupper = !700 m V Scan rate = 100 mV.sec"1
Solution: 0.5 M 3-methylthiophene 1.0 M TEAP in C H 3 C N
Further investigations showed that potentials greater than 1500mV were required to
achieve potentiostatic polymerisation. The polymers formed by this method showed
poor adherence and uneven coverage.
The potentiodynamic polymerisation of 3-methylthiophene was subsequently
investigated and it was found that polymerisation could be achieved by cycling the
potential applied to the electrode between 0 and 1700 mV at a scan rate of 100 mV.s_1.
This was typically continued for 10 - 20 cycles during which a relatively even polymer
layer was formed on the electrode surface. Galvanostatic polymerisation of 3-
methylthiophene was also studied and it was found that polymerisation could be achieved
providing the current density was greater than 10 mA.cnr2. However, if care was taken
to remove ali traces of water from the polymerisation solution it was possible to achieve
consistem polymerisation at 5 mA.cnr2 current density.
Vage 76

VoCymer Çeneration and 'RJ/C Modification
As was the case with thiophene, the potential required to achieve polymerisation was
greater than the potential that caused irreversible damage to the polymer once formed.
Consequenüy, the use of poly(3-Methylthiophene) as an electrode modifier was not
studied any further.
2,2'-Bithiophene polymerisation
The implication of the high oxidation potential required for the polymerisation of either
thiophene or 3-methylthiophene is that these polymers are not suitable for use in sensing
applications. An alternate route to the generation of a thiophene based CME is to
polymerise the thiophene dimer 2,2'-bithiophene.
The polymerisation of the thiophene dimer, 2,2'-bithiophene has been reported in the
literature and it has been shown to be oxidised at a potential significanüy lower than that
required to polymerise thiophene [251, 258]. Therefore, polymerisation of this monomer
may be a suitable route to the preparation of polythiophene modified electrodes.
Studies of the electrochemistry of 2,2-bithiophene show an increase in the oxidation
current commencing at approximately 700 mV vs Ag/Ag+ (Figure 2.14 scanl) the
current continues to increase as the potential is swept to the positive potential limit.
During this period polymer growth was observed at the electrode. This was evidenced
by the appearance of a deep red polymer on the surface of the Pt wire electrode. As the
potential is swept from the positive limit back to the starting potential the voltammogram
crosses over itself, this is characteristic of polymer nucleation and growth at the
electrode. The reverse scan also has a reduction peak at approximately 300 mV (Figure
2.14) attributable to the reduction of polymer formed on the electrode. Subsequent scans
(Figure 2.14 scans 2 and 3) exhibit a polymer oxidation peak at 550 mV, along with an
increase in magnitude of the 300 m V reduction peak as the amount of polymer on the
electrode surface increases.
Vage 77

VoCymer Çeneration and RJ/C Modification
Given the relatively low oxidation potential of 2,2-bithiophene, galvanostatic
polymerisation techniques were investigated. The results of this study are given in Table
2.7 and indicate that polymerisation is successfully achieved at a current density of
0.1 mA.cnr2, however a current density of 0.5 mA.cnr2 was used for ali further work.
TabCe2.7 Effect of current density on poCymerisation of 2,2-bithiophene
Current Density (mA.cnr2)
0.10
0.25
0.50
1.00
5.00
Time (min)
30.0
12.0
6.0
3.0
0.6
Polymerisation potential (mV)
670
750
780
710
800 *Conditions: Polymerisation Solution: 0.5 M 2,2'-bithiophene & 1 . 0 M N a C l O 4 i n acetonitrile Working Electrode: Glassy carbon Reference electrode: Ag/Ag+
800
i i i i r
-500
T—I
-1000
E(mV v. Ag/AeCI)
figure 2.14 Votentiodynamic poCymerisation of'2,2'•bithiophene
Conditions: Einilial=0mV
Solution:
El o w e r=-1000mV Scan rate= lOOmV.s"1
0.1 M 2,2-bithiophene 0.15 M TBATFB in CH 3 C N Euppet = 800 m V
Vage 78

VoCymer Çeneration and !RJ/C Modification
5uA
I I I I I I 1 I I I I I I |
800 SOO 0
E(mV v. Ag/AgCI) -500
I I I -1000
I 100U.A
scan 1 scan2
I I I I I
1000
I I I I I I I I I I I I I I I I
500 0 -500 -1000
E(mV v. Ag/AgCI)
figure 2.15 CycCic 1/oCtammograms of VoCy(2,2'-èithiophene) Vf^ in MO^aCC
Conditions: a) E u p p e r = 800 m V b) E u p p e r = l O O O m V E l o w e r = - 1 0 0 0 m V Scan rate = lOOmV.s"1
To determine the potential range over which this polymer may be used in aqueous
systems a CV. of the polymer modified electrode in M NaCl was performed. This is
Vage 79

VoCymer Çeneration and RJ/C Modification
shown in Figure 2.15. From this figure it can be seen that as the upper potential applied
to the polymer is increased to 1000 mV or greater, irreversible damage to the polymer
occurs. This feature is evident in Figure 2.15(b) where a loss of electroactivity is seen on
the second scan. By maintaining the upper potential limit to 800 mV the polymer does
not undergo any noticeable irreversible oxidation, as seen in Figure 2.15(a).
2.3.2.2 Polymerisation of thiophenes onto RVC
The generation of poly(3-methylthiophene) on RVC has proven to be difficult, as
potentiostatic polymerisation caused the polymer to form at the centre of the cartridge
whereas potentiodynamic coating techniques tended to coat only the outer edges of the
cartridge. The only way to produce some form of poly(3-methylthiophene) cartridges is
to use potentiodynamic methods for an extended period, the cartridges are coated but the
coating is uneven.
The only thiophene based polymer that has proven suitable for coating RVC is poly(2,2'-
bithiophene). This is because polymerisation can be achieved at a constant current
density. The polymers produced appear to coat the RVC cartridge evenly and are
prepared at a potential that does not significanüy damage the polymer during growth.
2.4 CONCLUSION
The preceding studies have confirmed that electrochemical synthesis of polypyrrole is
readily achieved from both aqueous and acetonitrile solutions of pyrrole and an
appropriate supporting electrolyte. It has also been shown that, provided galvanostatic
polymerisation is used, RVC is readily coated with polypyrrole from either solution.
Studies invéstigating the effect of the anion present in the polymerisation solution have
shown that the anion present in the polymerisation solution has a significant effect on the
polymer morphology, the polymerisation process and the electrochemistry of the
Vage 80

VoCymer Çeneration and RJ/C Modification
resultant polymer. The incorporation of different counterions during polymerisation is a
possible route to the preparation of chemically modified electrodes, however the utility of
this approach is limited by the oxidation potential required for polymerisation. If this is
greater than the oxidation potential of the counterion then polymerisation is not possible.
If this is the case, an alternate route to the incorporation of the required functional group is
through the preparation of a polymer with a readily exchangeable counterion.
Derivatisation is then achieved by post synthesis ion exchange with an appropriate
anionic reagent.
Studies of thiophene and 3-Methylthiophene based polymers have shown the
disadvantage of using these polymers is the high oxidation potential required for
polymerisation. This means that in most cases polymerisation can only be achieved by
controlled potential techniques. This in turn limits the reproducability of the CMEs
prepared by this technique. Also, the potential required for polymerisation causes
irreversible damage to the polymer that is formed.
The only thiophene based monomer of those studied, found to be readily polymerised by
galvanostatic techniques was 2,2'-bithiophene. The expected advantages of a higher
positive potential limit were not realised when using this polymer as it had a positive
potential limit of 800 mV (c.f. 700 mV for polypyrrole). A comparison of the
preparation of CMEs with either thiophene or pyrrole based polymers has shown that
pyrrole provides a more flexible route to electrode modification. This is primarily due to
the fact that pyrrole is polymerised at low potentials and that polymerisation can be
achieved from both aqueous and non-aqueous solutions.
Finally, this work has shown that whereas RVC cartridges may be coated by
potentiostatic techniques, the most effective means of depositing conducting polymers
onto the surface of the RVC cartridges are galvanostatic methods. As such the only two
monomers studied that can be considered suitable for use in the derivatisation of RVC
cartridges are pyrrole and 2,2-bithiophene.
Vage 81

MethyCmercury Sensing
CHAPTER 3 DETERMINATION OF METHYLMERCURY USING CHEMICALLY MODIFIED ELECTRODES
3.1 INTRODUCTION
The impact of mercury on the environment and the determination of mercury in a
variety of matrices is a topic that has been the focus of considerable attention in the
past few decades [308, 309]. Whilst the determination of inorganic mercury
compounds has received a great deal of attention it has been the detection and
quantitation of organomercury compounds, particularly methylmercury, that has been
the focus of a significant proportion of work. This is because methylmercury is by far
the most toxic commonly occurring form of mercury [310].
Anthropogenic sources of methylmercury are rare [72], and much of the
methylmercury present in contaminated sites has arisen from bacterial methylation of
inorganic mercury [311]. It has been stated that acidic conditions favour this
methylation reaction, thus lakes and waterways that are subject to both acid rain and
mercury contamination are likely to have high leveis of methylmercury. There have
been reports of "pristine" lakes in Canada, Scandinavia and the U.S. having
unacceptably high leveis of methylmercury. Fish caught from these lakes have leveis
of methylmercury far in excess of the permissible limits [309]. The source of
mercury in these lakes is thought to be industrial fallout which, when accompanied by
acid rain, leads to the formation of methylmercury in the affected waterways.
The concem with organomercuries, primarily methylmercury, is the ease with which
they enter the food chain through aquatic organisms to fish then higher animais, and
Vage 82

MethyCmercury Sensing
their persistence once there. Thus considerable effort has been spent in determining
methylmercury leveis in waters.
3.1.1 MERCURY AND METHYLMERCURY DETECTION
The determination and speciation of mercury compounds provides a challenging
problem for the analyst. A wide range of methods have been used for both detection
and speciation of mercury, with varying degrees of success. Cold vapour atomic
absorption spectroscopy ( C V A A S ) has been used extensively for inorganic mercury
analysis [71, 72, 76, 312, 313]. Modification of the mercury reduction step has
allowed the determination of total mercury. The difference between total and
inorganic mercury leveis is subsequenüy attributed to organomercury compounds [71,
72]. A problem with this approach, however, is that organomercury usually accounts
for a small percentage of the total mercury content and as such, errors in the
organomercury measurement may be significant. Secondly, such an approach gives
an indication of total organomercury content but gives no indication of species present.
Derivatisation followed by solvent extraction and graphite furnace atomic absorption
spectroscopy has also been used to quantify and speciate mercury [314], but it too
suffers from the same shortcomings as the C V A A S approach.
A more suitable method appears to be the use of a chromatographic techniques for the
separation and detection of organomercury compounds. Gas chromatography (GC)
has been used to separate methyl, ethyl and phenyl mercury species, with detection
being achieved by an electron capture detector [76, 314-316]. Greater selectivity and
sensitivity in the detection step has been achieved using a mercury specific detector,
microwave induced plasma emission spectroscopy (MIP). This detection system,
first described by Lichte and Skogerboe [317], provides a sensitive interference free
detection method that, when coupled with cold vapour generation, has a reported
theoretical limit of detection (LOD) of 3 x 10"17g of mercury with a practical limit of
detection of 10"14g of mercury [317a]. The use of G C to separate the various mercury
Vage 83

MethyCmercury Sensing
species prior to introduction into the plasma has proven very useful and has been
applied to the determination of methylmercury in fish and shellfish [313]. W h e n
preceded by preconcentration, derivatisation and headspace chromatography, the
determination of methylmercury in water has been achieved by G C - M I P [72]. The
detection limits quoted for this G C - MI P technique is in the sub picogram levei [318].
There has been some concern expressed in the literature regarding the degradation of
organomercury species at the elevated temperatures used for the G C separation [319
and references cited therein]. This degradation results in either the formation of new
organomercury compounds or the breakdown of these compounds to mercury. To
circumvent this problem some authors have investigated the use of high performance
liquid chromatography (HPLC) for mercury speciation studies. Methyl, ethyl and
phenyl mercury salts have been separated, as their dithiocarbamate complex, by
reverse phase chromatography with U V absorbance detection at 254 n m [319-323].
The limit of detection of these methods is poor by comparison with the preceding
methods and at best is in the high ppb leveis [323].
The use of C V A A S detection following L C separation improves the L O D to the low
ppb levei [324, 325]. Cold vapour generation inductively coupled plasma atomic
emission spectroscopy (ICPAES) has also been coupled with H P L C giving a L O D
for inorganic, methyl, ethyl and phenyl mercury of 35, 37, 62 and 62ng.mL*1
respectively [326]. This approach was further improved by the use of ICP-mass
spectrometry for mercury detection after chromatographic separation with a L O D for
methylmercury of l^ng.mL-1 [327]. To achieve such sensitivity requires the
modification of an extremely expensive and complicated instrument. However,
similar L O D s can be achieved at considerably less expense using electrochemical
detection following the chromatographic separation.
MacCrehan and Durst [328] first demonstrated the suitability of "charge neutralisation
reverse phase" chromatography for the separation of methyl, ethyl, phenyl and
Vage 84

MethyCmercury Sensing
inorganic mercury. In their work, detection was achieved by reductive differential
pulse amperometry at a gold amalgamated mercury electrode ( G A M E ) . The limit of
detection for this method was quoted as 2 ng.g"1 for methylmercury. Holak [325]
adapted this method to determine methylmercury in fish, however, he used D P V at a
hanging mercury drop electrode as the detection technique and was only able to
achieve a 10 ng.g-1 detection limit.
Evans and McKee [329, 330] further optimised the method proposed by MacCrehan
and Durst and were able to routinely achieve L O D s of 1 - 2 ng.L_1 for methyl, ethyl,
phenyl and inorganic mercury with an analysis time of less than 10 minutes.
Voltammetric methods have found some application in the determination of both
mercury and methylmercury, however not normally simultaneously. Mercury has
been determined at glassy carbon electrodes with the appropriate choice of supporting
electrolyte [331-333]. The preferred electrode for the voltammetric determination of
mercury appears to be gold [333-336]. W h e n used with a matrix exchange step
between preconcentration and determination, gold electrodes have exhibited superior
sensitivity to glassy carbon [337]. Jagner et ai. have also used gold electrodes for the
determination of mercury (II) by flow potentiometric stripping analysis [338].
Modified electrodes, particularly modified carbon paste electrodes, have been
investigated for inorganic mercury determination. Hernandez et ai. [166] modified a
carbon paste electrode with traces of zeolite. The modified electrode proved suitable
for the determination of mercury within the concentration range from 0.11 to 2.2
Hg.mL-1. W a n g and Bonakdor used a carbon paste electrode modified with a crown
ether to determine mercury [167]. The limit of detection for this method was
0.4 ̂ g.mL"1. More recentiy carbon paste electrodes modified with diphenylcarbazone
[160] and Dowex 50X8 cation exchange resin [154] have been used for mercury
determination. The former electrode was used to determine mercury in acid solution
with a L O D of 1 p.g.mL_1 (10 minute preconcentration followed by matrix exchange
Vage 85

MethyCmercury Sensing
prior to quantification), with the latter being used for the simultaneous determination
of both copper and mercury, although the electrode sensitivity was poor (ng.mL-1).
Tri-n-octylphosphine oxide (TOPO) has been used to form a T O P O modified gold
film (on glassy carbon) electrode. The T O P O was immobilised in a P V C film on the
gold film. The L O D for this method is 25 n g l A
Wallace et ai. [201,288, 302] have investigated the use of polypyrrole based modified
electrodes for the determination of mercury. These authors found that both
polypyrrole and a derivatised form of polypyrrole, poly(pyrrole-N-carbodithioate)
were suitable for use as mercury sensors. Both sensors had a quoted limit of
detection of 200 p-g.L"1, with the major difference being the method of mercury
collection. Mercury is deposited onto the polypyrrole surface by electrodeposition,
whereas it is trapped on the poly(pyrrole-N-carbodithioate) surface by a combination
of electrodeposition and complexation through the dithiocarbamate functional groups
present at the electrode surface. This sensor proved unsuitable for the detection of
organomercury compounds [338a].
There have been few electrochemical studies aimed at determining methylmercury.
Heaton and Laitinen have studied the voltammetric determination of methylmercury
using polarographic methods [339], the most sensitive being differential pulse
polarography. Ireland-Ripert et ai. [340] have studied the voltammetric determination
of methylmercury in the presence of mercury (II) ions. These workers use a gold
film electrode and a double standard addition technique to detect methylmercury with
a L O D of 2 x 10⁻⁸ mol.L"1- Phase sensitive A.C. polarography has also been used
giving a L O D of 10"7 moll/1 [341].
3.1.2 AIM AND SCOPE OF THIS WORK
The application of voltammetric techniques to the determination of organomercury
compounds, particularly methylmercury, is an área in which the use of chemically
Vage 86
MethyCmercury Sensing
modified electrodes may find application. Thus, this work was undertaken to
determine the feasibility of such an approach. To achieve this, the electrochemical
behaviour of organomercuries at various electrodes was studied.
The use of a dithiocarbamate modified electrode utilizing a polymer with a low
background signal may be a suitable means of detecting methylmercury.
Dithiocarbamates are known to form strong complexes with mercury salts [341a], a
property that should ensure a reasonable degree of preconcentration of methylmercury
at the sensor element. With this possibility in mind the electrochemistry of
methylmercury dithiocarbamate was also investigated. The dithiocarbamate complex
studied was that formed between methylmercury and ammonium pyrolidine
dithiocarbamate.
Finally, using information gained from the previous studies the design and generation
of a methylmercury sensor was considered and evaluated.
3.2 EXPERIMENTAL
3.2.1 REAGENTS AND SOLUTIONS
Mercury (II) standards (1000 jig.mL"1) were prepared by dissolving the requisite
amount of H g O in a minimum of nitric acid and düuting to volume. Ali working
standards were made by serial dilution of this standard. Methylmercury and
ethylmercury salts were obtained from Morton Thiokol (Danvers M A . ) and
phenylmercury acetate was obtained from Fluka. Organomercury stock solutions,
0.01 M , were prepared by dissolving the requisite amount of the salt in methanol.
Working solutions were prepared on a daily basis from these stock solution. A U
stock solutions were refrigerated when not in use.
Vage 87

MethyCmercury Sensing
Triton XI00 (5xl0-3%) was added to ali polarographic solutions as a máxima
suppressor.
N-ethyltyramine was prepared in accordance with a method described previously by
Imisides and Wallace [343].
Polymerisation solutions used were 0.1 M NET and 0.3 M NaOH in methanol.
Solutions were stored under refrigeration until use.
3.2.2 EQUIPMENT
Voltammetric measurements were performed on either a BAS 100A electrochemical
analyser (Bioanalytical Systems, West Lafayette), a B A S C V 27 voltammograph or
an ElectroLab system (Chapter 8). Polarographic and hanging mercury drop electrode
( H M D E ) experiments were performed with a P A R 174A connected to either a
dropping mercury electrode ( D M E ) or a model 303 static mercury drop electrode
(used for ali H M D E experiments).
3.2.3 PREPARATION OF THE GC/Hg7PNET-[CS2] ELECTRODE1
The glassy carbon electrode was first polished with V alumina, rinsed with water,
dried and polished on a dry hardened ashless (Whatman 542) filter paper. Final
cleaning of the electrode surface was achieved by 5 minutes ultrasonic cleaning in
distilled water.
Deposition of the mercury film was achieved by applying a constant potential of
200 m V to the electrode in a 10" 2M H g 2 + in 1 0 % H N O 3 . The solution was
deoxygenated thoroughly prior to deposition and stirred thoroughly during deposition
to ensure that the rate of deposition was not hindered by depletion of mercury at the
electrode-solution interface.
This electrode was developed in conjunction with Peter Teasdale at the University of Wollongong
Vage 88

MethyCmercury Sensing
NET was polymerised potentiodynamically from a solution of 0.1 M NET and 0.3 M
N a O H in methanol. The potential applied to the electrode was cycled between
400 m V and 2000 m V at 1 V.s"1 for 25 cycles.
The GC/Hg7pNET electrode was then placed in a stirred derivatisation solution,
comprising of 50:10:10 V/V benzene:alkaline isopropyl alcoholxarbon disulphide for
24 hours. This treatment derivatises the 2" amine on N E T to a dithiocarbamate
functionality. The polymerisation and derivatisation of N E T has been reported
previously [343].
3.2.4 PREPARATION AND CHARACTERISATION OF METHYLMERCURY
DITHIOCARBAMATE
Methylmercury dithiocarbamate was prepared by mixing 10 m L of 0.01M
methylmercury chloride and 20 m L of 0.01 M a m m o n i u m pyrrolidine
dithiocarbamate. A white precipitate formed almost immediately, however, the
reaction mixture was left standing for a further 5 minutes after which the precipitate
was filtered and dried at room temperature in an evacuated vessel. The product was
then analysed by mass spectrometry and elemental analysis techniques.
3.3 RESULTS AND DISCUSSION
33.1 ORGANOMERCURY SENSING AT CONVENTIONAL ELECTRODES
The first step in developing an electrochemical sensor for methylmercury was to
ascertain the electrochemical behaviour of methylmercury at a series of conventional
electrodes. The first of these studies were designed to confirm the potential of the
reduction responses for the individual mercury species at various electrodes. This was
done in order to provide an understanding of the electrochemistry of the analyte at the
electrodes to be used in subsequent investigations.
Vage 89
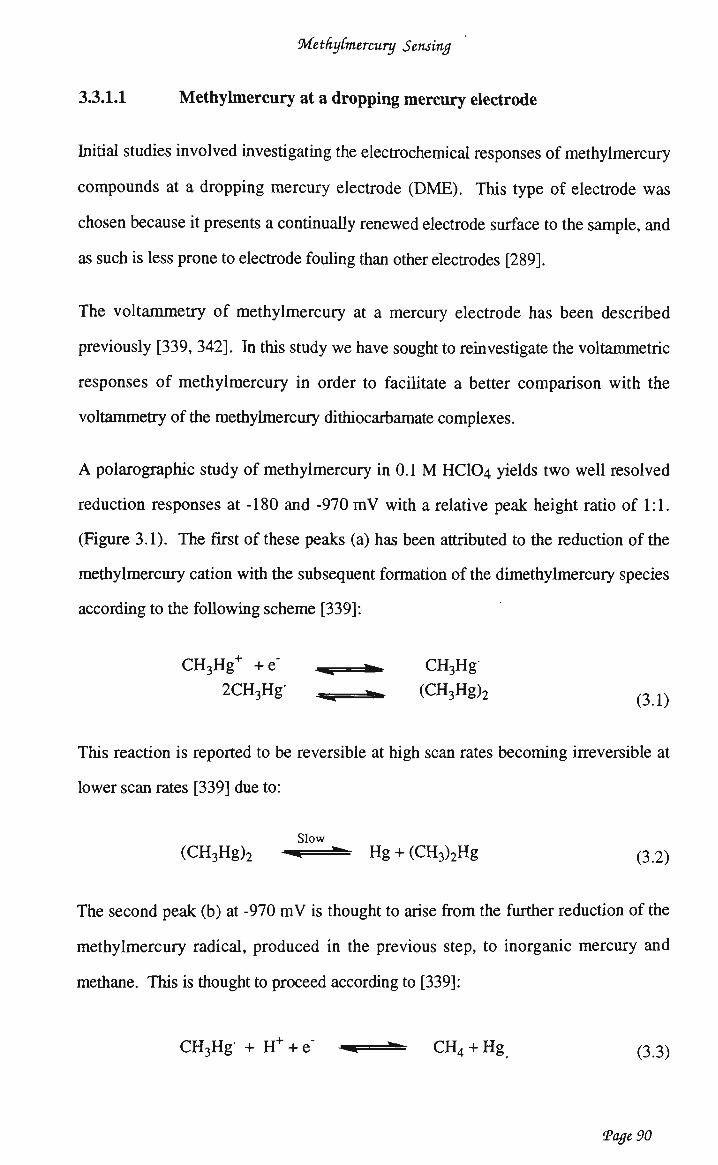
MethyCmercury Sensing
3.3.1.1 Methylmercury at a dropping mercury electrode
Initial studies involved investigating the electrochemical responses of methylmercury
compounds at a dropping mercury electrode (DME). This type of electrode was
chosen because it presents a continually renewed electrode surface to the sample, and
as such is less prone to electrode fouling than other electrodes [289].
The voltammetry of methylmercury at a mercury electrode has been described
previously [339,342]. In this study we have sought to reinvestigate the voltammetric
responses of methylmercury in order to facilitate a better comparison with the
voltammetry of the methylmercury dithiocarbamate complexes.
A polarographic study of methylmercury in 0.1 M HCIO4 yields two well resolved
reduction responses at -180 and -970 m V with a relative peak height ratio of 1:1.
(Figure 3.1). The first of these peaks (a) has been attributed to the reduction of the
methylmercury cation with the subsequent formation of the dimethylmercury species
according to the following scheme [339]:
C H 3 H g+ +e" - CH 3 H g
2CH3Hg- ^ ^ (CH3Hg)2 ( 3 J )
This reaction is reported to be reversible at high scan rates becoming irreversible at
lower scan rates [339] due to:
Slow
(CH3Hg)2 « ^ Hg + (CH3)2Hg (32)
The second peak (b) at -970 m V is thought to arise from the further reduction of the
methylmercury radical, produced in the previous step, to inorganic mercury and
methane. This is thought to proceed according to [339]:
CH3Hg- + H+ + e- « »• CH4 + Hg (33)
Vage 90

MethyCmercury Sensing
A differential pulse voltammogram for the reduction of methylmercury at a DME is
shown in Figure 3.2. The responses seen at -210 m V and -1010 m V correspond to
the reduction reactions described by equations 3.1 and 3.3 respectively. It is also
evident from this figure that, when considered in the light of the methyl mercury
concentration present, these responses are far too insensitive for use in methylmercury
detection.
The scans shown in Figures 3.1 & 3.2 were performed using 0.1 M HCIO4 as a
supporting electrolyte, however, as many water samples have chloride present, it was
decided that the reduction of methylmercury in M NaCl should be investigated. From
this it was found that the reduction responses in M NaCl are less distinct and more
drawn out than those seen for methylmercury in 0.1M HCIO4 (Figure 3.1). This
would indicate that methylmercury is more difficult to reduce in NaCl than in HCIO4.
I • • ' • I I > I I I I • 1 • 1 o -500 -1000 -1500
E(mV v. Ag/AgCI)
figure 3.1 VoCarogram* of methyCmercury
Conditions: EinitM = O m V Efinal= -1250 m V Scan rate= 10 mV.s"1 Drop time = 1 s
Sample: 10"3 M Methylmercury in 0.1 M HCIO4 with 5 x 10"3% triton X100
Ali polarograms given in this work were prepared by plotting the maximum current vs potential
Vage 91

MethyCmercury Sensing
IA O -500 .1000 -1500
E(mV v. Ag/AgCl) figure 3.2 Differential puCse voCtammogram of methyCmercury at a DME
Conditions: Einitial = 0 m V Efinai = -1500 m V Scan rate = 10 mV.s"1
Drop time = 1 s Modulation amplitude = 10 m V Sample: 10"3 M Methylmercury in 0.1 M HCIO4 + 5 x 10"3% triton X100
The addition of 0.01 M HCIO4 to the NaCl solution gives rise to a polarogram that is
similar to those measured in 0.1 M HCIO4. Both reduction peaks in the
1 M NaCl/0.01 M HCIO4 supporting electrolyte are at a potential more negative than
those recorded in 0.1 M HCIO4 indicating again that it is more difficult to reduce the
methylmercury cation in the former solution compared with the latter. This change in
reduction potential with p H and different supporting electrolyte has been reported by
other workers [339, 341,342], Presumably, one cause of these differences is the
stability of M e H g C l compared with MeHgC104. It should be noted,however, that in
both solutions the reduction currents are similar («4.5 uA).
The NaCl/HC104 supporting electrolyte was used for ali further polarographic studies
of the organomercury compounds.
Whereas a DME, by virtue of the fact that the surface is constantiy renewed, provides
an excellent tool for initial investigative work it often impractical for routine analytical
Vage 92

MethyCmercury Sensing
work and definitely not suitable for use in portable instrumentation. In order to find a
suitable sensing electrode the voltammetry of methylmercury was studied at several
other conventional electrodes, namely a hanging mercury drop electrode (HMDE), a
glassy carbon electrode and a mercury thin film electrode (MTFE).
3.3.1.2 The voltammetry of methylmercury at a HMDE
The linear sweep voltammetry (LSV) and differential pulse voltammetry (DPV) of
methylmercury at a HMDE is shown in Figure 3.3. In both LSV and DPV scans the
first reduction peak occurs at -480 mV, with the second reduction response appearing
at ="1200 mV. These peaks are thought to correspond with the formation of the
memylmercury radical (equation 3.1) and the subsequent reduction of the radical to
generate free mercury and methane (equation 3.3).
i i i i — i i i i i i i I I I i 0 100 B n » T. AJ/AJCI)
j i i i i I II 500 -1000 -150»
figure 3.3 VoCtammetric responses for the reduction of 10'3M methyCmercury
(in M (HaCl/ 0.01M 0ICCO4) at an 'HMDE using
a) Linear Sweep VoCtammetry
6) Differential Vulse VoCtammetry
Conditions: Einitial = 0 raV Efinal =-1500 mV Scan rate = 10 raV.s"1 Drop time: a) 1 s b) 2 s Modulation amplitude = 10 m V (DPP only)
Vage 93

MethyCmercury Sensing
3.3.1.3 Voltammetry at glassy carbon and M T F electrode
The reduction of methylmercury at glassy carbon was also studied. The responses
observed for this compound are shown in Figure 3.4. The first reductive scan on
Figure 3.4a has one significant peak at -1175 m V . This is due to the reduction of
methylmercury to metallic mercury. The presence of which is confirmed by the
oxidation peak at 170 m V . Cycling the potential applied to the electrode between
0 m V and various potentials down to -1500 m V indicates that the mercury oxidation
response does not appear until the potential applied to the electrode is taken to -
700 m V . At this potential a very small oxidation peak is seen on the reverse scan,
with a magnitude of about 0.3 pA. As the potential applied to the electrode is made
more negative the size of the mercury oxidation peak increases to «1.5 u,A at a
negative limit of -900 m V . It is not until the lower hmit of the scan is decreased to a
potential more negative than the potential at which the major reduction peak occurs
(-1180 m V ) that the mercury oxidation peak becomes significant. At a lower limit of
-1500 m V the resultant mercury oxidation peak is about 25 uA. These data would
suggest that the reduction peak at -1180 m V is due to the reduction of methylmercury
to metallic mercury and that whilst some reduction of methylmercury to mercury may
occur at -800 m V , this is not the major reaction occurring at this potential. Rather, as
in the voltammetry of methylmercury at mercury, the broad reduction peak seen at
«-800 m V may be due to the reduction of methylmercury to the methylmercury
radical (equation 3.1). However, this was not confirmed.
Vage 94

MethyCmercury Sensing
figure 3.4 VoCtammetry of IO'3 M MethyCmercury in 9^aCC/9úCC04 at a
gCassy carbon Electrode.
a) initial scan
b) 2ndscan
Conditions: Ejnitiai = 500 m V
Eupper = 500 m V
Elower= -1500 m V
Scan rate = lOOmV.s'1
A n interesting feature of the voltammograms in Figure 3.4 is the difference between
the first and subsequent reduetive scans. The first scan shows a single major
reduction peak at - 1 1 8 0 m V . This peak m a y be attributed to the reduction of
Vage 95
MethyCmercury Sensing
methylmercury to mercury metal. The appearance of a significant oxidation peak at
200 m V on the oxidative scan due to the oxidation of mercury from the glassy carbon
electrode, supports this suggestion.
The second and subsequent scans have major reduction peaks at 100 and -350 mV.
The first of these peaks is due to the reduction of mercury ions produced on the
oxidative scan and still within the vicinity of the electrode. The second peak is due to
the reduction of methylmercury as described by equation 3.1. These data indicate that
at a glassy carbon electrode the single electron reduction of methylmercury is not
readily seen, although the broad reduction peak on scan (a) and centred about
-820 m V may be due to this reaction. Once mercury is deposited on the surface of the
electrode the reduction reactions that occur are essentially those that occur at a
mercury-solution interface and as such, the single electron reduction response is
evident on scan (b) (Figure 3.11).
It is also worth noting here that the reduction of methylmercury occurs at a less
negative potential on the second scan, indicating that the methylmercury cation is more
readily reduced at a mercury surface.
Thus the second and subsequent cycles at the glassy carbon electrode were essentially
reduction at a mercury thin film electrode (MTFE). These responses appear to be
more reproducible than those at a plain glassy carbon electrode. This was
subsequently investigated and, whilst the response was more reproducible, it was still
too insensitive to be suitable for use as an analytical signal.
3J.2 VOLTAMMETRY OF METHYLMERCURY DITHIOCARBAMATE AT
M E R C U R Y BASED ELECTRODES
To better understand the electrochemical behaviour of methylmercury dithiocarbamate
at mercury based electrodes, a H M D E and D M E were used for studies of the
voltammetry of both the free dithiocarbamates and the
Vage 96
MethyCmercury Sensing
methylmercury dithiocarbamate complex. Bond and co-workers (344-346) have
studied the electrochemistry of various mercury dithiocarbamate complexes and
postulate the two electron reduction of the dithiocarbamate complexes to mercury and
the dithiocarbamate ligand according to:
Hg [R2dtc]2 + 2e" • Hg° + 2[R2dtc]' (3 4)
with mercury (I) intermediates, which are said to disproportionate as part of the
overall reaction scheme. In their work these authors have restricted their studies to
inorganic mercury dithiocarbamate complexes.
These have been a few voltammetric studies of the methylmercury cation but none
reported for methylmercury dithiocarbamate complex.
3.3.2.1 Voltammetry of dithiocarbamates at mercury electrodes
This aspect of the investigations involved studying the voltammetry of the
dithiocarbamate ligand to be used in this work. A differential pulse voltammogram
for ammonium pyrrolidine dithiocarbamate (APDC), in M NaCl is shown in Figure
3.5
The reduction peak evident at -380 m V is not due to the reduction of the
dithiocarbamate species alone, as these are not easily reduced. This was confirmed by
running a cyclic voltammogram of the dithiocarbamate solution using a glassy carbon
electrode. N o responses were evident within the potential window 0 - "1000 m V .
Therefore, this reduction peak must be associated with either an impurity in the
dithiocarbamate or the reduction of a species formed in the electrochemical cell. It is
the later of these possibilities that appears to be occurring, as the dithiocarbamate salt
used was A.R. grade and the peak persisted even after the dithiocarbamate was
recrystallised twice from ethanol.
Vage 97

MethyCmercury Sensing
figure 3.5 Differential pulse voCtammogram of IO'3 M AVDC in M9(aCC/
0.01 MMCC04
Conditions: E^ia! = 0 mV Efínal = -1500 Scan rate = 10 mV.s"1
Modulation amplitude = 25 m V Drop time = 1 s. Electrode H M D E
The most likely explanation for the cause of this peak is that it is associated with the
electrochemical response of Hg(dtc)2 formed at the HMDE. The presence of a
similar peak has been reported by Randle et ai. [347] in a study of the electrochemistry
of a series of alkyl dithiocarbamates in aqueous solution. These authors attribute the
peak to the desorption of mercury dithiocarbamates from the electrode surface.
It is quite feasible that the chemical and electrochemical conditions present when the
potential is applied to the cell (i.e. an applied potential of OmV in 10"2M H+/10"3M
dtc-) would cause the formation of Hg(dtc)2 according to:
2Hg + 2[dtc"] ^ *• 2Hgdtc + 2e" (35)
2Hgdtc ^ * Hg° + Hg(dtc)2 (3.6)
Vage 98

MethyCmercury Sensing
Such reactions have been reported previously for mercury-dithiocarbamate
interactions [347a].
The shape of the peak and the peak width at half height («120 mV) suggest that this is
not a surface effect but rather a slow reduction response, possibly the reduction of the
dithiocarbamate complex in accordance with equation 3.5.
Although the exact cause of this response was not elucidated, its position and
magnitude were detennined to aid in the interpretation of voltammograms recorded in
the presence of methylmercury and the dithiocarbamate.
33.2.2 Voltammetry of methymercury-APDC complex at mercury
electrodes
The methylmercury-pyrrolidine dithiocarbamate complex was prepared as described
in the experimental section. Elemental analysis of the product is given in Table 3.1.
TabCe 3.1 Elemental analysis of the methyCmercury dithiocarbamate compCfK.
Element
Carbon
Hydrogen
Nitrogen
Sulphur
Mercury
Weight
percent
20.02
2.99
3.77
16.87
50.06
Mole frac
1.67
11.96
0.27
0.53
0.25
From the results above, the molecular formula for the complex can be calculated as
C 6 H 4 7 N S 2 H g . The ratio of mercury to sulphur implies the formation of a 1:1
complex between methylmercury and pyrollidine dithiocarbamate. The hydrogen
leveis do not appear to be correct however, the result was not repeated as it was the
ratio of H g to S that was of interest as a result of this ratio the formula for the complex
was determined to be C Ó H I iNS2Hg. The discrepancy in hydrogen leveis between the
molecular formula of the complex, as determined by elemental analysis, and that
Vage 99
MethyCmercury Sensing
expected is presumably due to the fact that at this levei errors in the elemental analysis
are significant and are amplified during the calculations.
To confirm that a voltammetric response due to the methylmercury dithiocarbamate
complex could be detected, the complex was dissolved in a solvent containing
supporting electrolyte and characterised. A differential pulse voltammogram for this
complex dissolved in supporting electrolyte is shown in Figure 3.6. The result
confirmed that a peak at -850 m V can be attributed to the M e H g ( A P D C ) complex.
Therefore, it was decided to evaluate the in-situ formation of this complex. The
addition of 2 x IO"3 M ammonium pyrollidine dithiocarbamate to a IO"3 M solution of
CHsHgCl in M NaCl/10"2 M HCIO4 causes the almost instantaneous precipitation of
a white complex, methylmercury dithiocarbamate.
A differential pulse polarogram recorded on the supematant 8 minutes after mixing,
(Figure 3.7) shows reduction peaks at -320 m V , -460 m V and -800 m V . The
responses at -320 m V and -460 m V may be attributed to the reduction of free
methylmercury (c.f. Figure 3.3) and a mercury-APDC complex respectively (c.f.
Figure 3.5). The peak at -800 m V appears to be due to the methylmercury
dithiocarbamate complex. With time (Figure 3.7b)the peak at -320 m V completely
disappears indicating no measurable amounts of free C H 3 H g + in solution. This
indicates that the reaction has gone to completion, a suggestion backed up by the
observation that the peak at -800 m V no longer increases in size.
An interesting observation to come from these experiments was that, whereas with
CH3Hg+ it was difficult to achieve a reasonable reduction response for solutions less
concentrated than 10"3 M (Figure 3.2), with A P D C present the major portion of the
complex precipitated. There was, however, a reasonable signal for the saturated
solution of the M e H g ( A P D C ) complex, the concentration of which was considerably
less than 10"3 M . This would suggest that the use of dithiocarbamate complexes of
methylmercury may be a sensitive technique for the determination of methylmercury
Vage 100

MethyCmercury Sensing
in solution. To this end a series of experiments were performed using A P D C to
determine trace MeHg in water.
figure 3.6 Differential pulse voCtammogram of Mt9lg(&VDC) in supporting
eCectroCyte
Conditions: Eiaitia| = 0 mV Efinal =-1000 mV Scan rate = 5 mV.s"1 Drop time = 1 s Modulation amplitude = 25 m V Electrode: H M D E Supporting Electrolyte: M NaCl/10"2 M HC104
Vage 101

MethyCmercury Sensing
figure 3.7 Differential pulse voltammogram of supernatant liquid
a) 8 min after muátig methyCmercury and AVDC
6) 15 min after mváng methyCmercury and AVDC
Conditions: As in Figure 3.6
333 ADSORPTIVE STRIPPING VOLTAMMETRY OF MeHg (DTC)
Even though the detection of MeHg( APDC) at an H M D E is more sensitive than the
detection of MeHg+ at the same electrode, it was obvious that in order to achieve
Vage 102

MethyCmercury Sensing
useful detection limits a preconcentration step would be required prior to voltammetric
determination. Initial studies were aimed at investigating the feasibility of an
adsorptive stripping voltammetry approach to preconcentration. In this technique the
metal complexes of interest are accumulated at the electrode-solution interface by non-
electrolytic preconcentration. After sufficient accumulation the analyte is quantified by
the reduction or oxidation of the metal complex.
The first step in determining whether any adsorption responses may be present was to
investigate the effect of the initial potential on the analytical signal. Figure 3.8 shows
the effect of initial potential on the analytical peak height. From this figure it can be
seen that commencing a scan at -200 mV provides the greatest response.
0.4 "I
I ^ \ I °2' X 06
0.1 •
0.0 1 • • | • • | • • i • • i • • i O - 200 - 400 - 600 - 800 -1000
Initial potential (m V)
figure 3.8 Effect of initial potential on peafi height (Meüig AVDC)
Conditions: As in Figure 3.7b
To investigate the effect of accumulation potential on the analytical response, ali scans
were commenced at -200 mV. Prior to each scan a 60 second accumulation step was
performed at various potentials, the relative responses for each accumulation potential
are shown in Table 3.2.
Vage 103

Methylmercury Sensing '
TabCe 3.2 Effect of accumuCation potential on analytical response
Accumulation Potential Time ip (MA)
(seconds)
None
None
-200
-400
-500
-600
-800 Conditions: As in Figure 3.7a
0
60
60
60
60
60
60
0.305
0.400
0.275
0.295
0.245
Using the optimum deposition potential of -400 m V the effect of starting the scan at
-200 m V compared with -400 m V was again tested. The relative responses indicated
that commencing the scan from -400 m V provided more sensitive response for the
methylmercury-dithiocarbamate complex.
Thus, the conditions chosen for the determination of methylmercury by adsorptive
stripping voltammetry are:
Reaction time (for the reaction of the MeHg with the APDC): 15 minutes
Analytical waveform: Differential pulse voltammetry
Edep: 400 m V Scan rate: 10 mV.s"1
Einitial =-400 m V Efm al = -1200mV
Step width: 1 second Modulation amplitude: 25 m V
Using these conditions and an accumulation time of 60 seconds, a calibration curve
for the M e H g response was constructed. As can be seen from Figure 3.9 the
response is acceptable within the 50 - 500 ppb range.
Vage 104

MethyCmercury Sensing
<
<u c/a
C O D. c/a
2
1.0-
0.8-
0.6-
0.4-
0.2-
0.0-9 • • • 1 • I ' ' ' — I • • • I • I ' 1 ' I ' I
0 200 400 600 800 1000 1200
Methyl mercury concentration (ppb)
figure 33 Calibration Curve for the determination of methyCmercury
Conditions: as described above
This is a vast improvement on the responses for methylmercury detennined at the
same electrode. Using similar preconcentration conditions with no dithiocarbamate
present the analytical response for lOp-g-mL"1 methylmercury was 0.11 uA.
Whereas, with the dithiocarbamate present, the response for 50 p-g.L"1 was 0.12 U.A.
This represents a 200 fold improvement in the limit of detection for methylmercury.
333.1 Interferences
A study of the effect of various potential interferences indicated that both copper(II)
and lead ions can be expected to hinder the detection of methylmercury using mis
technique. In the dithiocarbamate solution the copper reduction response occurs at
-740 m V and the lead reduction response at -800 m V . Both responses are broad and
as such will be expected to overlap the methylmercury - dithiocarbamate response at
"850 m V . Mercury gives a reduction response at approximately -500 m V .
Two other organomercury compounds, ethylmercury and phenylmercury were also
examined as potential interferents.
Vage 105

MethyCmercury Sensing
The addition of 2x10"3 M APDC to a IO"3 M solution of ethylmercury in M NaCl/10"
2 M H C I O 4 was followed by the rapid formation of a heavy white precipitate. The
voltammograms recorded for the supernatant solution, presumably saturated with the
ethylmercury-pyrrolidine dithiocarbamate, exhibited significant variability with time.
A voltammogram recorded after 30 minutes reaction time shows no significant peak
attributable to the emyi^ercuiy-pyroiüdine dithiocarbamate complex.
A similar, if not more erratic behaviour was seen for phenylmercury under the same
conditions.
3.3.4 M ODIFIED ELECTRODES FOR THE DETECTION OF
METHYLMERCURY
Given the suitability of dithiocarbamates for the preconcentration of methylmercury
during the adsorptive stripping voltammetric procedure and the ease with which
dithiocarbamate functionalised modified electrodes may be produced, the next stage in
the development of the organomercury sensor is to transfer the complexation
chemistry from the solution to the electrode surface.
3.3.4.1 Glassy carbon/HgYpNET-[CS2]
The studies with polypyrrole based electrodes suggest that one of the requirements of
a successful organomercury sensor would be a very low background signal. One
group of polymers to possess this attribute are the tyramine based polymers,
specifically poly-N-ethyltyramine. This polymer has been used previously for
mercury detection [343]. In this case polymerisation followed by derivatisation, to
form the dithiocarbamate functionalised polymer, was used to produce an electrode
suitable for the determination of mercury. A further advantage of this type of polymer
is that is has been used successfully in the production of a hybrid electrode, known as
the dispersed metal electrode, which incorporates metallic mercury centres within the
polymer matrix [348]. The combination of a mercury-polymer hybrid electrode with
Vage 106

MethyCmercury Sensing
a dithiocarbamate functionalised polymer as the polymer component could
conceivably produce a sensor element that closely mimics the preconcentration and
quantification techniques used in the adsorptive stripping approach.
The electrode preparation technique, described in the experimental section, is an
adaptation and improvement of an electrode developed previously [349]. Whereas the
original electrode was based on a platinum substrate, the electrode reported here was
optimised for a glassy carbon substrate.
The first step in this study was to determine the optimum mercury film thickness. To
do this mercury was deposited on glassy carbon electrodes at -200 m V from a
vigorously stirred solution containing 10"2M Hg 2 + . Deposition was carried out for 1,
2 and 4 minutes. The M T F E was then coated with poly-N-ethyltyramine by a
potentiodynamic technique. A typical voltammogram for polymer growth is shown
in Figure 3.10.
JlmA
I I I I I I I I I I I I I I I I I I I I I I I I I 2000 1500 1000 500 0 -400
E(mV v. Ag/AgCI)
figure 3.10 Votentiodynamic growth ofpoCy -í^ethyCtyramine.
Conditions: Einilial = -400 m V EUppei. = 2000 m V
Elower = "400 m V Scan rate = 1000 m V.s"1
Solution: As described in experimental
Vage 107

MethyCmercury Sensing
The important feature of this voltammogram is the decreasing signal with subsequent
scans indicates the electrode is being coated with a polymer layer of low conductivity.
The mercury-poly-N-ethyltyramine electrode was then derivatised for 24 hours as
described in the experimental section. The resultant electrode consists of finely
dispersed mercury drops surrounded by a dithiocarbamate functionalised polymer.
This is shown schematically in Figure 3.11.
Layer of insulating polymer with mercury dispersed in it
Glassy carbon_ electrode
í JíL • • • • »i • • # ,
************************************ r///////////////////////////////y/// í///////////////////////////////////
************************************ >***********/***/******/*****/*/**** '/*/***********************/*/***/** '**/***. '*/***/* '******. _,, , '*******
'//////*. Glassy carbon ','*'/*'///* t******. * ******** f/*****. ******** tf***/****************/********/**/*
*********************/*********/****, t/tf*ttt/f**f/*tfffftt//ftf//t/fttf*
*/*/***/*************/***/********** //////////////////////////////////// ************************************ ************************************ f/***/*/****/**/*******/*f*****/*/*t t/****/***/*/****************/*****t
figure 3.11 Schematic of dispersed mercury eCectrode
A comparison of the responses seen for a IO"4 M solution of methylmercury at the
various derivatised electrodes indicates the electrode produced with one minute
mercury deposition step exhibited no peaks for the IO"4 M solution. It did however
give two poorly defined peaks for methylmercury reduction when the solution
concentration was increased to IO"3 M. The electrode prepared with a four minute
mercury deposition step had a large background response with no methylmercury
responses evident.
The only electrode to give any reasonable response for methylmercury was that
prepared with a two minute mercury deposition step during the electrode preparation.
Vage 108

MethyCmercury Sensing
From these results it is apparent that the levei of mercury in the polymer is criticai.
Too litüe, and there is an insufficient number of sites to allow efficient reduction of the
methylmercury trapped at the electrode, too much, and the background signal swamps
the analytical signal.
The two minute mercury plating step was used in the preparation of the electrodes for
ali further investigations.
A cyclic voltammogram of the GC/Hg7pNET-[CS2] in supporting electrolyte is
shown in Figure 3.12 This figure shows the first and 15th cycles of the
voltammogram.
I 50pA
b -m
\
0 T—r T"
•500
T — r " 1 — r 1000
E(mV v. Ag/AgCI)
figure 3.12 Cyclic voCtammograms of composite tCtctrode in supporting
eCectroCyte.
Conditions: Einitial = 0 m V Eupper = 0 m V Elower = '1000 m V Scan rate = lOOmV.s"1
During the first cycle (Figure 3.12(a)) a large reduction peak is seen at -650 m V . The
size of this peak gradually decreases until, by the 5th cycle (Figure 3.12(b)), it is
insignificant.
Vage 109

MethyCmercury Sensing
The cause of this peak is unknown, but may be associated with the setting up of better
charge paths within the polymer. This hypothesis is supported by the observation that
with a freshly prepared electrode it is not possible to perform cyclic voltammograms
with scan rates much greater than 100 mV.s"1. The response simply flattens out
indicating that the potentiostat is incapable of applyrng a voltage sufficiently high
enough to compensate for the internai resistance in the polymer. Whereas, after the
electrode has been cycled in supporting electrolyte for a few scans, it is possible to
perform cyclic voltammograms at higher scan rates, indicating the internai resistance
of the polymer is significantiy decreased during the conditioning step.
A cyclic voltammogram performed on a solution of 10"3M methylmercury in
supporting electrolyte shows a reduction response at approximately -450 m V , the
magnitude of which changes with varying methylmercury concentration. Figure 3.13
shows the response obtained for a 2 x 10"3M solution of methylmercury. The
potential of this response is more in keeping with the single electron reduction of the
methylmercury cation, as described in equation 3.1, rather than the reduction of a
methylmercury-dithiocarbamate moiety.
figure 3.13 Cyclic voCtammogram of a derivatised, composite eCectrode in
2 a: W3M Olplg'/supporting eCectroCyte
Conditions: As in Figure 3.12
Vage 110

MethyCmercury Sensing •
Having determined the position of the methylmercury response there are a number of
variables to be optimised in order to achieve the best analytical response possible.
3.3.4.1.1 Effect of Analytical Waveform
To optimise the analytical signal obtained both the voltammetric technique and the
potential limits used in the determination were investigated. It was found that
Osteryoung square wave stripping voltammetry (OSWSV) was the most appropriate
technique to use. It gave a symmetrical well defined response with an acceptable
analysis time. Linear sweep voltammetry was unsuccessful as the response was very
broad. The response obtained with differential pulse voltammetry was well defined
but the analysis time was too long. An OSWSV response for 10"3M methylmercury
at a composite electrode is given in Figure 3.14.
figure 3.14 OSWS1/scan of a derivatised, composite eCectrode in 10~3M
CflsíHg*/supporting eCectroCyte
Conditions: Eiaitial = 0 m V Efinal = -1200mV A.C. Amplitude = 25 m V Step potential = 4 m V Frequency = 15H2
Vage Ul

MethyCmercury Sensing
The effect of the starting potential was deteimined and found to have littie impact upon
the analytical signal. This is illustrated in Table 3.3.
TabCt33 Effect of the starting potential on the analytical response for
10-3MCtt£lg¥
Starting potential (mV)
0
-100
-200
-300
-400 * Analytical peak
Analytical response (uA)
at-400
2.39
2.37
2.43
2.23
—
±10mV
3.3.4.1.2 Effect of accumulation potential
Figure 3.15 shows the effect on the analytical signal of altering the accumulation
potential prior to the commencement of the analytical scan. From this figure it can be
seen that the optimum accumulation potential is within the window -200 m V to -
400 m V .
figure 3.15 Effect of accumulation potential on the analytical response
obtained for 10'3M CHplf
Conditions: as in Figure 3.14
Vage 112

MethyCmercury Sensing
To investigate this further, analyte accumulation at both -300 mV and -400 mV was
conducted for a series of accumulation times and the responses compared. The results
of this comparison are given in Table 3.4. From this table it can be seen that there is
little difference between the responses obtained, with deposition at -400 m V giving a
slightly larger signal at the shorter deposition times.
TabCe 3.4 A comparison ofthe analytical signals obtained for Ctti)'}lg¥ at a
ÇC/MgO/pO&TÍCSa] eCectrode.
Accumulation time (s) Analytical response (uA)
Accumulation at -300 mV Accumulation at -400 mV
60 2.07 2.19
120 2.02 2.18
240 2.16 2.20
480, 2^22 2;20 Einitial = 50 m V Efinai = -1200 m V ali other conditions as in Figure 3.21.
3.3.4.1.3 Optimum experimental conditions.
The data in the previous sections indicates that the optimum conditions for the
detection of methylmercury are:
Waveform: Osteryoung Square Wave Stripping Voltammetry
Einitial: 50 m V
Efinai: "900 m V
Edep: -400 m V
tdep- 60 s
Using these conditions it is possible to detect 10"5M CH3Hg+ with a the composite
electrode. A voltammogram for a 10"5M solution of methylmercury is shown in
Figure 3.16.
Vage 113

MethyCmercury Sensing
lOOnA
I , 1 1 j 1 1 , 1 1
O -500 -900
E(mV v. Ag/AgCI)
figure 3.16 OSlVS 'VoCtammogram for 10'5M (2.2ppm) Cfyflg+at a
composite electrode
Conditions: as in texc.
In comparison, the voltammogram shown in Figure 3.17 is for the same
methylmercury solution at a glassy carbon electrode. It can be seen that the peaks in
this voltammogram would render this electrode unsuitable for the detection of the
CH3Hg+ cation. The composite electrode provides a suitable substrate for the
reduction of methylmercury with the polymer layer protecting the electrode surface
from fouling.
Vage 114

MethyCmercury Sensing
i i I i i i | O _500 -900
E(mV v. Ag/AgCI)
figure 3.17 OSlVS VoCtammogram for 10'SM OtsHg+at a glassy carbon
eCectrode
Conditions: as in text.
It is evident from Figure 3.16 that the composite electrode does not possess a
sufficient levei of sensitivity to warrant further development. As a result of this no
further work was carried out with this electrode. Therefore calibration and interference
studies were not carried out.
3.6 CONCLUSIONS
The polarographic studies of methylmercury have shown that the reduction of the
C H 3 H g + cation is favoured in acidic conditions. Studies of the reduction of
methylmercury at stationary electrodes have also indicated that this reaction occurs
more reproducibly at a mercury surface.
The use of the dithiocarbamate, ammonium pyrolidine dithiocarbamate, has been
shown to increase the sensitivity of the methylmercury detection and forms the basis
of an adsorptive stripping voltammetric technique for the determination of CH3Hg+ in
Vage 115

MethyCmercury Sensing
water. The technique is not suitable for the detection of either ethyl or phenyl
mercury, although the choice of a different dithiocarbamate may improve this.
A modified electrode for the detection of methylmercury was considered. This was a
composite electrode combining preconcentration at a dithiocarbamate functionalised
polymer and detection at a mercury surface. This polymer proved to have inferior
sensitivity when compared with the adsorptive stripping technique. However, the
presence of the polymer film enhanced the methylmercury signal by virtue of the fact
that it provided a barrier protecting the electrode from unwanted side reactions,
providing a "cleaner" voltammogram. The potential of the C H 3 H g + reduction signal
suggests that it is a single electron reduction of CHsHg"1" rather than the reduction of a
methyj^ercury-mthiocarbarnate species.
In summary, the detection of CH3Hg+ at a chemically modified electrode provides
inferior detection to that achieved using an adsorptive stripping voltammetric approach
at a HMDE.
Vage 116
ÇoCd Sensing
CHAPTER 4 THE DETERMINATION OF GOLD USING CHEMICALLY MODIFIED ELECTRODES
4.1 INTRODUCTION
The preconcentration and determination of trace leveis of gold remains an área of
interest to those involved in either the processing of gold bearing minerais or the
geochemical exploration for suitable ore bodies. Analysis of processing streams and
plant effluent is essential to maximise the effíciency of the gold recovery processes
[350, 351], whilst the analysis of groundwater is a useful tool in geochemical
exploration [103,139].
Instrumental techniques used for the determination of gold include: AAS [103, 352],
H P L C [350 353], voltammetric methods [139, 156, 164, 351, 354-357] and
instrumental neutron activation analysis (INAA) [83,103, 358]. This is by no means
an exhaustive list of techniques available, reviews and comparisons of suitable
analytical techniques can be found in the literature [359,360].
4.1.1 VOLTAMMETRIC DETERMINATION OF GOLD
Voltammetric methods, especially stripping voltammetry, are well suited to the
determination of gold and as such have been investigated by a number of workers.
Simple polarographic determination of gold is not possible because gold is reduced at
a potential more positive than the oxidation potential of mercury [361]. The
appropriate choice of supporting electrolyte to form a more stable gold complex and
effectively lower the reduction potential of gold, enabled the polarographic
Vage 117

ÇoCd Sensing
determination of gold to be carried out [362], however this technique is too insensitive
to be a viable method for the determination of trace leveis of gold.
The stripping voltammetric determination of gold at carbon paste and graphite
electrodes was investigated extensively during the 1960's and early 1970's [361, 363-
368]. The use of very long deposition times with these electrodes enabled a limit of
detection of 1 U-g-L"1 to be achieved [368]. However, the mechanical instability and
lack of reproducibility of such electrodes have prevented them from coming into
widespread use. Platinum electrodes have also found limited application in the
determination of gold [369-371].
The advent of glassy carbon provided electroanalytical chemists with a very
reproducible inert carbon based electrode and A S V techniques for gold, utilising the
deposition of gold onto glassy carbon as a preconcentration step, were developed [351,
357, 372]. These techniques, especially when stripping was achieved using a pulsed
voltammetric waveform, possessed excellent limits of detection [372]. However, a
problem with the A S V determination of gold at glassy carbon is the interference
caused by electroactive species commonly encountered with gold, these include Cu,
Ag, Hg, Pt and Fe [357, 356]. This problem is usually overcome by including a
solvent extraction step in the sample preparation protocol. [357].
An alternative approach reported involved using a modified electrode in the ASV
determination of gold [373], To achieve this a carbon paste electrode, modified with a
chelating resin, was used for the non-electrolytic accumulation of gold(III). A
médium exchange step followed the accumulation procedure after which the
accumulated gold was reduced and subsequently determined by A S V . The method
reported is essentially free of most common interferences [373].
Cathodic stripping voltammetry has found limited application in the determination of
gold. Electrodes used in these studies have been either carbon paste [374, 375] or
modified carbon paste electrodes [156, 159, 164, 376, 377]. The detection limits
Vage 118

ÇoCd Sensing
achieved with the best of these electrodes has been in the high u.g.1/1 leveis [156]. The
effect of interferences varies between electrodes, with the presence of copper adversely
affecting most determinations [156,164,159, 373].
4.1.2 POLY(4 VINYLPYRIDINE)
The use of poly (4-vinylpyridine) (PVP) for the modification of electrodes was first
reported by Anson and O y a m a [381] and later by a number of other workers [382-
384].
The first report of the use of a PVP modified electrode in a sensor application was that
of Cox and Kulesza [174]. In this work a P V P modified platinum electrode was used
for the determination of anionic Cr(VI) species. The Cr(VI) was preconcentrated into
the protonated P V P film and determined, after a matrix exchange procedure, by a
reductive scan. During this scan the anionic Cr(VI) is reduced to a cationic Cr(III)
species and subsequently expelled from the polymer.
This polymer possesses two properties that make it attractive as a potential sensing
element for gold(IH). Firstly, when protonated the polymer is capable of
preconcentrating anions onto the polymer surface, presumably due to the presence of
positively charged amine groups throughout the polymer. Secondly, whilst the
polymer has a sufficient levei of ionic conductivity to allow reduction or oxidation of
species to occur at the polymer surface it does not show significant electrochemical
responses over the potential range of interest.
4.1.3 AIM AND SCOPE OF THIS WORK
There are a number of analytical techniques suitable for the analysis of gold in aqueous
samples, most of which are best suited to the analytical laboratory and would be
difficult to adapt for use in the field if required. The only technique that has been
Vage 119

ÇoCd Sensing
reported for the determination of gold in the field is a voltammetric one [139].
However, this technique is prone to interference in some applications.
Thus, it would appear that the voltammetric determination of gold could be improved
by the development of sensing elements that are less prone to the interferences
commonly associated with gold determination. A study of the interaction of gold with
electrochemically generated polymers may provide the necessary information to assist
in the development of a polymer based sensor for gold.
Here, as with the previous example, the judicious application of polymer modified
electrodes may provide a means of achieving this end. This work has therefore
focussed on investigating the interaction of gold with polymer modified electrodes as a
means of developing a sensor for the selective determination of gold.
4.2 EXPERIMENTAL
4.2.1 REAGENTS AND SOLUTIONS
Ali reagents used were analytical (A.R.) grade unless otherwise stated. Water used
was purified using a Milli-Q water purification system. Monomers used for the
electrochemically generated polymer were obtained from the Sigma Chemicals
Company and used as received. Gold solutions were prepared by serial dilution from
a 1000 mg.L"1 standard. This was prepared by dissolving lg of gold metal (99.99%)
in a minimum of aqua regia and diluting to the required volume.
Supporting electrolyte was prepared by adding 10 mL of concentrated hydrochloric
acid and 20 m L of concentrated nitric acid to water and diluting to 1 litre.
Vage 120

ÇoCd Sensing
4.2.2 INSTRUMENTATION
Cyclic voltammetry was performed using either a Bioanalytical Systems (BAS) (West
Lafayette In.) CV-27 Voltammograph connected to a Houston Omnigraphic 2000 X-
Y recorder or a B A S 100A Electrochemical Analyser. Ali other voltammetric
measurements were performed using the B A S 100A Electrochemical Analyser.
Glassy carbon disks (3 m m diameter) were supplied by either Chemtronics (Perth
W.A.) or B A S .
Homemade platinum electrodes were prepared by sealing a 1-2 cm length of 0.5 mm
platinum thermocouple wire into the end of a 1 m L pipette. Contact with the platinum
was made by using wood's metal to join the platinum to a length of copper wire. The
exposed platinum wire was trimmed to 1 cm length after fabrication.
Stripping voltammetry experiments were performed using a electrochemical cell
supplied by Chemtronics. This unique cell design facilitates matrix exchange
experiments and allows solution change without the electrode drying out [357]. A
diagram of the cell is shown in Figure 4.1.
(auxiliary) electrode
Ag/AgCI^v " j reference^~_G£,
1
Motor
.r^í i i
L, ,J BI |
Optical speed ^^ sensor
Sample
't\ i i
electrode C^T.» 1 / Cl
ri
<^0^ entry port
„-_—-Stirrer
button
Glassy carbon ^ r j c m
working electrode •—'
figure 4.1 Chemtronics Electrochemical Ceíl
Vage 121

ÇoCd Sensing
Control of the cell stirrer was achieved through a purpose built interface to connect it to
the B A S 100A.
The preparation of specific electrodes used in this work is detailed below.
4.2.3 ELECTRODE MODIFICATION
4.2.3.1 Polypyrrole
Polypyrrole coated electrodes were prepared by the galvanostatic oxidation of pyrrole
in a deoxygenated aqueous solution containing 0.5 M pyrrole and 1.0 M of the salt to
be used during polymer preparation. Unless otherwise indicated, oxidation was
achieved at a current density of 0.5 mA.cm"2 for 6 minutes. After preparation ali
electrodes were washed thoroughly and used immediately.
4.2.3.2 Poly(2^'bithiophene)
Poly(2,2'bithiophene) modified electrodes were prepared by the galvanostatic oxidation
of 2,2*bithiophene from a deoxygenated solution of 0.5 M 2,2'bithiophene and 1.0 M
concentration of a suitable salt, usually NaC104 or (C4H9)4NBF4 in acetonitrile.
Oxidative conditions were identical to those used for the preparation of polypyrrole
modified electrodes.
4.2.3.3 Chemisorbed poly(4-vinylpyridine) electrode
Poly(4-vinylpyridine) (Polyscience) was dissolved in methanol (A.R.) to give a
0.4% w/v solution of the polymer. A suitable aliquot of this polymer was placed on
each glassy carbon electrode with a 5-50 pL pipette. The methanol was then allowed to
evaporate at room temperatura.
The polymer modified electrode was subsequently soaked for 10 minutes in a 0.1 M
solution of H2SO4. This treatment both protonates the polymer and causes it to swell
[174].
Vage 122

ÇoCd Sensing
4.23.4 Electrochemically generated PVP
The polymer was synthesised by cycling a glassy carbon electrode between 0 and
-2000 m V , in a solution of 1.0 m M divinylbenzene (Aldrich), 5 - 40 m M 4-
vinylpyidine (Aldrich) in 6 0 % NX-dimethylacetamide and 4 0 % N/10 H2SO4.
Typically, electrodes were scanned for 5 -10 cycles.
4.3 RESULTS AND DISCUSSION
4.3.1 POLYPYRROLE
The ion exchange properties of polypyrrole have been discussed in chapter 2 of this
work. Feasibly, this property could be used as a means of preconcentrating (AuCU)"
prior to voltammetric determination.
The following studies were designed to test the suitability of polypyrrole modified
electrodes for this application and to investigate the effect of applied potential on the
interaction of gold(Ht) with the polymers.
4.3.1.1 Voltammetry of gold at polypyrrole
Polymers used for this study were synthesised from a solution of 0.5M pyrrole and
1.0 M NaCl. Initial investigations involved studying the voltammetry of polypyrrole
in M NaCl. Figure 4.2a shows a cyclic voltammogram of polypyrrole in M NaCl,
Figure 4.2b shows a LSS V scan of the same electrode after 60 seconds accumulation
at 700 m V . From these figures it is evident that there are no distinct reduction
responses due to the polymer or supporting electrolyte over the voltage range scanned
(0-700 m V ) . This observation held true for polypyrrole on both glassy carbon and
platinum electrodes.
Vage 123

ÇoCd Sensing
a
figure 4.2
I 50(iA
1 00
1 500
1 0
E(mV v. Ag/AgCI)
r™ •500
1 -10C
20*iA
500 E(mV v. Ag/AgCI)
1/oCtammetric responses for poCypyrroCe in MOiaCC
a) CycCic voCtammogram
b ) Linear sweep stripping voCtammogram
Conditions: Cyclic voltammetry Einitial = 0 m V
LSSV Eupper = 7 G 0 m V
E . = 700 mV initial
tdep = 60s Scan rate = lOOmV.s"1
E,ower = -1000mV Scan rate = 100 mV.s"1
Efina. = 0 mV Edep = 900 m V
A voltammogram for a polypyrrole coated platinum electrode, under the same
experimental conditions, in a solution of 50 mg.L"1 Au(III) in M NaCl shows a
Vage 124

ÇoCd Sensing
distinct reduction response at 500 mV presumably due to the reduction of Au(III) to
Au°. A LSSV scan from 700 - 0 mV, with 60 seconds preconcentration at 700 mV
exhibits a large reduction peak at 490 mV, again presumably due to the reduction of
gold(III) at the polymer electrode.
A similar series of experiments performed using polypyrrole coated glassy carbon
electrodes yield slightly different results. There is no distinct gold reduction response
seen on cyclic voltammograms recorded for polypyrrole modified glassy carbon
electrodes in a 50 mg.L"1 solution of Au(III) in M NaCl. A linear sweep stripping
voltammogram using the same electrode/solution combination recorded after 60
seconds accumulation at 700 mV shows a distinct reduction response at 500 mV
(Figure 4.3).
figure 4.3 LSSV response for 50mg.L1 Au(III) in M 9{aCC at a poCypyrroCe
modifiedgCassy carbon ECectrode
Conditions: LSSV E =70OmV Ef i = 0 m V initial final ~ u ra v
tdep = 30 s Edep =700 mV Scan rate = 100 mV.s"1
A series of experiments, performed to determine the interrelationship between
accumulation potential and the reduction response, show that the magnitude of the
Vage 125

ÇoCd Sensing
reduction response increases as the accumulation potential is made more positive.
These are shown in Table 4.1.
TabCe 4.1 Effect of accumuCation potential on analytical response for
Au(III) at a W/CC- eCectrode
Accumulation potential Responsea>b (uA) Au reduction potential
(mV) (mV)
700 100 500
800 160 490
900 225 435
1000 response disappears
a) Conditions Einitial = 700 mV, Elower = 0 mV tdep = 30 s Scan rate = 100 mV.s1
b) Sample: 50 mg.L'1 Au in M NaCl
This trend is evident up to an accumulation potential of 900 m V , after which the
polymer is severely degraded and the gold reduction response is diminished and/or
swamped by the polymer response.
With the increasing accumulation potential two phenomena occur. The first of these is
an apparent increase in ion exchange capacity with increasing potential. This has the
effect of increasing the amount of gold preconcentrated into the electrode which in turn
increases the analytical signal. However, as the accumulation potential is increased the
second phenomena begins to occur and the polymer is irreversibly damaged by "over
oxidation" [378]. This causes the conductivity of the polymer to decrease. The
resulting increase in iR drop across the polymer causes the potential of the gold
reduction response to shift (Table 4.1) whilst making these responses broader and less
distinct. This makes them more difficult to quantity.
Thus, the optimum analytical signal is obtained with an accumulation potential that
maximises gold preconcentration whilst minimising polymer damage and therefore
improving repeatability for subsequent determinations.
Vage 126

ÇoCd Sensing
These results indicate that it is possible to accumulate gold(III) at these electrodes and
that the application of a potential will enhance this accumulation process. It is also
evident that, as the accumulation occurs at a potential more positive of that required to
reduce the gold ions to metallic gold, accumulation must involve processes other than
electrodeposition.
There are three possible modes of interaction available, being;
(i) Ion exchange, with the anions incorporated in the polymer being replaced
by [AuCU]" ions
(ii) Adsorption of the Au(III) onto the polymer surface. This may involve
the interaction between protonated amine groups on the polymer and the
[AuCU]" anion.
(iii) A redox reaction between the polymer and the [AuCU]" anion. Feasibly
this could involve oxidation of the polypyrrole by the Au(III) ion with the
concomitant reduction of Au(III) to Au°. This m a y be a possibility as
Au(III) is a relatively strong oxidant (E 0= 1.42 V vs S H E ) and
polypyrrole is readily oxidised.
However, the fact that the analytical response seen with these electrodes is most
probably due to the reduction of gold from Au(III) to A u ° indicates that
preconcentration of gold at polypyrrole involves trapping gold in the trivalent oxidation
state (i.e. as AuCU")-
This observation suggest that option (III), discussed above, is not the mode of gold
accumulation as any gold collected would be immobilised as Au°, not Au(JTI) and
consequently not give rise to a reduction response. Thus, preconcentration of gold at
polypyrrole must occur by either anion exchange, adsorption onto the polymer or
possibly a combination of both mechanisms.
Having established that it is possible to preconcentrate gold(III) at polypyrrole and that
an analytically useful signal could be obtained using polypyrrole modified electrodes
Vage 127

ÇoCd Sensing
the next phase of the studies was to determine the effect of polymer synthesis
conditions on the analytical response for gold at polypyrrole.
4.3.1.2 The efJect of polymer synthesis conditions on the voltammetry of
AuíJII) at polypyrrole
The previous voltammograms were recorded using polypyrrole synthesised from a
solution containing the monomer and NaCl dissolved in water. The effect of the anion
present in the synthesis solution on the subsequent voltammetric behaviour of the
polymer formed was investigated and reported in Chapter 2 of this thesis. This work
was subsequently extended to investigate the effect that these voltammetric differences
between polymers may have on the voltammetry of gold(III) at polypyrrole electrodes.
To investigate this a series of polypyrrole polymers were produced incorporating
chloride, nitrate, tetrafluoroborate, perchlorate, salicylate and dodecylsulphate(DS")
(0.01 M , Pyrrole 0.05 M ) as the counterion in the polymer.
These polymers were subsequently studied to determine whether varying the anion
incorporated during the polymerisation process caused any significant changes in the
voltammetric response for gold(IU) at the polypyrrole electrodes. To achieve this both
the potential at which gold(III) was reduced and the magnitude of the reduction
response were determined.
It can be seen from Table 4.2 that for a given set of experimental conditions, except in
the case of polypyrrole/DS", the variation in the potential of the gold(III) reduction
response is minimal.
Vage 128

ÇoCd Sensing
TabCe 4.2 Reduction potential for goCd(III) at poCypyrroCe eCectrodes
synthesised in the presence of different anions.
Electrode Salt used during Potential of gold
designation growth reduction peaka-b
(mV)
PP/Cl" NaCl 496
PP/BF4- NaBF 4 533
PP/NO3- N a N 0 3 549
PP/CIO4- NaCI04 549
PP/salicylate N a C 7 H 6 0 3 516
PP/DS" NaC 1 2 H 2 5 S 0 4 270 Conditions: Einitiai = 700 m V Eiower = 0 m V Scan rate = 100 mV.s"1
(a) Preconcentration at 700 m V (b) Sample: SOmg.L'1 Au in M NaCl DS": dodecylsulphate
The reduction potential of gold at PP/DS" is significantly lower than that at the other
polypyrrole electrodes. This m a y be caused by the fact that polypyrrole/DS" is a poor
anion exchanger. The bulky D S " anion is not readily released from the polymer and as
such is not available for anion exchange. This anion is tightly bound within the
polymer and it has been shown that PP/SDS takes up or expels cations to maintain
charge neutrality when changing oxidation states [379]. A s a result of the poor anion
exchange capacity of PP/SDS it was not studied any further.
The effect of accumulation potential on peak height and potential was investigated.
Figure 4.4 shows the effect of accumulation potential on the magnitude of the gold
reduction response. The results for these anions show a wide variety of effects.
Vage 129

ÇoCd Sensing
<
a o o. as
SS a o 3 OS
400-1
300-
200-
100-
Cl
CIO". 4
NOj
BF4
salicylate
600 700 — 1 — 800
— I — 900 1000
Accumulation potential (mV)
figure 4.4 Effect of accumuCation potential on the magnitude of the
goCd(III) reduction response at various poCypyrroCe eíectrodes
Conditions: A s in Figure 4.3, with various accumulation potentials
In the case of chloride the relationship is a linear one, with the increase in accumulation
potential from 700 mV to 800 mV causing a similar increase in signal as increasing it
from 800 mV to 900 mV. In both cases the reduction response was increased by
0.602 uA-mV"1 increase in accumulation potential.
With the larger oxyanions NO3- and CIO4- the increase in accumulation potential from
700 mV to 800 mV cause a similar increase in reduction response as seen with the Cl"
anion. In this case the responses are increased by 0.515 pA.mV"1 and 0.600 uA.mV"1
respectively.
A further 100 mV increase in accumulation potential however, causes much more
significant increase in the reduction response for gold(III). The response at PP/NO3-
is increased by 0.960 jxA.mV"1 increase in accumulation potential and PP/CIO4" is
increased by 1.10 ^A.mV"1 increase in accumulation potential. The reason for this
dramatic increase in reduction response may be that at the more positive potentials the
polymer is more porous, thus facilitating the ion exchange of the larger anions out of
Vage 130

ÇoCd Sensing
the polymer. This effect would not be as significant for the smaller, more mobile,
chloride anion.
The effect of accumulation potential upon the reduction response of gold(III) is most
significant for the polymer incorporating the BF4- anion. A n increase in accumulation
potential from 700 m V to 800 m V causes an increase in the reduction response of
0.794 uA.mV"1. A further 100 m V increase in accumulation potential causes a further
1.65 uA.mV - 1 increase in the reduction response. These effects reflect the dependence
of this ion exchange reaction on changes in polymer porosity, particularly for the bulky
BF4" anion.
In contrast to the significant effect that potential has on the accumulation of gold at
PP/BF4-, increases in the accumulation applied to PP/salicylate cause only a small
increase in the gold(III) reduction response. A n increase in preconcentration potential
from 700 m V to 800 m V causes a 0.25 uA.mV"1 increase in the analytical response.
A further 100 m V increase in accumulation potential causes an additional
0.21 uA.mV- 1 increase in response. The phenomenon is caused by the fact that the
salicylate anion is quite bulky and as such will only exchange with difficulty (PP 105].
The application of potential in this case does not significantly improve the ion-
exchange reaction.
The effect of accumulation potential on the position of the gold reduction response was
also investigated. The data, presented in Figure 4.9, shows a similar trend to that seen
previously. The reduction potential becomes more cathodic as the accumulation
potential becomes more anodic, again indicating that the polymer is being irreversibly
damaged during the accumulation at higher potentials.
Vage 131

ÇoCd Sensing
figure 4.5 Effect of accumuCation potential on the potential of the goCd(III)
reduction response at various poCypyrroCe eCectrodes
Conditions: As in Figure 4.3, with accumulation at various potentials
Thus, from the preceding data it would appear that the accumulation of gold(III) at
polypyrrole electrodes is effected significantly by the anions incorporated into the
polymer during polymerisation.
It was previously stated that accumulation of gold at polypyrrole may be due either to
anion exchange into the polymer or to adsorption of the gold anions onto the polymer.
Studies of the effect of the anion, present during electropolymerisation, on the
analytical response have shown that any alteration in the anion exchange capacity of the
polymer effects the gold analytical response. From this it can be concluded that the
predominant mechanism of preconcentration is anion exchange of (AuCU") into the
polymer, for if adsorption was the primary preconcentration mechanism, change in
polymer ion exchange capacity would have little or no effect on the analytical signal.
In the light of these data the mode of operation for this electrode may be postulated,
equation 4.1 summarises this.
Vage 132

ÇoCd Sensing
X = NH (4.1)
The anionic tetrachloroaurate is preconcentrated into the polymer by anion exchange at
the potential used for accumulation. Following this the application of a negative going
potential causes the gold(HI) to be reduced to metallic gold at approximately 500 m V
giving rise to the analytical signal.
Given the initial success with the voltammetry of gold at polypyrrole modified
electrodes it was decided to investigate this further. The gold solutions used in this
initial investigation were too concentrated to provide any useful indication of the limit
of detection achievable with these electrodes.
Initially, calibration studies were performed with polymers prepared by galvanostatic
oxidation at a current density of 0.5 mA.cnr 2 for 6 minutes. These polymers have a
nominal thickness of 0.75 p.m.
The primary limitation to gold detection with these electrodes is the background signal
due to the polymer itself. At the potential where gold(III) reduction occurs the
polymer is still highly electroactive and gives rise to a significant reduction response.
Vage 133

ÇoCd Sensing
As a result of this the detection of gold at concentrations less than 3 mg.L"1 was not
possible. Coupled with this, the polymer background response changed significantly
between determinations, causing unreliable analytical results. It was felt that this
problem m a y be avoided if thin polymers were used. It can be seen from Table 4.3
that the analytical signal:background signal ratio was improved when thin polymers
were used.
Table 43 Effect of fim thickness on goCd response at poCypyrroCe eCectrodes
Polymerisation Film thickness Signal0 for 5 mg.L"1
timea (theoretical)b Au (uA)
6 minutes 0.75 um 51.8
3 minutes 0.375 um 50.7
1 minutes 0.125 um 30.2
0.5 minutes 0.063 u m 20.7
(a) at 0.5 mA.cm-2
(b) assuming 100% electrochemical effíciency and film density of 1 (c) Conditions: Einitiai = 700 m V Efinal = 0 m V E d e p = 900 m V ,
tdep = 60s Scan rate = 100 mV.s"l
The data presented in Table 4.3 indicates that thicker films give better signal.
However, as the film becomes thicker the polymer background response becomes
more significant and the gold(III) reduction response tends to broaden. This is shown
in Figure 4.6. Thus, the best analytical signal is achieved with a very thin polymer, in
this case 0.063 um. With this polymer the limit of detection is, at best 1 mg.L"1.
Coupled with this, the linear calibration region is extremely restricted. Figure 4.7
shows the calibration curve for a thin polymer. From this figure it is evident that
polypyrrole based sensors do not possess sufficient sensitivity for this application.
Vage 134

ÇoCd Sensing
J5uA
I— 700
I 500
E(mV v. Ag/AgCI)
20|xA
figure 4.6 A comparison of response for 5 mg-L'1 goCd(III) at different
poCymer thiclqiess
a) 0.063 \Lm
b) 0.75 \lm
Conditions: As in Table 4.3
Vage 135

ÇoCd Sensing
30-
< 20-
«a C O
o,
Analytical
c
_ _ _ _ _
/ • response(|iA)
t i i
) 10 2Q
Gold concentration (mg/L)
figure 4.7 Calibration curve for a thin poCymer
Conditions: Einitial= 700 m V Efinai = 0 m V Edep = 900 m V Scan rate = 100 mV.s"1
The preceding investigations have shown it is possible to detect gold(III) with
polypyrrole modified electrodes. However, the polymer background signal mitigates
against achieving the desired L O D for gold with these electrodes.
It is possible, however, that other conducting polymers, capable of ion exchange, may
be better suited to this application.
4.3.2 POLY(2^'BITHIOPHENE)
As with the pyrrole based polymers, the possibility of the use of ion exchange
accumulation of gold(III) at poly-2,2'bithiophene was investigated. The attraction of
this polymer was its slightly higher positive potential limit over polypyrrole. Poly-
2,2'bithiophene electrodes cycled in either M NaCl or 1 0 % aqua regia solution exhibit
no voltammetric responses over the potential range 0 to 800 m V . The addition of
50 mg.L"1 Au(III) to the NaCl solution causes the appearance of a reduction peak at
Vage 136

ÇoCd Sensing
470 mV and an oxidation peak at 850 mV, as shown in Figure 4.8a. The peak at
450 m V may be attributed to the reduction of the Au(III) ion to the metallic gold. The
peak to peak separation of 400 m V is significantly greater than would be expected.
This is primarily due to the difficulty with which gold is reduced.
The application of a preconcentration potential of 1100 mV for 60 seconds prior to a
linear sweep scan from 1100 m V to 0 m V causes an increase in the magnitude of the
gold(III) reduction peak at 400 m V . This data suggests that with these electrodes, as
with those already discussed, the application of a positive potential causes
accumulation of the tetrachloroaurate anion.
To verify this the effect of preconcentration potential on the gold(III) response was
studied and it was found that, as with the other polymers studied, an increasingly
positive accumulation potential resulted in a better analytical signal. This held true up
to 900 m V after which the signal decreased with increasing accumulation potential.
This is shown in Figure 4.19.
Vage 137

ÇoCd Sensing
T 1000
T 500
E(mV v. Ag/AgCI)
I 5|iA
800
I I I
500 E(mV v. Ag/AgQ)
figure 4.8 1/oCtammetric responses for 50 mg.L'1 Au(III) in M 9{aCC at a
poCy(2,2'bithiophene) modified eCectrode.
a) Cyctic VoCtammogram
b ) Linear Sweep Stripping VoCtammogram
Conditions: Cyclic voltammetry Einitial = 1100 m V
LSSV E u p p e r = 1100mV
Elower = 0 m V Scan rate = lOOmV.s"1
Electrode:
Einitial =1100 m V tdep = 60s Scan rate = 100 mV.s"1
Poly(2,2Bithiophene) on platinum
-final
'dep
= 0 mV = 1100 mV
Vage 138
ÇoCd Sensing
< zL
Cfl
s o C/J
a o o 3 "O
25-
20-
15-
10-
5-
600
- \
y ^ ^ .
i • i • i • i
700 800 900 1000
Deposition potential (mV)
1100
figure 4.9 Effect of accumuíation potential on magnitude of goCd(IH)
response at poCy 2,2 bithiophene eCectrodes
Conditions: Einitíai = 800 m V EfinaJ = 0 m V tjep = 60 see Scan rate = 100 mV.s"1
Sample: 10 mg.1/1 Au(III) in M NaCl Electrode: Poly(2,2Bithiophene) on platinum
Figure 4.10 shows the effect of accumulation potential on the potential of the gold
reduction peak and, as with the other polymers studied, the potential of this peak
becomes more cathodic as the polymer is overoxidised during accumulation.
The fact that this polymer is more resistant to overoxidation than polypyrrole is seen
by comparing the linear sweep stripping voltammogram recorded for each polymer at
the optimum accumulation potential and at a potential more positive than the optimum.
Whereas, with polypyrrole collection at 900 mV gives rise to the best analytical signal
and collection at 1000 mV causes the signal to be so degraded it is unquantifiable,
accumulation at poly 2,2'bithiophene is optimum at 900 mV with accumulation at
1200 mV causing some loss in response, but no significant degradation of the
analytical signal. This is shown in Figures 4.11 (a) and 4.11 (b).
Vage 139
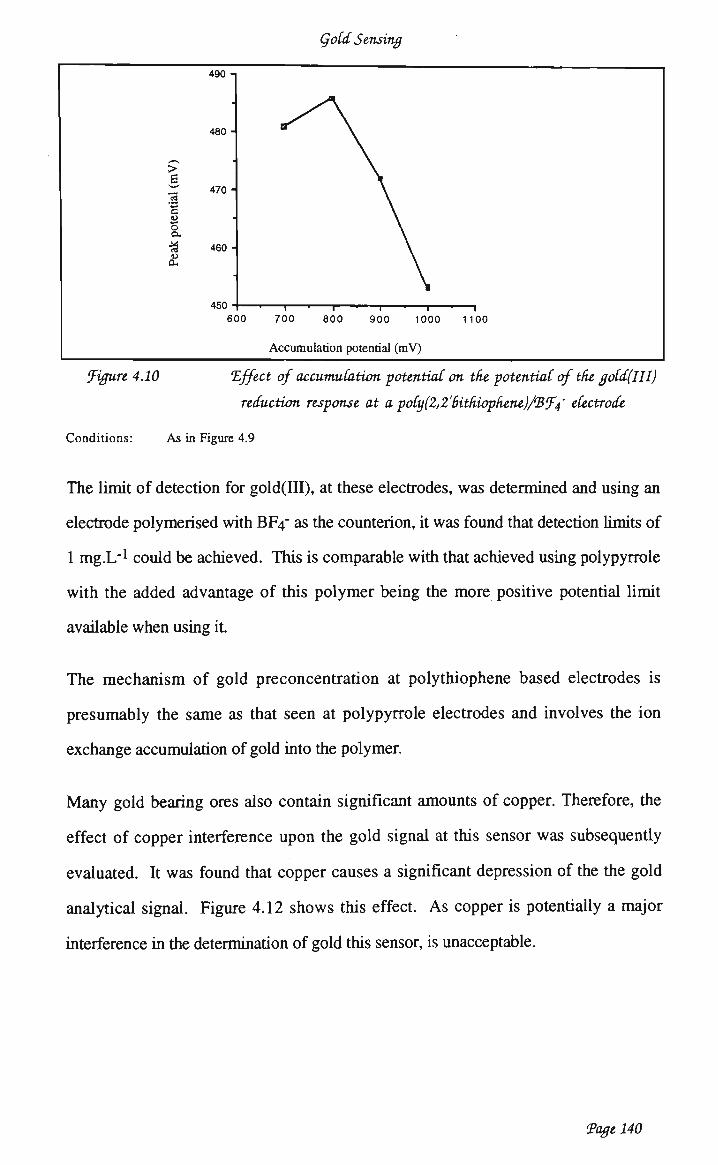
ÇoCd Sensing
>
a •a •43
a &
o o. •a tu
a,
490 -
480 -
470 •
460 •
°^\
\
\
\
600 700 800 900 1000
Accumulation potential (mV)
1100
figure 4.10 Effect of accumuCation potential on the potential of the goCd(IH)
reduction response at a poCy(2,2'bithiophene)/Bf4 eCectrode
Conditions: As in Figure 4.9
The limit of detection for gold(IU), at these electrodes, was determined and using an
electrode polymerised with BF4" as the counterion, it was found that detection limits of
1 mg.L"1 could be achieved. This is comparable with that achieved using polypyrrole
with the added advantage of this polymer being the more positive potential limit
available when using it.
The mechanism of gold preconcentration at polythiophene based electrodes is
presumably the same as that seen at polypyrrole electrodes and involves the ion
exchange accumulation of gold into the polymer.
Many gold bearing ores also contain significant amounts of copper. Therefore, the
effect of copper interference upon the gold signal at this sensor was subsequently
evaluated. It was found that copper causes a significant depression of the the gold
analytical signal. Figure 4.12 shows this effect. As copper is potentially a major
interference in the determination of gold this sensor, is unacceptable.
Vage 140

ÇoCd Sensing
10|iA
i i i 500 E(mV v. Ag/AgO)
10nA
800 SOO E(mV v. Ag/AgCI)
figure 4.11 Analytical response for goCd(IH) at poCy 2,2' bithiophene
eCectrodes
a) AccumuCation at 900 m*V
b) AccumuCation at 1200 mV
Conditions: As in Figure 4.9
Vage 141

ÇoCd Sensing
[ SOOnA
I ' • I ' » • 1 1 800 500
E(mV v. Ag/AgCI)
a
SOOnA
I I I I I I • • • 800 500
E(mV v. Ag/AgCI)
b
figure 4.12 Linear Sweep Stripping VoCtammetric response for the reduction
ofgoCd(III) at a poCy(2,2'bithiophene) eCectrode
a) 6 mg.L-íAutHI) in M 'HaCC
b) 6 mg.L^Au^II) and 6 mg.L-1 Cu2+ in M 9{aCC
Conditions: Einitial = 800 mV Efinal = 0 mV tdep = 60 see Scan rate = 50 mV.s'1
From the data obtained for the polypyrrole and poly (2,2'bithiophene) electrodes it
would appear that, whilst conducting polymers are capable of preconcentrating the
Vage 142

ÇoCd Sensing
anionic gold(UI) species, the quantification of the gold reduction response is complicated
by the polymer background response. As a result of this phenomenon these polymers
are not suitable for use as gold sensors. However, in order to confirm this several other
conducting polymers were generated and screened to determine both the magnitude and
position of the gold(lH) reduction response and the relative size of this response in
comparison to the polymer background response.
4.3.3 CHEMISORBED POLY(4 VINYLPYRIDINE)
Initial studies involved investigating the voltammetric responses of the PVP modified
electrode in both a supporting electrolyte and a solution of gold(III) in supporting
electrolyte. Electrodes used in these initial studies were prepared using a technique
similar to that described by Cox and Kulesza [174]. This involved dispensing a known
volume of a 0.4% W / V solution of P V P in methanol, onto the electrode surface and
allowing the methanol to evaporate to dryness. The electrode was then dipped into
methanol 3 times, to remove any excess PVP, and allowed to dry. The dried polymer
was then protonated by exposing the electrode to 0.1 M HC1 solution for 20 minutes.
Figure 4.13 shows the response obtained for a glassy carbon electrode (Figure 4.13a), a
P V P modified electrode with no preconcentration prior to quantification (Figure 4.13b)
and a P V P modified electrode with 4 minutes preconcentration, at no appüed potential,
prior to the reductive scan (Figure 4.13c). From this figure it can be seen that no
gold(III) reduction response is obtained with an unmodified glassy carbon electrode.
The presence of P V P on the electrode surface causes a very small gold(III) reduction
peak to appear at 500 m V . The size of this peak increases dramatically if gold is
accumulated at the electrode for several minutes prior to the reductive scan (4.19c),
indicating that the preconcentration and quantification of gold(III) at these electrodes is
feasible.
Vage 143

ÇoCd Sensing
figure 4.13 ^Reduction responses for goCd(III) at
a) llnnwdifiedgCassy carbon electrode
b ) VVV modified gCassy carbon (no preconcentration)
c) WT modified gCassy carbon (4 minutes preconcentration)
Conditions:
Sample:
Einitial = 1100 m V Scan rate = 100 mV.s"1
10 mg-L"1 Au(m) in M NaCl
''final = 0 mV
Presumably this response is due to the reduction of gold accumulated at the polymer
surface as a result of the preconcentration of AuCLf at the protonated amine site on the
polymer. This can be depicted schematically by the following equation:
- c = c - -c=c -
[AuCLJ [AuClJ'
Au
Scan cathodic
(4.2)
Vage 144
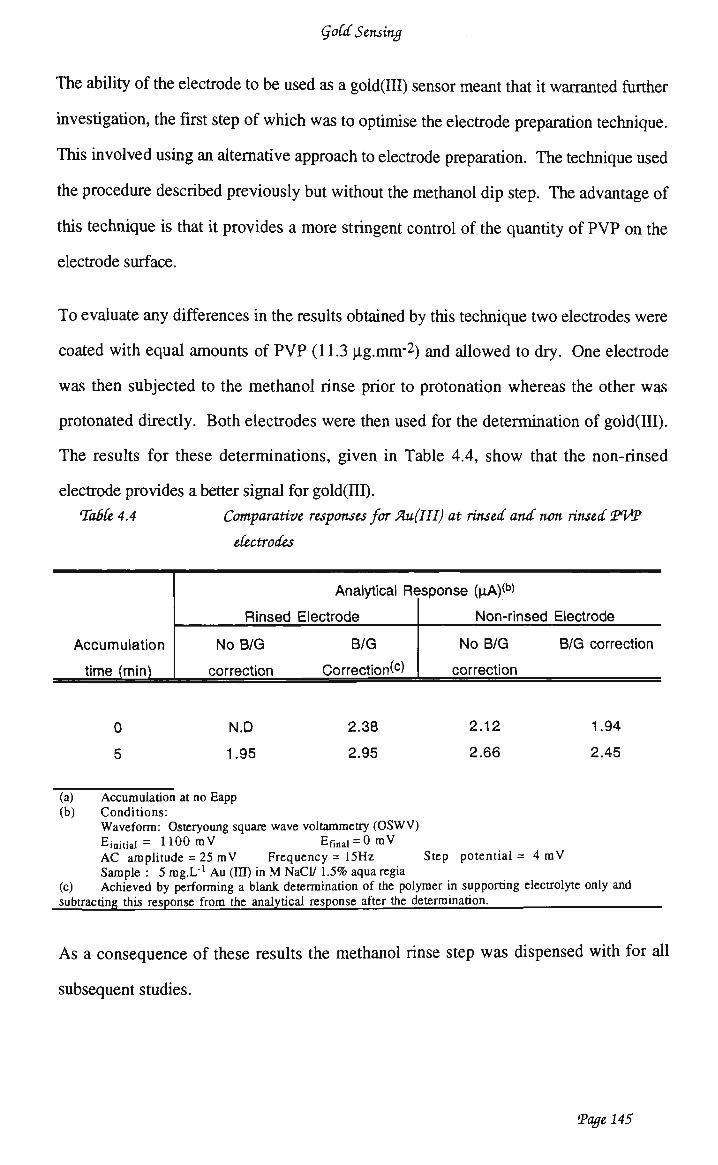
ÇoCd Sensing
The ability of the electrode to be used as a gold(III) sensor meant that it warranted further
investigation, the first step of which was to optimise the electrode preparation technique.
This involved using an alternative approach to electrode preparation. The technique used
the procedure described previously but without the methanol dip step. The advantage of
this technique is that it provides a more stringent control of the quantity of P V P on the
electrode surface.
To evaluate any differences in the results obtained by this technique two electrodes were
coated with equal amounts of P V P (11.3 p.g.mm"2) and allowed to dry. One electrode
was then subjected to the methanol rinse prior to protonation whereas the other was
protonated directly. Both electrodes were then used for the determination of gold(III).
The results for these determinations, given in Table 4.4, show that the non-rinsed
electrode provides a better signal for gold(ITI).
TabCe 4.4 Comparative responses for Au(III) at rinsed and non rinsed VW
electrodes
Accumulation
time (min)
0
5
(a) Accumulation (b) Conditions:
Analytical Re
Rinsed Electrode
No B/G
correction
N.D
1.95
at no Eapp
B/G
Correction(c)
2.38
2.95
isponse (uA)(b)
Non-rinsed Electrode
No B/G
correction
2.12
2.66
B/G correction
1.94
2.45
(c)
Waveform: Osteryoung square wave voltammetry (OSWV) Einitial = H O O m V Efmai = 0 m V A C amplitude = 25 m V Frequency = 15Hz Step potential = 4 m V Sample : 5 mg.L"1 Au (III) in M NaCl/ 1.5% aqua regia Achieved by performíng a blank determination of the polymer in supporting electrolyte only and
subtracting this response from the analytical response after the determination.
As a consequence of these results the methanol rinse step was dispensed with for ali
subsequent studies.
Vage 145
ÇoCd Sensing
4.3.3.1 Optimisation of analytical waveform
The choice of a suitable analytical waveform for the determination of gold(III) at PVP
modified electrodes was also determined. Three techniques were evaluated, these were
Osteryoung square wave stripping voltammetry ( O S W S V ) , differential pulse stripping
voltammetry (DPSV) and linear sweep stripping voltammetry (LSSV). In ali cases the
scans were preceded by 60 s accumulation at no applied potential. The responses
obtained by each technique are shown in Figure 4.14. From this figure it can be seen that
L S S V provides the most sensitive response for gold(III). As such, L S S V was the
technique used in almost ali of the subsequent w o ± .
Vage 146

ÇoCd Sensing
1100 i
500 E(mV v. Ag/AgCI)
figure 4.14 Comparison of responses for various potential zvaveforms a) Osteryoung square wave stripping voCtammetry b) Differential pulse stripping voltammetry c) Linear sweep stripping voCtammetry
Conditions: Einitial = H O O m V
OSWSV: A C amplitude = 25 m V DPSV: Scan rate = 10 mV.s'1
pulse width = 50 ms; LSSV: Scan rate = 500 mV.s'1
Ali determinations 1 minute preconcentration at no Eapp Sample: 10 mg.L"1 Au(III) in M NaCl
Efinal = 0 m V frequency = 15Hz Step potential = 4 m V pulse amplitude = 50 raV pulse period = 1000 ms
Using L S S V the effect of scan rate upon the analytical response was determined and it
was found that peak height was directly proportional to scan rate (Figure 4.15) indicative
of a surface bound species undergoing a redox change [287].
Vage 147

ÇoCd Sensing
60
50
< 40
£ 30 o D. C/3
cj
1 10 <
0 0 2000 4000 6000 8000 10000 12000
Scan rate (mV/s)
figure 4.15 Dependence of peaí^height upon scan rate forgoCd(III) at a WV
modified eCectrode
Condition: Ejnjtial = 1100 m V Efinai= 0 m V Sample: 5 mg.L"1 Au(ffl) in M NaCl/1.5% Aqua regia
The preceding scan rate studies were performed using the same electrode, regenerated
between scans. Regeneration was achieved by scanning the electrode 20 times between
the potential limits 1100 m V to 0 m V . This was done in a well stirred solution of 3%
aqua regia. At the completion of the regeneration exercise a blank determination was
performed to ensure that no gold response was evident.
During this regeneration the gold metal deposited on the electrode is reoxidised to
(AuCU)" which is subsequently exchanged out of the polymer by the anions present in
the regeneration solution. This is depicted in equation 4.3. Stirring is required to ensure
that gold is rapidly depleted from the polymer/solution interface.
ci-
cr + CAUC1/
ci
ei-
(4.3)
•(AUCI4)-
- (AuCl4)" High concentration of Cl'
-(AUCI4)-
.(AuCV
Vage 148

ÇoCd Sensing
433.2 Optimisation of analytical conditions for Chemisorbed PVP
The work described in the previous sections was performed using a starting potential of
1100 m V for the analytical determination. To further optimise the determination of
gold(UI) with the P V P electrodes the effect of altering the starting potential had on the
resulting analytical response was determined.
A PVP electrode was used to determine gold(III) in solution, starting from various initial
potentials. A s with the previous study, the electrode was regenerated between
determinations. The data obtained is given in Table 4.5 and shows that up to 1300 m V a
more positive initial potential leads to a greater analytical signal. Starting potentials of
1400 m V or greater cause irreversible damage to the polymer, presumably due to
oxidation of double bonds within the polymer backbone. This results in a significant
change in the gold reduction potential at the P V P electrode and a difficulty in
reproducibly determining the gold response. Reverting to a starting potential less than
1400 m V in subsequent determinations does not lead to a return of the original analytical
signal. This indicates that the polymer has been irreversibly damaged.
These results indicate that starting the potential scans from 1300 mV will achieve the
greatest sensitivity without causing significant damage to the polymer. Presumably the
cause for this improvement in signal is that the gold(III) anion is attracted to the
positively charged, protonated polymer, the more positive the charge the greater the
attraction.
Subsequent studies showed that continuai use of this starting potential caused a gradual
degradation of the polymer with the concomitant loss of analytical signal. Therefore a
starting potential of 1100 m V was used for ali subsequent investigations.
Vage 149

ÇoCd Sensing
TabCe 4.5 Effect of scana starting potential on goCd(III) reduction response
Starting potential (mV) Peak current (uA) Peak potential (mV)
1000
1100
1200
1300
1400 b
1.74
2.80
5.32
7.05
12.00
390
398
388
392
402 Conditions: N o accumulation period, Efinal = O m V ; Scan rate = 500 m V . s 1
Sample: 5 mg.L"1 Au(Ul) in M NaCl/1.5% aqua regia a second "oxidation" peak also seen on this determination, the appearance of this peak has been associated with irreversible damage to the polymer
4.3.3.3 Optimisation of electrode preparation
Even though the P V P electrodes studied gave an acceptable response it was possible that
an increase in sensitivity could be achieved by optimising the polymer film build.
Therefore the effect of polymer thickness on the analytical response and the linear
response range for the electrode was studied. To investigate this, a series of P V P
modified electrodes were prepared with varying polymer film thicknesses. These
electrodes were then protonated in N/10 H2SO4 for 10 minutes and subsequently used
for the determination of gold(IU). The results obtained are shown in Table 4.6
TabCe 4.6 Effect of polymer coating on analytical response!1^
Surface
concentration of
PVP (uq.mm'2)
1.4
2.8
5.7
11.3
28.3 a Conditions: wa'
^initial =
AliquOt (ul)
of 4% w/v PVP
solution
2.5
5.0
10.0
20.0
50.0 yeform: LSSV H O O m V ; Efinal= 0
Film thickness0
raV; deposition time = 60s, no applied potential
b Sample: 1 mg.L-1 Au(IH) in 3 % aqua regia c Calculated assuming a protonated film density of 1 g.cm
(um)
1.4
2.8
5.7
11.3
28.3
Scan rate =
3 [174]
Analytical response
SOOmV.s"1
(uA)
1.37
1.54
1.15
0.94
0.85
Vage 150

ÇoCd Sensing
These data indicate that increasing the amount of PVP added to the electrode surface
increases the signal. This was presumably due to the increased number of anion
exchange sites available. This effect held true up to a point, after which any increase in
ion-exchange capacity was negated by increased resistance due to the polymer film. This
increase in resistance was evidenced by the broad, drawn out gold chloride reduction
responses which were observed using thicker coatings.
The trade-off here is between ion-exchange capacity and sensitivity. It was decided to
use polymers prepared with a surface concentration of P V P within the range 2.8 -
11.3 jig/mm2 (5 - 20 u L of solution) for the calibration studies.
4.3.3.4 Calibration studies
Using electrodes prepared as described previously, the dependence of analytical signal
upon gold concentration was determined. As with previous studies it was necessary to
cycle the electrodes in supporting electrolyte between scans to removed any gold bound
to the electrode surface.
A calibration curve for gold(HI) at a P V P electrode is shown in Figure 4.16. From this
figure it can be seen that the analytical response in linear over the range 0-10 mg-L"1 with
a practical limit of detection of 1 mg.L"1. While this L O D is still no low enough it may
be improved by using thinner polymers or longer preconcentration times.
Vage 151

ÇoCd Sensing
Gold concentration (ppm)
figure 4.16
Conditions:
Electrode:
Calibration curve for Au(III) at a VW modified electrode (thicí^
polymer)
Einitial = 1100 mV Efinai = OmV Scan rate = 500 m V . s 1
60 seconds accumulation at no Eapp 5.7 mg.mm"2 P V P on glassy carbon
The calibration curve determined using a thinner polymer (2.8 p.g.mm"2 PVP) on glassy
carbon is shown in Figure 4.17. This graph shows that the analytical signal flattens out
at gold concentrations above 5 mg.L"1, presumably due to saturation of the
preconcentration sites on the polymer.
The analytical response is not linear over the 0-5 mg.L"1 concentration range. However
the calibration curve shows that it would be possible to quantify gold leveis over this
concentration range. The LOD for this electrode was approximately 0.2 mg-L"1.
Vage 152

ÇoCd Sensing
20-
< d.
Response
•
0 2 4 6 8 10
Gold concentration (ppm)
1 — ' !
12
figure 4.17 Calibration Curve for (AuCUf at a VW modified eUctrode (thinner
fiCm)
Conditions: As in Figure 4.16 Electrode: 2.8 ng.mm"2 PVP on glassy carbon
43.3.5 Copper interference
The effect of copper ions on the determination of gold was determined and it was found
that, although the presence of Cu2+ in solution caused some suppression of the gold(III)
reduction response it did not adversely affect the determination provided standard
addition techniques were used. Table 4.7 lists the analytical response for gold(III) both
with and without Cu2+ present.
Vage 153

ÇoCd Sensing
TabCe 4.7 Responses for 10mg.L-1Au(III) at VJ/V modified eCectrodes
No Cu2+ Response(uA)
(mg.L-1) with lOmg.L-'1 Cu 2 + With 20mg.L'1 C u 2 +
present present
8.47 7.56 7.26
43.4 E L E C T R O C H E M I C A L L Y G E N E R A T E D P V P (EC-PVP)
The major problem with the PVP electrodes prepared as described in the preceding
section is the modification technique used. In practice it was difficult to prepare
reproducible electrodes using the chemisorption approach to electrode modification.
Secondly, the adhesion of the modifier to the electrode surface was poor and as such the
mechanical stability of the electrodes proved to be a problem.
Both of these problems, reproducibility and stability could be alleviated, if not totally
removed, by the use of electrochemically generated polymers. Thus, it was decided to
investigate the possibility of preparing a poly(4-vinylpyridine) modified electrode by
electrochemical techniques.
43.4.1 Electrode preparation
The phenomenon of electrochemically initiated vinyl polymerisation was reported in the
early 1950's [181]. Using this approach, initiators, electrochemically generated at the
working electrode, react with the vinyl containing monomer and if conditions are right, a
polymer will deposit on the working electrode [181]. Because the film itself is an
insulator only very thin films are formed.
Initial studies were performed with a supporting electrolyte comprised of 6 0 % N,N-
dimethylacetamide and 4 0 % 0.2 M H2SO4. To this supporting electrolyte was added
5 m M 4-vinylpyridine and 1 m M divinylbenzene. A cyclic voltammogram recorded for
this solution over the potential range 0 - "2000 m V is shown in Figure 4.18 (scans a-e).
Vage 154

ÇoCd Sensing
From this figure it can be seen that on the first reductive scan (a) that a large reduction
peak centred on -1500 mV is evident. This peak decreases in size with subsequent scans
(b - c) as the electrode is coated with what appeared to be a poorly conducting polymer
layer.
1 1
0
1
50|xA
i
i i i I •
• 5 0 0
1 1 1 1 1 1 1
-1000
E(mV v. Ag/AgCI)
1 1 1 1 -1500
A a
/ » b
7 1^1 c
s/Ji d
/Üstf>r7 e
i i 1
-2000
figure 4.18 Cyclic voCtammogram for the eCectropoCymerisation of the 4-
vinyCpyridine/divinyCbenzene mvçture.
Conditions: Einitiai = 0 mV Elower = "2000 mV Eupper = O m V Scan rate = 100 mV.s"1
A steady state voltammogram of the polymer coated electrode in 0.1 M HC1 is shown in
Figure 4.19. The shape and magnitude of the voltammetric response indicate that the
glassy carbon electrode is coated with a surface layer of sorts and that this contaminant
does not have any appreciable redox responses over the potential region investigated.
Vage 155

ÇoCd Sensing
figure 4.19 Cyclic voCtammogram ofEC-WV modified gCassy carbon eCectrode in
0.1MMCC
Conditions: Einiüai = -1000 m V Elower=-1000 m V EuPp« = 1200 m V Scan rate = 100 mV.s"1
In order to ascertain which components of the polymerisation mixture were being
reduced a series of cyclic voltammograms were recorded. The N,N'*
dimethylacetamide:H2S04 supporting electrolyte was found to exhibit only a change in
baseline slope between -1000 m V and -1500 m V , presumably due to hydrogen
evolution in the acidic solution. 4-vinylpyridine in the supporting electrolyte has a
significant reduction peak at -1250 m V , however cycling the electrode potential past this
limit for a number of scans does not result in the formation of a polymer on the
electrode. This fact was confirmed by performing a cyclic voltammogram, of the
electrode scanned in the 4-vinylpyridine, in M NaCl. N o polymer response was evident
at ali. The addition of divinylbenzene to the polymerisation mixture causes the
appearance of the peak centred around -1500 m V and the formation of the polymer on
the electrode surface. Thus the polymerisation reaction would appear to involve the
formation of a reactive species by the reduction of 4-vinylpyridine however the presence
of divinylbenzene is required to achieve film formation.
Vage 156

43.4.2 Ion exchange properties
The modification scheme described above was sufficient to form a polymer on the
electrode surface. What was not clear however, was whether or not this polymer was
capable of ion exchange preconcentration.
To investigate this the electrode was cycled in a IO"5 M ferricyanide solution. It can be
seen from Figure 4.20 that on the first scan no distinctive oxidation peak is seen, the first
reductive cycle shows a significant Fe(III)/Fe(II) reduction peak after which both the
reduction and oxidation peaks increase in size with continued cycling. This increase in
peak size is caused by a gradual accumulation of ferricyanide/ferrocyanide in the
polymer. The reduction-oxidation peak to peak separation of 49 m V is less than would
be expected for a single electron transfer reaction in solution and is more in keeping with
a redox reaction involving surface bound species, albeit with polymer iR drop
contributing to the peak-peak separation. This non-zero peak-peak separation for
Fe(CN)63"/Fe(CN)64" redox transitions at P V P modified electrodes has been reported
previously [384]. These authors attribute this increase in A E p to slow electron transfer
between the electrode and the redox centres in the polymer film as well as film or
solution resistance effects.
Another indication that this response is not a solution response is the observation that a
glassy carbon electrode cycled in the same solution under identical conditions does not
exhibit any Fe(II)/Fe(III) redox responses.
Vage 157

ÇoCd Sensing
I I I I 1 I I 1 700 500 c
E(mV v. Ag/AgCI)
figure 4.20 Cycdc voCtammogram ofVJ/V modified eCectrode in 10'5M fe(CJ\Qs4'
Conditions: Ejnjtjai = 0 mV Eiower = 0 mV Eapper= 700 m V Scan rate = 100 mV.s'1
Sample: 10"*M K4 Fe(CN)6 in H 2 0 (no supporting electrolyte)
A cyclic voltammogram for an electrochemically generated PVP modified electrode in a
2 mg.L-1 gold(III) solution is shown in Figure 4.21. From this figure it can be seen that
a sharp, distinctive gold(III) reduction peak is evident at 450 mV.
Vage 158

ÇoCd Sensing
JlHA
l — l 1 I I I I I I I I I | 1200 500 0
E(mV y. Ag/AgCI)
figure 4.21 CycCic voCtammogram ofEC-WV modified gCassy carbon eCectrode in
goCd(III)
Conditions: Ejnitiai = 1100 mV, Eiower = 0 mV Eupper = 1200 mV Scan rate = 100 mV.s"1
Sample: 2 mg.L"1 Au(rH) in electrolyte
From these data it would appear that the electrochemically generated PVP electrodes are
suitable for gold accumulation and determination and warrant further investigation.
43.43 Gold determination - optimisation of potential waveform
The previous study with chemisorbed PVP, showed that the voltammetric stimulus used
during quantification significantly affected the analytical result and that, contrary to
expectations the pulsed techniques gave no improvement in signal to noise ratio.
Three voltammetric techniques were used to study the gold(III) reduction responses at
the EC-PVP electrodes. The techniques used were linear sweep stripping voltammetry,
Osteryoung square wave stripping voltammetry and differential pulse stripping
voltammetry. In ali cases the determinations were carried out with both 1 mg.L-1 and
200 Hg-L"1 Au(III) solutions and included 60 seconds preconcentration at 1100 mV prior
to the determination.
The results from these determinations are given in Table 4.8. From these data it may be
seen that at both concentrations results obtained by LSSV (at 500 mV.s"1) are superior to
Vage 159

ÇoCd Sensing
those obtained by OSWSV and DPSV. The greater signal obtained by LSSV coupled
with the "cleaner" background response (Figure 4.22) meant that L S S V was used for ali
subsequent studies.
TabCe 4.8 Responses obtained with various voCtammetric waveforms
Au(lll)
concentration
(mq.L-1)
1.0
0.1
Conditions: As in
Analytical Response (uA)
LSSV OSWSV
14 2.2
3.9 1.6
Figure 4.20 with accumulation at 1100 m V
DPSV
0.07
ND
The greater sensitivity of the linear sweep technique over the pulse techniques is contrary
to expectations and may simply be a function of the higher scan rate used.
To investigate this a LSSV scan performed at 500 mV.s-1 was compared with an
O S W S V scan performed at the same scan rate. The response for 1 mg.L"1 Au(III)
determined by these scans was 11 u A and 5.5 u A respectively, indicating that it is not
merely a scan rate effect. The increased signal observed with linear sweep techniques
may be caused by a nonfaradaic component of the analytical response. This would be
filtered out by pulse techniques.
A n alternate explanation of this observation is that pulse techniques (especially square
wave techniques) rely on the rapid reduction and oxidation of the analyte to achieve the
enhancement of the analytical signal. This cycling of gold between the oxidised and
reduced state is kinetically quite slow. This would adversely affect any potential
enhancement analytical signal to be gained from using pulsed techniques.
Vage 160

ÇoCd Sensing
JítiA
i — i — i — i — i — r
I 2HA
Ti HA
1100
500
E(mV T. Ag/AgCI)
T i 1
E(mV y. Ag/AgCI)
K(mV r. Ag/AgO)
figure 4.22 Analytical responses for Au(III) at a gCassy carbon eCectrode modified with E.C-WV a) LSSV b) OSWSV c) DVSV
Conditions: LSSV OSWSV DPSV
Sample:
Einitial=1100mV Scan rate =J&0mV.s"' A C amplitude = 25 m V Scan rate = lOmV.s"1
pulse width = 50 ms
'final = 0 m V tjep = 60 see
frequency = 15Hz Step E = 4 m V pulse amplitude = 50 m V
pulse period = 1000 m s 0.1 mg.L"1 Au(UJ) dilute aqua regia supporting electrolyte
Vage 161
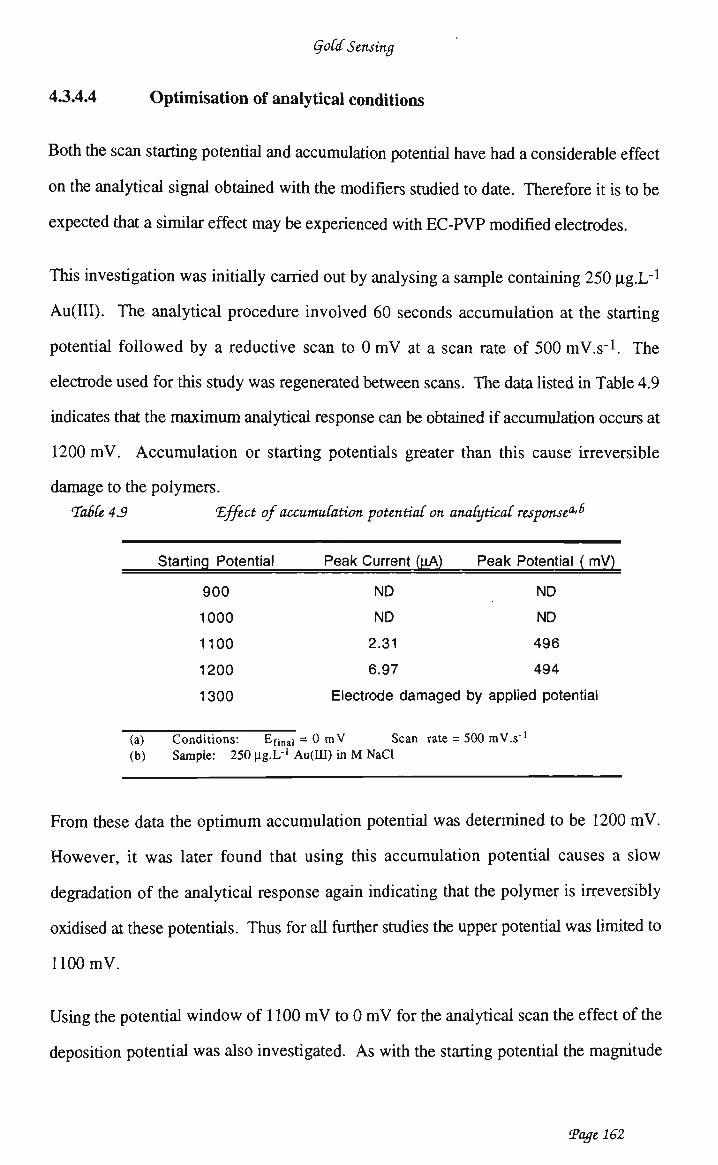
ÇoCd Sensing
43AA Optimisation of analytical conditions
Both the scan starting potential and accumulation potential have had a considerable effect
on the analytical signal obtained with the modifiers studied to date. Therefore it is to be
expected that a similar effect may be experienced with EC-PVP modified electrodes.
This investigation was initially carried out by analysing a sample containing 250 ug.L"1
Au(III). The analytical procedure involved 60 seconds accumulation at the starting
potential followed by a reductive scan to 0 m V at a scan rate of 500 mV.s"1. The
electrode used for this study was regenerated between scans. The data listed in Table 4.9
indicates that the maximum analytical response can be obtained if accumulation occurs at
1200 m V . Accumulation or starting potentials greater than this cause irreversible
damage to the polymers.
TabCe 43 Effect of accumuCation potential on analytical response^
Starting Potential Peak Current (uA) Peak Potential ( mV)
900 ND ND
1000 ND ND
1100 2.31 496
1200 6.97 494
1300 Electrode damaged by applied potential
(a) Conditions: Efinaj = 0 raV Scan rate = 500 mV.s1
(b) Sample: 250 H-g.L"1 Au(m) in M NaCl
From these data the optimum accumulation potential was determined to be 1200 mV.
However, it was later found that using this accumulation potential causes a slow
degradation of the analytical response again indicating that the polymer is irreversibly
oxidised at these potentials. Thus for ali further studies the upper potential was limited to
HOOmV.
Using the potential window of 1100 mV to 0 mV for the analytical scan the effect of the
deposition potential was also investigated. As with the starting potential the magnitude
Vage 162

ÇoCd Sensing
of response increases as the deposition potential increases. The maximum response is
obtained with a deposition potential of 1200 m V , however this causes slow degradation
of the polymer and 1100 m V was the maximum deposition potential for ali subsequent
determinations.
The electrolyte matrix used for gold deterrnination was also found to have a significant
effect on the gold(III) reduction response. Table 4.10 lists some electrolytes studied and
the results obtained. Aqua regia (3%) was chosen as the supporting electrolyte for gold
determination as it provided the best analytical signal with the least levei of background
response.
Table 4.10 Mattvc Effects
Matrix Blank response Gold responsea,b
M)
M NaCl Sloped 2.4
background
3 % Aqua regia Sloped 3.94
background
0.1 M HCI Sloped 7.99
background with a
couple of small
broad peaks
0.1 M HCIO4 destroys polymer
~(ã) Conditions: Einitial = 1100 mV Efinal = O mV Scan rate = 500 mV.s"1
(b) Sample: 100 ug.L1 Au(III)
43.4.5 Optimisation of electrode preparation
Given that the optimum conditions determined provide the best analytical response for
gold(III) there remains but one more parameter to be optimised, that is the preparation of
electrodes. It is to be expected that there will be an optimum polymer thickness, above
which iR drop across the film will cause a degradation of the analytical signal and below
Vage 163

ÇoCd Sensing
which the ion exchange capacity of the polymer will either be too low to achieve a
reasonable analytical signal or will saturate readily and possess a very limited linear
range.
Table 4.11 lists the results obtained with polymerisation solutions containing varying
amounts of 4-vinylpyridine. In ali cases the electrodes were polymerised for 5 cycles
(0 to -1500 m V and return) at 100 mV.s"1.
TabCe 4.11 The effect of varying 4-vinyCpyridine concentration in the
eUctropoCymerisation soCution on the magnitude of the Analytical
response"-'1'
4-vinylpyridine concentration Analytical Response (uA)
(mM ) c
5 not detected
15 not detected
24 17.3
33 16.5 a) Conditions:
LSSV EinitiaJ = 1100 m V Efinal = O m V Scan rate = 500 mV.s"1 Edep= 60s
b) Sample: 250 ng.L"1 Au in M NaCl c) Ali electrodes were polymerised from a solution containing 1.0 m M divinylbenzene
Increasing the number of scans during the polymerisation step was also investigated and
it was found that electrodes prepared with 10 cycles ( 0 t o - 1 5 0 0 m V ) were
approximately 5 0 % less sensitive than those prepared with only 5 cycles over the same
potential range.
From these data it can be concluded that there is an optimum film thickness for gold
determination and that this can be achieved by using a solution containing 24 m M 4-
vinylpyridine, 1 m M divinylbenzene in a 60:40 N,N'-dimethylacetamide: 0.2 M H 2 S O 4
supporting electrolyte. The polymerisation is achieved by cycling the electrode for 5
complete cycles between the potential limits of 0 m V and 1500 m V at 100 m V .s"1. The
actual thickness of the polymer formed has not been determined.
Vage 164

ÇoCd Sensing
43.4.6 Calibration studies
Using the optimum analytical conditions and electrode preparation techniques described
above calibration curves were prepared using gold(III) chloride as the analyte. The
objective of this study was to detennine both the limit of detection and response lüiearity
for this system.
The analytical response for (AuCU)" was found to be linearly dependant upon gold(III)
concentration up to 100 (Xg.L"1 after which a loss of linearity is evident. Presumably this
is due to saturation of the available ion exchange sites on the polymer. Figure 4.23
shows the calibration curve obtained for gold(III) chloride.
<
<*>
§ CL
S
8-
6-
4-
2-
0 < C
. ^ ' a
z'
/
í • i • i • i
1 100 200 300
A u (DT) concentration (u.g/L)
400
figure 4.23 Calibration curve for (AuCUfat a gCassy carbon eCectrode modified
with^CVW
Conditions: LSSV Einitial = H 0 0 m V Ef m a l=0raV Scan rate = 500 raV.s"1 tdep = 60s Edep= 1100 m V
Sample: (AuCL;)" in 3% aqua regia solution
Using this electrode and the conditions described above a LOD of 5 lig.L"1 could be
achieved.
Vage 165

ÇoCd Sensing
The recovery of gold from gold bearing ores is usually achieved with the carbon in pulp
extraction process. This process involves the dissolution of the gold into a cyanide
solution with the formation of gold cyanide. Consequenüy, it was decided to investigate
the electrochemistry of gold cyanide at a P V P modified electrode.
A cyclic voltammogram recorded for a 50 mg.L"1 gold cyanide in NaN03 (Figure
4.24a) shows a distinct gold reduction response at -500 m V , this can be attributed to the
reduction of gold cyanide to metallic gold according to:
Au(CN)2" + e" -^ Au + 2CN' (44)
The reduction potential for gold cyanide is much lower that gold chloride indicating that
this species is more difficult to reduce, and hence more stable than the chloro species.
Also, the analytical response for the cyanide complex is less sensitive than that observed
for the chloro complex.
This characteristic of the cyanide complex, coupled with the fact that any excess cyanide
in solution can potentially impede gold preconcentration necessitates the acidification of
the gold cyanide solution prior to analysis. This was achieved by the addition of aqua
regia to convert the cyanide salt to a chloride salt with the concomitant evolution of H C N
according to:
K(AuCN2) + 2HC1 ^„ K(AuCl2) + 2HCN (4 5)
A cyclic voltammogram of gold cyanide in M NaCl/3% aqua regia is shown in Figure
4.24b. The appearance of a new reduction peak at 375 m V indicates that a proportion of
the gold cyanide has been converted to the chloro complex. However, the presence of a
broad reduction peak at -500 m V suggests that there is still a significant levei of gold
cyanide present.
Vage 166

ÇoCd Sensing
I I i i i i I i i i i I i i i i I i i i i I 1100 • 500 0 -500 -1000
E(mV v. Ag/AgCI)
a
1 1 1 1 1 1 1 1 1 1 1 1 1 1 1 1 1 1 1 1 1 1 1100 500 O -500 -1000
E(mV v. Ag/AgCI)
b
figure 4.24 CycCic voCtammogram ofgoíd cyanide at a VW eCectrode
a) in M 9{a9^jp3
b) inM O^aCC/3% aqua regia
Quantification of the gold leveis was achieved using acidified cyanide solution and the
same experimental conditions as those employed for the determination of gold(III)
chloride.
A LSSV scan of a gold cyanide sample treated in this manner is shown in Figure 4.25.
The gold reduction potential has shifted by approximately 200 m V more cathodic than
the (AuCU)" reduction response. This data may indicate that the species formed is not
Vage 167
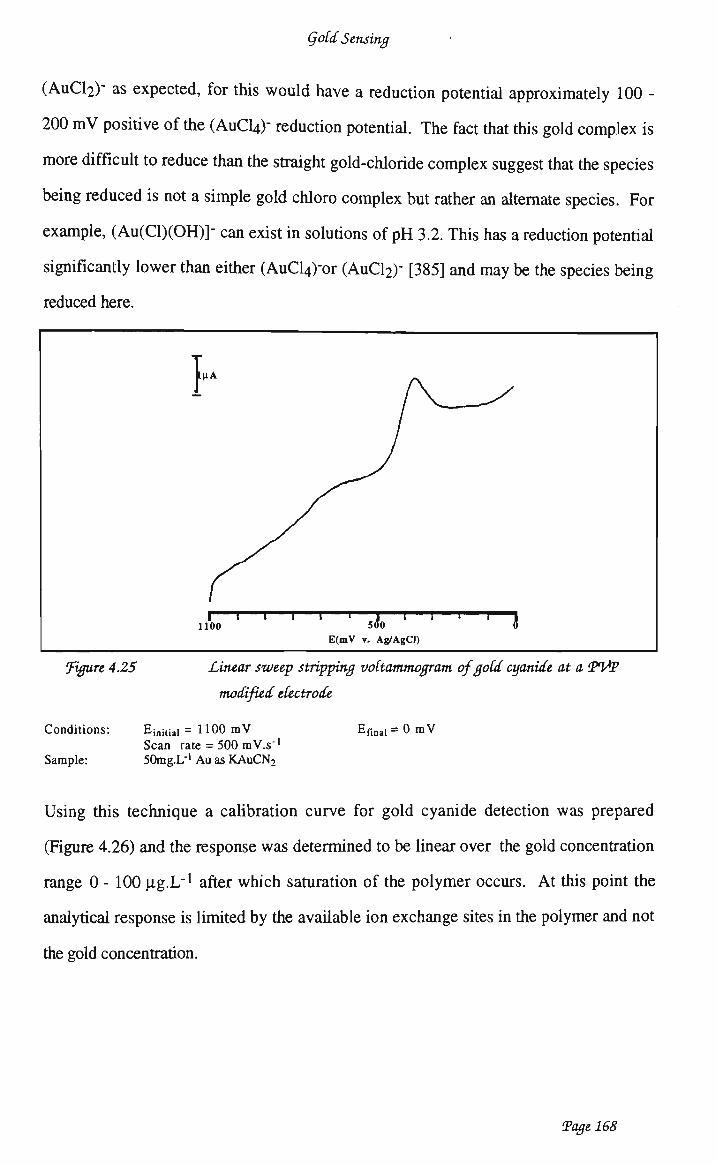
ÇoCd Sensing
(AuCh)- as expected, for this would have a reduction potential approximately 100 -
200 m V positive of the (AuCU) - reduction potential. The fact that this gold complex is
more difficult to reduce than the straight gold-chloride complex suggest that the species
being reduced is not a simple gold chloro complex but rather an alternate species. For
example, (Au(Cl)(OH)]" can exist in solutions of p H 3.2. This has a reduction potential
significantly lower than either (AuCl4)"or (AuCl2)" [385] and may be the species being
reduced here.
l 1 1 1 1 1 1 1 1 1 1 1 1100 500 0
E(mV v. Ag/AgCI)
figure 4.25 Linear sweep stripping voCtammogram ofgoCd cyanide at a VVV
modified eCectrode
Conditions: Ei„itiai =1100 m V Efmai = 0 m V Scan rate = 500 mV.s"1
Sample: 50mg.L_1 Au as KA11CN2
Using this technique a calibration curve for gold cyanide detection was prepared
(Figure 4.26) and the response was determined to be linear over the gold concentration
range 0-100 Hg.L"1 after which saturation of the polymer occurs. At this point the
analytical response is limited by the available ion exchange sites in the polymer and not
the gold concentration.
Vage 168
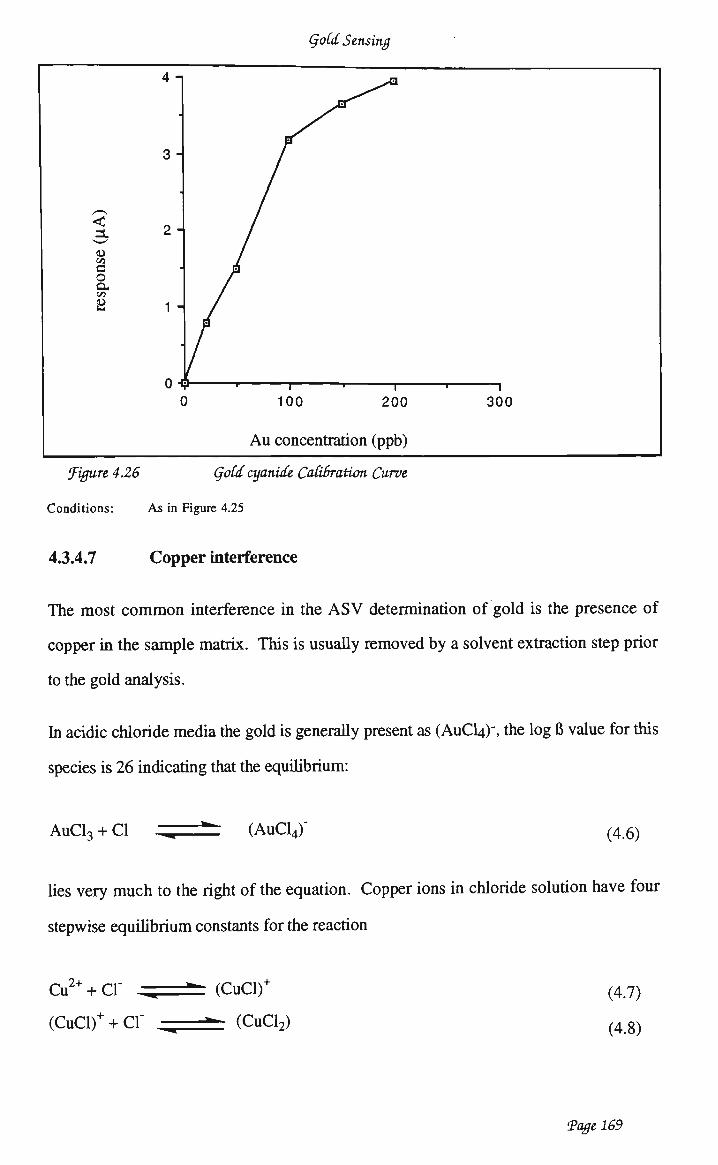
ÇoCd Sensing
< 3. C/5
c o a. 22
4-
3-
2-
1 -
0^ (
^ ^ a
r
r
? i i
) 100 200
A u concentration (ppb)
300
figure 4.26 ÇoCd cyanide Caübration Curve
Conditions: As in Figure 4.25
43.4.7 Copper interference
The most c o m m o n interference in the A S V determination of gold is the presence of
copper in the sample matrix. This is usually removed by a solvent extraction step prior
to the gold analysis.
In acidic chloride media the gold is generally present as (AuCU)", the log 6 value for this
species is 26 indicating that the equilibrium:
AuCl3 + Cl (AuCLJ' (4.6)
lies very much to the right of the equation. Copper ions in chloride solution have four
stepwise equilibrium constants for the reaction
Cu 2 + + Cl - ^ (CuCl)+
(Cuci)+ + cr ^ (Cuci2)
(4.7)
(4.8)
Vage 169
ÇoCd Sensing
(CuCl2) + Cl" ^
(CuCl3)" + cr -^
(CuCl3)"
(CuCl4)"
(4.9)
(4.10)
The log 6 values for these reactions are 0.98, 0.69, 0.55 and 0.0 respectively, indicating
that the favoured species in chloride media is the C u 2 + species.
The situation in cyanide media is somewhat different with the log B values for (AuCN2)"
and (AuCN 4)- being 38.3 and 56 respectively. For copper, the species CuCN2,(CuCN3)-
and (CUCN4)2- have log B values of 24, 28.6 and 30.3. Thus, in a cyanide solution both
anionic gold and copper species would be present.
This information suggests that with a judicious choice of supporting electrolyte (i.e. high
Cl" concentration) it should be possible to determine gold with little or no interference
from copper.
A calibration curve was prepared using a series of gold standards in a matrix of
0.1M HC1 containing 5 mg-L"1 Cu 2 + . It was found that, in contrast to sample containing
only gold, the analytical response was not linear. However, this deviation from linearity
did not render the response unusable as the calibration curve (Figure 4.27) shows.
12-
10-
8-
«
§ O. 4 -«3
D 1-1
2-
0 100 200 300 400 500 600
Gold concentration (ppb)
figure 4.27 Calibration curve for Au(III) in the presence of 5 mgL,'1 Cu2*
Conditions: As in Figure 4.25 Sample: Au(III) in 0.1M HC1 with 5 mg.L"' Cu2+
Vage 170

ÇoCd Sensing
The effect of cyanide in this solution was also investigated and it was found (Table 4.12)
that the addition of 1 m g X " 1 C N " to an acidified solution containing 100 ug.L"1 Au(III)
caused a significant drop in the analytical response and a 62 m V cathodic shift in the gold
reduction potential.
TabCe 4.12 Effect of cyanide on goCd reduction responsa
Cyanide Response Reduction
concentration (uA) potential
mq.L-1 (mV)
0 3.0 420
1 1.3 360
2 1.2 340
5 1.4 330 a Conditions: as in Figure 4.25 b Sample lOOug.L-1 AuÇUI) in 0.5M HC1
The shift in reduction potential with the addition of cyanide is consistent with the
formation of a new species in solution, a species more difficult to reduce than (AuCU)"
By implication this species probably contains CN".
The major shift in reduction potential and peak response suggests that the equilibrium is
established immediately upon the addition of the first aliquot of CN" and further
additions of C N " do little to alter this equilibrium. The probable scenario is that the
excess cyanide merely reacts with the HC1 and liberates H C N . The addition of copper to
this solution also causes a significant decrease in the gold response. It would therefore
appear that in order to achieve the maximum response for gold in a cyanide médium
mere acidification is insufficient. Thus the cyanide needs to be destroyed by using either
oxidative conditions or U V radiation to aid the degradation process.
The only other interferences to be investigated were Ag and Pt, both of which can exist
as anionic chloro complexes in a high chloride media. Figure 4.28 shows a L S S V scan
for a solution containing 100 p-g.L"1 each of gold and platinum.
Vage 171

ÇoCd Sensing
I I i I i « | I I I l | 1100 500 0
E ( m V v. Ag/AgCI)
figure 4.28 LSSV scan of goCd (III) and Vt at poCy(4-vinyCpyridine eíectrode)
Conditions: As in Figure 4.25
Responses were detected for both gold (456 m V ) and platinum (168 m V ) . However the
response for either metal was lower than that determined for each metal individually as
both are competing for the same total number of ion exchange sites on the polymer.
Silver gave no response at ali.
4.4 CONCLUSION
The preceding studies have shown that there is a significant degree of interaction between
the gold(III) anion and most of the conducting polymers studied. The mechanism of this
interaction appears to be ion exchange of the gold chloro anion into the polymer.
Although this interaction can be used to preconcentrate gold into the polymer. It is not
possible to use conducting polymer based C M E s for gold sensing as the background
response for the polymer swamps any analytical response present.
Secondly, the detection of gold(III) at poly(4-vinylpyridine) modified CMEs has been
demonstrated to be viable. Presumably the interaction of gold with this polymer is
Vage 172

ÇoCd Sensing
through the protonated amine groups present in the polymer structure. The preparation
of these sensors may be achieved by two methods. The first involves the chemisorption
approach whereby the polymer is dissolved in a suitable solvent, an aliquot of solution
placed on the electrode and the solvent left to evaporate. The advantage of this approach
is that electrode modification is simple and surface concentrations of P V P are easily
altered. The disadvantage is that using this modification technique it is difficult to
reproducibly modify electrodes. In terms of improved reproducibility a better approach
to electrode modification is the use of electrochemically generated PVP. This has been
shown to exhibit the appropriate ion exchange properties to make it suitable for use as a
gold(HI) sensor with the electrode preparation technique being more readily controlled
and more reproducible.
Studies of potential interferences have shown that those species that form stable anionic
complexes, in the supporting electrolyte being used for the gold determination, will
interfere with the gold detection by virtue of the fact that they compete with the gold
anion for the available ion exchange sites on the polymer electrode. A judicious choice
of electrolyte conditions may mútimise this effect.
Vage 173

Mercury sampdng
CHAPTER 5 COLLECTION OF MERCURY AT CHEMICALLY MODIFIED RVC
5.1 INTRODUCTION
Chapter 3 of this thesis dealt with the use of chemically modified electrodes in
the determination of methylmercury. The techniques used in this work rely on
the chemical and electrochemical interaction of the analyte with the electrode
modifier. It is entirely feasible that such reactions, provided they can be scaled
up, could provide the basis of a solid phase adsorbent for the preconcentration
of mercury species from aqueous systems.
5.1.1 SAMPLING OF MERCURY FROM AQUEOUS SYSTEMS
The stability of mercury compounds in aqueous samples has been studied by a
number of workers [12,13, 386]. To minimise losses of inorganic mercury it
is suggested that the sample be adjusted to a low pH, high ionic strength
oxidising environment and that ali samples be stored in glass containers only
[12].
Attempts to preconcentrate mercury from solution using solid phase extraction
prior to quantification have used several different supports. Koshima and
Hiroshi [88] have used activated carbon as the preconcentration médium.
These authors claim 9 7 % collection effíciency for inorganic mercury and 8 7 %
for methylmercury. Once collected the mercury was quantitatively determined
by graphite furnace atomic absorption spectroscopy.
Vage 174

Mercury sampdng
Preconcentration onto dithiocarbamate functionalised resins has been used by
several authors [71, 72, 78, 79]. Minogawa et ai. [71] used a commercial
dithiocarbamate resin, Sumichelate Q10, for the collection of mercury from
ri ver water and fresh water samples. These authors report essentially
quantitative collection of mercury over a wide p H range. Quantification of
mercury, once collected, was achieved by cold vapour atomic absorption
spectroscopy ( C V A A S ) . A more recent study of this resin by Lansen et ai.
[72] has reported results that conflict with those presented previously. Whereas
Minagawa found rapid, quantitative preconcentration of mercury over a wide
p H range, the recent study reports rapid adsorption of 9 0 % of the mercury
present but states that 20 hours is required to achieve 9 7 % removal. This study
also found that p H was more criticai than initially indicated with collection
being optimum within the 4 -10 p H region.
Using identical conditions to the previous study, Hansen found a 12.5% loss of
mercury during sampling, compared with no losses seen on the initial studies.
The reason for the discrepancies may be that the reagent blanks in the earlier
study were of the same order of magnitude as the samples being analysed.
Also the limit of detection quoted in the latter study (2 ng.L"1) appears to be
significantly lower than that achieved in the initial work.1
Brown et ai. [79, 78] have manufactured polyurethane disks loaded with
diethylammonium diethyldithiocarbamate, these authors found that is was
necessary to include a plasticiser (a-dinonylpthalate) to the derivatisation
mixture to achieve quantitative mercury retention at higher flow rates [79]. The
mechanism of collection enhancement was not discussed in either paper.
Quantitation is achieved by X R F , and it is interesting to note that these authors
1 These authors quote a 0.2 ngL"l L O D for their method. This involves a 20 L to 30 m L
preconcentration step which would imply a L O D for the determination step of <= 133 ngL" .
Vage 175

Mercury sampdng
report quantitative elution of the Hg dithiocarbamate complexes from the foam
using acetone.
Other methods of mercury preconcentration include amalgamation onto silver
or gold [387, 388] solvent extraction [312] and extraction onto sulphydryl
cotton [76].
5.1.2 AIM AND SCOPE
It can be seen from the introductory information that, although there has been a
great deal of activity in the field of mercury collection, there is still scope for
improvement. O f particular interest here is the application of chemically
modified electrodes to this application.
To achieve this requires the use of processes combining both an electrochemical
and a chemical collection mechanism to enhance collection efficiencies. This
can be achieved in either of two ways,
(i) Chemical step (eg. complexation) followed by an electrochemical
process (eg. reduction of the mercury collected)
O R
(ii) Electrochemically enhanced chemical step, for example the
application of a potential may enhance a complexation reaction, by
altering the charge density at the point of interaction.
With the appropriate choice of electrode modifier it is possible to develop a
sampling electrode with surface chemistry mimicking that found in
conventional solid phase adsorbents. The analyte-electrode interactions may be
further altered by the application of a potential to the electrode. In a manner
analogous to the preconcentration step in a stripping voltammetric technique,
the application of a preconcentration potential may change the electrode surface
to favour analyte-electrode interactions. This may come about as a result of
changes in polymer hydrophobicity, changes in charge density on functional
Vage 176

Mercury sampdng
groups or simply changes in polymer morphology brought about by the
application of a potential.
Therefore, this work has dealt with the modification of reticulated vitreous
carbon (RVC) cartridges to provide polymer modified cartridges for use in the
collection of mercury. The effect of applied potential on the polymer-analyte
interactions has also been studied in order to ascertain whether this variable
affects the collection efficiency at these electrodes.
5.2 EXPERIMENTAL
5.2.1 REAGENTS AND SOLUTIONS
Ali reagents used were A.R. grade unless otherwise specified. Mercury (II)
standards (1000 mg.L"1) were prepared by dissolving the requisite amount of
H g O in a minimum of nitric acid and diluting to volume. Ali working
standards were made by serial dilution of this standard.
Electrode modification solutions and techniques are described in chapter 2 of
this thesis.
5.2.2 EQUIPMENT
Sampling experiment were performed using the sampler cell and controllers
developed as part of this project. The general configuration used is shown in
Figure 5.1.
Vage 177
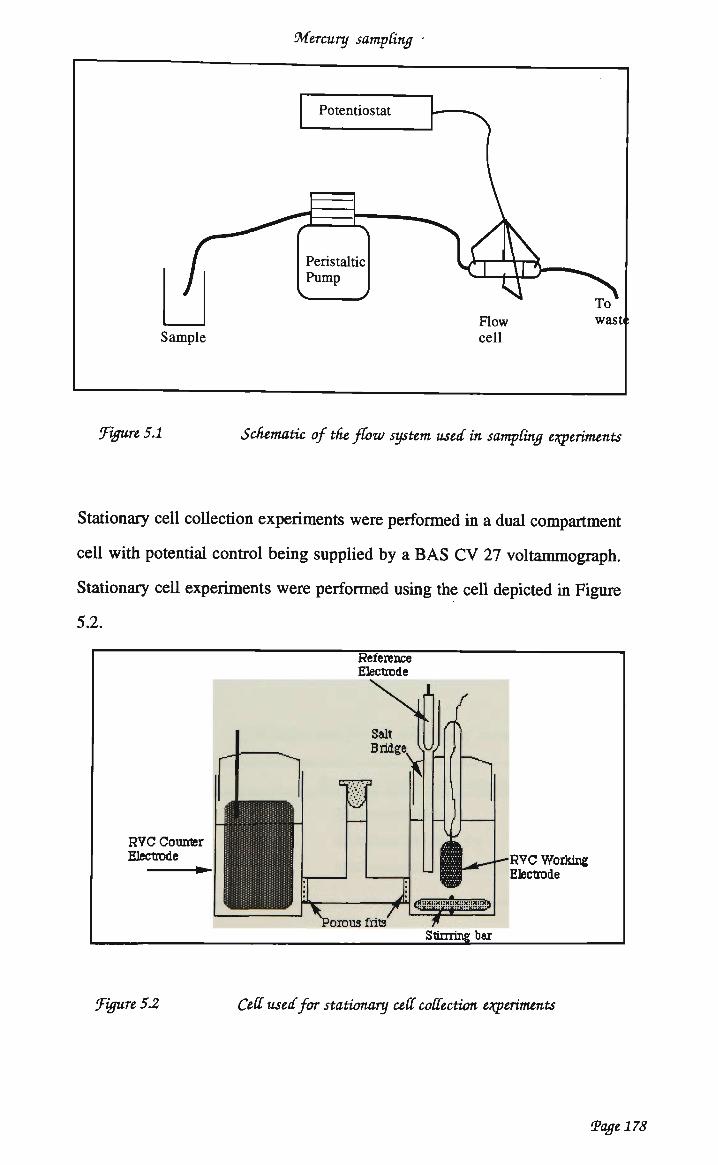
Sample
Mercury sampdng
Potentiostat
Peristaltic Pump
figure 5.1 Schematic of the fCow system used in sampdng experiments
Stationary cell collection experiments were performed in a dual compartment
cell with potential control being supplied by a BAS CV 27 voltammograph.
Stationary cell experiments were performed using the cell depicted in Figure
5.2.
R V C Counter Electrode
» •
Reference Electrode
•RVC Worjdng lElectrode
5orou3 frio Stiming bar
figure 5.2 Cell used for stationary ceCl coClection eTçperiments
Vage 178

Mercury sampdng'
Voltametric measurements were Performed on either a BAS 100A
electrochemical analyser (Bioanalytical Systems, West Lafayette), a B A S
C V 27 voltammograph or an ElectroLab system (Chapter 7).
5.2.3 CARTRIDGE MODIFICATION
Electrode modification was achieved by the techniques described in Chapter 2.
Typically, electrodes were punched from a sheet of R V C using a laboratory
cork borer. Once formed, the electrodes were boiled in concentrated nitric acid
to remove ali surface contamination after which they were rinsed with copious
amounts of Milli Q water. Electrodes were stored in Milli Q water until
derivatisation or use.
Prior to use RVC cartridges were sealed in a sleeve of heat-shrink teflon tubing
(Unasco, Sydney, Austrália). Ali tubing was soaked in concentrated nitric acid
overnight and rinsed thoroughly with distilled water prior to use with the R V C .
The various electrodes used and expected collection mechanism are listed in
Table 5.1.
TabCe 5.1 Cartridges used for the coCCection of mercury
Electrode Expected collection mechanism
RVC
PP/dtc"
Electrodeposition
Complexation with the
dithiocarbamate functional group
Vage 179

Mercury sampdng
5.3 RESULTS AND DISCUSSION
5.3.1 SAMPLER DEVELOPMENT
The development of an electrochemical preconcentration system required the
combination of four components, being;
(i)
(ii)
(iii)
(iv)
T h e sample delivery system.
T h e sampling electrode.
T h e sampler cell.
T h e electrochemical controller.
A perstaltic p u m p has been used as the sample delivery device throughout this
work. Items (ii) to (iv) were developed as part of this project. T h e
development of the sampling hardware and electrode optimisation is detailed in
reference 388. T h e final sampler cell design is s h o w n in Figure 5.3.
1 R Reference electrode
"3 Sample inlet ÍY. Electrode £-*-
^—-J| tvj ••••••••• w »IV-
' "Si Working electrode contact
Working electrode contact
LLf^e
Z^n^l _ Sample outlet
J1—1
Auxiliary electrode
figure 53 The final sampCer ceCl design
5.3.2 COLLECTION AT R V C
Initial studies of plain R V C as a collection médium involved determining the
voltammetric behaviour of mercury at R V C . At higher scan rates a broad
Vage 180

Mercury sampdng
reduction peak is seen at «0 m V . Oxidation peaks at 380 m V and 540 m V
confirm that H g has been deposited onto the R V C surface. A cyclic
voltammogram recorded at a slower scan rate 10 mV.s- 1 has a well defined
mercury reduction response at «150 m V , and the oxidation responses at
350 m V and 516 m V . The presence of 2 oxidation peaks for mercury has been
reported previously [389]. In this work the peaks were attributed to the
oxidation of mercury on mercury and mercury on glassy carbon. The fact that
a well defined reduction response can only be seen at a slow scan rate would
indicate that the rate of mercury reduction is slow or that cell resistance is high.
However, given that this determination was carried out using M N a N 0 3 as the
supporting electrolyte and a large área cylindrical Pt gauze electrode as the
counter electrode it may be assumed that cell resistance is minimal. Also
evident on this voltammogram is the cross over of the forward and reverse
scans at -750 m V . This voltammetric feature is commonly associated with the
nucleation and growth of a metal deposit. Presumably in this case it is due to
the further electrodeposition of mercury.
From these data it can be concluded that mercury could be collected onto R V C
at a collection potential <150 m V .
To study the effect of potential on mercury collection in a flowing cell, a series
of samples were run through the sampler at different collection potentials. The
deposition of mercury was greatest (95%) at -1000 m V (Figure 5.4), although
at this potential there were considerable quantities of oxygen evolved at the
counter electrode. Presumably, this low potential is needed because of the
effects of the cell iR drop.
Vage 181

Mercury sampdng
100-
80 -
% 60-U>
U
s O •a 40-> o S Ui
# 20 -
400
^ _ ^ _
r~^ "
/
200 0 -200 400 -600 -800 Í000
Collection potential (mV Vs. Ag/AgCI)
figure 5.4
Sample: Flow rate:
CoCCection efficiency of mercury (II) on RJ/C at various
potentials
10 m L of 1 ug-L^Hg2* in M NaNC>3 1 mL.min"1
Subsequent investigations used a sampling potential of -600 m V as this
allowed mercury collection to proceed without the generation of oxygen at the
auxiliary electrode. This was achieved with a slight reduction in sampling
efficiency (decreased to «85%).
Using this sampling potential the effect of flow rate upon sampling efficiency
was evaluated. It can be seen from Figure 5.5 that an increase in sample flow
rate caused a significant decrease in sampling efficiency. This was presumably
due to a combination of the slow rate of mercury reduction and the relatively
short residence time of the sample in the preconcentration cell at the higher flow
rates. Thus, plain R V C cartridges were deemed unsuitable for mercury
collection.
Vage 182

Mercury sampdng
90
30
g 70 9
% 60
i-E a (O 40 *
30
J^ure 5.5
Effect of flow rate upon sampling efficiency
1 2 Flow rate (ml/min)
Effect offíow rate upon sampdng efficiency
Sample: Eapp:
50 mL 0.2 ng.mL"1 Hg2 + in M NaNC>3 -600 m V
533 COLLECTION A T POLYPYRROLE MODIFIED ELECTRODES
The preceding collection regimes rely on reduction to immobüise the mercury
as such, no speciation data can be collected, thus it was considered that altemate
collections mechanisms may be appropriate in some circumstances. To study
this approach the collection of mercury at a variety of polymer modified
electrodes was studies.
The synthesis of the polymer modified electrodes used in this work is detailed
in Chapter 2. Based on the previous studies of mercury-dithiocarbamate
interactions it was decided to investigate the use of polypyrrole modified RVC
containing diethyldithiocarbamate anions within the polymer. The extremely
high equilibrium constant for the mercury - dithiocarbamate complexes, [391]
would also suggest that this is a valid approach. Throughout this study the
dithiocarbamate derivatised cartridges used, were produced by the ion exchange
derivatisation of polypyrrole chloride to produce polypyrrole with
diethyldithiocarbamate anion (dtc) as the counterion in the polymer. This
Vage 183

Mercury sampdng
reaction is thought to occur through the displacement of the chloride anion,
incorporated into the polymer during synthesis, by the diethyldithiocarbamate
anion from solution. This process may be depicted schematically by the
following equation:
N \
^CMXKH Sook is a ntumed
dithíocarbamaie wJanoo
(5.1)
Initial studies were aimed at investigating the voltammetry of H g at
polypyrrole/dtc electrodes in a stationary cell. This was followed by mercury
collection in both stationary and flow through cells. A typical voltammogram
of PP/dtc in M NaCl is shown in Figure 5.6.
Vage 184

Mercury sampdng
I lOOnA
500
T ÍOO^A
500
" I ' r
-500
E(mV v. Ag/AgCI)
I I I I I
0 E(mV v. Ag/AgCI)
-500
I •1000
•1000
figure 5.6 VoCtammogram ofW/dtc in M 9{aCC
Conditions Einitial = 0 m V Eupper = 500 m V
Elower =-1000mV Scan rate = 100 mV.s"1
Of particular interest to this study is the voltammetric behaviour of the polymer
during the first negative going scan. From Figure 5.6 it can be seen that the
Vage 185

Mercury sampdng .
response at PP/dtc is extremely low, which, when considered in the light of
other polypyrrole voltammograms, would imply that the polymer
electroactivity is very low. At an applied potential of -700 m V a reduction
response commences. This peak, centred around -850 m V can be attributed to
the expulsion of dtc anions from the polymer, presumably due to the fact that,
as a consequence of derivatisation, the mobile counterion incorporated during
the polymerisation process is displaced by the less mobile
diethydithiocarbamate anion. The fact that the polymer conductivity returns as
the polymer is cycled in M NaCl would tend to support this hypothesis.
During the cycling (at highly negative potentials) the dithiocarbamate anion is
expelled and replaced by a chloride anion. As this occurs the polymer
electroactivity returns, as evidenced by the well separated positive and negative
going scans on the cyclic voltammogram(Figure 5.6b).
The addition of mercury (II) ions (50 ug.mL"1) to the solution causes some
change to the cyclic voltammogram for PP/dtc. The most significant
differences being the suppression of the dtc oxidation peak and the failure of the
voltammogram to revert to the more typical shape.
The first of these differences is presumably due to the formation of the mercury
dithiocarbamate complex, the oxidation potential of which is higher than that of
the free dithiocarbamate. The second occurs because the mercury
dithiocarbamate complex is less soluble than the free dithiocarbamate ligand
and as such may impede any ion exchange with the chloride in solution. This
in turn means that the mechanism by which conductivity increases is impeded,
hence no significant change in the shape of the cyclic voltammogram.
What is interesting however, is the lack of any specific response due to either
mercury or the mercury dithiocarbamate complex. The lack of a reduction
response for the dithiocarbamate complex was particularly surprising however
Vage 186

Mercury sampdng .
it was felt that this may be the result of having insufficient mercury on the
electrode. To test this hypothesis a PP/dtc electrode was soaked for 30 minutes
in a 100 u^.mL"1 mercury (II) solution, to ensure saturation of ali available
dithiocarbamate sites on the electrode, after which a cyclic voltammogram in
M NaCl was recorded. This is shown in Figure 5.7.
| — r — i — i — i — | — n — l — l — | — i — 1 — i — i — | 500 0 -500 -1000
E(mV v. Ag/AgCI)
figure 5.7 CycCic voCtammogram of a W/dtc eCectrode in M 9{aCC
after 30 minutes in 100 rngJs1 íHg2* soCution
Conditions: Einitial = 0 mV Eiower=-1000 mV Eupper = 5 0° m V S c a n rate 1 0 u mV.s"1
As with the previous test no distinct mercury response was seen. The CV was
essentially the same as that recorded for PP/dtc in a mercury solution. The fact
that the voltammogram does not rapidly interconvert to that for a more
conductive polymer suggests that the mercury (II) is bound at the surface and
inhibiting anion movement.
Vage 187

Mercury sampdng
Despite the fact that no electrochemical response was seen for the mercury
using the PP/dtc electrode it was decided that, given the known affinity of
mercury for the dithiocarbamate group [391], this approach to mercury
collection was worthy of further investigation in a stationary cell. The data in
Figure 5.8 indicates the results obtained for the collection of mercury onto
PP/dtc coated RVC electrodes in a stationary cell.
fr 3 O Ul
<u e (+H
O
13 > o
e u «
#
100-
90-
80-
70-
60 J
50-
40-
30-
20-
10-
C
^"-"^3^s.
ff^^ ^^^» -̂ ""fl
TT| / ld
1 " 1 • 1 • 1
- 200 - 400 - 600 - 800
Applied potential (mV Vs Ag/AgCI)
i
- 1000
figure 5.8 CoCCection ofülgat W/dtc in stationary ceíl
Sample: 25 mL 100 ug.L"1 Hg2+ in M NaCl 10 minute collection period
The collection time in this experiment was deliberately kept short to ensure that
there would be less than 100% collection Hg2+ in ali cases. This meant that
differences in collection rate would be measurable. From this figure it is seen
that adequate collection occurs within the potential region -300 to
-700 mV. Using this data the collection work was continued using the flow
Vage 188
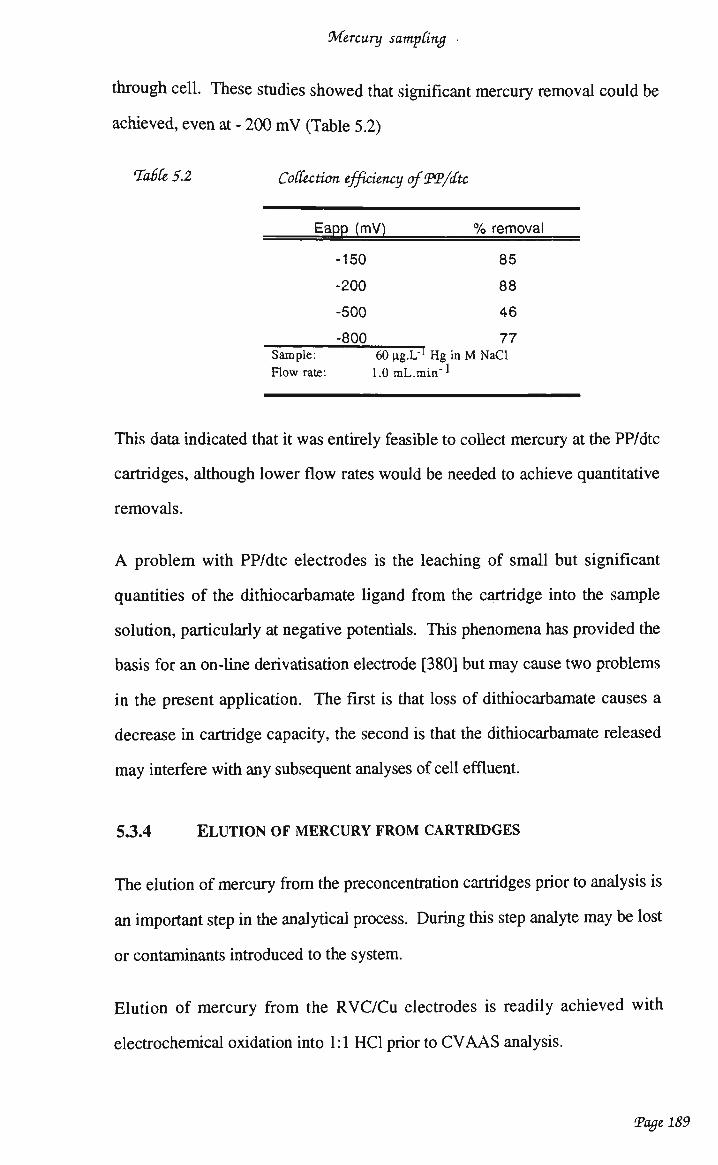
Mercury sampdng
through cell. These studies showed that significant mercury removal could be
achieved, even at - 200 m V (Table 5.2)
TabCe 5.2 CoClection efficiency ofW/dtc
Eapp (mV) % removal
-150 85
-200 88
-500 46
280Ç) 77 Sample: 60 ng.L"1 Hg in M NaCl
Flow rate: l.OmL.min"*
This data indicated that it was entirely feasible to collect mercury at the PP/dtc
cartridges, although lower flow rates would be needed to achieve quantitative
removais.
A problem with PP/dtc electrodes is the leaching of small but significant
quantities of the dithiocarbamate ligand from the cartridge into the sample
solution, particularly at negative potentials. This phenomena has provided the
basis for an on-line derivatisation electrode [380] but may cause two problems
in the present application. The first is that loss of dithiocarbamate causes a
decrease in cartridge capacity, the second is that the dithiocarbamate released
may interfere with any subsequent analyses of cell effluent.
5.3.4 ELUTION OF MERCURY FROM CARTRIDGES
The elution of mercury from the preconcentration cartridges prior to analysis is
an important step in the analytical process. During this step analyte may be lost
or contaminants introduced to the system.
Elution of mercury from the RVC/Cu electrodes is readily achieved with
electrochemical oxidation into 1:1 HC1 prior to C V A A S analysis.
Vage 189

Mercury sampdng
Elution of mercury from the PP/dtc cartridges is somewhat more difficult.
Initial work with electrochemical oxidation into various acids was hampered by
high reagent blanks. This was finally rectified and it was found that for ali
reagents used, blank leveis were less than 10 U-g-L"1 (Table 5.3).
TabCe 53 'BCankjevtCs
Elution Potential (mV) Eluting acid [Hg] in 25 mL elution
0 1:1 H2SO4 <10ppb
+500 1:1 H2SO4 <10 ppb
+1000 1:1 H2SO4 <10ppb
+500 1:1 HCI <10ppb
+1000 HCI <10ppb
Oxidative elution into 1:1 HCI was investigated first and it was found that
recovery efficiency was quite variable and at the best only 80 - 9 0 % efficient.
Elution into 1:1 H 2 S O 4 also proved to be problematic, suffering the same
shortcomings as the previous method. The addition of a small amount of
K M n 0 4 to the 1:1 H2SO4 used for elution improved the recoveries such that
they were generally in the 90 - 9 5 % efficiency range when dealing with
laboratory solutions. Presumably the permanganate aids in the oxidation of the
dithiocarbamate ligand.
5.3.5 COLLECTION OF REAL SAMPLE
The application of the sampling electrode developed to the collection of mercury
from an industrial effluent was considered.
For this work samples of effluent were obtained from ICI (Botany, Austrália).
Typically the effluent contained:
Vage 190

Mercury
Hg:
pH:
NaCl:
Other constituents:
various colloidal solids
organics:
' sampdng
=50 ng.L"1 (range >10 to < 100)
= 11
4 - 5%
CaC03l CaS04, Ca(OH)2, MgC03,
MgS04, Mg(OH)2, Fe(OH)3
up to 300 mg.L"1 of which
approximately 50 mg.L'1 are
volatiles. Also high in surfactants
with some PVC powder present
NaOCI: up to 10 mg.L"1
This effluent is high in organic interferents. These are known to affect
electrodeposition [392] processes in an adverse manner. Thus the application
of PP/dtc electrodes to this problem was investigated.
What was not evident however was the effect organics may have on collection
with these cartridges and, given the previous success with collection synthetic
samples it was decided to proceed to effluent samples, restricting the applied
potential to a negative limit of -400 m V to minimise leaching of the
dithiocarbamate anion. The results of this study are shown in Table 5.4.
These experiments show that there are components of the sample matrix which
are adversely effecting the collection of mercury. This is in some ways quite
surprising, as the formation constants for mercury dithiocarbamate complexes,
even Hg(dtc)+, are quite high [341a]. It should be noted, however that these
collection efficiencies are much better than those obtained with R V C (sampling
standard solutions only) especially given that these studies were performed with
non-acidified effluent. Presumably the formation of mercury dithiocarbamate
complexes at the electrode is easier to achieve than the reduction of mercury in
this media. The acidification of the samples prior to collection of mercury
caused a significant drop in sampling efficiently (about 20 - 3 0 % decrease).
Vage 191

Mercury sampdng
This may be due to the instability of dithiocarbamate in acid solution causing a
significant drop in the number of collection sites available on the electrodes.
TabCe 5.4 Collection of mercury from industrial effCuent with W/dtc
cartridges
Sample Details
125ug.L"1 Hg
(25 mL sample)
as above
as above
as above
as above
*i.e.: <10uo.L"1 Hq2+in
Applied Potential
0
-100
-100
-200
-400
cell effluent
% Removal
>92*
>92*
84
>92*
92
5.4 CONCLUSIONS
The preceding studies have shown that the collection of mercury at unmodified
R V C electrodes is far from satisfactory. The use of dithiocarbamate derivatised
polypyrrole electrodes has also been studied. These electrodes have been
shown to be suitable for mercury collection, particularly in solutions containing
organic species that m a y interfere with electrodeposition of mercury onto an
electrode.
T o achieve quantitative or near quantitative collection of mercury requires
sample flow rates of approximately 1 mL.min"1. This m a y limit the
applicability of this preconcentration method. These studies have also shown
that the application of a preconcentration potential to the C M E will alter the
sampling efficiency of the electrodes studied. In the case of PP/dtc electrodes
the optimum potential is less negative than that required for the collection of
Vage 192

Mercury sampdng .
mercury on an RVC electrode but sufficiently negative to reduce any mercury
collected at the electrode.
Also, the application of the negative potential may increase the negative charge
density at the dithiocarbamate groups and thus improve collection efficiency.
The problem with applying the negative potential to the PP/dtc electrodes is that
it causes a small but discernible amount of leaching of the dtc" anion from the
cartridge thus limiting the applicability of such a system. The use of
dithiocarbamate functionalised polymers, prepared in a manner similar to that
used in the preparation of the mercury sensor (chapter 3), may be suitable way
to circumvent this problem.
Vage 193

ÇoCd Sampdng
CHAPTER 6 COLLECTION OF GOLD AT POLYPYRROLE MODIFIED RVC
6.1 INTRODUCTION
As was the case with mercury, an alternative to gold detection is to obtain samples from
the appropriate collection point and transport these to a laboratory for treatment and
analysis. This is not a problem if the sampling point and laboratory are relatively close to
each other. However, particularly in the case of geochemical exploration, sampling point
and analytical laboratory may be separated by thousands of kilometres [139].
In this case the transport of bulky liquid samples becomes a difficult and expensive
exercise. A suitable solution to this problem is to collect the gold onto a small volume of
solid phase adsorbent and transport this for analysis. The advantage of this is that whilst
the gold is being collected onto the adsorbent it is also being preconcentrated thus making
subsequent detection easier.
6.1.1 PRECONCENTRATION TECHNIQUES
The preconcentration of gold from aqueous samples has been achieved by a number of
techniques. Solvent extraction of gold(III) into organic solvents has been used as the first
step in the A S V determination of gold [351, 357] or as a matrix clean-up step prior to
G F A A S determination [393]. Diethyldithiocarbamate ( D D C ) salts of nickel [358] and
zinc [394] have been used in the solvent extraction of gold(III) from aqueous samples.
According to Bajo and Wyttenback [358] if the mole ratio D D C / A u < 1 the complex A u
Vage 194

ÇoCd Sampdng
( D D Q C h is formed in chloride solution. Whereas if the ratio D D C / A u > 1 the complex
Au(DDC)2Cl is formed.
Collection of gold onto solid phase adsorbents has been investigated by a variety of
authors. Brajter and Slonawska [395, 396] have used Cellex P, a cation exchange resin,
to separate gold from platinum and rhodium prior to A A S determination. In this work
an amine was added to the sample matrix to ensure the complex Au(Amine)Cl2+ is
formed. This complex is then retained on the cation exchange resin.
Dithiocarbamate functionalised resins have also been used to preconcentrate gold prior to
I C P A E S determination [61]. Chen et ai. [64] have studied the use of both
dithiocarbamate resins and oxidised dithiocarbamate resins for the preconcentration of
heavy metal ions. These workers found that both resin types preconcentrate gold.
However, the capacity of the resins was quite low 0.5 - 0.6 meq ion/g compared with the
capacity for heavy metais (e.g. Cu 3.8 - 4.2 meq ion/g). Thus, the technique may be
suitable for the preconcentration of these metais, but not the separation of gold from the
other metais in the matrix. Huang et ai. [83] have also used an oxidised dithiocarbamate
functionalised resin for the preconcentration of gold(III) prior to neutron activation
analysis.
Myasoedova et ai. [397] developed a series of derivatised resins collectively known at
P O L Y O R G S . The chelating groups on these resins contain one or any combination of
the following functional groups, amine, hydroxyl, sulphonate, nitro, thiol, keto, thio,
isonitrosoacetamide or carboxylic acid groups. P O L Y O R G S have been shown to be
suitable sorbents for noble metais, including gold.
In a similar manner Grote and Kettrup [101] developed a polystyrene resin functionalised
with either S-bonded dithizone or dehydrodithizone. These resins are capable of
selectively preconcentrating both gold and the platinum group metais from mixtures
Vage 195

ÇoCd Sampdng
containing base metais and salts. Appropriate control of the elution conditions allows the
selective elution of the preconcentrated species.
Other workers have used tri-n-butylphosphate loaded polyurethane foam [398],
unmodified polyurethane foam [399], 2,2'-dipyridyl-3-[(4-amino-5-mercapto)-1,2,4-
triazolyl]hydrazone supported on silica gel [106] and silica gel modified with S-
aminopropyltriethoxysilane [91] for the preconcentration of gold(IH) from water samples
and the selective preconcentration of gold(III), from solutions containing Fe(III) and Cu
(II) ions, respectively.
Finally, the simplest method of gold preconcentration reported involves the addition of
activated charcoal to an acidified aqueous sample containing gold. The gold is
preconcentrated onto the charcoal, after which the charcoal is filtered off and analysed by
G F A A S , I N A A or any other suitable technique [103].
6.1.2 AIM AND SCOPE OF THIS WORK
Although there are a variety of preconcentration techniques available for the enrichment
of gold prior to analysis, most of these are best suited to the analytical laboratory and
would be difficult to use in a field sampling application. This is primarily the domain of
soüd phase adsorbent, of which but a few have been reported for gold.
Thus it would appear that there is still scope for the investigation of alternate adsorbents
for this application. A study of the interaction of gold with conducting polymers
provides the necessary information to assist in the development of conducting polymer
based sampling systems for gold.
Here, as with the previous example, the judicious application of polymer modified
electrodes may provide a means of achieving this end. This work, has therefore, focused
on investigating the interaction of gold with polymer modified electrodes as a means of
developing a sampling element for the preconcentration of gold.
Vage 196

ÇoCd Sampdng
6.2 EXPERIMENTAL
6.2.1 REAGENTS AND SOLUTIONS
Ali reagents used were analytical (A.R.) grade unless otherwise stated. Water used was
purified using a Milli-Q water purification system. Monomers used for the
electrochemically generated polymer were obtained from the Sigma chemicals Company
and used as received. Gold solutions were prepared by serial dilution from a
1000 mg.L_1 standard. This was prepared by dissolving lg of gold metal (99.99%) in a
niinimum of aqua regia and diluting to the required volume.
6.2.2 INSTRUMENTATION
Cyclic voltammetry was performed on a Bioanalytical Systems (BAS) (West Lafayette
In.) CV-27 Voltammograph connected to a Houston Omnigraphic 2000 X-Y recorder or
a B A S 100A Electrochemical Analyser. Voltammetric measurements were also
performed performed using the B A S 100A Electrochemical Analyser and where
appropriate a chemtronics P D V 2000 portable electrochemical analyser..
Collection experiments were performed using the controller and cell described in the
previous chapter.
6.2.3 CARTRIDGE MODIFICATION
Electrode modification was achieved by the techniques described in Chapter 2. Typically
electrodes were punched from a sheet of R V C using a laboratory cork borer. Once
formed, the electrodes were boiled in concentrated nitric acid to remove ali surface
contarnination after which they were rinsed with copious amounts of Milli Q water.
Electrodes were stored in Milli Q water until required for polymerisation.
The various electrodes used and expected collection mechanism are listed in Table 6.1.
Vage 197

ÇoCd Sampdng
TabCe 6.1 Cartridges used for the coãection of ÇoCd
Electrode designation
PP/Cl'
PP/CIO4-
PP/BF4
Expected collection mechanism
ion exchange
ion exchange
ion exchange
6.2.4 MODIFICATION OF RVC WITH POLYPYRROLE
Polypyrrole coated RVC electrodes were prepared by the galvanostatic oxidation of
pyrrole in a deoxygenated aqueous solution containing 0.5 M pyrrole and 1.0 M of the
salt to be used during polymer preparation. Oxidation was achieved at a current density
of =0.2 mA.cnr 2 for 10 minutes (based on a R V C surface área of 65 cm2.cnr3 [119,
120]).
After preparation ali electrodes were washed thoroughly and stored in Milli Q water until
they were needed for sampling experiments. Ali cartridges used in the sampling
experiments were sealed in heat shrink teflon tubing as described in section 5.2.3 of this
thesis.
6.2.5 ANALYSIS OF GOLD
Analysis of gold in solution was achieved using a chemtronics PDV2000 portable
electrochemical analyser. The electrochemical method used in this device is anodic
stripping voltammetry using a supporting electrolyte of dilute (3%) aqua regia.
Vage 198

ÇoCd Sampdng
6.3 RESULTS AND DISCUSSION
The interaction of gold with polypyrrole has been the major focus of this work and as
such will be reported here. The effect of polymer synthesis conditions on this interaction
has also been studied.
63.1 COLLECTION OF GOLD AT POLYPYRROLE MODIFIED RVC
The ion exchange properties of polypyrrole have been discussed in Chapter 2 and 4. The
studies described below were designed to investigate whether this is a viable means of
sampling gold (III), and whether the application of a potential could enhance the ion
exchange reactions.
From the voltammetric data detailed in section 4.3 it would appear that it is possible to
collect gold onto polypyrrole electrodes and that the optimum collection potential for
gold (TH) would be positive of the reduction potentials seen in the voltammograms, with
the more positive potentials giving better preconcentration. What is not clear however, is
whether or not 1 0 0 % preconcentration can be achieved. For sensing purposes low, but
reproducible, collection efficiencies are adequate. This is not the case for sampling where
near total collection of the analyte is required.
Prior to attempting to collect gold onto polypyrrole modified cartridges it was essential to
ascertain whether or not the gold had in fact been collected onto the polymer surface. To
investigate this a polypyrrole coated glassy carbon electrode was placed in a solution
(50 mg.L"1) of gold in M NaCl and a preconcentration potential of 700 m V applied.
Analysis of the electrode by electron probe micro analysis ( E P M A ) shows the presence
of gold at the electrode surface. Figure 6.1 shows the spectrum obtained for a PP/Cl
electrode after exposure, at 700 m V , to a 50 mg.L"1 solution of Au(III). These data
confirm that gold is preconcentrated on the electrode surface. However it gives no
information as to the mode of collection.
Vage 199

ÇoCd Sampdng
1*1
a 3 o U
(
Cl
1 Au
r > •
5 KeV
1
10
figure 6.1 EVMA spectrum of W/CC after cottection ofgoCd(III)
63.1.1 The effect of the anion present during synthesis on the collection of
gold at polypyrrole
Voltammetric studies (chapter 4) indicate that the anion incorporated into the polymer has
a significant effect on the magnitude of the interaction between the polymer and the
(AuCU)" anion.
To investigate this further polymers containing chloride, perchlorate and tetrafluoroborate
as the anion incorporated during polymerisation were used for gold (111) collection.
Figure 6.2 shows the collection efficiency of the polymers studied at various potentials.
Vage 200

ÇoCd Sampdng
100 ••
90-
80-
70-
< 60-"3 > 50-E a 4o-^ 30-
20-
10-
n -
! (
TSL
•̂ f j " * s ^
i • i • i • i •• • •' i
) 200 400 600 800 1000
Collection potential (mV)
• NaCl
NaClO „ 4
NaBF^
figure 6.2 CoClection efficiency* at various poCypyrroCes.
Conditions: Cartridge: Polypyrrole/NaCI Sample: 25 m L of 500 \ig.L'1 Au(fn) in M NaCl @ 1 mL-min1
In ali cases the collection efficiency at the optimum potential was excellent, and for the
CIO4- and BF4- anion it was not as affected by applied potential as the voltammetric
behaviour (section 4.3.1.2) would lead one to expect. These data suggest that the primary
mode of collection may not be ion exchange. For, if it was, the application of a positive
applied potential, which have been shown to enhance anion exchange at polypyrrole
(section 4.3.1.1) would be expected to enhance the collection of gold at these cartridges.
The effect seen to date is either negligible, as evidenced here, or opposite to that expected.
Collection at no applied potential was investigated and it was found that significant
collection efficiency can be achieved without the application of an accumulation potential.
However, the application of the appropriate potential causes an increase in sampling
* This was determined by passing a known amount of gold (III) solution through a polymer modified R V C cartridge and determining the amount of gold left in solution after it had been passed through the collection cartridge. This technique was used for ali collection efficiency experiments.
Vage 201

ÇoCd Sampdng
efficiency. This may indicate that there is a redox reaction between the polymer and the
gold, a subject investigated in section 6.3.1.2. This is shown in Table 6.2.
TabCe 6.2 CoCCection of goCd(IH) at poCypyrroCe ('Hg Eapp).
% Removal Polymer
At no E a p p At most efficient Eapp
PP/NaCI 89 89 (400 mV)
PP/NaCI04 83 99 (0 mV)
PP/NaBF4 92 99 (0 mV) Conditions: As in Figure 6.2
From this table it can be seen that significant collection efficiency can be achieved without
the application of an accumulation potential. The application of an appropriate potential
generally causes this efficiency to increase. This data does show a slight trend here when
comparing the collection efficiencies with applied potential. Polymers produced with
larger anions show higher collection efficiencies for gold. This may indicate that the
larger anions are more readily exchanged out of the polymer and that the AuCU" is more
readily exchanged into the polymer. This dependence of the ion exchange properties of
polypyrrole on polymer synthesis conditions has been reported previously [399a].
In an attempt to collect [AuCU]" by ion exchange only, the PP/NaCI cartridges were used
to collect Au(III) at 450 m V. At this potential there is little gold reduction at the polymer
and polymer damage is minimised whilst still allowing the ion exchange processes to
occur. Using a single cartridge cell collection efficiencies varied within the range
70 - 9 0 % . This degree of variability is too great. Therefore in an attempt to improve this
the dual electrode cell was used utilising two PP/NaCI electrodes set at 450 m V .
The data in Table 6.3 suggests that it is possible to collect gold by anion exchange using
the dual electrode configuration, indicating that a higher contact time between the sample
and the polymer is needed to achieve efficient, quantitative collection.
Vage 202

ÇoCd Sampdng
The need for longer contact times was confirmed with the use of the packed bed cartridge
to collect gold. Using this cartridge, which has a significantly greater surface área of
polymer to contact with the solution, it was possible to quantitatively remove gold from
solution without applying a potential to the electrode.
TabCe 63 % <Rtmoval of goCd at 450 mV (onto poCypyrroCe coated RJ/C)
Eapp %Au removal
450 92
96
96
96
97
96
93 Conditions: As in Figure 6.2
6.3.1.2 Characterisation of gold-polypyrrole interaction
The observations so far, particularly the optimum collection potentials required, suggest
that a preconcentration mechanism other than ion exchange may be responsible for the
preconcentration of gold (III) onto polypyrrole. To investigate this a PP/Cl electrode was
soaked overnight in 50 mg.L"1 Au (III) in M NaCl. The gold species at the electrode
surface were then determined by XPS. Figure 6.5 shows the XPS spectrum for this
electrode, the double peaks at 87.3 eV and 83.7 eV are typical of metallic gold [400].
Anionic gold species are expected to give a single peak at 87.5 eV.
These data indicate that the interaction of the polymer with gold involves the reduction of
the gold (III) anion with the concomitant oxidation of the polymer to overoxidised
polypyrrole by the gold anion. It does not however totally rule out ion exchange between
gold(III) anions and chloride in the polymer as any signal due to ionic gold species would
Vage 203

ÇoCd Sampdng
be included under the peak identified at 87.3 eV. Possibly, the mode of interaction
involves ion-exchange followed by the slow reduction of the gold accumulated.
That the polymer was oxidised by gold was further confirmed by measuring the potential
of a polypyrrole electrode in gold (III) solutions. This data, shown in Table 6.4, shows
that the potential at the electrode increases as the concentration of gold is increased.
486.0
459.6
f 433.2 s o w £ 406.8
Z 380.4
354.0 96.3 92.3 88.3 84.3 80.3 76.3
Binding Energy (eV)
| _ _
figure 6.5 XPS spectrum at poCypyrroCe/CC' eCectrode that has been soak&d in a
soCution containing SOmg.L'1 goCd(III).
Figure 6.6 shows the potential recorded at some polypyrrole coated RVC electrodes
whilst collecting gold with no applied potential in the electrochemical sampler. In ali
cases the potential at the electrode gradually rises, indicating that oxidation is occuring. In
contrast, similar potential measurements, recorded in M NaCl only, show no such
increase in electrode potential with time.
Vage 204

ÇoCd Sampdng
TabCe 6.4 Votential of VoCypyrroíe eCectrodes in goCd (III) soCutions
Gold concentration Electrode potential
0
50
00
240 m V
480 m V
650 m V
Reference electrode: Ag/AgCI Sample: Ali samples in M NaCl
figure 6.6
500-
400-
>
s,
a 30°" a O»
CU 200.
100<
^f
5 •
10 ^ ^ 15
t(min) 20 25
d
c
b
a
Chronopotentiograms of various poCypyrroCe eCectrodes in a 500 P-^X"1
Au(III) soCution.
a W/Cl in M^aCC
b W/3f4' in goCd soCution
c W/CC'4
d W/CIO4
Sample: 500 u.g.1/1 Au(III) in M NaCl solution.
Vage 205

ÇoCd Sampdng
6.3.1.3 Elution and quantification
Oxidative elution, at +1000 mV, into M NaCl does not release the gold from the
polymer.
The use of solvent extraction techniques, to remove any anionic gold species into
ethylacetate, also fails to remove any gold from the polymer, even if the cartridge is
soaked in the ethylacetate for up to 12 hours. This fact adds weight to the theory that the
gold is primarily present on the surface as metallic gold and not the anionic gold (III)
chloride.
Adequate elution of the gold has only been achieved by flushing the cartridges with aqua
regia. The aqua regia solution is suitable for analysis by either G F A A S or
electrochemical methods. Instrumental neutron activation analysis (INAA) has been
successfully used to directly determine the quantity of gold on the polymer modified
cartridges. The advantage of this technique is that the gold does not have to be eluted
from the polymer prior to quantification. Figure 6.7 shows the mass of gold on a
number of cartridges, as determined by INAA, and that expected. The expected mass of
gold on the cartridges was calculated by detennining the amount of gold left in a solution,
of known initial concentration, after it had been passed through a polypyrrole modified
R V C electrode. Elution of the gold from the surface of the polymer electrodes has
proven to be a difficult task, presumably because most of the gold is present on the
surface as Au°.
Vage 206
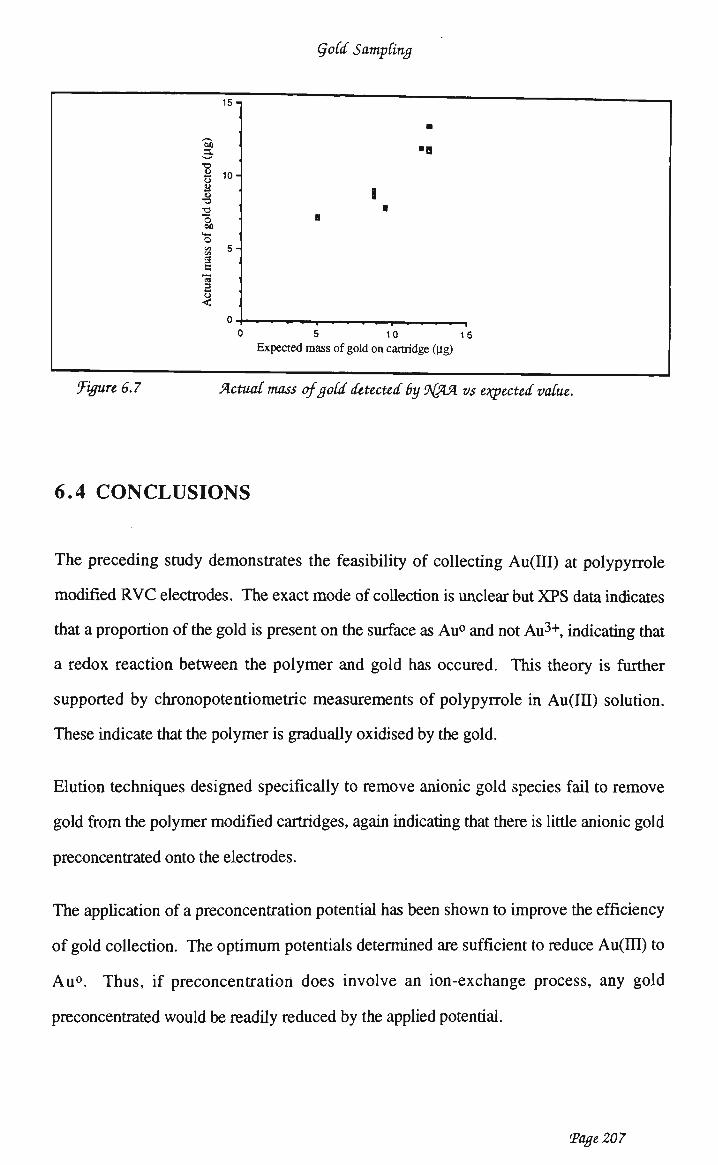
ÇoCd Sampdng
15-
1 10-
•a
<+*
o 2 5 "
13
1 0 -C
•
•B
1 B
a
5 10 15
Expected mass of gold on cartridge (u,g)
figure 6.7 Actual mass ofgoCd detected by 9{AA vs eiqpected value.
6.4 CONCLUSIONS
The preceding study demonstrates the feasibility of collecting Au(HI) at polypyrrole
modified R V C electrodes. The exact mode of collection is unclear but X P S data indicates
that a proportion of the gold is present on the surface as Au° and not Au 3 + , indicating that
a redox reaction between the polymer and gold has occured. This theory is further
supported by chronopotentiometric measurements of polypyrrole in Au(IJT) solution.
These indicate that the polymer is gradually oxidised by the gold.
Elution techniques designed specifically to remove anionic gold species fail to remove
gold from the polymer modified cartridges, again indicating that there is little anionic gold
preconcentrated onto the electrodes.
The application of a preconcentration potential has been shown to improve the efficiency
of gold collection. The optimum potentials determined are sufficient to reduce Au(III) to
Au° . Thus, if preconcentration does involve an ion-exchange process, any gold
preconcentrated would be readily reduced by the applied potential.
Vage 207

ÇoCd Sampdng
Contact time between the sample and the electrode has been shown to affect the
preconcentration efficiency with long contact times giving more efficient and reproducible
sampling. In a manner similar to that seen with the pyrrole based sensors, the anion
present during polymerisation does affect the interaction With the anions studied
polymers synthesised in the presence of large anions have better preconcentration
efficiencies than those prepared with small anions. There are no trends evident when
collecting gold at no applied potential. A tenuous link can be drawn between anion size
and gold collection efficiency when collecting gold at applied potential, with polymers
produced with larger anions providing the greatest preconcentration efficiency.
Finally, the difficulty with which gold is eluted from polypyrrole cartridges has meant
that analysis is most easily achieved with I N A A rather than electrochemical or
spectrometric methods that require quantitative elution of the preconcentrated gold
species.
Vage 208

ECectroLab
CHAPTER 7 ELECTROLAB
7.1 INTRODUCTION
The further advancement of research in sensors based on chemically modified electrodes
requires the development of new techniques for signal generation. This need arises from
the fact that the interaction of many target molecules with C M E s cause changes at the
electrode surface that are manifested, not as faradaic processes, but rather as non faradaic
signals. These signals may take the form of changes in resistance, capacitance or other
changes at the electrode surface [401]. Such changes are not readily detected with
conventional electrochemical instrumentation, particularly those utilising current sampled
pulsed electrochemical techniques. These techniques have been developed with current
sampling routines designed to effectively discriminate against the non-faradaic
components of the electrochemical signal.
To allow the inclusion of such signals in the analytical response normally requires the
modification of either the hardware or software or most conventional instruments. The
challenge therefore is to develop an instrument that will permit the researcher to readily
configure the electrochemical waveform in such a manner that it does not discriminate
against the non-faradaic components of the analytical signal, as is the normal approach,
but rather collects the data from them.
1
* The ElectroLab project was the combined effort of a number of people. Programming was carried out by M r M. Knight et ai. of Analogue Digital Instruments (ADI), N e w Zealand. Dr A.J. Hodgson provided a significant input into refining the user interface (screen designs) and testing the software. The author's contribution was the development and validation of the Design-A -Waveform. In particular ensuring that the defination of common voltammetric techniques could be achieved with this protocol and comparing the results obtained using Design-A-Waveform with those obtained with conventional instruments.
Vage 209

ECectroLab
The increased flexibility available with computer based instruments, compared with their
analog counterparts, would suggest that such an approach is feasible, however as yet
most, if not ali, computer based instruments have been configured to mimic hardware
based systems.
Since the first report of a rninicomputer controlled electrochemical system [402] there
has been a great deal of activity in this área, particularly during the mid 1970's and early
1980's. This work was prompted by the prospect of both increased reproducibility and
productivity from the ability to automate a particular experiment.
The computer based systems also included many innovative features such as averaging
of multiple scans [403, 404, 405] background subtraction [403, 404, 405, 406],
computer assisted optimisation of experiment [407, 408], resolution of overlapping
responses [409] and the collection of data at extremely high data acquisition rates [410-
412] facilitating rapid scan rate electrochemistry.
Many studies have concentrated on the hardware components of such systems. Ramaley
et ai. have reported the design of computer controlled potentiostats [413, 414], various
waveform generators [411, 412] and an autoranging data acquisition system [415].
Others have reported potentiostats suitable for computer interfacing [416-418]. While
some workers have designed software systems and interfaces suitable for use with
commercially available potentiostats [405,419,420].
However, the majority of workers have designed total systems incorporating the
potentiostat, the associated control lines for stirrers, dropping mercury electrodes,
together with the data generation and acquisition software in one package.
There seems to have been as many different approaches to the computerisation of
electrochemical experiments as there are authors of the various papers. At one extreme a
programmable calculator [421] has been used to manipulate data collected on a dedicated
Vage 210

ECectroLab
microprocessor unit whereas at the other minicomputers have been used to control
electrochemical instruments [405].
It was the development of smaller more powerful computers that accelerated the
computerisation of electrochemistry, and most other techniques.
Coken and Heimann [422] reported a system based around the Motorola 6800
microprocessor. Bond et ai. have used a variety of systems in an extensive study of
microprocessor controlled electrochemistry. They have performed cyclic differential
pulse voltammetry on a system based on a Raytheon Data Systems RDS-500 computer
[423]. A D E C P D P 11 was interfaced to a P A R 174 potentiostat in the development of
a system to perform background current correction in differential pulse and alternating
current polarography [423]. This instrument was also used for fast sweep differential
pulse voltammetry at a dropping mercury electrode [410].
Anderson and Bond also coupled a Motorola 6800 microprocessor to a home made
potentiostat and other peripheral devices to develop a system capable of performing
digital A C polarography [424], differential pulse polarography and pseudoderivative
normal pulse polarography [425]. A modified version of this unit was linked to a
Sphere 6809 microcomputer and used to perform differential pulse stripping
voltammetry with data collection in different time domains [426].
The microprocessor performs the data acquisition and control functions whilst the
microcomputer is used for data manipulation, print out and display. The system was
designed for use in clean laboratories and hazardous áreas, where the microprocessor
would be situated at the experiment and the microcomputer isolated in a normal office
environment.
Other workers have also developed systems based on dedicated microprocessors [407,
427-429], personal computers [419, 420, 403, 430] and minicomputers [431]. Most of
the programming for these systems was performed with high levei languages (basic,
Vage 211

ECectroLab
Fortran) although there has been one attempt to define a language that is specifically
designed to run electrochemical experiments [432]. The program, A S Y S T , consists of a
series of subroutines that may be configured to provide the control, stimulation and data
acquisition cycles. Of particular interest in this package is the method of defining the
voltammetric stimulus, by chosing the appropriate values for AE, Tp, Tb, Ep and E
(Figure 7.1) it is possible to select between staircase, differential pulse and square wave
voltammetry.
Ei
T TP
/ _\
< T b >
JAE
A
EP
V ' Ef
figure 7.1 The voCtammetric waveform definition parameters [from ref 432]
Apart from the case listed above there has been no attempt to devise a generic approach
to waveform definition, most workers have been content to simply write blocks of code
to define each waveform used. Therefore if the researcher wished to investigate a new
type of voltammetric stimulus it was necessary to write a new block of code defining the
required waveform.
7.1.1 AIM AND SCOPE
The development of flexible computer based electrochemical systems requires the
development of a new approach to waveform definition. To be successful this approach
needs to be easy to use, have readily varied current sampling routines and provide a
visual feedback of the waveform created, with the current sampling points indicated.
Vage 212
ECectroLab
This chapter reports the development of a computer based electrochemical instrument,
ElectroLab, that incorporates such a function. Specifically, the waveform definition
protocol, known as Design a Waveform, will be the focus of this chapter. The flexibility
of this technique will be demonstrated by way of evaluating a number of conventional
voltammetric techniques defined with this waveform definition protocol.
7.2 EXPERIMENTAL
7.2.1 REAGENTS
Ali reagents used were analytical reagent (AR) grade unless otherwise stated. Wherever
possible metal standards were prepared by dissolving purê metal (99.99% purity) in a
minimum of concentrated acid and subsequently diluting the solution to the required
volume. Alternatively, dry nitrate salts of the required metal were used. Mercury
standards were prepared by dissolving mercury (II) oxide in concentrated nitric acid and
diluting to the required volume.
7.2.2 HARDWARE COMPONENTS
The ElectroLab system consists of four major hardware components.
(i) The computer
(ii) The interface
(iii) The potentiostat
(iv) The cell stand
The choice of and development of these will be detailed in the results and discussion.
Hanging mercury drop electrode experiments were performed with a P A R S M D E 303A
electrode assembly connected to the ElectroLab with a purpose built interface.
Vage 213

ECectroLab
7.3 RESULTS AND DISCUSSION
7.3.1 HARDWARE DEVELOPMENT
7.3.1.1 The computer
The computer chosen for development into the ElectroLab system was an Apple
Macintosh, this was chosen because of the very efficient user interface. The Macintosh
graphic user interface is widely accepted as being more efficient, more productive and
easier to use than command driven interfaces. The combination of high resolution
graphics, pull down menus, explicit menu item headings, dialogue boxes and menu
command selection using a point and click mouse ensure that instrument operation is
simplified.
7.3.1.2 The interface
Rather than develop a new interface for this project it was decided to use an existing
system, the MacLab interface was chosen for modification.
This interface comprises of 1 output channel and 4 independem input channels, 2 of
which are used in ElectroLab. The output channel is a 12 bit (40kHz) D/A convertor that
supplies a zero to ± 2000 m V signal to the potentiostat for control of the cell voltages.
The input channels on the interface are both 12 bit A/D converter. One input is used to
monitor current whilst the other is set aside for potential monitoring. The current
monitoring channel has computer selected variable gain which, when coupled with the
gain ranges available on the potentiostat (also computer selected), gives current
sensitivities ranging from ±20nA to ±100mA in 1,2,5,10 increments. The actual
configuration of the instrument to achieve the required current sensitivity is invisible to
the operator. The setting is selected and the software configures the appropriate gain
settings to achieve this.
Vage 214
ECectroLab
The second input is used to monitor the potential of the working electrode. This is not
needed for voltammetric work but the potentiostat circuit includes a galvanostat which
will be used at a later stage in the instramenfs development. The ability to monitor
electrode potentials will be required to enable the recording of chronopotentiometric data.
7 J.1.3 The potentiostat
The potentiostat is a conventional 3 electrode configuration featuring computer selectable
current sensitivity. These settings are software controlled to make the hardware set-up
transparent to the user.
7.3.1.4 The cell stand
To complete the system a dedicated cell stand unit was developed. This unit houses the
stirring and gas purging facilities as well as providing a means of reproducibly locating
the electrodes.
Ali stirring and gas purging options can be operated under both manual or automatic
control. However the hardware and software are configured such that during analysis
automatic control overrides the manual control. The cell stand top was designed to
facilitate the reproducible positioning of electrodes. To achieve this, ali electrodes have a
tapered sleeve fitted to the top of them. This sleeve then fits into machined tapers in the
cell stand. Also, ali electrodes (i.e. working, auxiliary and reference) have non-
interchangable couplings to prevent the accidental incorrect connection of electrode leads
especially in a classroom setting. This was done to add a small degree of fool proofing
to the system. The cell stand is only suitable for use with solid electrodes.
73.2 DESIGN A WAVEFORM
In Design a Waveform the voltammetric stimulus is considered to be composed of 4
distinct components, a voltage ramp, two superimposed pulses, and current sampling
routines. The amplitude of the pulses may be increased, decreased or remain the same at
Vage 215

ECectroLab
each voltage step in the base ramp. Thus to operate the system each parameter is defined
individually and these are combined to form the voltammetric waveform desired. This
approach, although new to the programming aspect, has been used for many years in the
construction of analog instruments. With analog systems each component of the
stimulus is generated separately and combined on the input side of the control operational
amplifier [433]. Various voltage inputs are combined at the summing point (S) and the
complex voltage ramp applied to the cell. The circuitry require to achieve this is shown
in Figure 7.2.
figure 7.2 Circuit for an analog controCCed potentiostat showing the summing
pôint (S)
In a manner analogous with the hardware approach, to achieve the same effect with
software it is also necessary to divide each waveform into its individual components.
For example, differential pulse voltammetry can be considered to be a single pulse
superimposed on each step of a staircase ramp, whereas square wave voltammetry
requires both a positive and negative going pulse to be added to each step.
Vage 216

ECectroLab
The best way to highlight the flexibility of this approach is to evaluate a series of
waveforms that may be defined with the Design a Waveform dialogue. Prior to this the
waveform set up techniques should be discussed.
7.3.2.1 Waveform set up
To simplify the operation of this technique an easy to use operator interface was
developed. T o activate this the operator selects Design a Waveform from the
techniques menu at the top of the screen and is presented with the waveform set up
dialogue as shown in Figure 7.3.
é File EditlllJi!JIIffjDisplay Windows Macro
"Design R lüaueform"
- Ramp •
Initial
Final
Rate
Ulidth
Height
-1000
0
10
soo
5
mu mU
mü/s
ms
mU
Steps zuu
-£2 Oepc Pot.
nme
ISIUUII —
-1000
50
mU C
r-H PulS
Start
Height
Inc
Durat.
_ Boct Tii
2
] Stirrer
]Gas
n 1
50
100
0
100
s
—íXl Ciei Pot.
nme
ms
mü
mU
ms
[ Cancel |
Start
Height
Inc
Ourat.
r in limr 0
5
mU
s
300
-50
0
150
ms
mU
mU
ms
Sampling...
Uiew... j
l « 1
figure 73 The screen presented as the waveform set-up menu for Design a
'Waveform
Within this menu the base ramp parameters must be defined along with the pulses
(maximum of two) to be superimposed upon each step in the ramp.
To activate each pulse the small box in the upper left hand corner of each pulse definition
box is clicked and the appropriate parameters to define the pulse characteristics are
entered. To aid in visualising the waveform created the view button is activated and a
Vage 217

ECectroLab
graphical representation of three steps in the base ramp, with pulses superimposed, will
be displayed on the screen.
The instrument may also be configured to perform stripping voltammetry with the
waveform created this is achieved by activating the deposition dialogue. The required
accumulation potential and time prior to the stripping ramp are entered into the
appropriate dialogue boxes. It is also possible to apply a conditioning potential after the
analysis, this is controlled by the "clean" dialogue box.
73.2.2 Current sampling
To efficiently use the flexibility inherent in the waveform definition parameters it is
necessary to have a vary flexible current sampling routine.
With ElectroLab it is possible to sample the current over four windows or periods within
each step of the base ramp. Within each period the current sampling frequency is
10 k H z (1 sample every 100|is) and ali samples taken over a particular period are
averaged, with the average value stored against the potential of the base ramp at which it
was sampled.
These current sampling periods are of variable width and may be positioned anywhere
within the step width. To achieve this is a matter of simply activating the sampling
button (Figure 7.3) and a sampling set-up dialogue (Figure 7.4) will be called up. Each
period is activated by clicking in the small box to the left of the period number. To
correctly define each sampling period the starting position and duration of each period
must be specified, the only restrictions being that the periods must be defined in
chronological order and must not overlap.
Again in order to aid with the set-up procedures a graphical representation of one step in
the base waveform is shown, with any superimposed pulses shown by dotted lines. The
current sampling periods are shown on this graphic as solid or hatched boxes with the
sampling period numbers displayed above each period.
Vage 218

ElectroLab
Once sampled, each of the four possible current value are stored independently and the
individual voltammograms may be called up using the display menu. It is also possible
to display differential voltammograms, plotting the difference in current (Ai) between
any two current sampling periods versus the base ramp potential.
Sampling Time
1-153 Periorf i
Start
Durat.
Samples
30
20
200
ms
ms |
r-M Periori o
Start
Durat.
Samples
110
40
400
ms
ms
r E Sample
i-S Period 3
Start 1260
Durat. 140
Samples 400
ms
ms
-S Period 4
Start
Durat.
Samples
40(0
50
500
ms
ms
® Calculated
O Sampled Sample at
••• •••••••««•••••^
i m s
TI 3 ;"" ;.;.;.;.;.t
" % — • • >
*;*;=;'? Step Width :500ms
[ Cancel
CD
figure 7.4 The current sampdng dialogue (screen)
733 CONSTRUCTING CONVENTIONAL VOLTAMMETRIC STIMULI USING
DESIGN A WAVEFORM
The definition of a number of conventional waveforms is readily achieved with Design a
Waveform. These will be illustrated in the following section.
7.3.3.1 Staircase voltammetry
With this technique only the base ramp is activated, the operator will define both the step
width (t) and step heights. (AE) (Figure 7.5). This in turn dictates the coarseness of the
Vage 219

ElectroLab
ramp. Scan rate is a function of both step width and height. However, it was seen to be
the most important of the three and as such in the ElectroLab system scan rate has been
designated the "fixed variable". This allows the operator to manipulate either the step
width or height with the other variable automatically altered to maintain the prescribed
scan rate.
•a
%
AE 1
Time
figure 7.5 Voltammetric waveform used in staircase voCtammetry
Current sampling in staircase voltammetry has been shown to be an important
consideration [434]. In a comparison of voltammograms obtained by both linear scan
voltammetry and staircase voltammetry Bilewicz et. ai. [434] have shown that, in order
to achieve a staircase voltammetric response comparable with the linear sweep
counterpart, it is necessary to sample the current at one quarter of the step width (i.e.
where ts* = t/4). Figure 7.6 shows a staircase voltammogram recorded using Design a
Waveform with the current sampled at t/4. Figure 7.7 shows a comparison of the
responses determined at 4 different points on each step.
* t, = current sampling point
Vage 220

ECectroLab
ElectroLab: SCV by D A W (II) Page 5
o-
-10-
~ -20-•c
a. **-* "^ -30"
-40"
-50» i . , . | i | i | i | I -1 -0.8 -0.6 -0.4 -0.2 0
___^_ EM
figure 7.6 Staircase voCtammogram*for the reduction ofVb2* at an MMDE
Conditions Einitial = 0 mV Efinal =-1000 mV Scan rate = 10 mV.s-i Current sampled at t/4 (20 ms current sampling window)
Sample: 5x lfJ-3M Pb in M HC104
Ferrier et ai have studied staircase voltammetry with varied current sampling times
[435], In this study they found that the analytical response for the reduction of an
electrochemically reversible species was significantly effected by the position of the
current sampling point. For a given scan rate i a t/tg, which effectively means the closer
it is to the beginning of the step period, the higher the current. These authors also show
that for an electrochemically irreversible reaction the position of the current sampling
period has little effect on the analytical response and suggest that, by monitoring the
current at several points within each step and comparing the responses recorded it should
be possible to obtain a qualitative measure of the reversibility of a particular reaction.
To conduct this study the authors were required to build dedicated instrumentation with
sophisticated current sampling circuitry. With the Design a Waveform it is possible to
* The voltammograms shown in this chapter do not follow the sign convention used in previous chapters. The reduction responses are negative when using SCV, DPSV and only displayed in the positive direction with square wave voltammetry. Axes are also inverted when compared with previous figures. This occurs because the voltammograms included are screen dumps taken directly from voltammograms recorded with the ElectroLab software.
Vage 221

ECectroLab
sample the current at 4 different sampling periods within each step. These periods are
activated and varied by software control thus obviating the need for dedicated hardware.
Figure 7.7 shows a voltammogram for the reduction of Pb2+ illustrating the different
responses at various current sampling times.
-29-
-32-
-40-
-44-
* w
\ + 1 v» ^U
v- i*A
\*. 13/ Iv» -JOf' ^ ft»\ í0Tf\ V*^
-0.48 -0.44 -0.4 -0.36 E(V)
S*mpliag poiní 4 y (l*í < 20 3M ef ««ti
Simf li»g poiu 3(9 3lf4)
S»»I to* poni 2(9 U2)
-0.32 -058 -0.24
figure 7.7 Staircase voCtammogram for the reduction of the Vb2*showing the
effect of varying the current sampdng points at an 9ÍMDE
Conditions Ej„itiai = 0 mV Efinai = -1000 mV Scan rate = 10 mV.s"1
Current sampled at t/4, t/2, 3t/2 and for last 20 ms of each step (20 ms current sampling window)
Sample: 5x 10"3M Pb2+ in M HC104
7.3.3.2 DifTerential staircase voltammetry
In contrast to staircase voltammetry, where only one current sampling point is taken for
each step of the staircase waveform, differential staircase voltammetry [436, 437]
requires two current samples to be taken during each step and the difference in current Ai
between these two values is plotted versus the potential of each step.
Vage 222

ECectroLab
Figure 7.8 shows the waveform and current sampling points used in this technique. B y
sampling the current at two points within each step and plotting the difference in current,
it is possible to effectively cancel out the charging current component [436].
c •4—»
O
13 •a
c
a
Current sampling period 1 Current sampling
period 2
AE
Time
Sample point 2 Sample point 1 \(@l20ms) (@ 20 ms)
AE Jll LL
Time
figure 7.8 Waveform used in differential staircase voCtammetry [from ref 436
and437[
Scholz et ai. have reported two variante of this technique, with the first [436], the current
was sampled twice at the end of each step as shown in Figure 7.8a. A problem with this
approach is that a considerable component of the faradaic response will also be cancelled
out.
Vage 223

ECectroLab
The second approach reported by Scholz [437] involves sampling the current 20 m s after
the step and again at lOOms after the first sample is taken (Figure 7.8b). Using this
approach the authors claim the achieve improvements in the signal/noise ratio that allow
this technique to give a L O D equal to or slightly better than differential pulse
voltammetry. Figure 7.9 shows a differential staircase voltammogram for the reduction
of P b 2 + at a hanging mercury drop electrode.
Configuration of this technique with Design a Waveform is achieved by selecting the
staircase waveform as in the previous example and then define two current sampling
points on each step. The position and duration of each current sampling window is
defined in the sampling dialogue and the display is readily configured to plot the
difference between these points versus potential.
*—l
< w OI 1
0"
-2"
-4"
-6-
-8"
ElectroLab: DSCV by DaW (II) Page 1
v y -1 -0.8 -0.6 -0.4 -0.2
E(V) 0
figure 73
Conditions
Sample:
Differential staircase voCtammetric response for the reduction ofVb2*
at an MMDE
Einitial = 0 m V Efinal = -1000mV Scan rate= lOmV.s"1
current sampled at 20 ms and 120 ms (20 ms current sampling window)
5x 10"3M Pb2+ in M HC104
Vage 224

ECectroLab
1333 Differential pulse voltammetry
Differential Pulse Voltammetry (DPV) is easily defined with Design a Waveform. In
this case is a single pulse of fixed amplitude superimposed on each step of a voltage
ramp is required (Figure 7.10). T o achieve this the ramp is selected as in the previous
example and the pulse dialogue activated.
The desired pulse amplitude and width are entered along with the pulse starting time.
This is the delay from the commencement of the step in the base ramp before the pulse is
activated. This setting is chosen such that the pulse occurs at the end of each step in the
ramp.
Current sampling windows are specified to ensure that the current is sampled before the
imposition of the pulse and at the end of each pulse. The current differential is then
displayed on the screen.
Vage 225

ECectroLab
figure 7.10 The component waveform and the composite differential puCse
stimuCus
Vage 226

ECectroLab
Figure 7.11 shows a differential pulse voltammogram recorded for 5 xlO*3 M Pb2+in
M HCIO4. A comparison between this result and that obtained by DSCV (Figure 7.9)
shows that for the solution studied the signal/noise ratio appears to be significantly better
for the DPV technique.
0-
-20-
*-\ < -40-
•* -60-
-80-
.1 nn-- I uu
ElectroLab: DPV by DaW Page 1
~"~ ~\ Í \
li -1 -0.8 -0.6 -0.4 -0.2 E(V)
1
0
figure 7.11 A differential pulse voCtammogram for the reduction ofVb +at an
'HMDE.
Conditions Einitial = 0 mV Efinal = -1000 mV Scan rate = 10 mV.s"1 Pulse amplitude = 25 m V Pulse width = 50ms Pulse period = 200ms (20 ms current sampling window)
Sample: 5x 10"3M Pb2+ in M HC104
The DPV technique has been varied by some workers, either to increase instrument
sensitivity or to detect chemical interferences in the analytical process. Bond and
Grabaric [410] developed a microprocessor based system to perform fast sweep
differential pulse voltammetry. The technique required the imposition of 40 ms pulses
with a 80 ms period between the commencement of each pulse, the effective scan rate
used was 50 and 100 mV.s-1.
In a similar study Yeakel et. ai. [438] designed and built a digital signal generator for use
with a PAR 174 electrochemical analyser that would adapt it for use in rapid scan DPV.
Vage 227
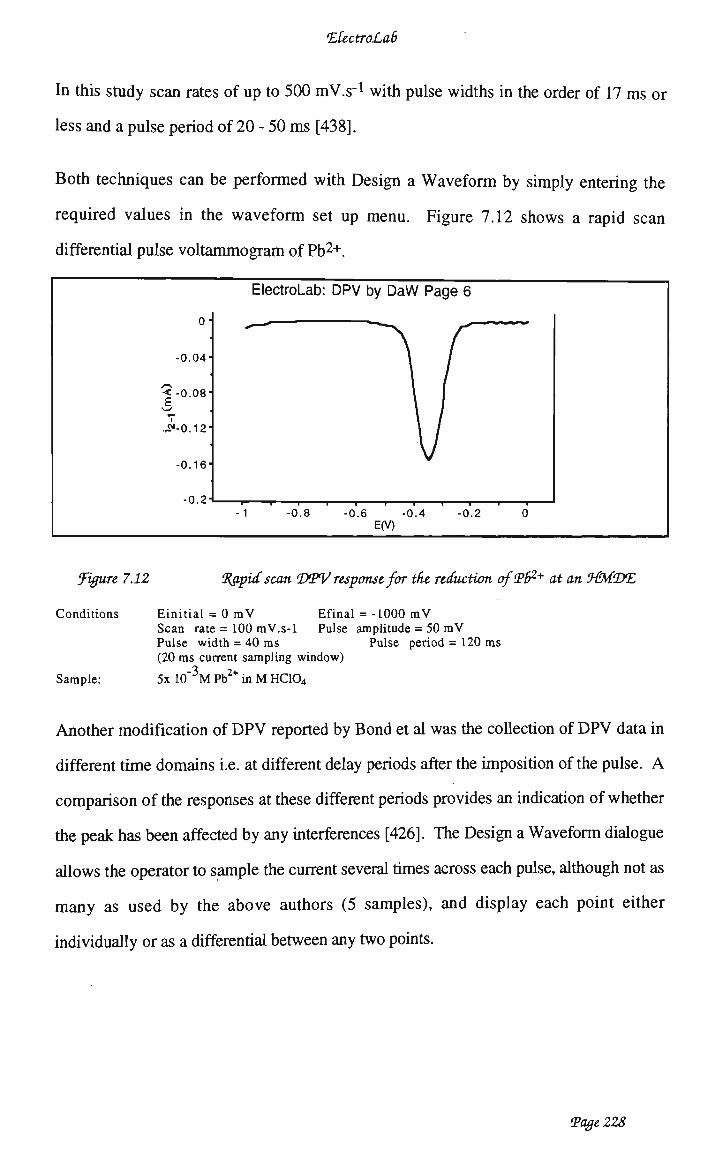
ECectroLab
In this study scan rates of up to 500 mV.s-1 with pulse widths in the order of 17 m s or
less and a pulse period of 20 - 50 ms [438].
Both techniques can be performed with Design a Waveform by simply entering the
required values in the waveform set up menu. Figure 7.12 shows a rapid scan
differential pulse voltammogram of Pb2+.
o-
-0.04-
<-0.08-£
•í*-0.12-
-0.16-
-0 2-
ElectroLab: DPV by D a W Page 6
' ^r \ /
\ / V
-1 -0.8 -0.6 -0.4 -0.2 E(V)
0
figure 7.12 íRapid scan DW response for the reduction ofVb2+ at an HMDE
Conditions Einitial = 0 mV Efinal = -1000 mV Scan rate = 100 mV.s-1 Pulse amplitude = 50 m V Pulse width = 40 ms Pulse period = 120 ms (20 ms current sampling window)
Sample: 5x 10"3M Pb2+ in M HC104
Another modification of DPV reported by Bond et ai was the collection of DPV data in
different time domains i.e. at different delay periods after the imposition of the pulse. A
comparison of the responses at these different periods provides an indication of whether
the peak has been affected by any interferences [426]. The Design a Waveform dialogue
allows the operator to sample the current several times across each pulse, although not as
many as used by the above authors (5 samples), and display each point either
individually or as a differential between any two points.
Vage 228

ElectroLab
133 A Square wave voltammetry
Square wave voltammetry (SWV) can be represented in two ways, either a base ramp
with one pulse superimposed upon it or as a base ramp with two pulses superimposed
upon it. With the former approach the pulse amplitude applied must by double the
square wave amplitude and the base ramp must be offset, by a value equivalent to the
amplitude of the square wave, to achieve the correct potential response.
Whereas with the latter approach the base ramp is simply defined (Figure 7.13a) and two
pulses equal in magnitude, but of opposite polarity (Figure 7.13b&c) and with pulse
width equal to half the width of each step in the base ramp, are applied. The resulting
composite waveform is shown in Figure 7.13d.
Vage 229

ECectroLab
T3 •a
g
a)
•a •a a a
b)
13 •a a
a <£ c)
Ta •a a « 0-
d)
• i
i " i
I j
j
Time
Time
Time
Time
figure 7.13 Components of a square wave voCtammetric stimulus
To do this with the Design a Waveform dialogue requires a little thought as square wave
parameters are usually reported as square wave amplitude, frequency and step height.
Vage 230

ECectroLab
Whereas, with Design a Waveform the input parameters are scan rate, step height, step
width, pulse amplitude, pulse width and pulse increment.
To set up SWV from Design a Waveform it is necessary to remember that
Scan rate = step height x frequency.
Therefore, the appropriate scan rate is calculated from the desired step height and
frequency parameter. This is entered along with the step height required, the system
automatically calculates and displays the appropriate step width. The pulse parameters
are then set at:
Pulse One with pulse duration half step width commencing at 0 ms. Pulse
amplitude for pulse one is entered and the increment value is 0 m V .
Pulse Two is set to commence at the end of pulse one for the same duration,
however pulse amplitude is set in the opposite direction to pulse one.
The current sampling windows are set at the end of each pulse as described
previously.
Figure 7.14 shows a square wave voltammogram for Pb2+ as recorded with Design a
Waveform.
7.3J.5 Normal pulse voltammetry
When considering normal pulse voltammetry (NPV) in the terms used in the Design a
Waveform definition dialogue it can be considered as a base ramp of zero volte range
with a superimposed incrementing pulse. However due to programming restrictions
with the instrument it was not possible to define a ramp with a 0 volt range. Therefore
another approach was taken.
Vage 231

ECectroLab
ElectroLab: S W V by D a W Page 2
0.2
0.16
< 0.12 £ CU
••=• 0.08
0.04"
0 i 1 1 i i i i i i i i i
-1 -0.8 -0.6 -0.4 -0.2 0 EfV)
figure 7.14 A square wave voCtammogram for the reduction ofVb2* at an
MMDE
Conditions Einjtiai = 0 mV Efmai = -1000 mV Scan rate = 30 mV.s"1 step height =-2 mV
Step width = 66.7 ms Pulse amplitude = 25 m V Pulse width = 33.3 ms (10 ms current sampling window at end of each pulse)
Sample: 5x 10"3M Pb2+ in M HC104
It is also possible to consider NPV as a coarse linear ramp onto which an incrementing
pulse ramp of opposite polarity is superimposed. This is depicted in Figure 7.15
Using the Design a Waveform approach it is necessary to consider that the step width in
the base ramp equates to the pulse period and the step height is the pulse amplitude (and
increment) from NPV (Figure 7.15a). To complete the definition a pulse is
superimposed on the ramp. This pulse commences at the end of the desired NPV pulse
and has a duration of (step width - NPV pulse width). The height of this pulse is the
same as the step height. Each increment is also 1 step height for each step of the base
ramp (Figure 7.15b). This way it is possible to define a NPV waveform (Figure 7.15c)
with the appropriate current windows being added after the waveform is defined. Figure
7.15 illustrates this approach.
Vage 232

ECectroLab
ia •a c B
b)
T3
1 c)
Time
Time
Time
figure 7.15 The Design a 'Waveform approach to Ü^V
Figure 7.16 shows a normal pulse voltammogram for the reduction of Pb2 + as recorded
with Design a Waveform.
Vage 233

ECectroLab
~~ ElectroLab: NPV by DaW Page 1
o -40
-80
Q -120
3 -160
-200
-240-
-280 i ' 1 • i 1 1 1 i i 1 "
-1 -0.8 -0.6 -0.4 -0.2 0
E(V) _ ^
figure 7.16 A normal pulse voCtammogram for the reduction of Vb2* at an
MMDE
Conditions Einitial = 0 m V Efinal = -1000 m V Scan rate = lOmV.s"1
Sample: 5x 10"3M Pb2+ in M HC104
In a variation of normal pulse polarography Bond and Anderson [ECW 004] describe a
technique Variable-Amplitude Pseudoderivative Normal-Pulse Polarography. With this
technique data points from pulses a fixed number of pulses apart (n = 1 to many) are
subtracted from each other and plotted versus potential.
The data acquisition routines in ElectroLab collect and store each individual data point in
a form that is compatible with any other Macintosh software. Therefore, whereas it is
not possible to display a pseudoderivative voltammogram directly from the ElectroLab
program, the raw data may be manipulated and plotted from any spreadsheet program.
7.3.4 SIMPLIFYING WAVEFORM DEFINITION DIALOGUES
Although it is possible to set up many analytical waveforms with the Design a
Waveform menu, this is often a tedious procedure (see especially normal pulse and
square wave voltammetry). Therefore the ElectroLab system has a series of preset
techniques available. This is achieved by displaying a set-up dialogue in which the
operator enters any parameters relevant to the technique chosen. The ElectroLab system
Vage 234

ECectroLab
then uses these parameters to perform the appropriate calculations and set up the Design
a Waveform parameters to perform the technique chosen.
The techniques available with preset dialogue are:
Staircase Voltammetry
Differential Pulse Voltammetry
Square Wave Voltammetry
Normal Pulse Voltammetry
Cyclic Voltammetry
and the stripping variante of these.
For example when defining square wave voltammetry with Design-a-Waveform, once
the initial and final potential have been set, it is necessary to define the scan rate, and step
height to obtain the required frequency. From this the step width must be determined to
calculate the pulse width. T w o pulses, equal in duration and magnitude, but opposite in
polarity must be sequentially superimposed on the base ramp to produce the required
waveform. Once the waveform has been defined the current sampling dialogue must be
activated and appropriate current sampling windows defined.
Using the preset dialogue it is only necessary to define initial potential, final potential,
square wave frequency, base ramp step height and pulse amplitude. The template is then
used to set ali appropriate parameters in the Design a Waveform technique to implement
the method required. A similar case appües for ali techniques available on ElectroLab.
Vage 235
ECectroLab
IA CONCLUSIONS
The Design a Waveform technique has been shown to be a versatile method for the
definition of voltammetric stimuli. The combination of flexible pulse definition and
current sampling protocol facilitate the use of a number of conventional and unusual
voltammetric techniques.
The operation of the Design a Waveform technique has been simplified by using a
combination of dialogue boxes and graphical feedback facilities in the waveform
definition menu. The definition of the more conventional voltammetric stimuli has been
further simplified by the inclusion of a number of preset techniques where the operator
simply defined the voltammetric stimuli in terms normally used to specify the technique
required (see square wave voltammetry example in 7.3.4).
The examples delineated in this chapter serve to illustrate the flexibility of this technique
in defining voltammetric stimuli. The extension of the technique should allow a number
of new methods to be developed.
Vage 236

ConcCusions
CHAPTER 8 CONCLUSIONS
From the work described in this thesis there are a number of general conclusions that
may be reached regarding the use of polymer modified electrodes in both sensing and
sampling applications.
Studies designed to determine the most appropriate means of preparing polymer
modified R V C electrodes have shown that this is best achieved by galvanostatic
preparation techniques. This limits the range of monomers available for polymerisation
onto this substrate. The modification of R V C has been achieved primarily using
polypyrrole. The generation of a thiophene based polymer on R V C is best achieved
using 2,2' bithiophene as the starting monomer.
A second limitation on the generation of polymer modified electrodes in general is that
associated with the incorporation of electroactive anions into the polymer when the
monomer oxidation potential is greater than that required to oxidise the reagent. To
circumvent this problem a technique has been devised whereby an easily exchangeable
anion that is stable at the monomer oxidation potential is incorporated into the polymer.
This anion is subsequently exchanged out of the polymer and replaced by the
electroactive species that is required for polymer functionalisation. This technique has
been used to produce electrodes for investigation in both sensing and sampling
applications.
The development of a methylmercury sensor based around polymer modified electrodes
has also been described. This sensor was based around a hybrid electrode prepared by
the chemical derivatisation of a polymer film layed down over a thin mercury film. The
rationale behind this electrode was the combination of preconcentration of the
methylmercury compound with a dithiocarbamate functionality on the electrode surface
with detection at a mercury film. The feasibility of using the approach in solution was
Vage 237
ConcCusions
first demonstrated then the transfer of this technology to one electrode was attempted.
The electrode prepared by this technique lacked the sensitivity to be suitable as a sensor
in application requiring low limits of detection for methylmercury. Superior sensitivity
was obtained using the adsorptive stripping voltammetric technique for methylmercury
that was developed.
A number of polymers were investigated in an attempt to produce a polymer modified
electrode for the determination of gold in aqueous samples. Polymers generated by both
oxidative and reductive polymerisation were studied. The best sensor was that developed
using poly-4-vinyl pyridine. This polymer is produced by reductive
electropolymerisation techniques and has proven suitable for the determination of gold.
The technique developed is capable of determining gold in the presence of copper, a
c o m m o n interferent in the voltammetric determination of gold. The reason that the
polymer is suitable for this application is that it does not have an appreciable
voltammetric signal in the region of interest yet possesses sufficient electrical
conductivity to allow signal generation to occur. Accumulation at the polymer is achieved
by ion exchange of the gold species onto the anion exchange sites present in the polymer.
Sampling with chemically modified RVC has been demonstrated and applied to the
collection of mercury from industrial effluent.
R V C modified with a dithiocarbamate containing polypyrrole. This electrode, R V C
modified with a dithiocarbamate containing polypyrrole, proved suitable for the
collection of mercury from solution and was not affected as much by other organics in
the sample. The interaction of the analyte with the sampling electrode was shown to be
affected by the application of potential to the electrode. This has been shown to enhance
the collection of mercury at these electrodes.
Vage 238
ConcCusions
The collection of gold at polypyrrole modified R V C has been shown to be a feasible
proposition. The interaction of the gold with the polymer has been shown to involve the
reduction of gold at the polymer surface. As with the collection of mercury the collection
of gold has been shown to be affected by the application of potential to the sampling
electrode.
Both cases demonstrate the feasibility of using polymer modified RVC for the collection
of analytes from solution. The technique should be suitable for wider application
provided that suitable modifiers can be appüed to the electrode surface.
The development of a controller and sampler cell for use with modified RVC electrodes
has been demonstrated. The cell designed has proven suitable for use in situations
requiring the application of a potential to the modified R V C . The controller has been
designed to make it simple to use and suitable for field application. The combination of
the controEer, the sampler cell and the modified R V C electrodes with a small portable
peristaltic p u m p make a device suitable for use in field sampling applications.
Particularly, for the collection gold and mercury as described here. The limitation on the
use of this device is that sampling must be carried out at flow rates no greater than
lrnL.mür1.
Finally, the development of an electrochemical workstation using a new way of defining
the voltammetric waveform has been described. The technique, Design-A-waveform, is
sufficiently flexible to be capable of performing most commonly used voltammetric
techniques as well as having the flexibility to be used for new voltammetric waveforms.
The variable current sampling routine available allow the operator to collect data at
various positions within each stimulus and as such allow the collection of data not only
due to faradaic processes but also due to the non-faradaic processes occurring at the
electrode surface. This facility may prove useful in the development of sensing
techniques based around polymer modified electrodes.
Vage 239