1936 teaching material_and_energy_balances_to
30
AC 2009-1936: TEACHING MATERIAL AND ENERGY BALANCES TO FIRST-YEAR STUDENTS USING COOPERATIVE TEAM-BASED PROJECTS AND LABS Michael Hanyak, Bucknell University Michael E. Hanyak, Jr. is a Professor of Chemical Engineering at Bucknell University since 1974. He received his B.S. from The Pennsylvania State University, M.S. from Carnegie Mellon, and his Ph.D. in Chemical Engineering from the University of Pennsylvania in 1976. His teaching and research interests include computer-aided engineering and design, courseware development and the electronic classroom. He was one of the principal investigators with Brian Hoyt, William J. Snyder, Edward Mastascusa, and Maurice Aburdene on a five-year National Science Foundation grant (#9972758, 1999-2004), entitled Combining Faculty Teamwork, Applied Learning Theory, and Information Technology: A Catalyst for Systemic Engineering Education Reform. Courseware and pedagogical developments have been the focal points of his professional career. Timothy Raymond, Bucknell University Timothy M. Raymond is a Professor of Chemical Engineering at Bucknell University since 2002. He received his B.S. from Bucknell University in 1997 and his Ph.D. in Chemical Engineering from Carnegie Mellon University in 2002. His teaching and research interests include atmospheric chemistry and physics, aerosol and particle studies, and improving engineering education. He received an NSF CAREER award (#0746125, 2008-2013), entitled Aerosol-Water Interactions in the Atmosphere. This work focuses on combining aerosol particle research with educational opportunities for undergraduates. © American Society for Engineering Education, 2009
-
Upload
chandro57 -
Category
Engineering
-
view
30 -
download
0
Transcript of 1936 teaching material_and_energy_balances_to

AC 2009-1936: TEACHING MATERIAL AND ENERGY BALANCES TOFIRST-YEAR STUDENTS USING COOPERATIVE TEAM-BASED PROJECTSAND LABS
Michael Hanyak, Bucknell UniversityMichael E. Hanyak, Jr. is a Professor of Chemical Engineering at Bucknell University since 1974.He received his B.S. from The Pennsylvania State University, M.S. from Carnegie Mellon, andhis Ph.D. in Chemical Engineering from the University of Pennsylvania in 1976. His teaching andresearch interests include computer-aided engineering and design, courseware development andthe electronic classroom. He was one of the principal investigators with Brian Hoyt, William J.Snyder, Edward Mastascusa, and Maurice Aburdene on a five-year National Science Foundationgrant (#9972758, 1999-2004), entitled Combining Faculty Teamwork, Applied Learning Theory,and Information Technology: A Catalyst for Systemic Engineering Education Reform.Courseware and pedagogical developments have been the focal points of his professional career.
Timothy Raymond, Bucknell UniversityTimothy M. Raymond is a Professor of Chemical Engineering at Bucknell University since 2002.He received his B.S. from Bucknell University in 1997 and his Ph.D. in Chemical Engineeringfrom Carnegie Mellon University in 2002. His teaching and research interests includeatmospheric chemistry and physics, aerosol and particle studies, and improving engineeringeducation. He received an NSF CAREER award (#0746125, 2008-2013), entitled Aerosol-WaterInteractions in the Atmosphere. This work focuses on combining aerosol particle research witheducational opportunities for undergraduates.
© American Society for Engineering Education, 2009

TEACHING MATERIAL AND ENERGY BALANCES TO
FIRST-YEAR STUDENTS USING COOPERATIVE TEAM-
BASED PROJECTS AND LABORATORIES
Abstract
A team-based cooperative learning environment for teaching Principles of Chemical Engineering
(the material and energy balances course) has been used at Bucknell University for several years.
This course has been carefully designed to include a variety of "best practices" to help prepare
chemical engineering students in their first course in the curriculum. The course involves five
two-week projects where students work in teams to complete problems covering a range of
materials and, at the same time, practice teamwork and professional skills. Additionally, each
project involves a complex laboratory experiment and use of process simulation software
(HYSYS) problems. This work is carefully guided by the course instructors in a way to promote
independent learning while assessing the desired outcomes. Assessment for this course has been
ongoing and involves a range of data from team self-reports, before and after project concept
inventories, individual surveys, team surveys, and final course evaluations. This paper will
explain the details of the course setup, the unique application and evaluation of various "best
practices" used in the course, and assessment/evaluation of the benefits of the cooperative
learning environment.
Introduction (Why?)
Principles of Chemical Engineering (CHEG 200) is the introductory course in the chemical
engineering curriculum at Bucknell University. At other universities this course is sometimes
referred to as the “stoichiometry” or the “material and energy balance” class. The purpose of the
class is to introduce students to the major concepts and ideas related to chemical engineering.
This allows students to 1) confirm their choice of major discipline (do they really want to be
chemical engineers or is this discipline what they were expecting?) and 2) form the basis of ideas
and concepts needed to be successful as chemical engineers. Traditionally and historically, this
course at most institutions would be a lecture-based course covering material and energy
balances. It would not include a laboratory but rather would rely solely on students performing
homework problems from the textbook while working individually or in small, independently-
formed groups.
Research into how students learn has shown that people are more likely to abstract the relevant
features of concepts and to develop a flexible representation of knowledge when a subject is
taught in multiple contexts, including examples that demonstrate wide application of what is
being taught.1 Educational researchers also widely acknowledge that learning by doing is more
effective for most people than passively listening to a lecture.2 Finally, there is consistent and
strong data from employers of chemical engineers that the primary attributes they are looking for
in new hires include problem-solving skills, teamwork skills, and communication skills.3 These
data have been a strong motivation to change how the first chemical engineering course is taught.

Between the late 1990’s and the early 2000’s, the Principles of Chemical Engineering at
Bucknell University was transformed from a more traditional, lecture-style course to a problem-
based learning environment. The course material still includes standard topics (using the
textbook by Felder and Rousseau4) such as material balances, energy balances, reactive and non-
reactive systems, and phase equilibrium. At the same time, the students learn team skills,
communication skills, and process modeling software (HYSYS). They also receive hands-on
experience with various chemical engineering unit operations, and they practice independent
learning skills.
This course makes use of the problem-based learning approach (PBL) and therefore contains
minimal lecture time, supplemental student materials, and independent learning requirements. In
order to make the best use of the cooperative learning environment, the class meets for two hours
every Monday, Wednesday and Friday. The class meets no more than a standard engineering
course at the university which includes four hours of class time and two hours of laboratory time
per week. At most schools, this would be equivalent to a four credit hour course with a 1-2
credit hour laboratory. In the final section of this paper, we provide options which would make
this course possible in a class meeting for only three credit hours without a laboratory.
It is not possible to “cover” all of the course material during class; so much of the content is
developed by the students utilizing the PBL format. The students “learn by doing” with constant
guidance and feedback from the instructor. The instructor also supplies additional resources to
the class via Blackboard postings and a course manual (or student handbook) purchased by the
students at the beginning of the year along with their course textbook. The focus in class
becomes application of course content with feedback from the instructor rather than the simple
supplying of course content via lecture. The course learning outcomes are given below:
1. To value critical thinking, self-learning, and teamwork.
2. To value organization, documentation, and presentation.
3. To learn a general problem-solving methodology and apply it.
4. To investigate the pressure-volume-temperature relationships for fluids.
5. To solve material balance problems with and without chemical reaction.
6. To solve material balance problems that incorporate phase equilibrium.
7. To solve energy balance problems with and without chemical reaction.
8. To solve material/energy balance problems involving health and safety issues.
9. To analyze a process flow sheet using a chemical process simulator.
10. To operate equipment and conduct experiments in the laboratory.
The above outcomes cover the cognitive, affective, and psychomotor domains of Bloom’s
Taxonomy9. In the Course Design (What?) section of this paper, we detail how all six categories
of Bloom’s cognitive domain are covered. The major content topics of the course are given
below:
1. Introduction to a Problem Solving Methodology
2. Units, Homogeneity, Algebraic Equations, and Gaussian Elimination
3. Primary, Chemical, Force, Rate, and Mixture Quantities
4. Interpolation, Graphical Curve Fitting, Least Squares

5. Mass Balances with no Reaction
6. Flow sheet Recycle and Purge
7. Mass Balances with Reaction and Recycle
8. Equations of State and Theory of Corresponding States
9. PT and PVT Diagrams, One-Phase Equilibria
10. TXY and PXY Diagrams, Multi-Phase Equilibria
11. Energy Balances with No Reactions and PH and HXY Diagrams
12. Material and Energy Balances with No Reactions
13. Energy Balances with Chemical Reactions
14. Process Simulation of Styrene Monomer Production from Toluene and Methanol
Students are held individually accountable via the keeping of a personal technical journal where
they individually document their work. This includes the solutions to in-class activities and
handouts as well as mini-assignments from the course manual. Students complete these
individual activities and place them in their journals which are checked and graded bi-weekly by
a course teaching assistant. The journals are also where students document their completion of
specified tasks in the process simulation software (HYSYS).
Beyond traditional technical content, the students receive instruction and practice in team skills,
written communication, and oral communication. The team environment provides them with a
support network and prepares them for future chemical engineering courses where they will
work on project and laboratory teams. The laboratories completed in this course and field trips
taken are listed below:
1. Steel and Cooper Piping Systems Experiment
2. Ethanol-Water Distillation Experiment
3. Methane Combustion and Spray Dryer Experiment
4. Membrane Air Separation Experiment
5. Plate-and-Frame Filter Press Experiment
6. Plant Trip to Cherokee Pharmaceuticals in Riverside, PA
7. Plant Trip to Frito Lay in Williamsport, PA
Course Design (What?)
The introductory course on chemical engineering at Bucknell University is a six-credit-hour
course taught to about 28 to 32 first-year majors over a 14-week period in the spring semester.
Prior to 2008, this course was taught to sophomore majors in the fall semester. Since 2008, it
has been taught to freshmen majors in the spring semester. Under the PBL format, the students
work for a fictitious company that has hired them at the entry-level position of provisional
sophomore engineer. The following two paragraphs extracted from the syllabus introduce the
students to the continuing educational course in this company on the first day of class.
“Welcome to the Internship Program in the Process Engineering Department of BEEF, Inc.,
the Bison Engineering and Evaluation Firm. Based on feedback from our Human Resources
Department about your strong technical background, you have been promoted to the status of
provisional sophomore engineer. As a new sophomore chemical engineer in this program,
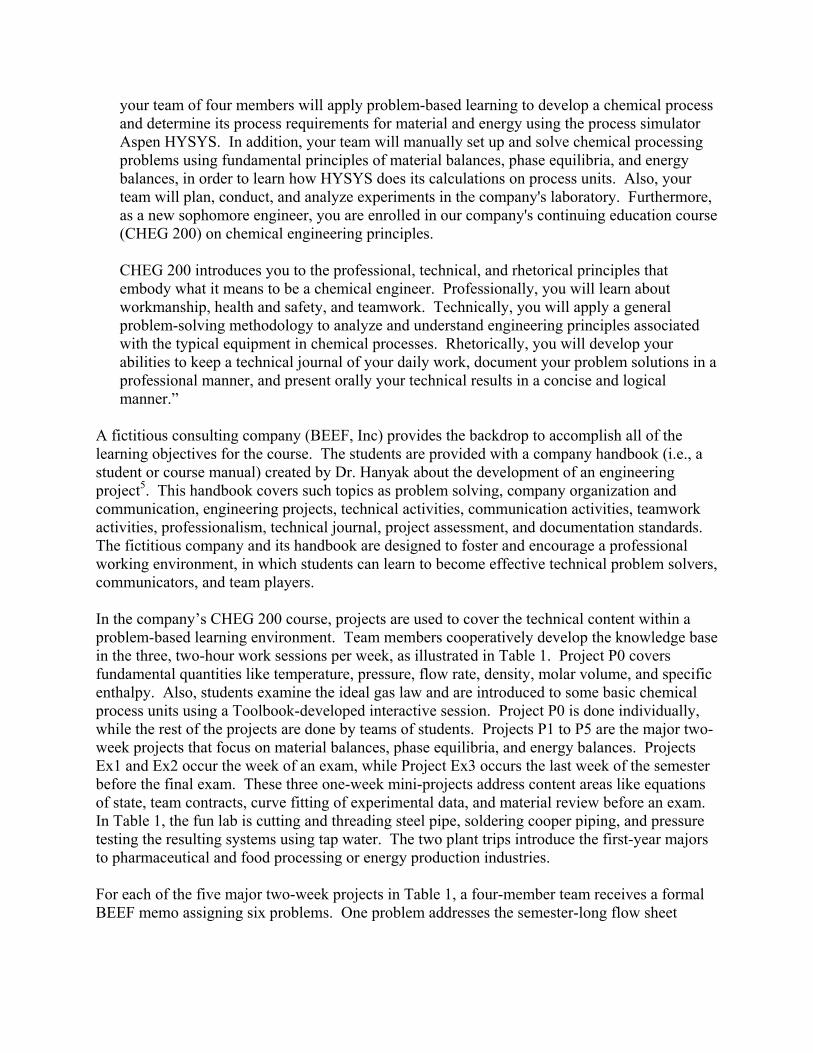
your team of four members will apply problem-based learning to develop a chemical process
and determine its process requirements for material and energy using the process simulator
Aspen HYSYS. In addition, your team will manually set up and solve chemical processing
problems using fundamental principles of material balances, phase equilibria, and energy
balances, in order to learn how HYSYS does its calculations on process units. Also, your
team will plan, conduct, and analyze experiments in the company's laboratory. Furthermore,
as a new sophomore engineer, you are enrolled in our company's continuing education course
(CHEG 200) on chemical engineering principles.
CHEG 200 introduces you to the professional, technical, and rhetorical principles that
embody what it means to be a chemical engineer. Professionally, you will learn about
workmanship, health and safety, and teamwork. Technically, you will apply a general
problem-solving methodology to analyze and understand engineering principles associated
with the typical equipment in chemical processes. Rhetorically, you will develop your
abilities to keep a technical journal of your daily work, document your problem solutions in a
professional manner, and present orally your technical results in a concise and logical
manner.”
A fictitious consulting company (BEEF, Inc) provides the backdrop to accomplish all of the
learning objectives for the course. The students are provided with a company handbook (i.e., a
student or course manual) created by Dr. Hanyak about the development of an engineering
project5. This handbook covers such topics as problem solving, company organization and
communication, engineering projects, technical activities, communication activities, teamwork
activities, professionalism, technical journal, project assessment, and documentation standards.
The fictitious company and its handbook are designed to foster and encourage a professional
working environment, in which students can learn to become effective technical problem solvers,
communicators, and team players.
In the company’s CHEG 200 course, projects are used to cover the technical content within a
problem-based learning environment. Team members cooperatively develop the knowledge base
in the three, two-hour work sessions per week, as illustrated in Table 1. Project P0 covers
fundamental quantities like temperature, pressure, flow rate, density, molar volume, and specific
enthalpy. Also, students examine the ideal gas law and are introduced to some basic chemical
process units using a Toolbook-developed interactive session. Project P0 is done individually,
while the rest of the projects are done by teams of students. Projects P1 to P5 are the major two-
week projects that focus on material balances, phase equilibria, and energy balances. Projects
Ex1 and Ex2 occur the week of an exam, while Project Ex3 occurs the last week of the semester
before the final exam. These three one-week mini-projects address content areas like equations
of state, team contracts, curve fitting of experimental data, and material review before an exam.
In Table 1, the fun lab is cutting and threading steel pipe, soldering cooper piping, and pressure
testing the resulting systems using tap water. The two plant trips introduce the first-year majors
to pharmaceutical and food processing or energy production industries.
For each of the five major two-week projects in Table 1, a four-member team receives a formal
BEEF memo assigning six problems. One problem addresses the semester-long flow sheet

Table 1. Project Structure for the Introductory ChE Course
Topics Source Two-Hour
Sessions
Project P0 { done independently }
Problem-Solving Methodology CinChE: Ch. 1 1
HYSYS Simulation and Process Streams F&R: Ch. 3 1
Projects P1 and P2 { done as a team }
Material Balances (without and with reaction) F&R: Ch. 4 6
Material Balances (with recycle and reaction) F&R: Ch. 4 6
Project Ex1 { done as a team }
Fun Lab, Equations of State, Team Contract F&R: Ch. 5 2
Two-Hour Exam I { taken independently } 1
Projects P3 and P4 { done as a team }
Chemical Phase Equilibria F&R: Ch. 6 6
Energy and Energy Balances (no reactions) F&R: Chs. 7-8 6
Project Ex2 { done as a team }
Plant Trip, Content Review since Exam I F&R: Ch. 6-8 2
Two-Hour Exam II { taken independently } 1
Project P5 { done as a team }
Material/Energy Balances (with reactions) F&R: Ch. 9 6
Team Laboratory Oral Presentations Handouts 1
Project Ex3 { done as a team }
Plant Trip, Curve Fitting of Experimental Data F&R: Ch. 2.7 3
Three-Hour Final Exam { taken independently }
Total Sessions: 42
F&R - the Felder and Rousseau textbook; CinChE - the Instructional Companion by Hanyak
simulation project of determining the process requirements and "best" operating conditions to
manufacture styrene monomer from toluene and methanol using the Aspen HYSYS processor
simulator. Four analysis problems focus on manually solving the material balances, phase
equilibria, and energy balances of process equipment. When the number of students in the
course is not divisible by four, an extra analysis problem is assigned to five-member teams.
These analysis problems are intended to help the student engineers get a better understanding of
how HYSYS does its calculations for individual process units. The sixth problem is related to a
laboratory experiment conducted in the Unit Operations Laboratory. Each problem for the flow
sheet simulation project is taken from a manual entitled Chemical Process Simulation and the
AspenTech HYSYS Software by Dr.Hanyak.6 The analysis problems are usually taken from
Elementary Principles of Chemical Processes.4 The laboratory problem requires a team to plan,
conduct, analyze, and document a laboratory experiment that solves a problem presented by one
of BEEF’s clients. Each team is required to determine the relative imbalance on mass for each
experiment and in some cases also on energy.
At BEEF, Inc., student chemical engineers learn to apply the principle of material balances,
phase equilibria, and energy balances, when their team solves the well-defined problems in a
project. Like the anatomy of an ill-defined problem, a well-defined problem has an initial state,
a goal state, and solution paths; however, its solution paths will all give the same correct answer
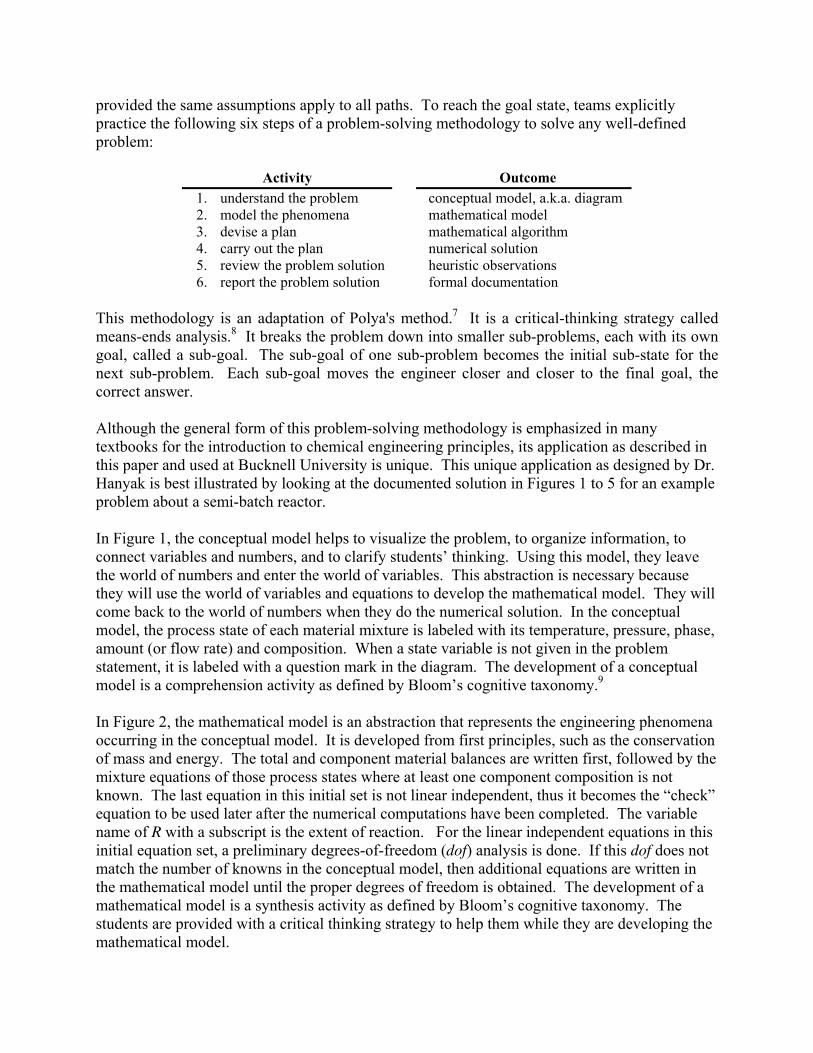
provided the same assumptions apply to all paths. To reach the goal state, teams explicitly
practice the following six steps of a problem-solving methodology to solve any well-defined
problem:
Activity Outcome
1. understand the problem conceptual model, a.k.a. diagram
2. model the phenomena mathematical model
3. devise a plan mathematical algorithm
4. carry out the plan numerical solution
5. review the problem solution heuristic observations
6. report the problem solution formal documentation
This methodology is an adaptation of Polya's method.7 It is a critical-thinking strategy called
means-ends analysis.8 It breaks the problem down into smaller sub-problems, each with its own
goal, called a sub-goal. The sub-goal of one sub-problem becomes the initial sub-state for the
next sub-problem. Each sub-goal moves the engineer closer and closer to the final goal, the
correct answer.
Although the general form of this problem-solving methodology is emphasized in many
textbooks for the introduction to chemical engineering principles, its application as described in
this paper and used at Bucknell University is unique. This unique application as designed by Dr.
Hanyak is best illustrated by looking at the documented solution in Figures 1 to 5 for an example
problem about a semi-batch reactor.
In Figure 1, the conceptual model helps to visualize the problem, to organize information, to
connect variables and numbers, and to clarify students’ thinking. Using this model, they leave
the world of numbers and enter the world of variables. This abstraction is necessary because
they will use the world of variables and equations to develop the mathematical model. They will
come back to the world of numbers when they do the numerical solution. In the conceptual
model, the process state of each material mixture is labeled with its temperature, pressure, phase,
amount (or flow rate) and composition. When a state variable is not given in the problem
statement, it is labeled with a question mark in the diagram. The development of a conceptual
model is a comprehension activity as defined by Bloom’s cognitive taxonomy.9
In Figure 2, the mathematical model is an abstraction that represents the engineering phenomena
occurring in the conceptual model. It is developed from first principles, such as the conservation
of mass and energy. The total and component material balances are written first, followed by the
mixture equations of those process states where at least one component composition is not
known. The last equation in this initial set is not linear independent, thus it becomes the “check”
equation to be used later after the numerical computations have been completed. The variable
name of R with a subscript is the extent of reaction. For the linear independent equations in this
initial equation set, a preliminary degrees-of-freedom (dof) analysis is done. If this dof does not
match the number of knowns in the conceptual model, then additional equations are written in
the mathematical model until the proper degrees of freedom is obtained. The development of a
mathematical model is a synthesis activity as defined by Bloom’s cognitive taxonomy. The
students are provided with a critical thinking strategy to help them while they are developing the
mathematical model.

Problem Statement
A new catalyst has been found that will produce styrene monomer at ambient conditions
(25ºC and 1 atm). The main reaction converts the reactants of toluene and methanol into
styrene monomer, water, and hydrogen. A side reaction converts the reactants into
ethylbenzene and water. The two reactants in stoichiometric proportion are placed into a
capped reaction vessel with the catalyst, and they are allowed to react isothermally. All
chemical components exist in the liquid phase, except hydrogen. How much material in kg-
mol is placed in the vessel initially to produce a desired amount of styrene monomer? The
molar conversion of the toluene is 80%, while the yield of the styrene is 75 mol%.
Conceptual Model
Diagram
initial time, ti final time, tf
no
flow
G
gas
capped vessel
Givens:
Rxn I: C7H8 + CH3OH C8H8 + H2O + H2 toluene methanol styrene
Rxn II: C7H8 + CH3OH C8H10 + H2O toluene methanol ethylbenzene
80 mol% conversion of toluene
75 mol% yield of styrene monomer
50.0
50.0
?
1
25
,
,
MEi
TLi
i
i
i
i
x
x
n
liquidPh
atmP
CT
Finds:
ni in kg-mol
G
gas
0.1
?
1
25
2,
HG
G
G
G
G
x
n
gasPh
atmP
CT
capped vessel
?
?
?
?
?
?
1
25
,
,
,
,
,
WAf
EBf
SMf
MEf
TLf
f
f
f
f
x
x
x
x
x
n
liquidPh
atmP
CT
Assumptions:
1. semi-batch process
2. basis of nf,SM = 150 kg-mol
Figure 1. Conceptual Model for the Example Problem of a Semi-Batch Reactor
In Figure 3, the mathematical algorithm is a plan (or blueprint) that identifies the independent
variables which satisfy the degrees of freedom (dof) and states the order in which the equations
from the mathematical model are to be solved. After defining its functional form of
[dependents] = f [independents], the students use a systematic partitioning procedure to move
equations from the mathematical model to their proper places in the mathematical algorithm.
The general format of a mathematical algorithm is a set of equations that can be solved directly,
then a set of equations that must be solved simultaneously (a SOLVE construct for a linear set or
an NSOLVE construct for a non-linear set), and finally a set of equations that must be solved last

in the mathematical algorithm. The development of a mathematical algorithm is an analysis
activity as defined by Bloom’s cognitive taxonomy.
In Figure 4, the numerical solution is done using the mathematical algorithm as a blueprint or
guide. This solution can be done manually with a pocket calculator, or it can be automated using
a computer program. The student identifies the base system of units and the basis for the
calculation, either a given amount (or flow rate) in the problem statement or an assumed one.
All “givens” are converted to the base system of units, all calculations as prescribed by the
mathematical algorithm are done in the base system of units, and all important “finds” are finally
converted from the base system of units to the desired units stated in the problem statement.
When the numerical solution is to be automated like in Excel or E-Z Solve, students are required
to do a dimensional consistency analysis as part of the mathematical algorithm development.
The development of a numerical solution is an application activity as defined by Bloom’s
cognitive taxonomy.
In Figure 5, the development of the heuristic observations is an evaluation activity as defined by
Bloom’s cognitive taxonomy. From the students’ experience of solving the well-defined
problem, what heuristic observations can they make that will give them a better understanding of
both the technical subject matter and the application of the problem-solving methodology?
These observations are made on the numerical solution, mathematical algorithm, mathematical
model, and conceptual model. They are general conclusions and/or recommendations that
students could apply to the solution of any well-defined problem. Basically, the development of
the heuristic observations is a reflective activity that seeks answers to “What If” questions.
The sixth and final step in the problem-solving methodology is the formal documentation of the
problem solution. Because the solution is more than just the numerical answers, the student
engineers of BEEF, Inc. are required to document their solution following the standards
prescribed in the company’s student handbook5. The documented results of these standards are
illustrated in Figures 1 to 5.
Because current textbooks on the introduction to chemical engineering do not support the
problem-solving methodology illustrated in Figures 1 to 5, the student engineers of BEEF, Inc.
are provided with an instructional companion by Dr. Hanyak.10
This document is designed to aid
students in the development of their critical thinking skills as an engineering problem solver.
The acronym for this instructional companion is CinChE, a Companion in Chemical
Engineering. The problem-solving methodology emphasized in CinChE provides a general
framework in which to solve any type of well-defined engineering problem. It is a systems
strategy that heavily uses the mental processes of decomposition, chunking, and pattern
matching. Numerous example problems are provided in CinChE for material balance, phase
equilibrium, and energy balance. The Acrobat portable-document-format (.pdf) version of
CinChE contains numerous annotations and web links that aid the student in understanding the
critical-thinking processes needed to develop the conceptual model, mathematical model,
mathematical algorithm, numerical solution, and heuristic observations.
The problem-solving methodology also reflects the Kolb learning cycle.11
The “Why?” part of
this cycle is the conceptual model. The “What?” part addresses the mathematical model. The

Mathematical Model
Total: Gn I + R1 = fn – in
in50.0
R1 MEf , in50.0
Gn I1
,
TL: – IR1 – IIR1 = TLfn , –
ME: – IR1 – IIn = –
SM: IR1 SMfn , =
EB: IIR1 EBfn ,
IIR1 WAfn ,
=
WA: IR1 + =
H2: R + = 0
mixture f: , , , ,f f TLn n f ME f SM f EB fn n n WAn
Conversion: 80.050.0 ,
TLfi nn
50.0 in
Yield: 75.050.0 ,
, TLfi
SMf
nn
n
# var' 10
# ' 9
1
s
eqn s
dof
Figure 2. Mathematical Model for the Example Problem of a Semi-Batch Reactor
Mathematical Algorithm
,i f SMn reactor n
I
1. R q SMfn ,
n I
2. G q R
3. ,, ,i f TLSolve n n in
0.50(0.20) in ,
− f TLn
0.50(0.75) in ,0.75
= 0
− f TLn SMfn ,
II
=
End
4. ,0.50 i f TL In n RR q
,
5. f WAnI II
q R R
6. f , EBnII
q R
7. ,f Mn 0.50 i I IIn R RE q
8. fni G In n R q
Figure 3. Mathematical Algorithm for the Example Problem of a Semi-Batch Reactor

Numerical Solution E-Z Solve Model, Michael Hanyak, March 12, 2009
/* Semi-Batch Reactor Example, CinChE Manual, p. 5-18
/* 1 - TM */ - nG + R1 = nf - ni
/* 2 - TL */ - R1 - R2 = nftl - 0.50*ni
/* 3 - ME */ - R1 - R2 = nfme - 0.50*ni
/* 4 - SM */ R1 = nfsm
/* 5 - EB */ R2 = nfeb
/* 6 - WA */ R1 + R2 = nfwa
/* 7 - H2 */ - nG + R1 = 0
/* 8 - conv */ 0.50*ni - nftl = 0.80*0.50*ni
/* 9 - yeild */ nfsm = 0.75*(0.50*ni - nftl)
nfsm = 150 /* kg-mol */
Givens: nfsm = 150 kg-mol
Finds: R1 = 150 kg-rxn
nG = 150 kg-mol
ni = 500 kg-mol
nftl = 50 kg-mol
R2 = 50 kg-rxn
nfwa = 200 kg-mol
nfeb = 50 kg-mol
nfme = 50 kg-mol
nf = 500 kg-mol
Figure 4. Numerical Solution for the Example Problem of a Semi-Batch Reactor
Heuristic Observations
Numerical Solution
mixture f: , , , , ,f f TL f ME f SM f EB f WAn n n n n n ????
Computational Check: 500 = 50 + 50 + 150 + 50 + 200 OK!
Mathematical Algorithm
Know ni instead of nf,SM, then math algorithm would not have a SOLVE construct.
Could solve the problem assuming ni and then scale the final answers.
Mathematical Model
Find the mole fractions of the liquid mixture at the end of the reaction (time tf).
Add liquid composition equations as Equations 10 to 14 to the mathematical model.
Place these composition equations into the mathematical algorithm as Steps 10 to 13.
Change the computational check to be the sum of mole fractions instead of flow rates.
Conceptual Model
What if no exit stream existed; that is, a batch system. What would the final pressure be?
Can the ideal gas law be used to find the pressure? What about safety considerations?
Figure 5. Heuristic Observations for the Example Problem of a Semi-Batch Reactor

“How?” part covers the mathematical algorithm and numerical solution. Finally, the “What If?”
part is the heuristic observations.
Course Implementation (How?)
The major projects in the course are designed not to be doable by one individual in the two-week
time allotted to complete each project. A four-member team is given a formal memo assignment
for each of the projects outlined in Table 1. Each member of a team received a special symbol of
゚, ヰ, `, or ゙ on the first day of the course to identify them as a unique member in their team.
Project roles are assigned to each member, and the members rotated those roles from project to
project as shown in Table 2. The rotation schedule for a five-member team has a different table,
since it must account for the fifth member whose assigned symbol is omega (Ȧ). The duties
specific to each role depend upon the problems being solved in a project as discussed below.
The six problems in each two-week project drive the learning on the particular content listed in
Table 1, as well as the learning on how to apply the problem-solving methodology. As
mentioned earlier, each major project has one HYSYS problem, four analysis problems for a
four-member team, and a laboratory problem. In a project, the HYSYS component is a self-
learning activity, the analysis component is a cooperative and team-based activity conducted in
the classroom, and the laboratory component is a team-based activity.
Table 2. Four-Member Team Rotation Schedule for the Project Roles
Project Role Project 1 Project 2 Project 3 Project 4 Project 5
Coordinator club spade heart diamond club
Observer diamond club spade heart diamond
Monitor heart diamond club spade heart
Assembler spade heart diamond club spade
HYSYS Problem. Two to three problems are assigned per project from the HYSYS manual by
Dr. Hanyak.6 This manual contains eight tutorials that introduce the students to the HYSYS
process simulation software, five process unit assignments that help them to develop their
abilities and confidence to simulate individual equipment (like pumps, heaters, reactors, and
distillation columns), and seven process flow sheet assignments that each member of the team
solves for a different reactor condition, in order for the team to determine the process
requirements and "best" operating conditions to manufacture styrene monomer from toluene and
methanol. These tutorials and exercises in the HYSYS manual are the self-learning component
of the course that students are to document independently in their technical journal. Since no
class time is spent on how HYSYS works, students are encouraged to consult with their
teammates while doing these assignments. A teaching assistant is provided to answer any
questions students might have about the HYSYS problems. Once members of a team have
completed and documented the HYSYS problems in their technical journal, the team meets and
collectively answers questions about the HYSYS assignment, and they document those answers
in the team’s project memo. Students are responsible to know the material associated with the
HYSYS tutorials and exercises, since this material may appear on the two, two-hour
examinations and the three-hour final exam, which are open-book tests that students complete by
themselves.

In addition to the self-learning HYSYS activities, students must complete and document in their
technical journal one-page quizzes that are accessed from the Blackboard system. Of the six to
nine quizzes provided per project, students are required to complete at least three of them. These
quizzes are essentially drill-and-practice activities. Another self-learning activity is one eLEAPS
session per project, which is accessed from the Blackboard system. The eLearning Engineering
And Problem Solving system by Oguzie and Hanyak is a surrogate coaching technique that
leverages the power of Adobe Acrobat for script development by instructors and Adobe Reader
for active learning by students.12
Basically, it is used to coach students through the solution to a
problem, derivation, proof, etc. Starting with a template solution created by the instructor, the
student follows a coaching script that guides them through a solution in step-by-step increments
called interactions. At the beginning of the coaching script, students are directed to print a copy
of a template solution, which they fill-in as they progress through the coaching script. An
eLEAPS session is an external activity that replaces the content coverage usually done in a
traditional lecture-format setting.
The three independent and external activities of the HYSYS problem, one-page quizzes, and
eLEAPS session are documented by the students in their technical journals. To insure individual
accountability, a teaching assistant inspects and evaluates each technical journal at the end of
each project.
Analysis Problems. The six-step, problem-solving methodology serves as the critical
framework in which to foster communication and teamwork skills using the five tenants of
cooperative learning. Using this methodology, team members complete their assigned roles
while solving the four analysis problems (A1, A2, A3, A4, and for a five-member team, A5) in
each project. The assigned responsibilities for each role are given in Table 3.
Table 3. Major Responsibilities for the Analysis Roles
coordinator helps the team to identify and understand its goals and
keeps everyone on task during the work sessions.
observer double-checks the problem solutions before they are
submitted and conducts the group processing activity.
monitor checks that everyone understands the problem solutions
and the strategies used to get them.
assembler prepares the project report packet and makes sure it is
turned in on time.
troubleshooter asks the “What if …?” questions and encourages the
discussion of opposing ideas.
For a four-member team, the coordinator also takes on the role of the troubleshooter. As given
in Table 2, team members rotate these roles from project to project to insure over the 14-week
semester that each team member experiences the responsibilities of each role at least once.
During the two weeks for a project, a two-hour, cooperative learning session (a.k.a. class time) is
devoted to each step in the problem-solving methodology, as illustrated in Table 4. The format
in Table 4 was specifically designed by Dr. Hanyak to incorporate the five tenants of cooperative
learning— positive interdependence, individual accountability, face-to-face promotive
interaction, appropriate use of teamwork skills, and regular self-assessment of team
functioning.13
At each co-op session, all students in a team are focusing on the same step in the

problem-solving methodology, but each is doing it on a different analysis problem. Before a co-
op session, a team member must develop a draft outside of class for that step in the problem-
Table 4. Four-Member Team Solving Problems A1, A2, A3, and A4
Project First Week Second Week
Role Monday Wednesday Friday Monday Wednesday Friday
Coordinator Diagram, A1 Model, A2 Algorithm, A3 Laboratory Solution, A4 Heuristics, A1
Observer Diagram, A2 Model, A3 Algorithm, A4 Laboratory Solution, A1 Heuristics, A2
Monitor Diagram, A3 Model, A4 Algorithm, A1 Laboratory Solution, A2 Heuristics, A3
Assembler Diagram, A4 Model, A1 Algorithm, A2 Laboratory Solution, A3 Heuristics, A4
solving methodology and bring it to that session (e.g., a draft of the conceptual model for the first
Monday, a draft of the mathematical model for the first Wednesday, etc.). These drafts are used
to focus the in-class reviews conducted by the groups of students working on the same problem
(i.e., those students with the same assigned symbol shown in Table 2). The instructor monitors
these group reviews and also provides his or her guidance and feedback. When team members
move to the next co-op session, they will all have the same focus but on a different problem as
shown in Table 4. At the end of the two weeks, all team members will have worked on all four
analysis problems and interacted with their team members, as well as with students from other
teams. In the sixth session, teams are required to spend time doing group processing; that is,
doing self-assessment to examine and enhance their teamwork skills. The documentation or
sixth step in the problem-solving methodology is done continuously over the two-week period,
starting with the conceptual model (a.k.a. diagram) and ending with the heuristic observations.
In Table 4, the second Monday is not devoted to a co-op session, but teams conducting
experiments in the Unit Operations Laboratory. Half of the teams work in the lab for the first
two hours on the second Monday afternoon, while the other half work in the lab for the last two
hours on that same Monday afternoon. The problem-solving methodology is used to prepare the
teams for a laboratory experiment using a portion of the first Monday, Wednesday, and Friday
co-op sessions and to complete the analysis after the experiment on the second Wednesday and
Friday coop sessions. Table 5 shows the general format for a two-hour co-op session.
As shown in Table 5, a co-op session begins with a brief mini-lecture of 10-20 minutes or
sometimes an online survey to probe students’ current understanding of topics. This activity is
usually followed by an activity where students complete a worksheet individually and/or in
teams while the professor circulates to ask and answer questions. About 30 minutes into the
class, half of the teams go to their particular laboratory experiment where course teaching
assistants (TAs) are waiting to answer questions and help guide the teams as they study, diagram,
and model the system.
Meanwhile, back in the classroom, the members of each team with the same symbol (e.g., hearts
in Table 4) gather together to review their drafted solution parts of an analysis problem (A1, A2,
A3, or A4) and receive feedback from the instructor. After about 30 minutes, the teams working
on the problems and those working on the labs switch places for the next 30 minutes. For the
remaining 30 minutes of the class period, another activity usually involves the introduction of a
new topic and explanation by the instructor. This activity also often involves students working

on laptop computers utilizing software such as E-Z Solve or HYSYS. The class typically ends
with team preparation for the next class or an online survey.
Table 5. Example of a Cooperative Learning Agenda for a Typical Two-Hour Class
Teams 1 and 2 Teams 3 and 4 Teams 5 and 6 Teams 7 and 8
12:55 p.m. Get a Notebook Computer and Sit in Your Team Area.
Go to Course Materials Cooperative Learning Agenda Project 1 cla P1_W1W Handouts.
1:00 p.m. Take Project P1.A# Math Model Survey using Team 360
1:05 p.m. Team Feedback about the Stoichiometric Balance Reading
CinChE, Appendix A, Pages A-12 to A-14
1:15 p.m. Problems P1.H1 and P1.L1 General Questions and Answers
P1.H1 – used HYSYS Manual/pdf_soln.hsc; P1.L1 – flow meter correction, see Bb course
1:30 p.m. Gas/Liquid Mixers, D 33
Math Algorithm & Safety
Gas/Liquid Mixers, D 33
Math Algorithm & Safety Problems A1-A5 Review Math Models, D 134
2:00 p.m. Problems A1-A5 Review Math Models, D 134 Gas/Liquid Mixers, D 33
Math Algorithm & Safety
Gas/Liquid Mixers, D 33
Math Algorithm & Safety
2:30 p.m.
Partitioning Algorithm: CinChE, Chapter 4, Pages 4-12 to 4-13
Open eLEAPS P01 Mathematical Algorithm Session
Mathematical Algorithm, Semi-Batch Reactor Example
in CinChE Manual, Chapter 5, Pages 5-18 to 5-23
Complete Solution in Assignments Section of the Bb CHEG 200 Course
2:50 p.m. Return notebook computers to right shell and plug power in.
Laboratory Problem. For Projects P2 to P5, teams rotate through the distillation column,
membrane separation, spray dryer, and filter press experiments. During Project P1, all teams
conduct a liquid mixing and gas mixing experiment. Teams are provided with a bound
laboratory notebook, which they use to document their laboratory-related activities. Team
members are assigned roles which they rotate from project to project. The responsibilities for the
laboratory roles are defined in Table 6.
For a four-member team, the coordinator also takes on role of the troubleshooter. All
documentation for these responsibilities is done in the team’s laboratory notebook. The rotation
schedule from project to project for the laboratory roles defined in Table 6 is shown in Table 2.
The team’s lab notebook is inspected and evaluated by a laboratory assistant during each of the
six meeting times in a project.
Table 6. Team Member Roles for a Laboratory Experiment
Before the Second-Monday Laboratory
Coordinator - Establishes the objectives and models the experiment.
Observer - Examines the equipment environment and constructs a diagram.
Monitor - Develops the experimental procedure and identifies safety issues.
Assembler - Develops the data tables and methods of analysis in an Excel file.
Troubleshooter - Reviews the above work products and asks the “What if?” questions.

During the Second-Monday Laboratory
Coordinator - Coordinates the specific roles and the experimental operation.
Observer - Observes and records the experimental data in the lab notebook.
Monitor - Monitors and modifies the experimental procedure in the lab notebook.
Assembler - Records all data in the Excel file and place a copy in the lab notebook.
Troubleshooter - Supervises safety and health issues during the experimental operation.
After the Second-Monday Laboratory
Coordinator - Drafts the intro, results, and conclusion sections in the lab notebook.
Observer - Drafts discussion section for the experimental results in lab notebook.
Monitor - Prepares any additional data tables and graphs in the lab notebook.
Assembler - Performs the data analyses and documents them in the lab notebook.
Troubleshooter - Reviews the memo for clarity, conciseness, and grammar.
For each laboratory problem in Projects P1, P2, P3, and P4, the instructor and the four laboratory
assistants (one for each experiment) provide guidance and feedback, in order to develop the
team’s technical, teamwork, and documentation skills. During Project P5, a team is to
demonstrate how well they have learned to plan, conduct, analyze, and document a laboratory
problem. The instructor and lab assistants do not provide guidance and feedback when a team
solves the laboratory problem for Project P5. Basically, the P5 laboratory problem serves as a
test of a team’s abilities to complete the lab assignment, independently. For the P5 laboratory
experiments only, teams prepare and deliver a 20-minute oral presentation on the last Monday of
the semester.
Summative Assessments. This section addresses grading instruments used by the instructor and
teaching assistants to evaluate a student’s performance as a professional engineer and as a team
member in BEEF, Inc. Their promotion to the rank of sophomore chemical engineers is based
on their individual contribution to and knowledge gained from the team projects (50%), the two
examinations (10% for the first and 15% for the second), and a final exam (25%) Five examples
of this evaluation policy are illustrated in the Excel worksheet of Figure 6 for some fictitious
students. During the semester, each student receives an individualized copy of Figure 6 after the
first and second exams, in order for them to gauge their progress in the course.
In the Excel worksheet of Figure 6, each column labeled with “Project Avg” is the project
quality on a scale of 0 to 100% that is based on a project report submitted by a team and
evaluated by a teaching assistant using a grading rubric and policies established by the instructor.
An example project grading rubric is shown in the Excel worksheet of Figure 7 for a specific
team. A project report consists of a summary memo and its attachments of a timesheet, original
project memo assignment, and six solutions to the project problems. The BEEF student
handbook by Dr. Hanyak presents guidelines to write a clear and concise memorandum and
standards to document the six problem solutions in a project.5 In Figure 7, the “Project Quality”
has two components—a “performance factor” and a “solution average” for the six project
problems. Each problem solution is evaluated on its problem statement, conceptual model,
mathematical model, mathematical algorithm, numerical solution, and heuristic observations as
shown in Figure 7. Out of 100 points for a problem solution, 60 points are assigned to the
mathematical model and heuristic observations, because they represent the higher-order thinking

Journal
Rating
Peer
Rating
Project
Avg
Work 1
Quality
Journal
Rating
Peer
Rating
Project
Avg
Work 2
Quality
Journal
Rating
Peer
Rating
Project
Avg
Work 3
Quality
Peer
Rating
Project
Avg
Work
Quality
Project
WorkExam 1 Exam 2
Final
Exam
3-Exam
Avg
Project
Factor
Course
Avg
P0.2
Bonus
Letter
Grade
Team Last Name First J1-J2 P1-P2 P1-P2 P1-P2 J3-J4 P3-P4 P3-P4 P3-P4 J5 P5+Ex's P5+Ex's P5+Ex's P5 Lab P5 Lab P5 Lab
1 Excellent Joe 1.05 1.02 86 92 1.10 1.03 90 102 1.10 1.02 91 102 1.03 91 94 98 104 77 104 96 1.05 99.5 0.35 A
2 Good Mary 0.99 1.00 86 85 1.08 1.05 90 102 1.10 1.03 96 109 1.05 89 93 98 71 62 89 77 0.85 80.2 0.60 B-
3 Fair Bob 1.08 1.02 86 95 1.10 1.03 90 102 1.10 1.05 91 105 0.95 92 87 98 79 77 57 67 0.74 70.0 1.35 C-
4 Poor Jane 0.95 0.88 87 73 1.08 0.95 93 95 1.00 0.99 96 95 0.98 88 86 87 60 67 65 65 0.71 63.4 -0.35 D
5 Bad Tim 1.05 0.93 94 92 1.10 0.98 95 102 0.98 0.99 95 92 0.97 89 86 94 55 54 44 49 0.54 49.9 -0.55 F
Below are Five Examples of How Course Grades are determined for Some Fictitious Students
These grades includes journal ratings, team peer ratings, team project averages, and exams.
Maintaining quality project work and good exam scores are very important in this grading scheme.
Figure 6. Example Evaluation Policy for the Introductory Chemical Engineering Course at Bucknell University
Project Work = [ 0.80 * average (Work 1, 2, and 3 Qualities) +
0.20 * ( Work P5 Lab Quality) ]
where the "Project Work" reflects your individual contribution to complete the bi-weekly project assignments. The three work
qualities are calculated as follows:
Work 1 Quality = journal rating * peer rating * Projects 01-02 average.
Work 2 Quality = journal rating * peer rating * Projects 03-04 average.
Work 3 Quality = journal rating * peer rating * "P5 + Ex1,2,3" average.
Please note that the project average for P5 is for the HYSYS and analysis problems only plus the three Ex's mini-projects.
The lab problem in P5 is treated as a separate project.
The P5 lab problem is a test of your team's ability to complete a lab assignment with little or no help from your project
supervisors. Your work quality in the P5 lab is determined as follows:
Work P5 Lab Quality = peer rating * P5 Lab average.
The P5 Lab average is based on 70% for the team lab notebook and 15% for the team lab memo report and 15% for the team lab
oral presentation.
Course Avg = [ 0.50 * ( Project Work ) * (Project Factor) +
0.10 * ( Exam 1 ) +
0.15 * ( Exam 2 ) +
0.25 * ( Final Exam ) ] / 1.00
where Project Factor = 1.10 * Exam Average
Exam Average = 0.2 * Exam 1 + 0.3 * Exam 2 + 0.5 * Final Exam
The "Project Factor" reflects the knowledge you have gained by working cooperatively in a team environment.
See Page 29 in the pink handbook for sophomore engineers about a team member's work quality.
You must do well on the exams,
because a project factor is
determined from them.
Your part as
a member of
a team. You
want to get
this as high
as possible.
HOW?
Your journal
rating which
you control,
and
your peer
rating which
is based on
your team's
assessment
of your
contribution.

To: Drs. Michael Hanyak and Timothy Raymond Date:
From: Team 6 Coordinator: Assembler:
Observer: Monitor:
Subject: CHEG 200 Project 2 Troubleshooter:
Project Memorandum: factor
1. Organization, appearance, neatness (0.1) 0.08
2. Purpose Statement (0.1) 0.10
3. Solution Method and Major Results (0.1) 0.10
4. Major Conclusions (0.1) 0.08
Problem Solutions:
1. Organization, appearance, neatness (0.1) 0.06
2. Completeness, each solution stapled (0.1) 0.09
3. Engineering paper, margins, headings (0.1) 0.07
4. Proper graphs and/or tables (0.1) 0.10
5. Numbers, units, conversion factors (0.1) 0.10
6. Block-in answers, precision (0.1) 0.05
Total = 0.83
H2 A1 A2 A3 A4 Lab
Problem Statement 10 10 10 10 10 10
Diagram & Assumptions 10 10 10 10 10 7
Mathematical Model 30 30 30 25 30 21
Mathematical Algorithm 10 8 8 8 5 9
Numerical Solution 10 6 8 8 9 8
Heuristic Observations 30 30 30 30 30 22
Total: 100 94 96 91 94 77
= x
= x =
Comments: Your team needs to consult the "Laboratory Notebook Guidelnes" handout to eliminate the
deficiencies marked in red in your lab notebook. Also, please consult Appenidx E in the
pink sophomore handbook to improve your memo report and to follow the documentation
standards for the problem solutions.
( solution average )
Project Quality 92.00.83 76
Project Quality ( performance factor )
(points)
(100)
Team Project Performance
(10)
(30)
(10)
(10)
(30)
Michael Adams
Performance Factor
Solution Correctness of Project Problems
Problem:
Figure 7. Evaluation Rubric for a Project Report Submitted by a Team
Chemical Engineering Department
Bucknell University
Lewisburg, PA 17837
Amanda RushMichael Adams
26-Feb-09
(10)
Julie Jefferson Carmen Bush

skills of synthesis and evaluation, respectively, in the cognitive domain of Bloom’s Taxonomy.
The performance factor on a scale of 0.0 to 1.0 is a measure of the appropriateness of the written
memo plus the professional workmanship of the project report. As shown in Figure 7, Team 6
for Project P2 had an excellent solution average of 92.0%, but a less than stellar performance
factor of 0.83. With these results, the project quality for Team 6 on Project 2 was a 76%.
In Figure 7, the score for the laboratory problem in a project is based on the grading rubric
shown in Figure 8. This rubric is maintained by each laboratory teaching assistant assigned to
supervise an experiment. As teams investigate their experiment in the Unit Operations
Laboratory for about a half-hour on the first Monday, Wednesday, and Friday of a project, the
laboratory assistant monitors the progress of the team using the first five sections in Figure 8.
The goal is to provide a team with sufficient feedback such that their laboratory notebook and
Excel worksheet are ready for doing the experiment on the second Monday of a project. When
doing the experiment, the team must enter experimental data into both their laboratory notebook
and Excel worksheet. Before they leave the experiment on the second Monday, a team must
show the laboratory assistant their percent relative imbalance for mass and (in some cases)
energy from within their Excel worksheet. During the co-op session on the second Wednesday
and Friday of a project, the laboratory assistants retrieve the team laboratory notebooks and
complete the evaluation of the last three sections in Figure 8. Basically, the grading rubric of
Figure 8 evaluates the content and professionalism of the team’s laboratory notebook, and its
scores are transferred to the “Lab” column in Figure 7 for the laboratory solution to the
experimental problem in a project. The instructor has a training session at the beginning of the
semester for the laboratory assistants and coaches them on how to run their experiment and
provide instructional feedback to the teams. On the second Monday, the instructor is present in
the laboratory, monitors the experimental work being supervised by each laboratory assistant,
and asks questions of and answers questions from the teams.
The previous two paragraphs have described how each team-based “Project Avg” column in
Figure 6 for the five major projects (P1, P2, P3, P4, and P5) is determined. After the teams have
completed two consecutive projects, a “Work Quality” is determined as illustrated in Figure 6 for
the first two projects (P1-P2). Basically, an individual grade is extracted from the averaged
score of the two projects by multiplying that averaged score by two factors – one for the
student’s performance on keeping a technical journal and one for the peer assessment of the
student’s performance while doing the two team projects. As shown in Figure 6, an individual
“Work Quality” is found for the combination of Projects P1 and P2, Projects P3 and P4, and
Projects P5, Ex1, Ex2, and Ex3. Also, a separate “Work Quality” is found for the laboratory
experiment of Project P5.
For the first three “Work Qualities” in Figure 6, a personal journal rating from 0.80 to 1.10 is
determined by a teaching assistant at the end of each project using the grading rubric as
established by the instructor and shown in Table 7. This rating is a measure of how well students
have been keeping their own technical journal and completing independently-documented (ID)
tutorials and quizzes in it. The technical journal is evaluated at two levels—organization and
independent work. For example, if students’ technical journals are organized and well

CHEG 200 Laboratory Notebook Checklist, Project ____
Experiment: ____________________________________________ Team _________
Coordinator: _______________________ Assembler: _________________________
Observer: _______________________ Monitor: _________________________
Troubleshooter: _________________________
Points Notebook Section
____/10 Purpose or Objective: ___ /4 What is being determined?
___ /6 Why? Who is the client?
____/10 Equipment: ___ /6 Major Equipment? How do they work? Make, Model, Serial#’s?
___ /4 Analytical Instruments? How do they work? Make, Model, Serial#’s?
____/10 Math Model:
___ /4 Updated diagram, mathematical model, and assumptions?
___ /6 Updated math algorithm with a units analysis? All measured variables?
____/10 Safety:
___ /6 MSDS info for all compounds? Important safety and health concerns?
___ /4 Safety level analysis? Corrective actions to lower safety risks?
____/10 Procedure: ___ /3 Global-level steps for major experimental equipment?
___ /3 Global-level steps for major analytical instruments?
___ /4 Selection and justification of statistical methods?
____/10 Experiment:
___ /3 Data recorded in lab notebook using ink? Entered into Excel spreadsheet?
___ /3 Calibration curves prepared and fitted? Flow rate corrections, if needed?
___ /4 Laboratory housekeeping and safety practices?
____/10 Analysis:
___ /6 Excel spreadsheet of updated mathematical algorithm? Good results?
___ /4 RIB’s and other requested info? Data tables and graphs, if appropriate?
____/10 Observations:
___ /6 Draft of major conclusions based on the purpose or objective?
___ /4 Draft of major recommendations to improve the experiment?
____/20 Record Keeping:
___ /8 Lab Notebook Organization?
___ /8 Lab Notebook Appearance and Neatness?
______ ___ /4 Instructor signed and dated lab notebook?
100
Comments:
Date: _____________ Lab Assistant: ______________________________ Page 1 of 1
Figure 8. Evaluation Rubric for a Team’s Laboratory Notebook

maintained, and they have completed only the ID tutorials, then their journal rating would be
1.05. Organization means the guidelines for keeping a personal journal in the BEEF
Table 7. Rubric Guidelines for the Inspection of a Technical Journal
Quality Rating Organization Independently-Documented
superb 1.10 ID Quizzes and Tutorials done.
1.05 ID Tutorials done.
good 1.00
Organized, well maintained.
0.98 ID Quizzes and Tutorials done.
poor 0.94 ID Tutorials done.
0.90
Organized, loosely maintained.
unacceptable 0.80 Not organized or maintained.
student handbook are being followed. Maintenance means entries are being made and the table
of contents is being updated. Associated with each project will be a set of independently-
documented (ID) tutorials and quizzes. Students are expected to complete all ID tutorials
(HYSYS and eLEAPS sessions) and at least three ID quizzes to qualify for the indicated journal
rating. Students are encouraged to consult with their teammates while doing the ID tutorials and
quizzes. However, they must independently document their completion of these ID items and
place them in their technical journal. To do otherwise would be plagiarism. Normally, technical
journal ratings would adjust students’ peer ratings up or down by 10 percent. However, if their
journal is not organized or maintained, their journal rating will adjust their peer rating down by
20 percent, even if they have completed the ID items. In Figure 6, Column “Journal Rating, J1-
J2” is the averaged journal ratings for the first two projects. It would be factored with a “Peer
Rating, P1-P2” to determine an individual “Work 1 Quality” for the first two projects.
As shown in Figure 6, a team-based “Peer Rating” is multiplied by a “Journal Rating”. After
two consecutive projects, the team members complete a peer assessment survey on the
performance of each team member including themselves. This two-question survey is shown in
Table 8, and the students are provided with a description for each scale option appearing in the
first question. This peer survey is an adaption of the “Peer Rating of Team Members” rubric
found in the article by Oakley, et al.14
Table 8. Peer Assessment Rubric for the Member Performance in a Team
1. To what degree did the member fulfill his/her responsibilities in the team projects?
Scale: Excellent, Very Good, Satisfactory, Ordinary, Marginal, Deficient, Unsatisfactory, etc.
2. Provide your written comments on the performance of the member.
Based on all team members’ responses to Question 1 in Table 8, a “Peer Rating” is calculated for
each member of a team, and it represents the team’s assessment of an individual member’s
performance in the two consecutive projects. The value of a “Peer Rating” usually ranges from

0.8 to 1.05, although very poor performances can result in a score lower than 0.80. In Figure 6,
the “Journal Rating, J1-J2”, “Peer Rating, P1-P2”, and “Project Avg, P1-P2” are multiplied
together to get the “Work 1 Quality, P1-P2” for a team member in the first two projects. A
similar procedure is used to find the second and third “Work Qualities” in Figure 6.
In the first four projects, the laboratory experiment is counted as one of the six problems in a
project report. For the last project (P5), it is treated separately from the other five P5 problems,
because it represents a team’s work to complete an experiment without any advice from the
instructor or teaching assistant. In addition to the team’s lab notebook, a written memo report
and an oral presentation are presented by the team. The lab notebook is evaluated by the
laboratory assistants, and the written memo report is graded by the instructor. The oral report is
evaluated by the instructor and the teaching assistants using the rubric in Figure 9 created by the
instructor. In Figure 6, the “Project Avg, P5 Lab” is based on 70% for the team lab notebook,
15% for the lab memo report, and 15% for the team lab oral presentation. A “Work Quality, P5
Lab” score is the product of the “Peer Rating, P5 Lab” and “Project Avg, P5 Lab” scores. This
lab “Work Quality” is then averaged with the other three “Work Qualities” to get the personal
“Project Work” column in Figure 6. This column is an overall assessment of a team member’s
performance in teamwork activities for the semester, and it counts 50% towards the final course
grade.
The three exams shown in Figure 6 are open-book tests taken by each student, and they account
for the other 50% of the final course grade. The instructor grades the exams. The first and
second exams are two hours in length, while the final exam is three hours long. The first exam
covers material balances, while the second exam covers phase equilibrium and energy balance
without reaction. The final exam covers energy balance with phase change and reaction. Each
exam has two problems and an extra-credit exercise. Since the exam problems are similar to the
project problems, the students must apply the problem-solving methodology to complete a
conceptual model, mathematical model, a combined mathematical algorithm and numerical
solution, and some heuristic observations for each exam problem. Basically, the exams are
designed to assess deep learning as opposed to surface learning, because the students must
demonstrate their mastery of applying the problem-solving methodology. The extra-credit
exercise is worth 10% of the total score for the two exam problems. It mostly covers important
content, and it provides a mechanism for students to garner some extra-credit points, which are
added to their score for the two exam problems.
In Figure 6, Column “P0.2 Bonus” addresses the second problem in Project P0, which occurs
during the half-week (i.e., two co-op sessions) at the start of a semester. As individuals, the
students seek the solution to a cylindrical tank problem by finding the minimum diameter based
on economics for manufacturing a fixed volume tank. In the two co-op sessions, they learn to
apply the problem-solving methodology, use E-Z Solve to generate the table of numbers for
different diameters, plot the results in Excel, and apply the documentation standards defined in
the BEEF student handbook. Their performance on this assignment can earn them ±3 bonus
points that are added to or subtracted from their “Course Avg” in Figure 6, before d their final
letter grade in the course. A score above a 75% earns them positive bonus points, while any
score below 75% earns them negative bonus points. An example score of 85% translates into

CHEG 200 Oral Report Evaluation Form
Team: ______ Investigation: ______________________________ Date: ____________
A team has a maximum of 15 minutes to present their laboratory project, followed by a 10-minute question/answer period. Each
team member must participate in the oral presentation. As a team, you should tell the audience what you are going to tell them,
then tell them, and finally tell them what you told them. Assume the audience is other engineers and clients. Consult the links
in the CHEG 200 Blackboard course for advice on giving oral presentations.
Team Assessment U P F G E† weight Score
Attitude: Did the team have a professional attitude? Business-type
dress? Did all team members have significant oral roles?
(5 6 7 8 9 10) x 2 = ______
Introduction: Did the team present a title page with names? a clear purpose
statement of the problem? an overview for the audience?
(5 6 7 8 9 10) x 2 = ______
Technical Content: Did the team present accurate and appropriate technical
material? Did they actually solve the assigned problem?
(5 6 7 8 9 10) x 6 = ______
Summary: Did the team present the important conclusions? Did they
provide appropriate recommendations? Acknowledgement?
(5 6 7 8 9 10) x 2 = ______
Visual Aids: Did the team make effective use of PowerPoint slides,
pointer, transition effects, tables, diagrams, demonstrations,
etc.?
(5 6 7 8 9 10) x 2 = ______
Delivery: Good eye contact, voice dynamics, gestures, and use of oral
transitions? Did speakers fidget, stand straight? "ahs"?
“oks”?
(5 6 7 8 9 10) x 2 = ______
Questions: Where the questions answered effectively? Did all team
members equally participate in answering the questions?
(5 6 7 8 9 10) x 4 = ______
subtotal: ______
Timing: Deduct one unit for each minute over the time limit. (-5 -4 -3 -2 -1 0 ) x 10 = ______
______ ____________ †Excellent (9.5), Good (8.5), Fair (7.5), Poor (6.5), and Unacceptable (5.5).
Grade = 200
Evaluator’s Feedback for Each Team Member
_________________________
_________________________
_________________________
_________________________
Project Evaluator: ________________________________________ signature
Figure 9. Evaluation Rubric for a Team’s Project P5 Laboratory Oral Presentation

+1.20 bonus points ((85-75/25 * +3), while an example score of 55% translates into –0.80 bonus
points ((75-55)/75 * -3). Because of this plus/minus incentive, students take this bonus
assignment seriously. Problem P0.2 also serves as an introductory example of economic
optimization for a straightforward engineering problem. At the end of the course, the last
HYSYS assignment on the manufacture of styrene monomer from methanol and toluene also
serves as an introductory example of the economic optimization of the reactor temperature based
on maximizing the net profit for the process flow sheet.
To administer most of the above summative assessments, the instructor employs teaching
assistants who are sophomore, junior, and senior majors. However, the instructor administers the
peer rating assessments, grades the three exams, and maintains the course summative Excel
worksheet illustrated in Figure 6. The teaching assistants are paid out of the departmental
operating budget. One teaching assistant is needed to grade the projects, and one is needed to
inspect technical journals and act as a HYSYS consultant. Four laboratory assistants are needed
to cover four teams for the first lab section, and four more are needed for the second lab section.
On average, the combined workload of the teaching assistants is about twelve hours per week.
Based on the timesheets provided by the teams in their project reports, the student workload on
the major projects averages about 15 to 18 hours per week; that is, six hours for the co-op
sessions per week and 3 to 4 hours outside of class for each two-hour session in class.
Formative Assessments. In addition to the above summative assessments that determine a
course grade for each student, many formative assessment surveys are used to gather feedback
on how students are doing on a co-op-session-to-co-op-session basis, on a project-to-project
basis, and on the overall course content. Both the students and instructor use this feedback to
make adjustments in the learning process. During most co-op sessions, electronic surveys are
conducted in the web-based academic version of the Team 360 system to assess students’
knowledge based on reading assignments and outside learning activities.15
The academic version
of Team 360 was a joint development project started in 2004 between Dr. Hanyak and Ascendus
Technologies. The Team 360 system provides the unique feature that team members can view
their collated responses to the survey questions, along with the aggregated responses of their
teammates and the class average for each scored survey question.
During the last Friday of each project, students complete a mini-concept inventory of about six
questions on material pertinent to that project. After completing this inventory as individuals,
the team members confer and resolve any differences and then complete the same concept
inventory for the team. After using Team 360 to administer this inventory, the instructor
displays the individual and team averages and then discusses the inventory with the class while
randomly calling on students to explain their answers. A partial deck of playing cards is used for
randomly selecting students to answer questions (e.g., the card 3Ɔ is Member Ɔ in Team 3).
Team group processing, the fifth tenant of cooperative learning, is conducted during the last
Friday of Projects P1 and P2. Using Team 360, team members individually answer the questions
shown in Table 9. These questions were developed by a colleague at Bucknell University
(Michael Prince). The students are told that their responses to the four questions will be shared
anonymously with their teammates using Team 360. After completing the survey, the team
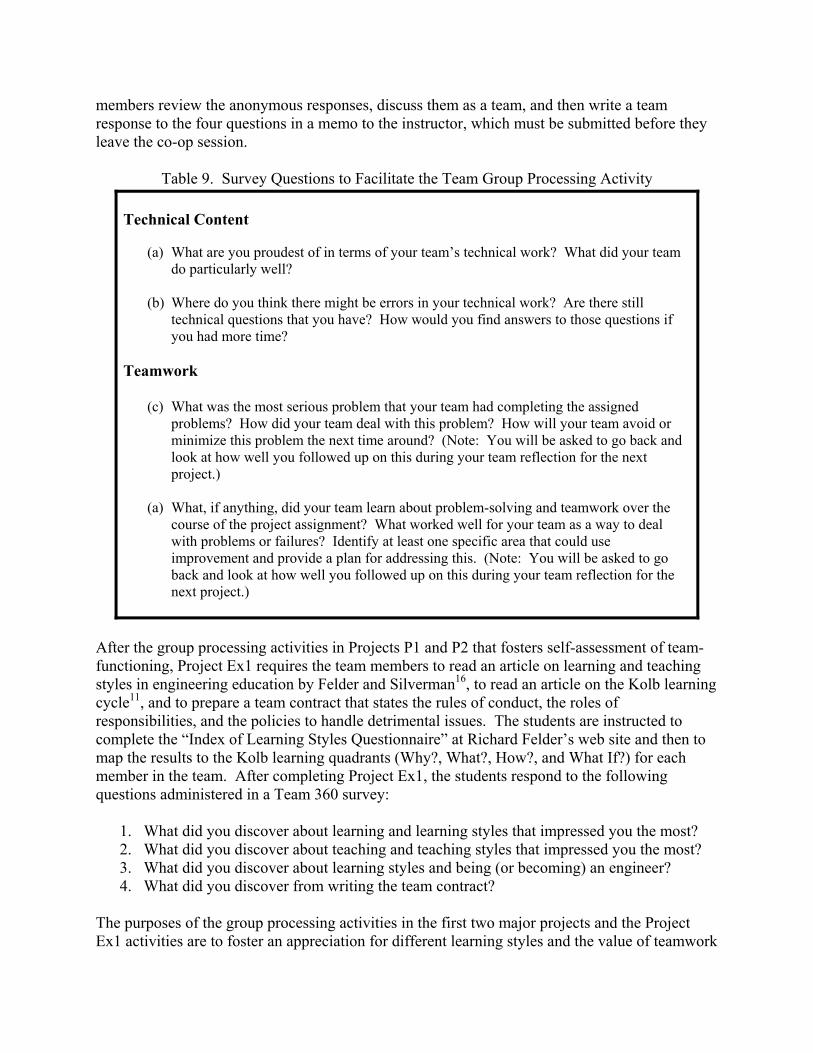
members review the anonymous responses, discuss them as a team, and then write a team
response to the four questions in a memo to the instructor, which must be submitted before they
leave the co-op session.
Table 9. Survey Questions to Facilitate the Team Group Processing Activity
Technical Content
(a) What are you proudest of in terms of your team’s technical work? What did your team
do particularly well?
(b) Where do you think there might be errors in your technical work? Are there still
technical questions that you have? How would you find answers to those questions if
you had more time?
Teamwork
(c) What was the most serious problem that your team had completing the assigned
problems? How did your team deal with this problem? How will your team avoid or
minimize this problem the next time around? (Note: You will be asked to go back and
look at how well you followed up on this during your team reflection for the next
project.)
(a) What, if anything, did your team learn about problem-solving and teamwork over the
course of the project assignment? What worked well for your team as a way to deal
with problems or failures? Identify at least one specific area that could use
improvement and provide a plan for addressing this. (Note: You will be asked to go
back and look at how well you followed up on this during your team reflection for the
next project.)
After the group processing activities in Projects P1 and P2 that fosters self-assessment of team-
functioning, Project Ex1 requires the team members to read an article on learning and teaching
styles in engineering education by Felder and Silverman16
, to read an article on the Kolb learning
cycle11
, and to prepare a team contract that states the rules of conduct, the roles of
responsibilities, and the policies to handle detrimental issues. The students are instructed to
complete the “Index of Learning Styles Questionnaire” at Richard Felder’s web site and then to
map the results to the Kolb learning quadrants (Why?, What?, How?, and What If?) for each
member in the team. After completing Project Ex1, the students respond to the following
questions administered in a Team 360 survey:
1. What did you discover about learning and learning styles that impressed you the most?
2. What did you discover about teaching and teaching styles that impressed you the most?
3. What did you discover about learning styles and being (or becoming) an engineer?
4. What did you discover from writing the team contract?
The purposes of the group processing activities in the first two major projects and the Project
Ex1 activities are to foster an appreciation for different learning styles and the value of teamwork
(i.e., the whole is better than the sum of its parts). For example, student comments to question 1
above included “I discovered that there are specific ways to improve your learning depending on
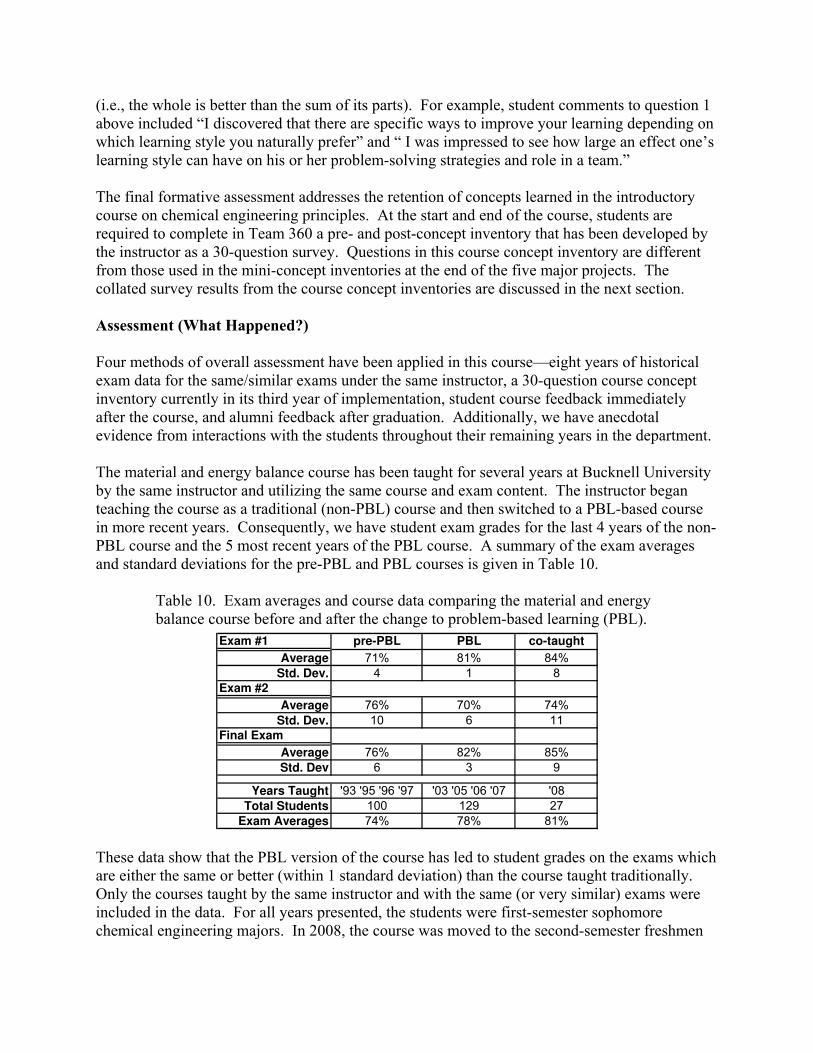
which learning style you naturally prefer” and “ I was impressed to see how large an effect one’s
learning style can have on his or her problem-solving strategies and role in a team.”
The final formative assessment addresses the retention of concepts learned in the introductory
course on chemical engineering principles. At the start and end of the course, students are
required to complete in Team 360 a pre- and post-concept inventory that has been developed by
the instructor as a 30-question survey. Questions in this course concept inventory are different
from those used in the mini-concept inventories at the end of the five major projects. The
collated survey results from the course concept inventories are discussed in the next section.
Assessment (What Happened?)
Four methods of overall assessment have been applied in this course—eight years of historical
exam data for the same/similar exams under the same instructor, a 30-question course concept
inventory currently in its third year of implementation, student course feedback immediately
after the course, and alumni feedback after graduation. Additionally, we have anecdotal
evidence from interactions with the students throughout their remaining years in the department.
The material and energy balance course has been taught for several years at Bucknell University
by the same instructor and utilizing the same course and exam content. The instructor began
teaching the course as a traditional (non-PBL) course and then switched to a PBL-based course
in more recent years. Consequently, we have student exam grades for the last 4 years of the non-
PBL course and the 5 most recent years of the PBL course. A summary of the exam averages
and standard deviations for the pre-PBL and PBL courses is given in Table 10.
Table 10. Exam averages and course data comparing the material and energy
balance course before and after the change to problem-based learning (PBL).
Exam #1 pre-PBL PBL co-taught
Average 71% 81% 84%
Std. Dev. 4 1 8
Exam #2
Average 76% 70% 74%
Std. Dev. 10 6 11
Final Exam
Average 76% 82% 85%
Std. Dev 6 3 9
Years Taught '93 '95 '96 '97 '03 '05 '06 '07 '08
Total Students 100 129 27
Exam Averages 74% 78% 81%
These data show that the PBL version of the course has led to student grades on the exams which
are either the same or better (within 1 standard deviation) than the course taught traditionally.
Only the courses taught by the same instructor and with the same (or very similar) exams were
included in the data. For all years presented, the students were first-semester sophomore
chemical engineering majors. In 2008, the course was moved to the second-semester freshmen

year and was co-taught by the previous instructor and a new instructor (who also taught the
course in 2004). These data are also included for comparison. We were originally concerned
that moving the course to the freshmen year might affect student performance leading to lower
course grades. The exam data and our own experiences interacting with the students have shown
this not to be the case. The freshmen performed identically, within standard deviations, to all
prior sophomore classes.
An in-house concept inventory (CI) was developed largely by the primary course instructor in
order to evaluate students’ understanding of key concepts from the course. The 30-question,
multiple-choice concept inventory (available upon request) was administered at the beginning of
the course for the past 3 years, at the conclusion of the two courses that have been completed,
and again to a class of 25 students one year after completion of the course. The average student
results for each question are shown below in Figure 10 for the class that took the same CI three
different times.
Material & Energy Balance Concept InventoryFirst-Year, 25 ChE Majors, Spring 2008
0.0
0.1
0.2
0.3
0.4
0.5
0.6
0.7
0.8
0.9
1.0
1 2 3 4 5 6 7 8 9 10 11 12 13 14 15 16 17 18 19 20 21 22 23 24 25 26 27 28 29 30
Question Number
Qu
esti
on
Mean
Pre-Course
Post-Course
1 Year After Course
Figure 10. Concept inventory data for a 30-question inventory administered to the same 25 students at
the beginning of the material and energy balance course (black - Pre-Course), at the conclusion of the
course (gray - Post-Course), and again one year after completing the course (striped - 1 Year After
Course).
While the data exhibit much variability, the average trend is clear. For the three times the CI was
administered pre-course, the class averages were 40%, 38%, and 42% respectively. For the two
classes that have completed the post-course CI, the averages were 58% and 60%. For the one
class that took the CI a year after the course, the class average was 62%. On average, the
students score around 40% on the pre-test, 60% on the post-test, and 62% a year after the course.
While the percentage score may seem low, the more important factor for a concept inventory is
the gain.17
Hake defines the gain, <g>, as (%post-test - %pre-test)/(100 - %pre-test). For the

two years of complete pre- and post-test data, the gain has been 0.30 and 0.35 respectively. This
gain can be compared with Hake’s data for a traditionally-taught course average of <g> = 0.23 ±
0.04 and an interactive engagement course average of <g> = 0.48 ± 0.14. Our results are within
about one standard deviation of the interactive engagement course average and they exceed the
traditionally-taught course average by 2 to 3 standard deviations. Thus, the CI results for this
course demonstrate a significant improvement in student concept knowledge beyond what would
be expected for a traditional course (based on Hake’s study of 6542 students in high school,
college, and university physics courses). Furthermore, the PBL approach utilized in this course
has been shown to create a learning environment that nurtures “deep” learning rather than
“surface/rote” learning while providing the best method for the development of lifelong learning
skills.18
From a recent departmental survey of Bucknell chemical engineering alumni within 10 years of
graduation, an open-ended question was asked: “Please provide an example (or more) of a skill
developed at Bucknell that particularly contributed to your post-graduate success.” While the
majority of responses referred to skills which were first introduced in the CHEG 200 course such
as teamwork, communication, and independent learning, one representative respondent
specifically mentioned the course with the following quote (exact): “attention to detail (CHEG
200 with Dr. Hanyak), developing good memo and report writing skills, the ability to handle
large projects, hands-on learning, overall a large degree of professional and intellectual growth.”
Other responses were analyzed and matched against departmental learning outcomes. Three of
the top four commonly identified areas included communication (33% of respondents),
teamwork (21%), and independent learning (12%) – all areas of focus for CHEG 200. These
survey data indicate that the practicing engineers who have graduated from our department
strongly value and rely on the skills originally introduced in this course. Over 60% of the
respondents attribute at least part of their post-graduate success to their skills in communication,
teamwork, or independent learning. Since this survey was an open-ended question providing no
prompts for answers, the percentages given represent minimums.
This course addresses nearly all of the ABET Criterion 3(a) through 3(k) on student outcomes
including outcomes related to conducting experiments, functioning in teams, solving problems,
professional responsibility, communication, life-long learning, and using modern engineering
tools. Specifically, the laboratory assignments address 3(b) and 3(k); the HYSYS simulations
address 3(i) and 3(k); the teamwork components address 3(d); and the projects address 3(a) and
3(e-g). These criteria are assessed in various direct and indirect ways.
For this course, one of the key outcomes directly assessed is teamwork, 3(d). Teamwork is
required to complete all project problems. After the second, fourth, and final projects, a team
member’s individual performance is assessed according to a peer assessment rubric. An
individual’s work quality is extracted from the team project grades using a technical journal
rating and peer rating of each team member. Another key area of assessment is content
competency, 3(a) and 3(e). Direct assessment of this outcome is by analyzing the grades for a
content-specific problem on one of the exams relating to material balances, energy balances, and
phase equilibrium. A final area of direct ABET assessment is analysis and evaluation, 3(b) and
3(e). Each team is required to practice a problem solving methodology (conceptual diagram,
mathematical model, mathematical algorithm, numerical solution, heuristic observations, and

formal documentation) while completing the four analysis problems. This methodology
incorporates the higher-ordered intellectual skills of Bloom’s taxonomy - application, analysis,
synthesis, and evaluation. Developing the mathematical model is a synthesis activity.
Formulating the mathematical algorithm is an analysis activity. Determining the numerical
solution is an application activity. Conducting heuristic observations (i.e., reflection) on the
numerical solution, mathematical algorithm, mathematical model, and conceptual model is an
evaluation activity.
Implementation Elsewhere (What If?)
This course has been specifically designed to fit into our Bucknell University teaching
environment which includes small class sizes of less than 40 students, a strong laboratory
component to the curriculum (typically 2 hours per week), and engineering classes which meet
for 4 standard classroom hours per week. These specific details do not preclude the adaptation
of this course to other university teaching environments. For instance, a class with significantly
more than 40 students could adapt the course by utilizing teaching assistants (TAs) who would
circulate around the room to smaller subgroups working on the same problem. Many schools
will only have 3.0 credit hours available for this course (3 classroom hours per week with no
laboratory component). This course format could be adapted by shortening the Problem Review
session to 20 minutes each day with 15 minutes both before and after for the mini-lectures and
activities. The day typically used for laboratory experiments could be used for in-class
demonstrations, videos, simulations, or as additional time to work example problems or address
student questions.
Summary
A team-based cooperative learning environment based on problem-based learning has been used
at Bucknell University to teach the first core course in the chemical engineering curriculum. This
course utilizes a variety of "best practices" to help prepare chemical engineering students in their
first course on chemical engineering. The course involves team projects where students complete
problems covering a range of materials and, at the same time, practice teamwork and
professional skills. Laboratory experiments, field trips, and independent learning of process
simulation software are also part of the course. Assessments include data from team self-reports,
concept inventories, individual and team surveys, individual and team grades, and course
evaluations. This paper has detailed the course structure and the various "best practices" used in
the course. Course assessments and evaluations including the concept inventory administered to
students one year after completing the course and the alumni survey, have demonstrated that
students gain deep understanding of course material while simultaneously developing skills in
teamwork, communication, and independent learning.
Bibliography
1. Gick, M.L., and K.J.Holyoak, “Analogical problem solving,” Cognitive Psychology, Vol. 12, 1980, p.306–355.

2. Prince, M., “Does Active Learning Work? A Review of the Research,” Journal of Engineering Education, Vol.
93, No. 3, 2004, pp. 223–231.
3. ACS Website http://portal.acs.org/portal/acs/corg/content, accessed March 2, 2009.
4. Felder, R. M. and R. W. Rousseau. Elementary Principles of Chemical Processes, 2005 Edition. John Wiley
and Sons, Inc. Hoboken, NJ, 2005.
5. Hanyak, Michael. Development of an Engineering Project: A Handbook for Sophomore Engineers. Chemical
Engineering Department, Bucknell University, Lewisburg, PA, 2008.
6. Hanyak, Michael. Chemical Process Simulation and the AspenTech HYSYS Software. Chemical Engineering
Department, Bucknell University, Lewisburg, PA, 2007.
7. Polya, G. How to Solve It: A New Aspect of Mathematical Method, Second Edition. Doubleday, Garden City,
NY, 1957.
8. Halpern, D. F. Thought and Knowledge: An Introduction to Critical Thinking, Second Edition. Lawrence
Erlbaum Associates, Inc., Hillsdale, NJ, 1989.
9. Bloom B. S. Taxonomy of Educational Objectives, Handbook I: The Cognitive Domain. David McKay, New
York, 1956. [online] URL: http://www.nwlink.com/~donclark/hrd/bloom.html.
10. Hanyak, Michael. Introduction to Chemical Engineering: An Instructional Companion. Chemical Engineering
Department, Bucknell University, Lewisburg, PA, 2009.
11. Harb, J. N., R. E. Terry, P. K. Hurt, and K. J. Williamson. Teaching Through the Cycle: Application of
Learning Style Theory to Engineering Education at Brigham Young University, Second Edition. Brigham
Young University Press, Provo, UT, 1995.
12. Oguzie, D. N. and M. E. Hanyak, A Web-Based Tool to Support Learning Engineering and Problem Solving.
Chemical Engineering Department, Bucknell University, Lewisburg, PA. Poster presented at the AIChE
Annual Meeting, San Francisco, CA, November 12-17, 2006.
13. Johnson, David. W., Roger. T. Johnson, and Karl. A. Smith. Active Learning: Cooperation in the College
Classroom. Interaction Book Co., Edina, Minnesota, 1998.
14. Oakley, B., R.M. Felder, R. Brent, and I. Elhajj, Turning Student Groups into Effective Teams. J. Student
Centered Learning, 2(1), 9–34, 2004.
15. Narayan, Vikram. The Team 360 Assessment System. Ascendus Technologies, Pittsburgh, PA, 2009. [online]
URL: http://www.ascendus.com.
16. Felder, R. M. and L. K. Silverman. Learning and Teaching Styles in Engineering Education. Engineering
Education, Vol. 78, No. 7, 1988, pp. 674-681.
17. Hake, R. R. 1998a. Interactive-engagement vs traditional methods: a six-thousand-student survey of mechanics
test data for introductory physics courses. American Journal of Physics 66(1):64-74. Available online at:
http://www.physics.indiana.edu/~sdi/.
18. D.R. Woods (2007) "Preparing for PBL" 3rd ed., McMaster University, Hamilton ON posted on the web 2007
at http://www.chemeng.mcmaster.ca/innov1.htm
![Payment of Wages Act, 1936 - Bihlabour.bih.nic.in/Acts/payment_of_wages_act_1936.pdf · THE PAYMENT OF WAGES ACT, 1936 ACT NO. 4 OF 1936 1* [23rd April, 1936.] An Act to regulate](https://static.fdocuments.in/doc/165x107/5aace4f47f8b9a9c2e8d902b/payment-of-wages-act-1936-payment-of-wages-act-1936-act-no-4-of-1936-1-23rd.jpg)


![Namibia – Insolvency Act 24 of 1936 - OSALL · INSOLVENCY ACT 24 OF 1936 [ASSENTED TO 17 JUNE 1936] [DATE OF COMMENCEMENT: 1 JULY 1936 Made applicable in Namibia with effect ...](https://static.fdocuments.in/doc/165x107/5acdbdf77f8b9ab10a8e0173/namibia-insolvency-act-24-of-1936-act-24-of-1936-assented-to-17-june-1936.jpg)


![Ante ORŠANIĆ_ Dr. Ante Starčević 1896-1936 [Jastrebarsko 1936.]](https://static.fdocuments.in/doc/165x107/577cc9e51a28aba711a4e5a0/ante-orsanic-dr-ante-starcevic-1896-1936-jastrebarsko-1936.jpg)