1934 VOL. 13 - americanradiohistory.com · 2019-07-17 · Improved 'Teleprinter Key board Technique...
102
JULY No. 1 1934 VOL. 13 www.americanradiohistory.com
Transcript of 1934 VOL. 13 - americanradiohistory.com · 2019-07-17 · Improved 'Teleprinter Key board Technique...

ELECTRICAL COMMUNICATION A Journal of Progress in the
Telephone, Telegraph and Radio Art H. T. KoHLHAAS, Editor
EDITORIAL BOARD
E. A. Brofos P. K. Condict G. Deakin E. M. Deloraine P. E. Erikson James E. Fullam F. Gill Frank C. Page H. M. Pease
John W. Foard
G. E. Pingree
Published Quarterly by the
/ur"runli"un/ Sruullurll E/ec/-rfc C"rpornffon Head Offices
67 BROAD STREET, NEW YORK, N. Y., U. S. A.
European General Offices
CONNAUGHT HOUSE, ALDWYCH, LONDON, W. C. 2, ENGLAND
G. E. Pingree, President S. G. Ordway, Secretary
Subscription, $J.OO per year; single copies 75 cents Joseph A. Redegeld, Treasurer
Volume XIII JULY, 1934
CONTENTS PAGE
IMPROVED TELEPRINTER KEYBOARD TECHNIQUE. . . . . . . . . . . 3 By F. R. Thomas
THE MEASUREMENT OF SMALL VALUES OF INDUCTANCE AND EFFECTIVE RESISTANCE. . . . . . . . . . . . . . . . . . . . . . . . . . . . . . 9
By J. K. Webb, M.Sc., A . M.I.E.E. and C. Brookes-Smith
APPLICATION OF TYPE c AND TYPED CARRIER SYSTEMS TO NON-STANDARD LINES............................... 14
By Bruce H. McCurdy and J. H . Holmes
TOLL TRANSMISSION PERFORMANCE IN RUMANIA. . . . . . . . . . 30
PROPERTIES OF LEAD AND LEAD ALLOY CABLE SHEATHS... 31 By J. C. Chaston, B.Sc., A .R.S.M.
THE PREDICTION OF PROBABLE SINGING POINTS ON LOADED CABLE CIRCUITS. . . . . . . . . . . . /' f. • • • • • • • • • • • • • • • • • • • • 5 1
By E. L. E . Pawley, M.Sc.
COMMUNICATION SYSTEM FOR THE ITALIAN SQUADRON TRANSATLANTIC FLIGHT . . . . ... . . -. <.. . . . . . . . . . . . . . . . . 61
By Ellery W. Stone
THE NEW "STANDARD" RADIO RECEIVERS FOR COMMERCIAL LINKS (R.M.6, R.M.7 and R.M.8) . . . . . . . . . . . . . . . . . . . . 69
By L. J. Heaton-A rmstrong, A . C.G.I., B.Sc., D.I. C., and L. 'T. Hinton, A . C.G.I., B.Sc., A .M.I.E.E.
RADIO EQUIPMENT FOR AIRCRAFT....................... 76 By D. B. Mirk, H. M. Samuelson and W. Bond
RECENT TELECOMMUNICATION DEVELOPMENTS OF INTEREST 92
TELEPHONE AND TELEGRAPH STATISTICS OF THE WORLD. . . 94
Number 1
www.americanradiohistory.com

Headquarters Building, Societatea Anonima
Romana de Telefoane, Bucarest, Rumania
www.americanradiohistory.com

Improved 'Teleprinter Key board Technique
By F. R. THOMAS Creed & Company, Limited, Croyden, England
THE introduction of Teleprinter Systems has had a profound influence on telegraph practice; for, since their intro
duction and substitution for the earlier Morse, Hughes, and other types of printer equipment, service has been sped up and costs reduced, with resultant stimulation to the earliest branch of electrical communication. Teleprinter Systems also have extended the scope and usefulness of telegraphy in commerce and industry so that today, for example, numerous firms have made provision for the rapid and exact transmission of orders, instructions, and information, between their offices and works.
Experience in these new fields focussed attention upon the desirability of providing Teleprinters with a keyboard conforming strictly to that of the commercial typewriter. This had hitherto been considered impracticable as it appeared to necessitate the use of a six-unit code which would have precluded inter-communication with existing systems.
Typewriter Characteristics
The commercial typewriter keyboard comprises four rows of keys. Each key controls a typebar carrying two type faces placed one above the other on the type-pad, these being known as the "upper case" and "lower case" type faces. The keys are labelled to correspond with the two type cases, and when the upper case is required it is preselected by depressing a shift key. This raises the type basket from the lower to the upper position.
The speed of operation is dependent only upon the ability of the typist.
Teleprinter Characteristics
The five-unit telegraph code used by Teleprinter Systems provides a maximum of thirtytwo signal permutations. After allocating combinations to the various functions such as carriage
3
return and line feed, twenty-eight are left for other purposes. In order to use these for letters, figures and punctuation signs it is self-evident that a "shift" mechanism must be incorporated in the printer. Two of the twenty-eight combinations are required for setting this mechanism in the required position, and there are thus left twenty-six combinations, each of which can be used for two characters.
Since the whole of one "case" is needed for the letters of the alphabet, the figures are included in the other "case" along with the punctuation signs, and it is necessary to transmit the appropriate shift signal to the printer when changing from one case to the other.
This departure from typewriter practice has necessitated typists receiving some preliminary instruction before operating Teleprinter keyboards.
There is a further difference in operation in that the speed of typing on Teleprinter Systems is limited by the transmission speed, which is seventy-two words per minute.
New Commercial Keyboard for Teleprinters
Creed & Company have now solved the problem of double case operation with the retention of a five-unit code by arranging for the automatic insertion of a shift signal whenever the sending of a figure or punctuation mark is required. In order to transmit this additional signal without slowing down the operation, a storage device has been provided which holds the permutations corresponding to the key last depressed until the appropriate shift signal has been automatically transmitted. This has enabled them to provide a keyboard conforming strictly to the commercial typewriter layout in which both figures and symbols are accommodated on the fourth row of keys, the symbols being selected by holding down a shift key. In the design of this new keyboard the physical dimensions in regard to the separation of the keys have been
www.americanradiohistory.com

4 E L E C T R I C AL C O M M U N I C A T I O N
determined from a study of many well-known commercial typewriters (Figs. 1 and 2) .
Incidentally, the provision of this storage feature frees the keyboard from the transmitting mechanism and so gives the operator relative
Figure 1
freedom of operation from the limitation of the speed of the transmitting mechanism. The speed of line transmission is fixed at fifty bauds which corresponds to a continuous operating speed of approximately seventy-two words per minute.
Commercial typists rarely operate continuously at speeds exceeding an average of 45 w. p. m., but when typing short words and frequently used syllables they often attain speeds over 100 w. p. m. When operating at a speed of 45 w. p. m. , the typist is well below the Teleprinter transmission speed, and there becomes available time equivalent to 2 7 w. p. m. for use, with the storage device, for short typing spurts at high speed, and actually permits the operation of two keys in succession at the rate of 1 80 w. p. m., three keys at 1 68 w. p . m. , four keys at 125 w. p. m. , and so on, until finally the uniform transmission speed of 72 w. p. m. is reached.
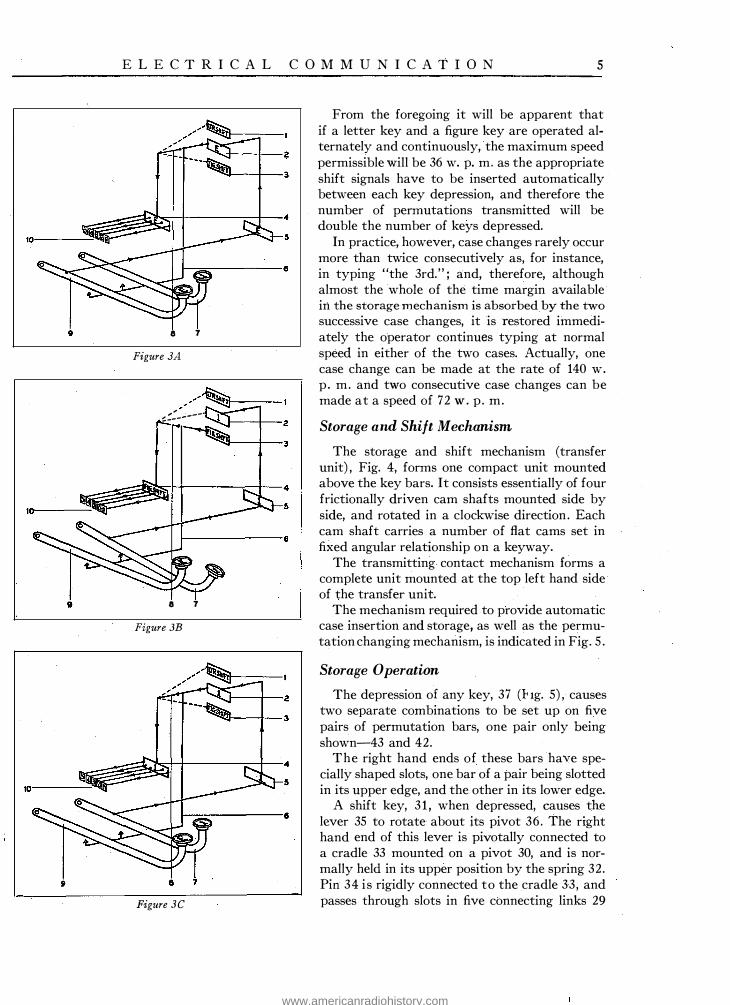
Principle of Operation
The storage and shift insertion devices are shown schematically in Figs. 3A, 3B and 3C, in which 9 is a "letter" key, E ; 5 represents permutation bars on which five-unit permutations are set up by the depression of any key ; 2 is the first stage of storage; 4 is the second stage of storage ; 10 represents the successive transmission of the five signal units ; 7 is a "figure" key, 1 ; 6 is a control to all keys which, through 8, causes the second storage stage 4 to be connected to a permanently established "figure shift" 3 or "letter shift" 1 , when a change of case is required.
·
Fig. 3A shows the normal condition existing after the depression of the letter E, key 9. The
E permutation has been set up on the bars 5 , transferred to the first storage 2 , then to the second storage 4, and thereafter transmitted as five successive units. This condition persists until the next key is depressed. As the five units are transferred simulataneously from one storage stage to the next it will be seen that another key can be operated immediately the preceding permutation has been transferred from the bars 5 to the first storage 2 . Before a third key can be depressed the first and second permutations must be passed onwards, and suitable locking means is provided at each stage to prevent the interference of successive permutations.
Fig. 3B shows the conditions established by the depression of a "figure" key 7 following a "letter" key. When the key is depressed not only is the appropriate permutation set up on the bars 5 , and passed to the first storage 2 , but the second storage is connected to the permanently established figure-shift permutation 3, which it picks up and transfers to the transmitter 10. The permutation in the first storage is held by a lock until the transmission of the figure-shift is effected, and it is then transferred to the second storage by the automatic reversion of the control 8 to the position shown in Fig. 3C.
A similar action takes place when a change from figures to letters is made, except that the control 8 connects the second storage to a permanently established letter-shift 1 .
I t will be noted that the controls 6 and 8 only operate where there is a change of case ; that is, the appropriate shift signal is only transmitted when there is a change from letters to figures or vice versa.
Figure 2
www.americanradiohistory.com
9
9
E L E C TR I C A L C O M M U N I C ATIO N 5
8 7
Figure JA
,,-,'� • ��:-----
8 7
Figure 3B
Figure JC
From the foregoing it will be apparent that if a letter key and a figure key are operated alternately and continuously, the maximum speed permissible will be 36 w. p. m. as the appropriate shift signals have to be inserted automatically between each key depression, and therefore the number of permutations transmitted will be double the number of keys depressed.
In practice, however, case changes rarely occur more than twice consecutively as, for instance, in typing "the 3rd."; and, therefore, although almost the whole of the time margin available in the storage mechanism is absorbed by the two successive case changes, it is restored immediately the operator continues typing at normal speed in either of the two cases. Actually, one case change can be made at the rate of 140 w. p. m. and two consecutive case changes can be made at a speed of 72 w . p. m.
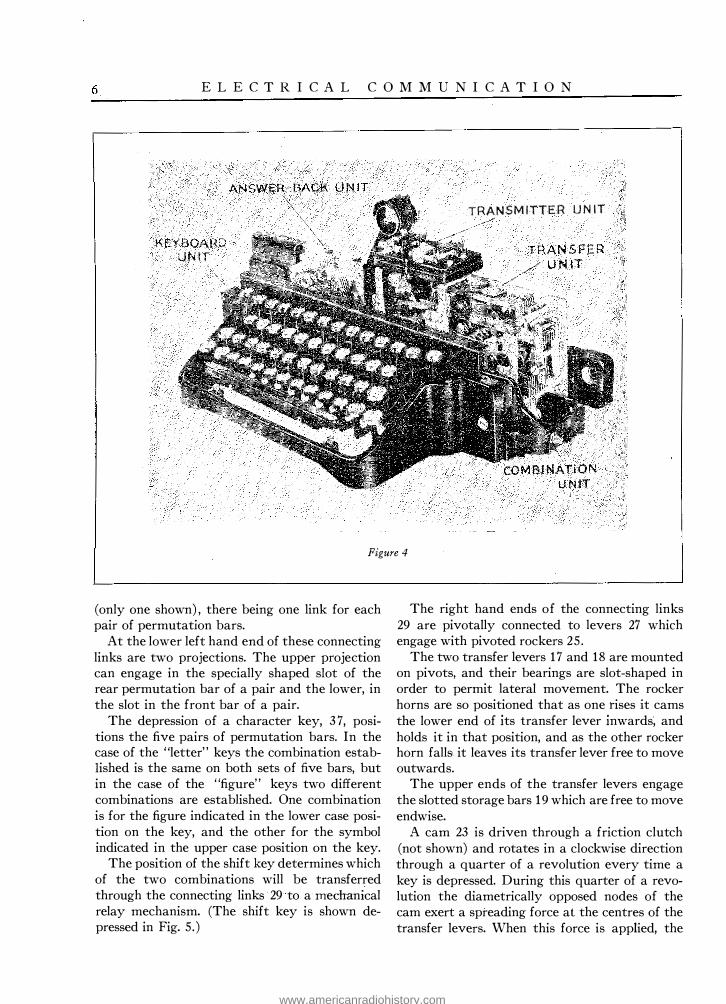
Storage and Shift Mechanism
The storage and shift mechanism (transfer unit) , Fig. 4, forms one compact unit mounted above the key bars. It consists essentially of four frictionally driven cam shafts mounted side by side, and rotated in a clockwise direction. Each cam shaft carries a number of flat cams set in fixed angular relationship on a keyway.
The transmitting contact mechanism forms a complete unit mounted at the top left hand side of the transfer unit.
The mechanism required to provide automatic case insertion and storage, as well as the permutation changing mechanism, is indicated in Fig. 5 .
Storage 0 peration
The depression of any key, 37 (hg. 5) , causes two separate combinations to be set up on five pairs of permutation bars, one pair only being shown-43 and 42.
The right hand ends of these bars have specially shaped slots, one bar of a pair being slotted in its upper edge, and the other in its lower edge.
A shift key, 3 1 , when depressed, causes the lever 35 to rotate about its pivot 36. The right hand end of this lever is pivotally connected to a cradle 33 mounted on a pivot 30, and is normally held in its upper position by the spring 32. Pin 34 is rigidly connected to the cradle 33, and passes through slots in five connecting links 29
www.americanradiohistory.com
6 ELECT RICAL CO M M U NICA TI O N
ANSWER BACK UNIT TRANSMITTER UNIT
TRANSFER UNIT
Figure 4
(only one shown) , there being one link for each pair of permutation bars.
At the lower left hand end of these connecting links are two projections. The upper projection can engage in the specially shaped slot of the rear permutation bar of a pair and the lower, in the slot in the front bar of a pair.
The depression of a character key, 3 7, positions the five pairs of permutation bars. In the case of the "letter" keys the combination established is the same on both sets of five bars, but in the case of the "figure" keys two different combinations are established. One combination is for the figure indicated in the lower case position on the key, and the other for the symbol indicated in the upper case position on the key.
The position of the shift key determines which of the two combinations will be transferred through the connecting links 29 to a mechanical relay mechanism. (The shift key is shown depressed in Fig. 5 .)
The right hand ends of the connecting links 29 are pivotally connected to levers 27 which engage with pivoted rockers 25 .
The two transfer levers 17 and 18 are mounted on pivots, and their bearings are slot-shaped in order to permit lateral movement. The rocker horns are so positioned that as one rises it cams the lower end of its transfer lever inwards, and holds it in that position, and as the other rocker horn falls: it leaves its transfer lever free to move outwards.
The upper ends of the transfer levers engage the slotted storage bars 19 which are free to move end wise.
A cam 23 is driven through a friction clutch (not shown) and rotates in a clockwise direction through a quarter of a revolution every time a key is depressed. During this quarter of a revolution the diametrically opposed nodes of the cam exert a spreading force at the centres of the transfer levers. When this force is applied, the
www.americanradiohistory.com

E L E C TRI C A L C O M M U N I C A T I O N 7
upper end of the transfer lever held by the raised rocker horn is pushed outwards and carries the storage bar with it. As the other transfer lever is unrestrained by its rocker horn it exercises no control over the bar.
The combination set up on the permutation bars by the depressed key is thus transferred to the bars 19 , and stored, the combination bars then being free to be reset by the depression of another key.
The left hand end of the storage bar 19 engages with a rocker, 6, and with an associated transfer mechanism similar to that already described.
It will be understood that each of the five links, 29, is associated with a pair of transfer levers, and the cams are arranged to transfer all five units of the selected combination simultaneously to the first storage bars.
After a predetermined interval the combination is passed on from the first storage bars to the second storage bars, 39, and so to the rockers, 40.
The upper ends of the transmitting levers 2 and 3 operate a common armature lever 4 and 1 , and the cams, 38, are angularly displaced to operate each pair of transmitting levers in succession. The start and stop impluses for each combination are automatically inserted by independent transfer levers (not shown) .
Shift Operation
When a change of case is required, the case determining bar, 41 , controls the mechnism for automatically inserting the figure and letter shift
1 2 3 4 ' • T 5 II 13 15 II IO 12 M 16
Figure 5
,, 1711119 20> 22
Figure 6
signals. It can occupy one of two positions. When letters (lower case) are being transmitted the bar, 41 , is in the left hand position, and when figures are being transmitted it is in the right hand position.
This movement from one side to the other releases the automatic shift insertion mechanism, and causes the appropriate shift signal to be transmitted.
The bar, 41 , controls the position of the shift release bar, 22. The left hand end of this bar engages with the shift detent, 1 5 , which is free to move sideways. The shift release cam, 16, is frictionally driven in a clockwise direction, and when the detent is moved from one side to the other the cam is released, and rotates through half a revolution, after which it is again arrested by the detent.
Mounted on the same shaft are five other cams, four of which-9, 10, 12 and 14-have two projections, while the fifth or middle one, has only one projection. On the left hand side of these cams are five shift selection levers, 8 (one only shown) , which are mounted with their upper ends restrained. On the right hand side of the cams only one shift selection lever, 13, corresponding with the middle (single projection) cam is provided. This lever is also restrained at its upper end.
The lower ends of all these levers engage with the second storage bars, 39, which are also engaged by the second transfer levers 5 and 7. As the shift cam shaft makes half a revolution from the position shown, all five of the left hand levers will operate their respective storage bars, and thereby set up the letter shift combination. The single lever on the right is not moved as
www.americanradiohistory.com
8 E L EC TR I C A L C O M M U N I C A TI O N
there is no corresponding projection on the middle cam.
On depressing a key in the upper or "figure" case, the shift cam shaft makes the upper half revolution, and the first, second, fourth and fifth cam levers are operated as well as the single right hand lever. The figure shift combination is thus set up on the storage bars, and the transmitting cam shaft is then released and the signals transmitted as previously described.
Immediately after the transmission of the appropriate shift signal has been completed, the permutation stored on the bars, 1 9, is released for transfer to the bars, 39, and is then transmitted.
In addition to the mechanism shown there are lock and trip mechanisms associated with each shaft. These can be seen in the photograph , Fig. 6, which shows the transfer unit with its cover and front plate removed.
"Run-Out" Key
Another feature introduced in the new keyboard is the provision of a "run-out" key. By holding down this key the combination already set up in the transfer mechanism by the last character key depressed is transmitted continuously. This facility is not only useful for circuit testing purposes, but simplifies the work of the operator when tabulating or underlining. For example, when typing a continuous line under the heading of a letter, it is now only necessary to operate the "hyphen" key (-) once, and then hold down the "run-out" key.
"Answer-Back" Unit
In Fig. 1 a key is shown marked "Who are you." The depression of this key transmits a combination to the distant printer which causes the release of an "answer-back" mechanism, Fig. 4. This consists of a frictionally-driven cylinder carrying a number of wards in which are cut predetermined five-unit combinations. The cylinder is normally held at rest by a detent which is disengaged on receipt of the signal transmitted by the "Who are you" key. As the cylinder rotates the five-unit wards operate successively upon five selecting levers which are connected to the second storage bars, 39, Fig. S. As each combination is set up on these bars, a separate cam on the "answer-back" cylinder trips the transmitting shaft, and the combination is transmitted back to the printer at the other end of the line. All keys on the keyboard are locked against operation during the rotation of the cylinder to prevent interference with the outgoing "answer-back" signals. The cylinder is brought to rest by the detent at the end of one revolution, and the keybar lock is removed.
This feature was primarily designed for use in person-to-person communication to enable the calling subscriber to verify that the correct connection had been established, but it is also of use in point-to-point services when there is no attendant at the receiving instrument, as it enables the sending operator to verify that the distant machine is working.
www.americanradiohistory.com

The Measurement of Small Values of Inductance and Effective Resistance
By J. K. WEBB, M.Sc., A.M.l.E.E., and C. BROOKES-SMITH
Standard Telephones and Cables, Limited
In connection with the development af the continuous loaded telephone cable, it has been found desirable to measure accurately the inductance and ejf ective resistance of very short samples, as well as the magnetic properties of the loading material. Details are given of a bridge suitable for this purpose.
Introduction
THE behaviour of cables used for communication purposes depends on the four parameters, dielectric capacity,
leakance, inductance, and effective resistance. In experimental work, considerable saving may be effected if these can be determined accurately on very short samples of the order of about two metres upwards. From these measurements a reliable forecast of the constants of the final cable may be deduced.
In the case of dielectric capacity and leakance, the well-known capacity and conductance bridge1 fulfils all requirements, but for the measurement of the remaining n:vo parameters, no analogous bridge has been available, and consequently it has been necessary to develop one.
This bridge, known as the a-c.-d-c. bridge, in addition to inductance, measures the resistance to alternating and direct current of the sample under test and hence, by subtraction, the increment of resistance due to inductive effects such as the skin effect in the copper conductor, and the eddy current and hysteresis loss in the loading material .
Measurements with a-c. and d-c. may be made without disturbing the sample in such quick succession that errors due to change of temperature are obviated.
The bridge can also be used to measure the magnetic properties of very small samples of the loading material , i. e . , permeability, hysteresis, and eddy current loss at known field strengths and, in the case of cables for carrier frequencies,
1 G. A. Campbell : Bell System Tech. Jnl., Vol. 1, No. 1 , July, 1922. W . J. Shackleton and J. G. Fergusson : Bell System Tech. Jnl., Vol. VII, No. 1, Jan. , 1928.
9
the effect of the screening, lead sheath, and armour on the resistance increment. Tests performed before and after removal of the metallic components surrounding the conductor enable valuable empirical data to be obtained. It has been found possible to obtain complete magnetic and loss data on a length of only two metres of 0 . 1 millimeter loading wire.
Bridge Circuit Employed
Since there are a variety of well-known methods available for the accurate measurement of small inductances, the main problem has been the determination of effective resistance in increments as low as 0.0001 ohms at very low field strengths in the loading material and, hence, correspondingly low currents in the sample.
The range of measurement found most desirable was inductance from 1 to 300 microhenries, and resistance from 0.0001 to 1 0 ohms over the frequency range of 100 to 70,000 cycles p :s. These limitations greatly restrict the choice of circuit in order that accuracy may be combined with sufficient sensitivity while errors, due to stray capacities, inductances, and contact resistances, may be kept negligible.
A simple substitution method has been found most effective in meeting these requirments, the circuit being given in Fig. 1 . This is essentially an equal ratio bridge in which an initial zero balance is obtained with the sample short circuited . After the short circuit across the sample is removed, balance is restored by decreasing the variable inductance and resistance in the same arm as the sample, the other three arms of the bridge remaining undisturbed. The amount of such decrease gives a measure of the effective
www.americanradiohistory.com

10 E L EC TRIC A L C O M M U NIC A TI O N
OSCILLATOR INPUT. CONTROL.
"��£JI��-� ��METER
Me.A.SURING INDUCTANCES
Figure 1
resistance and inductance of the sample. Similar measurements are made both with a-c. and d-c . , and from these the increment of effective a-c. resistance over the d-c. resistance may be computed.
Any errors due to stray capacities, etc. ,are thus seen to be confined to the one arm, CD, of the bridge in which the sample is inserted; the remaining three arms, being fixed, merely serve to complete the bridge network, and all errors in the latter cancel out on account of the double balance.
The inductance L 1 consists of three separate variable inductances in series, having maximum values of 350, 20, and 0 . 1 microhenries, respectively. Each is constructed astatically, and is sufficiently isolated to reduce mutual effects to a negligible value. The chief trouble in connection with the design of these inductances lay in their tendency to change their effective resistance with different settings but, by using litzendraht wire, carefully spacing and supporting the coils by the minimum of solid dielectric material , and supporting them in holders without having resort to any metal in the form of screws, spindles, and bushes, such trouble was almost entirely overcome. The smallest inductance is provided mainly to obtain the high degree of bridge balance necessary to observe small changes in resistance.
In the design of the variable resistance Ra the
main problem was to obtain a total variation of about 10 ohms in increments of 0 .0001 ohm without appreciable error due to contacts. This was successfully achieved by adopting the form of a five-dial shunted coil variable decade2 resistance, the five decades having ten steps each of 1 .0, 0. 1 , 0.01 , 0.001 , and 0.0001 ohm, respectively. In this arrangement each of five single coils is successively shunted by ten coils so as to provide a complete decade, with the result that very small increments of resistance can be obtained without any great difficulty in adjusting individual resistance coils and without the introduction of errors due to contact resistance of the switches.
The connections to the shunted coil decades are so arranged that increasing dial readings decrease the resistance in the circuit. In the same way the measuring inductance L i is arranged so that increasing dial readings actually correspond to decreasing inductance in the circuit. By this means the resistance and inductance of the sample is read on the dials directly if L i and Ra indicate zero when the sample is short circuited.
In order to effect this zero adjustment a small variable resistance and inductance is provided in the adjacent AD arm of the bridge. Four shunted coil decades of total variation of about
2 Mueller : Bulletin of Bur. of Stds. No. 13, p. 547, 1916, and No. 1 1 , p. 571, 1915.
www.americanradiohistory.com
E L EC TR IC A L C O M M U N IC A T I O N 1 1
1 ohm and a small variable self-inductance L 3 are provided for this purpose. The total resistance of both the AD and CD arms is in each case made up to 20 ohms, by the addition of fixed resistances.
Since measurements on magnetic samples are usually a function of current and, in practice, this latter is often extremely small, some method of determining the current traversing the sample was found essential . This was simply and effectively done by shunting known fractions of the total input current into the bridge network. The total current is of such a value that it can readily be measured by means of a thermocouple ammeter. Three shunts are provided, and are connected as in Fig. 1 . The switch positions are marked with powers which indicate the ratio between the measured total input current and the current in the sample. In order that the ratio may not vary with frequency, each shunt is designed to have the same time constant as the bridge network, this being effected by making the shunt coils of manganin wire having small toroidal inductances of copper wire in series. The difficulty of reading very small currents with a thermocouple is thus overcome.
Keys are provided to connect either a-c. or d-c. to the bridge input, and either an amplifier or d-c. galvanometer to the output. For a-c. work
up to 3000 or 4000 p :s., an amplifier having a gain of 80 db. is used, and above this frequency a heterodyne detector. For d-c., in cases where it is undesirable to circulate other than an extremely small current in the sample owing to trouble due to unilateral magnetisation effects, sufficient sensitivity is obtained by using a Paschan type galvanometer. If, however, it is permissible to pass a larger current through the sample, any ordinary galvanometer will suffice, although its resistance should preferably be less than 20 ohms.
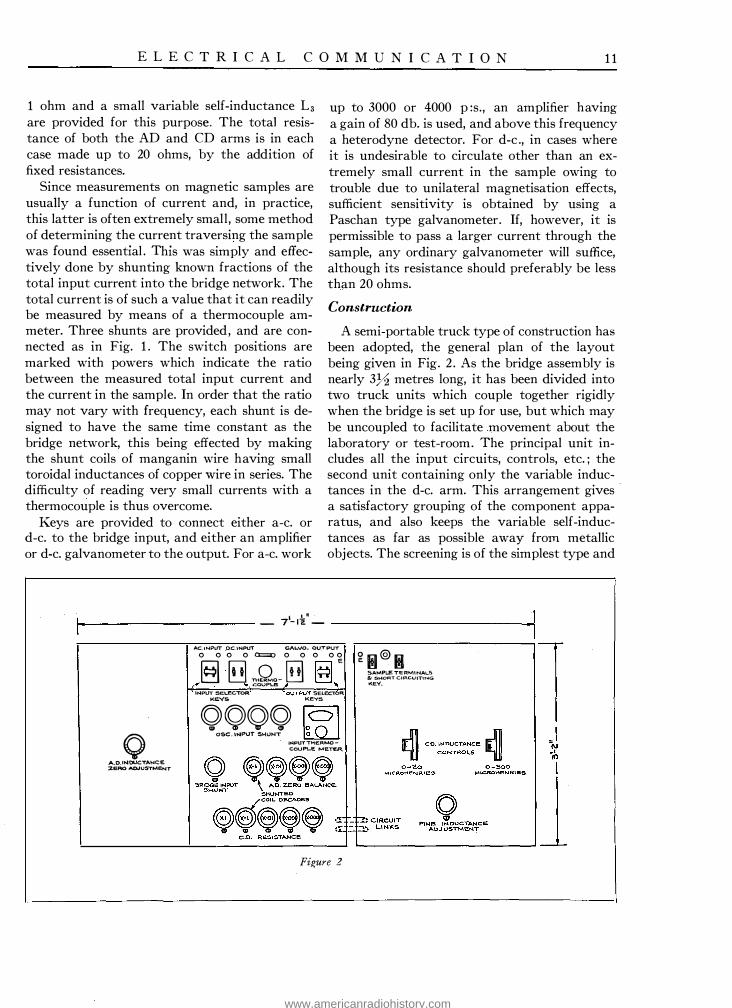
Construction A semi-portable truck type of construction has
been adopted, the general plan of the layout being given in Fig. 2 . As the bridge assembly is nearly 3;Y2 metres long, it has been divided into two truck units which couple together rigidly when the bridge is set up for use, but which may be uncoupled to facilitate movement about the laboratory or test-room. The principal unit includes all the input circuits, controls, etc.; the second unit containing only the variable inductances in the d-c. arm. This arrangement gives
.
a satisfactory grouping of the component apparatus, and also keeps the variable self-inductances as far as possible away from metallic objects. The screening is of the simplest type and
------------- - 71-1�' ---------------__....,
0 A..O.INDUCTAMC::E :ZERO ""1:).JUSTMENT
AC.1NPIJT 0.C.INPUT GAL.VO. OU�PUT 0 0 0 0 = 0 0 0 00
[§] � �Qo- [!] § E ,.I' ...... COUPLE ,j . , INPUT SELECTOR
KEYS �OUTPUT SELECTOR
KEYS
©<oO© R5l CD oSC.\NP\JT SHUM: � i�PUTTH.ERMOCOUPl-E. METE.R.
Fir;ure 2
�m@lil SAMPLE TERMINALS & SHORT CIRCUJTING KE'{.
www.americanradiohistory.com

12 ELE C TR I C A L C O M M U NI C A TI O N
Figure 3
is restricted to a single earth screen round the ratio arms, the leads to the output transformer and the measuring resistance in the CD arm. To avoid magnetic pick-up, the input and output transformers are magnetically shielded. The D corner of the bridge is connected to earth, and the side panel of the truck nearest the operator is lined with metallised paper which is also earthed. There is no metal in sufficient proximity to the variable inductances to give rise to any error due to their tendency to change their effective resistance with change of inductance. Fig. 3 is a photograph of an earlier model of the bridge, which, however, does not incorporate a number of the refinements subsequently found advisable, although it serves to show the type of construction adopted.
Accuracy
The bridge may readily be calibrated for inductance by comparing measurements made on fixed inductances covering its entire range with those obtained by any of the several alternative methods which are available and of unquestioned accuracy. This has been done without difficulty.
The calibration of the bridge in terms of effective resistance, however, has presented a real problem, since there is no good alternative method available for purposes of cross-checking-. A close consideration of the problem led to the
adoption of the following method as the most practical and reliable.
A series of inductive resistances was constructed, the various values of the inductances being chosen to cover the range of the bridge. The increment of a-c. effective resistance of these coils over the d-c. resistance was reduced to a minimum by using litzendraht copper wire wound in the form of a single layer coil, air spaced, with the minimum of support on an ebonite former. The dimensions of the coils were chosen to give as large a time constant as practicable. No metal was permitted within a considerable distance. The increment of effective resistance of such coils, while being quite small, may be calculated3
at 70 kc. , the value being about 12% only of the d-c. resistance. These effective resistance standards were then measured by means of the bridge, and results compared with the calculated values, the difference giving the bridge error.
The curves in Fig. 4 show the results thus
a Butterworth : N. P. L. Collected Researches, Vol. XVIII, 1924, Part IV, p. 77.
' .--- I .-- I lo=.� I
:c I �� 0 I I i.:Qza Ill t I I L.czr. � � �:J Ill I I I ��
l=� I/ !/ I/ w / I/
�� I J � r7 7 7 / l.:c1s. !!! Ill ,/ I/ IJ I/ w 70K ' ' lcl<!L a: ... I/ I/ / I lm:z.. 0
"-"1.a. � _I/ GOK< I/ / / _,, uJ v I?- v I/ I/ �� ,/ SOK / / a: /. � /17 ,v u �z 40�·
� 1� 1- vl7 ,_ -··
A 'fa- i....---.--- 1..--- , __ -L--
I� � lOK1 0 zo 40 60 80 100 IZO 140 160 1eo zoo 22.0 240 260 zso INDUCTANCE L1 MICROHENRI�
Figure 4
www.americanradiohistory.com

E L E C TR I C A L C O M M U N I C A T I O N 13
obtained, the correction being expressed as the increment of resistance which must be deducted from the figures obtained on a sample at any particular value of inductance, and for the frequency at which the measurement is made.
The change of phase angle of the shunted coil decade resistance with alteration of setting has been examined, but with each individual coil manufactured and adjusted to give as low a phase angle as possible, errors due to this cause are negligible.
The sensitivity of the bridge balance leaves little to be desired; an increment of 0.0001 ohm is readily observed under normal conditions, both with a-c. and d-c. In balancing with d-c. , possible errors due to thermo-electric effects are ruled out by always working with the galva-
nometer circuit closed. In this case, however, an approximate inductive balance should also be obtained to avoid inductive kicks on the galvanometer when switching the current on and off. All connections in the d-c. circuit are also made of copper so that thermo-electric currents hardly exist.
While the accuracy obtainable is to some extent dependent on the nature of the sample and other circumstances, in general , the effective resistance of an inductive resistance of value 0.1 ohm may be obtained with an accuracy better than 13 at all frequencies up to 70 kc. While this is the highest frequency for which the bridge has been used up to date there is, of course, no reason why measurements should not be made at even higher frequencies.
www.americanradiohistory.com

Application of Type C and Type D Carrier Systems to Non-Standard Lines
By BRUCE H. McCURDY Engineer of Toll Lines and Transmission Societatea Anonimi'i Romana de Telefoane
and J. H. HOLMES International Standard Electric Corporation
EDITOR'S NOTE : Concluded from the April, 1934 issue of Electrical Communication
V. Methods of Measurement and Prevention of Crosstalk
In this section, it is proposed to give a brief description of the methods of measuring both the C.F. and V.F. crosstalk values, together with some indication of the methods of prevention adopted.
(a) Measurement of Line Crosstalk
The measurement of the crosstalk on the line at carrier-frequencies was carried out by means of a No. 74008-A oscillator, a No. 74051-A crosstalk set and a No. 74001-A detector amplifier.
The principle of the. 74051-A crosstalk set will be evident from Fig. 6 which shows schematically the arrangement adopted for measuring near end crosstalk. The crosstalk set consists of two distinct parts through one of which a source of current of any desired frequency and such magnitude as may be convenient is connected directly to the circuit whose disturbing effect it is desired to measure, while through the other the same source is connected to a variable attenuating circuit calibrated in decibels. When the oscillator is connected to the disturbing circuit the line in which the crosstalk is to be measured, i .e., the disturbed line, is connected to a detector, and when the oscillator is connected to the attenuating circuit, the output side of the latter feeds the detector. These connections are accomplished by means of key No. 2 which operates as a quadripole doublethrow switch.
The detector for voice-frequencies may consist of a receiver, but for carrier-frequencies it is necessary to use a detector amplifier, which consists of an oscillator for heterodyning the input-frequency, an amplifier, and a detector.
Oscillator
£Jeledor 11eter -Lme
f),,furbed Cd
Figure 6-Schematic of Circuit for Measuring Near-End Crosstalk.
The oscillator-frequency is variable, so that upon detection, a clearly audible frequency may always be obtained, 1000 p :s. being generally employed. The purpose of the amplifier is, of course, to give extra sensitivity.
Considering the two positions of key No. 2, on the line side a certain tone is heard by means of the receiver connected in the anode circuit of the rectifier tube in the detector amplifier. This tone corresponds to the disturbing current which has been attenuated by an amount equal to the crosstalk in passing from the input of the disturbing circuit to the output of the disturbed circuit. (Cf. definition of far-end crosstalk in Section IV, which is applicable also for near-end crosstalk if the word "near" is substituted for the word "far") .
14
If now the key be thrown to position "meter," the attenuating circuit can be varied until the tone which is heard is equal to the tone heard in position "line" of the key. Then the crosstalk in decibels is plainly equal to the value read on the scale of the variable attenuating circuit.
The case of far-end crosstalk may be seen from Fig. 7 to be similar, except that in this case the disturbing circuit itself acts as a source
www.americanradiohistory.com

E L E C TR I C A L C O M M U N I C A T I O N 15
of supply for the meter side of the set, so that the reading obtained on the meter is indicative of the difference in level between the currents in disturbing and disturbed circuits at their output. As previously explained under Section IV, the attenuation of the disturbing circuit must be added to the crosstalk value read on the meter in order to obtain the true far-end crosstalk, and it is therefore desirable to make a measurement of the attenuation at the same time as the crosstalk is measured, in order to be able to correct the values. With this end in view the crosstalk set is provided with a special key, No. 7, which enables the current arriving from the disturbing circuit to be switched to a measuring set consisting of a calibrated thermocouple and galvanometer.
For each measurement, therefore, a known current of the particular frequency desired is sent out from the transmitting end of the circuit. The current arriving at the testing end is measured, and the loss is calculated in decibels (assuming equal line impedances at both ends) from the well-known relation : loss in DB = 20 log10 R, where R is the ratio of sending current to received current in the disturbing circuit.
After the current measurement, the key No. 7 is thrown so as to connect the disturbing circuit with the crosstalk meter, and the crosstalk is then measured. It will be noticed that when the disturbed circuit is connected to the detector the disturbing circuit is terminated by a resistance. The object of this resistance, which was kept at 600Q for the Rumanian carrier survey, is to obviate the possibility of reflected near-end crosstalk adding itself to the measured value of far-end crosstalk. It will
Oetec.tor tfeter - Line
Figure 7-Schematic of Circuit for Measuring Far-End Crosstalk.
't-�--------------/�m x
___ '(__ --8 fb!
Figure 8-Diagram Showing Equality of Crosstalk as Measured from Each End of a Line.
readily be appreciated that if the disturbing line be left unterminated during the period of listening to the disturbed circuit, there will be total reflection at the end of the disturbing circuit, and the reflected current will therefore be strong enough to produce near-end crosstalk, which may add itself to the far-end value, thus giving a value in excess of the real one.
In the crosstalk set three resistances are provided, of values 600Q, 650Q and 7oon, intended for use with various types of standard line. Since none of the toll lines in Rumania is of standard construction, and all lines vary greatly amongst themselves, the termination employed was always 600Q, it being considered inadvisable to take the time to determine the impedance for each circuit separately. Further, this gives a condition approximating the operating condition which, after all, was the object of investigation.
From theoretical considerations, it appeared that in such crosstalk surveys much time could be saved by measuring the line crosstalk between two circuits from one end only, taking advantage of the fact that the far-end corrected crosstalk measured at say the "A" end of the line from circuit X into circuit Y should be approximately equal to the far-end corrected crosstalk from circuit Y into circuit X measured at the "B" end of the line. This will be apparent from a consideration of Fig. 8. Suppose that there is one source of crosstalk on the line at C, causing interference between the two lines X and Y. If now we send a disturbing current into line X at A, and measure the crosstalk at B on line Y, we shall obtain a value which, when corrected for the attenuation of circuit X in the manner already described, will be equal
www.americanradiohistory.com

16 E L E C T R I C A L C O M M U N I C A T I O N
to the attenuation of the crosstalk path shown in Fig. 8 (a) by the dotted line. Let us now send a disturbing current on circuit Y from B and measure the crosstalk at A on circuit X. We shall obtain a corrected value equal to the attenuation along the crosstalk path of Fig. 8 (b). This path is obviously the same path as that of Fig. 8 (a) , hence the attenuation, i.e. , the crosstalk value will be about the same in each case. The same reasoning applies, of course, equally well to all other sources of crosstalk on the line; it may be stated, therefore, that the two values of total crosstalk measured in the two conditions described should be approximately equal .
Data were not available, however, as to the accuracy of the preceding statement. It was decided, therefore, in the case of two lines of differing electrical characteristics containing a number of sources of crosstalk, to measure from both ends of the line almost without exception in order to determine, for use in connection with future surveys of a like nature, whether this method could safely be utilised.
All line crosstalk was measured inclusive of all carrier line filters. This was done for the sake of convenience, as well as to include the office wiring on the filter bays, etc.
(b) Measurement of V. F. Crosstalk
The measurement of V. F. crosstalk was effected by means of the 74050-A crosstalk set in the majority of cases, and in a few cases with the 74051-A set. All measurements took place at the V. F. line side of the hybrid coil and were made under service conditions, i .e., with the transmission levels as specified for the particular circuit in question.
As a source of tone, the 7 4020-C test set was used, which gives a tone approximating the frequency composition of the human voice. The 7 4200-A network was used in the output circuit of the 7 4020-C set in order to smooth off the peaks in the output wave, which might otherwise cause overload effects in the tubes of the systems being measured with consequent inaccuracies in the measured values.
The principle of the measurement is precisely the same as that of the line measurement, and the far-end values must be corrected in just the same way.
(c) Adjustment of Levels
Before commencing the crosstalk survey, the level diagrams for the various proposed systems were prepared, as already mentioned, and the
·levels of each system were very carefully equalised on all routes where two or more systems were on the same pole lead.
In order to give an idea of what reduction in crosstalk can be effected, even qualitatively, by a proper equalisation of levels, it will be instructive to consider the case of the systems whose routes are shown in Fig. 3. It will be seen that there are several cases of parallelism amongst these systems. The most serious cases are naturally those between Timi;;oara and Arad, and between Bucarest and Pite;;ti, where several similar systems run on the same route.
When these various systems were originally lined up, they were all arranged to operate on normal carrier system levels; for the "C" systems, a transmitting level of + 20 db. at terminal and repeater stations and, for the "D" systems, a transmitting level of 6-7 db. The thought uppermost in the minds of those in charge of the line-up was to utilise to the full the margins of safety available on the systems in order to have as much reserve as possible to deal with line variations. Each system was carefully observed subsequent to being put into service, and the amount of crosstalk interference was qualitatively noted, and it was found that with these values of level, trouble was experienced in the following cases:
(i) Intelligible crosstalk from the BucarestSzeged C.N.3 system into the Bucarest-Timi;;oara C.N.3 system. This was due to the fact that there was a large difference in level between the two circuits in the direction A-B (towards
Bucarest) at Pite;;ti, since the Alba Julia-Pite;;ti section consists of 3 mm. wire, while the CraiovaPite;;ti carrier line is of 4 mm. diameter and is not so long.
(ii) Unintelligible crosstalk from the BucarestTimi;;oara C .S.3 system into the Bucarest-Szeged C.N.3 system. This was traced to the fact that the transmitting level at Timi;;oara on the C.S.3 system was too high at + 20 db., whereas the average level of the Szeged channels is only about + 1 1 db. at Timi;;oara.
As a result of these troubles, an attempt was
www.americanradiohistory.com

E L E C T R I C A L C O M M U N I C A T ION 17
k;G.
102
- 2 ...
Cit. n 1.
-...
,�.
..... --4.5,
_,
1l ·•
Figure 9--Bucarest-Timisoara No. 2 Carrier System-C.S.3 -Level Diagrams.
, tJ(l ·�·"" ,� .. 1:.·.� , �. - ,_
.m Km c�'9,r; "'1"8' r1I -i-- /If.< n.1
�"'·"f"•• i....-L-- ., 1-1-1-.._. --
- '� i.--i-:- -· HI � ... -.o .�
� 0.'1tm {f '--i--..- !l.J
11!.i'I� I� !...-i-- �--<10• -::;: 0
� I( Co""' Vf 1-1- "·' JJ,f. •hi'. f"!!.J -- .e..
,.";, '=j. �
Figure 10-Bucarest-Timisoara No. 1 Carrier SystemC.N.3-Level Diagrams.
"'· ·-
i---.!'6 �n. � '9K.": -. r ! -1--
"-'" A<. ! '-- .. --� .. , . _,_ - 1- .• f.i' f"t9
T-"8 -9.
: �I '"-• Ir I "' ,___ ,__
51.1!.rt". $.0 ,_ .. "='" ..... -
1- ·• "1-t.; .. I ; :1
lr1 '" I'!
'�;\K •. - I ,0 s..e ' .. ey i.- ! /.�
I
Figure 11-Bucarest-Szeged Carrier System Level Diagrams
made to interrelate the levels of all these systems so that they would be as nearly as possible equalised over the sections where parallelism occurred. The result of this attempt may be seen from Figs. 9, 10 and 1 1 , which show the
level diagrams for the systems concerned for the direction A-B.
Considering Fig. 1 1 which shows the level diagrams for the three channels of the BucarestSzeged system, the channels leave Szeged at an average level of + 20 db. , and arrive at Timi;;oara, where they commence to run parallel with the Bucarest-Timi;;oara C.S.3 channels, at an average level of + 1 1 db. The output level at Timi;;oara of the Bucarest-Timisoara C.S.3 channels is + 16 db., that is to say, at Timi;;oara the Szeged system works at about 5 db. below the Timi;;oara system (see Fig. 9). At Craiova, however, where both systems are repeatered, the position is reversed, since the Timi;;oara system line consists of 3 mm. copper, while that of the Szeged system is of 4 mm. copper, thus the decrease in level due to line attenuation is much greater for the former than for the latter. At the input to the repeater, the average levels for the two systems are : Szeged, + 1 db. and Timi;;oara -7 db. , that is to day, the difference is now 8 db. , Szeged being higher than Timi;;oara. This appeared on paper to be the best distribution of levels in view of the difference in diameter of the two lines, and actually, since the carrier systems were placed on this footing, no further trouble has been experienced from crosstalk.
At the output of the repeater at Craiova the normal level would be in the neighbourhood of +20 db. but if the Szeged system level were so high, then it would be impossible to equalise the levels at Pite;;ti, the commencement of the common route-section of this system and the Bucarest- Timi;;oara C.N.3 system. It was in fact, found necessary to reduce the A-B output level at Craiova on the Szeged system to an average value of + 5 db. as shown on Fig. 1 1 . This gives an average at Pite;;ti of 0 db., which
is approximately the same as the level incoming
from Alba Julia on the Timi;;oara system (see
Fig. 1 0) . With this arrangement of levels, no crosstalk is observable in service on either system.
Considering now Fig. 10, the mean output level in Timi;;oara on the Bucarest-Timi;;oara C.N.3 system is + 1 2 db. This value is intended as a compromise between the levels of the D.A.1 system Timi;;oara-Cluj and the D.1 system Timi;;oara-Oradea (Fig. 12) .
www.americanradiohistory.com

18 E L E C T R I C A L C O M M U N I C A T I O N
On the D.1 system between Bucarest and Craiova, shown in Fig. 1 2 (c) , no trouble was experienced due to crosstalk from the C .S.3 system, but as there was a certain amount of reserve on the latter system between Craiova and Bucarest, the output level was dropped slightly in Craiova, as shown in Fig. 9, from the normal value of + 20 db. to a mean of about + 14 db.
It will be noticed that in the foregoing no reference has been made to the B-A direction. The reason is that the interference problem is rendered very simple by the fact that singlechannel systems cannot be interfered with by the upper frequency bands of the "C" systems, since the "D" system bands all lie below 1 1 ,000 p :s. Thus the problem resolves itself simply into one of equali sing the output levels at Bucarest between the Szeged C.N .3 and Timi9oara C.N.3 systems, and at Craiova between the Szeged C.N.3 and Timi;mara C.S.3 systems. This was easily accomplished, all these values being of the order of + 20 db.
At Craiova, it might have been preferable to arrange the level of the Szeged channels at a value somewhat less than + 20 on account of the difference in diameter of the two lines between Craiova and Timi;;oara, but the advantage so gained from the point of view of interference would have been outweighed by the fact that there would have been very little emergency margin of amplification at Szeged, owing to the long distance between Craiova and Szeged.
·'""· ---r--___ _
?r�liea
Tr. .;.. o.s ___ ___
r----i--n.1 ..... ! ':-!.,.. - . .-_. '"''""'
Figure 12-Level Diagrams for Single Channel Carrier.
.!t2. �r...stern 1Y££ 1 But:aresf-Or.;;dea CS3 2 Cernrivli CIY.3 .3 /.;,si · CS3 4 C(qj OAf s Brarov /YS.I' Of 6 " • 2 j)f 7 " P/oesli ,, 1 QI 8 ,/ ,, 2 J)f 9 cai�k " " 01
10 ., .! DI
Pllanl(lm groups .SIJOW/l T/Jvsl._ __ __,
/Yole :' "'" ,rre9t//&r dis/r;i>vhon or p/Janlivns IS dve to the Tact l"ht:TI on prQc//cally every crossarm there are 2mm. ano' 4'"'"'· cil-cL.//ls wluC-h Could no/ .be ,,ohantorneo'.
Figure 13-Profile of Lead, Bucarest-Ploesti.
(d) Segregation and Transposition
In view of the statements made in Section IV of this paper that reduction of crosstalk could be effected by segregation and transposition, examples will be given of existing profiles and transposition schemes before quoting the results of measurements.
On the Bucarest-Pite;;ti route, for example, in the sections where the two circuits BucarestTimi9oara and Bucarest-Szeged run on the same poles, the former circuit is transposed every two poles, while the latter is not transposed at all except for a short distance out from Bucarest where the main toll lead enters and all circuits are transposed. The segregation is such that the circuits are for about half the distance separated by about five feet on the poles, while for the other half they are separated entirely, being on different poles separated by the width of the railway track.
The problem of segregation and transposition was much more acute on the Bucarest-Ploe;;ti lead than anywhere else, because there are so many systems which run on this route (see Fig. 13) .
www.americanradiohistory.com

E L E C T R I C A L C O M M U N I C A T I O N 1 9
I t will b e seen that the D . 1 systems have been placed, consistent with a reasonable separation amongst themselves, towards the bottom lefthand portion of the profile, while that system which would be the most likely to interfere with them, i .e. , the Bucarest-Cernauti C.N.3 system, has been placed upon the top right-hand corner. The Ploei;;ti systems Nos. 7, 8 and 9 are the nearest to the C.N.3 but crosstalk is not observable, even on these systems. The D .A. 1
Bucarest-Cluj system has also been kept apart from the D . 1 system (consistently with separation from the C.N.3 system) since the D.A. 1 transmission levels are higher than those of the D . 1 systems and the frequency bands are similar. The C.S.3 systems have simply been separated far from each other.
lr....,�;,i '':"' 'P A 'b"; ult;,
'>? ] k� I .. � 1 J \
I I ' � �a, ' I ' \ I I I \ I
I 'I j ' I I ' ' I JJ
10000 ..,;,ftec. zeoO(I .MOt1t1 Figure JS-Far-End Corrected Line Crosstalk between Szeged
C.N.3 System and Timisoara No. 1 C.N.3 System (Bucarest-Pitesti) .
0 With the profile shown, a still better arrange
ment of the circuits would have been possible <s
but for the fact that all pin positions were not \ \\
l '\ I /! ,
• 1 ·�
\1 "
Cvr tt.r ?) ... a' 'SV. �Ji -m , '� ., " "' Mii
available. It may be remarked in passing that from the
point of view of interference between systems, the fact that Bucarest is for all systems the B terminal has probably been a rather fortunate circumstance, in that it has meant that those
I
'a 0 I
i I
1,·
; I \ /,., ,\ , \\ � I I
� I ·- � I
I . M· 1 JI vr 1 I / J I -
\
m ' G � ,. u11n Q/1 .... ,, . (2) ), 1 .. " l'f'.
� I I \ ' I - ' 114\
I." /j \ I ;'· IP- �10 \ � IV i�d . " 'clr. er.:11 i,.,,�; 1�1. ,..
8· A �fe 1-"" I I
f 7o " 76 8J 78 7J i.-q; I 2 ··,-_,,,,,, 77 79, •tlJ 80 76 7JI I --J 78 79 80 8J 7: 72
', 4 77 7� 7S 87 7J 72 I 0 5000 '"· Ov
C systems which enter via the Bucarest-Ploe;;ti '7
lead are, as it were, automatically at approximately the same level as the D . 1 systems paralleling them from Ploei;;ti in the A-B direction. Had Bucarest been the A terminal , then the
Figure 16-Far-End Corrected Line Crosstalk between Bucarest-Ploesti D.1. Systems Nos. 1 and 2. (26th July, 1932)
D•
.Jen i,,;,g fror. •Vo s. iegeo
}_ '
fi �
\ I I � � I
-- I �
\ ., �""' -
eiL.101 .. -lJCt: .
I I
1 I
\ \ 24IJIM
, I
I I I
""' 00
C systems would, on account of overall loss requirements, necessarily have transmitted at + 20 db. output level, whereas the output level of the D . 1 _systems would have been at most about + 7 db. , and this large difference would have helped materially to produce crosstalk on the D . 1 systems.
In the present case, the choice for specific reasons of Bucarest, the central point of the system, as B terminal having proved so advantageous, it might be well in future layouts to consider making the central control point the B station, rather than the A.
VI. Results -/Set: Figure 14-Far-End Corrected Line Crosstalk between Szeged (a) Interpretation of Measured Values
C.N.3 System and Timisoara No. 1 C.N.3 System d" (Bucarest-Pitesti) . The measured values consist of direct rea mgs
www.americanradiohistory.com

20 E L E C T R I C A L C O M M U N I C A T I O N
of far-end crosstalk which must first of all be corrected in accordance with the corresponding attenuation frequency curve of the circuit on which the disturbing current was sent and then plotted in order to give the curve of true farend crosstalk according to the definition of Section IV.
Figs. 14-18 show specimen crosstalk frequency curves, corrected for attenuation.
Referring to Figs. 14 and 1 5 , which show the crosstalk conditions prevailing on the repeater section adjacent to Bucarest of the systems Bucarest-Szeged C.N.3 and Bucarest-Timi9oara C.N.3, the line crosstalk is on the average about 1 5 db. worse when current is sent on the Szeged line from Craiova than when it is sent on the Timi9oara line from Alba Julia. When, in addition, it is borne in mind that with the original line-up of these systems the Szeged system, in the A-B direction, had a level about 10 db. higher than the Alba Julia system at Pite9ti (see Fig. 3) , it will be readily realized that this unequal condition was still more intensified, and that intelligible crosstalk was heard on the
' 80 \ I
'
Di.· \ \ \ \
� �\' ,-I I
" ' / 70 :.I
'=:y ,,,,
C:. rve� (l) ona ' t2'I '17�.1J ir.tre<I •I ;, u 'al 'tl'.S/ ,, � (3) ,, Q\ '� ,, l r.�s' v � ' © "' @ #iVIO �11 a �sy.s �in 1 \;-. -.
� @ 60 ,, (.;) ' ' ,, e f21., rnrt "'r-£ oln. ' Vci {I.If!!. , ; B A '
I 71 67 2 73 72 j 72 70
-· 4 7J 67 --o 51 '00
.,
Timi9oara system at Bucarest. After the equalisation of the levels at Pite9ti , this crosstalk trouble ceased, and although it would perhaps have been preferable from the theoretical point of view to operate the Timi9oara system at a level higher than that of the Szeged system in order to equalise the crosstalk values, this would not have been practicable owing to line loss limitations, and in any case was not necessary since the crosstalk is now no longer noticeable.
Fig. 16 is an example of the case of a short line-Bucarest-Ploe9ti- 67 km. in length, carrying D . 1 systems. The crosstalk was measured from each end and in both senses, i.e, first the No. 1 line was the disturber, and then the No. 2 line.
The diagram shows the quarter point values tabulated for each direction and each curve. The line itself being very short, all four curves are very similar, but it may be observed nevertheless that there is a tendency for curves ( 1 ) and (2) to pair off with curves (4) and (3) , respectively, in the manner already foreshadowed in Section V (see Fig. 8).
I \
I \ i / � I \ '
i '\ J I \ , �
/, '
\ /!\ ii �\ rl
' ii �I
64 71 70 63
I \ � . . �\
�·. . . �"'-... -
.
ii i
I lfi' l\ J I \ \ V/ \
'.�·'
14-t 66 oo ii 7�
7J 62 63 67
''\-- � [\ •' �\ \ I ' H '
"' " � \ � v I � \ l er>
\� '< ,.....
' ' "' F.•l \. �,
-
6c � N» 7� 76 70
10000 Figure 17-Far-End Corrected Line Crosstalk between Bucarest-Brasnov D.1 Systems. (15th July, 1932.)
www.americanradiohistory.com

E L E C T R I C A L C O M M U N I C A T I O N 2 1
'JD
'°
-!: � '10 "* ·� � .'.! :: � ;;.
-
Cu. v"' ® LM f® . '. vc. ,,.,. � I l'.i\ " ' t:ll " � '" 17V
(1J " @ .se. <7i "' " � ' S°J rv"' 'I'm 1,,;,, I Ill " I i<> " .1 "
.�
! , .. ! \
I/ ,, .�
_I .,,- ' ,/ -�-?' ...... v , _ i--, I ,,,, '
I ,· I \ ' If-/ II' I \ .I
J 1\ v I /' �.
! \ ," ., f 1; \ L..----�
·"' � I _._ ,v / I'� "-v
\ /.r7 v v
.500o ""'/sec. 10000
j.Q) l'3l
:"1)
i\!I
Figure 18-Far-End Corrected Line Crosstalk between Bucarest-Brasnov D.1 System No. 1 and Bucarest
Oradea C.S.3 System.
-
-·
This tendency is much more marked when the line is longer, as may be seen from Fig. 17 , which shows the crosstalk in all combinations between the two Bucarest-Bra;;ov D . 1 systems, the length of the route being 180 km. In this case, the pairing of curves (1 ) with (4) and (2) with (3) is strikingly apparent, bearing out the theory of Section V, Fig. 8.
Fig. 18 is here reproduced in order to demonstrate the fact still more clearly. This figure represents the same four combinations as before, and gives the crosstalk measured up to 1 1 ,000 p :s. , i.e. , over the frequency range in which interference would be possible, between the 4 mm. circuit carrying the Bucarest-Oradea C .S.3 system and the Bucarest-Bra;;ov 3 mm. circuit carrying the D . 1 system No. 1 . The difference between the two pairs of curves in this case is very marked owing to the difference in diameter between the two wires. These curves are interesting, in that they give an indication of a possible qualitative method of perceiving the approximate location of a source of high crosstalk.
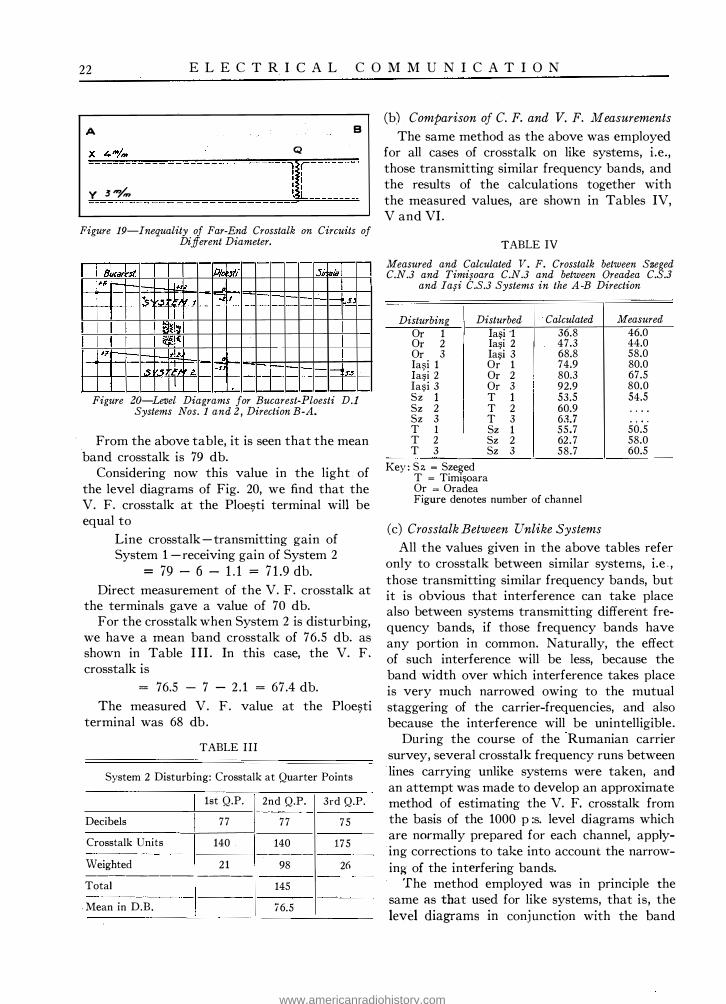
In Fig. 19 there is shown a source of crosstalk Q located nearer to the B terminal of two carrier lines X and Y of 4 mm. and 3 mm. diameter, respectively. Suppose that the farend crosstalk is measured at B, using first one
circuit as disturber and then the other. The crosstalk when using circuit X as disturber will obviously be greater than when Y is disturbing, since the attenuation of the portion AQ on the circuit X is smaller than that of the same portion of circuit Y, and AQ is longer than BQ. It appears then that in the Bucarest-Bra;;ov section, where the crosstalk when transmitting on the 4 mm. circuit in the A-B direction (curve 1) is smaller than the crosstalk when transmitting on the 3 mm. circuit, the crosstalk lies chiefly in the half-section nearer to Bucarest.
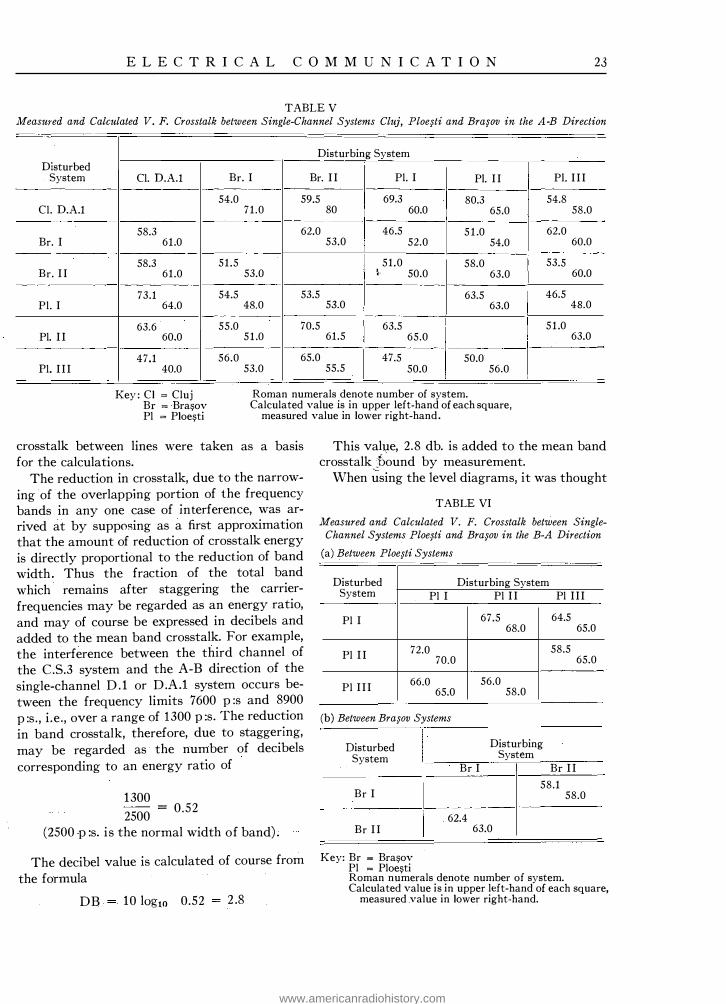
As an example of the interpretation of the measured values in terms of voice-frequency crosstalk at the terminals of the various carrier systems let us consider the case of the Ploe;;ti systems Nos. 1 and 2 , the line crosstalk curves of which have been given in Fig. 16 . The level diagrams for these two systems in the direction B-A are shown on Fig. 20. These particular systems are used as components of two BucarestSinaia circuits, which are carried on ordinary physical pairs between Ploe;;ti and Sinaia. For the carrier crosstalk survey the extensions of these lines to Sinaia were disregarded, only the carrier portion being considered.
Considering the crosstalk from System No. 1 into System No. 2 , given by curve No. 3, Fig. 16 , we find that for the frequency band under consideration, i.e, the lower side-band in the direction B-A, 41 70-6670 p :s. , the crosstalk at the quarter points of the band, after disregarding the peaks of the curve by drawing a mean line, is approximately as shown in Table I I , which also indicates the subsequent steps in the evaluation of the average value for the band, as already described in Section IV.
TABLE I I
System 1 Disturbing: Crosstalk a t Quarter Points
1st Q.P.
Decibels 78
Crosstalk Units 125
Weighted 19
Total
Mean in D.B.
2nd Q.P.
79
1 12
78
1 1 2
79
3rd Q.P.
80
100
15
www.americanradiohistory.com
22 E L E C T R I C A L C O M M U N I C A T I O N
A B Q
y 3 '%,
Figure 19-Inequality of Far-End Crosstalk on Circuits of Different Diameter.
B'Ka1 �t Pk •.t/ 5,; 1am •6 - ,,
'-; - ·�� f � .I _:n
I ��!� ii'.��·
,,� ''"' " .s V.5 'el � -1.1 •r_, I
Figure 20-Level Diagrams for Bucarest-Ploesti D.1 Systems Nos. 1 and 2, Direction B-A.
From the above table, it is seen that the mean band crosstalk is 79 db.
Considering now this value in the light of the level diagrams of Fig. 20, we find that the V. F. crosstalk at the Ploe9ti terminal will be equal to
Line crosstalk -transmitting gain of System 1 - receiving gain of System 2
= 79 - 6 - 1 . 1 = 7 1 .9 db.
Direct measurement of the V. F. crosstalk at the terminals gave a value of 70 db.
For the crosstalk when System 2 is disturbing, we have a mean band crosstalk of 76.5 db. as shown in Table I II . In this case, the V. F. crosstalk is
= 76.5 - 7 - 2 . 1 = 67.4 db.
The measured V. F. value at the Ploe9ti terminal was 68 db.
TABLE III
System 2 Disturbing: Crosstalk at Quarter Points
1st Q.P. 2nd Q.P. 3rd Q.P.
Decibels 77 77 75
Crosstalk Units 140 140 175 -----
Weighted 21 98 26 -------- -----Total 145
Mean in D.B. 76.5
(b) Comparison of C. F. and V. F. Measurements
The same method as the above was employed for all cases of crosstalk on like systems, i.e., those transmitting similar frequency bands, and the results of the calculations together with the measured values, are shown in Tables IV, V and VI.
TABLE IV
Measured and Calculated V. F. Crosstalk between Szeged C.N.3 and Timi�oara C.N.3 and between Oreadea C.S.3
and Ia�i C.S.3 Systems in the A -B Direction
Disturbing Disturbed Calculated Or 1 Ia;;i ·1 36.8 Or 2 Ia;;i 2 47.3 Or 3 Ia;;i 3 68.8 Ia;;i 1 Or 1 74.9 Ia;;i 2 Or 2 80.3 la9i 3 Or 3 92.9 Sz 1 T 1 53.5 Sz 2 T 2 60.9 Sz 3 T 3 63.7 T 1 Sz 1 55.7 T 2 Sz 2 62. 7 T 3 Sz 3 58.7
Key : Sz = Szeged T = Timi9oara Or = Oradea Figure denotes number of channel
(c) Crosstalk Between Unlike Systems
Measured 46.0 44.0 58.0 80.0 67.5 80.0 54.5 . . . . . . . . 50.5 58.0 60.5
All the values given in the above tables refer only to crosstalk between similar systems, i.e . , those transmitting similar frequency bands, but it is obvious that interference can take place also between systems transmitting different frequency bands, if those frequency bands have any portion in common. Naturally, the effect of such interference will be less, because the band width over which interference takes place is very much narrowed owing to the mutual staggering of the carrier-frequencies, and also because the interference will be unintelligible.
During the course of the Rumanian carrier survey, several crosstalk frequency runs between lines carrying unlike systems were taken, and an attempt was made to develop an approximate method of estimating the V. F. crosstalk from the basis of the 1000 p :s. level diagrams which are normally prepared for each channel, applying corrections to take into account the narrowing of the interfering bands.
The method employed was in principle the same as that used for like systems, that is, the level diagrams in conj unction with the band
www.americanradiohistory.com
E L E C T R I C A L C O M M U N I C A T I O N 23
TABLE V Measured and Calculated V. F. Crosstalk between Single-Channel Systems Cluj, PloeJti and BraiOV in the A-B Direction
Disturbing System Disturbed
System Cl. D.A.1 Br. I Br. I I Pl. I PI. I I PI. I I I
54.0 59.5 69.3 80.3 54.8 Cl. D.A.1 71 .0 80 60.0 65.0 58.0
58.3 62.0 46.5 5 1 .0 62.0 Br. I 61.0 53.0 52.0 54.0 60.0
58.3 51 .5 51.0 58.0 53.5 Br. I I 61.0 53.0 �· 50.0 63.0 60.0
73.1 54.5 53.5 63.5 46.5 Pl. I 64.0 48.0 53.0 63.0 48.0
63.6 55.0 70.5 63.5 51 .0 Pl. I I 60.0 51 .0 61.5 65.0 63.0
47.1 56.0 65.0 47.5 50.0 I Pl. I I I 40.0 53.0 55.5 50.0 56.0 -Key : Cl = Cluj
Br = Bra9ov Pl = Ploe9ti
Roman numerals denote number of system. Calculated value is in upper left-hand of each square
measured value in lower right-hand. '
crosstalk between lines were taken as a basis for the calculations.
The reduction in crosstalk, due to the narrow
ing of the overlapping portion of the frequency
bands in any one case of interference, was ar
rived at by supposing as a first approximation
that the amount of reduction of crosstalk energy
is directly proportional to the reduction of band
width. Thus the fraction of the total band
which remains after staggering the carrier
frequencies may be regarded as an energy ratio,
and may of course be expressed in decibels and
added to the mean band crosstalk. For example,
the interference between the third channel of
the C.S.3 system and the A-B direction of the
single-channel D . 1 or D.A.1 system occurs be
tween the frequency limits 7600 p :s and 8900
p :s. , i .e. , over a range of 1300 p :s. The reduction
in band crosstalk, therefore, due to staggering,
may be regarded as the number of decibels
corresponding to an energy ratio of
1300
2500 = 0·52
(2500 p :s. is the normal width of band) .
The decibel value is calculated of course from
the formula
DB 10 log10 0.52 2 .8
This value, 2 .8 db. is added to the mean band crosstalk}'.iound by measurement.
When using the level diagrams, it was thought
TABLE VI
Measured and Calculated V. F. Crosstalk between SingleChannel Systems Ploe§ti and BraJOV in the B-A Direction
(a) Between PloeJti Systems
Disturbed System Pl I
Pl I
Pl I I 72.0 70.0
Pl I I I 66.0 65.0
(b) Between BraJOV Systems
Disturbed System
Br I
Disturbing System Pl I I
67.5 68.0
56.0 58.0
Disturbing System
Pl I I I
64.5 65.0
58.5 65.0
Br I I Br I I
58.1 58.0
62.4 Br I I 63.0
Key: Br = Bra9ov Pl = Ploe9ti Roman numerals denote number of system. Calculated value is in upper left-hand of each square,
measured value in lower right-hand.
www.americanradiohistory.com

24 E L E C T R I C A L C O M M U N I C A T I O N
desirable to apply a further correction to take into account the loss of level relative to 1000 p :s. at the mid-point of the interfering portion of the frequency band, due to the shape of the frequency curve of the filters at the edges of the band.
For example, in the case of interference between channel 2 of the C .S.3 system and the single-channel systems, the mid-point of the overlap portion of the bands corresponds to a band frequency of 450 p :s. in each channel .
For possible errors in this assumption see Section (d) below. Now the level on the line at this frequency on the disturbing circuit is about 1 .5 db. lower than at 1000 p :s. due to the cut-off effect of the filters. Further, on the disturbed circuit the receiving gain is diminished by the same amount due to the same cause, thus on these two counts, the equivalent of the crosstalk path is increased by 1 .5 db. each ; therefore, a correction of 3 db. must be applied.
Tables VII and VIII show the values which must be applied as corrections in the various cases of interference. Table VII gives values which are intended to correct for the narrowing of the frequency bands due to staggering, and Table VIII gives the values which are intended to correct for differences in level between the 1000 p :s. value and the value at the mid-point of the interfering portion of the bands.
Several cases of interference were measured and calculated, and the results are shown in Table IX. The method of calculating the V. F. crosstalk was in all respects similar to that employed for like systems, the only difference being the application of the corrections described above.
For measuring the V. F. crosstalk, the human voice was employed as a source of disturbing current rather than the 74020-C test set, since it was felt that the tone given by the latter on the disturbed circuit was so very different
TABLE VII
C.S.3 I
C.N.3 I 4.5
C. N.3 II
C.N.3 III
C.S;3 I
C.S.3 I I
C.S.3 I I I
D . 1
C.S.3 I
C.N.3 I 1
C.N.3 II
C.N.3 III
C.S.3 I
C.S.3 I I
C.S.3 I I I
D.l
Band Reduction Corrections. A-B Direction
C.S.3 II C.S.3 III C.N.3 I C.N.3 I I
5.0
4.5 4.5
3.5
4.5
5.0 4.5
4.5
2 .8 7.0 0.8
TABLE VIII Level Reduction Corrections. A -B and B-A Directions
C.S.3 I I C.S.3 I I I C.N.3 I C.N.3 I I
0
1 0
0.5
1
0 1
0
3 0 0
C.N.3 III D.1
0.8
2 .8
3.5 7.0
C.N.3 III D.1
0
3
0.5 0
www.americanradiohistory.com

E L E C T R I C A L C O M M U N I C A T I O N 25
in quality from that on the disturbing circuit that discrepancies might arise in the measurements. With the voice, it was found impossible to hear any crosstalk below about 1000 crosstalk units (60 db.) on the 74050-A crosstalk set, and the measured values given in Table IX as oo should therefore rather be taken as being greater than 60 db.
(d) Accuracy of Results
The values quoted above are naturally subject to variations of different kinds, and the following represents an attempt to estimate the accuracy to be expected in predicting V. F. crosstalk values from the results of carrier crosstalk surveys.
The estimable variations arise from the fol-lowing sources :
Line variations Plate voltage variations Filament current variations Errors of measurement of C. F. crosstalk Errors of measurement of V. F. crosstalk Variation of level reduction correction (Table VIII)
Since the magnitude of the crosstalk depends upon the attenuation of the crosstalk path, it follows that variations in the latter will produce variations of the same magnitude in the measured crosstalk. Since, however, the voice-frequency measurements will, of necessity, be made at some time subsequent to the carrier line tests, the line will not necessarily be in the same condition for both tests. Now the range of variation in the attenuation of a carrier line with weather conditions depends not only upon the weather itself but also upon :
(i) The length of the circuit (ii) Its diameter
(iii) The frequency considered
By reason of (iii) , it follows that any correction to be applied must be arrived at separately for each case considered. For example, the line attenuation variations of channel III of a type C .S.3 system in the B-A direction (carrierfrequency 28.0 kc.) will be very much greater than say, the variations in the B-A direction of a single channel system (carrier-frequency 6.87 kc.) , other things, of course, being equal .
It is impossible to say just what is the magnitude of the variation in the equivalent of the crosstalk path due to a given fluctuation of at-
TABLE IX
Measured and Calculated V. F. Crosstalk between Unlike Systems. A-B Direction
(a) Between Szeged C.N.3 and Timiioara C.S.3 Sys fems
Disturbing Disturbed I Calculated Measured S.Z.1 T.1 55.7 66 S.Z.1 T.2 55 . . S.Z.2 T.2 62 . . S.Z.2 T.3 70.2 . .
S.Z.3 T.3 61.6 59 T.1 . S.Z.1 58.5 60 T.2 S.Z.1 47 . .
T.2 S.Z.2
I 51.3 60
T.3 S.Z.2 53.2 . . T.3 S.Z.3 51 .5 56
(b) Between Oradea C.S.3, Iaii C.S.3 and BraiOV and Ploe�ti D.1 Systems
Disturbing Disturbed Calculated Measured Or 2 Br I Or 2 Br II Or 3 Br I Or 3 Br II Br I Or 2 Br II Or 2 Br I Or 3 Br I I O r 3
Or 2 Pl II Or 2 Pl Ill Or 3 Pl II Or 3 Pl Ill Pl II Or 2 Pl III Or 2 Pl II Or 3 Pl Ill Or 3
la9i 2 Br II la9i 2 Br III Ia9i 3 Br I Ia;;i 3 Br II Br I Ia;;i 2 Br I I la9i 2 Br I la9i 3 Br I I la9i 3
la9i 2 Pl II la9i 2 Pl III la9i 3 Pl II la9i 3 Pl Ill Pl II la9i 2 Pl III la9i 2 Pl II la9i 3 Pl Ill la9i 3
Key: Sz = Szeged T = Timi;;oara Or = Oradea Br = Bra9ov
38.6 35.6 37.6 41.6 70.5 63.5 84.4 72.4
53.2 46.2 65.3 47.3 82.0 73.5 99.4 85.4
75.9 78.9 69.5 79.0 67.2 65.7 79.5 74
80.9 75.4 79.5 70.0 67.7 56.7 79.0 62.5
Pl = Ploe9ti Roman numerals denote number of system Arabic numerals denote number of channel
50.5 38 43 41 . . . . . . � .
. . . .
. . . .
54 54 48 56.5 0 • • •
. . . .
. . . .
. . . .
. . . .
. . . .
. . . .
. . .
. . . .
. . . .
. . . .
. . . .
. . . .
. . . .
. . . .
. . . .
. . . .
. . . .
. . . .
. . . .
www.americanradiohistory.com

26 E L E C T R I C A L C O M M U N I C A T I O N
tenuation in either the disturbing or disturbed circuit, since it is never certain whether a given small variation occurs in the crosstalk path or not, but at any rate it may be assumed with an accuracy sufficient for the purpose in hand that the variation in crosstalk is given by the arithmetic mean of the attenuation variations of the disturbing and disturbed circuits.
As an example, let us consider the case of interference in the A-B direction between channel I of the Bucarest-Szeged C.N.3 system and channel I of the Bucarest-Timi9oara C.S.3 system. This interference takes place between Timi9oara and Craiova, where the first named system runs on a 4 mm. circuit and the second on a 3 mm. circuit. The frequency at the centre of the overlapping portion of the band is 13 .35 kc. , and at this frequency, the variation in attenuation between extreme conditions may amount, for the 4 mm. circuit, to about 403 and, in the case of the 3 mm. circuit to about 353 of the whole6• From the data available for these lines, the variations possible are as follows :
4 mm. 6.4 db. 3 mm. 8.6 db.
The total variation to be expected in the crosstalk value is therefore equal to
6.4+8·6 = 7.5 db.
2
In other words the possible discrepancy between the voice-frequency crosstalk predicted in the manner outlined in this paper and that found subsequently by direct measurement will be ±3.75 db. , due to line variations.
Variations in plate voltage and filament current also produce variations in the gain of the carrier system amplifiers, modulators and demodulators. These variations in their turn cause differences in the measured voice-frequency crosstalk values since the latter are measured inclusive of all equipment.
Measurements on existing three-channel equipment indicate that the variatioII of gain in each station, due to plate voltage variations between the allowable limits, will be of the order of 0.6 db. total , that is, the gain fluctuation will be ±0.3 db.
"See "Transmission Characteristics of Open-Wire Telephone Lines" by E. I. Green, A. T. & T. Co., Bell System Technical Journal, October, 1930.
Similarly, for filament current variations between allowable limits, the gain fluc;;,�uation in each three-channel station will be about ±0.4 db.
These variations, ordinarily, will not introduce as much discrepancy as above quoted into the measurements, for, when the systems are measured for V. F. crosstalk, they are almost invariably "lined-up" (i .e., checked for overall loss and levels) immediately beforehand. In addition , on parallel systems, such changes would be mutually compensatory, since if the gain in one amplifier in any office varies due to, say, a fluctuation in plate voltage, then the gain of another amplifier of a parallel system will vary by the same amount and in the same direction, and the two variations will cancel one another. In the case, however, of non-coterminous systems paralleling each other in the first repeater section, it will be necessary to consider this variation, since the two transmitting amplifiers are not subiect to the same battery fluctuations.
Such a case occurs between Craiova and Szeged in the A-B direction, where the Szeged-Craiova repeater section of the Bucarest-Szeged C.N.3 system parallels the Timi9oara-Craiova repeater section of the Bucarest-Timi9oara C .S.3 system, but only in the section Timi9oara-Craiova. Variations, therefore, will occur due to plate voltage and filament current variations in both Szeged and Timi9oara. >
The total variation then, assuming the individual variations to add up as the root of the sum of their squares, will be
vco.3) 2 x 2 + (0.4) 2 x 2 = ± 0.1 db.
The errors in the actual measurements of voice-frequency and carrier-frequency crosstalk, i .e . , those depending on individual observers are probably of the order of about ± 2 db. in each case. These errors will doubtless vary for different persons, but for those engaged on the survey described in this paper the above figure may be taken as correct.
Since Table VI II (Level Reduction Corrections) has been compiled from the average of a large number of carrier channels, it is clear that individual channels will vary from this mean. From an examination of the detailed results available it appears that the possible error due
www.americanradiohistory.com

E L E C T R I C A L C O M M U N I C A T I O N 27
to individual variations from the mean will be about ± 2 db.
Considering, then, all the possible variations arising in the example quoted above, that of interference between channel I of the BucarestSzeged System and channel I of the BucarestTimi9oara System, we have the following
Variation Value
Line variations . . . . . . . . . . . . . . . . . . . . ±3.75 db. Plate voltage variations in Szeged . . . . ±0.3 "
" " " " Timi;;oara ±0.3 " Fila�ent current " " Szeged . . . . ±0.4 "
" Timi;;oara ±0.4
Variation Value
Errors in measurement of C. F. crosstalk. . . . . . . ±2.0 db. Errors in measurement of V. F. crosstalk . . . . . . . ±2.0 db. Individual variations of level reduction corrections. ±2.0 db.
The probable variation then, will be of the order of
V(3.7s) 2 + co.3) 2 + co.3) 2 + (o.4) 2 + (o.4) 2 + c2 ) 2
+ (2) 2 + (2) 2 = ± 5 . 15 db.
Referring to Table IX, it is seen that the figures when the Szeged channel is disturbing are, calculated : 55 .7 db. , measured : 66 db. , and when the Timi9oara channel is disturbing : calculated : 58.5 db. , measured : 60 db. In one case, the difference is double that calculated, and in the other, it is well within the limits predicted.
Now in addition to the estimable variations quoted above, there are others which cannot be estimated without special investigation.
For example, a serious difficulty in the measurement of the V. F. crosstalk, especially when speech is used as a disturbing influence, is the fact that the power is very low, and the crosstalk is very difficult to detect at all. This will very largely increase the normal variation from observer to observer.
Another source of variation probably lies in the assumption that the reduction in crosstalk between unlike systems due to the narrowing of the overlapping portions of the frequency bands depends upon the fact that the crosstalk energy is reduced in direct proportion as the band width is narrowed. SirU:e · it is known that the major portion of the ' foi'ce energy is carried by the lower frequencies, it is apparent that the particular end of tH� fr�quency band common to any two mutually' "interfering channels is of
decisive influence in determining the magnitude of the crosstalk. Just what deviation from the calculated value would result from this source, however, would be a matter for laboratory investigation.
It might be supposed, from the. magnitude and frequency of the variations between the calculated and measured values, that the method of calculation is unreliable but, actually, it is believed that the calculated values give a result corresponding more to the normal condition than the measured values, because the latter are subject to equipment variations as well as line changes.
Further, the variations of the measured from the calculated values are distributed fairly well in the positive and negative senses. If, for example, in Tables IV, V and VI, the calculated value be subtracted from the measured value, it is found that the sum of the resulting positive figures is 153. 7, and that of the negative figures is 142 . 7, i.e., the difference between the two is 1 1 .0 . These three tables, which contain all the cases of crosstalk between like systems considered, give SO values, and doubtless if the number of values had been greater, this difference would have been smaller. With a great enough number of values, the difference, i .e. , the algebraic sum of the variations, should approach zero. The smallness of the algebraic sum of the variations between measured and calculated values indicates that the method of calculation is reliable.
The sum of the algebraic variations between calculated and measured values on unlike systems cannot in the present instance be determined, since so many of the V. F. values were inaudible, but the results in general show the valuable effect of staggering the frequencies and indicate that, providing all ordinary precautions are taken, crosstalk troubles on unlike systems will be few and far between.
It may be pointed out, in connection with the values of crosstalk given, either measured or calculated, that these values refer to crosstalk measured or calculated between the terminals of the systems concerned and not to that which obtains in service conditions. The true condition is in many cases considerably more favorable than that indicated in these tables, due to the
www.americanradiohistory.com
28 E L E C T R I C A L C O M M U N I C A T I O N
fact that the channel in question is prolonged to some other point ; thus the incoming level on the channel is much lower than when measuring tone is sent, since the latter was always sent directly on the channel input.
VII. Maintenance Problems
Quite early in the development of the Rumanian carrier network it became apparent that the maintenance of the various systems would present problems, some of which in ordinary circumstances would not perhaps have been keenly felt. They were :
(a) The newness of carrier systems to the mechanics on the maintenance staff.
(b) The gradual extension of many of these systems to work with a small safety margin.
(c) The close interrelation of all systems with regard to community of routes and balanced levels.
In the case of problem (a) , where the mechanics found themselves suddenly confronted with a system of telephony up to that time entirely strange to them, they not only had to learn the principles governing this new method of communication, but it was also necessary for many of them to reorganize their whole ideas as regards what is acceptable as a good circuit, what constitutes good transmission, and how equipment and lines should be maintained with a view to ensuring it. For these reasons it was decided to conduct a training school for those mechanics who were to carry out maintenance work on the carrier systems.
This school took the form of a course of lectures delivered at Bucarest followed by practical work on the carrier terminals already existing in the Bucarest station. It was felt that the maintenance of the systems would be carried out more efficiently if the mechanics could be interested in the working of the systems, and accordingly about half the time of the carrier course was devoted to a simple, entirely non-mathematical explanation of the principles of carrier operation with special reference to the standard single-channel and three-channel systems, while the other half of the time was devoted to maintenance questions.
A most encouraging keenness was shown by the personnel concerned, and the increased
efficiency of maintenance has been an ample
justification for the time spent in training. After
the conclusion of the carrier school , the course of
lectures was worked up into a bulletin , which was
issued to every mechanic in the country concerned with carrier maintenance.
It has been found of great service to plot week by week the settings of all potentiometers of the three-channel systems, both at the repeater stations and at the terminals. The variations of the different potentiometer settings give indications of changes in transmission loss or gain in the various sections of the line, since these settings are always changed in such a way as to preserve the pilot channel level of the systems at a certain fixed value, which is determined by the engineer in charge of the original line-up of the system. These potentiometer curves are scrutinised in ordinary circumstances once a week by the engineer responsible for transmission maintenance of carrier systems, and are found of great value in that they indicate at once variations in any part of the system, thus enabling faults to be discovered and cleared with minimum delay.
Examples of such potentiometer curves are shown in Fig. 2 1 , which reproduces the curves for the amplifiers of the Bucarest-Oradea system for the month of December, 1932. Curves of demodulator potentiometer settings at the receiving terminal are also plotted. These give an indication of changes in the frequency characteristics of the line, as well as of faults in the terminal equipment.
VIII. Conclusion
A description of the layout and general characteristics of the Rumanian carrier network has been given in this paper. The authors have endeavored to show that the development of the network was forced in a way far from ideal , partly because of unforeseen traffic conditions and partly because of prevailing economic conditions. Problems of transmission interference and maintenance were thus forced upon the carrier engineers, and their solution afforded the resuhs already quoted.
The authors are of the opinion that in future surveys of lines, with a view to carrier operation, it will suffice to measure far-end crosstalk from
www.americanradiohistory.com
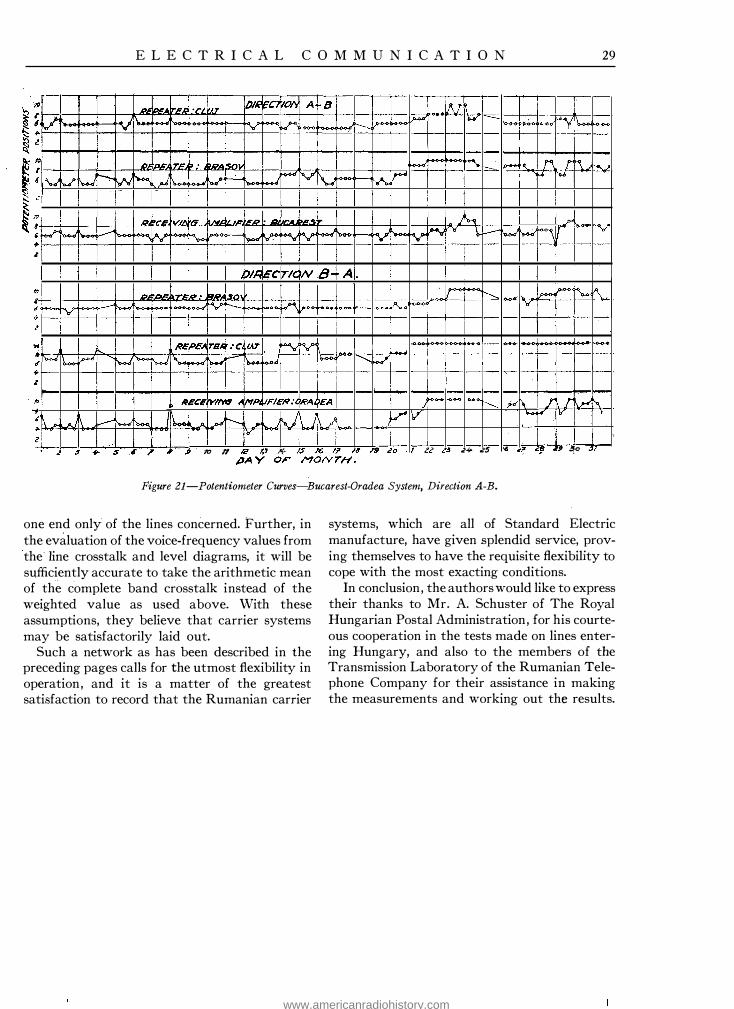
E L E C T R I C A L C O M M U N I C A T I O N 29
'/()
'V I �
+. .i I# I 6 I \,.J v "
¥ :L.
!'-' .......,_ � � ....
·r1 11'T /)/If. WCi VO/\ v � �
,.. ,__:_ ..-� � '"" r-.. µ
A 8 lAl1 I l� M -
1.-.<> � . . <><Ii '\,..,.. i,..,...,
....,.,, ...... � � ·� 1,,..., . . � rt«.. ..... ' rv \..,; '-..'\,. Ir< M '""
:i; - ... ,, ·-, __ . - - · - - � Jib-<> �
�v � '-· �-) � '<i hL---- h I"" y 'V I>-;'\,.,, . _ __ .. � . � r..t l'o..d r.-· - - � � l'l>" " >I .... .,, z
DIA 'EC IT/C � 8- A . � - ·-- -,.__ :--..... 1,...,.., r._ V\ I,_,. 8 ... � - 1 .. _ ..,.,... v ,. � � .... ... I; ..
.. /\'I. .0£,t, rs1. : c (.1..7 """"' rv �.L 8
�� \,.., ..- ·--·�- .,...... ........_ ..;/ ' """" ),_. V-0 ...... ,,_._. _.{ fl,....- i.-. � I; l
'° Rf!CE. vm � ' '1-fp, lrl�."R;I IRA• )£A -� 1·...__ ...,, '• T r •.• :..,. . 1 .i ..r v . ........ v \, I I � A I � I 1.- A ..d r---.. - / )
ilf' -I 2 I '
.! s .,. s " ,, . J> 1r1 II .fi! ,._, ,,,. lS � Ii' )6 .f9 i!O ' 22 2!! ,z;,. i!5 6 .2!1' ! , ., .!fo
Figure 21-Potentiometer Curves-Bucarest-Oradea System, Direction A-B.
one end only of the lines concerned. Further, in the evaluation of the voice-frequency values from the line crosstalk and level diagrams, it will be sufficiently accurate to take the arithmetic mean of the complete band crosstalk instead of the weighted value as used above. With these assumptions, they believe that carrier systems may be satisfactorily laid out.
Such a network as has been described in the preceding pages calls for the utmost flexibility in operation, and it is a matter of the greatest satisfaction to record that the Rumanian carrier
systems, which are all of Standard Electric manufacture, have given splendid service, proving themselves to have the requisite flexibility to cope with the most exacting conditions.
In conclusion, the authors would like to express their thanks to Mr. A. Schuster of The Royal Hungarian Postal Administration, for his courteous cooperation in the tests made on lines entering Hungary, and also to the members of the Transmission Laboratory of the Rumanian Telephone Company for their assistance in making the measurements and working out the results.
www.americanradiohistory.com
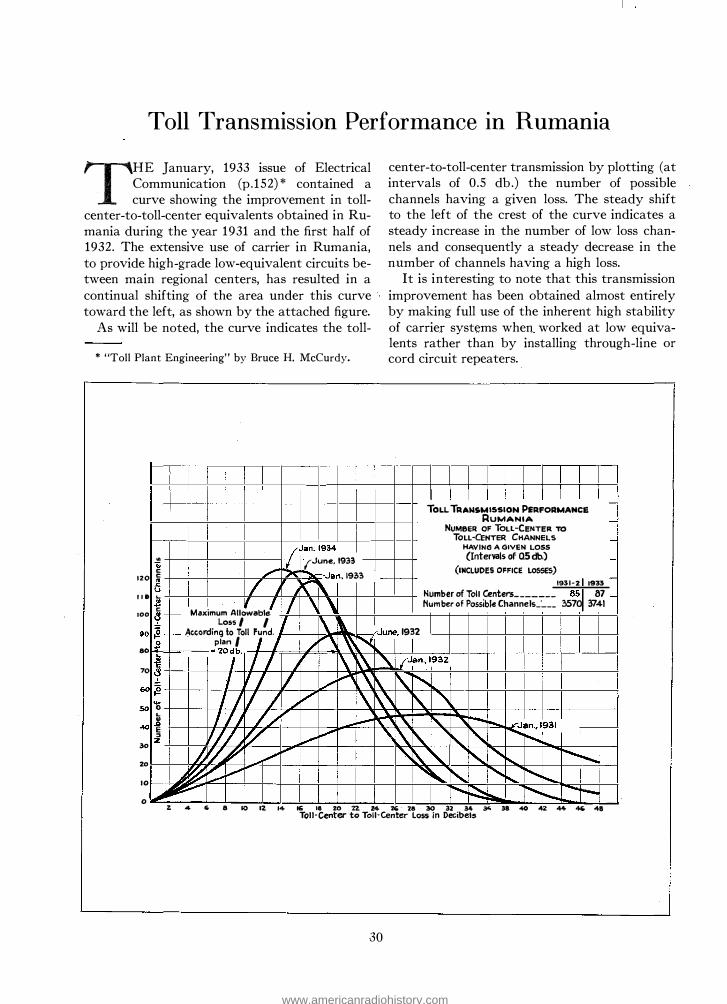
Toll Transmission Performance in Rumania
THE January, 1933 issue of Electrical Communication (p.152) * contained a curve showing the improvement in toll
center-to-toll-center equivalents obtained in Rumania during the year 1931 and the first half of 1932. The extensive use of carrier in Rumania, to provide high-grade low-equivalent circuits between main regional centers, has resulted in a continual shifting of the area under this curve toward the left, as shown by the attached figure.
As will be noted, the curve indicates the toll-
* "Toll Plant Engineering" by Bruce H. McCurdy.
/Jan. 1934 ..
ti _ _j (June, 1933 c ,,. .,.. ----Jan .. 1933 c .l! I , I(""� u ' ' ... .l! ' I I ' ' c � - Maximum Allowable
Loss / / ' \ � ;§ ->-- Aceol'ding to Toll Fund. .s - plan / J j ./ .... ' � N � =ZO?. 1 1 " \ � '
120
I I 0
100
90
80
70
center-to-toll-center transmission by plotting (at intervals of 0.5 db.) the number of possible channels having a given loss. The steady shift to the left of the crest of the curve indicates a steady increase in the number of low loss channels and consequently a steady decrease in the number of channels having a high loss.
It is interesting to note that this transmission improvement has been obtained almost entirely by making full use of the inherent high stability of carrier systems when worked at low equivalents rather than by installing through-line or cord circuit repeaters.
I I I I I I I I I I -TOLL TRANSMISSION PERFORMANCE RuMANIA -
NUMBER OF TOLL -CENTER TO TOLL-CENTER CHANNELS -HAVING A GIVEN LOSS (Intervals of QS db.) -
(INCLUDES OFFICE LOSSES) -_.._ -1931-2 1933
Number of Toll Centers _______ 85 87 -Number of Possible Channe Is_·___ 3570 3741
June. 1932
I "\. /Jan., 1932
.s I/ I J I/ � \� ' � ;§ I/ 50
30
20
10
0
.... j I I J ... v I\ \\ r\.. ' 0 L I I/ J �'/'/'.!' ' ... ' " _i,.--� , " 1'. � � --.0 -Jan., 1931 E ,, v V/ " L\. i\. 'It\. I" " l.....-J...-""" -r-... z
i � " _v ..... " � t\.. � ....... ,......,, � """""" A � � v "'1 � 1'.. I'. i..... 1'.... �
L...-i "1J!t � r--.. � r--.. -'""--- """""' 2 4 5 8 � � � � � � n � � � � " M � � � � # � �
Toll-Center to Toll-Center Loss in Decibels
30
www.americanradiohistory.com

Properties of Lead and Lead Alloy Cable Sheaths
By J. C. CHASTON, B.Sc., A.R.S.M.
Standard Telephones and Cables, Limited
Introduction
SOME indication of the extent to which lead or lead alloy cable sheaths play their part in the protection of communication
and power transmission systems throughout the world may be obtained from figures published by
the American Bureau of Metal Statistics. In 1929, the latest year for which figures are available, 206,000 short tons, or 2 1 .8% of the total consumption of lead, was used for the purpose of sheathing cables in the United States of America. The cable industry is now second only to the storage battery industry as a user of lead, and has held this position since 1925.
It is thus hardly surprising that in recent years a very large amount of work has been carried out in developing new lead alloys for the purpose of improving their protective value for cable sheathing purposes and reducing costs. As a result, there are now in use a large number of cable sheathing materials , the chief of which are unalloyed lead ; the lead-antimony alloys containing 0.7% to 1 .0% of antimony ; and the ternary lead alloys developed by the British Non-Ferrous Metals Research Association containing up to 0.25% of cadmium with up to 0.5% of antimony or 1 .5% of tin. The lead-tin alloys with 3% of tin were at one time largely used, but are now rarely specified, and the leadcalcium alloys recently considered in America do not appear to have reached the stage of regular production. In Table I a list, believed to be comprehensive, is given of the metallic sheathing materials which have from time to time been proposed or used.
Special virtues have been claimed for every one of these alloys, but when an attempt is made to assess the relative values of each for a particular application and, especially, to select the most suitable alloy for standardisation, difficulties at once arise. Nearly all the published work on the characteristics of sheathing alloys has been carried out on material which either has been
3 1
extruded as rod from a simple type of press or has been cold rolled. The test specimens have usually had machined surfaces and occasionally have been subjected to specified heat treatments. In a few instances, samples cut from cable sheaths have been used, but these invariably have been flattened out before test, without the important fact being realised that by severely deforming the material in this way, its properties are very considerably changed. In manufacturing cable sheath, on the other hand, a highly specialised type of extrusion press is used, the material leaves the die at a high temperature from which it is cooled more or less rapidly, and the sheath is left with a characteristic smooth surface finish. The question that at once arises concerns the extent to which one is justified in applying the results of tests on the one product to predict the behaviour of the other. The present paper reviews the state of our knowledge of the properties of the common cable sheathing alloys, and gives an account of an investigation carried out on samples of extruded sheath made in a standard cable press in an endeavour to answer this question.
Characteristics of Importance in a Cable Sheathing Material
Before describing the work covered by the present paper, it will be desirable to consider briefly the characteristics which are of importance in a sheathing material . Broadly speaking, the manufacturer seeks an alloy which, at high speed, will extrude easily without developing blisters and similar defects and which will be low in cost ; the installer looks for one which will withstand severe handling without fracture, buckling or crushing, which will bend easily, and which will not become abraded when drawn across hard surfaces ; and the user requires that the alloy, in as thin a layer as possible, shall continue to serve as a protection to the cable in the face of corrosion, alternating stresses, and all
www.americanradiohistory.com
32 E L E C T R I C A L C O M M U N I C A T I O N
other conditions met with in service. The emphasis to be placed on these various requirements varies with different classes of cables, and failure to take this fact into consideration has often been a cause of confusion in the past. A sheath material which has been found satisfactory for, say, aerial telephone cable, is not necessarily the best for cable which is to be drawn into ducts.
The principal types of lead-sheathed cables may conveniently be classed as :
1. Telephone Cable drawn into ducts. 2 . Telephone Cable laid in trenches (and generally
armoured). 3 . Aerial Telephone Cable. 4. Power Cable drawn into ducts. 5. Power Cable laid in trenches (and generally ar
moured). 6. Other.
In Europe, telephone cable in the past usually has been installed in ducts, whereas in America aerial telephone cable has been most commonly employed. Power cable is usually armoured and laid in trenches in the ground in Europe, but is extensively laid in ducts in America. It is interesting to note that both in Europe and America there now seems an increasing tendency to instal telephone cables in trenches, especially outside of town areas.
Certain characteristics are equally desirable in the sheaths of all classes of cable. These include the manufacturing requirements of high speed of extrusion, freedom from extrusion defects, and low cost. Lead is the easiest material to extrude but, provided certain precautions are taken, it is not difficult to produce good sheath with just as much certainty in any of the alloys. The question of cost is bound up with the thickness of the sheath, and any alloy which would enable the thickness to be reduced with safety would at once possess an immense advantage over all others. Such an alloy would obviously need to be more rigid, of higher strength and hardness, and greater resistance to fatigue and corrosion than the material it replaces. It should be recognised, however, that even if such a material were found, it might not in all cases be possible to reduce sheath thickness with safety, since the thinner sheath would most probably be very much more liable to buckle when it was bent. The factors which govern the tendency of an unsupported
tube to buckle when it is bent through a given angle are not subject to precise mathematical treatment, but it seems likely that the actual thickness is by far the most important, the rigidity of the material being a minor consideration. It, therefore, seems probable that for paper insulated telephone cables, where the core is relatively yielding and loosely packed, the tendency of the sheath to buckle may set a minimum limit on thickness, regardless of the rigidity, strength, or corrosion-resistance capability of the alloy employed. In the case of cables reinforced with a steel tape armouring, however, this consideration is not so important, and the additional circumferential rigidity imparted by the armouring may be sufficient to prevent a thin sheath from buckling. Further, in power cables, buckling is not likely to be a serious problem owing to the dense and unyielding nature of the core.
T,elephone Cables in Ducts
The installation of cables in ducts undoubtedly places greater demands on the sheath than any other form of installation. The cable is unwound from the drum, often led by sharp bends into the mouth of the duct, dragged along a narrow passage which may contain other cables and which is seldom absolutely straight (ground subsidence may cause great distortion in old duct runs) , and finally bent at the ends at acute angles in order to be accommodated in small manholes or connected up to loading coil pots.
The main requirement of a cable sheathing material which is to undergo such treatment, may be stated at once as ductility. It is obvious that the sheath should be sufficiently ductile to withstand without fracture the amount of stretching involved in reeling the cable off the drum, bending it into the duct, and setting it in place in the manhole. It is perhaps less evident that ductility is desirable to avoid fracture of the cable sheath in tension during the operation of "pulling-in." It might perhaps be thought that high tensile strength should be sought in order to avoid this kind of mishap. It must be remembered, however, that the cable sheath should not, and cannot in severe cases, be expected to take the strain of "pulling-in."
The sheath should always be firmly dressed
www.americanradiohistory.com

E L E C T R I C A L C O M M U N I C A T I O N 33
down on the core at the ends, and the pull transferred to the core or armouring of the cable. If, however, the dressing-down is not sufficiently carried out, a considerable amount of strain may still be thrown on the sheath , particularly when pulling into tight or distorted ducts. If th,e sheath has little ductility, fracture then be.comes a distinct possibility, since the pull may easily exceed the breaking load of any alloy sheath known. On the other hand, if the sheath is ductile, it will elongate without fracture and may grip the cable core again of its own accord.
A secondary requirement for the sheath material in this case is hardness, inasmuch as this measures resistance to permanent deformation and resistance to abrasion. The sheath should not be subject to easy crushing, as this would terrd to alter the capacity distribution of the conductors, and it should withstand the abrasive action of the duct� The resistance of the sheath to bending (an approximate measure of which is the maximum tensile strength) is of minor importance except in very small cables, since the stiffness of the sh.ea th is usually small in
TABLE I ALLOYS USED OR PROPOSED FOR CABLE SHEATHING
Composition Percent Alloy
Pb Sb Sn Cd Bi Cu Zn Ca Zn Te -- -- -- -- -- -- -- --
Pure Lead . . . . . . . . . . . . . . . . . . . 100.0 - - - - - - - - -
3 3 Tin Alloy . . . . . . . . . . . . . . . . 97.0 - 3.0 - - - - - - -
2 3 Tin Alloy . . . . . . . . . . . . . . . . 98.0 - 2 .0 - - - - - - -
1 3 Tin Alloy . . . . . . . . . . . . . . . . 99.0 - 1 .0 - - - - - - -
Copper bearing 1 3 Antimony Alloy . . . . . . . . . . . . . . . . . · · · · 99.0 1 .0 - - - 0.06 - - - -
0.853 Antimony Alloy . . . . . . . . 99. 15 0.85 - - - - - - - -
British Non-Ferrous Ternary Alloy No. 1 . . . . . . . . . . . . . . . . 99.25 0.5 - 0.25 - - - - - -
British Non-Ferrous Ternary Alloy No. 2 . . . . . . . . . . . . . . . . 98.25 - 1 .5 0.25 - - - - - -
British Non-Ferrous Ternary Alloy No. 3 . . . . . . . . . . . . . . . . 99.45 - 0.4 0.15 - - - - - -
Calcium Alloy . . . . . . . . . . . . . . . 99.96 - - - - - - 0.04 - -
Zinc Alloy . . . . . . . . . . . . . . . . . . . 97.0 - - - - - 3.0 - - -
Tin-Antimony Alloy . . . . . . . . . . 98.9 1 .0 0 .1 - - - - - - -
Cadmium Alloy . . . . . . . . . . . . . . 98.8 - - 1 .2 - - - - - -
Bismuth-Antimony Alloy . . . . . . 98:85 1 .0 - - 0.15 - - - - -
Antimony-Zinc Alloy . . . . . . . . . 99.36 0.5 - - - - - - 0.14 -
Tellurium Alloy . . . . . . . . . . . . . . 99.94 - - - - - - - - 0.06
Remarks
Original cable sheathing material. Still widely used.
From 1894 to 1913 was standard of American Telephone & Tele-graph Co. for telephone cables.
Used in Europe, more especially for small cables.
Used to some extent in Europe, particularly m Germany and France.
Has been standard of American Telephone & Telegraph Co. for telephone cable since 1913.
·
Used to some extent in Great Britain and Europe.
British Patent No. 272320.
British Patent No. 272320.
British Patent No. 272320 used by British Admiralty for ships cabling.
British Patent No. 3 14522 .
Claimed to have good corrosion resistance (24).
U. S. A. Patent No. 1896473.
British Patent No. 257676.
British Patent No. 351449.
British Patent No. 360422.
Recently introduced (38) .
www.americanradiohistory.com

34 E L E C T R I C A L C O M M U N I C A T I O N
comparison with that of the core. In addition to the preceding installation requirements, it is of course also necessary that the sheath should be as resistant as possible to corrosion and should also resist failure under the action of alternating stresses (fatigue) . Failure from fatigue is, surprisingly, not uncommon in duct cables, and is frequently caused by the vibrations set up by heavy traffic. The effect of vibration is probably often made more serious by the superimposition of a steady tensile pull, caused by creep of the cable along the duct lines.
Telephone Cable in Trenches
In this class of cable, ductility is far less important as the cable is required to withstand little bending beyond that involved in unreeling the cable. A hard sheath may here be of value to withstand crushing, and high corrosion-resistance is, of course, desirable. Fatigue resistance is of minor importance.
Aerial Telephone Cable
In aerial telephone cable, on the other hand, high fatigue resistance, tensile strength, and hardness are required to resist the strains imposed on the sheath by wind, storm, rain , snow, diurnal thermal expansions and contractions, and the crushing pressure of the supporting rings . Ductility is not an important installation requirement, since aerial cable is drawn straight from the drum through the loops of the supporting cable. It is generally possible to place the drum so as to avoid violent bending of the cable, and the ends do not need to be set in the acute curves often necessary in the manholes associated with duct cables. The tension placed on the cable during installation is also usually less than when drawing into ducts.
Power Cable Sheath in Ducts
The installation requirements for ductility are less severe for the sheaths of power cable which is drawn into ducts than for those of duct telephone cable. The ducts are generally roomier, pulling stresses are smaller, and the manhole bends less acute.
On the other hand, more severe calls are made on the sheath material while in service to with-
stand repeated bends, wear, and alternating stresses. In this connection, statistics published by the American National Electric Light Association in the annual reports of its Underground Systems Committee are of considerable interest. These now present a detailed analysis of the failures occurring each year in power cables operating at 6600 volts and over, belonging to fourteen large companies, and from it the following summary, showing the various causes ascribed for the reported sheath faults in the three years 1929-193 1 , has been prepared :
1. Cable movements (wear at duct mouths, wear at hangers, expansion and contraction in ducts) . . . 24. 1 % of total sheath failures
2. Electrolytic corrosion . . . 17 . 7 3. Damage and defective
workmanship in installa-tion . . . . . . . . . . . . . . . . . . 17 .1
4. Chemical corrosion . . . . . 16. 1 5. Extrus ion defects i n
lead . . . . . . . . . . . . . . . . . . 12 .7 6 . Sharp bends . . . . . . . . . . . 4.5 7 . Vibration . . . . . . . . . . . . . 4 .1 8. Bursting through high
internal oil pressure . . . . 0.7 9. Other causes . . . . . . . . . . 3.0
The trouble from cable movements is very much accentuated if the ducts are too small, the duct mouths insufficiently rounded, or the manholes not roomy enough. Much can undoubtedly be done by suitable duct design to overcome this most serious cause of trouble but, in addition, it is most desirable that the sheath material should be hard in order to resist abrasion and should be capable of withstanding repeated straining. It may be noted that localised repeated stresses at points of support or at the edges of wipes, where there is a sudden change in rigidity, often give rise to fatigue failure. Taking these considerations into account, it will be seen that cable movements and vibration (items 1 and 7) account between them for 28.2% of the reported failures, and indicate the desirability of a harder and more fatigue-resistant sheathing material . There is no indication of the material comprising the sheaths in the failures reported, but in most instances it was probably lead.
As far as electrolytic corrosion, damage in installation, and chemical corrosion are concerned, little can probably be expected from
www.americanradiohistory.com

E L E C T R I C A L C O M M U N I C A T I O N 35
improved sheath materials. The most serious item remaining is concerned with extrusion defects in the lead. The existence of these defects is particularly serious in cables working under a continuous internal oil pressure, since they frequently give rise to oil-leakage and eventual failure. Apparently there is not a great deal to choose between the alloys as regards freedom from oxide inclusions (the most serious defect) and therefore, the taking of particular precautions as regards cleanliness and the maintenance of the best operating conditions when extruding power cable sheaths is important.
One other point may be mentioned in connection with power cable sheaths. It is probably very desirable that they should behave elastically when variations of internal pressure occur during working. If the sheath stretches beyond its elastic limit under the pressure produced by the thermal expansion of the oil when the cable is under load, voids may be formed later when the oil cools and contracts (3, 32 , 46 ; for these and subsequent references see Bibliography at end of this paper) .
Power Cables in Trenches
Many of the troubles encountered in power cables laid in ducts are non-existent for armoured power cables laid in trenches. Abrasion and cable-movements give rise to few difficulties, and the principal cause of sheath failure is probably the presence of oxide inclusions. Soundness, resistance to corrosion, and elasticity under internal pressure comprise practically all the requirements sought in the sheath of this type of power cable.
Other Sheathed Cables
While the above classification probably includes by far the greatest tonnage of sheathed cables, it is, of course, by no means exhaustive. Submarine telephone and power cables, house and ship-wiring cables, and cables installed under conditions subject to excessive vibration (as on railway bridges) or to extremely corrosive conditions, may be mentioned as among those not so far discussed.
Ductility in submarine cables is very desirable in view of the extreme amount of handling which they are required to withstand. It has also been suggested that high fatigue resistance is desirable to withstand the somewhat large pulsating stresses which may be set up in laying or during repair work. Failure under these conditions, however, would perhaps be more in the nature of an ordinary tensile failure, against which high ductility would be expected to be the most likely guard. The failure of cables installed in positions subject to vibration has been given considerable attention in the past and the value in practice of the alloys possessing higher fatigue strength than pure lead demonstrated by observers in Germany (22, 23) , Great Britain (4) , and America ( 41 , 42) . The principal requirements of the sheathing materials in these and other positions are largely, of course, determined by a study of individual conditions and need not be considered further here.
Summary of Sheath Requirements
In order to summarise the above requirements in convenient form, the table shown below has been
Type of Cable Considerations Governing Choice of Sheath Material
Telephone Cable in Ducts.
Telephone Cable Armoured in Trenches.
Telephone Cable Aerial.
Power Cable in Ducts.
Power Cable Armoured in Trenches.
1 . Ductility. 3. Fatigue Strength. 5. Corrosion ResiEtance.
1. Cost. 3. Hardness.
1. Fatigue Strength. 3. Cost.
1 . Hardness. 3. Cost.
1. Cost. 3. Corrosion Resistance.
2 . Cost. 4. Hardness.
2. Corrosion Resistance. 4. Fatigue Strength.
2. Hardness. 4. Corrosion Resistance.
2. Fatigue Strength. 4. Corrosion Resistance.
2. Hardness. 4. Fatigue Strength.
www.americanradiohistory.com
36 E L E C T R I C A L C O M M U N I C A T I O N
prepared. This lists the principal characteristics in the order in which they are most likely to be considered when making a choice of sheath material for a given purpose. An indication of the technical importance of each factor is to be gauged by whether it is considered before or after the question of cost.
Previous Work on the Properties of Cable Sheathing Materials
Bearing in mind the requirements outlined above for materials for the extrusion of cable sheaths, it may be of interest to indicate the scope of the information available regarding the lead alloys which are or have been used for this purpose.
Age Hardening. An important characteristic which must be taken into account in any study of many of these alloys is their ability to age harden after rapid cooling from the region of the eutectic temperature. This increase in hardness is accompanied by a change in other mechanical properties. The fact that antimony-lead alloys could be hardened by quenching was observed in 1905 by Dubose (14) , but the increase in hardness which develops over a period of time after quenching does not appear to have been recognised prior to the work of Dean and his colleagues in 1925 and 1926 (1 1 , 13 ) . Since then, further observations have been published by Waterhouse and Willows (43) , and the influence of small amounts of third elements studied by those investigators, by Morgan, Swenson, Nix, and Roberts (30) , by Schumacher, Bouton , and Ferguson (34) , and by Seljesater (35 ) . The age hardening of the lead-calcium alloys has been studied by Schumacher and Bouton (33) and Dean and Ryjord (12) . In nearly all this work, the hardness tests have been confined to test pieces quenched in water from about 240°C. Waterhouse and Willows followed the progress of hardening in a few alloys cooled at slower rates. The erroneous impression is widespread that agehardening does not occur to any great extent in extruded alloy cable sheath which is cooled in air (37) , but no experimental evidence on this point has been published. The only hardness measurements to be reported on actual cable sheath samples appear to be those of Thielers (40) , but their value is slight since no account
was taken of the possibility of age hardening and the samples were flattened prior to testing.
Fatigue Strength. The fatigue strength of sheathing alloys has received considerable attention in recent years, particularly since it was demonstrated by Beckinsale and Waterhouse (4) in Great Britain, and Townsend (41 ) in America, that the cracking which had been observed by Archbutt (2) and others in cable placed on railway bridges and in similar locations was due to fatigue failure under repeated stresses. Additional examples of the failure of cable sheathing in similar positions have since been described by other observers, particularly by Haehnel (22 , 23) in Germany.
Fatigue endurance determinations have been made with the Haigh machine on samples turned from extruded and cold rolled material by Beckinsale and Waterhouse ( 4) , and this machine has also been used by Haigh and Brinley Jones (20) in investigating the influence of atmospheric action on the fatigue endurance of these materials. The McAdam type of rotating beam machine with single point loading has been used by Townsend and Greenall ( 42) and Schumacher and Bouton (33) in tests on specimens machined from extruded rod. The H. F. Moore machine for flat specimens was used by Dean and Ryjord (12) but they do not give a description of how the specimens were prepared. Unfortunately, the details given in the accounts of these investigations with regard to the previous history of the alloys and the degree to which age hardening took place before the tests were made, are not so complete as could be wished. The results obtained for the fatigue endurance of unalloyed lead, which does not age harden, are in very close agreement, but there is an extraordinary divergence in the fatigue test results found by the various workers for the age hardening alloys. It is difficult to avoid the conclusion that differences in the degree of age hardening or even of cold working of the test pieces may explain some, at least, of this divergence.
Fatigue tests on extruded sheath have been fairly numerous, but all have been in the nature of comparative tests carried out under an arbitrary set of conditions, usually employing a single value of reversed strain . Comparison between various test results is, therefore, not
www.americanradiohistory.com

E L E C T R I C A L C O M M U N I C A T I O N 37
possible. Tests of this character have been described by Townsend (41 , 42) , Dunsheath and Tunstall (15) , and the Henley Research Laboratories (47 ) . The influence of surface abrasions, and the effect of the general character of the surface of extruded cable sheath have not been studied.
The tests on fatigue have agreed in demonstrating the superiority of nearly all lead alloys over unalloyed lead, as regards fatigue resistance. This has probably led to the assumption that exceptionally pure lead has a very much lower fatigue resistance than the usual refined lead of commerce ( 4 ; discussion by Lancaster) . It is very difficult to find definite evidence for this assumption, and while it certainly seems likely that a difference in fatigue resistance may exist, it would seem desirable to await further evidence before accepting entirely the statements frequently made concerning the extreme susceptibility of very pure lead to fatigue failure.
Tensile Properties. Data on the tensile behaviour of standard specimens under rapid test conditions are given in many of the papers referred to, but as a general rule full details regarding speed of testing and mode of elongation are not included. High tensile strength is not in itself usually important in cable sheath materials, since it is desirable that any load should be carried by the core. Tests of the breaking loads of the sheaths of complete telephone cables have been reported by Street (39) . In order that any load may be readily transferred to the core, and that the sheaths may withstand severe deformation during handling and laying, ductility is, as indicated above, an important consideration. The value of the tensile test in determining this property, and the method of interpreting test results on lead and its alloys have been discussed recently by Haigh and Brinley Jones (2 1 ) , but little experimental work appears to have been carried out. The question as to whether lead and the alloys behave elastically under any range of stress does not appear to have been satisfactorily settled. As a result of tests on the volume changes of short lengths of oil-filled power cable under internal pressure, Beaver (3) concluded that lead behaved elastically at stresses below 280 lbs. per square inch.
This result, however, was challenged by Riley and Scott (32 ) , and also by Gurney Wood (46) , the latter of whom described experiments showing permanent stretching of lead and lead-antimony pipes under considerably lower stresses. It is significant also that Moore and Alleman (29) , in their long time tests found that "creep" occurred at stresses as low as 200 lbs. per square inch.
Mention may here be made of the effect of impurities on the strength of lead and its alloys. Very little precise work appears to have been done to determine this point, but the opinion seems to be widely held that zinc and bismuth in amounts over about 0.001 % and 0.05% respectively are undesirable as they may give rise to brittleness.
Creep Resistance. The creep resistance of cable sheaths is of some interest in connection with power cables, especially as it concerns the degree to which the sheath is likely to stretch under internal oil pressure. Creep tests in which determinations have been made of the time required for failure to occur under constant loads have been carried out on samples of extruded rod by Beckinsale and Waterhouse (4) , Townsend (41) and Dean and Ryjord ( 12 ) , while similar tests on samples of cable sheath have been reported by Archbutt (2) . Experiments in which the rate of creep has been measured under constand loads at various temperatures have been recorded by Townsend and Greenall (42) on machined test pieces, as well as by Clark and Upthegrove (10) and H. F. Moore and Alleman (29) on flattened cable sheath samples. This latter work, in particular, was carried out with
great care, and it is to be very much regretted that the samples were flattened out before test, and that age hardening of the alloys was ignored.
Moore and Alleman also recorded a few tests on the increase in diameter of actual sheath samples maintained under constant internal oil pressure.
Corrosion Resistance. Finally, the corrosion resistance of sheathing materials is a subject of considerable interest to the cable engineer. Cable breakdowns due to corrosion failure many times outnumber those due to all other sheath failures put together. In spite of the fact that the majority of these corrosion failures are un-
www.americanradiohistory.com
38 E L E C T R I C A L C O M M U N I C A T I O N
doubtedly due to electrolytic action by stray currents and cannot be attributed to any property of the sheath material, there still remain a very large number which are caused by chemical corrosion. For a general account and a fairly comprehensive bibliography of the corrosion of lead and its alloys, reference may be directed to the papers by Brady (5, 6) of the Building Research Station.
The corrosion of cable sheath by acetic acid vapour liberated under special circumstances from creosoted wood ducts has been investigated by Burns and Freed (8) and Burns and Campbell (7) . Corrosion by phenol from impregnating compounds has received attention from Fano (16) , Garre (19) and Haehnel (25 ) . Corrosion of flattened cable sheath samples in soil and soil waters has been investigated by Anderegg and Achatz (1) , Burns and Salley (9) , and others. Little of the work on soil corrosion, however, is convincing. The most valuable is undoubtedly to be found in the results of the soil corrosion studies which are still in progress by the United States Bureau of Standards (2 7, 28) . Unfortunately, the samples of lead and lead-antimony sheath used in this investigation were not equal in size and were flattened before burial in the soil. Nevertheless, the results emphasise one important fact-that in soils as distinct from acids, the rates of corrosion of both materials are sm.all , and any differences are minute. It follows that corrosion tests in soils and soil waters must be carried out under stringently controlled conditions, otherwise the experimental error may mask the differences which it is sought to determine. It is not always recognised that the relative rates of corrosion of lead or its alloys under strongly corrosive conditions are not necessarily the same as in less corrosive conditions such as prevail when the materials are buried in the ground.
Arising out of this, the very general opinion that tin-lead alloys are more corrosion-resistant than lead antimony or unalloyed lead may be noted. This has probably received support from the tests recorded by Beckinsale and Waterhouse (4) for the endurance of samples under load immersed in normal acetic acid , and also from the conclusions of Anderegg and Achatz of Purdue University ( 1 ) . The former tests were
obviously carried out under very special conditions, while examination of the evidence in the latter series of tests shows that the results are hardly so conclusive as claimed. Further, the theoretical arguments put forward to explain the superior corrosion resistance of the lead-tin alloys are not in accord with modern views. It is suggested that considerable further evidence is needed before any marked superiority for tinlead alloys can be accepted.
The general conclusion from the results of experimental work and from experience is that success in combating corrosion is most likely to be achieved by developing suitable waterproofing coatings which can be applied over the sheath. If moisture and air can be kept away from the sheath, corrosion cannot take place. At the present time, bituminous compounds are widely used for this purpose, reinforced often with bituminised paper, cotton or hessian tapes, or impregnated jute. Methods of treating the sheath chemically to produce an inert film on the surface, and of rolling small particles of another metal into the surface to afford protection, have been suggested from time to time (26, 44, 45 , 48) , but none seem to have been sufficiently successful to receive practical recognition . The problem of producing a really waterproof coating which can be relied upon to maintain a continuous protection, appears to have been most nearly solved by the use of bituminised paper, but its introduction is relatively recent and further experience is needed for its value to be fully established, especially in connection with steel armoured cables.
Preparation of Sheath Samples for Present Investigation
The present investigation has been carried out principally on samples of empty cable sheath., 1 inch in outside diameter and having a wall thickness of Ys inch, extruded at 20-40 ft./min. from a vertical press fitted with a split die block. At least one full charge was extruded from the press before the samples were taken , and normal extrusion practice was followed, the sheath being passed through a water trough to prevent adjacent turns from flattening and sticking when reeled on the drum, which had a diameter of 4 feet. In a few cases, additional lengths of sheath were reeled directly on a drum and allowed to
www.americanradiohistory.com

E L E C T R I C A L C O M M U N I C A T I O N 39
TABLE II MATERIALS USED FOR SHEATH SAMPLES
Per Cent Composition
Sheath Material by Analysis
Sb Sn Cd Cu -- -- --
Unalloyed Lead* . . . . . . . . . - - - -
0.66% Antimony-Lead . . . . 0 . 66 - - -
0.8% Antimony-Lead . . . . . 0 . 80 - - -
1.0% Antimony-Lead . . . . . 0 . 98 - - 0 . 06
Ternary Alloy No. 1 . . . . . . 0 . 48 - 0 . 24 -'
Ternary Alloy No. 3 . . . . . . - 0 . 41 0 . 14 -
* High grade refined lead was used for these samples.
cool freely in air. The unalloyed lead samples were extruded in lengths of 10 feet and supported in wooden troughs to prevent flattening. Table I I gives the composition of the materials extruded.
An addition of 0.06% of copper was made to the 1 .0% antimony alloys since it has been found that this helps to prevent any blisters from appearing on the surface of the sheath at high speeds of extrusion. Traces of copper in excess of about 0.02% increase the solid solubility of antimony in lead (30, 34) and thus are believed to reduce 0the risk of small patches of undissolved eutectic from segregating in the charge. The copper was introduced in the form of a copperantimony alloy. 1
In this connection, it may be pointed out that experience has shown that 1 % of antimony is about the most that can be present for the alloy to be extruded at normal operating rates even when copper is present. The addition of more copper does not increase the solubility of antimony, and although alloys containing antimony up to about 1 .75% have been suggested for special purposes, their production would need to be carried out at low temperatures and speeds, and possibly with the accompaniment of special precautions.
After extrusion, the sheaths were carefully unrolled, cut into lengths of 3 feet, and stored in wooden trays.
Age Hardening
Reference has been made above to the property
i British Patent No. 307543.
possessed by many of the sheathing alloys of age hardening after quenching in water from a temperature of about 250°C. In the manufacture of cable sheath, the material leaves the die block at about this temperature. Since the alloy is poured molten into the press container, allowed to become just solid , and then subjected to extraordinarily severe plastic deformation, it is to be expected that solution of the alloying elements in the lead is very nearly complete at the instant after extrusion. The first problem therefore was to determine whether the rates of cooling encountered in practice are sufficiently rapid to cause extruded cable sheath made from the various alloys to age harden, and what variations in the rate and degree of age hardening are t� be expected in routine working.
As the effect of variations in cooling rate has received practically no attention in the past, experiments on this point were carried out on samples of extruded material of each of the alloys. These were heated to 250°C for 30 minutes and cooled at three different rates as follows :
A-Quenched rapidly in water. B-Allowed to hang in still air and cool freely. C-Cooled slowly in an oven at an initial rate of about
1°C per minute.
The samples were then stored at room temperature and the hardness changes followed by periodic tests with a Vickers diamond indenter, using a load of 10 kg. applied for 30 seconds. The results for the antimony-lead alloys and for the ternary alloy No. 1 are shown in Figs. 1 to 4 inclusive. Ternary alloy No. 3 and unalloyed lead did not age harden under any of these treatments. The hardness of ternary alloy No. 3 remained between 5 . 1 and 5 . 7, and unalloyed lead at about 4.5.
A study of the curves shows that age hardening occurs in all the other alloys both when they are cooled freely in air and quenched suddenly in water, and that even after very slow cooling at the rate of about 1°C per minute some tendency to age harden persists. It will be noticed, however, that the ternary alloy No. 1 appears to be far more susceptible to variations of cooling rate than any of the antimony alloys. There is a very great difference between the hardening behaviour of the water quenched and air cooled specimens of ternary alloy, but in the antimony alloys
www.americanradiohistory.com

40 E L E C T R I C A L C O M M U N I C A T I O N
-and especially those with lower antimony percentages-the difference is far less marked.
The practical conclusion to be drawn from these results is that the hardening of extruded lead-antimony sheath is likely to be affected very little by extrusion conditions. The ternary alloy, on the other hand, would be expected to be more dependent on cooling rates.
The age hardening of the alloy sheaths extruded as described above has been followed over periods up to 500 days, and it will be seen that the results are very much what would be expected. The normal treatment of passing the sheath through a water bath is less drastic than the sudden quenching given to the small test samples, as a period of 1 5-30 seconds passes between leaving the die block and entering the water. As a result, the behaviour of the sheath falls midway between that of water-quenched and air-cooled samples.
In testing the hardness of the extruded sheath, specimens were prepared by cutting out with a hacksaw small sections about 1 inch long and Y2 inch wide. Each side was carefully ground flat by rubbing lightly on a file, and finally polished
0 oz ' ' • O w
I � < :t: 10 _ ,
o z
. . . . " • . , �� 6
• f.oet:ruded Sheath fbssed Through \Voter Bath A Samples Quenched 1n Water" From ZSO" C 0 Somples Cooled '.o Air From �°C � .. Samples Cooled 1n Oven from 250°C
� � �--"""-�21�-........ 4'----'--'---'---'--�-.1..----'--'---'---'--'
I I N 0 A Y 5
Figure 1-Age Hardening of 0.66% A ntimony-Lead Alloy.
0 .. z . O w > . � � 10 Q z
. . . . " w w z ' 0 U " G - < > J
• f.,._t,..r.ided Shea.th Possed Th...ough Woter Bat:h. A S.;imples Queonched 1n 'W<:;>t<=r From 250" C. 0 Samples Cooled In Air fr"Qm Zs:J°C . .::21. Samples Cooled in Oven From 250"'C
A G E IN D A Y S
Figure 2-Age Hardening of 0.8% Antimony-Lead Alloy.
. . d � 8 " z < o
• Extruded Sheath Po:ssed Through \\o6ter Both .6. Somplss Quenched 1n Water From �50"C. 0 Somp!eS Cooled on Air frorn 250"C 6 So.,.,ples Cooled ,., Oven From zsogc
� : b �A"---A&--A._-
> :t �
0
50 zoo A G E l N O A Y S
Figure 3-Age Hardening of 1.0% Antimony - 0.06% Copper-Lead Alloy.
• f..;truded Sheath Pas..=d Throvgh \l/otef"' &d:h .& S<lmples Ouendied '" \\Gt-er from 250° C. O Sumples Cooled 1n Air from z�o"C 4 Sample.<> Cooled •n Oven from Z50"C
z 11 rz 0 " ' "
D A Y S
Figure 4-Age Hardening of Ternary No. 1 Alloy.
on emery paper. For measuring hardness of these specimens, it was found that the Vickers diamond indenter showed a distinct improvement over a standard Brinell ball . The impressions given by a ball were rarely symmetrical, and it was very difficult to arrive at satisfactory figures for the mean diameter .
A certain amount of "scatter" is to be observed in the hardness tests on extruded sheath. This is attributed to the effects of another variable which may affect the hardness of sheath-namely, the amount of deformation undergone after extrusion. Experiments have shown that the effects of deforming the sheath can be very complex, depending on the extent of the deformation and the amount of age hardening which has taken place previously. The immediate effect is generally to increase the hardness, but subsequent changes may be very irregular and the hardness often drops considerably. The results show, however, that the deformation caused by rolling and unrolling an empty sheath on a cable drum has no very considerable effect on the progress of age
www.americanradiohistory.com

E L E C T R I C A L C O M M U N I C A T I O N 41
hardening. The effects probably are still less when the sheath is supported by the cable core.
Measurements of hardness were made also on samples of sheath reeled directly on the drum and so cooled slowly in air. The average age hardening was slightly different from the age hardening af the water cooled sheath, but the results showed much more scatter. In preparing these samples, however, it was impossible to avoid considerable "necking-down" of the sheath, as greater tension was required to prevent it from dipping in the water on the way to the drum and it remained hot under tension for a longer period. This effect, of course, would not be experienced in practice when the sheath is supported by the core.
Fatigue Strength
The first question which required attention regarding fatigue strength was how far it was safe to apply the results of fatigue tests on machined specimens to the case of extruded sheath. A considerable measure of agreement existed between the published results for the fatigue strength of unalloyed lead specimens of this type determined on various types of testing machine, and it was therefore decided as a first step to endeavour to carry out similar tests on actual lengths of extruded cable sheath.
For this purpose, a rotating-beam type of machine using two-point loading was developed. This is illustrated in Fig. 5, and is a modified form of one described by Shelton (36) of the United States Bureau of Standards, for testing wires. The essential feature is the use of a specimen so long that its own weight adds stresses at the centre (over and above those of the uniform bending moment produced by the applied load) , greater than the local clamping stresses at each end. In this way, it is possible to ensure that fracture will occur at the centre, without the need for using machined test pieces having the usual reduced section. It then follows from the beam formula that the maximum fibre stress at the centre of the specimen,
s W1 aW2 - + -8 2
'lt D4 - d4
32 D
Where W1 = weight of specimen between the chuck faces.
W2 = total of the applied weights.
a =distance from the line of action of the applied weights to the axis of support.
D and d =external and internal diameters of the specimen, respectively.
With the machine illustrated, it has been found that, by using specimens 28 inches long, mounted to have 22 inches between the faces of the chucks, fracture occurs in the centre portion of the sheath samples in the great majority of tests.
Few constructional details call for special attention. One difference between the behaviour of the sheath specimens and the long wire specimens used by Shelton should perhaps be emphasised, as this has enabled the design to be somewhat simplified. The wire specimens showed considerable deflection under load, whereas no deflection of the sheath specimens is apparent to the eye, at least under applied stresses sufficient to cause fracture within about 400,000 reversals. It has, therefore, been found unnecessary to use a quadrant support for the weights to keep the applied bending moment constant. Further, by allowing a small amount of play between the bearings and the tapered pivot supports, slight transverse movements of the ends of the specimen can occur freely, and the specimen can be regarded as a simply supported beam.
For all tests, a speed of 600 r.p.m. has been used. At higher speeds, it was found that "whirling" effects were likely to appear. No success was obtained in attempts to conduct the tests beyond the lower critical speeds.
In order to secure straight specimens for test, lengths of sheathing were closed at each end by steel mandrels hung from supports by means of cable stocking grips, and the smallest weights possible attached by the same means to the lower ends until a perfectly straight specimen was produced. Very little deformation of the material resulted from this operation, and in no case was any difference in hardness observed before and after straightening. The specimen was cut to length from the straightened sheathing, and hardness test specimens also prepared. In order to avoid bending a specimen while it was being mounted in the machine, it was first fixed into the back chuck and then this chuck was raised completely off the bed of the machine by means
www.americanradiohistory.com

42 E L E C T R I C A L C O M M U N I C A T I O N
Figure 5-Fatigue Testing Machine for Sheath Samples.
of a cord passing over a pulley above the chuck and attached to a counterweight. It was then possible to fix the other end of the specimen into the driving chuck without putting any serious bending strains on the specimen.
A typical fracture obtained during test is illustrated in Fig. 6. It is interesting to note that if, after test, the separated parts of the specimen were bent, cracks opened up along the whole length of the sheath. These cracks invariably appeared to commence from the outside of the sheath, and in this respect resembled all the examples which have been examined by the author of fatigue failure in service. The author's experience differs here from that of Beckinsale and Waterhouse (4) , who found fatigue cracking always commenced from within the sheath. The only instances observed by the author of cracks commencing from the inside of the sheath occurred on samples which had been split and opened out so as to stretch the inside skin.
The results of the tests on unalloyed lead sheaths are plotted in Fig. 7, which also shows the
results of other investigators. The close agreement between all these results is very striking, especially when the great diversity in testing equipment and in shape and surface condition of specimens is taken into account. The conclusion thus seems well established that in pure lead such factors as surface conditions and method of preparation have no very great influence on fatigue strength, and that the results of tests on solid machined test pieces can be applied with safety to the case of extruded cable sheath.
The question of the effect of surface condition is particularly interesting, since it has previously been pointed out that in soft metals such as lead, surface discontinuities would not be likely to be nearly so serious a source of stress concentration as in hard metals such as steel . A further test was therefore devised to obtain direct evidence on this point.
A specimen was scratched all over with coarse emery cloth (Wellington No. 2) before testing under a reversed stress of 475 lbs. per square inch. The fracture is illustrated in Fig. 8, and a
www.americanradiohistory.com
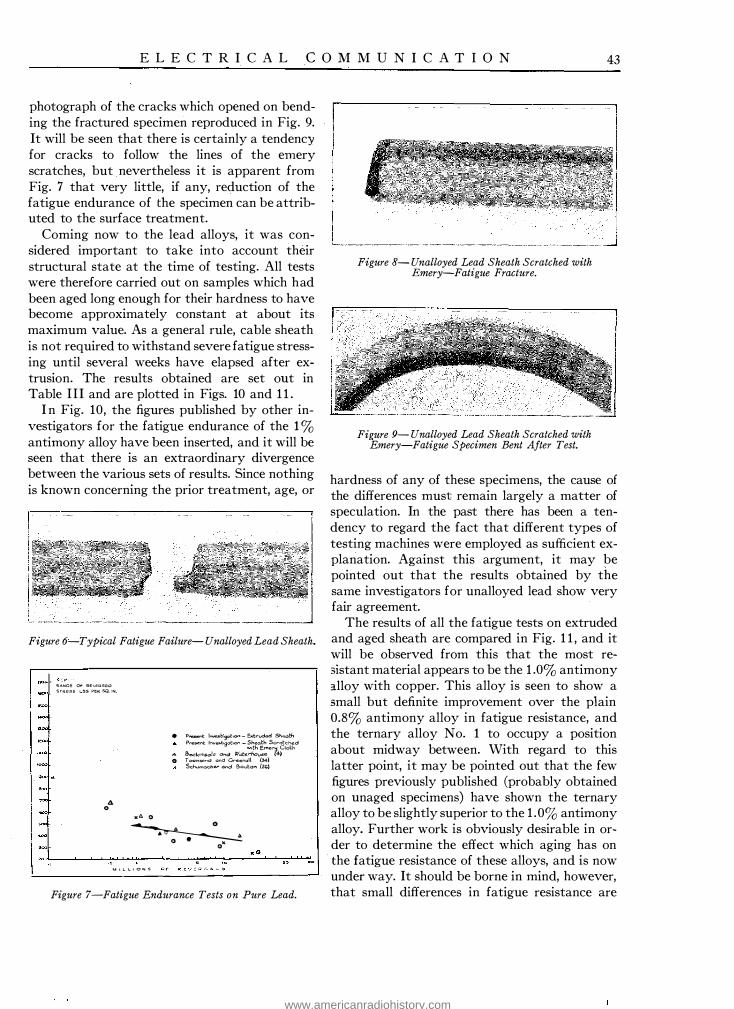
E L E C T R I C A L C O M M U N I C A T I O N 43
photograph of the cracks which opened on bending the fractured specimen reproduced in Fig. 9. It will be seen that there is certainly a tendency for cracks to follow the lines of the emery scratches, but nevertheless it is apparent from Fig. 7 that very little, if any, reduction of the fatigue endurance of the specimen can be attributed to the surface treatment.
Coming now to the lead alloys, it was considered important to take into account their structural state at the time of testing. All tests were therefore carried out on samples which had been aged long enough for their hardness to have become approximately constant at about its maximum value. As a general rule, cable sheath is not required to withstand severe fatigue stressing until several weeks have elapsed after extrusion. The results obtained are set out in Table I I I and are plotted in Figs. 10 and 1 1 .
I n Fig. 10, the figures published by other investigators for the fatigue endurance of the 1 % antimony alloy have been inserted, and it will be seen that there is an extraordinary divergence between the various sets of results. Since nothing is known concerning the prior treatment, age, or
Figure 6-Typical Fatigue Failure- Unalloyed Lead Sheath.
!:I.ANGE OF' i:ievE'RSEO sroiESS 1..e.s PER SQ. IN
A " •" 0
• p,..,.,_,.t 1 .. vesbsat'°'"' - e ... t.-vd� sr-,"°tn Present lnvest.9ot1on - Sheath Si::rotched
A &eckrmso!C' and Wate;�!;e.-(4-}Cloth
G Towns end and Greeno II (34) Schvmoch¢r" <!Ind Bouton (Zb)
� .. ..
" . 0 • "
' M l I.. 1.. < O N S
Figure 7-Fatigue Endurance Tests on Pure Lead.
Figure 8- Unalloyed Lead Sheath Scratched with Emery-Fatigue Fracture.
Figure 9- Unalloyed Lead Sheath Scratched with Emery-Fatigue Specimen Bent After Test.
hardness of any of these specimens, the cause of the differences must remain largely a matter of speculation. In the past there has been a tendency to regard the fact that different types of testing machines were employed as sufficient explanation. Against this argument, it may be pointed out that the results obtained by the same investigators for unalloyed lead show very fair agreement.
The results of all the fatigue tests on extruded and aged sheath are compared in Fig. 1 1 , and it will be observed from this that the most re-3istant material appears to be the 1 .0% antimony alloy with copper. This alloy is seen to show a small but definite improvement over the plain 0.8% antimony alloy in fatigue resistance, and the ternary alloy No. 1 to occupy a position about midway between. With regard to this latter point, it may be pointed out that the few figures previously published (probably obtained on unaged specimens) have shown the ternary alloy to be slightly superior to the 1 .0% antimony alloy. Further work is obviously desirable in order to determine the effect which aging has on the fatigue resistance of these alloys, and is now under way. It should be borne in mind, however, that small differences in fatigue resistance are
www.americanradiohistory.com
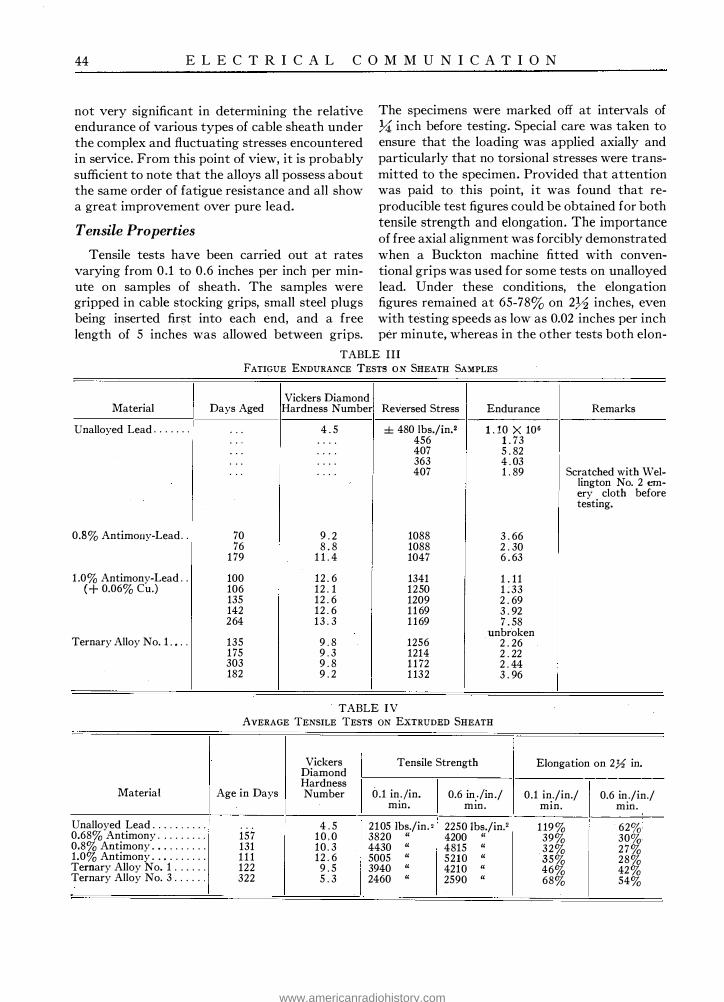
44 E L E C T R I C A L C O M M U N I C A T I O N
not very significant in determining the relative endurance of various types of cable sheath under the complex and fluctuating stresses encountered in service. From this point of view, it is probably sufficient to note that the alloys all possess about the same order of fatigue resistance and all show a great improvement over pure lead.
Tensile Properties
The specimens were marked off at intervals of U inch before testing. Special care was taken to ensure that the loading was applied axially and particularly that no torsional stresses were transmitted to the specimen. Provided that attention was paid to this point, it was found that reproducible test figures could be obtained for both tensile strength and elongation . The importance of free axial alignment was forcibly demonstrated
Tensile tests have been carried out at rates when a Buckton machine fitted with convenvarying from 0.1 to 0.6 inches per inch per min- tional grips was used for some tests on unalloyed ute on samples of sheath. The samples were lead. Under these conditions, the elongation gripped in cable stocking grips, small steel plugs figures remained at 65-78% on 2Yz inches, even being inserted first into each end, and a free with testing speeds as low as 0.02 inches per inch length of 5 inches was allowed between grips. per minute, whereas in the other tests both elon-
Material
Unalloyed Lead . . . . . . .
0.83 Antimony-Lead . .
1 .03 Antimony-Lead . . ( + 0.063 Cu.)
Ternary Alloy No. 1 . • . .
Material
Unalloyed Lead . . . . . . . . . . 0.683 Antimony . . . . . . . . . 0.83 Antimony . . . . . . . . . . 1.0% Antimony . . . . . . . . . . Ternary Alloy No. 1 . . . . . . Ternary Alloy No. 3 . . . . . .
TABLE III FATIGUE ENDURANCE TESTS ON SHEATH SAMPLES
Days Aged
. . .
. . .
. . .
. . .
. . .
70 76
1 79
100 106 135 142 264
135 175 303 182
Vickers Diamond Hardness Number
4 . 5 . . . . . . . . . . . . . . . .
9 . 2 8 . 8
1 1 . 4
12 . 6 12 . 1 12 . 6 12 . 6 1 3 . 3
9 . 8 9 . 3 9 . 8 9 . 2
Reversed Stress
± 480 lbs./in.2 456 407 363 407
1088 1088 1047
1341 1250 1209 1 1 69 1 169
1256 1214 1 1 72 1 132
TABLE IV
Endurance Remarks
1 . 10 x 106 1 . 73 5 . 82 4 . 03 1 . 89 Scratched with Wei-
lington No. 2 em-ery cloth before testing.
3 . 66 2 . 30 6 . 63
1 . 1 1 1 ; 33 2 . 69 3 . 92 7 . 58
unbroken 2 . 26 2 . 22 2 . 44 3 . 96
AVERAGE TENSILE TESTS ON EXTRUDED SHEATH
Vickers Tensile Strength Elongation on 2Y, in. Diamond Hardness
Age in Days Number 0.1 in)in. 0.6 in)in./ 0.1 in./in./ 0.6 in_./in./
mm. mm. min. mm.
. . . 4 . 5 2105 lbs./in. 2 2250 Jbs./in.2 1 19 3 62% 157 1 0 . 0 3820 " 4200 " 393 30% 131 10 . 3 4430 " 4815 " 323 273 1 1 1 12 . 6 5005 " 5210 " 353 283 122 9 . 5 3940 " 4210 " 463 42 3 322 5 . 3 2460 " 2590 " 683 543
www.americanradiohistory.com
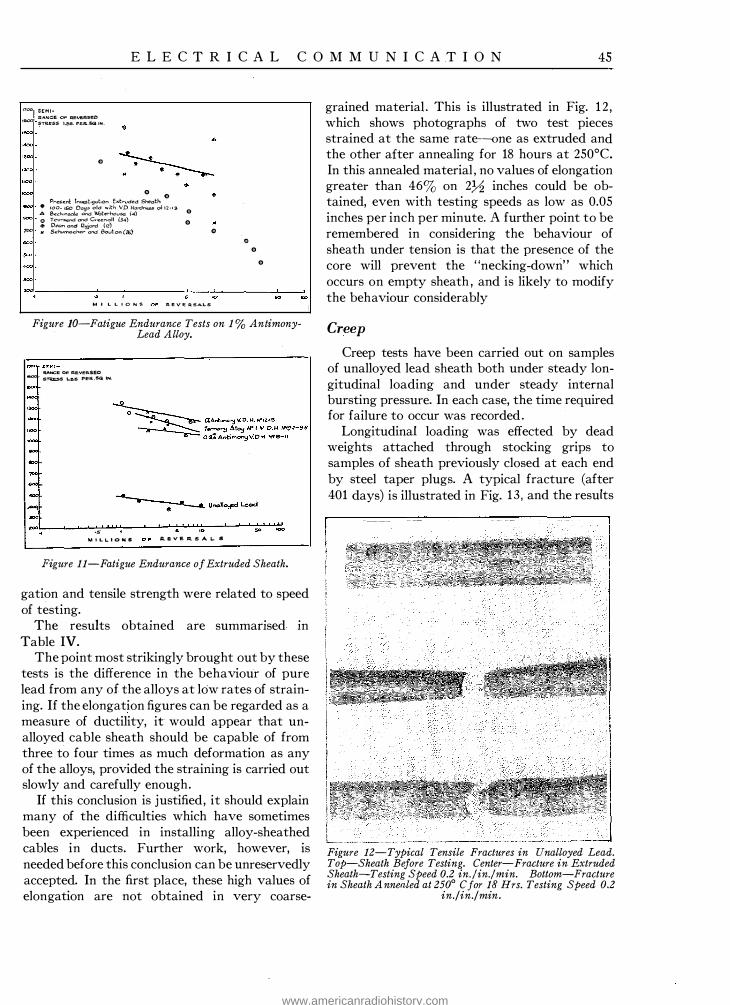
E L E C T R I C A L C O M M U N I C A T I O N 45
i7oo SEMl-.RANOE OF .QE\l!:ASeO
'"'°° ST.QeSS J...e.s. PEA..SQ IN.
.,
.. Present 1nvesbgot1on Exb·uded Sheath E> • 100- 1so Do!;!" old w.th VD Hordne.s.s o+. 12-13
A Beck•n'50le and \l.bl:er-h<:iuse {4) 0 e TCW'1i;e"d and Greenoll (.34) • Deon and 12�ord (12)
7PD x S.:hvmocher and Bouton (a;}
M I L L I O N S
..
R. E V E i:t S A L S
., ..
.. ..
Figure JO-Fatigue Endurance Tests on 1 % AntimonyLead Alloy.
RANGE ()F AEVERSED l50CI S"TReSS L&S PER..SQ IN.
--
""' --
.•. M I L L I O N S
. R. E. V E R. S A L.. S
Figure 11-Fatigue Endurance of Extruded Sheath.
gation and tensile strength were related to speed of testing.
The results obtained are summarised in Table IV.
The point most strikingly brought out by these tests is the difference in the behaviour of pure lead from any of the alloys at low rates of straining. If the elongation figures can be regarded as a measure of ductility, it would appear that unalloyed cable sheath should be capable of from three to four times as much deformation as any of the alloys, provided the straining is carried out slowly and carefully enough.
If this conclusion is justified, it should explain many of the difficulties which have sometimes been experienced in installing alloy-sheathed cables in ducts. Further work, however, is needed before this conclusion can be unreservedly accepted. In the first place, these high values of elongation are not obtained in very coarse-
grained material . This is illustrated in Fig. 12 , which shows photographs of two test pieces strained at the same rate-one as extruded and the other after annealing for 18 hours at 250°C . In this annealed material , no values of elongation greater than 463 on 2_72 inches could be obtained, even with testing speeds as low as 0.05 inches per inch per minute. A further point to be remembered in considering the behaviour of sheath under tension is that the presence of the core will prevent the "necking-down" which occurs on empty sheath , and is likely to modify the behaviour considerably
Cl'eep
Creep tests have been carried out on samples of unalloyed lead sheath both under steady longitudinal loading and under steady internal bursting pressure. In each case, the time required for failure to occur was recorded.
Longitudinal loading was effected by dead weights attached through stocking grips to samples of sheath previously closed at each end by steel taper plugs. A typical fracture (after 401 days) is illustrated in Fig. 13 , and the results
Figure 12-Typical Tensile Fractures in Unalloyed Lead. Top-Sheath Before Testing. Center-Fracture in Extruded Sheath-Testing Speed 0.2 in./in./min. Bottom-Fracture in Sheath A nnealed at 250° C for 18 Hrs. Testing Speed 0.2
in./ in./ min.
www.americanradiohistory.com

46 E L E C T R I C A L C O M M U N I C A T I O N
are plotted in Fig. 14. A few tests have also been carried out on samples of 0 .66% antimony sheath, and in Fig. 15 a fracture which occurred after 10.Yz days is shown. This photograph illustrates the inter-crystalline cracking which is often noticed in connection with these creep failures. In some respects they are reminiscent of fatigue cracks, but they are to be distinguished by the general surface flow which is always apparent after creep. Fatigue cracks are found in material which to the eye shows no signs whatever of working.
Bursting tests were carried out by maintaining a pressure of oxygen or nitrogen inside lengths of sheath until failure occurred. The fibre stresses in the sheath were calculated, and the results are compared with those for longitudinal creep in Fig. 14. A typical burst is shown in Fig. 16 . The bursts usually occurred along the line of the "weld" which is present at the bottom of sheath extruded from the usual type of cable press. It is along this line that dirt or oxide inclusions make their appearance (15) . If present in large amounts these may be a source of weakness. However, the results shown in Fig. 14 indicate that with carefully made sheath the reduction in strength is not very significant, in no case exceeding 30%.
Some bursting tests were also carried out at 1 10° C with the results given in Table V. In none of these tests did failure occur along the line of "weld," a typical failure being illustrated in
Figure 13-Typical Creep Failure of Unalloyed Lead Sheath.
LSS/c' 6 Endu.-ance Under Long1tu.:::i1nal Loadmg Endurance Under Inter-no! Bur""Sbn9 p,.......,sur-e
Figure 14--Creep and Bursting Tests-Pure Lead Sheath.
Fig. 1 7 . No explanation of the difference in character of failures at 1 10° C and room temperature can be offered.
TABLE V
BURSTING TESTS ON UNALLOYED LEAD AT 1 10° C
Fibre Stress
200 lbs. per in. 2 2 70 lbs. per in. 2 300 lbs. per in. 2 490 lbs. per in. 2
Corrosion
Time to Failure
1036 hours 68 hours 43 hours .9 hours
In order to attempt a comparison between the corrosion resistance of the various alloys under conditions likely to be met with in service, the apparatus shown in Fig. 18 has been used. The aim has been to control all the essential factors likely to affect the rate of corrosion, and to obtain reproducible results. The specimen of cable sheath, 5� inches long, is supported 6 mm. below the surface of the corroding liquid in a vessel immersed in a thermostat which has been maintained at 32° C in all experiments. After the apparatus is set up, the air is exhausted from the vessel-a vacuum desiccator-and pure oxygen then admitted from an aspirator. The pressure is finally adjusted to atmospheric. Attempts to measure the degree of corrosion by tensile tests of the corroded specimens were not successful. It was found, however, that reliable loss-of-weight measurements could be made by using a 40% solution of acetic acid to remove the corrosion products at the end of the experiment. No attack on the uncorroded lead was observed by this reagent when the cleaned specimens were immersed again for periods of up to 15 minutes. In carrying out an experiment, the specimen wa:s cleaned before and after the experiment by immersing for about 3 minutes in acetic acid in the manner recommended by the committee of the A.S.T.M. on the corrosion of non-ferrous metals and alloys (18) . Up to the present, preliminary tests only have been carried out, using a 2% solution of ammonium nitrate in the corrosion vessels and immersing the specimens for one week. The degree to which results can be reproduced is shown in Table VI, which sets out the
www.americanradiohistory.com

E L E C T R I C A L C O M M U N I C A T I O N 47
Figure JS-Typical Creep Failure-0.66% AntimonyLead Alloy.
Figure 16- Unalloyed Lead Sheath. Typical Failure Under Prolonged Internal Pressure at Room Temperature.
I I I L�-��--"'-"'-���---,�--
Figure 17- Unalloyed Lead Sheath. Typical Failure Under Prolonged Internal Pressure at 110° C.
measurements which have so far been made. It should be emphasised that these figures are quoted solely to show the close agreement obtained on repeated tests in the apparatus. They show only the degree of corrosion under one special set of conditions, and should not be used to draw general conclusions concerning the relative corrosion resistance of the various alloys. It is hoped to extend these experiments and obtain time-corrosion curves under varying conditions, and also to measure the corrosion in soil waters obtained in the field.
Conclusion
The experimental work which has been described demonstrates that considerable agehardening effects occur in cable sheaths extruded from antimony-lead and antimony-cadmiumlead alloys. The antimony-lead alloys age-harden nearly as rapidly when cooled slowly in air as
when quenched in water but the antimonycadmium-lead alloys are influenced to a greater extent by changes in the rate of cooling.
The fatigue endurance tests which have been carried out on unalloyed lead sheath show close agreement with earlier determinations on machined test pieces and indicate that the specialised operation of extrusion in a cable press has no appreciable influence on the fatigue resistance. The character of the surface-whether smooth or abraded-also appears to have little influence on the fatigue resistance of extruded lead sheath. Tests on alloy sheaths which have been allowed to age to about their maximum hardness have been carried out but it has been difficult to discuss the results in relation to those previously recorded, since age-hardening effects have never previously been taken into consideration. Further work appears needed in this connection ; and it is suggested that, at the present time, the conclusion to be drawn is that all the alloys studied have about the same order of fatigue resistance and all show a great improvement over pure lead.
In the earlier part of the paper, the requirements for the sheaths of various classes of cable were considered and attention was drawn to the value of a high degree of ductility for such applications as the sheaths of duct cables. The experimental work has shown that, in this respect, lead may be very greatly superior to any of the alloys, particularly at low rates of straining.
With regard to corrosion resistance, it is be-
Figure 18-Corrosion Test Apparatus.
www.americanradiohistory.com

48 E L E C T R I C A L C O M M U N I C A T I O N
lieved important to emphasise that there is very little real difference between lead and the lead sheathing alloys and that where additional corrosion resistance is required, attention should be given to the possibility of applying a bituminous or similar waterproofing coating over the sheath. In experiments in which the corrosion resistance of these materials is compared, slight variations in the conditions may easily give rise to misleading conclusions. Details are given of a method which has, therefore, been designed for carrying out immersion tests on short lengths of extruded cable sheath.
Summing up the conclusions of the paper as far as they can be applied to the practical problem
of the choice of a cable sheathing material , Table VII compares the most important characteristics of sheaths extruded from the various materials examined, and gives the principal applications for which each is considered most suitable.
While to a certain extent preliminary in character, it is hoped that the work which has been described will assist in bridging the gap between the results of laboratory experiments previously recorded on conventional test pieces and the use of the latter in predicting the comparative behaviour of cable sheaths extruding from various alloys. The present paper will have served its purpose if only it makes clearer the nature of the
TABLE VI CORROSION OF SHEATH SAMPLES IN 2 % AMMONIUM NITRATE SOLUTION AT 32° C
Material
Unalloyed Lead . . . . . . . . . . . . .
0.8% Antimony-Lead . . . . . . . .
1.0% Antimony-Lead with 0.06% Copper . . . . . . . . . . . . .
Ternary Alloy No. 1 . . . . . . . . . .
Age Days
. . .
. . .
. . . 410 420
450
280 312
Vickers Diamond Hardness No.
. . . .
. . . .
. . . . 10 . 2 10 . 2
1 2 . 4
9 . 5 9 . 5
Weight Before Tests
361 . 00 gms. 357 . 09 " 369 . 09 "
326. 90 " 319. 24 "
306 . 96 "
339 . 8 1 " 338 . 12 "
TABLE VII
Weight After One Week Loss of Weight
359 . 15 gms . 1 . 85 gms. 355 . 20 " 1 . 89 " 367 . 20 " 1 . 89 "
325 . 37 " 1 . 53 " 317_ 72 " 1 . 52 "
305 . 25 " 1 . 71 "
336 . 94 " 2 . 87 " 335 . 40 " 2 . 72 "
RESULTS OF TESTS ON THE PROPERTIES OF ·CABLE SHEATHS EXTRUDED FROM VARIOUS ALLOYS*
Vickers Diamond Fatigue Strength in Percent Elongation in
Aged Condition in Hardness No. After Days Aged Condition Tensile Tests
V.D. Safe Semi-range V.D. Straining Straining Applications for Which Hardness of Stress for Hardness at 0.1 at 0.6 the Material is Recom•
Sheath Material 0 50 100 200 400 No. 10X10• Cycles No. in./in./min. in./in./min. mended -- -- -- --Unalloyed Lead . . . . . . 4.5 4.5 4.5 4.5 4.5 4.5 375 lbs./sq. in. 4.5 119% 62% Armoured telephone and
power cable in the ground. Duct tele-phone cable.
0.66% Antimony-Lead 6.0 7.5 8.5 10.0 10.0 . . . . · · · · · · 10.0 39% 30% No special application.
0.8% Antimony-Lead. 6.5 8.5 10.0 11 .0 1 1.0 10.0 1030 lbs./sq. in. 10.3 32% 27% May be used in place of 1 % antimo ny-lead alloy.
1.03 Antimony-Lead (Copper Bearing) . . . 6.5 9.5 1 1.5 13.0 12.0 12.5 1165 lbs./sq. in. 12.6 35 % 28% Aerial telephone cable,
duct power cable, and rarely duct telephone cable.
Ternary Alloy No. 1 . . 7.5 10.0 10.0 9.5 9.0 9.5 1070 lbs./sq. in. 9.5 46% 42% May be used in place of 1 % antimony lead alloy.
Ternary Alloy No. 3 . . 5.3 5.3 5.3 5.3 53 . . . . · · · · · · 5.3 63% 54% Special Applications •
* Sheaths passed through water bath after leaving press.
www.americanradiohistory.com

E L E C T R I C A L C O M M U N I C A T I O N 49
problems involved, shows the factors which need thorough and careful investigation, and emphasises the need for caution in accepting the claims made for new cable sheathing material.
References
1 . Anderegg, F. 0. and Achatz, R. V. : "Self Corrosion in Lead Cable Sheath,'' Bulletin Eng. Expt. Station, Lafayette, Indiana, 1924, No. 18.
2 . Archbutt, L.: "Failure of the Lead Sheathing of Electric Cables," Trans. Faraday Soc. 1921, 17, 22-35.
3. Beaver, C. J . : "The Physical Behaviour of Lead Sheaths in Relation to Failures of High-Voltage Cables," Elect. Rev. 1929, 104, 96-98, 142-145, 187-188, 734-736.
4. Beckinsale, S. and Waterhouse, H . : "The Deterioration of Lead Cable Sheathing by Cracking and Its Prevention,' ' J. Inst. Metals, 1928, 39, 375-406.
5. Brady, F. L . : "The Corrosion of Lead in Buildings,' ' Building Research Tech. Paper, 1929, No. 8.
6. Brady, F. L . : "The Corrosion Resistance of the B .N .F. Ternary Alloys of Lead in Buildings," Metal Ind., 1932 ' 40, 297-298.
7. Burns, R. M. and Campbell, W. E. : "Electrical Resistance Method of Measuring Corrosion," Amer. Electrochemical Soc. (Advance Copy) 1929, May, 137-151.
8. Burns, R. M. and Freed, B. A. : "Corrosion of Cable Sheath in Creosoted Wood Conduit," J. Amer. Inst. Elect. Eng. 1928, 47, 576-579.
9. Burns, R. M. and Salley, D. J . : "Particle Size as a Factor in the Corrosion of Lead by Soils," Ind. and Eng. Chem. 1930, 22, 293-297.
10. Clark, C. L. and Upthegrove, C . : "Flow Characteristics of Some Lead Cable Sheath at Temperatures Above Atmospheric," Amer. Soc. Mech. Eng. Trans. 1930, 52, 1F.S.P. 249-254.
1 1 . Dean, R. S., Hudson, W. E. and Fogler, M. F . : "The System Lead-Antimony II ," J. Ind. Eng. Chem. 1925, 17, 1246-1247.
12. Dean, R. S. and Ryjord, J. E.: "Alloys for Cable Sheathing," Metals and Alloys, 1930, 1, 410-419.
13. Dean, R. S., Zickrick, Lyall and Nix, F. C . : "The Lead Antimony System and Hardening of Lead Alloys,'' Trans. Amer. Inst. Min. Met. Eng., 1926, Feb.
14. Dubose: "Tempering of Alloys of Lead and Antimony," Reunions des Membres Francais et
_Beiges,
Assoc. Internationale pour l 'essai des matenaux de construction, 1905, March 25.
15. Dunsheath, P. and Tunstall, H . A. : "The Physical Properties of Cable Sheaths," J. Inst. Elect. Eng. 1928, 66 280-289, 638-641.
16 . F;no, E. Da: "Chemical Corrosion of Lead in Presence of Phenol (1)," Giorn. Chim. Ind. Appl., 1932, 14, 18-2 1 .
17 . Fano, E. Da : "Catalytic Action of Phenols in the Corrosion of Lead-Covered Cables, " Telegr. U. Fernsprechtech. 1932, 21, 267-270.
18. Fuller, T. S . : " Report of Committee B3-Corrosion of Non-Ferrous l\!fetals and Alloys," Proc. Amer. Soc. Test Mat. 1932, 32 (I), 201-225.
19. Garre, G. : " Corrosion of Lead Cable,'' Electrotech. z., 1931, 52, 1418.
20. Haigh, Bernard P . . and Jones, Brinley : "Atmospheric Action in Relation to Fatigue,'' J. Inst. Metals, 1930, 43, 2 71-296.
2 1 . Haigh, Bernard P. and Jones, Brinlev : " Interpretation of the Tensile Test (with reference to Lead Alloys) ," J . Inst. Met., 1933, 51, 49-70.
22. Haehnel, Otto: "A New Kind of Lead Sheath Corrosion, ' ' Society of Metallurgists, 1923.
23. Haehnel, Otto: "Contribution to the Question of the Intercrystalline Brittleness in Telephone Cables, ' ' Elekt. Nachr. Tech. , 1926, 3, 229-235.
24. Haehnel, Otto: "Chemical Corrosion of Lead in the Ground," Elekt. Nachr. Tech., 1928, 5, 171-1 76.
25. Haehnel, Otto: "The Resistance of Various Metals to Corrosive Attack by the Vapours of Phenol and Creosol," Korrosion U. Metallschutz, 1932, 8, 260-263.
2 6. Laussaud, L. and Noirclerc, A. : "The Deterioration and Protection of the Lead Sheaths of Electric Cables," Rev. Gen. d'Elec., 1933, 34, 19-28.
2 7. Logan, K. H., Ewing, S. P. and Yeomans, C. D . : "Soil Corrosion Studies, Part I ," U. S. Bur. Stand. Tech. Paper, 1928, No. 368.
28. Logan, K. H. and Grodsky, V. A. : "Soil-Corrosion Studies, 1930. Rates of Corrosion and Pitting of Bare Ferrous Specimens," U. S. Bur. Stand. Journal of Research, July, 1931, RP. No. 329.
29. Moore, Herbert F. and Alleman, Norville J . : "The Creep of Lead and Lead Alloys used for Cable Sheathing," Bulletin Univ. IJlinois Eng. Experiment Station, 1932, No. 243.
30. Morgen, R. A., Swenson, L. G., Nix, F. C. and Roberts, E. H . : "Ternary Systems of Lead-Antimony and a Third Constituent," Proc. Inst. Met., Div. Amer. Inst. Min. and Met. Eng. 1928, 316-35 1.
31 . Norbury, A. L.: "The Hardness and Spontaneous Annealing of Lead," Trans. Faraday Soc., 1923, 19, 140-152.
32. Riley, T. N. and Scott, T. R.: Correspondence on paper by C. J. Beaver, Elect. Rev., 1929, 104, 310-311 , 900.
33. Schumacher, Earle E. and Bouton, G. M . : "Age Hardening Lead-Calcium Alloys," Metals and Alloys, 1930, 1, 405-409.
34. Schumacher, Earle E., Bouton, G. M. and Ferguson, Lawrence : "Effect of Small Quantities of Third Elements on Ageing of Lead-Antimony Alloys," Ind. and Eng. Chem. 1929, 21, 1042-1044.
35. Seljesater, K. S . : "Effect of Arsenic on Dispersion Hardenable Lead-Antimony Alloys," Trans. Amer. Inst. Min. Met. Eng. Inst. Met. Div. 1929, 573-580.
36. Shelton, S. M. : "Fatigue Testing of Wire," Amer. Soc. Test Mat., 1931, Preprint No. 40.
37. Sherman, Waldo L. : "The Production of Lead Encased Cable," Wire and Wire Products, 1932, 7, 1 79-182, 204-205.
www.americanradiohistory.com

50 E L E C T R I C A L C O M M U N I C A T I O N
38. Singleton, W. and Jones, Brinley : "Some Effects of the Addition of Tellurium to Lead," J. Inst. Met. , 1933 , 51, 7 1 -92 .
39. Street, Charles Frederick: "The Mechanical Working of Lead-Covered Underground Telephone Cables, " Proc. Inst. Civil Eng., 1917, 202, 412-420.
40. Thielers, Martin : " Investigation of the Mechanical Strength of Various Lead Sheaths, " Tech. Paper Roy. Swedish Telegraph Administration, 1925, No. 6.
41 . Townsend, John R. : "Fatigue Studies of Telephone Cable Sheath Alloys, " Proc. Amer. Soc. Test Mat. 1927' 27 (2) , 1 53-166.
42 . Townsend, ]. R. and Greenall, 0. H . : "Fatigue Studies of Telephone Cable Sheath Alloys, " Proc. Amer. Soc. Test. Mat. 1930, 30 (11 ) , 395-405.
43. \\Taterhouse, H. and Willows, R. : "The Effects of C0ld Rolling and of Heat Treatment on Some Lead Alloys," ]. Inst. Metals, 1931 , 46, 139-1 68 .
44. Werner, M . : "Grain Size and Corrosion, " Z. Metallkunde, 1930, 22, 342.
45. Werner, M. " (Lead) Grain Size, Eutectics, and Corrosion," Z. Metallkunde, 1932, 24, 85-87.
46. Wood, Gurney : "High-Pressure Cables, " Elect. Rev., 1929, 104, 3 70-371 , 900.
47. Anon. : "Fatigue Cracking of Lead Sheathed Cables, " Distribution of Electricity, 1931, 554-555.
48. "TreatinJ Metallic Surfaces to Produce a Modified Surface," B.P. 372936.
www.americanradiohistory.com
The Prediction of Probable Singing Points on Loaded Cable Circuits
By E. L. E. PAWLEY, M.Sc.
General
I N the design of long distance telephone transmission s:ste�s, the subj:ct of impedance regulanty 1s of great importance.
Irregular distr ibution of circuit constants along the length of a line gives rise to echo effects which directly affect intelligibility and, in the
case of circuits involving the use of two-wire repeaters or of two-wire extensions to repeatered four-wire circuits, it usually sets an upper. limit to the gain which is permissible for each repeater. Since the number of repeaters required for a circuit of given length and composition and for a given overall transmission equivalent depends on the gain which can be used at each repeater, the economic importance of impedance regularity is readily apparent.
It is well known that the amplification which can be obtained from any two-way repeater depends on the accuracy with which the impedance-frequency characteristic of the line on each side of it can be simulated by that of a balancing network or, in the case of a single element repeater, by that of the line on the other side. It has been shown by G. Crisson1 that this applies to any form of repeater which produces effective amplification of intelligible speech in both directions on a single channel of communication. If the gain of such repeater exceeds the limits fixed by the irregularity of line impedance then the repeater will fall into sustained oscillation, or singing, provided that the phase relations are suitable. The theory of the singing repeater has been discussed in a paper by L. T. Hinton, A. R. A. Rendall and C. S. White. 2
The manner in which the irregularities affect the permissible repeater gain is well known and will be recapitulated here.
'"The Limitation of the Gain of Two-Way Telephone Repeaters by Impedance I rregularities, " The Bell System Technical Journal, Vol. IV, January, 1925.
'"Phase Relations in Unbalanced Two-Way Te'.ephone Repeaters," Electrical Communication, July, 1929.
5 1
When an alternating e.m.f. i s applied to the sending end of a line, any irregularity in the circuit constants along the line will cause an apparent reflected current to flow back to the sending end. This reflected current will combine with the original current in such a way as to affect the impedance of the line as it would be measured from the sending end and to cause undulations to appear in the impedance-frequency characteristic. The magnitude and position of these undulations will depend on the magnitude and phase of the return current relative to that of the sending e.m.f. They will therefore depend on the nature and location of the irregularities and on the circuit constants of the line.
It can easily be shown that at any irregularity the ratio of the return current to the current which would exist at that point if the line were smooth is :
Z - Zo
Z + Zo
where Z is the actual vector impedance of the line at the irregularity and Z0 is the vector impedance which it would have if the irregularity were removed. When the influence of a number of irregularities is combined their total effect may be regarded as a return current at the sending end, the magnitude and phase depending on the actual impedance of the line and on the balancing network at any particular frequency :
ZL -ZN I = A a zL+zN
-
(where ZL and z;; are the vector impedances of the line and network, respectively) . The transmission loss corresponding to this return factor is equal to the real part of
zL+zN 20 log10 decibels.
ZL - ZN
This .transmission loss defines the singing point
www.americanradiohistory.com

52 E L E C T R I C A L C O M M U N I C A T I O N
between the line and network at the particular frequency. The corresponding phase angle is a.
The total transmission loss across the hybrid coil is equal to the singing point (as defined above) plus about 6.6 decibels to allow for the division of energy in the coil and the copper and iron losses in it. The total phase rotation across the hybrid coil is equal to a plus an additional angle due to the characteristics of the coil itself.
Further discussion and description of methods of measuring impedance unbalance are contained in an article on "The Measurement of Impedance Unbalance" which is a contribution to the proceedings of the C.C.I. by the International Standard Electric Corporation (Plenary Session, June, 1929, IV, Appendix I I , Green Book, p. 84) .
In general it is impracticable to design a network so as to simulate the undulations which occur in the impedance curve of a loaded circuit . The network is therefore designed to have an impedance characteristic as nearly as possible coincident with a smooth mean curve passing through the impedance-frequency characteristic of the line.
For singing to occur in a two-wire two-element repeater of the usual form, the total effective gain for the two directions of transmission must be at least equal to the sum of the singing points of the lines on the two sides of the repeater against their respective balancing networks, at the frequency at which singing occurs. In practice it is found that distortion occurs when a two-wire repeater operates at a gain near to the point at which sustained oscillations become possible, and a certain margin of stability must be provided.
For singing to occur it is also necessary that the total phase rotation around the singing path be 2n"K, where n is any integer. The total rotation consists of the phase rotation in the amplifying elements and their associated transformers and filters and also of rotation across the hybrid coil due partly to the characteristics of the coil itself and partly to the angle a in the expression for the return current given above.
If a two-wire repeater is applied to a line there will, in general, be several frequencies within the transmitted band at which phase relations will hold such that if the gain be gradually increased
until singing occurs, singing will commence at that one of these several frequencies at which the total singing point is a minimum and less than the total effective gain of the repeater.
Hence, in designing a repeatered two-wire cable it is necessary to design for a certain minimum value of singing point over the whole transmitted frequency range and to ensure, as far as practicable, that no circuit will have a minimum singing point lower than the prescribed value at any frequency in the range.
The impedance irregularities which may occur in a coil-loaded cable circuit may take the form of variations of capacity, inductance, resistance or leakance from one loading section to another. In practice, variations of resistance and leakance are unimportant and the inductance of the line conductors and the self-capacity of the loading coils may be neglected. It is necessary to consider only variations of line capacity and of coil inductance from one loading section to another ; variations of circuit constants within a loading section need not be taken into account.
Previous work on this subject has made it possible to calculate for any particular frequency the probable singing point at any point on a circuit due to a single impedance irregularity at any other point, and methods have been developed for calculating the probable effect of simple combinations of such single irregularities.
In practice, however, there are generally small variations of capacity and inductance from one loading section to another for each circuit along the whole length of a cable. It is generally possible to estimate approximately, from the results of factory tests, the average extent to which individual values of capacity and inductance will deviate from the mean values, and it is necessary to calculate from these data the minimum values of singing point which are likely to occur. Conversely, it may be necessary to compute limits for the cable and coil irregularities in order that given singing point guarantees probably will be met.
Papers by G. Crisson3 give in detail a method of predicting the probable fraction of a given group of circuits which will have the singing
3"1rregularities in Loaded Telephone Circuits," The Bell System Technical Journal, October, 1925 and Electrical Communication, October, 1925.
www.americanradiohistory.com

E L E C T R I C A L C 0 M M U N I CA T I 0 N 53
point below any given value at any prescribed "' frequency. The more practical problem, however, is to predict the probable minimum and average values, for all the circuits in a group, of the minimum singing point of each circuit over a prescribed frequency range. The present paper gives a solution to this latter problem based on theoretical considerations and involving certain empirical assumptions which have been justified by subsequent results.
It is proposed to explain the application of this solution to practical problems and to recapitulate sufficient information from the above-mentioned paper by G. Crisson (Electrical Communication, Vol . IV, p. 98) to enable anyone unacquainted therewith to apply this solution so as to predict approximately the probable minimum and average values of the minimum singing point over a prescribed frequency range for a group of circuits in all cases normally arising in practice. These quantities will be designated "minimum minimum singing point" and "average minimum singing point," respectively.
It will be recalled that, for any individual circuit, a current transmitted from one end will give rise to a reflection from each individual irregularity along the circuit. The magnitude of the total reflected current returned to the sending end at any particular frequency depends .on the magnitude and phase relation of each individual reflection. It would be mathematically possible to predict the exact value of singing point at any frequency for every circuit in a cable provided that the exact capacity and inductance in every loading section were known. But in practice this would involve exceedingly laborious calculations, and it is usually not possible to estimate accurately the capacity and inductance in each circuit in every loading section in the cable, but only to estimate average deviations from the mean value.
A group of circuits will therefore be considered as a whole and the theory of probabilities will be invoked in order to achieve the required results. In general there will be variations of mean capacity from one loading section to another and also variations between the capacities of individual circuits within each loading section. Similarly, there will be variations of mean inductance from
one loading point to another and also between the inductances of individual coils at each loading point. Circuits may be connected at random between one loading section and the next so that, for example, a circuit of high capacity in one loading section may be joined through to one of low capacity in the next. Variation of mean inductance from one loading point to another can generally be neglected in comparison with variations of inductance from coil to coil at the same loading point. If not, the effect can easily be allowed for in the calculations.
In the installation of toll cables, steps may be taken to reduce the capacity deviations in each loading section by cross-splicing the circuits according to the results of deviation tests and also to reduce variations of capacity along a circuit by matching circuits of high capacity in one section to circuits of high capacity in the next section . The method of calculation herein described is applicable to cases where such practices have been followed and also where no such precautions have been taken.
Data Requir·ed
Assuming that it is required to calculate the probable minimum minimum or average minimum singing points, or the fraction of circuits having minimum singing points less than a given value, for a group of similar normal circuits over a range of frequencies from a lower limit f' to an upper limit f, and for given line irregularities, the following data are required :
(a) The root mean square value of the fractional inductance deviation of individual loading coils from the average of all the coils, at the highest frequency, f, in the range considered. This quantity is denoted by HA.
(b) The root mean square value of the fractional deviation of the average capacity of all the circuits considered in each loading section from the average of the average capacities for all the loading sections. This quantity is denoted by HB·
(c) A quantity which will be denoted by He. If no capacity matching is used He will be the root mean square value of the fractional deviation of the capacity of each individual circuit in each loading section from the average capacity of all the circuits in the section.
www.americanradiohistory.com

-I '
54 E L E C T R I C A L C O M M U N I C A T I O N
If capacity matching is used, the effect of such matching is to reduce the change in capacity at each loading point for each circuit. The capacity changes which remain will be due partly to differences between the mean loading section capacities, which have already been included in HB, and partly to the impossibility of mat1hing all the deviations perfectly. Imperfect matching on any circuit leaves differences between the deviation of this circuit in any section, and its deviation in adjacent sections. The r.m.s. value of these deviation differences for all circuits and for all loading points can be calculated from field test sheets which show the capacity deviation of each circuit in each loading section from the mean capacity of that section and the way in which circuits are cross-connected at the loading points .
The r.m.s. circuit deviation, He, for each loading section, corresponding to the value of r.m.s. change in deviation, is obtained by divid
ing the r.m.s. change in deviation by v� The root mean square values of HA, HB,
and He may be assumed to be approximately �; times the average values.
(d) The number of circuits involved in the group considered, denoted by N.
(e) The length of the circuits considered, denoted by 1 .
(f) The transmission loss in decibels per loading section, denoted by L.
(g) The cut-off frequency of the circuits, (fc) .
Calculation of Representative Singing Point for a Particular Frequency
It is necessary to compute the following functions :
The total Representative Deviation,
The irregularity Function,
This is merely the loss in decibels correspond-
ing to H , regarded as a current ratio and may be obtained from current ratio tables.
The Frequency Function ,
Vl -W2 f Sw = 20 log10 , where W = -
f w c
The value of this expression may be taken from the curve in Fig. 1 .
The Attenuation Function ,
1 SA = 10 log10 1 -4L x o.1 1s1
-e
The values are given on Fig. 2 . The short line correction, for lines o f n loading
sections
1 -[ 1 antilog10
where T = nL. The values of ST are given on Fig. 3 (ST is denoted by SN - S in the article by Mr. Crisson above mentioned) .
Now, at the particular frequency f, the most probable value of singing point corresponding to the r.m.s. values of the rectangular components of the return currents due to the line irregularities is :
Sp = SH + Sw + ST - SA·
This quantity Sp will be called the representative singing point at the frequency f. It may be noted incidentally that this value of Sp is the probable singing point which will not be
exceeded on+of the total number of circuits
at the particular frequency f, e being the Napierian base. There will, therefore, be more circuits having probable singing points greater than Sp than less than Sp, and the mean value will be greater than Sp, although more circuits will probably have a singing point equal to Sp than to any other value.
Calculation of Probable Singing Points for Any Particular Frequency
If it is desired to find for the particular frequency f, the probable fraction of the total number of circuits which will have singing points
www.americanradiohistory.com

E L E C T R I C A L C O M M U N I C A T I O N 55
+26
+24
+22
\ �
+20
+ I B
+ 1 6
+ 14 + 12
+ 10 (/) + e _J w ID + G u w 0 + 4 I � If) + 2
0
- 2
- B
-10
FREQUENCY FUNCTION Sw = 20 Lo9 1/' �w2 w = j_ f c
\ \ \
\ \
I\ "
I\. '\ I\.
'\ "'
'\ '\
I\ \
\ \
vidual circuit at that frequency has a definite magnitude and phase angle, and that its rectangular components are each determined by a normal probability law. In that case the magnitude of the total return current (which alone determines the singing point, independently of the angle) follows a law which is not a normal probability law, but a law of vector distribution which is obtained by combining the probabilities for the two rectangular components and integrating from 0 to 2 7t to cover all possible phase angles.
When it is required to find the probable minimum singing point over a wide range of frequencies, however, one is not concerned with the probable value of the return current at any particular frequency (which is a vector quantity) but with its minimum value at all frequencies in the range irrespective of phase angle.
Since, over a wide frequency range, the phase angle of the return current at any frequency may be expected to cover all possible values from 0 to 27t, it appears reasonable to suppose that the distribution of minimum singing points for all circuits will follow a normal error law rather than a law of vector distribution.
An analysis of over 700 measured values of
24
I
0 O·l 0·2 0·3 0·4 O·S 0·6 0·7 O·S 0·9 I ·O 22 ATTENUATION FUNCTION SA : 10 Lo� IO
1 - e - 4 l., XQ•IJ51 � �
w Figure 1
less than any given magnitude, or the converse, this may be done by adding to Sp the distribution function, SF, the value of which is given on Fig. 4_and is as follows :
1 F
The method so far described is similar to that described by Mr. Crisson, and Figs. 1 to 4 inclusive are reproduced from the above mentioned paper.
Calculation of Minimum Singing Point Over a Range of Frequencies
The distribution function mentioned above is calculated for a single frequency on the assumption that the return current for any indi-
20
IS
16
� 14 w m
iii a 1.c !'2 .,,
10
8
6
4
2
\ '
\ \
\
0 O·I
NOTE:-
f\
SEE " IRREC.ULARITIES IN LOADED TELEPHONE � � CIRCUITS." C.EOR((E CRISSON, EL. COMM VOL.N p�9B L "' TRANSMISSION LOSS PER LOADIN� ,_ ,___
SECTION
� "
I"'-!'--.
--... r--. r-. ,...._
0-2 0·3 0·4 o,s 0·6 0·1 o·a o� L-DECIBEL.S.
Figure 2
www.americanradiohistory.com

56 E L E C T R I C A L C O M M U N I C A T I O N
I \ \ I
1 ·6 I\ \ '
c l ·O � "
8
O· 6
0·4
3
CORRECTION FOR SHORT LINES OF "n" SECTIONS I
ST = Sn-5 = 10 Lo5 10 1 - ---, -
T
NOTE:- t I r LoglO 2Q
\
SEE �1RREC.U1..ARITIES IN LOADED TELEPHONE CIRCUITS; GEORGE CRISSON , EL COMM. VOL rst p SB T .. TOTAL TRANSMISSION LOSS IN LINE: OF
\ I\ \
n" LOADIN" SECTIONS
\ '
I'\. '
..........
5 6 T-OECIBELS
Figure 3
� ..........
9
._____
..___ ._____ ._____
-IO
minimum singing point over the range 300-2200 p :s. shews that this hypothesis is correct to a very close degree of approximation ; and, for any normal gauge of medium-heavy loaded side or phantom circuits, the root mean square deviation of the individual minimum singing points from the mean minimum is about 1. 7 5 decibels.
If a value can be found for the probable mean of the minimum singing points over the frequency range, the probable minimum value can easily be found for any number of circuits from a normal error curve.
Now for any individual circuit the probable minimum singing point over a range of frequencies will clearly be less than the probable value at any given frequency within the range by an amount depending on the irregularities in the singing point-frequency curve. These irregularities are due to variations in the way in which the currents reflected from individual line irregularities are combined, since the phase angle per loading section varies with frequency.
It should be possible, therefore, to find an empirical figure for the average probable difference between the average minimum singing point and the probable value of Sp already
obtained for the highest frequency in the range considered.
A study of several cases for which the singing points have been both predicted and measured shews that for any normal gauge of mediumheavy loaded side or phantom circuits this difference is about 2 .5 decibels. Calling this quantity Sn, we have a value for the probable average minimum singing point for any number of circuits :
Now the fraction, say, of the total number of circuits having a probable minimum singing
a point differing from SM by an amount SQ± 2' where a i s small, i s given by a law of normal error of the form :
h e-h2s2
v 7r Q y
1 where h = _ /
V 2 X r.m.s. error.
The r.m.s. error has been determined empirically as 1 . 7 5 decibels, as given above, so that h = 0.404.
The graph of the error curve is given on Fig. 5 . h
The maximum height of the curve iV '1t = 0.228. This means that the probable percentage of circuits which will give a reading of minimum singing point equal to SM within ± ft db. is 22 .83.
The fraction, Q, of the total number of circuits which will give a probable reading of singing point less than any particular value is obtained by integrating the normal error curve from SQ = - oo up to the value of SQ for the highest value of singing point corresponding to the required reading . (This integration is performed by means of a convergent series, see "The Combination of Observations," Brunt p . 19.) For instance, i f readings are taken to the nearest decibel , the singing point corresponding to a reading of 30 db. is 30 ± ft db. , so that the total number of readings equal to or less than 30 db. will correspond to the total number of
www.americanradiohistory.com

E L E C T R I C A L C O M M U N I C A T I O N 57
true values of 30 + � db. or less. The corresponding value of SM + So is therefore 30k db.
Fig. 6 has been obtained by integrating the curve on Fig. 5 so as to give values of S0 for different fractions of the total number of circuits in the group considered.
We have now the value of probable minimum singing point over the frequency range for any given fraction of any group of circuits :
The probable average minimum singing point is then obtained by putting SQ = 0 and the probable minimum by using the value of Q representing one circuit. For example, the minimum singing point for a group of 40 circuits
1 is obtained by using Q = 4o = .025 on the
curve of Fig. 6. Then S o = -3.4 db. so that one circuit in the group will probably have a minimum singing point less than the probable average minimum by 3 .4 decibels or more.
To find what minimum singing point limit will probably not be met by any given percentage of the total circuits it is merely necessary to use the value of Q corresponding to this percentage ; e.g., for 25% circuits Q = 0.25 and So = 1 .2 db. so that 25% of circuits will probably have minimum singing points less than
the probable average minimum by 1 .2 decibels or more.
As explailled above, the actual readings which would probably be obtained would be lower than the calculated figures by an amount depending on the closeness to which the readings are taken. For example, if readings are taken to the nearest decibel the probable values would be k db. lower than those calculated. This does not apply to the mean reading which should be accurate.
Application of the Method
In employing this method of predicting singing points the following facts should be borne in mind :
(1 ) The method is based on normal probabilities so that it applies only to the normal case where the singing point is due to a larger number of small irregularities distributed at random. If, after the results of field tests are available, it is found that the distribution of the mean loading section capacities is far from a normal random distribution, then more accurate values of singing point can be obtained by calculating, for a number of frequencies, the actual return current from each individual loading section. This current must be multitiplied by e-2P where p is the propagation constant from the cable terminal to the loading
DISTRIBUTION FUNCTION S F" = - 10 Lo9,0 L09e.P
+ 22 + 20 + I S + 1 6 + 14
!I +J2 w + 10 ID + 8 i3 + 6
+ 4 + 2
w 0 I
IL Ill 0 ·<)OJ - z -4 - 6 - a ..: 10
FOR SIN(41NG POINTS AT ONE INDIVIDUAL FREQUENCY
NOT E :-SEE " IRREC,.ULARITIES IN LOADED TELEPHONE CIRCUITS . " CiEOR(fE CRISSON , EL. COMM. VOL . N p.9s·.
F = FRACTION OF A LARGE QROUP OF' CIRCUITS.
·01 F O·I ------
·0001 Figure 4
I
II v
� v L-
I· 0
www.americanradiohistory.com

58 E L E C T R I C A L C O M M U N I C A T I O N
ui 1-5
0·3
� 0·2 u � z 0 i= !;! a: LL 0· 1 I ,..,
NORMAL ERROR CURVE y - 1L e - h2 sQ2 --/'ff
I R.M.5. ERROR"= h./2 = 1 •75 DECIBELS h = 0 · 404 �= 0 · 228
30
I \ 20
I \ I \
_b... l'iT I I \ 0
I \ J �
I/ 't--..... - 6 -S -4 -3 -2 -I 0 +I +2 +3 +4 +5 +6 S,, - DECIBELS
Figure 5
section considered, in order to obtain the magnitude and phase angle of the return current at the sending end. The return currents so obtained for each loading section must then be added vectorially. This calculation is very laborious when performed for several frequencies, but the method is sometimes of use where the results obtained on the assumption of a random distribution appear to be inaccurate. It is often possible, by the exercise of judgement to modify the r.m.s. value of loading section deviation so as to allow, approximately, for irregular distribution. If there are a few large individual irregularities their effect must be combined with that of the normal irregularities.
(2) The probable minimum singing point for a group of circuits depends, as shewn above, on the size of the group. This is merely because the greater the number of values measured the greater is the probability of striking a low value. For instance, if it is found that on a certain cable a certain value of singing point will probably be the minimum for 1 circuit in 100, then if there are only 10 circuits the probable minimum will be higher. But on ten such cables the probable value for 1 circuit in 100 will probably occur once, although for any one of the individual cables it probably will not occur.
In other words, unless the capacity and inductance for each individual circuit in each
loading section is known, the actual minimum singing point obtained on any cable is a matter of chance and no calculation can do more than indicate its most probable value for any particular case. Test results shew, however, that this indication is, in general, sufficiently reliable for practical purposes although there is always the possibility of an unusually low isolated value occurring by chance or of a particularly unfortunate allocation of cable lengths causing a large irregularity to occur on all the circuits in a group.
(3) The method described above is based on three assumptions :
(a) That the lowest singing points occur, in general, at the highest frequencies. This is the case for all normal types of circuits. The highest frequency, f, in the transmitted band was therefore taken as a basis for calculation.
(b) That the measured values of singing point follow a normal error law. Actually this is nol strictly true for values remote from the mean singing point; for instance a value of zero, from the normal law of errors might occur once in an infinite number of observations, but is not practically possible because, even if all the deviations were at some finite limit and all added in phase, they would not give a return loss of zero for a line of finite length. This effect, as shewn above, is not sufficiently marked to affect the results appreciably for the values usually met with in practice. Where capacity matching is used, however, the possibility of a large number of irregularities giving return currents adding in phase at any frequency is reduced and the minimum minimum singing point tends to approach more nearly to the average minimum.
(c) That the first irregularity occurs at the sending end of the line, i .e . , in the first halfsection or half-coil. If this is not the case, twice the loss from the sending end to the first irregularity must be added to the values obtained.
( 4) Care should be taken to employ fractional deviations throughout the calculations. Percentage deviations must be divided by 100 before entering the calculations.
(5) Values measured in practice with an impedance unbalance set include the effect of any mismatching between the simulating network
www.americanradiohistory.com

E L E C T R I C A L C O M M U N I C A T I O N 59
and the mean smooth curve of the line impedance. This tends to make measured results somewhat lower than the calculated values. The effect can be allowed for by combining the calculated values with the singing poin t corresponding to the impedance unbalance between the network and the mean curve.
(6) It is often possible to calculate the probable singing point for a given type of line by proceeding from measured values obtained on a different type having the same irregularities. It is then unnecessary to calculate the representative deviation and the work of computation can be made shorter and the results more reliable by employing the curves of Figs. 1 to 3 inclusive to find the difference between the expected singing points for the two types of circuits. This difference is the same for the average mm1mum, minimum minimum, and all other probable measurements. For instance, Fig. 1 may be used to find the difference between the probable singing points for two types of circuit which differ only in their cut-off frequencies.
Also, for two similar types of circuit having different irregularities, only the value of SH is different and this difference is the probable difference for all measurement�.
For two groups involving different numbers of similar circuits only the value of SQ is different, but this difference varies according to the percentage of circuits for which the value is required.
Summary
To find the probable minimum singing points for a group of normal loaded circuits, the following steps must be taken :
(1) Determine the total representative deviation, H, and find the corresponding irregularity function SH from current ratio tables.
(2) Find Sw from Fig. 1 , SA from Fig. 2 and, for short lines, ST from Fig. 3 . Take Sn
0 00,
DISTRIBUTION FUNCTION Sq FOR MINIMUM SINC,fNC, POINTS OVER A F'REQUf:"f,JCY RANC,E rROM 0 TO f Q = F'RACTION OF TOTAL CIRCUITS C,IV!NC, A PROBABLE TRUE SINC.ING POINT
u::ss THAN S. 2 == o ·so ±fi-fo50. e-h2(±sq) d sq
C' O I 0 '
Figure 6
' 0
as 2 .5 decibels and find SQ from Fig. 6 for the percentage of circuits for which the singing
point is required. For the average minimum singing point take SQ as zero.
(3) Calculate S = SH +Sw+ST -SA -Sn +SQ Then the probable percentage of circuits
which will have a true singing point less than S is the percentage used in finding S�. If SQ has been chosen to represent one circuit then probably one circuit, and only one, will have a singing point less than S.
In comparing calculated values with measured results it should be remembered that readings, for instance, of 30 db. or less, correspond to true singing points of 30.5 db. or less when readings are taken to the nearest decibel . This does not apply to the means of readings which should be accurate.
Conclusion
Practical examples have shewn that the method is capable, if used with caution and judgment, of giving a useful indication of the performance which may be expected in any normal case, provided that the r.m.s. deviations can be estimated sufficiently accurately.
To obtain absolutely accurate values for the singing points in any given cable i t would
_be
necessary to know the deviation of every mdividual coil and circuit in every loading section throughout the cable and the computation involved would generally be quite impracticable.
www.americanradiohistory.com
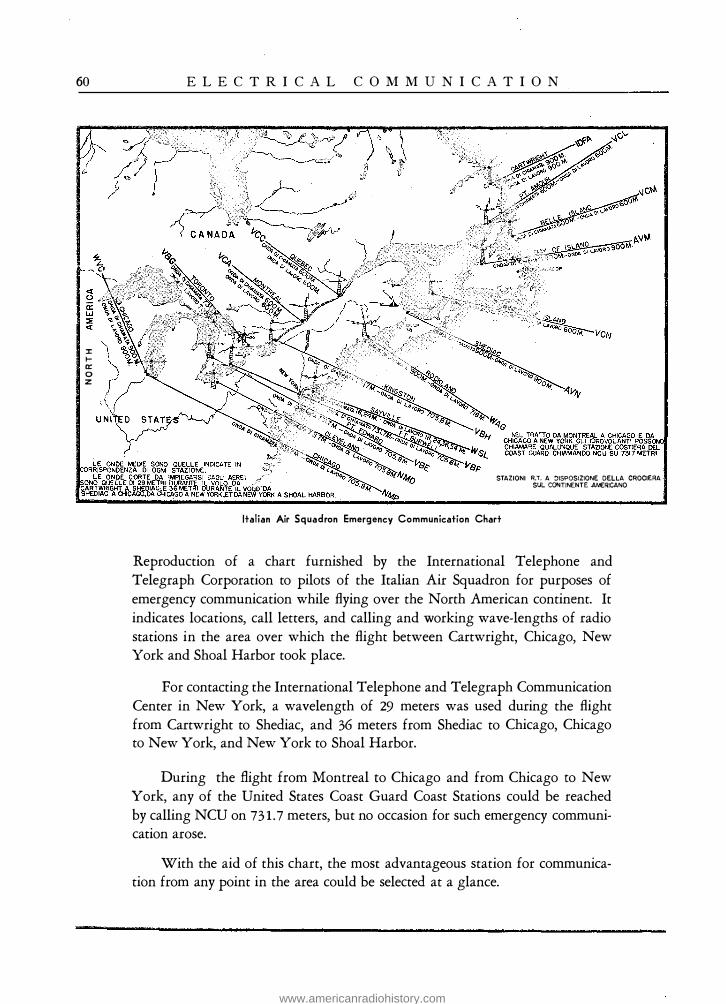
60
:r la: 0 z
E L E C T R I C A L C O M M U N I C A T I O N
STAZIONI R.T. A DISPOSIZIONE DELLA CROCIERA SUL CONTINENTE AMERICANO
Italian Air Squadron Emergency Communication Chart
Reproduction of a chart furnished by the International Telephone and Telegraph Corporation to pilots of the Italian Air Squadron for purposes of emergency communication while flying over the North American continent. It indicates locations, call letters, and calling and working wave-lengths of radio stations in the area over which the flight between Cartwright, Chicago, New York and Shoal Harbor took place.
For contacting the International Telephone and Telegraph Communication Center in New York, a wavelength of 29 meters was used during the flight from Cartwright to Shediac, and 36 meters from Shediac to Chicago, Chicago to New York, and New York to Shoal Harbor.
During the flight from Montreal to Chicago and from Chicago to New York, any of the United States Coast Guard Coast Stations could be reached by calling NCU on 73 1.7 meters, but no occasion for such emergency communication arose.
With the aid of this chart, the most advantageous station for communication from any point in the area could be selected at a glance.
www.americanradiohistory.com

Communication System for the Italian Squadron Transatlantic Flight
By ELLERY W. STONE
Lieutenant- Commander U.S.N.R., Operating Vice President, Mackay Radio and Telegraph Company
ON July 1st, 1933 a squadron of twentyfive large Italian military seaplanes of the Royal Italian Air Force under the
command of General Italo Balbo, Air Minister*, took off from their base at Orbetello, Italy, on a transatlantic flight which was to take them to Chicago and back to Rome.
The seaplanes were Savoia-Marchetti S.55 X flying boats, each powered with two IsottaFraschini 880 hp. water cooled motors, and two three-blade propellers. The planes were capable of a maximum speed of 150 knots, with a cruising speed of 124 knots. Their cruising range was about 40% above that required by the longest distance to be flown between any two consecutive bases. The flying weight of each plane fully loaded was about 1 1 .5 tons. Each plane was manned by a commander pilot, a second pilot, a radio operator, and a mechanician. Some planes had on board an extra man for special duties. All personnel were officers and non-commissioned officers of the R.l.A.F.
The entire flight had been divided into thirteen legs, thus affording fourteen landing bases where the squadron would be able to find shelter, fuel, communication facilities and general assistance. The fourteen bases and the distances separating them were :
Orbetello--Amsterdam . . . . . . . about Amsterdam-Londonderry . . . . . . . . . Londonderry-Reykjavik . . . . . . . . . . Reykjavik-Cartwright . . . . . . . . . . . . Cartwright-Shediac . . . . . . . . . . . . . . Shediac-Montreal. . . . . . . . . . . . . . . . Montreal-Chicago . . . . . . . . . . . . . . . Chicago--New York . . . . . . . . . . . . . . New York-Shediac . . . . . . . . . . . . . . . Shediac-Shoal Harbor . . . . . . . . . . . . Shoal. Harbor-Azores . . . . . . . . . . . . .
Azores-Lisbon . . . . . . . . . . . . . . . . . . . Lisbon-Rome . . . . . . . . . . . . . . . . . . .
870 miles 630 " 930 "
1 ,500 " 800 " 500 " 870 " 950 " 725 " 650 "
1,525 " 968 "
1,351 "
* Now Air Marshal, and Governor of the Italian Colony of Libya, Africa.
In addition to the above, an emergency base, located at Julianehaab, Greenland, was only to be used if necessity compelled. This base would have afforded to the squadron the same facilities as other bases, but its main purpose was that of providing the flight with a miniature weather bureau well equipped and well manned, situated far enough north, where weather conditions are generally bad and very unstable, to permit the preparation of weather forecasts for the most hazardous of the thirteen legs-the "hop" from Reykjavik to Cartwright.
Each base was under the command of a specially detailed Italian Air Officer and was manned by men of the Royal Italian Air Force.
The International Telephone and Telegraph Corporation became interested in this historic flight late in 1932 when one of the System representatives in Europe, Mr. H. H . Buttner, a Vice President of Mackay Radio and Telegraph Company, was called to Rome to discuss with General Balbo, then Air Minister, tentative arrangements for the communications organization to serve the needs of the flight. The appointment of the l .T.T. as the communication agency of the flight was made on January 4th, 1933 and, subsequently, General Aldo Pellegrini, Director of the Royal Air Force Training School in Orbetello, and Colonel Mario Infante, Director of Communication Services of the Air Ministry, were detailed to come to New York to select sites for the North American bases and to confer with the communication officials of the l .T.T. for the purpose of organizing the most ambitious chain of radio, cable, and wire communications ever attempted for an aerial venture-in fact, for any world event.
61
The author of the present paper was detailed by the late Mr. Hernand Behn, then President of the l .T.T., to organize the radio, cable, and telegraph set-up of the International System in the execution of the role entrusted to us by the Italian Government.
www.americanradiohistory.com
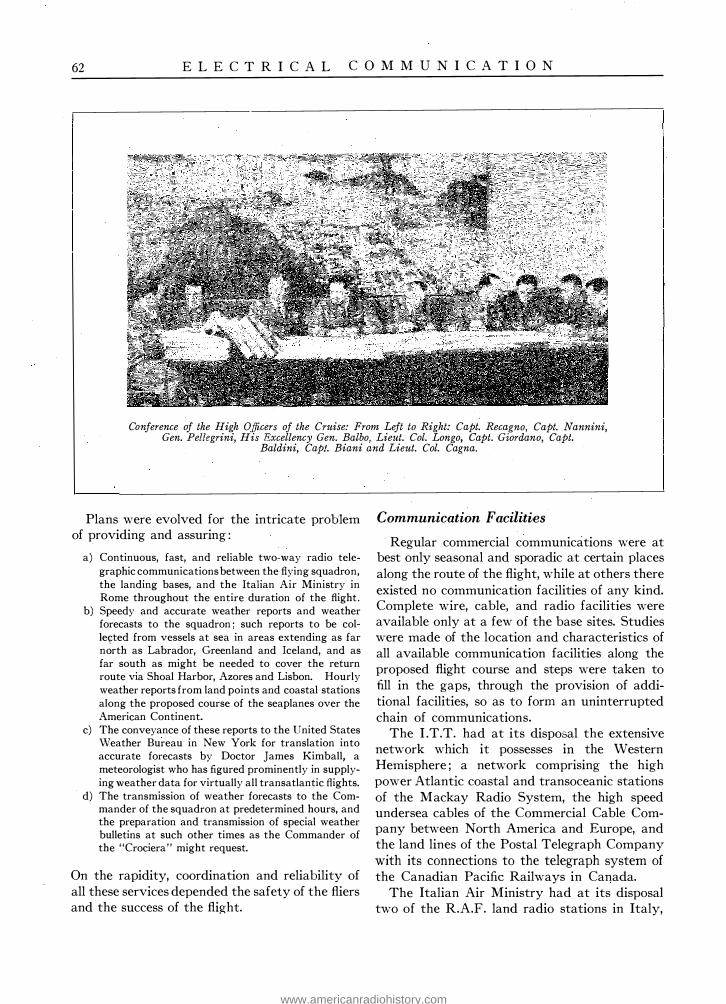
62 E L E C T R I C A L C O M M U N I C A T I O N
Conference of the High Officers of the Cruise: From Left to Right: Capt. Reca.gno, Capt. Nannini,
Gen. Pellegrini, His Excellency Gen. Balbo, Lieut. Col. Longo, Capt. Giordano, Capt. Baldini, Capt. Biani and Lieut. Col. Cagna.
Plans were evolved for the intricate problem of providing and assuring :
a) Continuous, fast, and reliable two-way radio telegraphic communications between the flying squadron, the landing bases, and the Italian Air Ministry in Rome throughout the entire duration of the flight.
b) Speedy and accurate weather reports and weather forecasts to the squadron ; such reports to be collected from vessels at sea in areas extending as far n�rth as Labrador, Greenland and Iceland, and as far south as might be needed to cover the return route via Shoal Harbor, Azores and Lisbon. Hourly weather reports from land points and coastal stations along the proposed course of the seaplanes over the American Continent.
c) The conveyance of these reports to the United States \Veather Bureau in New York for translation into accurate forecasts by Doctor James Kimball, a meteorologist who has figured prominently in supplying weather data for virtually all transatlantic flights.
d) The transmission of weather forecasts to the Commander of the squadron at predetermined hours, and the preparation and transmission of special weather bulletins at such other times as the Commander of the "Crociera" might request.
On the rapidity, coordination and reliability of all these services depended the safety of the fliers and the success of the flight.
Communication Facilities
Regular commercial communications were at best only seasonal and sporadic at certain places along the route of the flight, while at others there existed no communication facilities of any kind. Complete wire, cable, and radio facilities were available only at a few of the base sites. Studies were made of the location and characteristics of all available communication facilities along the proposed flight course and steps were taken to fill in the gaps, through the provision of additional facilities, so as to form an uninterrupted chain of communications.
The I .T.T. had at its disposal the extensive network which it possesses in the Western Hemisphere ; a network comprising the high power Atlantic coastal and transoceanic stations of the Mackay Radio System, the high speed undersea cables of the Commercial Cable Company between North America and Europe, and the land lines of the Postal Telegraph Company with its connections to the telegraph system of the Canadian Pacific Railways in Canada.
The Italian Air Ministry had at its disposal two of the R.A.F. land radio stations in Italy,
www.americanradiohistory.com
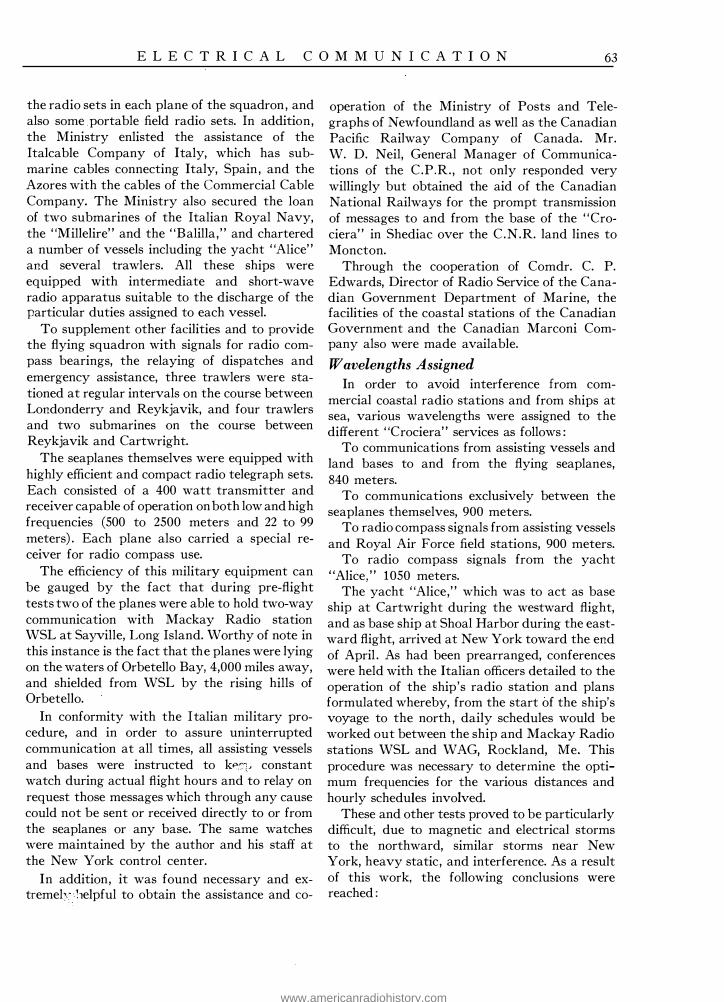
E L E C T R I C A L C O M M U N I C A T I O N 63
the radio sets in each plane of the squadron, and also some portable field radio sets. In addition, the Ministry enlisted the assistance of the Italcable Company of Italy, which has submarine cables connecting Italy, Spain, and the Azores with the cables of the Commercial Cable Company. The Ministry also secured the loan of two submarines of the Italian Royal Navy, the "Millelire" and the "Balilla," and chartered a number of vessels including the yacht "Alice" and several trawlers. All these ships were equipped with intermediate and short-wave radio apparatus suitable to the discharge of the particular duties assigned to each vessel.
To supplement other facilities and to provide the flying squadron with signals for radio compass bearings, the relaying of dispatches and emergency assistance, three trawlers were stationed at regular intervals on the course between Londonderry and Reykjavik, and four trawlers and two submarines on the course between Reykjavik and Cartwright.
The seaplanes themselves were equipped with highly efficient and compact radio telegraph sets. Each consisted of a 400 watt transmitter and receiver capable of operation on both low and high frequencies (500 to 2500 meters and 22 to 99 meters) . Each plane also carried a special receiver for radio compass use.
The efficiency of this military equipment can be gauged by the fact that during pre-flight tests two of the planes were able to hold two-way communication with Mackay Radio station WSL at Sayville, Long Island. Worthy of note in this instance is the fact that the planes were lying on the waters of Orbetello Bay, 4,000 miles away, and shielded from WSL by the rising hills of Orbetello.
In conformity with the Italian military procedure, and in order to assure uninterrupted communication at all times, all assisting vessels and bases were instructed to k"'" ,, constant watch during actual flight hours and to relay on request those messages which through any cause could not be sent or received directly to or from the seaplanes or any base. The same watches were maintained by the author and his staff at the New York control center.
In addition, it was found necessary and extremelv 11elpful to obtain the assistance and co-
operation of the Ministry of Posts and Telegraphs of Newfoundland as well as the Canadian Pacific Railway Company of Canada. Mr. W. D. Neil, General Manager of Communications of the C.P.R. , not only responded very willingly but obtained the aid of the Canadian National Railways for the prompt transmission of messages to and from the base of the "Crociera" in Shediac over the C.N.R. land lines to Moncton.
Through the cooperation of Comdr. C. P. Edwards, Director of Radio Service of the Canadian Government Department of Marine, the facilities of the coastal stations of the Canadian Government and the Canadian Marconi Company also were made available.
Wavelengths Assigned In order to avoid interference from com
mercial coastal radio stations and from ships at sea, various wavelengths were assigned to the different "Crociera" services as follows :
To communications from assisting vessels and land bases to and from the flying seaplanes, 840 meters.
To communications exclusively between the seaplanes themselves, 900 meters.
To radio compass signals from assisting vessels and Royal Air Force field stations, 900 meters.
To radio compass signals from the yacht "Alice," 1050 meters.
The yacht "Alice," which was to act as base ship at Cartwright during the westward flight, and as base ship at Shoal Harbor during the eastward flight, arrived at New York toward the end of April . As had been prearranged, conferences were held with the Italian officers detailed to the operation of the ship's radio station and plans formulated whereby, from the start of the ship's voyage to the north, daily schedules would be worked out between the ship and Mackay Radio stations WSL and WAG, Rockland, Me. This procedure was necessary to determine the optimum frequencies for the various distances and hourly schedules involved.
These and other tests proved to be particularly difficult, due to magnetic and electrical storms to the northward, similar storms near New York, heavy static, and interference. As a result of this work, the following conclusions were reached :
www.americanradiohistory.com

64 E L E C T R I C A L C O M M U N I C A T I O N
WAG could best communicate with the yacht "Alice" on 718 meters and 2,420 meters.
WSL found that from 1 ,800 G.M.T. to 2,200 G.M.T. it could use with advantage 23.84 meters for transmission to the "Alice" and 29 meters for reception. From 2 ,200 G.M.T. to 1 ,800 G.M.T., 35.76 meters proved better for transmission, while a wavelength of 39 meters was better for reception.
AVN and AVM could contact WAG easily enough on 840 meters, while A VS could not be relied upon to contact directly either WAG or WSL on long wave ; magnetic disturbances, fading, and low power being the adverse factors. A wavelength of 29 meters, however, proved satisfactory.
AVR and AVL could not rely on continuous contact with \VSL but could receive WSL on 1 7 .87 and 23.84 meters during the day and on 35.76 and 54.04 meters during the night.
All the base radio stations and the trawlers could, however, communicate promptly by relay with WSL. (Distances between the vessels averaged 250 miles.)
ABO and IKM in Italy, being permanent land stations, could communicate easily with WSL on the following wavelengths :
WSL would transmit on 17 and 24 meters during the day and receive on 18 and 29 meters ; during the night it would transmit on 36 and 54 meters. There would be a period between darkness and daylight when 29 and 36 meters gave best results.
The optimum wavelengths for use between the seaplanes and WSL during the flight over the North American continent between Cartwright, Shediac, Montreal, Chicago, New York, and Shoal Harbor were determined by a very practical experiment. Col. Infante and R.A.F. Radio Operators Ponticelli and Mercalli , equipped with short-wave receivers similar to those of the planes, undertook an automobile trip from New York to Chicago, Montreal , Shediac, Cartwright, and return. At predetermined intervals, they stopped en route and noted reception from WSL on various frequencies for the various legs of the North American course. The results of these tests determined the assignment of the following wavelengths for communications between the seaplanes and WSL :
Seaplane "Savoia Marchetti S. 55 X."
26 meters from Cartwright to Shediac 36 meters from Shediac to Chicago, Chicago to New
York, and New York to Shoal Harbor 29 meters for greater distances.
WSL had no difficulty in contacting the squadron at any time along the entire course of the flight. The reasons for this were : first, the high power of the transmitting station ; second, the fact that when necessary WSL was able to transmit on four transmitters simultaneously, each on a different frequency, thus enabling the receiving operator at any point to select the optimum frequency for his location from the four frequencies used, namely : 16780 kc. (1 7 .87 m.) , 12585 kc. (23 .84 m.) , 8390 kc. (35.76 m.) , and 5555 kc. (54.04 m. ) .
The carrying out of these tests and contact work lasted from the first week in May to the end of June, 1933. WAG and WSL were on the air at practically all hours on this assignment, and their staffs had to be increased considerably in order not to delay the normal commercial work of these stations.
Collection of Weather Data
The New York control center was entrusted with the collection of information pertaining to meteorological conditions for that portion of the flight west of the 35th meridian, and the procuring of this data from all points adjacent to the course of the flight presented a problem demanding considerable preparation. Reports were received from ships at sea either directly or through the Weather Bureau at Washington,
www.americanradiohistory.com

E L E C T R I C A L C O M M U N I C A T I O N 65
from C.P.R. stations, from all bases in Labrador, from Mackay Radio and Commercial Cable stations, and from many Postal Telegraph stations located near the Canadian border between Chicago and New York. Arrangements were made with the Canadian Weather Bureau and the Canadian Department of Marine for the collection and transmission of weather reports by the Canadian and Newfoundland Government weather stations directly to Mackay Radio coastal stations, or by relay between designated Government stations. All such information was immediately turned over to Dr. Kimball of the local Weather Bureau and Professor Montanari, meteorologist of the Royal Air Force.
Emergencies
Another phase covered by the communication system was that of preparing for emergency messages. In order to provide immediate assistance to any unit of the seaplane squadron while over
North American waters, it was arranged that the Director of Naval Intelligence, the Director of Naval Communications, and the Chief Signal Officer of the Army in ·w ashington would be made joint addressees for all bulletins released relating to the flight movements. This would have permitted prompt action by the United States Army and Navy in case of distress.
The Commander of the Eastern Area of the United States Coast Guard was also kept informed of the progress of the flight in the event that the services of the Coast Guard should be required to render assistance to a disabled seaplane. The Coast Guard radio stations NMP in Chicago, and NMD in Cleveland kept constant watch during the actual flying time from Montreal to Chicago and New York.
The Director of Naval Communications ordered the Atlantic Coast naval radio stations north of New York, as auxiliaries to Mackay Radio, to keep constant watch during the "hops" from Cartwright to Shediac, and from New York
Seaplane "Savoia Marchetti S. 55 X."
www.americanradiohistory.com

66 E L E C T R I C A L C O M M U N I C A T I O N
Lieut. Col. Mario Infante, R.I.A . F. , and Lieut. Commander Ellery W. Stone, U.S.N.R., at the International Telephone and Telegraph Corporation Control Center of the " Crociera. "
to Shoal Harbor. The squadron, however, was never out of communication with the I .T.T. control center and, happily, no disaster occurred requiring the assistance of the military services.
Communication Log of the Flight
Below are given briefly a few excerpts from the log kept at the control center and from the many bulletins issued to the Army, Navy, Coast Guard, newspapers, and broadcasting stations by Mackay Radio during the period of the fortythree days from the start to the finish of the "Crociera." Actual time spent in flying the 12 ,000-mile stretch was 103 hours.
All time given is E.S.T., 75th Meridian.
July 1st 0 :10 A.M. Mackay Radio reports that the 25 sea
planes took off from Orbetello for Amsterdam.
8 :00 A.M. One plane capsized in landing at Amsterdam.
8 :10 A.M. Mackay Radio now advised from Amsterdam capsized plane wrecked, one of the crew missing, pilot and commander saved by two Dutch Marine Cadets.
8 :25 A.M. Mackay Radio now reports that Sergeant Quintavalli of the wrecked plane is dead; Captain Baldini, Lieutenants Novelli and Demetria injured and fifth man slightly hurt.
July 2nd 2 :30 A.M. Gen . Balbo took off from Amsterdam for
Londonderry. The 23 other planes of the squadron followed immediately.
8 :55 A.M. Squadron landed at Londonderry. July 5th
7 :40 A.M. Squadron took off from Londonderry for Reykjavik.
2 :1 5 P.M. Report from Gen. Balbo to Mackay Radio states Italian Squadron landed at Reykjavik. Squadron faces a stop of a few days on account of adverse weather conditions over Atlantic.
The I .T.T. control center, which up to this time had been concerned mostly with dispatching
www.americanradiohistory.com

E L E C T R I C A L C O M M U N I C A T I O N 67
the great volume of messages to and from the Italian Ministry in Rome, the bases in Amsterdam and Londonderry, and to the squadron, now became directly responsible for the collection of weather reports and the transmission of forecasts preparatory to the long and hazardous transatlantic flight from Reykjavik to Cartwright.
Bulletins were required twice a day while the seaplanes were resting at the bases, every two hours while the planes were preparing to start, and every hour (or oftener if requested) while the planes were actually flying.
The United States Weather Bureau in New York had been connected with the I .T.T. control center by special wires, and the hourly weather reports from the designated observation points soon began to pour in. Forecasts were then transmitted in Italian to the Commander of the squadron regularly and accurately. On July 8th, WSL received from AVR (Reykjavik) a message addressed to the author, in which Gen. Balbo expressed his satisfaction and his thanks for the "speed and accuracy" of the communication services.
July 12th 2 :15 A.M. Mackay Radio advises that squadron
took off from Reykjavik for Cartwright. 8 :15 A.M. Squadron passed over Italian submarine
"Millelire" at Lat. 57 .2 North, Long. 46.5 West, approximately 950 miles from Reykjavik.
1 1 :20 A.M. Italian Squadron now two hundred miles from Cartwright. All is well.
1 :SO P.M. Mackay Radio announces that Gen. Balbo landed safely at Cartwright.
4 :20 P.M. The eighth and final squad of three planes now landed at Cartwright. This completes the landing of the 24 seaplanes under the command of Gen. Balbo and concludes an outstanding achievement in aviation history. The number of planes safely brought across the Atlantic is more than twice that of any previous flight.
July 13th 8 :30 A.M. Gen. Balbo's leading squadron took off
from Cartwright for Shediac.
1 :00 P.M. Squadron bucking strong wind and is shaping its course to Magdalen Island in the Gulf of St. Lawrence.
2 :37 P.M. Mackay Radio announces Gen. Balbo landed at Shediac. Sea calm, weather good.
3 :00 P.M. All of the seaplanes have landed safely.
July 14th
Squadron has completed about 4500 miles of its 7000-mile flight to Chicago.
8 :5 1 A.M. Gen. Balbo took off from Shediac for Montreal.
1 1 :00 A.M. Gen. Balbo has radioed that he is abeam of Lake Millicent, Maine, and at this point they were having a beautiful view of an immense forest. Mackay Radio has just delivered to the General a congratulatory message from Premier Mussolini. What is believed to be a record was achieved today by Mackay Radio in the handling of the message from Premier Mussolini in Rome to Gen. Balbo in flight over Maine. The entire transmission took exactly three minutes, and the reply from the General to Premier Mussolini (a few minutes later) was handled with the same speed.
1 :10 P.M. Planes landing at Montreal.
July 15th 10:14 A.M. Gen. Balbo took off from Montreal for
Chicago. 10 :49 A.M. Mackay Radio announces that the sixth
squadron has just taken off. Just delivered to Gen. Balbo's flagship a radiogram recommending a change in the course 60 miles to the northward to avoid thunderstorm on the course Toledo, Cleveland, Erie. Gen. Balbo will radio his exact course later, to enable the United States Army escort of forty pursuit planes to meet him at the point where he will enter United States territory.
1 :25 P.M. Mackay Radio reports that Gen. Balbo radioed that he was over Lake Simcoe at 1 :OS P.M. pointing for Nottawasaga Bay and thence to Southampton on the east shore of Lake Huron. He advised that he would fly south along the east shore of Lake Huron and would enter the United States at Port Huron.
3 :45 P.M Gen. Balbo has j ust sent a message to the Italian Government stating that he passed over Toledo escorted by a squadron of American Army combat planes flying in splendid and close formation.
5 :30 P.M. Circling over Chicago, then landing.
July 19th 7 :42 A.M. Gen. Balbo took off from Chicago for
New York. 1 :20 P.M. Mackay Radio announces that a message
from Major General Haskell, commanding the New York National Guard, was transmitted to Gen. Balbo's plane requesting the Italian Commander to fly his squadron over the Natiorial Guard
www.americanradiohistory.com

68 E L E C T R I C A L C O M M U N I C A T I O N
encampment at Peekskill, N. Y. Gen. Haskell stated the Guard would fire a salute as the Italian Squadron passed over. Gen. Balbo, however, was not able to change his course so as to accept this invitation.
2 :SS P.M. Gen. Balbo landing at Floyd Bennett Field.
July 25th 9 :01 A.M. Gen. Balbo's squadron takes off from New
York for Shediac. 12 :50 P.M. Gen. Balbo transmitted to Mackay Radio
several messages of thanks addressed, respectively, to: the President of the United States; the Mayor of New York; the Mayor of Chicago ; the Secretary of War, and the Secretary of the Navy.
1 :15 P.M. The plane I-GALL has been forced to land off the coast at Rockland, Maine, on account of an oil leak. The plane is in radio communication with the Mackay station at that point and will again take off as soon as it can obtain additional oil.
2 :37 P.M. Gen.Balbo's squadron landing at Shediac. 3 :15 P.M. The plane I-GALL took off from Rock
land, Maine, for Shediac. 4 :30 P.M. All planes are now safely landed at
Shediac. July 26th
8 :31 A.M. The squadron took off from Shediac for Shoal Harbor, Newfoundland.
9 :20 A.M. The plane 1-ROVI was forced to land at Cape Traverse due to minor trouble to the water pump.
11 :40 A.M. Squadron landed at Shoal Harbor.
July 27th 7 :13 A.M. Plane 1-ROVI took off from Cape Tra-
verse for Shoal Harbor. Pump trouble repaired.
10:10 A.M. I-ROVI landed at Shoal Harbor.
August 8th 2 :45 A.M.
6 :05 A.M.
1 :25 P.M.
2 :00 P.M.
August 9th
Gen. Balbo's squadron took off from Shoal Harbor for the Azores. Gen. Balbo radioed that squadron was 450 miles out of Shoal Harbor. He had ordered nine planes to land at Horta and the remaining fifteen at Ponta Delgada in the Azores. Gen. Pellegrini with nine planes is now landing at Horta. Gen. Balbo and his fifteen planes are now landing at Ponta Delgada.
2 :20 A.M. Gen. Pellegrini's squadron took off from Horta.
3 :30 A.M. Gen. Balbo's squadron took off from Ponta Delgada.
4 :30 A.M. I-BALB (Balbo flagship) calls IKM but is unable to contact. WSL contacts I-BALB immediately and Gen. Balbo radios that the plane I-RANI capsized in taking off from Ponta Delgada and that
Capt. Ranieri, Sergeant Major Cremaschi and Sergeant Boveri only bruised. Second pilot Lieut. Squaglia suffering from concussion of the brain. The other planes, still on the water, would take off immediately and join the squadron. Thus 23 planes would fly to Lisbon. This dispatch forwarded immediately by cable to the Air Ministry.
4 :40 A.M. It was announced that Lieut. Squaglia had died.
10 :30 A.M. Entire squadron lands safely at Lisbon.
August 12th 1 :40 A.M. Squadron took off from Lisbon on its way
to Rome. 8 :40 A.M. Over Majorca Island and reported by
I.T.T. radiotelephone station there to Madrid, thence by radiotelegraph to WSL.
12 :25 P.M. Circling over Rome. 12 :45 P.M. Mackay Radio announces that Gen.
Balbo's squadron has landed at Ostia amid thunderous applause from hundreds of thousands of spectators. Gen. Balbo and his brave men have covered in mass formation over 12,000 miles, thus ending the most remarkable feat in the history of aviation.
The I .T.T. is indebted to the radio station of the Vatican City for the step-by-step instantaneous description of the events as they took place when the planes were arriving at Ostia, circling Rome, and landing at Fiumicino (Ostia) .
The success of the Balbo flight was a brilliant affirmation of Italy's progress under the present regime and a striking proof of the efficiency of Italian aviation. It forecasts what the future may have in store for aerial navigation and once again demonstrates the great value of reliable and fast communications to ships of the air.
We should like at this time to pay tribute to the brilliant ability and splendid cooperation of Col. Mario Infante, without whose untiring efforts the success of this communication problem could not have been realized. Appreciation is also due to Col . Paolo Sbernadori , Air Attache of the Royal Italian Embassy at Washington ; Mr. W. D. Neil, General Manager of Communications of the Canadian Pacific Railway Company ; Comdr. C. P. Edwards, Director of Radio Service of the Canadian Government ; the Canadian Marconi Company, and the Minister of Posts and Telegraphs of Newfoundland for their splendid cooperation and that of their respective organizations.
www.americanradiohistory.com

The New "Standard" Radio Receivers for Commercial Links (R.M.6, R.M.7 and R.M.3)
By L. J. HEATON-ARMSTRONG, A.C.G.I., B.Sc., D.I.C. Standard Telephones aud Cables, Limited
and L. T. HINTON, A.C.G.I., B.Sc., A.M.I.E.E. International Standard Electric Corporation
General
IN considering the design of modern commercial receivers the first step is to review the requirements which have to be met.
These may be divided into three categories :
(A) Service to be catered for. (B) Performance. (C) Cost.
A brief survey will make it clear that a single receiver is not likely to meet all the requirements. For instance, the wavelengths in commercial use range from 15 cm. (micro-ray) to 30,000 metres. The performance required varies from that for telegraph reception on ships to high quality transatlantic broadcast relays.
From the cost standpoint, receivers can range from a simple TRF set to the multi-valve equipments which are used for long distance radio link telephone traffic.
Certain specialised services must have receivers specifically designed to meet their m-
dividual requirements. Examples are the 15 centimetre micro-ray receiver, portable equipments working at less than 10 metres, and transatlantic short-wave sets.
The wavelength allocation shown in Table I and agreed to at the Madrid Convention, in its range from 10 to 30,000 metres, covers many of these specialised services. It embraces, however, a very large number of less specialised services which can be covered by what we have conveniently classified as "Commercial Receivers." The problem in design, therefore, resolves itself into finding the best economic solution to provide commercial receivers for the range shown in the table.
Requirements for Commercial Receivers
(A ) Service
Receivers should be capable of handling telegraphy, continuous wave as well as modulated continuous wave, and telephony-in some instances, of broadcast reception quality. They
TABLE I European Wavelength Service Allocation
TYPE WAVELENGTH FREQUENCY SERVICE RECEIVER
-.+-13.5 m
This band is divided into 32 separate sections allocated to Fixed Land Stations, Mobile Air-
SHORT WAVES 10 to 50 Metres 30,000 to 6,000 Kcs. craft and Marine, Broadcasting, and Amateur services. It is employed chiefly for long distance communication, telegraphy and telephony.
-RM6 50 to 200 Metres 6,000 to 1 ,500 Kcs. This band is allocated to Fixed Land Stations,
Mobile Marine and Amateur services and is used chiefly for short distance telephony and teleg-raphy.
MEDIUM WAVES 200 to 545 Metres 1 ,500 to 550 Kcs. Broadcasting -- .+- 250 m
545 to 822 Metres 550 to 365 Kcs. Marine Mobile
822 to 938 Metres 365 to 320 Kcs. Aircraft Mobile -RM7
938 to 1 , 132 Metres 320 to 265 Kcs. Marine and Aircraft Beacons
1 , 132 to 1,875 Metres 265 to 160 Kcs. Broadcasting -- - .+-1 ,500 m
LONG WAVES 1,875 to 3 ,000 Metres 160 to 100 Kcs. Mobile and Marine -RMS - -<-5,000 m
3,000 to 30,000 Metres 100 to 10 Kcs. Fixed Land Stations, Press Service --- .+-22,000 m
69
www.americanradiohistory.com

70 E L E C T R I C A L C O M M U N I C A T I O N
must also be extremely reliable and simple to operate.
(B) Performance
The basic performance requirements are that the receiver shall have satisfactory selectivity, audio frequency response and sufficient gain so that the output is limited only by the inherent tube noise. It is also desirable that the receiver should be capable of working either from alternating current mains power supply or from batteries.
(C) Cost
The receivers should be designed at a price commensurate with the service and performance required.
From a technical point of view one single receiver could be designed to give the required performance for the whole range, but it would be so rnmplicated and costly that the other requirements would not be met.
A study of the individual types of service indicated in Table I , bearing in mind all the requirements to be met, has resulted in the production of three new Standard receivers to cover the range of 13 .5 to 22 ,000 metres. These receivers are coded R.M .6, R.M.7 and R.M.8 and wi11 be described in more detail below. The wavelength ranges of the receivers are indicated in Table I and it will be seen that they meet the service requirements with the minimum amount of equipment.
Wavelengths shorter than about 13 .5 metres are not at present generally in use for commercial services, so that this is the lowest wavelength covered. The short-wave receiver covers the range from 13.5 to 250 metres, while the medium wave receiver covers from 250 to 5000 metres. No overlap has been considered necessary on these receivers since 250 metres lies in the medium-wave broadcast band.
The medium and long wavelength receivers overlap from 1 , 500 metres to 5,000 metres. This arrangement has been chosen to avoid the use of two receivers, which would be necessary under certain service conditions if a division had been fixed without overlap. At the end of the range, a wavelength of 30 ,000 metres is well within the audible limit and is not used in practice. It is, therefore, considered that there is no need to
cover wavelengths longer than 22 ,000 metres. The power supply equipment for these re
ceivers has been carefully studied and a separate a-c. power supply unit capable of feeding any one of the three receivers has been designed. This power supply unit works from alternating current mains of the types normally met with in practice and supplies the necessary voltages and currents for the operation of the receivers which use indirectly heated valves throughout. If it is desired to use batteries instead of a-c. mains supply, they can be connected directly to the receiver.
The last few years have seen remarkable advances made in radio receivers, particularly in the field of broadcasting. New and highly efficient valves have appeared and the improved mechanical design of component parts has made it possible to build very efficient and compact equipments.
A commercial receiver, as distinct from a broadcast receiver, must be built so that its performance can be guaranteed under rough treatment, and its components must be extremely reliable under all conditions of use. Further, many features, such as alternate telephone and telegraph reception, as well as metering facilities, acoustic shock limiters, etc. , not necessary on broadcast receivers, must be incorporated in the commercial design to fulfil the demands made from the operating field.
R.M.6 Receiver (Short-Wave)
The R.M.6 is an eight valve receiver employing the superheterodyne principle, and is shown in block schematic form in Fig. 1 .
The valves are employed as follows : one highfrequency amplifier, first detector, beat oscillator, two intermediate frequency amplifiers, second detector, output power pentode, and automatic gain control valve. The latter can also be made to oscillate for the heterodyne reception of C .W. telegraph. The high and intermediate frequency amplifiers are variable mu pentodes which are silent and very stable in operation and which give high gain .
The wavelength range (13 .5 to 250 metres) is covered by means of a three-position switch and variable condensers. No plug-in coils are used, thus making for very easy operation. The radio frequency signal is fed through a tuned circuit
www.americanradiohistory.com
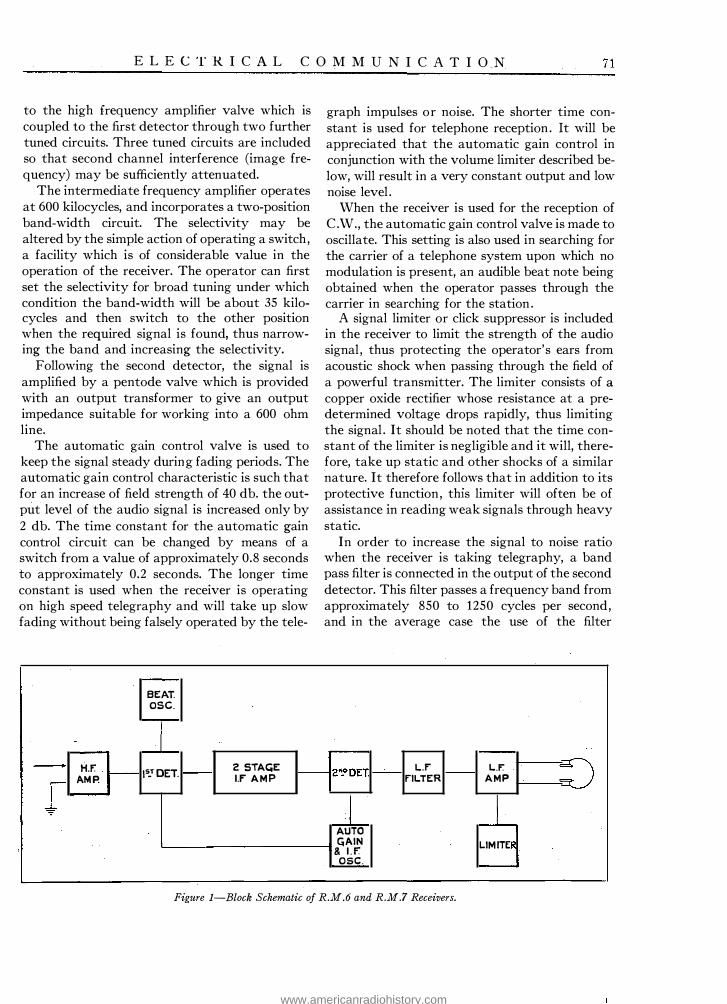
E L E C T R I C A L C O M M U N I C A T I O N 7 1
to the high frequency amplifier valve which is coupled to the first detector through two further tuned circuits. Three tuned circuits are included so that second channel interference (image frequency) may be sufficiently attenuated.
The intermediate frequency amplifier operates at 600 kilocycles, and incorporates a two-position band-width circuit. The selectivity may be altered by the simple action of operating a switch, a facility which is of considerable value in the operation of the receiver. The operator can first set the selectivity for broad tuning under which condition the band-width will be about 35 kilocycles and then switch to the other position when the required signal is found, thus narrowing the band and increasing the selectivity.
Following the second detector, the signal is amplified by a pentode valve which is provided with an output transformer to give an output impedance suitable for working into a 600 ohm line.
The automatic gain control valve is used to keep the signal steady during fading periods. The automatic gain control characteristic is such that for an increase of field strength of 40 db. the output level of the audio signal is increased only by 2 db. The time constant for the automatic gain control circuit can be changed by means of a switch from a value of approximately 0.8 seconds to approximately 0.2 seconds. The longer time constant is used when the receiver is operating on high speed telegraphy and will take up slow fading without being falsely operated by the tele-
H.F. AM P.
BEAT. osc.
l5_T OET. 2 STAGE l.F A M P
graph impulses or noise. The shorter time constant is used for telephone reception. It will be appreciated that the automatic gain control in conjunction with the volume limiter described below, will result in a very constant output and low noise level .
When the receiver is used for the reception of C.W., the automatic gain control valve is made to oscillate. This setting is also used in searching for the carrier of a telephone system upon which no modulation is present, an audible beat note being obtained when the operator passes through the carrier in searching for the station.
A signal limiter or click suppressor is included in the receiver to limit the strength of the audio signal , thus protecting the operator's ears from acoustic shock when passing through the field of a powerful transmitter. The limiter consists of a
copper oxide rectifier whose resistance at a predetermined voltage drops rapidly, thus limiting the signal . It should be noted that the time constant of the limiter is negligible and it will, therefore, take up static and other shocks of a similar nature. It therefore follows that in addition to its protective function, this limiter will often be of assistance in reading weak signals through heavy static.
In order to increase the signal to noise ratio when the receiver is taking telegraphy, a band pass filter is connected in the output of the second detector. This filter passes a frequency band from approximately 850 to 1250 cycles per second, and in the average case the use of the filter
L.f' f'ILTER
L.F: A M P
AUTO L------------t 4AIN
& l . F. LIMITE
osc.
Figure 1-Block Schematic of R.M.6 and R.M.7 Receivers.
www.americanradiohistory.com

72 E L E C T R I C A L C O M M U N I C A T I O N
10 rJ) J w m u 20 w 0
z 0 ;:: 30 c( :l z w I-I-c( 40
50 '--��-'-��----1..���L--1..�� -20 - 10 0 + I() + 20
KILOCYCLES OF"F RESONANCE:. Figure 2-Selectivity Curve of R.M. 6 Receiver.
will increase the signal to noise ratio by 10 db. The selectivity curve of the R.M.6 receiver
measured at 20 megacycles (15 metres) with the selectivity set for telephone reception is shown in Fig. 2. It will be seen that the loss at 3.5 kilocycles on either side of the tuning point is 6 db. and this setting will give adequate quality for commercial telephone work. The curve for broad tuning used when the operator is searching for a station has a loss of 6 db. at approximately 1 7 .5 kilocycles on each side of the tuning point.
The sensitivity is such that the receiver will furnish an audio-frequency output of 50 milliwatts for a signal input of 5 microvolts modulated 30% at 400 p :s. from a 70 ohm line. This sensitivity will give good reception from telephone signals having a field strength of 1 microvolt per metre received on a half-wave dipole, providing atmospheric conditions permit.
In Fig. 3 are shown typical overall audiofrequency response curves for these receivers. The curve marked 1 is used for telephone reception, while curve 2 is used for telegraph reception
and is obtained by the inclusion of the band-pass filter mentioned above.
Two volume controls are provided. The first is located immediately before the output valve, thus controlling the level to the line when the automatic gain control is in circuit ; the second operates on the high frequency circuits and is used for obtaining the best operating conditions from the point of view of the automatic gain control and for the reduction of cross modulation.
A meter and a rotary switch permit measurements to be taken of the filament voltage, plate voltage and the plate current of each valve.
The receiver is mounted on a chassis which slides into the back of a metal box. A front view of the receiver is shown in Fig. 4 and it will be noticed that the front panel of the chassis is set back from the edge of the case. Mechanical protection is thus afforded for the various switches mounted on the front of the receiver. Particular care has been taken to render all parts of the receiver accessible and it has been built to stand rough usage in service.
The receiver is provided with the necessary terminals so that it may be connected to an ordinary open antenna and ground, or to a directive antenna by means of a transmission line. This transmission line may be of the balanced openwire type or the concentric conductor type. The latter may be constructed of copper tubes insulated from each other or may be specially designed single-core radio frequency cable.
R.M. 7 Receiver (Medium-Wave)
The R.M. 7 receiver is in design essentially the same as the R.M.6 shown in the block schematic of Fig. 1 .
a •O m ' 5 � IS $ 20 g
30
CURVE I • WITHOUT L F'" F"IL TEA! • · WITH •
-c.-� \
I- ' L. I
50 100 soo 1000 F'R£QUf;NCY • ?ERIOOS PCR SECOHO
\
...._!'--.. "
5000 10000
Figure 3-Typical Overall Audio-Frequency Characteristics of Commercial Receivers.
www.americanradiohistory.com

E L E C T R I C A L C O M M U N I C A T I O N 73
Figure 4-R.M. 6 Receiver (13.5-250 Metres) .
It has all the features of the R.M.6 differing only in regard to the wavelength range of 250 metres to 5 ,000 metres and to the intermediate frequency which, in this case, is 45 kilocycles.
The selectivity curves of this receiver taken at 1 ,000 kilocycles (300 metres) are shown in Fig. 5 . The first curve shows the receiver with the switch in the position for telephone reception where the loss is 6 db. at approximately 2 .5 kilocycles on either side of the tuning point. The second curve shows the response when the switch is set for the reception of telegraphy where the loss is 6 db. at approximately 0.5 kilocycles on either side of the tuning point. It is of interest to note that the loss is some 60 db. for a total band-width of 9.0 kilocycles in the telegraph position and 16.5 kilocycles for telephony.
In addition to these two degrees of selectivity, there is another position provided, and by operating a switch the receiver may be converted to a straight set using one high-frequency amplifier, detector, and two audio-frequency amplifiers. In this position the tuning is very flat ; for example, a band-width of 30 kilocycles may be received on 600 metres, so that the receiver may be used for
picking up ship traffic or for other work where a close watch has to be kept on a wide frequency band. The sensitivity of this receiver is such that it will deliver an output of 50 milliwatts for an input signal of 5 microvolts modulated 30% at 400 p :s. from a sinall antenna. This sensitivity is sufficient to receive all signals which would be audible above the normal atmospheric noise level . Means of connecting the receiver to the antenna are similar to those employed in the R.M.6 described above.
The size of the R.M.7 receiver is the same as the R.M.6 and the two sets are almost identical in appearance.
R.M. 8 Receiver (Long-Wa.ve)
The R.M.8 receiver differs from the two preceding equipments as it is a tuned radio frequency set instead of a superheterodyne. The receiver employs six valves : two variable mu high frequency pentodes, detector, low frequency amplifier, output pentode, and separate heterodyne oscillator. The wavelength of 1 ,500 metres to 22 ,000 metres covers the long waveband. A
www.americanradiohistory.com

74 E L E C T R I C A L C O M M U N I C A T I O N
\() .J w CD u w 0 z 0 � :::> z w I-�
CURVE I - F'OR TELEPHONE
II 2 - TELEGRAPH
10
20
30
40
50
60 '--��-'-���-'--��--1��--l.� - 10 -s o +s + 10 KILOCYCLES OFF' RESONANCE: ,
Figure 5-Selectivity Curve of R.M.7 Receiver.
block schematic of the receiver is shown in Fig. 6 which clearly indicates the system used.
In view of the comparative absence of fading on the waveband over which this receiver works, there is no necessity to include an automatic gain control 1valve, as for the shorter wavelengths.
When a beat note is required for the reception of telegraphy, the separate heterodyne oscillator is adjusted to give this beat frequency in the detector circuit.
The signal limiter previously described is of particular value in this set, in that it greatly facilitates reception under bad static conditions prevalent on long wavelengths.
The wavelength switch, band-pass filter and metering system are similar to those previously described, but only one gain control is fitted in place of the two necessary with automatic gain control on shorter wavelengths.
Selectivity curves are shown in Fig. 7 , one curve corresponding to a radio frequency of 200 kilocycles (1 ,500 metres) and the other, to 85 kilocycles (3 ,530 metres) . The band-width is sufficient for commercial telephone reception, and the band-pass filter allows the response to be narrowed for telegraphy in the manner shown in Fig. 3 .
The receiver has a sensitivity such that on 150 kilocycles a signal input from the antenna of 20 microvolts will give an audio output of 50 milliwatts. When used with a normal antenna, the sensitivity is, therefore, adequate to give good reception from any signal likely to be audible above the normal atmospheric noise level.
Power Supply Unit
The power supply for these receivers is obtained either from batteries or from the mains by means of a power supply unit. When working with batteries, the filaments are connected to a 1 2 volt battery and the plate circuits to a 1 30
2 STA�E DET. 15..! L.F. L.F: 2N_DL_f". =-'
�L H . F" AMP AMP I f"ILTER A M P -
H ET LIMITER osc.
Figure 6-Block Schematic of R.M.8 Receiver.
www.americanradiohistory.com

E L E C T R I C A L C O M M U N I C A T I O N 75
volt battery. The drain on the filament battery is 3 amperes for the R.M.6 and 7 , and 2 amperes for the R.M .8 receiver. The plate supply drain varies somewhat depending on the service for which the receiver is being operated but the maximum value is 70 milliamperes for the R.M.6 and 7 , and 45 milliamperes for the R.M.8
CURVE I - AT 200 KILOCYCLES
Ill ...J w
0
receiver. ro 10 u
When any of the receivers are required to W 0 operate from an a-c. mains supply a unit has I
been designed which is equally applicable to all three receivers. By means of a step-down transformer this unit supplies the 12 volts necessary for the filament circuit of the indirectly heated valves. It also includes a full-wave rectifier valve of the micromesh type, with the necessary smoothing filter which furnishes the plate supply at 1 30 volts d-c. The power supply unit will function from a-c. mains having voltages from
z 20 0
1 10 to 250 volts and a periodicity from 40 to
� :l z w � !(
30
40 -10
" 2 - II 85
-s o +s + 10 KILOCYCLES OFF RESONANCE
60 cycles per second. Figure 7-Selectivity Curve of R.M.8 Receiver.
www.americanradiohistory.com

Radio Equipment for Aircraft
By D. B. MIRK, H. M. SAMUELSON and W. BOND
Standard Telephones and Cables, Limited
THE demand for increased communication f�cilities is �e�rd on all sides. The funct10n of rad10 m the fulfilment of
this demand is in many cases a more economical alternative to land lines or cables, but in some cases it is the only possible means of communication, such as with ships at sea and with aircraft. In these services it is used not only as a means of communication in the accepted sense of the word, but it is probably also the most satisfactory means of navigation under adverse weather conditions. It may be said that radio is essential for the regularity of marine and air services and the safety of personnel .
Radio has been used as a means of communication with aircraft for some years now, but recent advances in the radio art have considerably extended its scope. At the same time, the rapid development of aviation in the last few years has further emphasised the necessity of the application of modern radio technique to the solution of its communication and navigation problems.
Before commencing the design of a range of radio equipments to meet this need a thorough investigation was made of the existing methods and requirements of aviation radio services. It should be of interest to summarise the results of this investigation so that a clear idea can be obtained of the various requirements which must be fulfilled. The investigation almost naturally divided itself into the two main sections of (1 ) Civil Aviation , and (2) Military and Naval Aviation.
Civil Aviation
It should be noted that although this study is based on European practice as regards technique, the underlying requirements for satisfactory radio communication for civil aviation are practically universal .
At present the radio services are used for navigational purposes and not, in general, as a
means of telephonic or telegraphic communication for passengers.
There are three types of Civil Aviation activities for which radio is required on aircraft : (a) on the main trunk routes, (b) on the feeder routes, and (c) for special charter and private use. At the present time only a small minority of European special charter and private aircraft owners have radio equipment installed in their machines and its use is mainly confined to occasions when the aircraft is flying over a regular air route with its corresponding ground organisation. However, this case is worth-while considering since it seems rational that the safety of such aircraft should be considered equally with the others, and the demand for radio facilities in connection therewith is definitely increasing.
(a) AIRCRAFT ON MAIN TRUNK ROUTES
By international convention all aircraft carrying ten or more passengers on a scheduled air route must carry radio transmitting and receiving apparatus. An exception is made where the carrying of the equipment would be superfluous owing to lack of a ground radio organisation. The majority of aircraft operating over such routes carry a second officer, and it is usual for him to be a qualified radio operator and navigator.
Two-way air-to-ground communication is carried on within the 850-950 metre wavelength band. At the ground stations a continuous watch is kept on 900 metres, the aircraft calling wave, but once communication has been established, traffic is generally switched over to 870 or 930 metres in order to a void congestion. Since in Europe there is usually a qualified radio operator on board the multi-seater aircraft, continuous wave telegraphy is employed for communication. The employment of telephony is dying out owing to the increasing traffic on 900 metres, but it is often used by the pilot when within a comparatively short distance of his terminal aero-
76
www.americanradiohistory.com
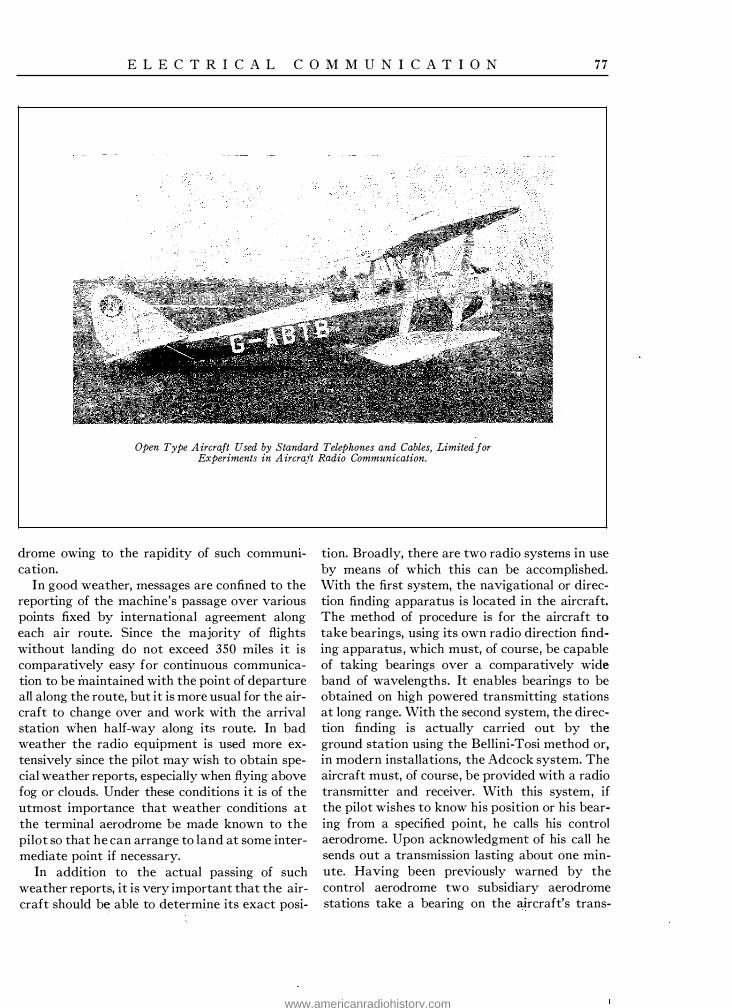
E L E C T R I C A L C O M M U N I C A T I O N 77
Open Type Aircraft Used by Standard Telephones and Cables, Limited for Experiments in Aircraft Radio Communication.
drome owing to the rapidity of such commumcation.
In good weather, messages are confined to the reporting of the machine's passage over various points fixed by international agreement along each air route. Since the majority of flights without landing do not exceed 350 miles it is comparatively easy for continuous communication to be maintained with the point of departure all along the route, but it is more usual for the aircraft to change over and work with the arrival station when half-way along its route. In bad weather the radio equipment is used more extensively since the pilot may wish to obtain special weather reports, especially when flying above fog or clouds. Under these conditions it is of the utmost importance that weather conditions at the terminal aerodrome be made known to the pilot so that he can arrange to land at some intermediate point if necessary.
In addition to the actual passing of such weather reports, it is very important that the aircraft should b� able to determine its exact posi-
tion. Broadly, there are two radio systems in use by means of which this can be accomplished. With the first system, the navigational or direction finding apparatus is located in the aircraft. The method of procedure is for the aircraft to take bearings, using its own radio direction finding apparatus , which must, of course, be capable of taking bearings over a comparatively wide band of wavelengths. It enables bearings to be obtained on high powered transmitting stations at long range. With the second system, the direction finding is actually carried out by the ground station using the Bellini-Tosi method or, in modern installations, the Adcock system. The aircraft must, of course, be provided with a radio transmitter and receiver. With this system, if the pilot wishes to know his position or his bearing from a specified point, he calls his control aerodrome. Upon acknowledgment of his call he sends out a transmission lasting about one minute. Having been previously warned by the control aerodrome two subsidiary aerodrome stations take a bearing on the aircraft's trans-
www.americanradiohistory.com

78 E L E C T R I C A L C O M M U N I C A T I O N
A.TR4 Equipment Installed in Small Private Aircraft.
mission and send the results to the control aerodrome where the actual bearings are plotted out on a map, the point of intersection obtained being the actual position of the aircraft at the time of transmission . The result is then transmitted back to the aircraft. The time elapsing between the aircraft's first call and the result given is usually under two minutes . The wavelengths used for this communication are in the 850-950 band. This is the system which is in general use at the present time on European trunk routes . Its principal advantages are that no special equipment is required in the aircraft, no special skill is required on the part of the aircraft operator, and it has a relatively long range. The disadvantages are that the ground station can handle only one aircraft at a time, and to be universally useful in giving the actual position of the aircraft it is necessary to have a network of ground stations located along the route where it is required.
The above two systems enable the aircraft to
find its actual position and, from this information in conjunction with maps, to plot its course.
In many cases it is not possible to employ either of the above systems due to the lack of direction finding apparatus on the aircraft or on the ground. However, it is possible to give the aircraft the course which it should follow, without indicating its actual position. There are two general systems in use :
The Hominz System-This consists essentially of a radio receiver located in the aircraft with a device which indicates to the pilot the direction of the radio transmitting station at the aerodrome to which he is flying. Its principal advantage is that as the apparatus is on the aircraft itself, any number .of machines can "Home" on the same transmitter simultaneously, and that the apparatus is very simple to operate. Its disadvantage, since the signal is transmitted from the station in all directions, is that the aircraft will approach the transmitting station on a course depending upon the wind rather than on a straight line.
The Beacon System-With this system the signal is projected in the form of a beacon or ray along the trunk route. The aircraft is equipped with a radio receiver which indicates visually or orally to the pilot immediately he deviates from the beam. Its advantage is its simultaneous availability to any number of aircraft and the direct indication given to the pilot immediately he goes off his course.
(b) AIRCRAFT ON THE FEEDER ROUTES
For the smaller type of passenger machines on feeder routes, or for freight and mail aircraft, where only one pilot is carried, the above practice still holds good. The only alteration is on the equipment side, which is modified in accordance with the nature of the aircraft services. Since the pilot generally has to work the equipment, telephony is favoured, and often the equipment must be remotely controlled if there is no space for it alongside the pilot. Within range of main aerodromes full use can be made of the direction finding facilities available for the regular trunk routes and the procedure is exactly the same. The Homing and Beacon systems are of particular interest for this service.
www.americanradiohistory.com

E L E C T R I C A L C O M M U N I C A T I O N
r - - - -- - - - - -1 I I I I I I I I
... JJ
I :-
I ,-t--+------tt·---t--..;;w.t<>-· I
. 'i·"
--i----1 IM<• ·�91 4 lf'§i ;
11:1, 3. ·:I· t
----------------J--"'"::;<W��� !::1�: •OOO� I
PH � C�OSE.0 FO' TE;1..f;Pt-tOHy MC W· C�OSEO F'Oi::l M00U�AT£0 TEi..eGIC:'At.Pl-t'r' R - c.i..os�o F"OR R t;;CEl\/INC T �osc:o F'CR T�ArJS .... 1TT1l"•.C:i
1 ... r-rc-.-.::,-.,.,.- ''"';l;---.N"""I-= I
I ;1 ; I � I I ·II ·�·- • •• - ·
I •
L __ _ _ _ _ _ _ _ _ _ _ _ _ _ _ _ _ _ _ ___.
Circuit Schematic of A TRJ Equipment.
79
www.americanradiohistory.com

80 E L E C T R I C A L C O M M U N I C A T I O N
(c) SPECIAL CHARTER AND PRIVATE AIRCRAFT
Within the last few years the commercial use of aircraft has expanded considerably by their employment on special flights. The transport of newspaper special correspondents with press photographs, and the chartering of aircraft by business men represents no small proportion of the amount of civil flying carried out annually. The number of privately owned aircraft also is increasing at a very rapid rate .
Several air transport companies specialise in special charter work, and have available fast three or four seater aircraft. It is recognised that radio equipment is indispensable for the safe operation of the machine which often covers greater distances than the larger regular air transport types, and quite a number of these special charter aircraft are fitted with radio apparatus. Since the pilot is generally the only member of the crew, telephony transmission and reception is necessary. This is especially the case in Great Britain where an exclusive wavelength of 862 metres has been allotted to radio telephony traffic on internal air routes and for communication by telephony with Croydon on the continental routes.
The same facilities for navigational assistance are required as for "Aircraft on the Feeder Routes."
ALLOCATION OF WAVELENGTHS FOR CIVIL
AVIATION
Mention has been made above of the aircraft radio traffic being conducted between 850 and 950 metres. This was originally fixed by international convention and is still adhered to by practically every country in Europe. In spite of the congestion encountered, owing to so much traffic within a comparatively narrow band of frequencies, it is likely that the present system will be retained for a long time. The reasons for this are : first, that a complete change-over to other frequencies would render obsolete all the existing aircraft and ground equipments (the expense of replacement would be tremendous) ; second, that up to the present the current methods of direction finding, whether on the ground or in the air, operate accurately only at wavelengths approximately above 700 metres.
With the expansion of air routes outside of Europe, however, a definite need has arisen for
radio operation within the 40-120 metre wavelength band. One of the principal reasons therefor is that on such routes as the Australian or African airways, the atmospheric disturbances on medium wavelengths render communication impossible for a large period of the day ; the shorter wavelengths of 40-80 metres are not so badly affected. Furthermore, the greater distances covered between aerodromes have demanded much longer ranges from the radio equipment as compared with the European routes. Consequently, the combined wavelength set has been adopted on these long distance airways since, for the European portion of the air route, the medium-wave operation is used and, on the longer stretches over tropical countries, shortwave transmission and reception is employed.
Military Aviation
The full ramifications of military and naval aviation cannot be described here, but some general observations are given in connection with two types of service where radio communication is vital , viz . , Fighter Aircraft and Reconnaissance Aircraft. Naturally each country has its own ideas on the function and operation of these two services but the broad outlines remain the same in each case, and are briefly described.
Fighter A ircraft-This type of machine is almost invariably a single seater whose operation demands all the concentration of the pilot on his multifarious duties. For this reason radio communication must essentially be effected by telephony. The functions of the fighter aircraft are to intercept and destroy enemy machines so that information is required as to the whereabouts of hostile formations ; and, once contact has been made, communication between the leader of the fighter formation and his subordinates is needed since modern fighting tactics call for a group of such machines to operate as one unit. Obviously, trailing aerials cannot be permitted for fighter aircraft. Furthermore, since many telephonic communication channels are required, shortwave transmission and reception is universally employed. Very often, one wavelength is used for two-way communication with the ground, and another wavelength for intercommunication between aircraft. The wavelength band used is 40-120 metres. Quite a common practice is for a
www.americanradiohistory.com

E L E C T R I C A L C O M M U N I C A T I O N 81
Cabin Type Aircraft Used by Standard Telephones and Cables, J:imited for Experiments in Aircraft Radio Communication
squadron to take off on patrol , the squadron leader keeping in touch with his ground station until the latter advises him of the whereabouts of enemy aircraft. When within sight of his opponents, the squadron leader switches over to his other wavelength for communicating his tactical instructions to the rest of the squadron. Sometimes only the aircraft of the squadron leader and the sub-formation leaders have transmitters and receivers fitted, the remaining units of the squadron merely being able to receive, but it is recognised that two-way communication for all units is an undoubted asset.
Reconnaissance Aircraft-The functions of such aircraft (sometimes called "Army Cooperation Aircraft") is to transmit information of military value back to divisional and corps headquarters, often over a long distance. A subdivision of their duties is to observe targets for the artillery, usually over a comparatively short range. The type of radio equipment used, therefore, will depend upon the exact service on which the aircraft is engaged, but for the purpose of
these notes medium and long range reconnaissance only will be considered. The aircraft employed on these duties are always two or three seater type, and the radio equipment is usually operated by the observer but, in general , a duplicate set of operating apparatus including a telegraph key and telephones is provided for the pilot's use. At present medium wavelengths (500-1500 metres) are used, necessitating the employment of a trailing antenna for long distance communication . It may seem surprising that shorter wavelengths are not used, but the "Skip" distance effect has been one deterrent, the other being economic, since the existing communication system has been built up on the older technique, and the cost of a complete new short-wave system is very considerable. However, it seems that the ideal type of radio equipment for this service is combined medium and short-wave. Telegraph transmission and reception is most often employed on reconnaissance duties, continuous wave operation being the most popular on the score of selectivity and range. Whilst the fullest
www.americanradiohistory.com

82 E L E C T R I C A L C O M M U N I C A T I O N
possible navigational assistance is desirable in military and naval aviation, up to the present it has not been found practical to carry more than the simplest form of "Homing" device. This is because the direction finding must be done in the aircraft as any transmitted signal is liable to give away the position of the aircraft to the enemy.
Equipments Developed
The above survey gives some indication as to the requirements which the radio equipment has to meet for the various services outlined. Actually seven distinct types have been developed, several of them being adaptations of prototypes ; as, for example, the splitting up of a combined long and short-wave transmitter into a self-contained longwave or short-wave model .
The salient features of the various types are listed below :
The ATR2 equipment is available as a separate medium-wave equipment (Type ATR4) and a short-wave equipment (Type ATR5) , respectively. Similarly, the ATR6 equipment is available as a medium-wave equipment (Type ATR7) or short-wave (Type ATRS) . The change merely involves the removal of the short-wave or medium-wave tuning unit of the transmitter, as the case may be. One type of receiver only is used for all the equipments, whether medium-wave or short-wave operation, or both, is required. Similarly, many other pieces of apparatus are com-
mon to several equipments, such as filter units, remote controls, etc. This standardisation considerably facilitates the operation and servicing of the equipment, and also gives great flexibility when expanding an existing radio communication system.
Manufacture-If a radio transmitter or receiver is to be fitted to any Civil Aircraft registered in Great Britain, the design and manufacture of all component parts is subject to very stringent regulations issued by the British Air Ministry. These regulations cover approval of the circuit design, of the materials used in manufacture, and of the actual equipment under test. When a radio equipment has been accepted it is then listed by the British Air Ministry as an approved design in their official Hand Book of Air-Worthiness.
Before embarking on their development and manufacturing programme, Standard Telephones and Cables, Limited decided that all of its radio equipments for aircraft, irrespective of the services for which they were designed, should fulfill these regulations and specifications, thus setting a hall-mark on the company's products.
If a manufacturing firm is considered by the British Air Ministry to be of sufficient standing, they may be allowed to furnish a certificate on their own responsibility indicating that their designs are in accordance with the regulations. Such firms are known as "Approved Designers"
Type WL Aerial Power Weight Notes
ATR2 40/80 500/1000 20w 87 lbs. Telephony C.W. or M.C.W. Telegraphy
ATR3 40/120 20w 77 lbs. Telephony C.W. or M.C.W. Telegraphy
ATR4 500/1000 or 1000/1800 20w 74 lbs. Telephony C.W. or M.C.W. Telegraphy
ATRS 30/60 or 40/80 20w 75 lbs. Telephony C.W. or M.C.W. Telegraphy
ATR6 30/60 or 40/80 or 70w 105 lbs. Telephony C.W. or M.C.W. 550/1100 (Aerial power on telephony 20w)
ATR7 550/1 100 70w 98 lbs. Telephony C.W. or M.C.W. (Aerial power on telephony 20w)
ATR8 30/60 or 70w 98 lbs. Telephony C.W. or M.C.W. 40/80 or (Aerial power on telephony 20w) 90/180
www.americanradiohistory.com
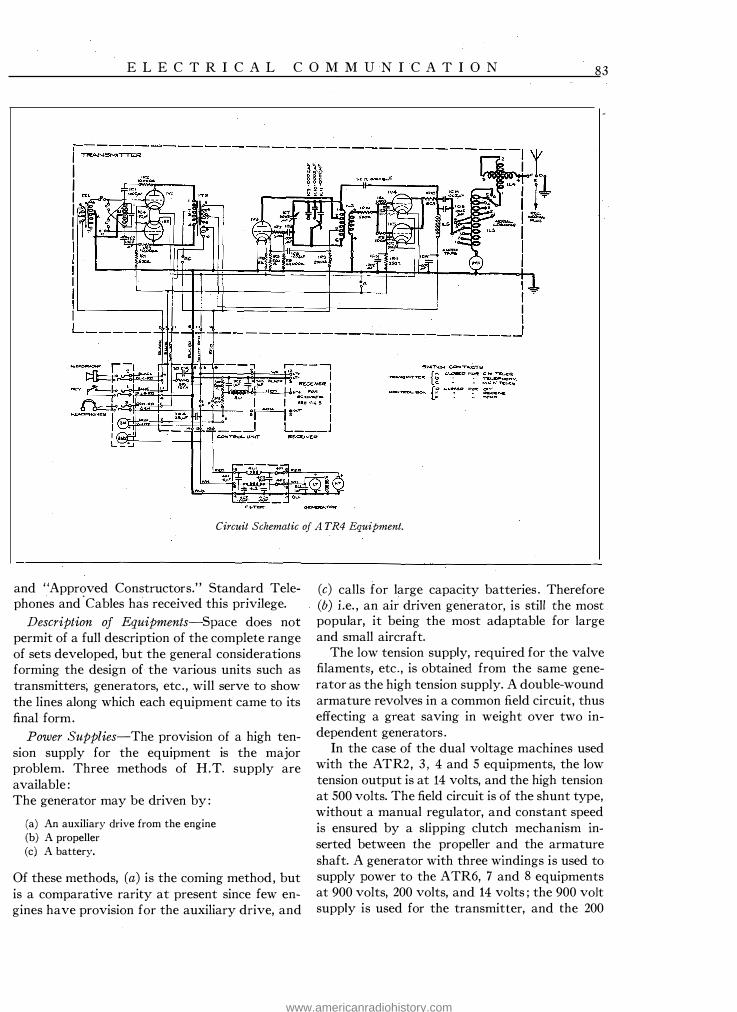
E L E C T R I C A L C O M M U N I C A T I O N 83
1�,,:;;-�:---------------------------:-1 I I I I I · I · I I I I I I l "'?" I L---���� I I I L----- ���� · -- ---- --------- --------�
Circuit Schematic of A TR4 Equipment.
and "Approved Constructors." Standard Telephones and
· Cables has received this privilege.
Description of Equipments-Space does not permit of a full description of the complete range of sets developed, but the general considerations forming the design of the various units such as transmitters, generators, etc . , will serve to show the lines along which each equipment came to its final form.
Power Supplies-The provision of a high tension supply for the equipment is the major problem. Three methods of H.T. supply are available : The generator may be driven by :
(a) An auxiliary drive from the engine (b) A propeller (c) A battery.
Of these methods, (a) is the coming method, but is a comparative rarity at present since few engines have provision for the auxiliary drive, and
(c) calls for large capacity batteries . Therefore (b) i .e. , an air driven generator, is still the most popular, it being the most adaptable for large and small aircraft.
The low tension supply, required for the valve filaments, etc. , is obtained from the same generator as the high tension supply. A double-wound armature revolves in a common field circuit, thus effecting a great saving in weight over two independent generators .
In the case of the dual voltage machines used with the ATR2 , 3 , 4 and 5 equipments, the low tension output is at 14 volts, and the high tension at 500 volts. The field circuit is of the shunt type, without a manual regulator, and constant speed is ensured by a slipping clutch mechanism inserted between the propeller and the armature shaft. A generator with three windings is used to supply power to the ATR6, 7 and 8 equipments at 900 volts, 200 volts, and 14 volts ; the 900 volt supply is used for the transmitter, and the 200
www.americanradiohistory.com

84 E L E C T R I C A L C O M M U N I C A T I O N
A TR6 Transmitter.
volt supply for the receiver. In cases where navigation lights are fitted to the aeroplane, the low tension output of the radio generator can be used to charge the aircraft lighting battery through a lighting control box, cut-out, etc. , in the usual manner. This feature has proved popular with both aircraft constructors and operators, since the weight, head resistance, and cost of a separate charging generator are avoided.
In the larger types of aeroplanes a comparatively large low voltage power supply is often available from a battery with its associated charging generator for navigation lights, cabin lights, etc. As an alternative to the air driven dual voltage generator system, therefore, all the Standard aircraft radio sets have been designed to be capable of operation also from a rotary transformer (dynamotor) power supply system. This practice avoids the necessity of duplicating generators. The aircraft power supply usually consists of a 12 or 24 volt air driven generator of about 500 watts output, arranged to charge a battery which is normally "floating" when the aircraft is in flight. The battery is used to drive the rotary transformer for supplying the required high tension power to the transmitter whilst the filaments of both transmitter and receiver are heated directly from the battery. The latter must of necessity be of adequate capacity for the added load since, for an output of 300 milliamperes at
500 volts (as required for the ATR2 , 3 , 4 and 5 equipments) , an input of some 24 amperes at 12 volts must be taken to drive the rotary transformer. Two separate rotary transformers are used to supply power to the ATR6 , 7 and 8 equipments ; one rotary transformer supplies 200v. 30 m.a. to the receiver and draws 1 .5 amperes from the 12v. battery ; the other, a 900v. 300 m.a. transformer, supplies the transmitter and draws 40 amperes. It seems probable that this method of power supply will become more popular, since its adoption means that the radio set can be used after a forced landing and that the electrical and radio services of an aeroplane can be more closely allied than they are at present.
Filter Units-When planning the range of Standard aircraft radio sets it was decided that
Circuit Schematic of A TR6 Equipment.
www.americanradiohistory.com

E L E C T R I C A L C O M M U N I C A T I O N 85
all the radio equipments should be designed to be capable of operating directly from generators without the use of any high or low tension batteries. It was therefore necessary to make lengthy experiments to evolve suitable filter units to reproduce the steady voltage conditions obtainable from accumulators and dry batteries. This applied particularly to the receivers which, because of high gain, are very susceptible to electrical interference. The result of this work has shewn that a bad commutator ripple will produce transients throughout the whole of the audio frequency and radio frequency range. The audio frequency ripple does not cause serious trouble owing to the relatively low audio frequency gain used in the receiver, but the radio frequency ripple causes serious interferences as energy radiated from the machine leads is picked up directly by the aerial. Interference such as this is eliminated by :
(1) Designing the generators to have a low ripple. (2) Inserting high frequency filter circuits as close as
possible to the commutators of the generators. (3) Shielding the circuit up to and including the filter
circuit.
Two filter units have been developed, one for use with all the low powered and the other for use with the high powered radio equipments.
Transmitters-The range of transmitters developed may be broadly divided into two headings : (1) Those of about 20 watts aerial power (Types AT 2, 3 , 4 and 5) ; (2) those of about 70 watts aerial power (Types AT 6, 7 and 8) . The Standard Micromesh valve of about 20 watts output with its high amplification and low impedance proved ideal for use in the lower powered types of transmitters. By its incorporation it was possible to operate these equipments on the comparatively low anode voltage of 500 volts, to operate the modulator valve directly from the microphone, and to limit the number of valves required.
Some form of frequency control was considered essential both for military and civil aviation radio services and, therefore, a highly stable and shielded master oscillator circuit is to be found in all models. Although crystal control is desirable from the purely radio operating point of view on the shorter wavelengths, its adoption for equipments destined for military or naval avia-
tion service has not been thought to be desirable. The main reason for this is that under active service conditions rapid change of operating wavelength is called for, thus demanding an almost unlimited supply of crystals. Furthermore, the extra weight of the crystal circuit with its attendant heater and thermostat devices is a formidable addition to a small transmitter weighing only some 16 lbs. , intended either for civil or military use.
Five Standard Micromesh valves of similar type (No. 4033A) , with indirectly heated cathodes, are used in each low power transmitter, while in the high powered sets three 50 watt (No. 42 1 1D) valves are used.
The master oscillator valve drives two amplifier valves arranged in push-pull in the case of the short-wave transmitters, and in parallel for the long-wave transmitters. In the short-wave case the anode circuit is tuned by a variable condenser and the aerial coupled by a fixed coil with a variable number of turns . In the long-wave case the aerial capacity is used to tune the output circuit, fine tuning being effected with a variometer. The coarse adjustment is obtained by changing taps on the coil. Continuous wave telegraphy is effected by varying the bias of the power amplifier valves. In the case of the low powered sets, telephony is effected on the Heising principle by two further valves arranged in pushpull, as class B amplifiers, and driven directly from the microphone. Very good commercial quality speech can be obtained with 80% modulation. Modulated telegraphy is provided by making the modulator valves oscillate at 1 ,000 cycles and keying in the usual manner. This method of modulation has been found to give a
A TR2 Receiver.
www.americanradiohistory.com

86 E L E C T R I C A L C O M M U N I C A T I O N
note with a very small percentage harmonic content and therefore a note far more easy to read through severe atmospheric interference than that produced by the more usual type of interrupter disc on the generator shaft. Modulation is carried out in the higher power sets by grid control . The method using a valve as a grid leak was first tried but abandoned, owing to the low percentage modulation obtainable and the high voltage between cathode and heater of the modulator with its attendant risk of breakdown. The modulation transformer has now been placed in the grid circuit between the lower end of the drive coil and earth and driven through a 4033-A amplifier valve directly from the microphone. By maintaining the secondary impedance low relative to the minimum grid impedance, it has been possible to transmit very good quality speech with this circuit and to effect 1003 modulation. When using grid modulation the carrier power is dropped to one-quarter of the carrier power on C.W. but rises to the full value when 1003 modulated.
Receiver-The same type of receiver is used on both the high power and low power radio equipments. This receiver functions as a superheterodyne on short-waves, 30-80 metres, while on medium-waves the intermediate frequency amplifier is made variable over the range of 550-1 ,200 metres and acts as a straight circuit. When receiving long-waves the aerial is tapped on to the tuning coil through a very small condenser in order that a trailing aerial or a fixed aerial may not upset the ganging between this first tuned circuit and the next. Radio dust-cored coils are used in order to save space and to obtain highly selective circuits. The first amplifier valve is a radio frequency variable "mu" pentode. Volume control is carried out by varying the bias of this valve. Its output is coupled to the detector grid through a similar ganged tuned circuit. A leaky grid triode detector valve is used. Reaction is controlled by varying the H.T. supply to the detector, the coupling coils being fixed. This method gives an exceedingly smooth control of reaction as the receiver slides in and out of oscillation without a click or a trace of backlash. The detector is transformer-coupled to an audio frequency amplifier valve that is again a triode, while the output to headphones is
Transmitter and Receiver A ssembly of A TRJ Equipment.
taken through a second transformer . For short-wave reception the medium-wave
tuning control is set to approximately 660 metres and two more valves are switched into circuit. The first valve functions as a leaky grid detector, while the second is a beating oscillator. It was found from the point of view of simplicity and sensitivity, that the balanced triode detector, with the beating oscillator injected in the anode circuit, was the most satisfactory. The aerial circuit is ganged with the beating oscillator and is very lightly coupled to the aerial to prevent it from upsetting the ganging. When the receiver is required to be used as a short-wave set only,. the medium-wave tuning condenser is replaced by a small fixed condenser and the receiver left with only one tuning control . For medium-wave reception the circuit of the frequency changer is completely removed, and reception carried out on the three valve straight circuit.
The normal receiver has a wavelength of 30-80 metres and 500-1200 metres. When used with the ATR 3 equipment the range is increased to 40-
www.americanradiohistory.com

E L E C T R I C A L C O M M U N I C A T I O N 8 7
120 metres. The sensitivity of the receiver is such that on short-waves an input of approximately 40 microvolts will give a comfortable signal in the headphones . On medium-waves an input of approximately 800 microvolts gives a similar output. The undistorted output of the receiver is approximately 100 milliwatts.
Direction Finding Equipment-Direction Finding Equipment will form the subject of a paper which it is planned to publish in the not distant future.
Control Box-The control box is essentially a distribution point where the incoming power supply is distributed to the transmitter, receiver and .meter unit.
Remote Controls-All the equipments have been designed to provide facilities for operation by remote control . A four-lever unit is used in conjunction with Bowden wires to carry out the following :
(1) Select "OFF RECEIVE or SEND." (2) Medium-wave receiver tuning. (3) Reaction control. (4) Select C.W. PHONE or M.C.W. TRANSMISSION.
Short-wave receiver tuning i5 carried out by means of a geared flexible drive.
Microphones-Two types of microphones have been developed : (1) an insensitive close-talking microphone for use in commercial aircraft ; and, (2) a combined oxygen mask and microphone for use in fighter aircraft. As the noise in the cockpit of a military machine is usually of the order of plus 120 db. it will be realised that this noise must be excluded as the pilot could not possibly raise his voice to a higher level than this at the microphone. The capsule is let into a mask with a soft rubber edging that completely covers the pilot's nose and mouth. Two breather tubes are provided at the bottom ; these tubes also serve as an acoustic filter attenuating considerably high frequency noises that might otherwise get in through the holes. An electric heater is provided for these tubes as otherwise, at high altitudes, moisture from the pilot's breath might condense and freeze in the tubes. Oxygen is let in through another tube. The oxygen supply is, of course, under the pilot's control and may be turned on or off at will . The microphone goes with a specially designed helmet and goggles and is instantly detachable should the pilot have to leave the aircraft by parachute in an emergency.
Typical Military Installation-The requirements of a fighter aircraft are, minimum weight and size, two wavelengths working into a fixed aerial , operation by remote control , and minimum drag to be introduced by the equipment. Most high powered aero engines for military use now provide a drive for a charging generator as the head resistance and drag produced by a wind driven generator are a serious consideration when the aircraft is required to yield the maximum possible performance. A 500 watt, 15 volt, charging generator designed to have a constant voltage over a wide speed range charges the battery through a cut-out and switch box. The switch box provides facilities for switching the navigation lights, gun-heaters, wing tip flares, instrument lights, cockpit lights, and the supply to the radio equipment. If emergency working on the ground is required the battery is usually of 40 ampere hour capacity, but if the equipment is only for use in the air a 20 ampere hour battery is used. High tension supply is furnished by means of a rotary transformer running from the 12 volt battery. The high frequency filtering circuits are built into the rotary transformer unit, which is started by means of a relay controlled from the "OFF-RECEIVE-SEND" switch on the control box. The use of this relay saves taking the heavy low tension leads to the control box.
Generally there is a door in the side of the fuselage behind the pilot's cockpit giving access to a space with two runners fixed to the tubular steel framework into which the crate holding the transmitter, receiver, and control box can slide. The equipment can thus simply be slid into position, the power lead from the rotary transformer plugged into the control box, aerial and remote controls attached, and the equipment is ready for operation. The aerial lead is taken through a lead-in insulator to the tail fin where it branches to the wing tips. In the cockpit the pilot has under his control the electrical switch box, the four lever unit, and the receiver tuning control. He can transmit on any two wavelengths in the range 40-120 metres and receive on any wavelength. He can also transmit or receive continuous wave telegraphy, telephony, or modulated continuous wave telegraphy. Before him is located the meter unit for checking the performance of the equipment. The pilot's microphone,
www.americanradiohistory.com

88 E L E C T R I C A L C O M M U N I C A T I O N
telephones, and key all plug into the meter unit and are arranged so that, if the pilot has to make an emergency parachute descent, the microphone can be instantly pulled from his face. The headphones pull out automatically as the pilot climbs out of the cockpit.
The ATR 3 transmitter is designed for instantaneous selection in the air of any two wavelengths in the band from 40-120 metres. This is accomplished by having two independent master oscillator circuits and two independent amplifier circuits with means of mechanically switching from one to the other.
The transmitter is lined up on the ground for wavelength "A", by first setting the master oscillator condenser "A" to the required wavelength and then tuning the aerial circuit by the aerial condenser "A" until the aerial ammeter shews approximately two amperes. The transmitter is lined up in a similar manner on wavelength "B" and afterwards requires no adjustment. The change of aerial capacity when the plane is on the ground and when it is in the air is not sufficient to cause any appreciable change in output. The effective height of the fixed antenna employed, is approximately 2 metres. The receiver requires an input of 40 microvolts to give a reasonable tele-
phone signal. Reception may therefore be carried out down to field strengths of approximately 20 microvolts per metre. A ground transmitter with 300 watts in the aerial will give this field strength at a distance of approximately 100 miles at a height of 6,000 ft. ; and, on a wavelength of 45 metres, which is about the most efficient wavelength for fighter aircraft, the field strength of the transmitting station increases with height so that, as the aircraft rises, the range is correspondingly increased. The air-to-ground range varies in a similar manner with the height of the aircraft. The range can therefore only be specified for a given set of conditions. The aerial current is approximately two amperes on a wavelength of 45 metres, and the effective height of the aerial is 2 metres. At a height of 6,000 ft. , this can generally be. relied on to give a minimum field strength on the ground of 5 microvolts per metre at a distance of 100 miles. Two-way telephony is thus possible with the equipment up to a limiting distance of 100 miles.
The equipment as presented in table below is in the form of a general purpose military short-wave set for transmission and reception of C.W. and M.C.W. telegraphy as well as telephony. If only telephony is required, a corresponding reduc-
WEIGHT AND DIMENSIONS OF ATR3 EQUIPMENT WITH WIND D RIVEN GENERATOR
Width Height Depth Weight
(1) Transmitter . . . . . . . . . . . . . . . . . . . . . . . . . . . . . 15 m. 1 1 m . 6 ,Y:l in. 19 lbs.
(2) Receiver. . . . . . . . . . . . . . . . . . . . . . . . . . . . . . . . 13% " 7 " 6Ys " 14 lbs.
(3) Control Box . . . . . . . . . . . . . . . . . . . . . . . . . . . . . 7% " 6;!4 " 4 " 4 lbs. (Over cable gland)
(4) Dual Voltage Air Driven Generator with Clutch and Propeller . . . . . . . . . . . . . . . . . . . . 13,Y:l in. long (gen erator only) 22 lbs.
5 Ys " diameter
(5) H .F. Filter Unit . . . . . . . . . . . . . . . . . . . . . . . . . 4:\4 in. 7 m. 4;!4 " 2 lbs. 12 oz. (Over plug)
(6) Meter Unit . . . . . . . . . . . . . . . . . . . . . . . . . . . . . . 5 % " 3 % " 2 " 1 lb. 3 oz.
(7) Microphone and Telephones . . . . . . . . . . . . . . . 1 lb. 3 oz.
(8) Inter-Unit Wiring (Average) . . . . . . . . . . . . . . . 4 lbs.
(9) Remote Control System . . . . . . . . . . . . . . . . . . 5 lbs.
(10) Aerial System (Average) . . . . . . . . . . . . . . . . . . . 4 lbs.
Total weight of complete installation . . . 77 lbs. 2 oz.
www.americanradiohistory.com

E L E C T R I C A L C O M M U N I C A T I O N 89
Units of A TR4 Equipment.
tion in the overall weight is effected. Installation in a Light Plane-The light plane
owner requires a small compact radio set for use on the air routes where the wavelengths used are 850-950 metres. The ATR 4 equipment meets this need. A light passenger plane very seldom is equipped with an auxiliary drive for a generator and, as a large lighting battery is not carried, a wind driven dual voltage generator is used. This is usually mounted under the fuselage on a metal bracket. A metal braided four-core cable connects the generator to the high frequency filter unit which is located inside the fuselage but need not be in a very accessible spot. The transmitter, receiver, and control box are usually slung by elastic shock absorber cord from the roof of the bulkhead of the luggage compartment. A light cable is taken back to the pilot and the meter unit placed in his view. The "OFF, RECEIVE, SEND" switch, receiver tuning, reaction control, and type of transmission switch are controlled by Bowden cables from the pilot's seat. In this way the installation occupies very little space. The
aerial winch and fairlead have to be mounted close to the pilot as he has to release this and wind it in himself. If the machine is fitted with navigation lights fed from a battery, the dual voltage generator can be utilised for charging this battery.
Two hundred feet of wire is used for an aerial with the beaded type aerial weight, giving an effective height of 9 metres. This small effective height is due to the aerial trailing away to the horizontal when in flight. The equipment provides an aerial current of 1 .2 amperes and a field strength of 5 microvolts per metre at 200 miles. The limiting telephony range is thus 200 miles while the C.W. telegraphy range is approximately 500 miles.
The receiver requires an input of 800 microvolts to give a normal signal without the use of reaction. Since the effective height of the aerial is 9 metres, the required field strength is approximately 100 microvolts per metre on telephony and 10 microvolts per metre on C.W. telegraphy. This field strength is given by a 1 . kW. ground
www.americanradiohistory.com

90 E L E C T R I C A L C O M M U N I C A T I O N
station with 150 ft. masts at a distance of 200 in its base so as to allow its easy removal from the miles over the ordinary type of open country as machine. The transmitter and receiver are slung found in Europe. (See table below.) by shock absorber elastic from a vertical rack in
The ATR6 equipment is a combined wave- the operator's compartment. The equipment is length equipment providing transmission and designed for direct control and is located in a conreception on 30 - 1 20, or 550 - 1 , 100 metres, venient place for the operator. As in the low the change-over between these two wavelength powered equipment, provision is made for chargbands being effected instantaneously. Transmis- ing the aircraft lighting battery by taking two sion and reception is carried out on the trailing leads from the control box to the battery. The aerial on both wave bands but for short distance range of the ATR 6 equipment is such that a working a fixed aerial is also provided. The set is skilled operator making use of the medium and essentially intended to be handled by a radio short-wave features can guarantee to maintain operator using short-wave C.W. communication contact with some ground station no matter in over long distances and medium-wave telephone what part of the world he may be flying. communication over short distances. The receiver Interference from Ignition Systems-Reception has been left the same as that used with the low in aircraft is made difficult by two factors. The power equipments since the transmitting air-to- first is acoustic noise producing a very serious ground range on telephony has not been in- interfering effect with the wanted signal ; this, of creased on medium-waves ; there was, therefore, course, can be overcome to a certain extent by no point in increasing the medium-wave receiver using well fitting headphones and a good flying sensitivity. Long distance reception is done on helmet. The second is electrical interference from the short-wave side of the receiver which is some the ignition system. Each time a spark passes 26 db. more sensitive than the medium-wave between the plug points the circuit acts as a low portion. power radio transmitter and radiates energy from
The triple voltage generator is mounted under the plug leads ; this, of course, is picked up by the the fuselage and is connected to the high fre- receiving aerial and may cause serious trouble. quency filter unit by means of a nine-core Fortunately, there is a metal bulkhead behind shielded cable. The generator is fitted with a plug each engine in order to prevent fire risk and this,
WEIGHTS AND DIMENSIONS OF ATR4 EQUIPMENT
(1) Transmitter Type AT4 in Separate Case . . .
(2) Receiver Type AR2 in Separate Case . . . . . .
(3) Radio Control Box . . . . . . . . . . . . . . . . . . . . . . .
(4) Meter Unit . . . . . . . . . . . . . . . . . . . . . . . . . . . . .
(5) Dual Voltage Air Driven Generator with Clutch and Propeller . . . . . . . . . . . . . . . . . . . . .
(6) Filter Unit . . . . . . . . . . . . . . . . . . . . . . . . . . . . . .
(7) Microphone Telephones and Morse Key . . . .
(8) Aerial Winch, Wire Weight and Fairlead . . . .
(9) Inter-Unit Wiring (Average)
Total Weight . . . . . . . . . . . . . . . . . . . . . . . .
(10) 4 Lever Remote Control Unit . . . . . . . . . . . . .
Width
147,:l in.
13%" "
67,:l "
5 % "
13 Yz in. long (generator only) 7 in.
Height Depth
11 in. 8%: in. (over plug)
7 " SY, "
(over plug)
7 % " 4 in. (over cable
gland) 3% " 2 "
5 7§ in. dia.
47,:l " 4 in. (over plug)
I
Weight
1872 lbs.
14 lbs.
4 lbs.
1 7,:l lbs.
22 lbs.
2 % lbs.
2 lbs.
8 lbs.
3 lbs.
75Yz lbs.
2 7,:l lbs.
www.americanradiohistory.com

E L E C T R I C A L C O M M U N I C A T I O N 91
combined with the metal cowling placed round the engine for streamlining purposes, sometimes provides excellent shielding and eliminates the interference. In many cases, however, it is necessary to fit shielded magnetos (that is, magnetos with metal covers in place of the usual bakelite moulding over the distributor) and metal braided leads from the magneto to the sparking plugs and the switches. It is not usually necessary to fit screened plug caps on to the sparking plugs, but on certain types of aircraft even this has to be done. It is usual to get more interference from an engine in the nose of a machine than from engines in the leading edge of the wing, owing to the close proximity of this engine to the radio equipment.
The present rapid growth of air transport indicates a further great expansion in the nexl decade. Since radio provides the only method of communication , this art must necessarily expand with the activities of flying. At present the communication of messages has reached a high degree of reliability but the application of radio to direction finding is capable of very great improvement.
The problem of the provision of suitable apparatus to enable aircraft to land under conditions of bad visibility is one which still requires much investigation, but it is generally felt that radio will provide the solution.
www.americanradiohistory.com

Recent Telecommunication Developments of Interest
THE 6.25 kW. relay broadcast transmitter shown in the accompanying illustration is one
of a series of 4 (three 1 .25 kW. and one 6.25 kW.) relay broadcasters installed at Nyiregyhaza, Pees, Miskolz and Magyaravar by the Standard Electric Company, Budapest, in cooperation with The Royal Hungarian Postal Administration to ensure that those localities remote from the 120 kW. transmitter at Budapest receive the programmes transmitted by Budapest at adequate signal strength.
A feature of these equipments is their complete automatic operation from a distance. After the closing of the starting circuit at the control point, which may be at a distance of anything up to 40 km. , the whole sequence of oi::erations
is automatic, including signals indicating to the control point that the operating sequence has started and, finally, that the antenna current is within the limits specified.
Except for the water circulating pump in the 6.25 kW. equipment, no rotating machines are employed in any of the stations, the whole of the supplies being obtained from rectifiers . For the supplies up to 1 ,000 volts, dry metal rectifiers are employed, while for the higher tensions, use is made of Hot Cathode Mercury Vapour Rectifiers.
With each equipment a completely mainsoperated line amplifier is employed.
The equipments are designed to give the highest quality reprcduction of si::eech ar:d music.
6.25 k W. Relay Broadcast Transmitter
92
www.americanradiohistory.com

E L E C T R I C A L C O M M U N I C A T I O N 93
JN the paper " 'Standard' High Power Broad-casting Transmitters at Budapest and Kalund
borg," published in the April, 1934 issue of Electrical Communication, illustrative reference was made to the 120 kW. vacuum tube. This tube is unique in a number of features, notably in its high power capacity as a permanently sealed tube and its high factors of safety. Since it is subjected to a 60% overload test before being passed as satisfactory, each tube, during the test, gives an output as an oscillator of 200 kW. at 25 ,000 volt anode tension, thus giving evidence of reliability and long life in normal service. In addition, the tube is constructed to close manufacturing limits, ensuring uniformity of product and consistency in operation. These features, combined with robust design, permit the 120 kW. tube to be treated like ordinary high tension gear in electric power plants, and the broadcast transmission station itself has taken on a new form. Instead of the semi-laboratory appearance hitherto familiar, cubicle construction is employed for the power amplifiers on Standard broadcast transmitters.
The filament power employed in the 120 kW. tube is 5 .4 kW. ; the amplification factor is 38 ; the impedance is 2 ,000 ohms ; and the normal anode tension is 20,000 volts, thus assuring efficient operating conditions. The relatively small dimensions, light weight, sturdy construction and simplicity of mounting give confidence to operators in handling the tube. It is manu-
factured by Le Materiel Telephonique, Paris.
AUTOMATIC Long Distance Switching and National Dialing are making rapid progress
in Switzerland. In the April , 1934 issue of Electrical Communication this subject was discussed by Mr. E . Frey, Swiss Telephone and Telegraph Administration Engineer in charge of Basie, with particular reference to the toll service between Basie and Zurich. The change from manual to automatic working will be completed in four steps as follows :
1. Basie City to Zurich City . . . . . . . . . In service 2. Basie City to Zurich rural area . . . . In service 3. Basie rural area to Zurich City and
rural area . . . . . . . . . . . . . . . . . . . . . . . In partial service 4. Zurich rural area to Basie City and
rural area . . . . . . . . . . . . . . . . . . . . . . . Being studied
When the Basie-Zurich plan is completely realised, over 100,000 lines of rotary automatic equipment installed in 124 different exchanges will have the facility of full automatic interconnection. The two most distant exchanges will be over 100 km. apart, and the area covered will exceed 1 ,500 sq. km. The success of this innovation is proved by the subscribers' preference for the new method and the Administration's report of increased revenue.
Service between Geneva and Lausanne is scheduled for July, 1934, and plans for further extensions in Zurich, Berne and Lucerne are being studied.
www.americanradiohistory.com

94 E L E C T R I C A L C O M M U N I C A T I O N
Telephone and Telegraph Statistics of the World Compiled by Chief Statistician's Division, American Telephone and Telegraph Company
Telephone Development of the World, by Countries January I, 1933
CouNTRit:s
NORTH AMERICA: United States . . . . . . . . . . . . . . . . . . . . . Canada . . . . . . . . . . . . . . . . . . . . . . . . . . . · · · Central America . . . . . . . Mexico . . . . . . . . . West Indies:
Cuba . . . . . . . . . . . . . . . . . . . . Porto Rico . . . . . . . . . . . . . . .
Other W. I. Places . . . . . . . . . . Other No. Am. Places . . . . . . . . . . . . . . . . . . . . . . . . . . . . .
Total . . . . . . . . . . . . . . . . . . . . . . . . . . . . . . . . . . SOUTH AMERICA:
Argentina . . . . . . . . . . . . . . . . . . . . . . . . . . . . . . . . . . . . . . . . . Bolivia . . . . . . . . . . . . . . . . . . . . . . . . . . . . . . . . . . . . . . Brazil . . . . . . . . . . . . . . . . . . . . . . . . . . . . . . . . . . . . . . . . . . . . Chile . . . . . . . . . . . . . . . . . . . . . . . . . . . . . . . . . . . . . . . . . . . . . Colombia . . . . . . . . . . . . . . . . . . . . . . . . . . . . . . . . . . Ecuador . . . . . . . . . . . . . . . . . . . . . . . . . . . . . . . . . . . . . . . . Paraguay . . . . . . . . . . . . . . . . . . . . . . . . . . . . . . . . . . . . . . . . . Peru . . . . . . . . . . . . . . . . . . . . . . . . . . . . . . . . . . . . . . . . . . . . . Uruguay . . . . . . . . . . . . . . . . . . . . . . . . . . . . . . . . . . . . . . . . . . Venezuela . . . . . . . . . . . . . . . . . . . . . . . . . . . . . . . . . Other So. Am. Places . . . . . . . . . . . . . . . . . . . . . . . . . . .
Total . . . . . . . . . . . . . . . . . . . . . . . . . . . . . . . .
EUROPE: Austria . . . . . . . . . . . . . . . . . . . . . . . . . . . . . . . . . . . . . . . . . Belgium**· . . . . . . . . . . . . . . . . . . . . . . . . . . . . . . . . . . . . . . . Bulgaria . . . . . . . . . . . . . . . . . . Czechoslovakia . . . . . . . . . . . . . Denmark# . . . . . . . . . . . . . . . . . . . . . . . . . Finland . . . . . . . . . . . . . . . . . .
����:nyif : : : : : : : : : : : : : : : : : : : . . . . . . , . . . . . . . Great Britain & No. Ireland . . . . . . . . . . . . Greece . . . . . . . . . . . . . . . . . . . . . . . . . . . . . . . . . . . . Hungary . . . . . . . . . . . . . . . . . . . . . Irish Free State# . . . . . . . . . . . . . . . . . . . . . . Italy* . . . . . . . . . . . . . . . . . . . . . . . . . . . . . Jugo-Slavia . . . . . . . . . . . . . . . . . . . . Latvia# . . . . . . . . Netherlands . . . . . . . . . . . . . . . . . . . . . . . . . . Norway* . . . . . ·. . . . . . . . . . . . . . . . . . . . . . . . . Poland . . . . . . . . . . . . . . . . . . . . . . . . . . . . . . . . . . . . . . . . . . Portugal . . . . . . . . . . . . . . . . . . . . . . . . . . . . . . . . . . . . . . . . . . Roumania . . . . . . . . . . . . . . . . . . . . . . . . . . . . . . . . . . . . . . . . Russia I[ . . . . . . . . . . . . . . . . . . . . . . . . . . . . . . . . . . . . . . . . . . Spain . . . . . . . . . . . . . . . . . . . . . . . . . . . . . . . . . . . . . . . . . . . . Sweden . . . . . . . . . . . . . . . . . . . . . . . . . . . . . . . . . . . . . . . . . . . Switzerland . . . . . . . . . . . . . . . . . . . . . . . . . . . . . . . . . Other Places in Europe . . . . . . . . . . . . . . . . . . . . . .
Total . . . . . . . . . . . . . . . . . . . .
ASIA: British India# . . . . . . . . . . . . . . . . . . . . . . . . . . . . . . . . . . . f :��;:#: : : : : : : : : : : : : : : : : : : : : . . . . . . . : : : : : : : : : : : : : : : Other Places in Asia . . . . . . . .
Total . . . . . . . . . . . . . . . . . . . . . . . . . . . . . . . . . .
AFRICA: Egyp t . . . . . . . . . . . . . . . . . . . . . . . . . . . . Union of South Africa# . . . . . . . Other Places in Africa . . . . . . . . .
Total . . . . . . . . . . . OCEANIA:
Australia* . . . . . . . . . . . . . . . . . . . . . . . Dutch East Indies . . . . . . . . . . . . . . . . . . . . . . . . . . Hawaii . . . . . . . . . . . . . . . . . . . . . . . . . . New Zealand# . . . . . . . . . . . . . . Philippine Islands . . . . . . . . . . . Other Places in Oceania . . . . .
Total . . . . .
TOTAL WORLD . . . . . . . . . . . . . . . . . . . . . . . . . . . . . .
NUMBER OF TELEPHONES Government Private
Systems Companies
205.711 1 1,175
1,427
485 537
7,101
226,436
700
2,500 3,000
600 2,770
9,570
239.495 299,947
19,646 148,366
15.803 1,651
1,292.254 2,960,401 2,146,409
110,565 32,642
46.112 58.809
332,858 1 19,683
95, 1 1 7 10,445
569 , 1 1 1
575,757 346,205 100,720
9,521,996
22, 109 72,000
965,390 153,708
1,213,207
45.489 116,360
95,647
257,496
484,626 39,750
151.757 6,000 3,401
685,534
1 1.914,239
17,424,406 1,055.534
14.167 98.677
44,087 1 1 ,337 13,695 1 1 ,379
18,673.282
318,331 2,018
169.693 44,414 28,652
3.275 2.601
15.279 29,378 22,000
635,641
9,914
19,530 340.770 133,000
17,299 720
467,066 744
78.000 88,850 33,086 5 1 , 191
280.942 1,524
12,583
1.535,219
35,183 75.000
19,398
129,581
1.198
1 ,198
3,657 24.206
3,803 20.516
228
52,410
21,027,331
* June 30, 1932. ** Febrnary 28, 1933. # March 3 1 , 1933.
Total
17 .424,406 § § 1.261 .245
25,342 100,104
44.572 1 1 ,874 20,796 1 1 ,379
18,899,718
318,331 2,018
170,393 44,414 3 1 , 152
6,275 2,601
15.279 29,378 22,600
2,770
645,211
239,495 309,861
19.646 167,896 356,573 134,65 1
1 , 292.254 2.960,401 2,146.409
17,299 1 1 1 ,285
32.642 467,066
46,856 58,809
332.858 197.683 183,967
43,531 5 1 ,191
569,11 1 280,942 577,281 346,205 113,303
1 1,05 7.215
57,292 147.000 965,390 173,106
1,342,788
45,489 116,360
96.845
258,694
484,626 43,407 24,206
155,560 26,516
3,629
737,944
32,941,570§
Per Cent of Total
World
52.89% 3.83%
.08%
.30%
.14%
.04%
.06%
.03%
57.37%
.96%
.01% .52% .13% .09% .02% .01% .05% .09% .07% .01%
1.96%
.73% .94% .06% .51%
1.08% .41%
3.92% 8.99% 6.52%
.05%
.34%
.10% 1.42%
.14%
. 18% 1.01%
.60%
.56% .13% . 16%
1.73% .85%
1.75% 1.05%
.34%
33.57%
.17%
.45% 2.93%
.53%
4.08%
.14%
.35%
.29%
.78%
1.47% .13% .08% .47% .08% .01%
2.24%
100.003
If U.S.S.R., including Siberia and Associated Republics. § Includes approximately 13,500,000 automatic or "Dial" telephones, of which about 50% are in the United States.
§ § As reported by the United States Department of Commerce, Bureau of the Census.
Telephones Per 100
Population
13.94 1 1 .98
0.39 0.62
1.13 0.74 0.31 3.14
1 1.01
2.74 0.06 0.39 1.02 0.34 0.25 0.30 0.24 1 .49 0.69 0.52
0.73
3.55 3.77 0.32 1.12 9.82 3.63 3.07 4.51 4.62 _, 0.26 1.26 1 . 1 1 1.10 0.33 3.04 4.07 6.96 0.57 0.64 0.28 0.34 1.21 9.33 8.43 1.37
2.01
0.02 0.03 1 .44 0.14
0. 13
0.22 1 .40 0.09
0.18
7.40 0.07 5.90
10.12 0.20 0. 16
0.84
1.61
www.americanradiohistory.com

E L E C T R I C A L C O M M U N I C A T I O N
Telephone and Telegraph Wire of the World, by Countries
January 1, 1933
95
MILES OF TELEPHONE WIRE MILES OF TELEGRAPH WIRE Service Per Cent Per Cent
COUNTRIES Operated By Number of Total Per 100 Number of Total Per 100 (See Note) of Miles World Population of Miles World Population
NORTH AMERICA: United States . . . . . . . . . . . . P. 87,678,000 58.333 70. 14 2,260,000 34.273 1.81 Canada . . . . . . . . . . . . . . . . . . . . . . . . . . . . . P.G. 5 ,089,000 3.383 48.33 366,000 5.553 3.48 Central America . . . . . . . . . . . . . . . . . . . . . P.G. 58,000 .043 0.88 20,000 .303 0.31 Mexico . . . . . . . . . . . . . . . . . . . . . . . . . . . . . P. 5 14,000 .343 3.01 85,000 1.293 0.50 West Indies:
Cuba . . . . . . . . . . . . . . . . . . . . . . . . . . . . . P. 298,000 .203 7.58 14,000 .213 0.36 Porto Rico . . . . . . . . . . . . . . . . . . . . . . . . P. 32,000 .023 1.99 1 ,000 .023 0.06
Other W. I. Places . . . . . . . . . . . . . . . . . . . P.G. 91,000 .063 1.38 5 ,500 .083 0.08 Other No. Am. Places . . . . . . . . . . . . . . . . P. 19,000 .013 5.25 1 1 ,000 .173 3.04
Total . . . . . . . . . . . . . . . . . . . . 9;l,779,000 62.383 �4.64 2 ,762,500 41.893 1.61
SOUTH AMERICA: Argentina . . . . . . . . . . . . . . . . . . . . . . . . . . . P. 1,175,000 .783 10.11 200,000 3.033 1.72 Bolivia . . . . . . . . . . . . . . . . . . . . . . . . . . . . . P. 5,500 .0043 0.17 5,000 .083 0.16 Brazil . . . . . . . . . . . . . . . . . . . . . . . . . . . . . . P. 640,000 .433 1.45 105,000 1.593 0.24 Chile . . . . . . . . . . . . . . . · · · · · · · · · · P. 200,000 .133 4.58 34,000 .513 0.78 Colombia . . . . . . . . . . . . . . . . . . . . . . . . . P. 74,000 .053 0.81 2 1,000 .323 0.23 Ecuador . . . . . . . . . . . . . . . . . . . . . . . . . . P.G. 6,000 .0043 0.24 4,000 .063 0.16 Paraguay . . . . . . . . . . . . . . . . . . . . . . . . . P. 3,000 .0023 0.34 2,500 .043 0.28 Peru . . . . . . . . . . . . . . . . . . . . . . . . . P. 47,000 .033 0.74 13,000 .203 0.20 Uruguay . . . . . . . . . . . . . . . . . . . . . . . . . . . . P. 47,000 .033 2.39 7,500 . 1 1 3 0.38 Venezuela . . . . . . . . . . . . . . . . . . . . . . . . . . P. 60,000 .043 1.83 7,000 . 1 1 3 0.21 Other So. Am. Places . . . . . . . . . . . . . . . . G. 5 ,500 .0043 1.04 500 .013 0.15
Total . . . . . . . . . . . . . . . . . . . . 2,263 ,000 1.5 1 3 2.58 399,500 6.063 0.45
EUROPE: Austria . . . . . . . . . . . . . . . . . . . . . . . . . . . . . G. 731 ,000 .493 10.85 48,000 .733 0.71 Belgium**· . . . . . . . . . . . . . . . . . . . . . . . . . G. 1,617,000 I 1.083 19.67 32,000 .49% 0.39 Bulgaria . . . . . . . . . . . . . . . . . . . . . . . . . . . . G. 65 ,000 .043 1.07 8,000 .123 0.13 Czechoslovakia . . . . . . . . . . . . . . . . . . . . . . P.G. 556,000 .373 3.71 82,000 1.243 0.55 Denmark# . . . . . . . . . . . . . . . . . . . . . . . . . . P. 1,143,000 .76% 31.49 11,000 .173 0.30 Finland . . . . . . . . . . . . . . . . . . . . . . . . . . . . P. 338,000 .22� 9.11 11 ,000 .173 0.30 France . . . . . . . . . . . . . . . . . . . . . . . . . . . . . G. 4,504,000 3.00 0 10.69 523,000 7.933 1.24 Germany# . . . . . . . . . . . . . . . . . . . . . . . . . . G. 15,200,000 10. 1 1 3 23.17 134,000 2.033 0.20 Great Britain & No. Ireland# . . . . . . . . . G. 10,500,000 6.983 22.61 344,000 5.223 0.74 Greece . . . . . . . . . . . . . . . . . . . . . . . . . . . . . P. 62,000 .043 0.95 34,000 .523 0.52 Hungary . . . . . . . . . . . . . . . . . . . . . . . . . . . G. 393,000 .263 4.45 49,000 .743 0.55 Irish Free State# . . . . . . . . . . . . . . . . . . . . G. 120,000 .083 4.07 22,000 .333 0.75 Italy . . . . . . . . . . . . . . . . . . . . . . . . . . . . . . . P. *1 ,329,000 .88� 3.14 250,000 3.793 0.59 J ugo-Sla via . . . . . . . . . . . . . . . . . . . . . . . . . G. 145,000 .10 0 1.01 5 7,000 .863 0.40 Latvia# . . . . . . . . . . . . . . . . . . . . . . . . . . . . G. 257,000 .173 13.28 4,500 .073 0.23 Netherlands . . . . . . . . . . . . . . . . . . . . . . . . . G. 950,000 .633 11.63 22,000 .333 0.27 Norway* . . . . . . . . . . . . . . . . . . . . . . . . . . . P.G. 587,000 .393 20.68 28,000 .433 0.99 Poland . . . . . . . . . . . . . . . . . . . . . . . . . . . . . P.G. 877,000 .583 2.70 60,000 .913 0.18 Portugal . . . . . . . . . . . . . . . . . . . . . . . . . . . . P.G. 113,000 .083 1.65 14,000 .213 0.20 Roumania . . . . . . . . . . . . . . . . . . . . . . . . . . P. 180,000 .123 0.99 43,000 .653 0.24 Russia I[ . . . . . . . . . . . . . . . . . . . . . . . . . . . . G. 700,000 .473 0.42 200,000 3.033 0.12 Spain . . . . . . . . . . . . . . . . . . . . . . . . . . . . . . P. 1, 140,000 .763 4.91 91,000 1.383 0.39 Sweden . . . . . . . . . . . . . . . . . . . . . . . . . . . . . G. 2,025,000 1.353 32.71 36,000 .553 0.58 Switzerland . . . . . . . . . . . . . . . . . . . . . . . . . G. 1 ,060,000 .703 25.80 16,000 .243 0.39 Other Places in Europe . . . . . . . . . . . . . . . P.G. 324,000 .223 3.94 25,000 .38% 0.30
Total . . . . . . . . . . . . . . . . . . . . 44,916,000 29.88% 8.16 2, 144,500 32.523 0.39
ASIA: British India# . . . . . . . . . . . . . . . . . . . . . . . P.G. 385,000 .263 0.11 432,000 6.553 0.12 China . . • . . . . . . . . . . . . . . . . . . . . . . . . . . . P.G. 474,000 .313 0.11 130,000 1.973 0.03 Japan# . . . . . . . . . . . . . . . . . . . . . . . . . . . . . G. 3,470,000 2.313 5.18 184,000 2.793 0.27 Other Places in Asia . . . . . . . . . . . . . . . . . P.G. 491 ,000 .33% 0.39 157,000 2.38% 0.12
-----
Total . . . . . . . . . . . . . . . . . . . . 4,820,000 3.2 1 % 0.48 903,000 13.693 0.09
AFRICA: Egypt . . . . . . . . . . . . . . . . . . . . . . . . . . . . . . G. 266,000 .183 1.26 35,000 .533 0.17 Union of South Africaf, . . . . . . . . . . . . . . . G. 500,000 .333 6.01 32,000 .493 0.39 Other Places in Africa . . . . . . . . . . . . . . . . P.G. 239,000 .163 0.21 150,000 2.273 0.13
---- ----
Total . . . . . . . . . . . . . . . . . . . . 1,005,000 .67% 0.71 217,000 3.293 0.15
OCEANIA: Australia* . . . . . . . . . . . . . . . . . . . . . . . . . . G. 2,535 ,000 1.683 38.71 101 ,000 1.533 1.54 Dutcq.East Indies . . . . . . . . . . . . . . . . . . . G. 246,000 .16% 0.39 27,000 .413 0.04 Hawa11 . . . . . . . . . . . . . . . . . . . . . . . . . . . . . P. 87,000 .063 21.22 0 .003 0.00 New Zealand# . . . . . . . . . . . . . . . . . . . . . . . G. 600,000 .403 39.04 25,000 .383 1.63 Philippine Islands . . . . . . . . . . . . . . . . . . . P.G. 64,000 .043 0.48 11.000 .173 0.08 Other Places in Oceania . . . . . . . . . . . . . . P.G. 8,000 .013 0.35 4,000 .063 0.17
Total . . • . . . . . . . . . . . . . . . . . 3,540,000 2.353 4.03 168,000 2.553 0.19
TOTAL WORLD . . . . . . . . . 150,323,000 100.003 7.36 6,594,500 100.003 0.32
NOTE: Telegraph service is operated by Governments. except in the United States and Canada. In connection with telephone wire, P. indi-cates that the telephone service is wholly or predominantly operated by private companies. G. wholly or predominantly by the Government, and P.G. by both private companies and the Government. See preceding table.
* June 30, 1932. ** February 28, 1933. # March 3 1 , 1933. 'II U.S.S.R. including Siberia and Associated Republics.
www.americanradiohistory.com

96 E L E C T R I C A L C O M M U N I C A T I O N
Telephone Development of Large and Small Communities-January l , 1933 NUMBER OF TELEPHONES
Service In Communities In Communities COUNTRY Operated of 50,000 of less than
by Population 50,000 (See Note) and Over Population
Australia* . . . . . . . . . . . . . . . . . . . . . . . . . . G. 276,400 208,226 Austria . . . . . . . . . . . . . . . . . . . . . . . . . . . . . G. 177,175 62,320 Belgium**· . . . . . . . . . . . . . . . . . . . . . . . . . G. 207,000 102,861 Canada . . . . . . . . . . . . . . . . . . . . . . . . . . . . . P.G. 681,000 580,245 Czechoslovakia . . . . . . . . . . . . . . . . . . . . . . P.G. 60,547 107,349 Denmark. . . . . . . . . . . . . . . . . . . . . . . . . . . P. 167,563 190,437 Finland . . . . . . . . . . . . . . . . . . . . . . . . . . . . P. 50,151 84,500 France . . • . . . . . . . . . . . . . . . . . . . . . . . . . . G. 739,018 553,236 Germany# . . . . . . . . . . . . . . . . . . . . . . . . . . G. 1 ,917,215 1 ,043,186 Great Britain and No. Ireland# . . . . . . . . G. 1,561,800 613 ,800 Hungary . . . . . . . . . . . . . . . . . . . . . . . . . . . G. 84,218 27,067 Japan#. . . . . . . . . . . . . . . . . . . . . . . . . . . . . G. 615,877 349,513 Netherlands. . . . . . . . . . . . . . . . . . . . . . . . . G. 216,855 116,003 New Zealand# . . . . . . . . . . . . . . . . . . . . . . . G. 58,845 96,715 Norway* . . . . . . . . . . . . . . . . . . . . . . . . . . . P.G. 74,873 122,810 Poland . . . . . . . . . . . . . . . . . . . . . . . . . . . . . P.G. 1 1 1 , 142 72,825 Spain . . . . . . . . . . . . . . . . . . . . . . . . . . . . . . P. 167,001 113 ,941 Sweden . . . . . . . . . . . . . . . . . . . . . . . . . . . . . G. 229,245 348,036 Switzerland. . . . . . . . . . . . . . . . . . . . . . . . . G. 155,480 190,725 Union of South Africa . . . . . . . . . . . . . . . . G. 63,400 52,200 United States . . . . . . . . . . . . . . . . . . . . . . . P. 9,842,371 7,582,035 NoTE: P. indicates that the telephone service is wholly or predominantly operated by private companies.
Government, and P.G. by both private companies and the Government. See first table. * June 30, 1932. ** February 28, 1933. # March 3 1 , 1933.
TELEPHONES PER 100 POPULATION
In Communities In Communities of 50,000 of less than
Population 50,000 and Over Population
8.35 6.43 7.57 1.42 6.09 2.13
21.02 7.96 3.61 0.81
17.58 7.13 10.49 2.61
8.36 1.66 7.22 2.67 5.99 3.01 4.93 0.38 3.36 0.72 6.69 2.35
1 1 .06 9.62 18.53 5.04
2.35 0.26 3.54 0.62
22.45 6.73 18.00 5.88
6.46 0.71 19.52 10.17
G. wholly or predominantly by the
Telephone Conversations and Telegrams-Year 1932
Total Number Number of Number of of Wire
COUNTRY Telephone Telegrams Communica-Conversations tions
Australia . . . . . . . . . . . . . . . . . . . . . . 397 ,000,000 13,423,000 410,423,000 Austria . . . . . . . . . . . . . . . . . . . . . . . . 558,000,000 1,716,000 559,716,000 Belgium . . . . . . . . . . . . . . . . . . . . . . . 227,000,000 6,287,000 233,287 ,000 Canada . . . . . . . . . . . . . . . . . . . . . . . . 2,346,573,000 9,936,000 2 ,356,509,000 Czechoslovakia . . . . . . . . . . . . . . . . . 280,000,000 4,428,000 284,428,000 Denmark . . . . . . . . . . . . . . . . . . . . . . 549,423,000 1,722,000 551,145,000 Finland . . . . . . . . . . . . . . . . . . . . . . . 176,000,000 531,000 176,531,000 France . . . . . . . . . . . . . . . . . . . . . . . . 861,854,000 3 1 ,220,000 893,074,000 Germany . . . . . . . . . . . . . . . . . . . . . . 2,162,586,000 16,869,000 2,1 79,455 ,000 Gt. Britain & No. Ireland . . . . . . . 1,530,000,000 44,884,000 1,574,884,000 Hungary . . . . . . . . . . . . . . . . . . . . . . 133,000,000 2,066,000 135,066,000 Japan . . . . . . . . . . . . . . . . . . . . . . . . . 3,434,523,000 49,829,000 3,484,352,000 Netherlands . . . . . . . . . . . . . . . . . . . . 390,000,000 3,563,000 393,563 ,000 New Zealand . . . . . . . . . . . . . . . . . . . 315,024,000 4,153,000 319,177,000 Norway . . . . . . . . . . . . . . . . . . . . . . . 257,000,000 3 ,058,000 260,058,000 Poland . . . . . . . . . . . . . . . . . . . . . . . . 683,468,000 3,516,000 686,984,000 Spain . . . . . . . . . . . . . . . . . . . . . . . . . 645,000,000 20,000,000 665,000,000 Sweden . . . . . . . . . . . . . . . . . . . . . . . . 850,000,000 3,653,000 853,653,000 Switzerland . . . . . . . . . . . . . . . . . . . . 261,100,000 2 , 174,000 263,274,000 Union of South Africa . . . . . . . . . . . 197,000,000 4,427,000 201,427,000 United States . . . . . . . . . . . . . . . . . . 25,500,000,000 148,000,000 25 ,648,000,000
PER CENT OF WIRE COMMUNICATIONS TOTAL WIRE PER CAPITA
COMMUNICATIONS Telephone Telephone
Conver- Telegrams Conver- Telegrams Total sations sations
96.7 3.3 60.8 2.1 62.9 99.7 0.3 82.8 0.3 83.1 97.3 2.7 27.7 0.8 28.5 99.6 0.4 224.5 1.0 225.5 98.4 1.6 18.8 0.3 19.1 99.7 0.3 151.8 0.5 152.3 99.7 0.3 47.6 0.1 47.7 96.5 3.5 20.5 0.7 21.2 99.2 0.8 33.0 0.3 33.3 97.2 2.8 33.0 1.0 34.0 98.5 1.5 15.1 0.2 15.3 98.6 1.4 51.7 0.7 52.4 99.1 0.9 48.1 0.4 48.5 98.7 1.3 205.8 2.7 208.5 98.8 1.2 90.8 1 . 1 91.9 99.5 0.5 21.2 0.1 21.3 97.0 3.0 27.9 0.9 28.8 99.6 0.4 137.6 0.6 138.2 99.2 0.8 63.7 0.5 64.2 97.8 2.2 23.9 0.5 24.4 99.4 0.6 204.6 1.2 205.8
NoTE: Telephone conversations represent completed local and toll or long distance messages. tional messages.
Telegrams include inland and outgoing interna-
TELEPHONE DEVELOPMENT I N THE UNITED STATES AND EUROPE
1903 1913 1923 January 1st of each year
DISTRIBUTION OF THE WORLD'S TELEPH ONES January I . 1 933
6.5 % F R A NC E ---·''"°'
4 cyo
ALL OTHER EUROPEAN
COUNTRIES J4 C}'o
ALL OTH ER
CANADA ---� 4 '%
www.americanradiohistory.com

E L E C T R I C A L C O M M U N I C A T I O N
TeJephone Development of Large Cities
January 1, 19�3 Number
of Country and City (or Exchange Area)
Estimated Population
(City or Exchange Area) Telephones
ARGENTINA: Buenos Aires . . . . . . . . . . . . . . . . . . . . . . . . . . . . . . . . . . . . . . . . . . . . . . . . . .
AUSTRALIA: Adelaide . . . . . . . . . . . . . . . . . . . . . . . . . . . . . . . . . . . . . . . . . . . . . . . . . . . . . . Brisbane . . . . . . . . . . . . . . . . . . . . . . . . . . . . . . . . . . . . . . . . . . . . . . . . . . . . . . Melbourne . . . . . . . . . . . . . . . . . . . . . . . . . . . . . . . . . . . . . . . . . . . . . . . . . . . . Sydney . . . . . . . . . . . . . . . . . . . . . . . . . . . . . . . . . . . . . . . . . . . . . . . . . . . . · . .
AUSTRIA: Graz . . . . . . . . . . . . . . . . . . . . . . . . . . . . . . . . . . . . . . . . . . . . . . . . . . . . . . . . . Vienna . . . . . . . . . . . . . . . . . . . . . . . . . . . . . . . . . . . . . . . . . . . . . . . . . . . . . . .
BELGIUM : Antwerp . . . . . . . . . . . . . . . . . . . . . . . . . . . . . . . . . . . . . . . . . . . . . . . . . . . . . . Brussels . . . . . . . . . . . . . . . . . . . . . . . . . . . . . . . . . . . . . . . . . . . . . . . . . . . . . . Liege . . . . . . . . . . . . . . . . . . . . . . . . . . . . . . . . . . . . . . . . . . . . . . . . . . . . . . . . .
BRAZIL: Rio de Janeiro . . . . . . . . . . . . . . . . . . . . . . . . . . . . . . . . . . . . . . . . . . . . . . . .
CANADA: Montreal . . . . . . . . . . . . . . . . . . . . . . . . . . . . . . . . . . . . . . . . . . . . . . . . . . . . . Ottawa . . . . . . . . . . . . . . . . . . . . . . . . . . . . . . . . . . . . . . . . . . . . . . . . . . . . . . . Toronto . . . . . . . . . . . . . . . . . . . . . . . . . . . . . . . . . . . . . . . . . . . . . . . . . . . . . . Vancouver . . . . . . . . . . . . . . . . . . . . . . . . . . . . . . . . . . . . . . . . . . . . . . . . . , . .
CHINA: Canton . . . . . . . . . . . . . . . . . . . . . . . . . . . . . . . . . . . . . . . . . . . . . . . . . . . . . . .
�cl�fn����: : : : : : : : : : : : : : : : : : : : : : : : : : : : : : : : : : : : : : : : : : : : : : : : : : : Shanghai . . . . . . . . . . . . . . . . . . . . . . . . . . . . . . . . . . . . . . . . . . . . . . . . . . . . ,
CUBA: Havana . . . . . . . . . . . . . . . . . . . . . . . . . . . . . . . . . . . . . . . . . . . . . . . . . . . . . .
CZECHOSLOVAKIA: Prague . . . . . . . . . . . . . . . . . . . . . . . . . . . . . . . . . . . . . . . . . . . . . . . . . . . . . . .
DANZIG: Free City of Danzig . . . . . . . . . . . . . . . . . . . . . . . . . . . . . . . . . . . . . . . . . . . .
DENMARK: Copenhagen . . . . . . . . . . . . . . . . . . . . . . . . . . . . . . . . . . . . . . . . . . . . . . . . . . .
FINLAND: Helsingfors . . . . . . . . . . . . . . . . . . , . . . . . . . . . . . . . . . . . . . . . . . . . . . . . . . .
FRANCE : Bordeaux . . . . . . . . . . . . . . . . . . . . . . . . . . . . . . . . . . . . . . . . . . . . . . . . . . . . Lille . . . . . . . . . . . . . . . . . . . . . . . . . . . . . . . · · · · · · · · · · · · · · · · · · · · · · · · · · Lyons . . . . . . . . . . . . . . . . . . . . . . . . . . . . . . . . . . . . . . . . . . . . . . . . . . . . . . . . Marseilles . . . . . . . . . . . . . . . . . . . . . . . . . . . . . . . . . . . . . . . . . . . . . . . . . . . . Paris . . . . . . . . . . . . . . . . . . . . . . . . . . . . . . . . . . . . . . . . . . . . . . . . . . . . . . . . .
GERMANY: # Berlin . . . . . . . . . . . . . . . . . . . . . . . , . . . . . , , . , . , . . , . . . . . . . . . . . , . . . . . . Breslau . . . . . . . . . . . . . . . . . . . . . . . . . . . . . . . . . . . . . . . . . . . · · · · · · · . · · · · Cologne . . . . . . . . . . . . . . . . . . . . . . . . . . . . . . . . . . . . . . . . . . . . . . . . . . . . . . Dresden . . . . . . . . . . . . . . . . . . . . . . . . . . . . . . . . . . . . . . . . . . . . . . . . . . . . . . Dortmund . . . . . . . . . . . . . . . . . . . . . . . . . . . . . . . . . . . . . . . . . . . . . . . . . . . . Essen . . . . . . . . . . . . . . . . . . . . . . . . . . . . . . . . . . . . . . . . . . . . . . . . . . . . . . . . Frankfort-on-Main . . . . . . . . . . . . . . . . . . . . . . . . . . . . . . . . . . . . . . . . . . . . .
rci:����:��t·o
·n� " : : .. : : : : : : : : : : : : : : : : : : : : : : : : : : : : : : : : : : : : : : : : : :
Munich . . . . . . . . . . . . . . . . . . . . . . . . . . . . . . . . . . . . . . . . . . . . . . . . . . . . . .
GREAT BRITAIN AND NO. IRELAND : # Belfast . . . . . . . . . . . . . . . . . . . . . . . . . . . . . . . . . . . . . . . . . . . . . . . . . . . . . . . Birmingham . . . . . . . . . . . . . . . . . . . . . . . . . . . . . . . . . . . . . . . . . . . . . . . . . . Bristol . . . . . . . . . . . . . . . . . . . . . . . . . . . . . . . . . . . . . . . . . . . . . . · . . · · · . . · Edinburgh . . . . . . . . . . . . . . . . . . . . . . . . . . . . . . . . . . . . . . . . . . . . . . . . . . . . Glasgow . . . . . . . . . . . . . . . . . . . . . . . . . . . . . . . . . . . . . . . . . . · · · · · . . . . · · · Leeds . . . . . . . . . . . . . . . . . . . . . . . . . . . . . . . . . . . . . . . . . . . . . . . . . . . . . . . . Liverpool . . . . . . . . . . . . . . . . . . . . . . . . . . . . . . . . . . . . . . . . . . . . . . . . . . . . . London . . . . . . . . . . . . . . . . . . . . . . . . . . . . . . . . . . . . . , . . . . . . . . . . . . . . . . . Manchester . . . . . . . . . . . . . . . . . . . . . . . . . . . . . . . . . . . , . . . . . . . . . . . . . . . Newcastle . . . . . . . . . . . . . . . . . . . . . . . . . . . . . . . . . . . . . . . . . . . . . . . . . . . . Sheffield . . . . . . . . . . . . . . . . . . . . . . . . . . . . . . . . . . . . . . . . . . . . . . . . . . . . . .
4t1A 'i'i���lulu . . . . . . . . . . . . . . . . . . . . . . . . • . . . . . . . . . . . . . . . . . . . . . . . . . . . •
HUNGARY: Budapest . . . . . . . . . . . . . . . . . . . . . . . . . . . . . . . . . . . . . . . . . . . . . . . . . . . . . Szeged . . . . . . . . . . . . . . . . . . . . . . . . . . . . . . . . . . . . . . . . . . . . . . . . . . . . . . .
IRISH FREE STATE: Dublin# . . . . . . . . . . . . . . . . . . . . . . . . . . . . . . . . . . . . . . . . . . . . . . . . . . . . . .
2,910,000
326,000 334,000
1,028,000 1,262,000
167,000 2 ,000,000
530,000 958,000 427,000
1,700,000
990,000 185,700 756,800 191,000
1,000,000 850,000
1,500,000 1 ,500,000
750,000
890,000
240,000
798,000
260,000
265,000 202,000 665,000 860,000
2,900,000
4,241 ,000 618,000 743,000 700,000 585,000 649,000 635,000
1 ,636,000 771 ,000 736,000
415,000 1 , 188,000
414,000 442,000
1 , 185,000 5 10,000
1,190,000 9,090,000 1,097,000
470,000 516,000
138,000
1,021,000 138,000
419,000
172, 100
27 ,656 24,715 92,253
106,472
8,088 157,432
37,363 97,210 2 1 ,605
49,850
175,672 36,501
193,885 53,644
7,300 14,620 12, 162 44,605
35 ,208
37,329
16,765
151,727
35,183
18,457 16,334 33,471 30,407
434,066
469,270 40,890 63,898 58,2 1 1 23,225 28,426 61 ,427
153,547 64,879 73,569
17,516 56,027 20,196 30,497 5 7,833 23,224 56,983
798,153 63,712 19,229 19,287
16,189
73,928 1 ,998
17,601
97
Telephones Per 100
Population
5.91
8.48 7.40 8.97 8.68
4.84 7.87
7.05 10.15
5.06
2.93
17.74 19.66 25.62 28.09
0.73 1.72 0.81 2.97
4.69
4.19
6.99
19.01
13.53
6.96 8.09 5.03 3.54
14.97
1 1 .07 6.61 8.60 8.31 3.97 4.38 9.68 9.39 8.42
10.00
4.22 4.72 4.88 6.90 4.88 4.55 4.79 8.84 5.81 4.09 3.74
1 1.73
7.24 1.45
4.20
www.americanradiohistory.com

98 E L E C T R I C A L C O M M U N I C A T I O N
Telephone Development of Large Cities-(Concluded)
January 1, 1933
Country and City (or Exchange Area)
Estimated Population
(City or Exchange Area)
ITALY : Genoat . . . . . . . . . . . . . . · · · · · · · · · · · · · · · · · · · · · · · · · · · · · · · · · · · · · · · · ·
Milan . . . . . . . . . . . . . . . . . . . . . . . . . . . . . . . . . . . . . . . . . . . . . . . . . . . . . . . .
Romet . . . . . . . . . . · · · · · · · · · · · · · · · · · · · · · · · · · · · · · · · · · · · · · · · · · · · · ·
JAPAN:# Kobe . . . . . . . . . . . . . . . . . . . . . . . . . . . . . . . . . . . . . . . . . . . . . . . . . . . . . Kyoto . . . . . . . . . . . . . . . . . . . . . . . . . . . . . . . . . . . . . . . . . . . . . . . . . . . . . . . .
Nagoya . . . . . . . . . . . . . . . . . . . . . . . . . . . . . . . . . . . . . . . . . . . . . . . . . . . . . .
Osaka . . . . . . . . . . . . . . . . . . . . . . . . . . . . . . . . . . . . . . . . . . . . . . . . . . . . . . . . Tokio . . . . . . . . . . . . . . . . . . . . . . . . . . . . . . . . . . . . . . . . . . . . . . . . . . . . . . . .
LA TV.IA:,. R1gaj)" • • . . . • . • • . . • . . . • • . • • • . • • . . • . • . • . • . . . . . · • · · • · • · · · · · · · · · · •
MEXICO: Mexico City . . . . . . . . . . . . . . . . . . . . . . . . . . . . . . . . . . . . . . . . . . . . . . . . . .
NETHERLANDS: Amsterdam . . . . . . . . . . . . . . . . . . . . . . . . . . Haarlem . . . . . . . . . . . . . . . . Rotterdam . . . . . . . . . . . . . . . . . . . . . . . The Hague . . . . . . . . . . . . . . . . . . . . . . . . . .
NEW ZEALAND: Aukland1;' . . . . . . . . . . . . . . . . . . . · · · · · · · · · · · · · · · · · · · · · · · · · · · · · · · · · ·
NORWAY: Oslo* . . . . . . . . . . . . . . . . . . . . . . . . . . . . . . . . . . . . . . . · . . · · · · · · · · · · · · · ·
PHILIPPINE ISLANDS: Manila . . . . . . . . . . . . . . . . . . . . . . . . . . . . . . . . . . . . . . . . . . . . . . . . . . . . . . .
POLAND: Lodz . . . . . . . . . . . . . . . . . . . . . . . . . . . . . . . . . . . . . . . . . . . . . . . . . . . . . . . . . Warsaw . . . . . . . . . . . . . . . . . . . . . . . . . . . . . . . . . . . . . . . . . . . . . . . . . . . . . .
PORTUGAL: Lisbon . . . . . . . . . . . . . . . . . . . . . . . . . . . . . . . . . . . . . . . . . . . . . . . . . . . . . . .
ROUMANIA: Bucharest . . . . . . . . . . . . . . . . . . . . . . . . . . . . . . . . . . . . . . . . . . . . . . . . . . . .
RUSSIA: Leningrad . . . . . . . . . . . . . . . . . . . . . . . . . . . . . . . . . . . . . . . . . . . . . . . . . . . . Moscow . . . . . . . . .. . . . . . . . . . . . . . . . . . . . . . . . . . . . . . . . . . . . . . . . . . . . . .
SPAIN: Barcelona . . . . . . . . . . . . . . . . . . . . . . . . . . . . . . . . . . . . . . . . . . . . . . . . . . . . . Madrid . . . . . . . . . . . . . . . . . . . . . . . . . . . . . . . . . . . . . . . . . . . . . . . . . . . . . . .
SWEDEN: Gothenburg . . . . . . . . . . . . . . . . . . . . . . . . . . . . . . . . . . . . . . . . . . . . . . . . . . . Malmo . . . . . . . . . . . . . . . . . . . . . . . . . . . . . . . . . . . . . . . . . . . . . . . . . . . . . . . Stockholm . . . . . . . . . . . . . . . . . . . . . . . . . . . . . . . . . . . . . . . . . . . . . . . . . . . .
SWITZERLAND: Basel. . . . . . . . . . . . . . . . . . . . . . . . . . . . . . . . . . . . . . . . . . . . . . . . . . . . . . . . . Berne . . . . . . . . . . . . . . . . . . . . . . . . . . . . . . . . . . . . . . . . . . . . . . . . . . . . . . . . Geneva . . . . . . . . . . . . . . . . . . . . . . . . . . . . . . . . . . . . . . . . . . . . . . . . . . . . . . . Zurich . . . . . . . . . . . . . . . . . . . . . . . . . . . . . . . . . . . . . . . . . . . . . . . . . . . . . . . .
UNITED STATES: (See Note) New York . . . . . . . . . . . . . . . . . . . . . . . . . . . . . . . . . . . . . . . . . . . . . . . . . . . . Chicago . . . . . . . . . . . . . . . . . . . . . . . . . . . . . . . . . . . . . . . . . . . . . . . . . . . . . . Los Angeles . . . . . . . . . . . . . . . . . . . . . . . . . . . . . . . . . . . . . . . . . . . . . . . . . . . Pittsburgh . . . . . . . . . . . . . . . . . . . . . . . . . . . . . . . . . . . . . . . . . . . . . . . . . . . .
Total 10 cities over 1 ,000,000 Population . . . . . . . . . . . . . . . . . . . . . . . Milwaukee . . . . . . . . . . . . . . . . . . . . . . . . . . . . . . . . . . . . . . . . . . . . . . . . . . . . San Francisco . . . . . . . . . . . . . . . . . . . . . . . . . . . . . . . . . . . . . . . . . . . . . . . . . Washington . . • . . . . . . . . . . . . . . . . . . . . . . . . . . . . . . . . . . . . . . . . . . . . . . . .
Total 9 cities with 500,000 to 1,000,000 Population . . . . . . . . . . . . . . Minneapolis . . . . . . . . . . . . . . . . . . . . . . . . . . . . . . . . . . . . . . . . . . . . . . . . . . . Seattle . . . . . . . . . . . . . . . . . . . . . . . . . . . . . . . . . . . . . . . . . . . . . . . . . . . . . . . Denver . . . . . . . . . . . . . . . . . . . . . . . . . . . . . . . . . . . . . . . . . . . . . . . . . . . . . . . Hartford . . . . . . . . . . . . . . . . . . . . . . . . . . . . . . . . . . . . . . . . . . . . . . . . . . . . . Omaha . . . . . . . . . . . . . . . . . . . . . . . . . . . . . . . . . . . . . . . . . . . . . . . . . . . . . . .
Total 34 cities with 200,000 to 500,000 Population . . . . . . . . . . . . . . .
Total 53 cities with more than 200,000 Population . . . . . . . . . . . . . . .
650,000 1,013,000
945,000
820,000 1,000,000
960,000 2,600,000 5,300,000
406,000
1,100,000
775 ,000 155,000 615,000 500,000
210,000
250,000
388,000
850,000 1 ,200,000
612,000
600,000
2 ,250,000 3,000,000
1,000,000 950,000
25 1,000 131,000 438,000
149,000 1 13,000 145,000 260,000
7,114,000 3,521,000 1,357,000 1,000,100
2 1,894,600 745,100 672,000 587,800
5,980,800 498,600 411,400 295,500 242,000 233,800
10,270,500
38,145,900
Number of
Telephones
29,153 82,120 65,173
30,933 39,219 3 1 ,489
1 10,740 184,034
2 1 ,732
51 ,492
53,080 1 1,505 40,310 47,283
21,011
49,562
17,540
13,679 56,100
24,823
20,252
72,349 106,776
45,200 52,116
40,746 20,005
139,407
28,102 22,019 25,860 50,659
1,576,616 831,679 362,597 193,838
4,618,727 138,772 245,196 195,683
1,236,351 121 ,456 107,083
87,682 52,869 61,691
1,918,542
7,773,620
Telephone Per 100
Populatio1
4.49 8.11 6.90
3.77 3.92 .�.28 4.26 3.47
5.35
4.68
6.85 7.42 6.55 9.45
10.01
19.82
4.52
1.61 4.68
4.06
3.38
3.21 3.56
4.52 5.49
16.23 15.27 31.83
18.86 19.49 17.83 19.48
22.16 23.62 26.72 19.38 21.10 18.62 36.49 33.29 20.67 24.36 26.03 29.67 2 1.85 26.39
18.68
20.38
NOTE: There are shown, for purposes of comparison with cities in other countries, the total development of all cities in the United States in certai population groups, and the development of certain representative cities within each of such groups.
t January 1, 1932. * Jnne 30, 1932. If March 3 1, 1933.
www.americanradiohistory.com

E L E C T R I C A L C O M M U N I C A T I O N 99
s The Telephone • • •
R1GDT AnM OF MooEB,N Bus1NESS
An industrialist picks up his telephone and calls a business associate
on a liner in mid-ocean-an exchange of ideas and a knotty problem is
solved . . . all in a few minutes.
A sales n1anager with a multitude of details requiring his presence at
the home office, covers his territory by telephoning his salesmen-a few
encouraging words to each, advice on a new merchandising point driven
home as only the voice and personality behind that voice can do it . . .
and the work of months is accomplished in an hour or less.
A bookkeeper calls the order clerk on the floor below about an irregu
larity in a hill, and without leaving their desks the matter is straightened
out in a few seconds.
Thus millions upon millions of work hours every day are saved to
business through the telephone-multiplying earning power-eliminat
ing untold expense and waste-sweeping away confusion.
Truly it has been said that the telephone is the Right Arm of Modern Business.
www.americanradiohistory.com

100
'e1
E L E C T R I C A L C O M M U N I C A T I O N
INTERNATIONAL TELEPHONE AND TELEGRAPH CORPORATION
BOARD OF DIRECTORS ARTHUR M. ANDERSON
J. P. Morgan & Co.
SosTHENES BEHN, President
F. WILDER BELLAMY Dominick & Dominick
EDWARD J. BER WIND Chairman, Berwind-'White Coal Mining Company
EDWIN F. CmNLUND, Vice-President and Comptroller
PHILIP K. CONDICT Executive Vice-President, International Standard Electric
Corporation
JoHN W. CuTLER Edward B. Smith & Co.
R. FULTON CUTTING Financier
CHARLES E. DUNLAP President, Berwind-Whito Coal Mining Company
GEORGE H. GARDINER Davis Polit Wardwell Gardiner & Reed
GEORGE S. GrnBs President, Postal Telegraph and Cable Corporation
A . H. GRISWOLD Executive Vice-President, Postal Telegraph and Cable
Corporation
ALLEN G. HoYT Vice-President, The National City Bank of New York
RUSSELL c. L 1cFFINGWELL J. P. Morgan & Co.
CLARENCE H MACKAY Chairman of the Board, Postal Teleg_raph and Cable Corporation
J O�IN L . MERRILL President, AU America Cables, Incorporated
WALTER E. OGILVIE President, Havana Terminal Railrond Company
HENRY B. 0RDE President, Shanghai Teleohone Comoany
BRADLEY W. PALMER Palmer, Dodge . • Barstow. 'Vi1ldns & Davis
Boston
GEORGE E. PINGREE President, International Standard Electric Corporation
W01coTT H. PITKIN, Vice-President and General Attorney
LEWIS J . PROCTOR, Vice-President
LANSING P. REED Davis Poll\: Wardwell Gardiner & Reed
GEORGE H. GARDINER General Counsel
-
OFFICERS President
SosTHENES BEHN
LEWIS J. PROCTOR GEORGE E. P IN GREE PHILIP K. CONDICT ]AMES E. FULLAM
Vice-Presidents
JOHN L. �1ERRILL FRANK w. PHELAN WILLIAM F. REPP
FRANK C. p AGE LoGAN N. RocK GEORGE s. GI BBS
Vice-President and
A. H. GRISWOLD
Vice-President and
Vice-President and
General Attorney WOLCOTT H. PITKIN
General Technical Director GERALD DEAKIN Con1ptroller
EDWIN F. CHINLUND
Secretary SAMUEL G. ORDWAY
T HE International Telephone and Telegraph Corporation was organized to co
operate and assist technically and financially in the general development of electrical communications in a broad international sense, and, with respect to the organization and development of national communications systems, it is the purpose of the I nternational Telephone and Telegraph Corporation to develop truly national systems operated by the nationals of each coun try in which the International Corporation is or may become interested. The International Corporation was not organized with the desire of imposing American practices in its foreign activities. There appeared
Treasurer J QSEPH A. REDEGELD
to be a fruitful field of service to be rendered in bringing together under one general organization electrical communications systems, and the extension, by the International Corporation to the associated companies, of the technical and financial facilities and direction that might be needed for their intensive and efficient development. The best American practices have been suggested but never imposed. On the contrary, the International Corporation has always been ready and quick to adjust American practices to local conditions and to adopt such local practices as were conducive to the successful development of the various entities.
www.americanradiohistory.com

Licensee Companies BELL TELEPHONE MANUFACTURING COMPANY . . . . . . . . . . . . . . . . . . . . Antwerp, Belgium
Branches: Brussels. BELL TELEPHONE MAN UFACTURING COM PANY . . . . . . . . . . . . . . Berne, Switzerland BELL TELEPHONE MA'.'iUFACTURING COMPANY . . . . . . . . . . . . . . The Hague, Holland
CmNA ELECTRIC COMPANY, LIMITED . . . . . . . . . . . . . . . . . . . . . . . . . . . . . Shanghai, China Branches: Canton, Hankow, Harbin, Hongkong, Peiping, Tientsin.
CoMPA;;:;{A STANDARD ELECTRIC ARGENTINA . . . . . . . . . . . . . . . . Buenos Aires, Argentina
INTERNATIONAL STANDARD ELECTRIC CORPORATION, Branch Office, Rio de Janeiro, Brazil
LE MATERIEL T b'.Li,'.PHONIQUE . . . . . . . . . . . . . . . . . . . . . . . . . . . . . . . . . . . . Paris, France Branch: Rabat, Morocco
NIPPON DENKI KABUSHIKI KAISHA . . . . . . . . . . . . . . . . . . . . . . . . . . . . . . . . Tokyo, Japan Branches: Osaka, Dairen, Taihoku.
FERDINAND SCHUCHHARDT, BERLINER FERNSPRECH-UND TELEGRAPHENWERK AKTIENGESELLSCHAFT . . . . . . . . . . . . . . . . . . . . . . . . . . . . . . . . . . . . . . Berlin, Germany
STANDARD ELECTRIC AKTIESELSKAB • . . . . . . . .
S'L\NDARD TELEFON-CG KABELFABRIK A/S . . . ' ' .
STANDARD ELECTRIC COMPANY w POLSCE SP. z. 0. 0 . . '
. Copenhagen, Denmark
. . . . . . . Oslo, Norway
. . . . . . . Warsaw, Poland
STANDARD ELECTRIC DoMs A SPOLECNOST . . . . . . . . . . . . . . . . . . . Prague, Czechoslovakia Branch: Bratislava.
STANDARD ELECTRICA ROMANA S/ A . . . . . ' . . . . . . . . ' . ' . . . Bucharest, Rumania
STANDARD ELECTRICA, s. A . . . . . . . . . . . . . Madrid, Spain Branches: Barcelona, Santander.
S'L\NDARD ELECTRIC.\, S. A . . . ' . ' . . . . . Lisbon, Portugal
STANDARD ELETTRICA l TALIANA . . . . . . . . . . . . . . . . . . . . . . . . Milan, Italy Branch: Rome.
STANDARD TELEPHONES AND CABLES, LIMITED . . . . . . . . . . . . . . . . . . . London, England Branches: Birmingham, Glasgow, Leeds, Manchester, Dublin, Cairo, J ohannes
burg, Calcutta, Singapore.
STANDARD TELEPHONES AND CABLES (AUSTRALASIA) , LIMITED . . . . . Sydney, A ustralia Branches: Melbourne , Wellington, New Zealand.
STANDARD VILLAMOssA.GI RESZVENY TA.RSA.SAG . . . . . . . . . . . . . . . . Budapest, Hungary
SrnuTOMO ELECTRIC WIRE & CABLE WORKS, LIMITED . . . . . . . . . . Osaka, Japan
VEREINIGTE TELEPHON- UND TELEGRAPHENFABRIKS AKTIEN-GESELLSCHAFT, CzEIJA, NISSL & Co . . . . . . . . . . . . . . . . . . . . . . . . . . . . . . . . . . . . . . . . Vienna, Austria
Sales Offices and .dgencies Throughout the World
www.americanradiohistory.com