19189638 Cvp Analysis
42
CHAPTER Cost-Volume-Profit Analysis In Brief Managers need to estimate future revenues, costs, and profits to help them plan and monitor operations. They use cost-volume-profit (CVP) analysis to identify the levels of operating activity needed to avoid losses, achieve tar- geted profits, plan future operations, and monitor organizational performance. Managers also analyze operational risk as they choose an appropriate cost structure. This Chapter Addresses the Following Questions: Q1 What is cost-volume-profit (CVP) analysis, and how is it used for decision making? Q2 How are CVP calculations performed for a single product? Q3 How are CVP calculations performed for multiple products? Q4 What is the breakeven point? Q5 What assumptions and limitations should managers consider when using CVP analysis? Q6 How are margin of safety and operating leverage used to assess operational risk? ch03.qxd 9/27/04 4:06 PM Page 86
-
Upload
prathap-h-muthu -
Category
Documents
-
view
50 -
download
2
Transcript of 19189638 Cvp Analysis

CHAPTE
R
Cost-Volume-Profit Analysis
�In BriefManagers need to estimate future revenues, costs, and profits to help them
plan and monitor operations. They use cost-volume-profit (CVP) analysis to
identify the levels of operating activity needed to avoid losses, achieve tar-
geted profits, plan future operations, and monitor organizational performance.
Managers also analyze operational risk as they choose an appropriate cost
structure.
This Chapter Addresses the Following Questions:
Q1 What is cost-volume-profit (CVP) analysis, and how is it used for decision making?
Q2 How are CVP calculations performed for a single product?
Q3 How are CVP calculations performed for multiple products?
Q4 What is the breakeven point?
Q5 What assumptions and limitations should managers consider when using CVP analysis?
Q6 How are margin of safety and operating leverage used to assess operational risk?
ch03.qxd 9/27/04 4:06 PM Page 86

87
In the early 1980s,personal computerswere still somewhat a
novelty. At that time,Coleco manufactured asmall computer calledAdam. In addition, it soldColecovision games forhome computers. Colecomarketed Adam and itscomputer games heavily,hoping in 1982 for a hotseller during the Christ-mas and holiday gift sea-son. However, Adam andColecovision did not sellwell. Coleco found itselfclose to bankruptcy.
Then in 1983 Colecopurchased the license tomanufacture CabbagePatch Dolls. It began pro-duction for Christmas1983. Coleco widely pub-licized the dolls’ arrival attoy stores, but managersanticipated greater sales of Adam in their productionschedules. They did not emphasize production of theCabbage Patch Dolls. These dolls became hot sellers thatChristmas, and inventories were depleted rapidly. Thescarcity generated so much interest that customers fought
with each other for thedolls and even wreckedsome toy stores while try-ing to purchase CabbagePatch Dolls for the holi-days. Because of theshortage, advertising forthe dolls was canceledshortly after their intro-duction.
Coleco’s managerscontinued to think that thecompany’s reputationwould be based on com-puters. However, CabbagePatch Dolls became theirmost successful productfor the next several years.After success with Cab-bage Patch Dolls and ac-tion figure toys calledMasters of the Universe,Coleco continued to aimfor hot sellers. This strat-egy involved a great dealof uncertainty, and by
1988 the company was bankrupt. ■
SOURCES: L. Brannon and A. McCabe, “Time-Restricted Sales Appeals,”Cornell Hotel and Restaurant Administration Quarterly, August/September2001, pp. 47–53; and K. Fitzgerald, “Toys Face Scrooge-Like Christmas,”Advertising Age, September 19, 1988, pp. 30–32.
COLECO: FAULTY FORECASTS
87
ch03.qxd 9/27/04 4:06 PM Page 87

88 CHAPTER 3 ➤ COST-VOLUME-PROFIT ANALYSIS
■ Key Decision Factors for ColecoWhat went wrong with Coleco’s decision to emphasize production of Adam instead of Cab-bage Patch Dolls? The problems began with uncertainties about which products would bepopular at Christmas. Coleco’s managers could not know which products would sell best.Nevertheless, it was necessary for them to make decisions about the types and volumes ofproducts to manufacture. They forecast the number and type of products that would sell andthen made production decisions accordingly. The following discussion summarizes key is-sues in Coleco’s decision-making process.
Knowing. Knowledge about consumer markets, competition, production processes, andcosts were critical when Coleco’s managers decided which product to emphasize. Coleconeeded this knowledge for its potential markets—dolls, computers, and games. Given thecompany’s experience, its knowledge was probably greater for producing Adam than forCabbage Patch Dolls. However, doll manufacturing was a relatively simple process com-pared to producing computers.
Identifying. Companies commonly face major uncertainties in their product markets,particularly in the toy industry where competition is often fierce and consumer tastes changerapidly. However, Coleco’s uncertainties were greater than most because of the relativelynew—and competitive—computer market. For example, the managers did not know:
● How quickly consumers would embrace computers● What would persuade consumers to purchase a first computer● How quickly computer technology and competition would change● Exactly how much the computers would cost to produce
Exploring. Coleco’s managers faced a difficult task in adequately exploring their deci-sion to emphasize Adam over Cabbage Patch Dolls. However, thorough analysis is crucialfor this type of decision. For example, the managers needed to do the following:
● Anticipate which product would sell best. Although market research helps managersestimate product demand, they would still have considerable uncertainty about actualproduct sales.
● Avoid biased forecasts and analyses. Managers often have emotional attachments tosunk costs, such as the large investment already made in Adam, that should not affectdecision making.
● Consider risks associated with the cost structure for each product. Compared toAdam, Cabbage Patch dolls probably had lower fixed costs and a greater proportionof variable costs. When more of a product’s costs are variable, profit is less risky be-cause the sales volumes needed to cover fixed costs are relatively lower. CabbagePatch may have carried less operating risk than Adam.
Prioritizing. Given limited resources and their analyses of expected profit from the twoproducts, Coleco’s managers decided to prioritize production of Adam over Cabbage PatchDolls. This decision might have been clouded by management biases, as already discussed.
Envisioning. Despite previous poor sales of Adam, Coleco’s managers continued promot-ing the product. In hindsight, it is easy to criticize the company for this strategy; however, itwould have been difficult for Coleco’s managers to adequately estimate product sales. Later, themanagers adopted an ongoing strategy of seeking hot-selling toys. This strategy ultimately failed.
■ Decision Making Using Information about Revenues and Costs
Because Coleco’s managers overestimated Adam sales and underestimated Cabbage PatchDoll sales, they not only incurred substantial losses on the Adam line, but also lost the opportunity to gain more profit by selling additional Cabbage Patch Dolls. In Chapter 2, wefocused primarily on the estimation of costs. However, managers combine information aboutrevenues and costs to help them decide the mix and volumes of goods or services to produce
DETERMINING A PROFITABLE MIX OF PRODUCTS
ch03.qxd 9/27/04 4:06 PM Page 88

COST-VOLUME-PROFIT ANALYSIS 89
COST-VOLUME-PROFIT ANALYSIS
Cost-volume-profit (CVP) analysis is a technique that examines changes in profits in responseto changes in sales volumes, costs, and prices. Accountants often perform CVP analysis to planfuture levels of operating activity and provide information about:
● Which products or services to emphasize● The volume of sales needed to achieve a targeted level of profit● The amount of revenue required to avoid losses● Whether to increase fixed costs● How much to budget for discretionary expenditures● Whether fixed costs expose the organization to an unacceptable level of risk
■ Profit Equation and Contribution MarginCVP analysis begins with the basic profit equation.
Profit � Total revenue � Total costs
Separating costs into variable and fixed categories, we express profit as:
Profit � Total revenue � Total variable costs � Total fixed costs
The contribution margin is total revenue minus total variable costs. Similarly, the contri-bution margin per unit is the selling price per unit minus the variable cost per unit. Bothcontribution margin and contribution margin per unit are valuable tools when consideringthe effects of volume on profit. Contribution margin per unit tells us how much revenue fromeach unit sold can be applied toward fixed costs. Once enough units have been sold to coverall fixed costs, then the contribution margin per unit from all remaining sales becomes profit.
If we assume that the selling price and variable cost per unit are constant, then total rev-enue is equal to price times quantity, and total variable cost is variable cost per unit timesquantity. We then rewrite the profit equation in terms of the contribution margin per unit.
Profit � P � Q � V � Q � F � (P � V ) � Q � F
where P � Selling price per unitV � Variable cost per unit
(P � V ) � Contribution margin per unitQ � Quantity of product sold (units of goods or services)F � Total fixed costs
We use the profit equation to plan for different volumes of operations. CVP analysis can be performed using either:
● Units (quantity) of product sold● Revenues (in dollars)
■ CVP Analysis in UnitsWe begin with the preceding profit equation. Assuming that fixed costs remain constant, wesolve for the expected quantity of goods or services that must be sold to achieve a targetlevel of profit.
Profit equation: Profit � (P � V ) � Q � F
Solving for Q: Q � � Quantity (units) required to obtain target profit
Notice that the denominator in this formula, (P � V ), is the contribution margin per unit.
F � Profit��
(P � V )
Q1 What is cost-volume-profit (CVP) analysis,and how is it used fordecision making?
Q2 How are CVPcalculations performedfor a single product?
1Editorial, “A Proactive Approach to Cost Cutting,” SmartPros, June 2002, www.smartpros.com.
and sell. They also use this information to monitor operations and evaluate profitability risk.In this chapter, we combine revenues and costs in our analyses.
CURRENT PRACTICEAccording to Jon Scheumann,director of the business processconsulting firm Gunn Partners,successful organizations need aculture that is attuned to costmanagement and that pays attention to cost structures.1
ch03.qxd 9/27/04 4:06 PM Page 89

Suppose that Magik Bicycles wants to produce a new mountain bike called MagikbikeIII and has forecast the following information.
Price per bike � $800Variable cost per bike � $300Fixed costs related to bike production � $5,500,000Target profit � $200,000Estimated sales � 12,000 bikes
We determine the quantity of bikes needed for the target profit as follows:
Quantity � ($5,500,000 � $200,000) � ($800 � $300) � 11,400 bikes
■ CVP Analysis in RevenuesThe contribution margin ratio (CMR) is the percent by which the selling price (or rev-enue) per unit exceeds the variable cost per unit, or contribution margin as a percent of rev-enue. For a single product, it is
CMR �
To analyze CVP in terms of total revenue instead of units, we substitute the contributionmargin ratio for the contribution margin per unit. We rewrite the equation to solve for the to-tal dollar amount of revenue we need to cover fixed costs and achieve our target profit as
Revenue � �
To solve for the Magikbike III revenues needed for a target profit of $200,000, we firstcalculate the contribution margin ratio as follows:
CMR � ($800 � $300) � $800 � 0.625
A contribution margin ratio of 0.625 means that 62.5% of the revenue from each bike soldcontributes first to fixed costs and then to profit after fixed costs are covered.
Revenue � ($5,500,000 � $200,000) � 0.625 � $9,120,000
We check to see that the two results are identical by multiplying the number of units (11,400)times price ($800) to obtain the revenue amount ($9,120,000).
The contribution margin ratio can also be written in terms of total revenues (TR) andtotal variable costs (TVC). That is, for a single product, the CMR is the same whether wecompute it using per-unit selling price and variable cost or using total revenues and totalvariable costs. Thus, we can create the following mathematically equivalent version of theCVP formula.
Revenues �
For Magikbike III we could use the forecast information about volume (12,000 bikes)to determine the contribution margin ratio.
Total revenue � $800 � 12,000 bikes � $9,600,000Total variable cost � $300 � 12,000 bikes � $3,600,000Total contribution margin � $9,600,000 � $3,600,000 � $6,000,000Contribution margin ratio � $6,000,000 � $9,600,000 � 0.625
■ CVP for Multiple ProductsMany organizations sell a combination of different products or services. The sales mix is theproportion of different products or services that an organization sells. For example, we learnedin the opening vignette that Coleco sold both Adam computers and Cabbage Patch dolls. Touse CVP in the case of multiple products or services, we assume a constant sales mix in ad-dition to the other CVP assumptions. Assuming a constant sales mix allows CVP computa-tions to be performed using combined unit or revenue data for an organization as a whole.Later in the chapter we will learn how to perform detailed computations for the sales mix.
F � Profit��(TR � TVC)/TR
F � Profit��
CMRF � Profit��(P � V )/P
P � V�
P
90 CHAPTER 3 ➤ COST-VOLUME-PROFIT ANALYSIS
HELPFUL HINTComputing the CVP using totalrevenues and total variable costs isuseful in cases where per-unitvariable costs are unknown.
ch03.qxd 9/27/04 4:06 PM Page 90

■ Breakeven PointManagers often want to know the level of activity required to break even. A CVP analysiscan be used to determine the breakeven point, or level of operating activity at which rev-enues cover all fixed and variable costs, resulting in zero profit. We can calculate thebreakeven point from any of the preceding CVP formulas, setting profit to zero. Dependingon which formula we use, we calculate the breakeven point in either number of units or intotal revenues. For Magikbike III, breakeven points are:
Breakeven quantity � ($5,500,000 � $0) � ($800 � $300) � 11,000 bikesBreakeven revenue � ($5,500,000 � $0) � 0.625 � $8,800,000
■ Cost-Volume-Profit GraphA cost-volume-profit graph (or CVP graph) shows the relationship between total revenuesand total costs; it illustrates how an organization’s profits are expected to change under dif-ferent volumes of activity. Exhibit 3.1 presents a CVP graph for Magikbikes III. Notice thatwhen no bikes are sold, fixed costs are $5,500,000, resulting in a loss of $5,500,000. As salesvolume increases, the loss decreases by the contribution margin for each bike sold. The costand revenue lines intersect at the breakeven point of 11,000, which means zero loss and zeroprofit. Then as sales increase beyond this breakeven point, we see an increase in profit, grow-ing by the $500 contribution margin for each bike sold. Profits achieve the target level of$200,000 when sales volume reaches 11,400.
COST-VOLUME-PROFIT ANALYSIS 91
Q4 What is the breakevenpoint?
CURRENT PRACTICEThe U.S. Small BusinessAdministration Web siterecommends the use of breakevenanalysis and refers small businessowners to a breakeven analysiscalculator and CVP graphing tool.2
2Do a search for Breakeven Analysis at the U.S. Small Business Administration Web site, available at www.sba.gov.
EXHIBIT 3.1CVP Graph for Magik Bicycles’ Magikbike III.
Dolla
rs
Quantity of bikes
11,000
$5,500,000
$8,800,000$9,120,000
11,400
Operatingloss area
Operatingincome area
Total revenue
Total costsBreakeven point
GUIDE YOUR LEARNING 3.1 Key Terms
Stop to confirm that you understand the new terms introduced in the last several pages.
Cost-volume-profit (CVP) analysis (p. 89) *Sales mix (p. 90)Contribution margin (p. 89) Breakeven point (p. 91)Contribution margin per unit (p. 89) Cost-volume-profit graph (p. 91)Contribution margin ratio (CMR) (p. 90)
For each of these terms, write a definition in your own words. For the starred term, list at leastone example that is different from the ones given in this textbook.
ch03.qxd 9/27/04 4:06 PM Page 91

■ CVP with Income TaxesUp to this point, our CVP calculations ignored income taxes. An organization’s after-taxprofit is calculated by subtracting income tax from pretax profit. The tax is usually calcu-lated as a percentage of pretax profit.
After-tax profit � Pretax profit � Taxes� Pretax profit � (Tax rate � Pretax profit)� Pretax profit � (1 � Tax rate)
If we want to know the amount of pretax profit needed to achieve a target level of after-taxprofit, we solve the preceding formula for pretax profit:
Pretax profit �
Suppose that Magik Bicycles plans for an after-tax profit of $20,000 and its tax rate is30%. Then,
Pretax profit � $20,000 � (1 � 0.30) � $28,571
The company needs a pretax profit of $28,571 to earn an after-tax profit of $20,000.The following illustration develops a cost function to calculate the volumes needed to
break even and to achieve a target after-tax profit when multiple products are involved.
After-tax profit��(1 � Tax rate)
92 CHAPTER 3 ➤ COST-VOLUME-PROFIT ANALYSIS
ALTERNATIVE TERMSSome people use the terms operatingincome (loss) or income (loss) beforeincome taxes instead of pretax profit(loss). Similarly, some people use netincome (loss) instead of after-taxprofit (loss).
DIE GEFLECKTE KUH EIS (THE SPOTTED COW CREAMERY) (PART 1)CVP ANALYSIS WITH INCOME TAXES
Die Gefleckte Kuh Eis (The Spotted Cow Creamery) is a popular ice cream emporium near a uni-versity in Munich, Germany. Information for the most recent month (amounts in euros) appears here.
Revenue 40,000Cost of food and beverages sold 20,000Labor 15,000Rent
���1�,�0�0�0�
Pretax profit 4,000Income taxes (25%)
���1�,�0�0�0�
After-tax profit����
3��,��0��0��0��
The store owner asked the manager, Holger Soderstrom, to estimate results for the nextmonth. This particular outlet has not performed as well as the owner’s other three outlets. Hol-ger believes that sales volumes will increase to 48,000 next month because it has been an un-usually hot and dry summer.
Estimating the Cost FunctionTo perform CVP analysis, Holger first estimates the cost function. Using accounting records, he clas-sifies each cost as fixed or variable and then estimates next month’s cost. Of the costs listed in theaccounting records, labor ( 15,000) and rent ( 1,000) are most likely fixed (assuming employeeswork fixed schedules). Assuming that fixed costs do not change from month to month, Holger’s bestestimate of next month’s fixed costs is 16,000 ( 15,000 � 1,000). The remaining item, cost offood and beverages sold ( 20,000), is most likely a variable cost. Because The Spotted Cow Cream-ery’s focus is retail sales of ice cream and other food items, Holger can reasonably assume that salesvolume drives this variable cost. Thus, he estimates expected variable costs as a percent of revenue:
20,000 � 40,000 � 0.50, or 50% of revenue
Holger combines his fixed and variable cost estimates to create the following cost function for next month:
TC � 16,000 � (50% � Revenues)
Estimating After-Tax ProfitIf next month’s revenues are 48,000, Holger expects total variable costs to be (50% � 48,000) �
24,000. Therefore, his estimate of pretax profit is
Pretax profit � 48,000 � 16,000 � 24,000 � 8,000
ch03.qxd 9/27/04 4:06 PM Page 92

COST-VOLUME-PROFIT ANALYSIS 93
Holger estimates income taxes and after-tax profit, assuming that income taxes remain at 25% ofpretax profit:
After-tax profit � 8,000(1 � 0.25) � 6,000
Calculating Revenues to Achieve Targeted After-Tax ProfitHolger presents the preceding information to the owner. However, the owner still has concernsabout this outlet because the other outlets have achieved after-tax profits of about 8,000 eachduring the last few months. The owner thinks that sales volume might be the problem. To help an-alyze this possibility, Holger determines the sales volume necessary to earn after-tax profits of 8,000per month. He begins by calculating the targeted pretax profit:
Pretax profit � 8,000 � (1 � 0.25) � 10,667
Next, he uses the following CVP formula to solve for targeted revenue:
Revenues �
Substituting in the preceding information:
Revenues � ( 16,000 � 10,667) � 0.50 � 53,334
Notice that Holger uses the contribution margin ratio calculated with the sales revenue and vari-able costs from his original analysis.
Holger summarizes his target profit calculations for the owner as follows:
Revenue 53,334Cost of food and beverages sold (50% of 53,334) 26,667Labor (fixed) 15,000Rent (fixed)
���1�,�0�0�0�
Pretax profit 10,667Income taxes (25%)
���2�,�6�6�7�
After-tax profit����
8��,��0��0��0��
For the outlet to achieve an after-tax profit of 8,000, revenues need to increase by 33% [( 53,334 � 40,000) � 40,000] over last month.
Holger presents this information to the owner and argues that sales will increase to 53,334because the weather will be hotter next month. However, the owner thinks that Holger may be wor-ried about being replaced, and so his revenue estimates are probably biased upwards. The ownerdecides to investigate Holger’s estimates further by comparing his revenues and costs to those inthe other outlets.
F � Profit��
CMR
GUIDE YOUR LEARNING 3.2 The Spotted Cow Creamery (Part 1)
The Spotted Cow Creamery (Part 1) illustrates a multiple-product CVP analysis with income taxes. For this illustration:
Identify Problem Define It and Information Identify Uncertainties Explore Assumptions Explore Biases
Which definitions, analy-sis techniques, andcomputations wereused?
What decisions werebeing addressed? Whatinformation was rele-vant to the decisions?
What types of uncer-tainties were there?Consider uncertaintiesabout:● Revenue and cost
estimates● Interpreting results● Relevant range of
operations● Feasibility of activity
level
Reread the first part ofthis chapter and iden-tify the assumptionsused in developing theCVP formulas. How reasonable are these assumptions for The Spotted Cow Creamery?
Why and how mightthe manager’s bias influence the computa-tions? Why would theowner be uncertainwhether the managerhad created biased rev-enue or cost estimates?
ch03.qxd 9/27/04 4:06 PM Page 93

94 CHAPTER 3 ➤ COST-VOLUME-PROFIT ANALYSIS
PERFORMING CVP ANALYSES WITH A SPREADSHEET
Spreadsheets are often used for CVP computations, particularly when an organizationhas multiple products. Spreadsheets simplify the basic computations and can be designedto show how changes in volumes, selling prices, costs, or sales mix alter the results.
■ CVP Calculations for a Sales MixAlthough The Spotted Cow Creamery sells multiple products, the CVP analysis performedby the store manager did not provide computations for individual products. Instead, the anal-ysis focused on the total amount of revenue needed to achieve a target profit. If the managerwants to use CVP results to plan future operations for individual products, the required rev-enue for each product needs to be determined. Such computations are performed using thesales mix. The sales mix should be stated as a proportion of units when performing CVPcomputations in units, and it should be stated as a proportion of revenues when performingCVP computations in revenues. Sales mix computations can become cumbersome if per-formed manually; it is easiest to use a spreadsheet.
To demonstrate CVP computations using a spreadsheet, suppose that Magik Bicyclesdeveloped three different products, a small bike for children and youths, a road bike, and amountain bike. Total fixed costs for the company are $14,700,000. Forecasted sales volumesare as follows. The sales mix in percentages is calculated from these volumes.
Youth Road Mountain TotalForecasted volume (units) 10,000 18,000 12,000 40,000Expected sales mix in units 25% 45% 30% 100%
Because of increased competition and an economic downturn, the managers of Magik Bi-cycles are uncertain about the company’s ability to achieve the forecasted level of sales. Theywould like to know the minimum amount of sales needed for an after-tax profit of $100,000.The company’s income tax rate is 30%. The expected unit selling prices, variable costs, andcontribution margins for each product are as follows:
Youth Road MountainPrice per unit $200 $700 $800Variable cost per unit
���7�5� �
2�5�0� �
3�0�0�
Contribution margin per unit $��
1��2��5��
$��
4��5��0��
$��
5��0��0��
Exhibit 3.2 shows a sample CVP spreadsheet for Magik Bicycles. Notice that all of theinput data is placed in an area labeled as “Input section” in the spreadsheet. The calculationsare performed outside of this area (formulas for this spreadsheet are shown in Appendix 3A).Spreadsheets designed this way allow users to alter the assumptions in the input section with-out performing any additional programming.
The spreadsheet in Exhibit 3.2 first uses the input data to compute expected revenues,costs, and income. The revenues and variable costs for each product are computed by mul-tiplying the expected sales volume times the selling price and variable cost per unit shownin the input area. The revenues and variable costs for the three products are then combinedto determine total revenues and total variable costs for the company. After subtracting ex-pected fixed costs and income taxes (30% of pretax income), the expected after-tax incomeis $455,000.
When an organization produces and sells a number of different products or services, weuse the weighted average contribution margin per unit to determine the breakeven point ortarget profit in units. Similarly, we use the weighted average contribution margin ratio to de-termine the breakeven point or target profit in revenues. “Weighted average” here refers tothe expected sales mix: 10,000 youth bikes or $2,000,000 in revenues, 18,000 road bikes or
Q3 How are CVPcalculations performedfor multiple products?
CURRENT PRACTICESpreadsheet skills are importantprofessionally. The AmericanInstitute of Certified PublicAccountants (AICPA) states that anentry-level accountant should beable to “appropriately use electronicspreadsheets and other software tobuild models and simulations.”3
3This skill is an element of the competency “Leverage Technology to Develop and Enhance Functional Compe-tencies,” AICPA Core Competency Framework, accessed through the Library at eca.aicpaservices.org/.
ch03.qxd 9/27/04 4:06 PM Page 94

$12,600,000 in revenues, and 12,000 mountain bikes or $9,600,000 in revenues. Given thesales mix, the weighted average contribution margin per unit is calculated as the combinedcontribution margin ($15,350,000) divided by the total number of units expected to be sold(40,000), or $383.75 per unit as computed in Exhibit 3.2.4 The weighted average contribu-tion margin ratio is the combined contribution margin ($15,350,000) divided by combinedrevenue ($24,200,000), or 63.43%.5
PERFORMING CVP ANALYSES WITH A SPREADSHEET 95
4Another way to compute the weighted average contribution margin per unit is to sum the contribution margins forthe three products, weighted by number of units sold as follows: (10,000 � 40,000)($200 � $75) � (18,000 �40,000)($700 � $250) � (12,000 � 40,000)($800 � $300) � $383.75.
5Another way to compute the weighted average contribution margin ratio is to sum the contribution margin ratios for thethree products, weighted by revenues as follows: ($2,000,000 � $24,200,000)[($200 � $75) � $200] � ($12,600,000 �$24,200,000)[($700 � $250) � $700] � ($9,600,000 � $24,200,000)[($800 � $300) � $800] � 63.43%.
EXHIBIT 3.2Spreadsheet for Magik Bicycles CVP with Multiple Products
Input sectionExpected sales volume-unitsPrice per unitVariable cost per unit
Fixed costsDesired after-tax profitIncome tax rate
Contribution MarginUnitsRevenueVariable costsContribution margin
Contrib. margin per unit Contrib. margin ratio
Expected sales mix in unitsExpected sales mix in revenues
Expected IncomeContribution margin (above)Fixed costs Pretax incomeIncome taxes After-tax income
Preliminary CVP CalculationsTarget pretax profit for CVP analysisFixed costs plus target pretax profit
CVP analysis in unitsCVP calculation in unitsRevenueVariable costsContribution marginFixed costsPretax incomeIncome taxesAfter-tax income
CVP analysis in revenuesCVP calculation in revenuesVariable costsContribution marginFixed costsPretax incomeIncome taxesAfter-tax income
Youth Bikes10,000
$200$75
$14,700,000$100,000
30%
Youth Bikes10,000
$2,000,000750,000
$1,250,000
$125.0062.50%
25.00%8.26%
Youth Bikes9,669.614
$1,933,923725,221
$1,208,702
Youth Bikes$1,933,923
725,221$1,208,702
Road Bikes18,000
$700$250
(enter zero for breakeven)
Road Bikes18,000
$12,600,0004,500,000
$8,100,000
$450.0064.29%
45.00%52.07%
Road Bikes17,405.305
$12,183,7134,351,326
$7,832,387
Road Bikes$12,183,713
4,351,326$7,832,387
Mtn. Bikes12,000
$800$300
Mtn. Bikes12,000
$9,600,0003,600,000
$6,000,000
$500.0062.50%
30.00%39.67%
Mtn. Bikes11,603.537$9,282,829
3,481,061$5,801,768
Mtn. Bikes$9,282,829
3,481,061$5,801,768
Total Bikes40,000
$24,200,0008,850,000
$15,350,000
$383.7563.43%
100.00%100.00%
$15,350,00014,700,000
650,000195,000
$455,000
$142,857$14,842,857
Total Bikes38,678
$23,400,4658,557,608
14,842,85714,700,000
142,85742,857
$100,000
Total Bikes$23,400,465
8,557,60814,842,85714,700,000
142,85742,857
$100,000
A123456789
10111213141516171819202122232425262728293031323334353637383940414243444546474849505152
B C D E
Note: Appendix 3A provides a version of this spreadsheet showing the cell formulas.
ch03.qxd 9/27/04 4:06 PM Page 95

96 CHAPTER 3 ➤ COST-VOLUME-PROFIT ANALYSIS
The spreadsheet in Exhibit 3.2 performs CVP computations using both units and rev-enues. To achieve an after-tax target profit of 100,000, the company must earn a pretax profitof $142,857 [$100,000 � (1 � 0.30)]. To compute the total number of units (bikes) that mustbe sold to achieve the target profit, we divide the fixed costs plus the target profit by theweighted average contribution margin per unit:
Units needed for target profit � Q � � � 38,678 units
Magik needs to sell 38,678 units to achieve an after-tax target profit of $100,000. To deter-mine the number of units for each product that must be sold, we multiply the total numberof units (38,678) by each product’s expected sales mix in units. For example, the companymust sell 38,678 units � (10,000 units � 40,000 units), or 9,670 youth bikes.
To calculate the amount of revenue needed to achieve the target after-tax profit of$100,000, we divide the fixed costs plus the target pretax profit by the weighted averagecontribution margin ratio:
Revenues � � � $23,400,373
The difference between the spreadsheet and this hand-calculated amount is due to round-ing, as are any differences in the following amounts. To determine the revenues for eachproduct that must be sold, we multiply the total revenues ($23,400,373) by each product’sexpected sales mix in revenues. For example, the company must achieve $23,400,373 �($2,000,000 � $24,200,000), or $1,933,914 in revenues from youth bikes. Notice that therequired revenue for each product is equal to the required number of units times the ex-pected selling price. For youth bikes, 9,670 units � $200 per unit � $1,934,000.
The results of calculations using units and revenues are always identical. Because in-formation in the example was given in units, it would have been easiest to create the spread-sheet using only the computations for CVP in units. However, in some situations per-unitinformation is not available. In those cases, it is necessary to perform CVP calculations us-ing revenues. Later in the chapter we revisit the ice cream shop illustration to analyze theinfluence of sales mix on the total contribution margin.
■ CVP Sensitivity AnalysisOne of the benefits of creating a spreadsheet with a separate input section is that additionalCVP analyses can easily be performed by the changing input data. For example, suppose themanagers of Magik Bicycles want to know the number of bikes they must sell to break even.We can return to the spreadsheet in Exhibit 3.2 and change the “Desired after-tax profit” to zero. The resulting spreadsheet, showing only CVP calculations in units, is presented inExhibit 3.3.
The managers of Magik Bicycles could use the CVP spreadsheet to perform several dif-ferent types of sensitivity analyses. Suppose sales of the mountain bike are falling behind
$14,700,000 � $142,857���
63.43%F � Profit��
CMR
$14,700,000 � $142,857���
$383.75 per unitF � Profit��
(P � V )
Q5 What assumptions andlimitations shouldmanagers considerwhen using CVPanalysis?
EXHIBIT 3.3Spreadsheet Results forMagik Bicycles BreakevenAnalysis
Preliminary CVP CalculationsTarget pretax profit for CVP analysisFixed costs plus target pretax profit
CVP analysis in unitsCVP calculation in unitsRevenueVariable costsContribution marginFixed costsPretax incomeIncome taxesAfter-tax income
Youth Bikes9,576.547
$1,915,309718,241
$1,197,068
Road Bikes17,237.785
$12,066,4504,309,446
$7,757,003
Mtn. Bikes11,491.857$9,193,485
3,447,557$5,745,928
$0$14,700,000
Total Bikes38,306
$23,175,2448,475,244
14,700,00014,700,000
00
$0
A31323334353637383940414243
B C D E
ch03.qxd 9/27/04 4:06 PM Page 96

PERFORMING CVP ANALYSES WITH A SPREADSHEET 97
expectations. They could determine the effects of the change in sales mix on results. Everyassumption in the data input box is easily changed to update information. Sensitivity analy-sis helps managers explore the potential impact of variations in data they consider to be par-ticularly important or uncertain.
■ Discretionary Expenditure DecisionCVP analysis also helps managers make business decisions such as whether to increaseor decrease discretionary expenditures. For example, suppose the managers of MagikBicycles want to advertise one of their products more heavily. A distributor pointed out that the road bike price was less than a competitor’s price for a model with fewerfeatures. The competitor’s brand name is quite well known, but the distributor thinksthat he could sell at least 10% more road bikes if Magik launched a regional advertis-ing campaign.
The managers of Magik estimate that an additional expenditure of $100,000 in adver-tising will increase road bike sales by 5%, to 18,900 bikes. To estimate the effects of theproposed expenditure, we return to the spreadsheet in Exhibit 3.2 and make two changes.First, fixed costs would increase by $100,000 to $14,800,000. Second, the expected volumeof road bikes sold would increase to 18,900. The resulting spreadsheet in Exhibit 3.4 indi-cates that after-tax profits are expected to increase by $213,500 from $455,000 to $668,500.Notice on the spreadsheet that the change in sales mix affects the weighted average contri-bution margin; it changes from 383.75 to $385.21.
We could perform the same calculation without the spreadsheet by subtracting the$100,000 investment in fixed costs from the additional contribution margin of $405,000[900 bikes � ($700 � $250)]. The resulting incremental after-tax profit is $213,500[($405,000 � $100,000)(1 � 0.30)]. Because profits are expected to increase more thancosts for this advertising campaign, the managers would be likely to make the additionalinvestment.
■ Planning, Monitoring, and Motivating with CVPCVP analyses are useful for planning and monitoring operations and for motivating employeeperformance. If the owner of The Spotted Cow Creamery obtains similar information for theother outlets, results can be compared to identify differences in revenue levels and cost func-tions. For example, unusually high labor costs might suggest that the low-profit outlet isoverstaffed or inefficient. Once the owner analyzes the reasons for differences in profitabil-ity, emphasis can be placed on increasing revenues, reducing costs, or both. The owner canalso hold managers more accountable for performance, which should motivate their work ef-forts toward the owner’s goals.
Q1 What is cost-volume-profit (CVP) analysis,and how is it used fordecision making?
EXHIBIT 3.4Spreadsheet for Magik Bicycles Advertising Expenditure Decision
Contribution MarginUnitsRevenueVariable costsContribution margin
Contrib. margin per unit Contrib. margin ratio
Expected sales mix in unitsExpected sales mix in revenues
Expected IncomeContribution margin (above)Fixed costs Pretax incomeIncome taxes After-tax income
Youth Bikes10,000
$2,000,000750,000
$1,250,000
$125.0062.50%
24.45%8.05%
Road Bikes18,900
$13,230,0004,725,000
$8,505,000
$450.0064.29%
46.21%53.28%
Mtn. Bikes12,000
$9,600,0003,600,000
$6,000,000
$500.0062.50%
29.34%38.66%
Total Bikes40,900
$24,830,0009,075,000
$15,755,000
$385.2163.45%
100.00%100.00%
$15,755,00014,800,000
955,000286,500
$668,500
A121314151617181920212223242526272829
B C D E
CHAPTER REFERENCEChapter 4 uses CVP analysis foradditional types of decisions. We also learn that decisions are ofteninfluenced by qualitative informationthat is not valued in numerical terms.
CHAPTER REFERENCEIn Chapter 10, CVP analysis is used tocreate flexible budgets for measuringand monitoring performance atdifferent levels of activity.
ch03.qxd 9/27/04 4:06 PM Page 97

98 CHAPTER 3 ➤ COST-VOLUME-PROFIT ANALYSIS
DIE GEFLECKTE KUH EIS (THE SPOTTED COW CREAMERY) (PART 2)THE INFLUENCE OF SALES MIX ON PROFITABILITY
The owner of The Spotted Cow Creamery has several profitable stores. He asked the store man-agers to provide information about their sales mix, specifically the amount of beverage versusice cream products sold. Beverages provide a much larger contribution margin than ice cream.After analyzing the data, he found that about half of the revenues in the most profitable storeswere for the sale of beverages. In addition, these stores have more stable sales throughout thewinter because they sell specialty coffee beverages as well as soft drinks.
The owner shared this information with Holger, the manager of a less profitable store. Hol-ger investigates the contribution margins from beverages and ice cream at his store. He sets upa spreadsheet to examine the influence of the sales mix on profitability, shown in Exhibit 3.5(a).He finds that beverages are about 15% of total revenue ( 6,000 � 40,000). The contributionmargin ratio for beverages is 93% ( 5,600 � 6,000), whereas the contribution margin for icecream is 42% ( 14,400 � 34,000). When he changes the desired sales mix in the spreadsheetfrom 15% to 50% beverages to match the sales mix of more profitable stores, the after-tax in-come increases by a sizeable amount from 3,000 to 8,353 as indicated in Exhibit 3.5(b).
Holger realizes that several strategies would increase the percentage of beverages in hiscurrent sales mix. First, he could require the sales clerks to suggest a beverage with each sale. Inaddition, he could emphasize beverages in his advertising. He could also analyze his competitors’beverage prices to be certain that his prices are competitive. A small drop in the price of beveragesmight increase the volume of beverages sold more than enough to offset the decline in contribu-tion margin ratio. He uses the spreadsheet to perform sensitivity analysis around these factors.
EXHIBIT 3.5 Spreadsheet for The Spotted Cow Creamery
Input section
RevenueVariable costCurrent sales mix in revenuesFixed costsTax rateDesired sales mix in revenues
Contribution margin ratio
Income statementRevenueVariable costContribution margin
Fixed costsPretax incomeTaxesAfter tax income
Beverage€6,000
40015%
15%
93%
€6,000400
5,600
Ice Cream€34,000
19,60085%
85%
42%
€34,00019,60014,400
Total€40,000
20,000100%
16,00025%
100%
Weighted Average50%
€40,00020,00020,000
16,0004,0001,000
€3,000
A12345678910111213141516171819202122
B C D
Input section
RevenueVariable costCurrent sales mix in revenuesFixed costsTax rateDesired sales mix in revenues
Contribution margin ratio
Income statementRevenueVariable costContribution margin
Fixed costsPretax incomeTaxesAfter tax income
Beverage €6,000
40015%
50%
93%
€20,0001,333
18,667
Ice Cream€34,000
19,60085%
50%
42%
€20,00011,529
8,471
Total€40,000
20,000100%
16,00025%
100%
Weighted Average68%
€40,00012,86327,137
16,00011,137
2,784€8,353
A12345678910111213141516171819202122
B C D
GUIDE YOUR LEARNING 3.3 The Spotted Cow Creamery (Part 2)
The Spotted Cow Creamery (Part 2) illustrates the influence of sales mix on profitability. For thisillustration:
Compute It Identify Uncertainties Explore Uses
For Exhibit 3.5, manually recalculate:● Sales mix in units● Sales mix in revenues● Weighted average contribu-
tion margin ratio
At the end of the illustration,the store manager was con-sidering several strategies forchanging his store’s sales mix.What uncertainties does themanager face?
How was CVP informationused by the owner? How wasit used by the manager?
(a) Current Sales Mix (b) Desired Sales Mix
ch03.qxd 9/27/04 4:06 PM Page 98

ASSUMPTIONS AND LIMITATIONS OF COST-VOLUME-PROFIT ANALYSIS 99
Exhibit 3.6 summarizes the input data, assumptions, and uses of CVP analysis. CVP anal-ysis relies on several assumptions. In Chapter 2 we assumed for the linear cost function(F � V � Q) that production volumes are within a relevant range of operations wherefixed costs remain fixed and variable costs remain constant. In addition, for CVP analysis,we assume that selling prices remain constant and that the sales mix is constant. Sensitivityanalysis can be performed to determine the sensitivity of profits to these assumptions.
■ Uncertainties and Quality of Input DataAs indicated in Exhibit 3.6, CVP analysis relies on forecasts of expected revenues and costs. CVP assumptions rule out fluctuations in revenues or costs that might be caused bycommon business factors such as supplier volume discounts, learning curves, changes in pro-duction efficiency, or special customer discounts. In addition, many uncertainties may ariseabout whether CVP assumptions will be violated, such as the following:
● Can volume of operating activity be achieved?● Will selling prices increase or decrease?● Will sales mix remain constant?● Will fixed or variable costs change as operations move into a new relevant
range?● Will costs change due to unforeseen causes?● Are revenue and cost estimates biased?
ASSUMPTIONS ANDLIMITATIONS OFCOST-VOLUME-PROFIT ANALYSIS
Q5 What assumptions andlimitations shouldmanagers considerwhen using CVPanalysis?
CHAPTER REFERENCEChapter 2 explains the importance ofthe relevant range in measuring thecost function.
EXHIBIT 3.6 Input Data, Assumptions, and Uses of CVP Analysis
Input Data for CVP Analysis
Expected Revenues (volume and sellingprice)
Expected Costs (cost function)
Sales Mix (for multipleproducts)
CVP Analysis and AssumptionsCalculate number of units or rev-enues needed for:
● Breakeven● Target profit
Assumptions:
● Operations within a relevantrange● Linear cost function
–Fixed costs remain constant–Variable cost per unit remainsconstant
● Linear revenue function–Sales mix remains constant–Prices remain constant
Use Results to:Describe volume, revenues, costs, and profits:
● Values at breakeven or target profit.:–Units sold–Revenues–Variable, fixed, and total costs
● Sensitivity of results to changes in:–Levels of activity –Selling price–Cost function –Sales mix
● Indifference point between alternatives● Feasibility of planned operations
Assist with plans and decisions such as:
● Budgets● Product emphasis● Selling price● Production or activity levels● Employee work schedules● Raw material purchases● Discretionary expenditures such as advertising● Proportions of fixed versus variable costs
Monitor operations by comparing expected and actual:
● Volumes, revenues, costs, and profits● Profitability risk
ch03.qxd 9/27/04 4:06 PM Page 99
100 CHAPTER 3 ➤ COST-VOLUME-PROFIT ANALYSIS
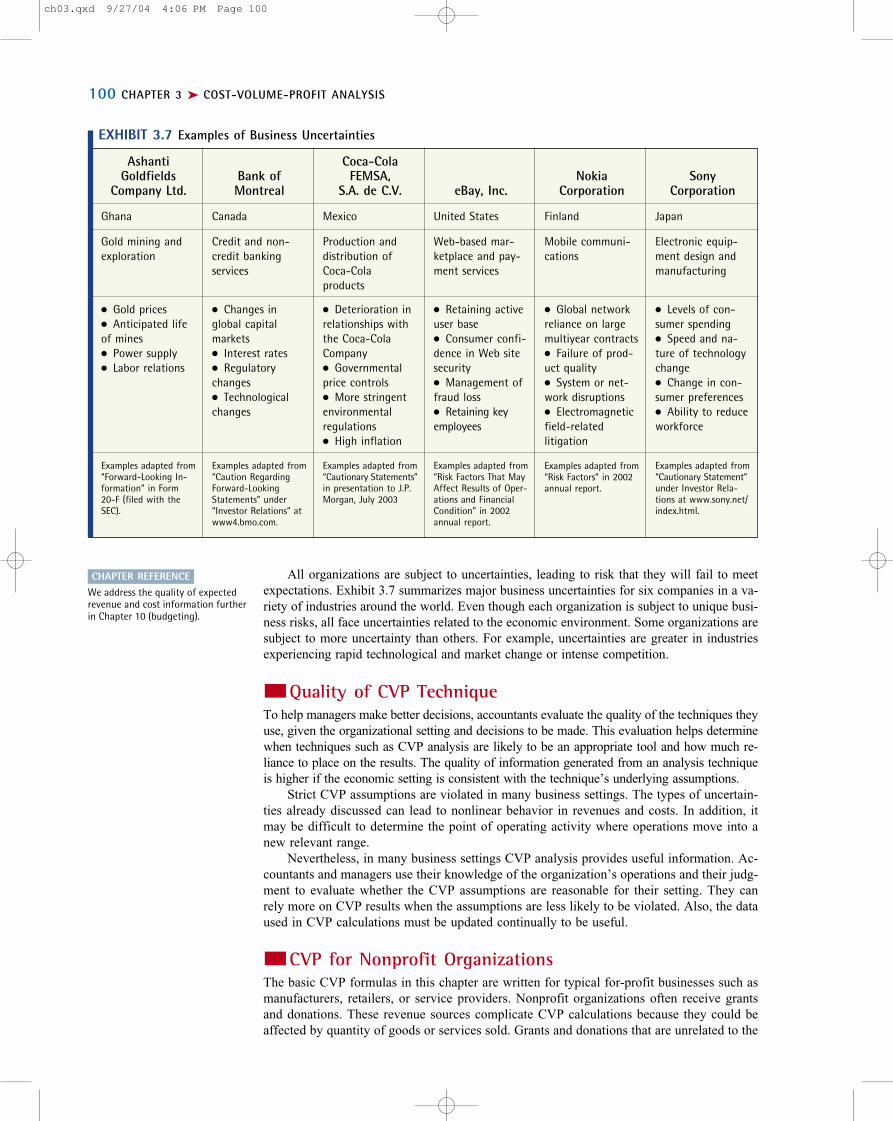
EXHIBIT 3.7 Examples of Business Uncertainties
Ashanti Goldfields
Company Ltd.
Ghana
Gold mining andexploration
● Gold prices● Anticipated lifeof mines● Power supply● Labor relations
Examples adapted from“Forward-Looking In-formation” in Form20-F (filed with theSEC).
Bank of Montreal
Canada
Credit and non-credit banking services
● Changes inglobal capital markets● Interest rates● Regulatorychanges● Technologicalchanges
Examples adapted from“Caution RegardingForward-LookingStatements” under “Investor Relations” atwww4.bmo.com.
Coca-ColaFEMSA,
S.A. de C.V.
Mexico
Production anddistribution ofCoca-Cola products
● Deterioration inrelationships withthe Coca-ColaCompany● Governmentalprice controls● More stringentenvironmental regulations● High inflation
Examples adapted from “Cautionary Statements”in presentation to J.P.Morgan, July 2003
eBay, Inc.
United States
Web-based mar-ketplace and pay-ment services
● Retaining activeuser base● Consumer confi-dence in Web sitesecurity● Management offraud loss● Retaining keyemployees
Examples adapted from“Risk Factors That MayAffect Results of Oper-ations and FinancialCondition” in 2002 annual report.
Nokia Corporation
Finland
Mobile communi-cations
● Global networkreliance on largemultiyear contracts● Failure of prod-uct quality● System or net-work disruptions● Electromagneticfield-related litigation
Examples adapted from“Risk Factors” in 2002annual report.
Sony Corporation
Japan
Electronic equip-ment design andmanufacturing
● Levels of con-sumer spending● Speed and na-ture of technologychange● Change in con-sumer preferences● Ability to reduceworkforce
Examples adapted from“Cautionary Statement”under Investor Rela-tions at www.sony.net/index.html.
All organizations are subject to uncertainties, leading to risk that they will fail to meetexpectations. Exhibit 3.7 summarizes major business uncertainties for six companies in a va-riety of industries around the world. Even though each organization is subject to unique busi-ness risks, all face uncertainties related to the economic environment. Some organizations aresubject to more uncertainty than others. For example, uncertainties are greater in industriesexperiencing rapid technological and market change or intense competition.
■ Quality of CVP TechniqueTo help managers make better decisions, accountants evaluate the quality of the techniques theyuse, given the organizational setting and decisions to be made. This evaluation helps determinewhen techniques such as CVP analysis are likely to be an appropriate tool and how much re-liance to place on the results. The quality of information generated from an analysis techniqueis higher if the economic setting is consistent with the technique’s underlying assumptions.
Strict CVP assumptions are violated in many business settings. The types of uncertain-ties already discussed can lead to nonlinear behavior in revenues and costs. In addition, itmay be difficult to determine the point of operating activity where operations move into anew relevant range.
Nevertheless, in many business settings CVP analysis provides useful information. Ac-countants and managers use their knowledge of the organization’s operations and their judg-ment to evaluate whether the CVP assumptions are reasonable for their setting. They canrely more on CVP results when the assumptions are less likely to be violated. Also, the dataused in CVP calculations must be updated continually to be useful.
■ CVP for Nonprofit OrganizationsThe basic CVP formulas in this chapter are written for typical for-profit businesses such asmanufacturers, retailers, or service providers. Nonprofit organizations often receive grantsand donations. These revenue sources complicate CVP calculations because they could beaffected by quantity of goods or services sold. Grants and donations that are unrelated to the
CHAPTER REFERENCEWe address the quality of expectedrevenue and cost information furtherin Chapter 10 (budgeting).
ch03.qxd 9/27/04 4:06 PM Page 100

ASSUMPTIONS AND LIMITATIONS OF COST-VOLUME-PROFIT ANALYSIS 101
quantity of goods or services sold are offset against fixed costs in the CVP formulas. How-ever, when grants and donations vary with a not-for-profit organization’s operating activi-ties, they might be included in revenues or subtracted from variable costs. The treatment de-pends on the nature of the grant or donation.
The following illustration continues the story of Small Animal Clinic from Chapter 2.Recall that Small Animal Clinic is a not-for-profit organization that treats small animals. Itreceived a foundation grant that matches incoming revenues. For example, if a pet ownerpays $30 in fees, the foundation matches with an additional $30 to the clinic. In this case,the grant is included in revenues for CVP calculations.
SMALL ANIMAL CLINICNOT-FOR-PROFIT ORGANIZATION CVP ANALYSIS
WITH TWO RELEVANT RANGES
Leticia Brown, Small Animal Clinic manager, and the accountant, Josh Hardy, are completing theoperating budget for 2006. Leticia estimated that the clinic will experience 3,800 animal visits,and Josh estimated the cost function as follows:6
TC � $119,009 � $16.40Q
where Q is the number of animal visits. Leticia and Josh budgeted revenue per animal visit at$60 ($30 in fees plus $30 in matching grant). Thus, they estimated that the clinic should achievea surplus of $46,671[($60)(3,800) � $119,009 � ($16.40)(3,800)]. The clinic is a not-for-profitorganization and pays no income taxes on its surplus.
To complete the planning process for next year, Leticia asks Josh to compute the clinic’sbreakeven point. As manager of a not-for-profit organization, she is particularly sensitive to finan-cial risk and wants to know how much the clinic’s activity levels could drop before a loss would occur.
Breakeven Compared to BudgetJosh performs the following calculations. With revenue per visit of $60, the contribution marginper animal visit is
P � V � $60.00 � $16.40 � $43.60
Josh solves for Q with profit equal to $0 to find the breakeven point in number of animal visits:
Q � � � 2,730 visits
Leticia is pleased to see that the budgeted number of animal visits (3,800) is significantlyhigher than the breakeven number. This result gives her considerable assurance that the clinic isnot likely to incur a loss, even if revenues fail to achieve targeted levels or if costs exceed esti-mated amounts.
Potential Investment in New EquipmentDuring the first two months of 2006, Leticia learns that the number of animal visits at Small Ani-mal Clinic is running approximately 10% higher than the budget, and costs seem to be under con-trol. Leticia thinks that the clinic might be on track for a high surplus this year.
For the past two years, Leticia has been interested in purchasing equipment costing $200,000to provide low-cost neutering services. This year PAWS, a local charity, offered to pay for half ofthe equipment cost, but only after the clinic raises the other half of the funds. Currently the clinichas no excess cash because surpluses from prior years were invested in other projects. Thus, the
($119,009 � $0)��
$43.60F � Profit��
(P � V )
6 In the Chapter 2 illustration Small Animal Clinic (Part 2), the cost function was calculated as: TC � $119,009 �($15.20)(Number of animal visits) � (0.04)(Fee revenue). If average fee revenue is $30 per animal visit, thenthe last term in the cost function can be rewritten as (0.04)($30)(Number of animal visits), which can besimplified as ($1.20)(Number of animal visits). This substitution allows the cost function to be rewritten as:TC � $119,009 � ($16.40)(Number of animal visits). This version of the cost function is appropriate for esti-mating total costs for the clinic, but it would not be appropriate for estimating total costs for a single ani-mal visit, where the fees vary depending on the services performed.
(continued)
ch03.qxd 9/27/04 4:06 PM Page 101

102 CHAPTER 3 ➤ COST-VOLUME-PROFIT ANALYSIS
clinic needs to raise $100,000 to receive the PAWS grant. Leticia asks Josh to calculate the numberof animal visits needed to achieve a surplus of $100,000.
Calculating and Analyzing Targeted Activity LevelJosh calculates the expected quantity needed to achieve $100,000 surplus as follows:
Q � � � � 5,024 animal visits
He then calculates the total dollar amount of revenue needed:
Revenues � � � $310,389
Josh tells Leticia that the clinic will need to earn $301,389 in revenues or 5,024 visits to achieve asurplus of $100,000.
The budgeted level of activity (3,800 animal visits) is substantially higher than the level of ac-tivity needed to break even (2,730 animal visits). If animal visits continue to exceed this year’s budgetby 10%, Josh estimates that animal visits will reach 4,180 (3,800 � 1.10) by year-end. However, he thinks that it would be very difficult to achieve a targeted surplus of $100,000 (5,024 animalvisits).
CVP Adjusted for Change in Relevant RangeAs Josh works on his report, he realizes that the clinic’s cost function might change if the num-ber of animal visits gets very high. Leticia told him that she will probably hire another technicianand need to rent more space and purchase additional equipment if animal visits exceed 4,000 thisyear. Therefore, Josh’s cost function for 5,024 visits is wrong. He develops a new cost function as-suming that an additional technician, space, and equipment will increase fixed costs by about$60,000 per year.
TC � ($119,009 � $60,000) � $16.40Q � $179,009 � $16.40Q, for Q � 4,000
Thus, Josh’s earlier CVP analysis was incorrect when animal visits exceed 4,000. The level of ac-tivity needed for a targeted surplus of $100,000 needs to be recalculated:
($179,009 � $100,000) � $43.60 � 6,400 for Q � 4,000
Josh notices that an activity level of 6,400 animal visits is noticeably higher than the 5,024 visitshe first calculated. He realizes how important it is to adjust for the relevant range when perform-ing CVP analyses.
When Josh shows Leticia the new results, they agree that the clinic cannot raise the funds fornew equipment by increasing the number of visits to 6,400. Leticia may need to cut costs or seekother ways to pay for the neutering equipment. The additional fixed cost would also require theclinic to have a much higher volume of operations to avoid a loss.
$119,009 � $100,000���
$43.60/$60.00F � Profit��(P � V )/P
$219,009�
$43.60$119,009 � $100,000���
$60.00 � $16.40F � Profit��
P � V
GUIDE YOUR LEARNING 3.4 Small Animal Clinic
Small Animal Clinic illustrates a CVP analysis with target profit and two relevant ranges for a not-for-profit organization. For this illustration:
Identify ProblemDefine It and Information Identify Uncertainties Explore Assumptions
Describe how the CVP compu-tations change when morethan one relevant range is involved.
What decisions were being addressed? Why was CVP information useful for the decisions?
How reasonable are the CVPassumptions for Small AnimalClinic?
What were the uncertainties?Consider uncertainties about:● Revenue and cost estimates● Interpreting results● Relevant range of operations● Feasibility of activity level
ch03.qxd 9/27/04 4:06 PM Page 102

MARGIN OF SAFETY AND DEGREE OF OPERATING LEVERAGE 103
In Small Animal Clinic, the manager used CVP information to help her learn how muchthe volume of business could decline before the clinic would incur a loss. The managerof Spotted Cow Creamery was able to identify the specific products to emphasize forincreased profitability. Managers are often interested in these types of questions. In ad-dition, information from CVP analysis can be used to help manage operational risk.
■ Margin of SafetyThe margin of safety is the excess of an organization’s expected future sales (in either rev-enue or units) above the breakeven point. The margin of safety indicates the amount by whichsales could drop before profits reach the breakeven point:
Margin of safety in units � Actual or estimated units of activity � Units at breakeven pointMargin of safety in revenues � Actual or estimated revenue � Revenue at breakeven point
The margin of safety is computed using actual or estimated sales values, depending on thepurpose. To evaluate future risk when planning, use estimated sales. To evaluate actual riskwhen monitoring operations, use actual sales. If the margin of safety is small, managers mayput more emphasis on reducing costs and increasing sales to avoid potential losses. A largermargin of safety gives managers greater confidence in making plans such as incurring addi-tional fixed costs.
The margin of safety percentage is the margin of safety divided by actual or estimatedsales, in either units or revenues. This percentage indicates the extent to which sales can de-cline before profits become zero.
Margin of safety percentage in units �
Margin of safety percentage in revenues �
When the original budget was created for Small Animal Clinic, the breakeven pointwas calculated as 2,730 animal visits, or $163,800 in revenues. However, Leticia andJosh expected 3,800 animal visits, for $228,000 in revenue. Their margin of safety in units of animal visits was 1,070 (3,800 � 2,730) and in revenues was $64,200($228,000 � $163,800). Their margin of safety percentage was 28.2% (1,070 � 3,800,or $64,200 � $228,000). In other words, their sales volume could drop 28.2% from ex-pected levels before they expected to incur a loss. Exhibit 3.8 provides a CVP graph forthis information.
Margin of safety in revenue���Actual or estimated revenue
Margin of safety in units���Actual or estimated units
MARGIN OF SAFETYAND DEGREE OF OPERATING LEVERAGE
Q6 How are margin ofsafety and operatingleverage used to assessoperational risk?
EXHIBIT 3.8CVP Graph and Margin ofSafety for Small AnimalClinic
Dolla
rs
Quantity of Animal Visits
$163,800
$228,000
Expected visits =3,800 visits
Margin of Safety = 1,070 visits
Margin of Safety inRevenues = $64,200
Breakeven Point =2,730 animal visits
Total Revenue
EstimatedSurplus = $64,200Total Costs
ch03.qxd 9/27/04 4:06 PM Page 103

104 CHAPTER 3 ➤ COST-VOLUME-PROFIT ANALYSIS
EXHIBIT 3.9Advantages and Disadvantages of Fixed Costs
Common Advantages Common Disadvantages● Fixed costs might cost less in total than ● Investing in fixed resources might divertvariable costs. management attention away from the● Companies might require unique assets organization’s core competencies.(e.g., expert labor or specialized production ● Fixed costs typically require a longerfacilities) that must be acquired through long- financial commitment; it can be difficult toterm commitments. reduce them quickly.● Fixed assets such as automation and robotics ● Underinvestment or overinvestment in fixed equipment can significantly improve operating costs could affect profits and may not easily efficiency. be changed in the short term.● Fixed costs are easier to plan; they do notfluctuate with levels of activity.
7To see the relationship between the two formulas, recall the profit equation: Profit � (P � V ) � Q � F, whichcan be rewritten as F � Profit � Contribution margin. In turn, Degree of operating leverage � Contribution margin � Profit � (F � Profit) � Profit � (F � Profit) � 1.
■ Degree of Operating LeverageManagers decide how to structure the cost function for their organizations. Often, potentialtrade-offs are made between fixed and variable costs. For example, a company could purchasea vehicle (a fixed cost) or it could lease a vehicle under a contract that charges a rate permile driven (a variable cost). Exhibit 3.9 lists some of the common advantages and disad-vantages of fixed costs. One of the major disadvantages of fixed costs is that they may bedifficult to reduce quickly if activity levels fail to meet expectations, thereby increasing theorganization’s risk of incurring losses.
The degree of operating leverage is the extent to which the cost function is made upof fixed costs. Organizations with high operating leverage incur more risk of loss when salesdecline. Conversely, when operating leverage is high an increase in sales (once fixed costsare covered) contributes quickly to profit. The formula for operating leverage can be writ-ten in terms of either contribution margin or fixed costs, as shown here.7
� � �
Degree of operating leverage in terms of fixed costs � � 1
Managers use the degree of operating leverage to gauge the risk associated with their costfunction and to explicitly calculate the sensitivity of profits to changes in sales (units or revenues):
% change in profit � % change in sales � Degree of operating leverage
For Small Animal Clinic, the variable cost per animal visit was $16.40 and the fixed costswere $119,009. With budgeted animal visits of 3,800, the managers expected to earn a profitof $46,671. The expected degree of operating leverage using the contribution margin for-mula is then calculated as follows:
Degree of operating leverage � � � 3.55
We arrive at the same answer of 3.55 if we use the fixed cost formula:
Degree of operating leverage � � 1 � 2.55 � 1 � 3.55$119,009�$46,671
$165,680�$46,671
($60 � $16.40) � 3,800 visits����
$46,671
F�Profit
(P � V ) � Q��
ProfitTR � TVC�
ProfitContribution margin���
ProfitDegree of operating leverage in terms
of contribution margin
ch03.qxd 9/27/04 4:06 PM Page 104

MARGIN OF SAFETY AND DEGREE OF OPERATING LEVERAGE 105
The degree of operating leverage and margin of safety percentage are reciprocals.
Margin of safety percentage �
Degree of operating leverage �
If the margin of safety percentage is small, then the degree of operating leverage is large. Inaddition, the margin of safety percentage is smaller as the fixed cost portion of total cost getslarger. As the level of operating activity increases above the breakeven point, the margin ofsafety increases and the degree of operating leverage decreases. For Small Animal Clinic,the reciprocal of the margin of safety percentage is 3.55 (1 � 0.282). The reciprocal of thedegree of operating leverage is 0.282 (1 � 3.55).
■ Using the Degree of Operating Leverage to Plan and Monitor Operations
Managers need to consider the degree of operating leverage when they decide whether to in-cur additional fixed costs, such as purchasing new equipment or hiring new employees. Theyalso need to consider the degree of operating leverage for potential new products and ser-vices that could increase an organization’s fixed costs relative to variable costs. If additionalfixed costs cause the degree of operating leverage to reach what they consider an unaccept-ably high level, managers often use variable costs—such as temporary labor—rather thanadditional fixed costs to meet their operating needs.
For example, the technicians at the Small Animal Clinic are paid a salary and work 40-hour weeks. Suppose Leticia could hire part-time technicians at $20.00 per hour insteadof hiring full-time technicians at the current salaries of $78,009. If each visit requires aboutan hour of technician time, the new cost function would be TC � ($119,009 � $78,009) �($16.40 � $20.00)Q � $41,000 � $36.40Q. The breakeven point decreases considerably to1,738 animal visits [$41,000 � ($60.00 � $36.40) per animal visit] or $104,280. Profit atQ � 3,800 animal visits is $48,680 [$228,000 � $41,000 � (3,800 animal visits � $36.40per animal visit)]. Operating leverage at 3,800 animal visits becomes 1.84 [($41,000 �$48,680) � 1], which is much lower than the 3.55 when technicians are a fixed cost. Al-though operating leverage improved, the cost for technicians increased from $18.75 per hour[$78,009 � (2 technicians � 2,080 hours per technician per year)] to $20.00 per hour.
The advantage of having technicians as hourly workers is that they can be scheduledonly for hours when appointments are also scheduled. When business is slow fewer techni-cian hours are needed, which means less risk of incurring losses if the number of visits drops.Exhibit 3.10 provides a CVP graph of the two options. Risk decreases considerably whenthe breakeven point is so much lower. On the other hand, it may be more difficult to hirequalified and dependable technicians unless work hours and pay can be guaranteed.
An indifference point is the level of activity at which equal cost or profit occurs acrossmultiple alternatives. To provide Leticia with additional information as she considers chang-ing the cost structure, Josh calculates the indifference point. Using the budgeted assump-tions, Josh sets the two cost functions equal to each other and then solves for Q as follows:
$41,000 � $36.40Q � $119,009 � $16.40Q$20Q � $78,009, so Q � 3,901
When visits are fewer than 3,901, the clinic profit will be greater using more variable cost.When visits exceed 3,901, the clinic is better off using more fixed costs, assuming that thefixed costs remain constant up to 4,000 visits. When visits exceed 4,000, we know that additional fixed costs will be incurred, and then a new indifference point will need to be calculated.
1���Margin of safety percentage
1����Degree of operating leverage
CURRENT PRACTICEBefore 1983, Medicare used cost-based payment. Hospitals had highoperating leverage because risk of loss was low. After Medicarechanged to a flat fee per patient,managers lowered their operatingleverage.8
8S. Kallapur and L. Eldenburg, “Uncertainty, Real Options, and Cost Behavior: Evidence from Washington StateHospitals,” University of Arizona Working Paper, 2003.
ch03.qxd 9/27/04 4:06 PM Page 105

106 CHAPTER 3 ➤ COST-VOLUME-PROFIT ANALYSIS
GUIDE YOUR LEARNING 3.5 Key Terms
Stop to confirm that you understand the new terms introduced in the last several pages:
Margin of safety (p. 103) Degree of operating leverage (p. 104)Margin of safety percentage (p. 103) Indifference point (p. 105)
For each of these terms, write a definition in your own words.
EXHIBIT 3.10 CVP Graph for Small Animal Clinic with Different Degrees of Operating LeverageDo
llars
Quantity of Animal Visits
1,738
$119,009$104,280
$41,000
$182,996
$234,060
$163,800
2,730 3,901
Total Revenue
TC = 41,000 + 36.40QTC = 119,009 + 16.40Q
Indifferencepoint
In recent years, U.S. companies have increasingly relied on temporary labor (also calledcontingent or contract workers) to fill positions that in the past would have been filledby regular employees. Temporary jobs span the entire workforce including manufacturing,service, farm, and professional services. Managers gain many benefits including the following:
● Reduce risk of loss by increasing the proportion of variable costs.● Quickly increase and decrease employment levels in response to economic changes.● Pay higher wages to skilled workers without inflating the pay scales of regular employees.● Pay lower wages and avoid making hiring commitments to low-skilled employees.● Fill positions while recruiting permanent workers during labor shortages.
Many economists and business analysts argue that temporary labor is good for workers andthe economy. Temporary work arrangements provide the following economic benefits:
FOCUS ON ETHICAL DECISION MAKINGTemporary Labor
Notice that the indifference point calculation ignores operational risk. At 3,901 animalvisits, the clinic is expected to earn the same profit under the two cost function alternatives.However, the clinic’s operational risk is greater for the cost function having higher fixedcosts. Therefore, the clinic’s manager would not necessarily be indifferent between the twocost functions if 3,901 animal visits were expected.
ch03.qxd 9/27/04 4:06 PM Page 106

MARGIN OF SAFETY AND DEGREE OF OPERATING LEVERAGE 107
● Reduce overall unemployment levels because employers are less reluctant to hire temporarylabor than regular employees.
● Increase employment opportunities for new workforce entrants, workers laid off from jobs,and workers wanting flexible work schedules.
● Improve regular employee morale by reducing their unemployment risk.
On the other hand, labor groups, homeless advocacy groups, and others believe that tempo-rary labor arrangements are socially harmful. They argue that the use of temporary labor contrib-utes to the following issues:
● Unfairly reduces overall pay scales for skilled and unskilled workers.● Increases unemployment risk for the least-skilled and lowest-paid workers, contributing to
poverty and homelessness.● Reduces worker representation as well as health care and retirement benefits.
SOURCES: J. C. Cooper and K. Madigan, “U.S.: Labor’s New Flexibility Cuts Two Ways,” Business Week, December24, 2001; and S. N. Houseman, A. L. Kalleberg, and G. A. Erickcek, “The Role of Temporary Help Employment in Tight Labor Markets,” Upjohn Institute Staff Working Paper No. 01-73, July 2001. Available at www.upjohninst.org/publications/wp/01-73.pdf.
Practice Ethical Decision Making
In Chapter 1, we learned about a process for making ethical decisions (Exhibit 1.11). You can ad-dress the following questions to improve your skills for making ethical decisions. Think about youranswers to these questions and discuss them with others.
Questions to Consider Ethical Decision-Making Process about This Ethical Dilemma
Identify ethical problems as they arise. Does the hiring of temporary labor create an ethical problem? Why or why not?
Objectively consider the well-being of others Different viewpoints for this problem were and society when exploring alternatives. described in the preceding example. What
assumptions lie behind each viewpoint?
Clarify and apply ethical values when Is the hiring of temporary labor a business issue,choosing a course of action. a social issue, or both? Explain. Identify the values
you use to answer the following questions:● Is it fair for employers to pay different wage
rates and provide different benefits to tempo-rary and permanent workers who perform thesame jobs?
● Is it fair for businesses to pass their businessrisks directly on to the employees?
Work toward ongoing improvement of How can company managers determine on an personal and organizational ethics. ongoing basis whether their hiring practices
are ethical?
ch03.qxd 9/27/04 4:06 PM Page 107

108 CHAPTER 3 ➤ COST-VOLUME-PROFIT ANALYSIS
APPENDIX 3A
Input sectionExpected sales volume-unitsPrice per unitVariable cost per unit
Fixed costsDesired after-tax profitIncome tax rate
Contribution MarginUnitsRevenueVariable costsContribution margin
Contrib. margin per unit Contrib. margin ratio
Expected sales mix in unitsExpected sales mix in revenues
Expected IncomeContribution margin (above)Fixed costs Pretax incomeIncome taxes After-tax income
Preliminary CVP CalculationsTarget pretax profit for CVP analysisFixed costs plus target pretax profit
CVP analysis in unitsCVP calculation in unitsRevenueVariable costsContribution marginFixed costsPretax incomeIncome taxesAfter-tax income
CVP analysis in revenuesCVP calculation in revenuesVariable costsContribution marginFixed costsPretax incomeIncome taxesAfter-tax income
Youth Bikes10,00020075
14,700,000100,0000.3
Youth Bikes=B3=B3*B4=B5*B3=B14-B15
=B16/B13=B16/B14
=B3/$E13=B14/$E14
Youth Bikes=B21*$E$36=B36*B4=B36*B5=B37-B38
Youth Bikes=$E$46*B22=B46*B5/B4=B46-B47
Road Bikes18,000700250
(enter zero for breakeven)
Road Bikes=C3=C3*C4=C5*C3=C14-C15
=C16/C13=C16/C14
=C3/$E13=C14/$E14
Road Bikes=C21*$E$36=C36*C4=C36*C5=C37-C38
Road Bikes=$E$46*C22=C46*C5/C4=C46-C47
Mtn. Bikes12,000800300
Mtn. Bikes=D3=D3*D4=D5*D3=D14-D15
=D16/D13=D16/D14
=D3/$E13=D14/$E14
Mtn. Bikes=D21*$E$36=D36*D4=D36*D5=D37-D38
Mtn. Bikes=$E$46*D22=D46*D5/D4=D46-D47
Total Bikes=SUM(B3:D3)=SUM(B14:D14)=SUM(B15:D15)=SUM(B16:D16)
=E16/E13=E16/E14
=SUM(B21:D21)=SUM(B22:D22)
=E16=B7=E16-E26=B9*E27=E27-E28
=B8/(1-B9)=B7+E32
Total Bikes=E33/E18=SUM(B37:D37)=SUM(B38:D38)=E37-E38=B7=E39-E40=E41*B9=E41-E42
Total Bikes=E33/E19=SUM(B47:D47)=E46-E47=B7=E48-E49=B9*E50=E50-E51
A12345678910111213141516171819202122232425262728293031323334353637383940414243444546474849505152
B C D E
Spreadsheet Formulas for Magik Bicycles SpreadsheetThe following formulas were used for the spreadsheet shown in Exhibit 3.2.
SUMMARY
Q1 What Is Cost-Volume-Profit (CVP) Analysis, and How Is It Used for Decision Making?
Cost-Volume-Profit (CVP) AnalysisA technique that examines changes in profits in response tochanges in sales volumes, costs, and prices
CVP GraphShows the relationship between total revenues and total costs; illustrates how an organization’s profits are expected to changeunder different volumes of activity
ch03.qxd 9/27/04 4:06 PM Page 108

SUMMARY 109
UsesDescribe volume, revenues, costs, and profits:
● Values at breakeven or target profit:–Units sold–Revenues–Variable, fixed, and total costs
● Sensitivity of results to changes in:–Levels of activity –Selling price–Cost function –Sales mix
● Indifference point between alternatives● Feasibility of planned operations
Assist with plans and decisions such as:
● Budgets ● Discretionary expenditures● Product emphasis such as advertising● Selling price ● Proportions of fixed● Production or activity levels versus variable costs● Employee work schedules● Raw material purchases
Monitor operations by comparing expected and actual:
● Volumes, revenues, costs, and profits● Profitability risk
Q2 How Are CVP Calculations Performed for a Single Product?
CVP FormulasCVP analysis in units needed to attain target profit:
Q � �
CVP analysis in revenues needed to attain target profit:
Revenues � � �
Pretax profit needed to achieve a given level of after-tax profit:
Pretax profit �After-tax profit��(1 � Tax rate)
F � Profit��(TR � TVC)/TR
F � Profit��(P � V )/P
F � Profit���Contribution margin ratio
F � Profit��
P � VF � Profit
���Contribution margin per unit
Q3 How Are CVP Calculations Performed for Multiple Products?
Use CVP Formulas for a Single Product, Except
Weighted average contribution margin per unit �
Weighted average contribution margin ratio �Total expected contribution margin����
Total expected revenue
Total expected contribution margin����
Total expected number of units
Q4 What Is the Breakeven Point?
Breakeven PointLevel of operating activity at which revenues cover all fixed andvariable costs, resulting in zero profit.
CalculationSet target profit equal to zero in the CVP formula.
Q5 What Assumptions and Limitations Should Managers Consider When Using CVP Analysis?
CVP Assumptions● Operations within a relevant range of activity● Linear cost function
–Fixed costs remain fixed.–Variable cost per unit remains constant.
● Linear revenue function–Sales mix remains constant.–Prices remain constant.
Uncertainties● Actual future volumes, revenues, and costs are unknown.● CVP assumptions might not hold.
In Light of Assumptions and Uncertainties, Need to Evaluate:● Quality of data used in CVP analyses● Suitability of CVP analysis for the setting● Sensitivity of CVP results to changes in data for important
uncertainties
ch03.qxd 9/27/04 4:06 PM Page 109
110 CHAPTER 3 ➤ COST-VOLUME-PROFIT ANALYSIS
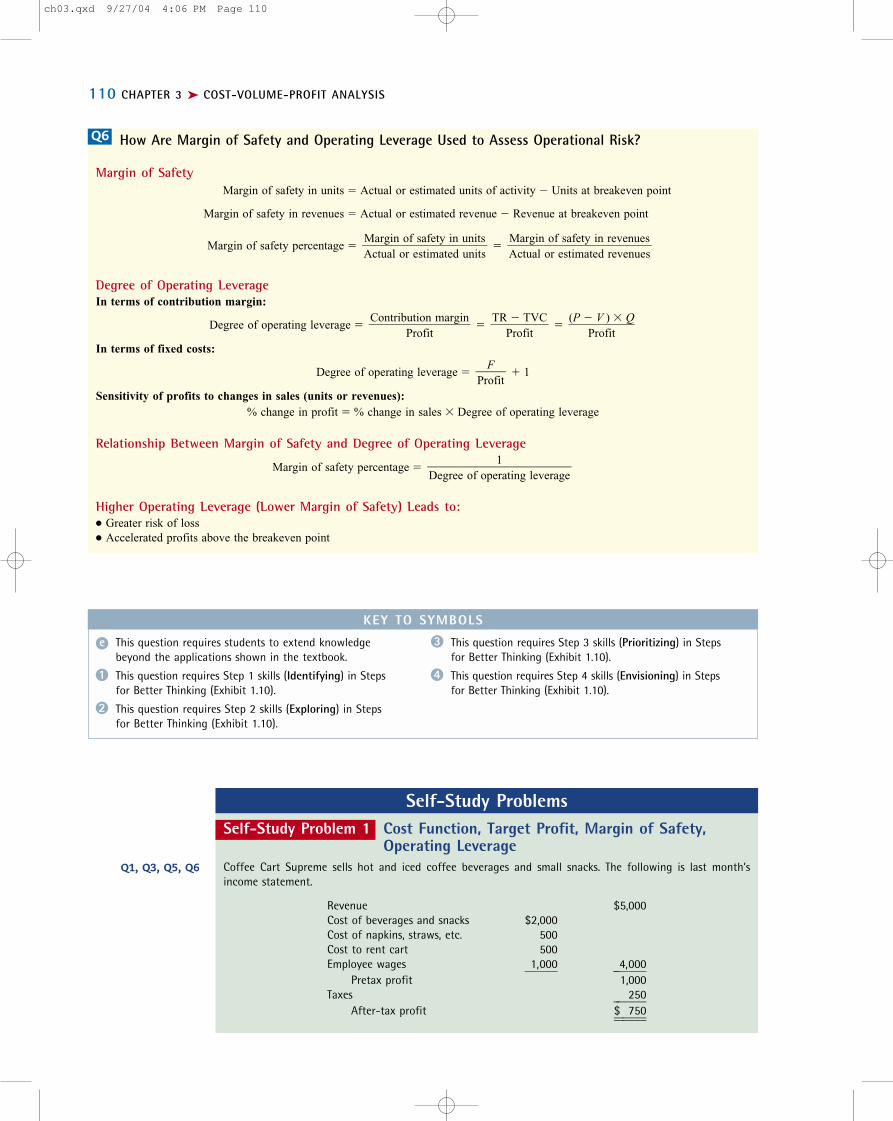
Q6 How Are Margin of Safety and Operating Leverage Used to Assess Operational Risk?
Margin of SafetyMargin of safety in units � Actual or estimated units of activity � Units at breakeven point
Margin of safety in revenues � Actual or estimated revenue � Revenue at breakeven point
Margin of safety percentage � �
Degree of Operating LeverageIn terms of contribution margin:
Degree of operating leverage � � �
In terms of fixed costs:
Degree of operating leverage � � 1
Sensitivity of profits to changes in sales (units or revenues):% change in profit � % change in sales � Degree of operating leverage
Relationship Between Margin of Safety and Degree of Operating Leverage
Margin of safety percentage �
Higher Operating Leverage (Lower Margin of Safety) Leads to:● Greater risk of loss● Accelerated profits above the breakeven point
1����Degree of operating leverage
F�Profit
(P � V ) � Q��
ProfitTR � TVC��
ProfitContribution margin���
Profit
Margin of safety in revenues����Actual or estimated revenues
Margin of safety in units���Actual or estimated units
KEY TO SYMBOLS
This question requires Step 3 skills (Prioritizing) in Stepsfor Better Thinking (Exhibit 1.10).
This question requires Step 4 skills (Envisioning) in Stepsfor Better Thinking (Exhibit 1.10).
This question requires students to extend knowledge beyond the applications shown in the textbook.
This question requires Step 1 skills (Identifying) in Stepsfor Better Thinking (Exhibit 1.10).
This question requires Step 2 skills (Exploring) in Stepsfor Better Thinking (Exhibit 1.10).
1 4
2
e 3
Self-Study Problems
Q1, Q3, Q5, Q6
Self-Study Problem 1 Cost Function, Target Profit, Margin of Safety, Operating Leverage
Coffee Cart Supreme sells hot and iced coffee beverages and small snacks. The following is last month’s income statement.
Revenue $5,000Cost of beverages and snacks $2,000Cost of napkins, straws, etc. 500Cost to rent cart 500Employee wages
�1�,�0�0�0� ��
4�,�0�0�0�
Pretax profit 1,000Taxes
���2�5�0�
After-tax profit $������
7��5��0��
ch03.qxd 9/27/04 4:06 PM Page 110

SELF-STUDY PROBLEMS 111
A. What is the total cost function for Coffee Cart Supreme?B. What is the tax rate for Coffee Cart Supreme?C. Calculate the amount of sales needed to reach a target after-tax profit of $1,500.D. What was Coffee Cart Supreme’s degree of operating leverage last month?E. What was Coffee Cart Supreme’s margin of safety in revenue last month?F. What was Coffee Cart Supreme’s margin of safety percentage last month?G. Suppose next month’s actual revenues are $8,000 and pretax profit is $2,000. Would actual costs behigher or lower than expected?H. Coffee costs are volatile because worldwide coffee production varies from year to year. Explain howthis volatility affects the quality of the cost function for Coffee Cart Supreme.
Solution to Self-Study Problem 1A. To estimate the cost function, we use judgment to classify costs as fixed, variable, or mixed. For a typi-cal retail business, rent and wages are likely to be fixed. We estimate fixed costs as the sum of these twocosts ($500 � $1,000 � $1,500). It seems reasonable that the costs of beverages and snacks ($2,000) andnapkins, straws, etc. ($500) would vary with revenues. We use the revenues as the cost driver to estimatevariable costs as $2,500 � $5,000 � 0.50, or 50% of revenues. Thus, the cost function is
TC � $1,500 � (50% � Revenue)
B. We use income tax expense and pretax profit from last month to estimate the tax rate:
Tax rate � Taxes � Pretax profit � $250 � $1,000 � 25%
C. We first calculate the amount of pretax profit needed to achieve an after-tax profit of $1,500.
Targeted pretax profit � $1,500 � (1 � 0.25) � $2,000
The contribution margin ratio is
(5,000 � 2,500) � 5,000 � 0.50 or 50%
We then perform the CVP calculation for revenues.
Revenue � ($1,500 � $2,000) � 0.50 � $3,500 � 0.50 � $7,000
D. We use the results of our previous computations to calculate the contribution margin, and we then cal-culate the degree of operating leverage:
Contribution margin � $5,000 � $2,500 � $2,500
Degree of operating leverage � Contribution margin � ProfitDegree of operating leverage � $2,500 � $1,000 � 2.50
E. Before calculating the margin of safety, we need to calculate the breakeven point. Note that the marginof safety must be calculated in revenue dollars. We do not have unit or product mix information. Thebreakeven point is calculated as
$1,500 � 0.50 � $3,000 in revenues
Current revenues are $5,000, so the margin of safety is calculated as
Margin of safety � $5,000 � $3,000 � $2,000
F. We use the formula to calculate margin of safety percentage:
Margin of safety percentage � $2,000 � $5,000 � 40%
Note that we can check our previous degree of operating leverage computation as follows:
Degree of operating leverage � 1 � Margin of safety percentage � 1 � 0.40 � 2.50
G. The expected and actual costs at $8,000 revenue are
Expected Costs � $1,500 � (50% � $8,000) � $5,500
Actual Costs � $8,000 � $2,000 � $6,000
Actual costs are $500 higher than expected.
2
2e
e
REQUIRED:
ch03.qxd 9/27/04 4:06 PM Page 111

112 CHAPTER 3 ➤ COST-VOLUME-PROFIT ANALYSIS
2
Q1, Q2, Q5
REQUIRED:
H. When any costs are volatile, predicting them is problematic. Worldwide coffee prices are uncertain formany reasons, such as weather conditions in coffee growing areas, the ability of farmers to increase crops,and coffee demand patterns. In addition, broader factors such as changes in economies and political up-heaval influence costs. All of these factors reduce our ability to develop a cost function that accuratelypredicts future costs, which means that the quality of the cost function is diminished.
Self-Study Problem 2 Sensitivity AnalysisThe spreadsheet developed for the Magik Bicycles examples in this chapter is available on the Web at www.wiley.com/college/eldenburg. Download the template and use the spreadsheet to answer the following ques-tions. A printout of the formulas used in the spreadsheet is available in Appendix 3A.
A. Examine the spreadsheet so that you understand how the cells in the data input section are refer-enced. When all of the decision variables are located in one place in the spreadsheet, accountants andmanagers can easily perform sensitivity analysis by changing values in the data input section. Why is itimportant to be able to change the spreadsheet easily to reflect changes in assumptions?B. Suppose that Magik adds a helmet to each youth bike sold. The helmets cost $25 each but incorporatenew materials and an innovative design that has reduced injuries and deaths from children’s bike acci-dents. Magik’s managers believe that by advertising the new helmet as part of the youth bike package,sales will increase to 13,000. However, an advertising campaign will need to be undertaken to alert parentsto the benefits of the new helmet. How much can Magik afford to spend on advertising and still expect toearn the original after-tax profit of $455,000? Assume the selling price remains at $200 per bike package.C. Identify CVP input factors that you believe are uncertain for this decision, and use your judgment to de-termine a new value for each factor. Reflect these changes in the spreadsheet to see how they affect thebreakeven point and profitability. Choose a best-case and worst-case scenario to present to the managers ofMagik Bicycles. Make a list of the points you would include in a memo explaining your sensitivity analysis tothe managers.
Solution to Self-Study Problem 2A. Accountants and managers will explore changes in more assumptions and vary the values within thespreadsheet more readily if it is easy to do. When these changes are made and the results are analyzed,managers better understand how unplanned changes in future operations might affect profitability. Thisknowledge allows them to more readily evaluate results and adjust operating plans.B. Exhibit 3.11 provides relevant parts of the spreadsheet with the changes. With increased sales of youthbikes from 10,000 to 13,000 and an increased variable cost from $75 to $100, expected pretax profits in-crease to $700,000. Comparing $700,000 to $650,000 (Exhibit 3.2), Magik can spend up to $50,000 on ad-vertising to maintain its current level of profitability.C. Many different scenarios could occur. No single answer is always correct. Your answer depends on theassumptions that you make. Following are some example assumptions for the best and worst cases. Yourmost likely case should be between these two values.
One best case is that the new strategy is very popular with customers. More than 13,000 of the bikes are sold.The managers discover that customers are willing to pay a higher price for the bike, so they raise the price.In addition, manufacturing efficiency improves with the greater volume, reducing variable cost per unit. Also,fixed costs are lower than expected because the managers found some costs that could be reduced.One worst case is that the helmets fail to attract customers. In fact, sales fail to meet original expectations;fewer than 10,000 are sold. Because the company produced extra bikes expecting an increase in demand, themanagers lower the selling price to encourage additional sales. In addition, the company hires extra workersto meet the expected demand, and other costs such as insurance and electricity are higher than expected.These changes caused both the variable and fixed costs to be higher than originally planned.
Your memo to the managers should include the following:● Explain the assumptions for the best case and worst case scenarios.● Explain the reasoning behind the most likely case.● Ask managers to consider beforehand how they would respond to the best- and worst-case scenarios.● Make suggestions for monitoring the results for the youth bike.● Encourage the managers to evaluate the advertising and product results, and make suggestions for im-
proving the operation or dropping the new helmet, if plans are unsuccessful.
3
www.wiley.com/college/eldenburg
ch03.qxd 9/27/04 4:06 PM Page 112
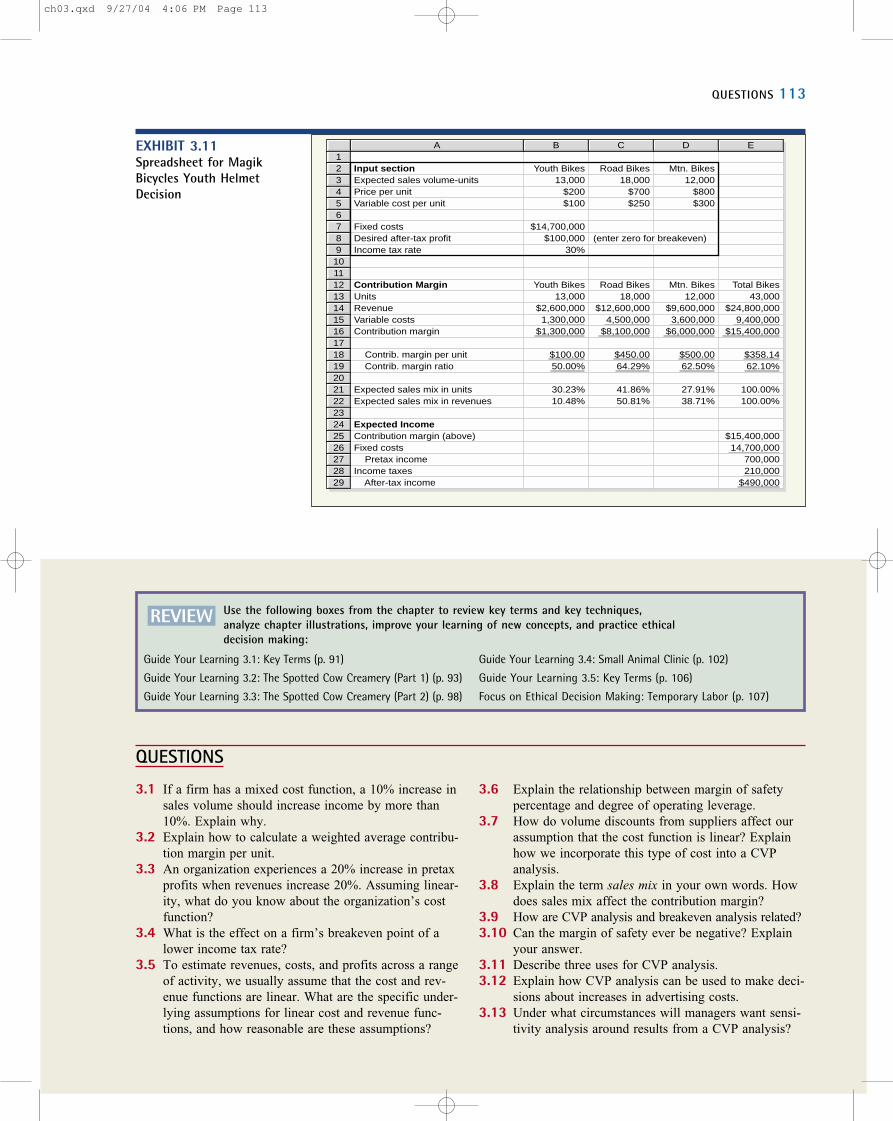
QUESTIONS 113
REVIEW Use the following boxes from the chapter to review key terms and key techniques, analyze chapter illustrations, improve your learning of new concepts, and practice ethical decision making:
EXHIBIT 3.11Spreadsheet for Magik Bicycles Youth Helmet Decision
Input sectionExpected sales volume-unitsPrice per unitVariable cost per unit
Fixed costsDesired after-tax profitIncome tax rate
Contribution MarginUnitsRevenueVariable costsContribution margin
Contrib. margin per unit Contrib. margin ratio
Expected sales mix in unitsExpected sales mix in revenues
Expected IncomeContribution margin (above)Fixed costs Pretax incomeIncome taxes After-tax income
Youth Bikes13,000
$200$100
$14,700,000$100,000
30%
Youth Bikes13,000
$2,600,0001,300,000
$1,300,000
$100.0050.00%
30.23%10.48%
Road Bikes18,000
$700$250
(enter zero for breakeven)
Road Bikes18,000
$12,600,0004,500,000
$8,100,000
$450.0064.29%
41.86%50.81%
Mtn. Bikes12,000
$800$300
Mtn. Bikes12,000
$9,600,0003,600,000
$6,000,000
$500.0062.50%
27.91%38.71%
Total Bikes43,000
$24,800,0009,400,000
$15,400,000
$358.1462.10%
100.00%100.00%
$15,400,00014,700,000
700,000210,000
$490,000
A123456789
1011121314151617181920212223242526272829
B C D E
Guide Your Learning 3.1: Key Terms (p. 91)
Guide Your Learning 3.2: The Spotted Cow Creamery (Part 1) (p. 93)
Guide Your Learning 3.3: The Spotted Cow Creamery (Part 2) (p. 98)
Guide Your Learning 3.4: Small Animal Clinic (p. 102)
Guide Your Learning 3.5: Key Terms (p. 106)
Focus on Ethical Decision Making: Temporary Labor (p. 107)
QUESTIONS
3.1 If a firm has a mixed cost function, a 10% increase insales volume should increase income by more than10%. Explain why.
3.2 Explain how to calculate a weighted average contribu-tion margin per unit.
3.3 An organization experiences a 20% increase in pretaxprofits when revenues increase 20%. Assuming linear-ity, what do you know about the organization’s costfunction?
3.4 What is the effect on a firm’s breakeven point of alower income tax rate?
3.5 To estimate revenues, costs, and profits across a rangeof activity, we usually assume that the cost and rev-enue functions are linear. What are the specific under-lying assumptions for linear cost and revenue func-tions, and how reasonable are these assumptions?
3.6 Explain the relationship between margin of safetypercentage and degree of operating leverage.
3.7 How do volume discounts from suppliers affect ourassumption that the cost function is linear? Explainhow we incorporate this type of cost into a CVPanalysis.
3.8 Explain the term sales mix in your own words. Howdoes sales mix affect the contribution margin?
3.9 How are CVP analysis and breakeven analysis related?3.10 Can the margin of safety ever be negative? Explain
your answer.3.11 Describe three uses for CVP analysis.3.12 Explain how CVP analysis can be used to make deci-
sions about increases in advertising costs.3.13 Under what circumstances will managers want sensi-
tivity analysis around results from a CVP analysis?
ch03.qxd 9/27/04 4:06 PM Page 113

114 CHAPTER 3 ➤ COST-VOLUME-PROFIT ANALYSIS
3.16Q2, Q4
3.17Q2
REQUIRED:
3.18Q4
EXERCISESTarget profit, not-for-profit breakeven
A. The variable cost per gift basket is $2, fixed costs are $5,000 per month, and the sellingprice of a basket is $7. How many baskets must be produced and sold in a month to earn apretax profit of $1,000?
B. The Community Clinic (a not-for-profit medical clinic) received a lump-sum grant fromthe City of Tucson of $460,000 this year. The fixed costs of the clinic are expected to be$236,000. The average variable cost per patient visit is expected to be $7.64 and the aver-age fee collected per patient visit is $4.64. What is the breakeven volume in patient visits?
CVP graphA. Create a CVP graph using the information in Exercise 3.14, part (A). Explain the infor-
mation in the graph.B. Create a CVP graph using the information in Exercise 3.14, part (B). Explain the infor-
mation in the graph.
Cost function, breakevenA. The average cost per unit was $234 at a volume of 1,200 units and $205 at a volume of
1,400 units. The profit was $24,000 at the lower volume. Estimate the variable cost per unit.B. Sparkle Car Wash Supplier sells a hose washer for $0.25 that it buys from the manufacturer
for $0.12. Variable selling costs are $0.02 per hose washer. Breakeven is currently at a salesvolume of $10,600 per month. What are the monthly fixed costs associated with the washer?
C. Monthly fixed costs are $24,000 when volume is at or below 200 units and $36,000 whenmonthly volume is above 200 units. The variable cost per unit is $200 and the sellingprice is $300 per unit. What is the breakeven quantity?
Profit, price for target profit The Martell Company has recently established operations in a com-petitive market. Management has been aggressive in its attempt to establish a market share. Theprice of the product was set at $5 per unit, well below that of the company’s major competitors.Variable costs were $4.50 per unit, and total fixed costs were $600,000 during the first year.
A. Assume that the firm was able to sell 1 million units in the first year. What was the pre-tax profit (loss) for the year?
B. Assume that the variable cost per unit and total fixed costs do not increase in the secondyear. Management has been successful in establishing its position in the market. Whatprice must be set to achieve a pretax profit of $25,000? Assume that sales remain at 1 million units.
Cost function, breakeven Data for the most recent three months of operations for the RainBeauSalon appear here:
March April MayNumber of appointments 1,600 1,500 1,900
Hair dresser salaries $14,000 $14,000 $18,000Manicurist salaries 12,000 12,000 16,000Supplies 900 750 950Utilities 600 480 400Rent 1,000 1,000 1,000Miscellaneous
��3�,�5�0�0� ��
3�,�4�5�0� ��
3�,�5�8�0�
Total costs $��
3��2��,��0��0��0��
$��
3��1��,��6��8��0��
$��
3��9��,��9��3��0��
A general cost-of-living salary increase occurred at the beginning of May.
A. What is the total cost function for RainBeau Salon?B. If the average fee per appointment is $25, estimate the appointments required in June to
break even.
Breakeven, target profit, ROI target profit Madden Company projected its income before taxesfor next year as shown here. Madden is subject to a 40% income tax rate.
3.14Q2, Q4
3.15Q2, Q4
REQUIRED:
3.19Q2, Q4
2
e
e
e
e
e
e
ch03.qxd 9/27/04 4:06 PM Page 114

EXERCISES 115
Sales (160,000 units) $8,000,000Cost of sales
Variable costs 2,000,000Fixed costs
�3�,�0�0�0�,�0�0�0�
Pretax profit $��
3��,��0��0��0��,��0��0��0��
A. What is Madden’s breakeven point in units sold for the next year?B. If Madden wants $4.5 million in pretax profit, what is the required level of sales in dollars?C. If Madden’s net assets are $36 million, what amount of revenue must be achieved for
Madden to earn a 10% after-tax return on assets?
Breakeven, target profit, cost changes, selling price Laraby Company produces a single prod-uct. It sold 25,000 units last year with the following results.
Sales $625,000Variable costs 375,000Fixed costs
�1�5�0�,�0�0�0�
Income before taxes 100,000Income taxes (45%)
��4�5�,�0�0�0�
After-tax profit $����
5��5��,��0��0��0��
In an attempt to improve its product, Laraby’s managers are considering replacing a component part thatcosts $2.50 with a new and better part costing $4.50 per unit during the coming year. A new machinewould also be needed to increase plant capacity. The machine would cost $18,000 and have a usefullife of 6 years with no salvage value. The company uses straight-line depreciation on all plant assets.
A. What was Laraby Company’s breakeven point in units last year?B. How many units of product would Laraby Company have had to sell in the past year to
earn $77,000 in after-tax profit?C. If Laraby Company holds the sales price constant and makes the suggested changes, how
many units of product must be sold in the coming year to break even?D. If Laraby Company holds the sales price constant and makes the suggested changes, how many
units of product will the company have to sell to make the same after-tax profit as last year?E. If Laraby Company wishes to maintain the same contribution margin ratio, what selling
price per unit of product must it charge next year to cover the increased materials costs?
Target profit, progressive income tax rates, CVP graph Dalton Brothers pay 15% in taxes onincome between $1 and $40,000. All income above $40,000 is taxed at 40%. The firm’s variablecosts as a percent of revenues are 60%. Annual fixed costs are $250,000.
A. What level of sales must the firm achieve to earn income after taxes of $150,000?B. Prepare a CVP graph for Dalton.
Breakeven, selling price, target profit with price and cost changes All-Day Candy Companyis a wholesale distributor of candy. The company services grocery, convenience, and drug storesin a large metropolitan area. Small but steady growth in sales has been achieved by the All-DayCandy Company over the past few years, but candy prices also have been increasing. The com-pany is reformulating its plans for the coming fiscal year. The following data were used to pro-ject the current year’s after-tax income of $100,400.
Average selling price $4.00 per boxAverage variable costs
Cost of candy $2.00 per boxSelling costs
�0�.�4�0�
per boxTotal $
��2��.��4��0��
per boxAnnual fixed costs
Selling $160,000Administrative
�2�8�0�,�0�0�0�
Total $��
4��4��0��,��0��0��0��
Expected annual sales (390,000 boxes) � $1,560,000 Tax rate � 40%
REQUIRED:
3.20Q1, Q2, Q4
REQUIRED:
3.21Q3
REQUIRED:
3.22Q1, Q3, Q4
e
e
ee
e
ch03.qxd 9/27/04 4:06 PM Page 115

Candy manufacturers have announced that they will increase prices of their products an averageof 15% in the coming year because of increases in raw material (sugar, cocoa, peanuts, and so on)and labor costs. All-Day Candy Company expects that all other costs will remain the same as dur-ing the current year.
A. What is All-Day Candy Company’s breakeven point in boxes of candy for the currentyear?
B. What average selling price per box must All-Day Candy Company charge to cover the15% increase in the variable cost of candy and still maintain the current contributionmargin ratio?
C. What volume of sales in dollars must the All-Day Candy Company achieve in the com-ing year to maintain the same after-tax income as projected for the current year if the av-erage selling price of candy remains at $4.00 per box and the cost of candy increases15%?
Breakeven, operating leverage, cost function decision You are the advisor of a Junior Achieve-ment group in a local high school. You need to help the group make a decision about fees that mustbe paid to sell gardening tools at the Home and Garden Show. The group sells a set of tools for$20.00. The manufacturing cost (all variable) is $6 per set. The Home and Garden Show coordina-tor allows the following three payment options for groups exhibiting and selling at the show:
1. Pay a fixed booth fee of $5,600.2. Pay a fee of $3,800 plus 10% of all revenue from tool sets sold at the show.3. Pay 15% of all revenue from tool sets sold at the show.
A. Compute the breakeven number of tool sets for each option.B. Which payment plan has the highest degree of operating leverage?C. Which payment plan has the lowest risk of loss for the organization? Explain.D. At what level of revenue should the group be indifferent to options 1 and 2?E. Which option should Junior Achievement choose, assuming sales are expected to be
1,000 sets of tools? Explain.
ROI target profit, foreign exchange rates Borg Controls has a net investment in its German sub-sidiary of $2.68 million. The firm attempts to earn a 15% pretax return on its investment. Variablecosts for the German subsidiary are 60% of revenues. Annual fixed costs are 321,000. For the cur-rent year, the manager of the German subsidiary anticipates revenues of 1.7 million. The exchangerate is expected to be 1.2 � $1.
A. If operations meet expectations, what is the rate of return that Borg Controls will earnfrom its German subsidiary? (Hint: Calculate the rate of return by dividing pretax incomeby the net investment.)
B. What level of revenue in euros would be required of the subsidiary for the parent to earnexactly a 15% rate of return in dollars, assuming no changes in the exchange rate?
Target profit, margin of safety, operating leverage The following budget data apply to Newberry’sNutrition:
Sales (100,000 units) $1,000,000Costs
Direct materials $300,000Direct labor 200,000Fixed factory overhead 100,000Variable factory overhead 150,000Marketing and administration
�1�6�0�,�0�0�0�
Total costs��
9�1�0�,�0�0�0�
Budgeted pretax income $��������
9��0��,��0��0��0��
Direct labor workers are paid hourly wages and go home when there is no work. The marketingand administration costs include $50,000 that varies proportionately with production volume. As-sume that sales and production volumes are equal.
116 CHAPTER 3 ➤ COST-VOLUME-PROFIT ANALYSIS
REQUIRED:
e
e
3.23Q1, Q2, Q4, Q6
REQUIRED:
3.24Q3
REQUIRED:
3.25Q2, Q6
e
e
e
ch03.qxd 9/27/04 4:06 PM Page 116

A. Compute the number of units that must be sold to achieve a target after-tax income of$120,000, assuming the tax rate is 40%.
B. Calculate the margin of safety in both revenues and units.C. Calculate the degree of operating leverage.
Breakeven, target profit, margin of safety, operating leverage Pike Street Taffy makes and sellstaffy in a variety of flavors in a shop located in the local public market. Data for a recent weekare as follows:
Revenue (2,000 lbs. @ $4.80 per lb.) $9,600Cost of ingredients $3,200Rent 800Wages
�4�,�8�0�0� ��
8�,�8�0�0�
Pretax income 800Taxes (20%)
���1�6�0�
After-tax income $������
6��4��0��
All employees work standard shifts, no matter how much taffy is produced or sold.
A. Calculate the breakeven point in units and in revenue.B. Calculate the number of units and the amount of revenues that would be needed for after-
tax income of $3,000.C. Calculate the margin of safety in units and the margin of safety percentage.D. Calculate the degree of operating leverage.
Breakeven, target profit, margin of safety Vines and Daughter manufactures and sells swimsuitsfor $40 each. The estimated income statement for 2005 is as follows:
Sales $2,000,000Variable costs
�1�,�1�0�0�,�0�0�0�
Contribution margin 900,000Fixed costs
���7�6�5�,�0�0�0�
Pretax profit $������
1��3��5��,��0��0��0��
A. Compute the contribution margin per swimsuit and the number of swimsuits that must besold to break even.
B. What is the margin of safety in the number of swimsuits?C. Suppose the margin of safety was 5,000 swimsuits in 2004. Are operations more or less
risky in 2005 as compared to 2004? Explain. D. Compute the contribution margin ratio and the breakeven point in revenues.E. What is the margin of safety in revenues?F. Suppose next year’s revenue estimate is $200,000 higher. What would be the estimated
pretax profit?G. Assume a tax rate of 30%. How many swimsuits must be sold to earn an after-tax profit
of $180,000?
PROBLEMS 117
REQUIRED:
3.26Q2, Q4, Q6
PROBLEMSCost function, breakeven, quality of information, relevant range Oysters Away picks, shucks,and packs oysters and then sells them wholesale to fine restaurants across the state. The incomestatement for last year follows:
Revenue (based on sales of 2,000 cases of oysters) $200,000Expenses:
Wages for pickers, shuckers, and packers $100,000Packing materials 20,000Rent and insurance 25,000Administrative and selling
��4�5�,�0�0�0� �
1�9�0�,�0�0�0�
Pretax income 10,000Taxes (20%)
���2�,�0�0�0�
After-tax income $���������
8��,��0��0��0��
3.27Q2, Q4, Q6
REQUIRED:
3.28Q2, Q4, Q5
REQUIRED:
ch03.qxd 9/27/04 4:06 PM Page 117

118 CHAPTER 3 ➤ COST-VOLUME-PROFIT ANALYSIS
REQUIRED:
3.29Q1, Q3, Q5
REQUIRED:
Pickers, shuckers, and packers are employed on an hourly basis and can be laid off whenever nec-essary. Salespeople mostly deliver the product and are paid on a salaried basis.
A. Estimate the cost function for Oysters Away.B. What is the breakeven point in cases for Oysters Away?C. The manager thinks that the company will harvest and sell 3,000 cases of oysters next
year. Estimate the after-tax income.D. Oysters Away harvested and sold 2,000 cases in each of the last several years. What does
this suggest about the quality of the income information you calculated in part (C)?E. Describe reasons why the cost function developed for the relevant range up to 2,000
cases might not hold for 2,001 to 3,000.
Relevant information, breakeven, target profit, price, uncertainties Francesca would like tolease a coffee cart in Aspen, Colorado. The lease is $800 per month and a city license to sell foodand beverages costs $20 per month. The lessor of the stand has shown Francesca records indicat-ing that gross revenues average $32 per hour. The out-of-pocket costs for ingredients are gener-ally about 40% of gross revenues. Last year she paid 25% of her income in federal taxes.
Francesca pays $1,000 per month for her condominium. She could store the cart overnight inthe condo’s garage, which is currently unused. Real estate developers in Aspen estimate that about20% of the cost of a residential building is for the garage.
At present, Francesca is earning $2,400 per month as a ski instructor for one of the big ski areas. In the summertime she earns about the same income as a kayaking instructor.
A. List each piece of quantitative information in this problem. For each item, indicatewhether it is relevant to Francesca’s decision and explain why.
B. If Francesca leases the cart and works 30 days in a month, how many hours will she have towork each day, on average, to be at least as well off financially as she is in her current job?
C. If Francesca wants to work only 25 days per month, how much will revenues have to in-crease for her to work 4 hours per day and be as financially well off as she is in her cur-rent job?
D. Can Francesca be certain that her revenues will average $32 per hour? Why or why not?E. What other information might help Francesca with this decision?
Sales mix, multiple product breakeven, uncertainties, quality of information Keener producestwo products: regular boomerangs and premium boomerangs. Last month 1,200 units of regularand 2,400 units of premium were produced and sold. Average prices and costs per unit for themonth are displayed here.
Regular PremiumSelling price $22.15 $45.30Variable costs 4.31 6.91Product line fixed costs 8.17 24.92Corporate fixed costs
��5�.�6�2� ��
5�.�6�2�
Operating Profit $����
4��.��0��5��
$����
7��.��8��5��
Product line fixed costs can be avoided if the product line is dropped. Corporate fixed costs canbe avoided only if the firm goes out of business entirely. You may want to use a spreadsheet toperform calculations.
A. Assuming the sales mix remains constant, how many units of premium will be sold eachtime a unit of regular is sold?
B. What are the total fixed product line costs for each product?C. What are the total corporate fixed costs?D. What is the overall corporate breakeven in total revenue and for each product, assuming
the sales mix is the same as last month’s?E. What is the breakeven in revenues for regular boomerangs, ignoring corporate fixed
costs?F. Why is the breakeven for regular boomerangs different when we calculate the individual
product breakeven versus the combined product breakeven?
e
e
2
1
3.30Q3, Q4, Q5
REQUIRED:
e
e
11
e
(continued)
ch03.qxd 9/27/04 4:06 PM Page 118

PROBLEMS 119
G. When managers monitor the profitability of regular boomerangs, are corporate fixed costsrelevant? Explain.
H. CVP analysis assumes that the sales mix will remain constant. Explain why managersgenerally cannot know for certain what their sales mix will be.
I. What is the effect of uncertainty about the sales mix on the quality of the information ob-tained from CVP analyses?
Cost function, marginal cost, opportunity cost, usefulness of CVP A neighbor asked for yourhelp preparing a grant for a not-for-profit after-school art program that would benefit elementaryschool children in the neighborhood. He wants to charge low fees for most children, but also of-fer some scholarships for low-income children. He needs to have one staff person for every sixchildren to meet state regulations. He can use high school student volunteers for two of these po-sitions, but is concerned about potential absences on their part if he relies on them for the statecount. He would like the program to serve at least 30 children, and more, if possible.
He wants you to help him decide on the fees to charge and also to determine how many stu-dents could receive scholarships.
A. Think about the costs involved in an after-school program. Assume that your neighborcan use the local elementary school for free.1. List costs that will be incurred for the program, and categorize them as fixed, variable,
or mixed.2. For each variable cost, choose a potential cost driver. Explain your choice.
B. Do you think the cost structure would be primarily fixed or primarily variable? Explain.Remember, even though staff work only part time, they will have a regular schedule tomeet the state regulations of six children per staff member.
C. Suppose one of the staff members has only one child to help. What is the marginal costfor three scholarships?
D. Suppose the program is fully subscribed by fee-paying children. What is the opportunitycost per scholarship?
E. Will CVP analysis help your neighbor choose a fee that would cover at least 10 scholar-ships? Explain how you would set up a spreadsheet so that your neighbor could performsensitivity analysis to make more informed decisions.
Breakeven, CVP, potential cost structure change, employee reaction Ersatz manufactures a single product. The following income statement shows two different levels of activity, which areassumed to be within Ersatz’s relevant range. You may want to use a spreadsheet to perform calculations.
Ersatz, Inc.Income Statement
Activity Levels
Volume 1,000 units 1,500 unitsSales @ $100 each $100,000 $150,000Less variable expenses
Manufacturing @ $40 each 40,000 60,000Selling @ $10 each 10,000 15,000Administration @ $6 each
���6�,�0�0�0� ���
9�,�0�0�0�
Contribution margin 44,000 66,000Less fixed expenses
Manufacturing 10,000 10,000Selling 11,000 11,000Administration
��2�0�,�0�0�0� ��
2�0�,�0�0�0�
Pretax income $��������
3��,��0��0��0��
$����
2��5��,��0��0��0��
A. What is Ersatz’s breakeven point in units?B. Draw a CVP chart showing the two levels of activity and the breakeven point.C. If Ersatz plans to sell 1,300 units, what will pretax income be?
(continued)
2
3.31Q1, Q2, Q4
REQUIRED:
2
2
2
2
1
3.32Q1, Q2, Q4, Q5
2
e
REQUIRED:
ch03.qxd 9/27/04 4:06 PM Page 119

120 CHAPTER 3 ➤ COST-VOLUME-PROFIT ANALYSIS
REQUIRED:
3.33Q1, Q2, Q4, Q5, Q6
D. Your boss asked you to draft an e-mail response to Ersatz’s major stockholder, whowants to know why pretax income increases by more than 800% when sales increase byjust 50%. Both your boss and the stockholder are busy people and expect short answers.
E. Management expects that variable costs and selling prices will rise by 3%, but fixed costswill not change. What will the new breakeven point be? Explain the result.
F. Management wants to change the way that sales representatives are paid. At present, salesrepresentatives are paid $11,000 � $10 per unit. Management will replace this formula witha payment of $20 per unit. At what level of sales will it make no difference in incomewhich cost function is used?
G. Add the new cost function to the preceding CVP chart.H. Which of the two cost functions will minimize selling expenses assuming that sales are
above the indifference level calculated in part (F)?I. How would sales representatives be likely to respond to the new payment system?J. Discuss the pros and cons to the company of changing the way sales representatives are
paid.
Breakeven, avoidable fixed costs, price, CVP assumptions, operating risk Last year’s incomestatement for King Salmon Sales follows.
Revenue (100,000 lbs.) $800,000Expenses
Fish $200,000Smoking materials 20,000Packaging materials 30,000Labor (wages) 300,000Administrative 150,000Sales commissions
��1�0�,�0�0�0�
Total expenses��
7�1�0�,�0�0�0�
Income $������
9��0��,��0��0��0��
The fishing season is only three to four months long, so labor costs (wages) are for employeeswho are college students and work in the summer. They are hired only as needed.
A. The state government curtailed fishing because of low fish counts. Because of this restric-tion, King Salmon Sales can only buy 50,000 pounds. Assume the administrative cost isincurred only if the company sells salmon. Assuming the managers will decide to operateif the company can at least break even, should they operate this year? (Hint: Calculatethe breakeven quantity.) Provide calculations and explain your answer.
B. Now assume that the administrative costs continue regardless of whether the companysells salmon. Assuming the managers will decide to operate if the company can at leastbreak even, should they operate this year? Provide calculations and explain your answer.
C. Because of the salmon shortage, suppose that retail salmon prices are increasing. What isthe breakeven price for King Salmon? Assume that administrative costs continue regard-less of whether the company sells salmon.
D. Suppose the managers rely on the preceding CVP analysis to decide whether to operatethe business. What assumptions are they making?
E. How reasonable are these CVP assumptions?F. Suppose the owner of King Salmon Sales asked you about the company’s cost structure.
Because volumes of fish fluctuate a great deal from one year to the next, the owner iswondering if some way can be found to reduce the risk of an operating loss. Write a briefmemo to explain how the proportion of fixed and variable costs affects the risk of losswhen operations are close to the breakeven point.
Cost function, breakeven, target profit, uncertainties and bias, interpretation Joe Davies isthinking about starting a company to produce carved wooden clocks. He loves making the clocks.He sees it as an opportunity to be his own boss, making a living doing what he likes best.
Joe paid $300 for the plans for the first clock, and he has already purchased new equipmentcosting $2,000 to manufacture the clocks. He estimates that it will cost $30 in materials (wood,
e
3
22
e
e
e
✩ 3.34Q1, Q2, Q4, Q5
2
ch03.qxd 9/27/04 4:06 PM Page 120
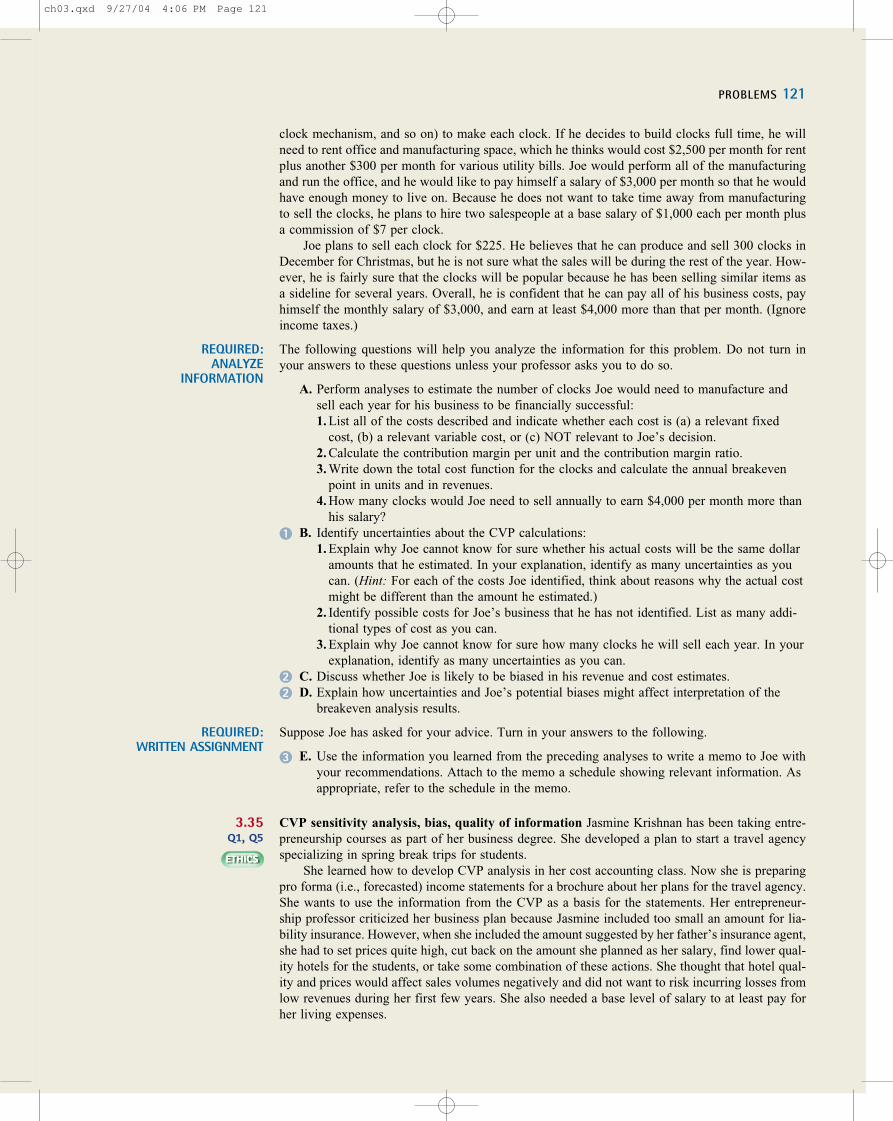
PROBLEMS 121
clock mechanism, and so on) to make each clock. If he decides to build clocks full time, he willneed to rent office and manufacturing space, which he thinks would cost $2,500 per month for rentplus another $300 per month for various utility bills. Joe would perform all of the manufacturingand run the office, and he would like to pay himself a salary of $3,000 per month so that he wouldhave enough money to live on. Because he does not want to take time away from manufacturingto sell the clocks, he plans to hire two salespeople at a base salary of $1,000 each per month plusa commission of $7 per clock.
Joe plans to sell each clock for $225. He believes that he can produce and sell 300 clocks inDecember for Christmas, but he is not sure what the sales will be during the rest of the year. How-ever, he is fairly sure that the clocks will be popular because he has been selling similar items asa sideline for several years. Overall, he is confident that he can pay all of his business costs, payhimself the monthly salary of $3,000, and earn at least $4,000 more than that per month. (Ignoreincome taxes.)
The following questions will help you analyze the information for this problem. Do not turn inyour answers to these questions unless your professor asks you to do so.
A. Perform analyses to estimate the number of clocks Joe would need to manufacture andsell each year for his business to be financially successful:1. List all of the costs described and indicate whether each cost is (a) a relevant fixed
cost, (b) a relevant variable cost, or (c) NOT relevant to Joe’s decision.2. Calculate the contribution margin per unit and the contribution margin ratio.3. Write down the total cost function for the clocks and calculate the annual breakeven
point in units and in revenues.4. How many clocks would Joe need to sell annually to earn $4,000 per month more than
his salary?B. Identify uncertainties about the CVP calculations:
1. Explain why Joe cannot know for sure whether his actual costs will be the same dollaramounts that he estimated. In your explanation, identify as many uncertainties as youcan. (Hint: For each of the costs Joe identified, think about reasons why the actual costmight be different than the amount he estimated.)
2. Identify possible costs for Joe’s business that he has not identified. List as many addi-tional types of cost as you can.
3. Explain why Joe cannot know for sure how many clocks he will sell each year. In yourexplanation, identify as many uncertainties as you can.
C. Discuss whether Joe is likely to be biased in his revenue and cost estimates.D. Explain how uncertainties and Joe’s potential biases might affect interpretation of the
breakeven analysis results.
Suppose Joe has asked for your advice. Turn in your answers to the following.
E. Use the information you learned from the preceding analyses to write a memo to Joe withyour recommendations. Attach to the memo a schedule showing relevant information. Asappropriate, refer to the schedule in the memo.
CVP sensitivity analysis, bias, quality of information Jasmine Krishnan has been taking entre-preneurship courses as part of her business degree. She developed a plan to start a travel agencyspecializing in spring break trips for students.
She learned how to develop CVP analysis in her cost accounting class. Now she is preparingpro forma (i.e., forecasted) income statements for a brochure about her plans for the travel agency.She wants to use the information from the CVP as a basis for the statements. Her entrepreneur-ship professor criticized her business plan because Jasmine included too small an amount for lia-bility insurance. However, when she included the amount suggested by her father’s insurance agent,she had to set prices quite high, cut back on the amount she planned as her salary, find lower qual-ity hotels for the students, or take some combination of these actions. She thought that hotel qual-ity and prices would affect sales volumes negatively and did not want to risk incurring losses fromlow revenues during her first few years. She also needed a base level of salary to at least pay forher living expenses.
REQUIRED: ANALYZE
INFORMATION
3.35Q1, Q5
REQUIRED: WRITTEN ASSIGNMENT
1
22
3
ch03.qxd 9/27/04 4:06 PM Page 121

122 CHAPTER 3 ➤ COST-VOLUME-PROFIT ANALYSIS
REQUIRED:
3.36Q1, Q4, Q5
REQUIRED:
✩ 3.37Q1, Q3, Q4, Q5, Q6
She decided to ask friends and relatives to invest in her travel agency to ensure she had enoughcapital for the first few years. Once her reputation was well established, she assumed that highercustomer volumes would cover all of her expected costs. She was confident that her planned tripswould attract enough students each year to cover most of her costs. From focus groups on cam-pus, she learned which types of trips were most appealing to other students. Now she planned touse sensitivity analysis to solve for volumes that would make the pro forma statements look at-tractive to investors.
A. In general, what information do we hope to gain from performing sensitivity analyses?Explain.
B. Explain how bias might enter into Jasmine’s sensitivity analyses.C. How might Jasmine’s bias affect the quality of the investment brochure information?D. Identify a potential ethical problem for Jasmine.E. When you consider the well-being of Jasmine’s family and friends, how would you rec-
ommend that Jasmine use sensitivity analysis for her brochure? Explain.
Small business owners, CVP research on the internet The Internet provides many resources tohelp small business owners successfully manage their businesses. Resources include informationabout common techniques used for planning and managing operations.
A. Why are small business owners often unaware of common business techniques such asCVP analysis?
B. Why might CVP analysis be even more useful to small business owners than to managersof large organizations? (Hint: Consider whether information about the margin of safetyand size of potential losses might be especially important for people who own small businesses.)
C. Use an Internet search engine to locate Web sites that provide information about theterms breakeven analysis and cost-volume-profit analysis. Also search for these terms onWeb sites designed explicitly to help small business owners, such as the U.S. Small Busi-ness Administration (www.sba.gov). Summarize what your research tells you about theuses and usefulness of breakeven and CVP analysis.
D. Suppose you are trying to help a small business owner learn to use breakeven and CVPanalysis. Write a memo to the owner explaining what you think the owner should do andinclude appropriate references to Internet resources that would be useful to the owner.Assume that you have already had a brief conversation with the owner about breakevenand CVP analysis, and the owner expressed an interest in learning more. Focus on com-municating effectively by avoiding unnecessarily technical language and concentrating onthe most important points.
Cost function, operating leverage, keeping or dropping a business The university’s WildcatLair caters to students and serves sandwiches and beverages. It has been reporting losses in pastmonths. In July, for example, the loss was $5,000.
Revenue $70,000Expenses
Purchases of prepared food $21,000Serving personnel 30,000Cashiers 5,500Administration 10,000University surcharge 7,000Utilities
��1�,�5�0�0� ��
7�5�,�0�0�0�
Loss $����
(��5��,��0��0��0��)
The Lair purchases prepared food directly from University Food Services. This charge variesproportionately with the number and kind of meals served. Personnel paid by the Lair serve the food,tend the cash register, bus and clean tables, and wash dishes. The staffing levels rarely change; theexisting staff can usually handle daily fluctuations in volume. Administrative costs are primarily thesalaries of the manager and her office staff. Because the university provides support services for the
2
2
2
2
3
1
1
3
1
www.wiley.com/college/eldenburg
ch03.qxd 9/27/04 4:06 PM Page 122

PROBLEMS 123
Lair, such as payroll, human resources, and other administrative support, the university charges a sur-charge of 10% of its revenues. Utility costs are the costs of cooling, heating, and lighting during itsnormal operating hours.
The university’s management is considering closing the Wildcat Lair because it has been op-erating at a loss.
The following questions will help you analyze the information for this problem. Do not turn inyour answers to these questions unless your professor asks you to do so.
A. What is the breakeven point for Wildcat Lair from the university’s perspective (includingthe university surcharge)? What is the breakeven point from Wildcat Lair’s perspective(excluding the university surcharge)?
B. Define and calculate the degree of operating leverage for the Lair, ignoring the universitysurcharge.
C. From the perspective of university management, is the university surcharge a relevantcost in deciding whether to close the Lair? Why or why not?
D. Identify possible ways that operations could be modified so that some of the fixed costsbecome variable costs.
E. Given the Lair’s cost function and operating leverage, describe possible benefits of modi-fying operations so that some of the fixed costs become variable costs.
Turn in your answers to the following.
F. From the perspective of university management, describe the pros and cons of closing theWildcat Lair.
G. Suppose you are the manager of the Wildcat Lair. Write a memo to persuade the univer-sity management to keep the club open.
Not-for-profit breakeven price, budget alternatives The Elder Clinic, a not-for-profit organiza-tion, provides limited medical services to low-income elderly patients. The manager’s summaryreport for the past four months of operations is reproduced here.
March April May June TotalPatient visits 849 821 778 842 3,290Patient fees $
����4�,�2�3�0�
$����
4�,�1�8�0�
$$����
3�,�8�7�5�
$�����
4,�2�6�0�
$����
16�,�5�4�5�
Medical staff salaries 13,254 13,256 13,254 14,115 53,879Medical supplies used 3,182 3,077 2,934 3,175 12,368Administrative salaries 3,197 3,198 3,197 3,412 13,004Rent 1,000 1,000 1,000 1,100 4,100Utilities 532 378 321 226 1,457Other expenses
����2�,�8�5�4� ����
2�,�7�7�6� ����
2�,�6�7�1� ����
2�,�8�2�8� ���
1�1�,�1�2�9�
Total expenses���
2�4�,�0�1�9� ���
2�3�,�6�8�5� ��
2�3�,�3�7�7� ��
2�4�,�8�5�6� ���
9�5�,�9�3�7�
Operating surplus (loss) $����
(��1��9��,��7��8��9��) $
����(��1��9��,��5��0��5��) $
������(
��1��9��,��5��0��2��) $
����(
��2��0��,��5��9��6��) $
����(��7��9��,��3��9��2��)
The clinic receives an operating subsidy from the city, but unfortunately, the operating loss in-curred through June ($79,392) is larger than anticipated. Part of the problem is the salary increasethat went into effect in June, which had been overlooked when the budget was submitted to the citylast year. To compound the problem, the warm summer months traditionally bring with them an in-crease in heat-related health problems. Thus, the clinic is likely to experience an increase in patientvisits during July.
The accountant made the following assumptions in developing the cost function:
● Salaries are fixed, and June values are used.● Medical supplies vary with patient visits.● Rent and utilities are fixed, and last period’s costs are used.● Other expenses are mixed and using regression, fixed cost is $702 and variable cost is $2.53
per patient visit.
REQUIRED: ANALYZE
INFORMATION
REQUIRED: WRITTEN
ASSIGNMENT
3.38Q1, Q2, Q4, Q5, Q6
1
1
2
2
3
e
ch03.qxd 9/27/04 4:06 PM Page 123

124 CHAPTER 3 ➤ COST-VOLUME-PROFIT ANALYSIS
REQUIRED:
REQUIRED:
3.40Q1, Q3, Q4, Q5
Clinic management is considering an increase in patient fees to reduce losses.
A. Develop a cost function for this data. You may have done this for Chapter 2, and in thatcase use that cost function. Solve for the average patient fee necessary to break even as-suming there are 940 patient-visits using the cost function you developed. Compare thisnew fee with the average patient fee charged during March through June.
B. Suppose the clinic raises its patient fees to break even. What problems do you see fromthe elderly patients’ perspective if the fee is raised?
C. In this setting, would an increase in fees be likely to affect patient volume? What prob-lems do you see from the clinic’s perspective if the fee is raised?
D. Other than raising the fee, what ideas might the clinic consider to balance the budget?
Cost function, target profit, operating leverage, CVP graph, owner goals Elina Siljander ownsElina’s Stained Glass in Helsinki, Finland. The business produces and sells three different typesof stained glass windows: small, medium, and large. Elina has two full-time employees who workregular schedules to cut glass and assemble the windows. She borrowed money from the bank tostart the business and pay living expenses. She is concerned that her cash flows might not be highenough either to pay herself or to repay the bank loan. She would like to generate approximately
10,000 (euros) in pretax profit each month to cover her living expenses and repay the loan.The following revenue and cost information covers the past four months:
June July August SeptemberRevenues 9,050 10,531 12,946 16,116
Raw materials and supplies 1,745 2,433 3,074 4,029Labor 3,880 4,041 4,246 4,282Rent 2,000 2,000 2,000 2,200Miscellaneous
����5�2�5� ����
7�0�1� �����
7�4�7� ����
7�9�3�
Profit������
9��0��0�� ������
1��,��3��5��6�� ��������
2��,��8��7��9�� ��������
4��,��8��1��2��
A. Develop a cost function for Elina’s Stained Glass.B. Determine the level of revenue Elina’s Stained Glass must generate to achieve the tar-
geted profit of 10,000 per month.C. Calculate Elina’s degree of operating leverage for September.D. Interpret Elina’s degree of operating leverage.E. Create a CVP graph showing the breakeven point, target profit, and margin of safety.F. Write a memo to Elina with recommendations about ways she might achieve her goals.
Building and using a CVP financial model Toddler Toy Company sells baby dolls, teddy bears,and toy cars. The managers established a preliminary budget using the following assumptions. Theywould now like to evaluate the sensitivity of budgeted results to different sets of assumptions.
Toddler Toy CompanyAssumptions for Coming Year
Baby Dolls Teddy Bears Toy Cars
Volume 200,000 125,000 225,000Price $ 3.50 $ 2.75 $ 3.15Variable costs $ 2.05 $ 1.75 $ 2.45Fixed costs $65,000 $125,000 $35,000
Target pretax income � $0Investment � $2 millionCapacity � 1 million units
A. Create a spreadsheet that the managers can use for sensitivity analysis. (Hint: Use theMagik Bicycles spreadsheet in Exhibit 3.2 and Appendix 3A to help you set up a spread-sheet with a data input box.) Modify input data in the spreadsheet to answer the follow-ing parts of this problem. You may wish to add cell references for percentage changes inprices, volumes, and costs.
3.39Q1, Q3, Q4, Q5, Q6
REQUIRED:
2
1
1
e
2
2
3
(continued)
ch03.qxd 9/27/04 4:06 PM Page 124

PROBLEMS 125
B. Assume that the volume of dolls sold increases to 225,000 units with no change in fixedor variable costs. What is the new pretax income? Does the number produced by your fi-nancial model appear to be reasonable? (Manually estimate the increase in pretax incomeif volume increases and fixed costs remain constant. Compare this figure to your spread-sheet result.)
C. Based on the original assumptions, what is the effect on pretax income if variable costsincrease by 5% for each of the three product lines? Assume that nothing else changes.
D. Return to the original assumptions. Assume that a sales manager proposed a new adver-tising campaign to boost sales volume. The campaign would cost $30,000 and is esti-mated to increase the volume of each product as follows:
Baby doll sales increase by 20,000 units.Teddy bear sales increase by 7,500 units.Toy car sales increase by 30,000 units.
What would be the effect on pretax income if this plan were adopted? E. Return to the original assumptions. Now assume that due to competition, Toddler Toys
must cut prices on each of its three products by 20%. In addition, a new advertising cam-paign costing $45,000 must be instituted to counteract bad publicity. Given these assump-tions, what is the new breakeven point?
F. Return to the original assumptions. What would be the pretax income if Toddler Toys in-creases the price of all three products by 10% and the volume of each product line decreasesby 5%?
G. Given the same assumptions as in part (F), how many units must Toddler Toys sell to earn atarget pretax income of $100,000? A target pretax income of $150,000? A pretax return oninvestment (ROI) of 10%? (Hint: To determine the target pretax income, multiply 10% timesamount invested.)
H. Spreadsheets for financial modeling allow sensitivity analysis of revenues, costs, andquantities such as estimated product volumes.1. Explain why it is not possible to perfectly estimate revenues, costs, and quantities.2. Explain how sensitivity analysis can help managers evaluate the pros and cons of
alternatives.3. Explain how manager bias might influence estimates of revenues, costs, and quantities.
Building and using a CVP financial model The following information for Pet Palace, a large retailstore that sells pet-related merchandise, was recorded for the first quarter. The store tracks merchan-dise according to product type. The category “Other” includes accessories such as dog beds, leashes,kitty litter boxes, bird cages, and so on. The company is considering several different strategies to im-prove operations for the next quarter.
Input Data Food Toys Pets Other TotalRevenue $500,000 $150,000 $75,000 $200,000 $925,000Variable cost 200,000 50,000 60,000 50,000 360,000Fixed cost 550,000Tax rate 25%
A. Create a spreadsheet that Pet Palace managers can use for sensitivity analysis. Modify in-formation in the data input section and answer the questions in the following parts.
B. What is Pet Palace’s breakeven point? What total revenue is necessary for a target after-tax income of $100,000?
C. Pet Palace managers are considering their advertising campaign for the next period. They be-lieve they could spend an additional $10,000 on advertising for a product line and increasesales by 10%. One manager wants to increase advertising on pets because that product line iscurrently the smallest. Another manager believes the ads should promote the most profitableproducts, but they are not sure which products those would be. What is the after-tax income ifpets are promoted? What is the most profitable product? What is the after-tax income if thatproduct is promoted?
D. What factors, other than the quantitative results, might influence managers’ decisions toincrease advertising?
e
3.41Q1, Q3, Q4, Q5
2
2
1
REQUIRED:
1
e
ch03.qxd 9/27/04 4:06 PM Page 125

126 CHAPTER 3 ➤ COST-VOLUME-PROFIT ANALYSIS
BUILD YOUR PROFESSIONAL COMPETENCIES
Focus on Professional Competency: Decision Modeling Model building for decision making,quality of analysis Review the following definition and elements for the Decision Modeling competency.9
Individuals preparing to enter the accounting profession must be able to use strategic and criti-cal approaches to decision-making. They must objectively consider issues, identify alternatives,and choose and implement solution approaches in order to deliver services and provide value.
3.42Q1, Q2, Q3, Q4, Q5, Q6
1. Identifies problems, poten-tial solution approaches, andrelated uncertainties
2. Objectively identifiesstrengths, weaknesses, oppor-tunities, and threats associatedwith a specific scenario, case,or business activity
3. Uses quantitative techniquesto explore the likelihood of al-ternative scenarios
4. Organizes and evaluates information, alternatives,cost/benefits, risks and rewardsof alternative scenarios
5. Employs model-buildingtechniques to quantify prob-lems or test solutions
6. Links data, knowledge, andinsights together for decision-making purposes
7. Engages in continuous im-provement and constructs newmodels over time
8. Makes decisions over timeas a result of engaging in continuous improvement andconstructing new models
Level 1 Level 2 Level 3 Level 4
DEFINITION:
ELEMENTS FOR THIS COMPETENCY INCLUDE
9The definition and elements are reprinted with permission from AICPA; copyright © 1978–2000 & 2003 by American In-stitute of Certified Public Accountants. The AICPA’s Core Competency Framework can be accessed at eca.aicpaservices.org.
A. Focus on the competency elements 1, 4, 6, and 8, which relate to the use of informationin management decision making. Answer the following questions:1. What types of management decisions were addressed in Chapter 3?2. What types of quantitative analyses were used in Chapter 3 to address these decisions?3. Were quantitative results the only information used by managers to make decisions?
Why or why not?4. Review the decision-making illustrations in Chapter 3. Provide an example where data,
knowledge, and insights were linked together. Explain.5. Review the decision-making illustrations in Chapter 3. Provide an example where an
improvement in analysis led to improved decision making. Explain.B. Focus on competency element 5, which addresses the use of model-building techniques.
Explain how CVP analysis (a model-building technique) can be used to (1) quantifyproblems and (2) test solutions.
C. Focus on competency elements 2 and 3, which relate to the use of quantitative techniquesto explore alternative scenarios. Answer the following questions:1. What is CVP sensitivity analysis? How is it used to quantitatively explore the likeli-
hood of alternative scenarios?2. What is the degree of operating leverage? How is it used to quantitatively explore the
likelihood of alternative scenarios?D. Focus on competency element 6, which relates to the use of information in decision mak-
ing. Suppose you plan to perform CVP analysis for an organization.1. What types of data do you need to perform the CVP analysis?2. Why is knowledge about the organization critical to your ability to perform a high-
quality analysis? What do you need to know?
REQUIRED:
112
2
2
2
2
2
21
ch03.qxd 9/27/04 4:06 PM Page 126

BUILD YOUR PROFESSIONAL COMPETENCIES 127
Integrating Across the Curriculum: Economics and Marketing Nonlinear revenue, maxi-mize profits, CVP assumptions Hollis Company manufactures and markets a regulator used tomaintain high levels of accuracy in timing clocks. The market for these regulators is limited andhighly dependent upon the selling price.
Based upon past relationships between the selling price and the resulting demand, as well asan informal survey of customers, management derived the following demand function, which ishighly representative of the actual relationships.
D � 1,000 � 2P
where D � Annual demand in unitsP � Price per unit
The estimated manufacturing and selling costs for the coming year are as follows:
Variable costsManufacturing $75 per unitSelling $25 per unit
Fixed costsManufacturing $24,000 per yearSelling $6,000 per year
A. Write the function for total revenue. [Hint: Recall that total revenue equals price timesquantity (P � Q), and the demand function determines the quantity sold (Q).]
B. Write the total cost function, substituting the demand function for Q.C. Perform a search on the Internet to find a quadratic equation calculator or go to www.
wiley.com/college/eldenburg. Use the calculator to find the breakeven points. (Hint: Setthe revenue function equal to the cost function and algebraically convert the equation toquadratic form: AP2 � BP � C � 0.)
D. Draw a graph with total revenue and total cost for Q between zero and 1,000 units. Markthe breakeven points.
E. Determine the selling price that Hollis Company should charge per regulator and thenumber of regulators the company should sell to maximize the company’s profits for thecoming year. (Hint: Recall that profit is maximized when marginal revenue equals mar-ginal cost. You must be able to differentiate a simple function to answer this question.)
F. Which CVP assumption does this situation violate? Explain.G. For the past several years, assume the company sold regulators at the price you calculated
in part (E) and that volume varied between 375 and 425 units per year. In this situation,discuss whether it would be appropriate to use CVP analysis to estimate the company’sprofits.
3.43Q1, Q2, Q5
REQUIRED: e
ee
e
e
www.wiley.com/college/eldenburg
ch03.qxd 9/27/04 4:06 PM Page 127