1.9 Global Environmental Concerns
18
184 Bureau of Energy Efficiency Figure 9.1 Ozone Layer e 9. GLOBAL ENVIRONMENTAL CONCERNS Syllabus Global Environmental Concerns : Unit ed Na ti ons Fr ame work Conve nti on on Cl imat e Change (UNFCC ), Kyoto Protocol, Conference of Partie s (COP) , Clean Developme nt Mechanism (CDM), Prototype Carbon Fund (PCF), Sustainable Development, 9.1 Global Environment al Issues As early as 1896, the Swedish scientist Svante Arrhenius had predicted that human activities would interfere with the way the sun interacts with the earth, resulting in global warming and climate change. His prediction has become true and climate change is now disrupting global envi ronm enta l sta bil ity. The las t few deca des have see n man y tre atie s, convent ions , and protoc ols for the cause of glo bal enviro nmental prote ction. Few examples of environmental issues of global significance are: • Ozone layer depletion • Global warming • Loss of biodiversity One of the mos t imp ort ant char act eristics of this environmental degradation is that it aff ect s all manki nd on a glo bal scale wit hout reg ard to any par ticular cou ntry , reg ion, or race. The whole world is a stakeholder and this raises issues on who should do what to combat environmental degradation. 9.2 Ozone Layer Depletion Ea rt h’ s at mo sphe re is di vi ded into three regions, namely troposphere, stratosphere and mesosphere (see Figure 9.1). The stratosphere extends from 10 to 50 kms from the Earth’s surf ace. This re gi on is concentrat ed wi th slight ly pungent smell ing, light bluish ozone gas . The ozone gas is mad e up of molecules ea ch conta ini ng three atoms of oxy ge n; it s chemical formula is O 3 . The ozone layer, in the stra to sp he re acts as an effic ie nt fi lt er fo r harmful solar Ultraviolet B (UV-B) rays
-
Upload
prateek-gupta -
Category
Documents
-
view
218 -
download
0
Transcript of 1.9 Global Environmental Concerns

8/2/2019 1.9 Global Environmental Concerns
http://slidepdf.com/reader/full/19-global-environmental-concerns 1/18
184Bureau of Energy Efficiency
Figure 9.1 Ozone Layereeeeeeeeeeeeeeeeeeeeeeeeeeeeeeeeeeeeeeeeeeeeeeeeeeeeeeeeeeeeeee
9. GLOBAL ENVIRONMENTAL CONCERNS
Syllabus
Global Environmental Concerns: United Nations Framework Convention on Climate
Change (UNFCC), Kyoto Protocol, Conference of Parties (COP), Clean Development
Mechanism (CDM), Prototype Carbon Fund (PCF), Sustainable Development,
9.1 Global Environmental Issues
As early as 1896, the Swedish scientist Svante Arrhenius had predicted that human activities
would interfere with the way the sun interacts with the earth, resulting in global warming and
climate change. His prediction has become true and climate change is now disrupting globalenvironmental stability. The last few decades have seen many treaties, conventions, and
protocols for the cause of global environmental protection.
Few examples of environmental issues of global significance are:
• Ozone layer depletion
• Global warming
• Loss of biodiversity
One of the most important characteristics of
this environmental degradation is that itaffects all mankind on a global scale without
regard to any particular country, region, or
race. The whole world is a stakeholder and
this raises issues on who should do what tocombat environmental degradation.
9.2 Ozone Layer Depletion
Earth’s atmosphere is divided into three
regions, namely troposphere, stratosphere andmesosphere (see Figure 9.1). The stratosphere
extends from 10 to 50 kms from the Earth’s
surface. This region is concentrated with
slightly pungent smelling, light bluish ozonegas. The ozone gas is made up of molecules
each containing three atoms of oxygen; itschemical formula is O3. The ozone layer, in the
stratosphere acts as an efficient filter for
harmful solar Ultraviolet B (UV-B) rays

8/2/2019 1.9 Global Environmental Concerns
http://slidepdf.com/reader/full/19-global-environmental-concerns 2/18
9. Global Environmental Concernseeeeeeeeeeeeeeeeeeeeeeeeeeeeeeeeeeeeeeeeeeeeeeeeeeeeeeeeeeeeee
185Bureau of Energy Efficiency
Figure 9.2 Ozone Production and Destruction Process
Ozone is produced and destroyed
naturally in the atmosphere and until
recently, this resulted in a well- balanced equilibrium (see Figure 9.2).
Ozone is formed when oxygen
molecules absorb ultraviolet radiationwith wavelengths less than 240nanometres and is destroyed when it
absorbs ultraviolet radiation with
wavelengths greater than 290nanometres. In recent years, scientists
have measured a seasonal thinning of the ozone layer primarily at the South Pole. This
phenomenon is being called the ozone hole.
9.2.1 Ozone Depletion Process
Ozone is highly reactive and easily broken down by man-made chlorine and bromine
compounds. These compounds are found to be most responsible for most of ozone layer depletion.
The ozone depletion process begins when CFCs (used in refrigerator and air conditioners)
and other ozone-depleting substances (ODS) are emitted into the atmosphere. Winds efficientlymix and evenly distribute the ODS in the troposphere. These ODS compounds do not dissolve
in rain, are extremely stable, and have a long life span. After several years, they reach the
stratosphere by diffusion.
Strong UV light breaks apart the ODS molecules. CFCs, HCFCs, carbon tetrachloride,
methyl chloroform release chlorine atoms, and halons and methyl bromide release bromine
atoms. It is the chlorine and bromine atom that actually destroys ozone, not the intact ODSmolecule. It is estimated that one chlorine atom can destroy from 10,000 to 100,000 ozone
molecules before it is finally removed from the stratosphere.
Chemistry of Ozone Depletion
When ultraviolet light waves (UV) strike CFC* (CFCl3) molecules in the upper atmosphere, a
carbon-chlorine bond breaks, producing a chlorine (Cl) atom. The chlorine atom then reactswith an ozone (O3) molecule breaking it apart and so destroying the ozone. This forms an
ordinary oxygen molecule (O2) and a chlorine monoxide (ClO) molecule. Then a free oxygen**
atom breaks up the chlorine monoxide. The chlorine is free to repeat the process of destroying
more ozone molecules. A single CFC molecule can destroy 100,000 ozone molecules. Thechemistry of ozone depletion process is shown in Figure 9.3.
* CFC - chlorofluorocarbon: it contains chlorine, fluorine and carbon atoms.
** UV radiation breaks oxygen molecules (O2) into single oxygen atoms.

8/2/2019 1.9 Global Environmental Concerns
http://slidepdf.com/reader/full/19-global-environmental-concerns 3/18
Figure 9.3 Chemistry of Ozone Depletion Process
Chemical equation is
CFCl3 + UV Light ==> CFCl2 + Cl
Cl + O3 ==> ClO + O2
ClO + O ==> Cl + O2
The free chlorine atom is then free to attack another ozone moleculeCl + O3 ==> ClO + O2
ClO + O ==> Cl + O2
and again ...
and again... for thousands of times.
Cl + O3 ==> ClO + O2
ClO + O ==> Cl + O2
Scientist measure ozone layer thickness by measuring how much ultraviolet radiation reachesthe ground, using a Dobson ozone spectrophotometer. Ozone layer thickness is measured in
Dobson units. The higher the number, the thicker the ozone layer. Since the 1970s, gases
produced for commercial purposes have been destroying the ozone layer, upsetting thenatural equilibrium that existed. It is planned that by 2005 in developed countries and by
2015 in developing countries, the use of ozone depleting gases, such as CFCs, will be phased
out.
9.2.2 Effects of Ozone Layer Depletion
Effects on Human and Animal Health: Increased penetration of solar UV-B radiation islikely to have high impact on human health with potential risks of eye diseases, skin cancer and
infectious diseases.
Effects on Terrestrial Plants: In forests and grasslands, increased radiation is likely to changespecies composition thus altering the bio-diversity in different ecosystems. It could

8/2/2019 1.9 Global Environmental Concerns
http://slidepdf.com/reader/full/19-global-environmental-concerns 4/18
also affect the plant community indirectly resulting in changes in plant form, secondary
metabolism, etc.
Effects on Aquatic Ecosystems: High levels of radiation exposure in tropics and subtropics
may affect the distribution of phytoplanktons, which form the foundation of aquatic food webs.
It can also cause damage to early development stages of fish, shrimp, crab, amphibians andother animals, the most severe effects being decreased reproductive capacity andimpaired larval development.
Effects on Bio-geo-chemical Cycles: Increased solar UV radiation could affect terrestrialand aquatic bio-geo-chemical cycles thus altering both sources and sinks of greenhouse and
important trace gases, e.g. carbon dioxide (CO2), carbon monoxide (CO), carbonyl sulfide
(COS), etc. These changes would contribute to biosphere-atmosphere feedbacks responsible for the atmosphere build-up of these greenhouse gases.
Effects on Air Quality: Reduction of stratospheric ozone and increased penetration of UV- B
radiation result in higher photo dissociation rates of key trace gases that control the chemicalreactivity of the troposphere. This can increase both production and destruction of ozone and
related oxidants such as hydrogen peroxide, which are known to have adverse effects on human
health, terrestrial plants and outdoor materials.
The ozone layer, therefore, is highly beneficial to plant and animal life on earth filtering out the dangerous part of sun’s radiation and allowing only the beneficial part to reach earth. Anydisturbance or depletion of this layer would result in an increase of harmful radiation reaching the earth’s surface leading to dangerous consequences.
9.2.3 Ozone Depletion Counter Measures
− International cooperation, agreement (Montreal Protocol) to phase out ozone depletingchemicals since 1974
− Tax imposed for ozone depleting substances
− Ozone friendly substitutes- HCFC (less ozone depleting potential and shorter life)
− Recycle of CFCs and Halons
9.3 Global Warming
Before the Industrial Revolution, human activities released very few gases into the
atmosphere and all climate changes happened naturally. After the Industrial Revolution,
through fossil fuel combustion, changing agricultural practices and deforestation, the naturalcomposition of gases in the atmosphere is getting affected and climate and environment
began to alter significantly.
Over the last 100 years, it was found out that the earth is getting warmer and warmer, unlike
previous 8000 years when temperatures have been relatively constant. The presenttemperature is 0.3 - 0.6
oC warmer than it was 100 years ago.

8/2/2019 1.9 Global Environmental Concerns
http://slidepdf.com/reader/full/19-global-environmental-concerns 5/18
The key greenhouse gases (GHG) causing global warming is carbon dioxide. CFC's, even
though they exist in very small quantities, are significant contributors to global warming.Carbon dioxide, one of the most prevalent greenhouse gases in the atmosphere, has two
major anthropogenic (human-caused) sources: the combustion of fossil fuels and changes in
land use. Net releases of carbon dioxide from these two sources are believed to be
contributing to the rapid rise in atmospheric concentrations since Industrial Revolution.Because estimates indicate that approximately 80 percent of all anthropogenic carbon dioxide
emissions currently come from fossil fuel combustion, world energy use has emerged at the
center of the climate change debate.
9.3.1 Sources of Greenhouse Gases
Nitrous oxideSome greenhouse gases occur naturally in theatmosphere, while others result from human
activities. Naturally occurring greenhouse gasesinclude water vapor, carbon dioxide, methane,
nitrous oxide, and ozone (refer Figure 9.4). Certainhuman activities, however, add to the levels of mostof these naturally occurring gases.
Ozone 6%
7%
Methane
12%
CFC
21%
Carbon dioxide
54%
Carbon dioxide is released to the atmosphere whensolid waste, fossil fuels (oil, natural gas, and coal),
and wood and wood products are burned.
Figure 9.4 %Share of Greenhouse Gases
Methane is emitted during the production and transport of coal, natural gas, and oil. Methane
emissions also result from the decomposition of organic wastes in municipal solid waste
landfills, and the raising of livestock. Nitrous oxide is emitted during agricultural and industrialactivities, as well as during combustion of solid waste and fossil fuels.
Very powerful greenhouse gases that are not naturally occurring include hydrofluorocarbons(HFCs), perfluorocarbons (PFCs), and sulfur hexafluoride (SF6), which are generated in a
variety of industrial processes.
Often, estimates of greenhouse gas emissions are presented in units of millions of metric tons
of carbon equivalents (MMTCE), which weights each gas by its Global Warming Potential or
GWP value.
9.3.2 Global Warming Potentials
Although there are a number of ways of measuring the strength of different greenhouse gases inthe atmosphere, the Global Warming Potential (GWP) is perhaps the most useful.
GWPs measure the influence greenhouse gases have on the natural greenhouse effect, includingthe ability of greenhouse gas molecules to absorb or trap heat and the length of time,greenhouse gas molecules remain in the atmosphere before being removed or broken

8/2/2019 1.9 Global Environmental Concerns
http://slidepdf.com/reader/full/19-global-environmental-concerns 6/18
down. In this way, the contribution that each greenhouse gas has towards global warming can
be assessed.
Each greenhouse gas differs in its ability to absorb heat in the atmosphere. HFCs and PFCs
are the most heat-absorbent. Methane traps over 21 times more heat per molecule than
carbon dioxide, and nitrous oxide absorbs 270 times more heat per molecule than carbondioxide. Conventionally, the GWP of carbon dioxide, measured across all time horizons, is 1.The GWPs of other greenhouse gases are then measured relative to the GWP of carbon dioxide.
Thus GWP of methane is 21 while GWP of nitrous oxide is 270.
Other greenhouse gases have much higher GWPs than carbon dioxide, but because their
concentration in the atmosphere is much lower, carbon dioxide is still the most important
greenhouse gas, contributing about 60% to the enhancement of the greenhouse effect.
9.3.3 Global Warming (Climate Change) Implications
Rise in global temperatureObservations show that global temperatures have risen by about 0.6 °C over the 20th century.
There is strong evidence now that most of the observed warming over the last 50 years is
caused by human activities. Climate models predict that the global temperature will rise byabout 6 °C by the year 2100.
Rise in sea level
In general, the faster the climate change, the greater will be the risk of damage. The mean sealevel is expected to rise 9 - 88 cm by the year 2100, causing flooding of low lying areas and
other damages.
Food shortages and hunger
Water resources will be affected as precipitation and evaporation patterns change around theworld. This will affect agricultural output. Food security is likely to be threatened and someregions are likely to experience food shortages and hunger.
India could be more at risks than many other countries
Models predict an average increase in temperature in India of 2.3 to 4.8oC for the benchmark
doubling of Carbon-dioxide scenario. Temperature would rise more in Northern India than inSouthern India. It is estimated that 7 million people would be displaced, 5700 km
2of land
and 4200 km of road would be lost, and wheat yields could decrease significantly.
9.4 Loss of Biodiversity
Biodiversity refers to the variety of life on earth, and its biological diversity. The number of
species of plants, animals, micro organisms, the enormous diversity of genes in these species,
the different ecosystems on the planet, such as deserts, rainforests and coral reefs are all a part of a biologically diverse earth. Biodiversity actually boosts ecosystem productivity
where each species, no matter how small, all have an important role to play and that it is in this
combination that enables the ecosystem to possess the ability to prevent and recover from
a variety of disasters.
8/2/2019 1.9 Global Environmental Concerns
http://slidepdf.com/reader/full/19-global-environmental-concerns 7/18
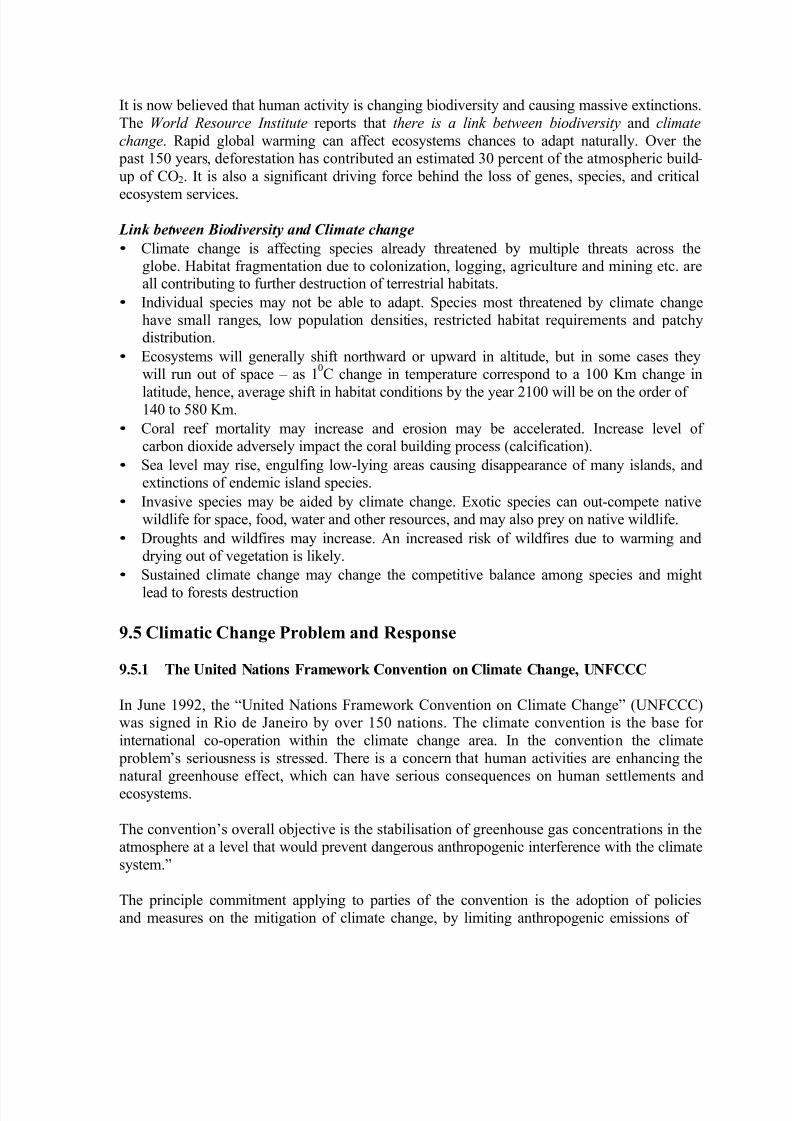
It is now believed that human activity is changing biodiversity and causing massive extinctions.
The World Resource Institute reports that there is a link between biodiversity and climate
change. Rapid global warming can affect ecosystems chances to adapt naturally. Over the past 150 years, deforestation has contributed an estimated 30 percent of the atmospheric build-
up of CO2. It is also a significant driving force behind the loss of genes, species, and critical
ecosystem services.
Link between Biodiversity and Climate change
• Climate change is affecting species already threatened by multiple threats across theglobe. Habitat fragmentation due to colonization, logging, agriculture and mining etc. areall contributing to further destruction of terrestrial habitats.
• Individual species may not be able to adapt. Species most threatened by climate changehave small ranges, low population densities, restricted habitat requirements and patchydistribution.
• Ecosystems will generally shift northward or upward in altitude, but in some cases theywill run out of space – as 1
0C change in temperature correspond to a 100 Km change in
latitude, hence, average shift in habitat conditions by the year 2100 will be on the order of 140 to 580 Km.
• Coral reef mortality may increase and erosion may be accelerated. Increase level of carbon dioxide adversely impact the coral building process (calcification).
• Sea level may rise, engulfing low-lying areas causing disappearance of many islands, andextinctions of endemic island species.
• Invasive species may be aided by climate change. Exotic species can out-compete nativewildlife for space, food, water and other resources, and may also prey on native wildlife.
• Droughts and wildfires may increase. An increased risk of wildfires due to warming anddrying out of vegetation is likely.
• Sustained climate change may change the competitive balance among species and might
lead to forests destruction
9.5 Climatic Change Problem and Response
9.5.1 The United Nations Framework Convention on Climate Change, UNFCCC
In June 1992, the “United Nations Framework Convention on Climate Change” (UNFCCC)was signed in Rio de Janeiro by over 150 nations. The climate convention is the base for
international co-operation within the climate change area. In the convention the climate
problem’s seriousness is stressed. There is a concern that human activities are enhancing thenatural greenhouse effect, which can have serious consequences on human settlements and
ecosystems.
The convention’s overall objective is the stabilisation of greenhouse gas concentrations in theatmosphere at a level that would prevent dangerous anthropogenic interference with the climate
system.”
The principle commitment applying to parties of the convention is the adoption of policies
and measures on the mitigation of climate change, by limiting anthropogenic emissions of

8/2/2019 1.9 Global Environmental Concerns
http://slidepdf.com/reader/full/19-global-environmental-concerns 8/18
greenhouse gases and protecting and enhancing greenhouse gas sinks and reservoirs. The
commitment includes the preparation and communication of national inventories of greenhouse
gases. The Climate convention does not have any quantitative targets or timetables for individual nations. However, the overall objective can be interpreted as stabilization of
emissions of greenhouse gases by year 2000 at 1990 levels.
The deciding body of the climate convention is the Conference of Parties (COP). At the COPmeetings, obligations made by the parties are examined and the objectives and
implementation of the climate convention are further defined and developed. The first COP was
held in Berlin, Germany in 1995 and the latest (COP 10) was held in December 2004, BuenosAires, Argentina.
9.5.2 The Kyoto Protocol
There is a scientific consensus that human activities are causing global warming that could
result in significant impacts such as sea level rise, changes in weather patterns and adverse
health effects. As it became apparent that major nations such as the United States and Japan
would not meet the voluntary stabilization target by 2000, Parties to the Convention decidedin 1995 to enter into negotiations on a protocol to establish legally binding limitations or
reductions in greenhouse gas emissions. It was decided by the Parties that this round of negotiations would establish limitations only for the developed countries, including the
former Communist countries (called annex A countries).
Negotiations on the Kyoto Protocol to the United Nations Framework Convention on Climate
Change (UNFCCC) were completed December 11, 1997, committing the industrialized nationsto specify, legally binding reductions in emissions of six greenhouse gases. The 6 major
greenhouse gases covered by the protocol are carbon dioxide (CO2), methane (CH4), nitrous
oxide (N2O), hydrofluorocarbons (HFCs), perfluorocarbons (PFCs), and sulfur hexafluoride
(SF6).
Emissions Reductions
The United States would be obligated under the Protocol to a cumulative reduction in itsgreenhouse gas emissions of 7% below 1990 levels for three greenhouse gases (including
carbon dioxide), and below 1995 levels for the three man-made gases, averaged over the
commitment period 2008 to 2012.
The Protocol states that developed countries are committed, individually or jointly, to
ensuring that their aggregate anthropogenic carbon dioxide equivalent emissions of greenhouse
gases do not exceed amounts assigned to each country with a view to reducing their overallemissions of such gases by at least 5% below 1990 levels in the commitment period 2008 to
2012.
The amounts for each country are listed as percentages of the base year, 1990 and range from
92% (a reduction of 8%) for most European countries--to 110% (an increase of 10%) for
Iceland.

8/2/2019 1.9 Global Environmental Concerns
http://slidepdf.com/reader/full/19-global-environmental-concerns 9/18
Developing Country Responsibilities
Another problematic area is that the treaty is ambiguous regarding the extent to which
developing nations will participate in the effort to limit global emissions. The original 1992climate treaty made it clear that, while the developed nations most responsible for the current
buildup of greenhouse gases in the atmosphere should take the lead in combating climate
change, developing nations also have a role to play in protecting the global climate. Per Capita CO2 emissions are small in developing countries and developed nations have altered
the atmosphere the most as shown in the Figure 9.5 & Figure 9.6.
Figure 9.5 Per Capita CO2 Emissions for the 15
Countries With the Highest Total Industrial
Emissions, 1995
Figure 9.6 Cumulative Carbon-Dioxide
Emissions, 1950-95
Developing countries, including India and China, do not have to commit to reductions in thisfirst time period because their per-capita emissions are much lower than those of developed
countries, and their economies are less able to absorb the initial costs of changing to cleaner
fuels. They have not contributed significantly to today’s levels of pollution that has been the product of the developed world’s Industrial Revolution. The idea is that developing countries
will be brought more actively into the agreement as new energy technologies develops and as
they industrialize further.
Annex I and Annex II Parties
Annex I parties are countries which have commitments according to the Kyoto protocol. Theentire Annex I parties are listed in the Table 9.1 below. Further Annex I parties shown in
bold are also called Annex II parties. These Annex II parties have a special obligation to
provide “new and additional financial sources” to developing countries (non Annex I) to helpthem tackle climate change, as well as to facilitate the transfer of climate friendly
technologies to both developing countries and to economies in transition. Commitments are
presented as percentage of base year emission levels to be achieved during between 2008 – 2012.

8/2/2019 1.9 Global Environmental Concerns
http://slidepdf.com/reader/full/19-global-environmental-concerns 10/18
Table 9.1 Annex I and Annex II Parties
European Union % Economies in transition to a market economy %
Austria 92 Bulgaria 92
Belgium 92 Croatia 95Denmark 92 Czech Republic 92
Finland 92 Estonia 92
France 92 Hungary 94
Germany 92 Latvia 92
Greece 92 Lithuania 92
Ireland 92 Poland 94
Italy 92 Romania 92
Luxembourg 92 Russian Federation 100
Netherlands 92 Slovakia 92
Portugal 92 Slovenia 92
Spain 92 Ukraine 100Sweden 92
United Kingdom 92
Other Europe Other Annex I
Iceland 110 Australia 108Liechtenstein 92 Canada 94
Monaco 92 Japan 94
Norway 101 New Zealand 100
Switzerland 92 United States of America 93
Base year is 1990 for all countries except those economies in transition, who may chose analternative base year or multi-year period.
Actions required from developed and developing Nations
The Kyoto Protocol does call on all Parties (developed and developing) to take a number of steps to formulate national and regional programs to improve "local emission factors,"
activity data, models, and national inventories of greenhouse gas emissions and sinks that
remove these gases from the atmosphere. All Parties are also committed to formulate, publish, and update climate change mitigation and adaptation measures, and to cooperate in
promotion and transfer of environmentally sound technologies and in scientific and technical
research on the climate system.
Who is bound by the Kyoto Protocol?
The Kyoto Protocol has to be signed and ratified by 55 countries (including those responsible
for at least 55% of the developed world's 1990 carbon dioxide emissions) before it can enter
into force. Now that Russia has ratified, this been achieved and the Protocol will enter into
force on 16 February 2005.

8/2/2019 1.9 Global Environmental Concerns
http://slidepdf.com/reader/full/19-global-environmental-concerns 11/18
9.5.3 India’s Greenhouse Gas Emissions
India has experienced a dramatic growth in fossil fuel CO2 emissions, and the data compiled byvarious agencies shows an increase of nearly 5.9 % since 1950. At present India is rated as
the 6th
largest contributor of CO2 emissions behind China, the 2nd
largest contributor.
However, our per capita CO2 of 0.93 tons per annum is well below the world average of 3.87tons per annum. Fossil fuel emissions in India continue to result largely from coal burning.India is highly vulnerable to climate change as its economy is heavily reliant on climate
sensitive sectors like agriculture and forestry. The vast low-lying and densely populated
coastline is susceptible to rise in sea level.
The energy sector is the largest contributor of carbon dioxide emissions in India. The national
inventory of greenhouse gases indicates that 55% of the total national emissions comefrom energy sector. These include emissions from road transport, burning of traditional bio-
mass fuels, coal mining, and fugitive emissions from oil and natural gas.
Agriculture sector constitutes the next major contributor, accounting for nearly 34%. Theemissions under this sector include those from enteric fermentation in domestic animals,
manure management, rice cultivation, and burning of agriculture residues. Emissions from
Industrial sector mainly came from cement production.
Indian Response to Climatic Change
Under the UNFCCC, developing countries such as India do not have binding GHGmitigation commitments in recognition of their small contribution to the greenhouse problem aswell as low financial and technical capacities. The Ministry of Environment and Forests is thenodal agency for climate change issues in India. It has constituted Working Groups on theUNFCCC and Kyoto Protocol. Work is currently in progress on India's initial National
Communication (NATCOM) to the UNFCCC. India ratified the Kyoto Protocol in 2002
9.6 The Conference of the Parties (COP)
The Conference of the Parties is the supreme body of the Climate Change Convention. The vastmajority of the world’s countries are members (185 as of July 2001). The Convention entersinto force for a country 90 days after that country ratifies it. The COP held its first session in1995 and will continue to meet annually unless decided otherwise. However, various subsidiary bodies that advise and support the COP meet more frequently.
The Convention states that the COP must periodically examine the obligations of the Parties
and the institutional arrangements under the Convention. It should do this in light of theConvention’s objective, the experience gained in its implementation, and the current state of scientific knowledge.
Exchange of Information
The COP assesses information about policies and emissions that the Parties share with each
other through their national communications. It also promotes and guides the development
and periodic refinement of comparable methodologies, which are needed for quantifying net

8/2/2019 1.9 Global Environmental Concerns
http://slidepdf.com/reader/full/19-global-environmental-concerns 12/18
greenhouse gas emissions and evaluating the effectiveness of measures to limit them. Based on
the information available, the COP assesses the Parties efforts to meet their treaty commitments
and adopts and publishes regular reports on the Convention’s implementation.
Support for Developing countries
Developing countries need support so that they can submit their national communications,adapt to the adverse effects of climate change, and obtain environmentally sound
technologies. The COP therefore oversees the provision of new and additional resources by
developed countries.
The third session of the Conference of the Parties adopted the Kyoto Protocol.
9.6.1 The Flexible Mechanisms
The Kyoto protocol gives the Annex I countries the option to fulfill a part of their commitments
through three “flexible mechanisms”. Through these mechanisms, a country can fulfill a partof their emissions reductions in another country or buy emission allowances from another
country. There are three flexible mechanisms:
i. Emissions trading
ii. Joint implementationiii. Clean development mechanism
i) Emissions trading
Article 17 of the Kyoto protocol opens up for emissions trading between countries that have
made commitments to reduce greenhouse gas emissions. The countries have the option todelegate this right of emissions trading to companies or other organisations.
In a system for emissions trading, the total amount of emissions permitted is pre-defined. Thecorresponding emissions allowances are then issued to the emitting installations through
auction or issued freely. Through trading, installations with low costs for reductions are
stimulated to make reductions and sell their surplus of emissions allowances to organisations
where reductions are more expensive. Both the selling and buying company wins on thisflexibility that trade offers with positive effects on economy, resource efficiency and climate.
The environmental advantage is that one knows, in advance, the amount of greenhouse gases
that will be emitted. The economical advantage is that the reductions are done where thereduction costs are the lowest. The system allows for a cost effective way to reach a pre-
defined target and stimulates environmental technology development.
ii) Joint Implementation, JI
Under article 6 of the Kyoto protocol an Annex I country that has made a commitment for reducing greenhouse gases, can offer to, or obtain from another Annex I country greenhouse
gas emissions reductions. These emissions reductions shall come from projects with the
objectives to reduce anthropogenic emissions from sources or increase the anthropogenic
uptake in sinks. In order to be accepted as JI-projects, the projects have to be accepted by

8/2/2019 1.9 Global Environmental Concerns
http://slidepdf.com/reader/full/19-global-environmental-concerns 13/18
both parties in advance. It also has to be proven that the projects will lead to emissions
reductions that are higher than what otherwise would have been obtained. JI-projects are an
instrument for one industrial country to invest in another industrial country and in return obtainemissions reductions. These reductions can be used to help fulfill their own reduction
commitments at a lower cost than if they had to do the reductions in their own country.
iii) Clean Development Mechanism (CDM)
Article 12 of the Kyoto protocol defines the Clean Development Mechanism, CDM. The
purpose of CDM is to:a) contribute to sustainable development in developing countries;
b) help Annex I-countries under the Kyoto Protocol to meet their target.
With the help of CDM, countries which have set themselves an emission reduction target under
the Kyoto Protocol (Annex I countries) can contribute to the financing of projects in developing
countries (non-Annex I countries) which do not have a reduction target. These projects should
reduce the emission of greenhouse gases while contributing to the sustainable development of the host country involved. The achieved emission reductions can be purchased by the
Annex I country in order to meet its reduction target.
In order to be accepted as CDM-projects, the projects have to be accepted by both parties in
advance. It also has to be proven that the projects will lead to emissions reductions that are
higher than what otherwise would have been obtained. The difference between JI-projectsand CDM-projects is that JI-projects are done between countries that both have
commitments, while the CDM-projects is between one country that has commitments and
another country that does not have commitments. Emissions reductions that have been donethrough CDM-projects during the period 2000 to 2007, can be used for fulfilling
commitments in Annex I countries for the period 2008-2012.
How CDM works?
An investor from a developed country, can invest in, or provide finance for a project in a
developing country that reduces greenhouse gas emissions so that they are lower than theywould have been without the extra investment – i.e. compared to what would have happened
without the CDM under a business as usual outcome. The investor then gets credits – carbon
credits - for the reductions and can use those credits to meet their Kyoto target. If the CDMworks perfectly it will not result in more or less emission reductions being achieved than
were agreed under the Kyoto Protocol, it will simply change the location in which some of
the reductions will happen.
For example, a French company needs to reduce its emissions as part of its contribution tomeeting France’s emission reduction target under the Kyoto Protocol. Instead of reducingemissions from its own activities in France, the company provides funding for theconstruction of a new biomass plant in India that would not have been able to go ahead withoutthis investment. This, they argue, prevents the construction of new fossil-fueled plants inIndia, or displaces consumption of electricity from existing ones, leading to a

8/2/2019 1.9 Global Environmental Concerns
http://slidepdf.com/reader/full/19-global-environmental-concerns 14/18
reduction in greenhouse gas emissions in India. The French investor gets credit for those
reductions and can use them to help meet their reduction target in France.
Requirements for Participating in CDM
Project cycle for CDM
The project cycle for CDM is shown in Figure 9.7. There are seven basic stages; the first four stagesare performed prior to the implementation of the project, while the last three stages are performedduring the lifetime of the project.
Figure 9.7 Project Cycle for CDM

8/2/2019 1.9 Global Environmental Concerns
http://slidepdf.com/reader/full/19-global-environmental-concerns 15/18
While investors profit from CDM projects by obtaining reductions at costs lower than in their
own countries, the gains to the developing country host parties are in the form of finance,
technology, and sustainable development benefits.
Projects starting in the year 2000 are eligible to earn Certified Emission Reductions (CERs) if
they lead to "real, measurable, and long-term" GHG reductions, which are additional to any thatwould occur in the absence of the CDM project. This includes afforestation and reforestation projects, which lead to the sequestration of carbon dioxide.
At COP-7, it was decided that the following types of projects would qualify for fast-track approval procedures:
− Renewable energy projects with output capacity up to 15 MW− Energy efficiency improvement projects which reduce energy consumption on the
supply and/or demand side by up to 15 GWh annually− Other project activities that both reduce emissions by sources and directly emit less
than 15 kilotons CO2 equivalent annually.
The CDM will be supervised by an executive board, and a share of the proceeds from projectactivities will be used to assist developing countries in meeting the costs of adaptation to
climate change.
Indian Initiatives on CDM
Government of India has been willing to fulfill its responsibility under the CDM. It hasdeveloped an interim criterion for approval of CDM project activities, which is now available
to stakeholders. It has undertaken various capacity building activities like holding of
workshops, initiation of various studies, and briefing meeting with the stakeholders. India has been actively participating in the CDM regime and has already approved projects for further development.
Under CDM, projects such as energy efficient hydrocarbon refrigerators, modernization of small scale foundry units and renovation, modernization of thermal power stations etc. are
being taken up.
Case Example
In a power plant renovation and modernization programme by replacing plant equipment whichare prone to wear and tear over a period of time, such as boilers and auxiliaries, turbine
blades, HP governor valves and station auxiliaries which include material handling equipment,water treatment, pulverisers, ash handling plant, ESP etc resulted in CO2 emission
reduction from 1.20 kg/kWh to 1.11 kg/kWh. The details are shown in the Table9.2:

8/2/2019 1.9 Global Environmental Concerns
http://slidepdf.com/reader/full/19-global-environmental-concerns 16/18
Table 9.2 Efficiency Improvement And Emission Reduction in a Power Plant Modernisation
Programme
Parameters Before the programme After the programme
Gross heat rate (kcal/KWh) 2700 2500
Net efficiency (%) 28 30
Specific coal consumption 0.77 0.71
Total CO2 emissions (tones/year) 1435336 1329015
CO2 emissions (kg/ kWh) 1.20 1.11
9.7 Prototype Carbon Fund (PCF)
Recognizing that global warming will have the most impact on its borrowing client countries,
the World Bank approved the establishment of the Prototype Carbon Fund (PCF). The PCF isintended to invest in projects that will produce high quality greenhouse gas emission reductions
that could be registered with the United Nations Framework Convention on Climate Change
(UNFCCC) for the purposes of the Kyoto Protocol. To increase the likelihood that the
reductions will be recognized by the Parties to the UNFCCC, independent experts will followvalidation, verification and certification procedures that respond to UNFCCC rules as they
develop.
The PCF will pilot production of emission reductions within the framework of Joint
Implementation (JI) and the Clean Development Mechanism (CDM). The PCF will investcontributions made by companies and governments in projects designed to produce
emission reductions fully consistent with the Kyoto Protocol and the emerging framework for
JI and the CDM. Contributors, or "Participants" in the PCF, will receive a pro rata share of the emission reductions, verified and certified in accordance with agreements reached withthe respective countries "hosting" the projects.
9.7.1 Size of Market for Emissions Reductions
• All estimates of market volume are speculative at this early stage in the market’sdevelopment.
• One way of looking at the potential size of the market is to assume that about one
billion tonnes of carbon emissions must be reduced per year during the commitment
period of 2008-2012 in order for the industrialized countries to meet their obligations
of a 5% reduction in their 1990 levels of emissions.
Under Prototype carbon fund programme of the World Bank. Government of India has
approved a municipal solid waste energy project for implementation in Chennai, which
proposes to use the state of art technology for extracting energy from any solid wasteirrespective of the energy content. Many industrial organisations in the private sector have also
sought assistance under this fund.

8/2/2019 1.9 Global Environmental Concerns
http://slidepdf.com/reader/full/19-global-environmental-concerns 17/18
9.8 Sustainable Development
9.8.1 What is Sustainable Development?
Sustainable development is often defined as 'development that meets the needs of the present,
without compromising the ability of futuregenerations to meet their own needs'.
Sustainable development encompasses three basic and inter-related objectives:
• Economic security and prosperity
• Social development and advancement
• Environmental sustainability
Figure 9.8 Sustainable Development
Sustainable development demands that we seek ways of living, working and being that enable
all people of the world to lead healthy, fulfilling, and economically secure lives without
destroying the environment and without endangering the future welfare of people and the
planet.
Sustainable development as applied to energy and environment should consider thefollowing:
• inputs - such as fuels and energy sources, land and raw materials - are non-renewable
they should be used up only as far as they can be substituted in future
• where they are renewable they should be used up at a rate within which they can berenewed,
• outputs - in production and consumption - should not overstrain ecosystems or theassimilation capacity of the ecosphere.

8/2/2019 1.9 Global Environmental Concerns
http://slidepdf.com/reader/full/19-global-environmental-concerns 18/18
QUESTIONS
1 Name and explain three effects of ozone layer depletion.
2 Explain ozone layer depletion problem?
3 Ozone is formed by combination of a) three oxygen atoms b) one oxygen atom
c) four ozone atom d) five ozone atom.
4 Name at least three chemicals responsible for ozone depletion?
5 Name at least three greenhouse gases responsible for global warming?
6 Explain impacts of climatic change on earth?
7 What is the main role of UNFCCC?
8 What do you understand by term “COP” and explain its role?
9 What is Kyoto protocol, and what are its implications for developed and
developing countries?
10 Explain CDM and its objectives.
11 What are the uses of prototype carbon fund?
12 Explain the concept of sustainable development.
REFERENCES:
1. Cleaner Production – Energy Efficiency Manual for GERIAP, UNEP, Bangkok prepared by National Productivity Council
2. Training material on ‘Environmental concerns’ prepared by National Productivity
Council
3. Parivesh, October 2002 – Central Pollution Control Board
www.epa.orgwww.uneptie.orgwww.cpcb.nic.inwww.wri.org www.safecli m ate.netwww.globalwar m i ng.org