19% 11% 4% 49% vein PTFE artery. Experimental Characterization of Transitional Unsteady Flow Inside...
68
19% 11% 4% 49% vein PTFE artery
-
date post
19-Dec-2015 -
Category
Documents
-
view
218 -
download
0
Transcript of 19% 11% 4% 49% vein PTFE artery. Experimental Characterization of Transitional Unsteady Flow Inside...

19%
11%4%
49%
vein
PTFE
artery

Experimental Characterization of Transitional Unsteady Flow Inside a Graft-to-Vein Junction
Nurullah Arslan
Mechanical Engineering DepartmentThe University of Illinois at Chicago

Argon-Ion laser750mW Downstream tank
Upstream Tank
Test section
LDA probe Radiator Heater
PumpBall valve
90%
10%
Ball valve

Graft
PVSDVS
Color Doppler Ultrasound
QMAX 2.5 l/min
QMEAN 1.5 l/min
QMIN 1 l/min
10%

Graft
PVSDVS
Color Doppler Ultrasound
QMAX 2.5 l/min
QMEAN 1.5 l/min
QMIN 1 l/min
10%
AV Graft Image Taken by Color Duplex Ultrasound

Schmidt et al., Vascular Access for Hemodialysis, 1985
Arterio-Venous (A-V) GraftsHemodialysis Patients

PTFE Graft just after Implantation(Reference: Access Surgery, 1982)

Hemodynamics low and oscillating WSS
Arterial Bypass Graft Failure
Tissue growthThickening of the vessel wall
Intimal Hyperplasia
Stenosis (narrowing of the vessel)
FailureBlockage stops blood flow
Thrombosis (blood clot)

Arterial PTFE Graft Model(Loth et al.)
Similar Geometry but different flow conditions
Re=222

IH Distribution for Arterial Grafts

LDA Results for Arterial Graft

Results Under Arterial Flow ConditionsRemean=222 (Loth et al.)
Summary:
1) No Turbulence
2) No separation was observed
3) Flow was complex with strong secondary flow patterns
4) Pulsatility affected the flow field greatly (velocity profiles were more blunt)
5) WSS values were generally low in the anastomosis

Hemodynamics Turbulence & WSS
Events Leading to AV Graft Failure
Energy Transfer to the wallTissue Vibration
Enthothelial Cell Damage
Tissue growthThickening of the vessel wall
Intimal Hyperplasia
Stenosis (narrowing of the vessel)
Increased turbulencePlatelet activation
FailureBlockage stops blood flow
Thrombosis (blood clot)

DVS
Floor
PVS
A-V GraftHood
Heel(Apex)
Toe
+x/D0-x/D
Graft to Vein Junction

Fillinger et al., Hemodynamics and Intimal Hyperplasia, 1991
Canine AV Graft Study
(A) 3-D schematic representation of perianastomotic tissue vibration. (B) Schematic representations of longitudinal(C) Transverse views of perianastomotic tissue vibration

Stenosis Location inside the A-V graft
Re10-3
Thickness (mm)

Fillinger Concluded
1) Tissue vibration
2) Reynolds Number
intimal hyperplasia at the venous anastomosis
(2D) 29 Apr 1998
-6.4 -3.2 0 3.2
(2D) 29 Apr 1998

Other AV Graft Model Studies(No turbulent measurements)
Velocity measurements and WSS estimation (Shu et al.)
Velocity patterns by flow visualization (Krueger et al. )
Flow patterns using flow visualization (Bakran et al.)

Turbulence StudiesTurbulence measurements in
constricted tubes (Deshpande et al., 1980, Jones et al., 1985, Kehoe et al., 1990)
High Reynolds stresses may cause red blood cell damage and platelet activation (Sutera, S.P. and Mehrjardi, M.H., 1975)
Stenosis

Objective
To determine the distribution of turbulence and Reynolds stresses
within the an AV graft using in vitro modeling techniques

Summary of In Vivo Measurements
Patient I Patient IIGraft Diameter(mm) 6 6.7 Umax(m/s) 1.5 1.2 Umin(m/s) 1 0.8Remax 2700 2400Remin 1800 1600Qmax(ml/min) 2544 2525Qmin(ml/min) 1696 1683Womersley number() 4.8 5.3
Re = VD/, Q = VA, A = R2
= R(2 f/µ)1/2
µ=3.5 mPa/s, =1.05 g/cm3

Methods

In Vitro MeasurementsBifurcation plane and plane
Flow Division: DVS:Graft = 10:90
Steady Flow
Re = 1060, 1820, 2530, 2720
umean, vmean, urms, vrms, u´v ´
Pulsatile Flow
Repeak= 2470, Remean= 1762
uens, vens, urms, vrms, u´v´ as ƒ(t)

(2D) 23 Oct 1998
-6 -5.2 -4.4 -3.6 -2.8 -2 -1.2 -0.4 0.4 1.2 2 2.8 3.6
x x xx
xx
x
x x x x x x x x x x x x x
-6.6
x
y
z
(2D) 23 Oct 1998
Measurement Locations in A-V Graftx indicates measurements lines perpendicular to the plane of bifurcation

0
0.1
0.2
0.3
0.4
0.5
0.6
0.7
0.8
0.9
1
-1 -0.5 0 0.5 1
Radial position (r/R)
No
nd
ime
nsi
on
al v
elo
city
(u
/Um
ax)
LDA measurements
Theoretical Parabolicprofile
0
0.1
0.2
0.3
0.4
0.5
0.6
0.7
0.8
0.9
1
-1 -0.5 0 0.5 1
Radial Position (r/R)
Non
dim
ensi
onal
vel
ocity
(u/U
max
)
LDA measurements
Theoretical Parabolicprofile
GRAFT inlet DVS
Velocity Profiles at Graft Inlet and DVSRe=1060

0
0.1
0.2
0.3
0.4
0.5
0.6
0.7
0.8
0.9
1
-1 -0.5 0 0.5 1
Radial Position (r/R)
No
nd
ime
nsi
on
al v
elo
city
(U
/Um
ax)
LDA Measurements
Theoretical Parabolic profile
0
0.1
0.2
0.3
0.4
0.5
0.6
0.7
0.8
0.9
1
-1 -0.5 0 0.5 1
Radial Position (r/R)
Non
dim
ensi
onal
vel
ocity
(U/U
max
)
LDA Measurements
Theoretical Parabolicprofile
GRAFT inlet DVS
Velocity Profiles at Graft Inlet and DVSRe=2530

Flow rates in Graft and DVS
0
500
1000
1500
2000
0 60 120 180 240 300 360
Phase Angle (degrees)
Flo
w R
ate
(ml/m
in)
Flow rate, Graft
Flow rate, DVS
In Vitro Flow Wave Form at Graft inlet and DVS (Graft:DVS = 85:15)

Velocity Profiles at Systolic Acceleration and Peak
-1 -0.5 0 0.5 1
r/R
U/U
max
Theory
LDA measurments Phase Angle=30)
-1 -0.5 0 0.5 1
r/R
U/U
max
Theory
LDA measurements Phase Angle=60)

Velocity Profiles at Systolic Deceleration and Diastole
-1 -0.5 0 0.5 1
r/R
U/U
max
Theory
LDA measurements Phase Angle=120)
-1 -0.5 0 0.5 1
r/R
U/U
max
Theory
LDA measurements Phase Angle=300)

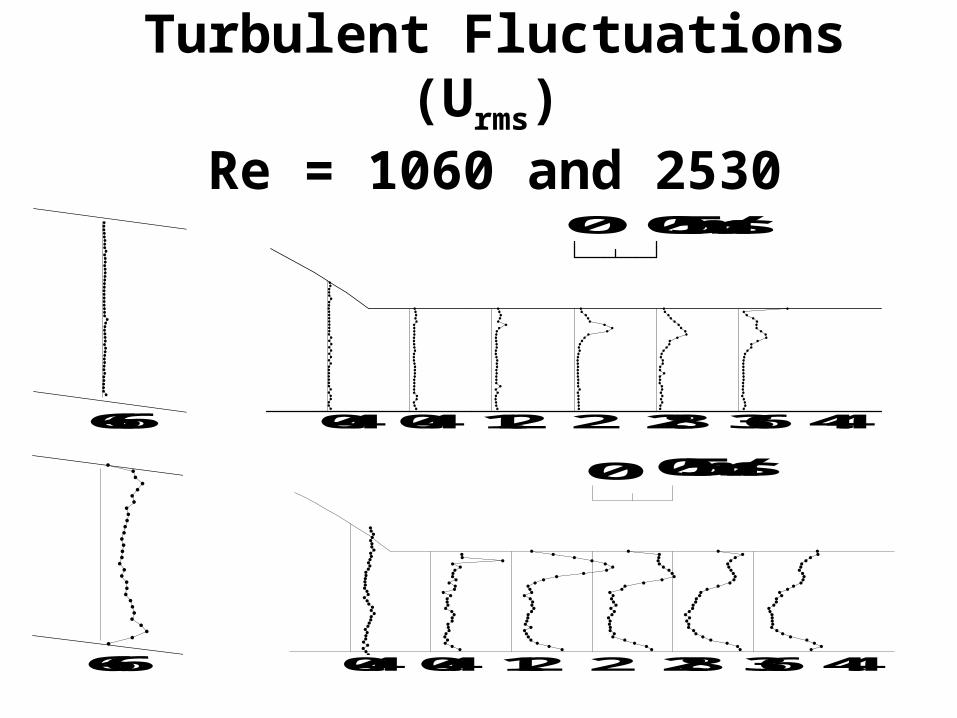
Results Under AV Flow Conditions
1) Separation
2) Turbulence
3) Secondary Flow
4) Pulsatility
5) WSS

Midplane Velocity Vectors Re = 1060
-6.8-6-5.2-4.4-3.6-2.8-2-1.2-0.40.41.222.83.64.4
02m/s
(a)
-6.8-6-5.2-4.4-3.6-2.8-2-1.2-0.40.41.222.83.64.4
00.5m/s
(b)
-6.8-6-5.2-4.4-3.6-2.8-2-1.2-0.40.41.222.83.64.4
00.5m/s
(c)
-6.8-6-5.2-4.4-3.6-2.8-2-1.2-0.40.41.222.83.64.4
0500dynes/cm2
(d)

Midplane Velocity Vectors Re = 1060 and 2530
-6.6
-6.6
-6.6
-6.6 -0.40.4 1.2 2 2.8 3.6 4.4
0 0.5m/s
(b)
-0.4 0.4 1.2 2 2.8 3.6 4.4
0500dynes/cm2
(d)
-0.40.4 1.2 2 2.8 3.6 4.4
0 5m/s
(a)
-0.40.4 1.2 2 2.8 3.6 4.4
00.5m/s
(c)
-6.6
-6.6
-6.6
-6.6
-0.40.4 1.2 2 2.8 3.6 4.4
0 5m/s
(a)
-0.40.4 1.2 2 2.8 3.6 4.4
00.5m/s
(b)
-0.40.4 1.2 2 2.8 3.6 4.4
00.5m/s
(c)
-0.40.4 1.2 2 2.8 3.6 4.4
03000dynes/cm2
(d)

Separation Bubble
~0.1 Dv
(2D) 31 Oct 1998 (2D) 31 Oct 1998
PVS
Toe <1.0 Dv

-6 .6
-6 .6 -1 .2 -0 .4 0 .4 1 .2 2 2 .8 3 .6 4.4
0 4 m/s
(a)
-1 .2 -0 .4 0 .4 1 .2 2 2 .8 3 .6 4 .4
0 0 .5 m/s
(b)
Mean Velocity in the Plane to the Bifurcation PlaneRe=1060 and 2530
-6.6
-6.6
-6.6
-6.6 -1.2 -0.4 0.4 1.2 2 2.8 3.6 4.4
0 4m/s
(a)
-1.2 -0.4 0.4 1.2 2 2.8 3.6 4.4
0 0.5m/s
(b)
-1.2 -0.4 0.4 1.2 2 2.8 3.6 4.4
0 0.5m/s
(c)
-1.2 -0.4 0.4 1.2 2 2.8 3.6 4.4
0 500dynes/cm2
(d)

Results Under AV Flow Conditions
1) Separationsmall region near the toe creating a low WSS region
2) Turbulence (Urms, Vrms, and RS)
3) Secondary Flow
4) Pulsatility
5) WSS

Turbulent Fluctuations (Urms) Re = 1060
-6.8-6-5.2-4.4-3.6-2.8-2-1.2-0.40.41.222.83.64.4
02m/s
(a)
-6.8-6-5.2-4.4-3.6-2.8-2-1.2-0.40.41.222.83.64.4
00.5m/s
(b)
-6.8-6-5.2-4.4-3.6-2.8-2-1.2-0.40.41.222.83.64.4
00.5m/s
(c)
-6.8-6-5.2-4.4-3.6-2.8-2-1.2-0.40.41.222.83.64.4
0500dynes/cm2
(d)
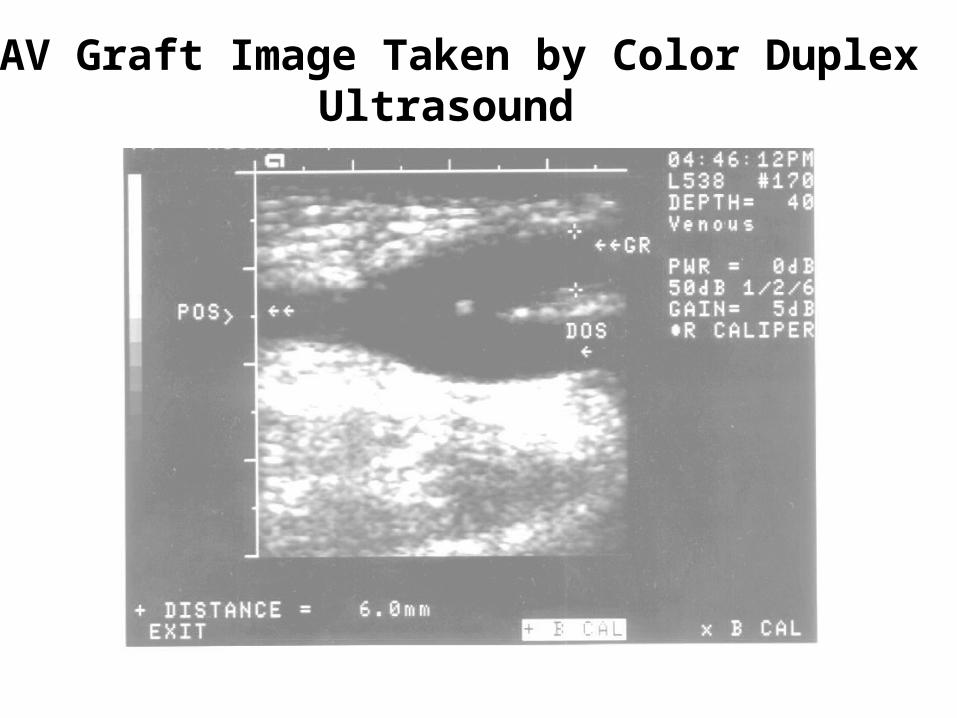
Turbulent Fluctuations (Urms)
Re = 1060 and 2530
-6.6
-6.6
-6.6
-6.6 -0.40.4 1.2 2 2.8 3.6 4.4
00.5m/s
(b)
-0.40.4 1.2 2 2.8 3.6 4.4
0500dynes/cm2
(d)
-0.40.4 1.2 2 2.8 3.64.4
0 5m/s
(a)
-0.40.41.2 2 2.83.64.4
00.5m/s
(c)
-6.6
-6.6
-6.6
-6.6
-0.40.4 1.2 2 2.8 3.6 4.4
0 5m/s
(a)
-0.4 0.4 1.2 2 2.8 3.6 4.4
00.5m/s
(b)
-0.40.4 1.2 2 2.8 3.6 4.4
00.5m/s
(c)
-0.4 0.4 1.2 2 2.8 3.6 4.4
03000dynes/cm2
(d)

-6 .6
-6 .6
-1 .2 -0 .4 0 .4 1 .2 2 2 .8 3 .6 4 .4
0 0 .5 m/s
(b)
-1 .2 -0 .4 0 .4 1.2 2 2 .8 3 .6 4 .4
0 0 .5 m/s
(c)
Urms at the Perpendicular Plane Re=1060 and 2530
-6.6
-6.6
-6.6
-6.6 -1.2-0.4 0.4 1.2 2 2.8 3.6 4.4
0 4m/s
(a)
-1.2 -0.4 0.4 1.2 2 2.8 3.6 4.4
0 0.5m/s
(b)
-1.2 -0.4 0.4 1.2 2 2.8 3.6 4.4
0 0.5m/s
(c)
-1.2 -0.4 0.4 1.2 2 2.8 3.6 4.4
0 500dynes/cm2
(d)

Turbulent Fluctuations (Vrms)
Re = 1060 and 2530
-6.6
-6.6
-6.6
-6.6 -0.4 0.4 1.2 2 2.8 3.6 4.4
0 0.5m/s
(b)
-0.4 0.4 1.2 2 2.8 3.6 4.4
0 500dynes/cm2
(d)
-0.4 0.4 1.2 2 2.8 3.6 4.4
0 5m/s
(a)
-0.4 0.4 1.2 2 2.8 3.6 4.4
0 0.5m/s
(c)
-6.6
-6.6
-6.6
-6.6
-0.4 0.4 1.2 2 2.8 3.6 4.4
0 5m/s
(a)
-0.4 0.4 1.2 2 2.8 3.6 4.4
00.5m/s
(b)
-0.4 0.4 1.2 2 2.8 3.6 4.4
0 0.5m/s
(c)
-0.4 0.4 1.2 2 2.8 3.6 4.4
0 3000dynes/cm2
(d)

-6 .6
-6 .6 -1 .2 -0 .4 0 .4 1 .2 2 2.8 3 .6 4 .4
0 500 dynes/cm2
(d)
-1 .2 -0 .4 0 .4 1 .2 2 2 .8 3 .6 4 .4
0 0.5 m/s
(c)
Vrms at the Perpendicular Plane Re=1060 and 2530
-6.6
-6.6
-6.6
-6.6 -1.2 -0.4 0.4 1.2 2 2.8 3.6 4.4
0 4m/s
(a)
-1.2 -0.4 0.4 1.2 2 2.8 3.6 4.4
0 0.5m/s
(b)
-1.2 -0.4 0.4 1.2 2 2.8 3.6 4.4
0 0.5m/s
(c)
-1.2 -0.4 0.4 1.2 2 2.8 3.6 4.4
0 500dynes/cm2
(d)

Reynolds Stress( ) Re = 1060 and 2530
'v'u-6.6
-6.6
-6.6
-6.6 -0.4 0.4 1.2 2 2.8 3.6 4.4
0 0.5m/s
(b)
-0.4 0.4 1.2 2 2.8 3.6 4.4
0500dynes/cm2
(d)
-0.4 0.4 1.2 2 2.8 3.6 4.4
0 5m/s
(a)
-0.40.4 1.2 2 2.8 3.6 4.4
0 0.5m/s
(c)
-6.6
-6.6
-6.6
-6.6
-0.4 0.4 1.2 2 2.8 3.6 4.4
0 5m/s
(a)
-0.4 0.4 1.2 2 2.8 3.6 4.4
00.5m/s
(b)
-0.4 0.4 1.2 2 2.8 3.6 4.4
0 0.5m/s
(c)
-0.4 0.4 1.2 2 2.8 3.6 4.4
03000dynes/cm2
(d)

-6 .6 -1 .2 -0 .4 0 .4 1 .2 2 2.8 3 .6 4 .4
0 500 dynes/cm2
(d)
Reynolds Stress( ) at the Perpendicular Plane
Re = 1060 and 2530
-6.6
-6.6
-6.6
-6.6 -1.2 -0.4 0.4 1.2 2 2.8 3.6 4.4
0 4m/s
(a)
-1.2 -0.4 0.4 1.2 2 2.8 3.6 4.4
0 0.5m/s
(b)
-1.2 -0.4 0.4 1.2 2 2.8 3.6 4.4
0 0.5m/s
(c)
-1.2 -0.4 0.4 1.2 2 2.8 3.6 4.4
0 500dynes/cm2
(d)
'v'u
Results Under AV Flow Conditions
1) Separationsmall region near the toe creating a low WSS region
2) Turbulencehigh Urms,Vrms, RS at these Re #s and localized near the toe
3) Secondary Flow
4) Pulsatility
5) WSS

Secondary Flow Field Inside AV Graft

(2D) 05Aug1998
n66 n52 n44 n36 n28 n20
n12 n04 p04 p12 p20 p28 p36
(2D) 05Aug1998
Re=1060
V component of the Velocity, Perpendicular to Bifurcation

Results Under AV Flow Conditions
1) Separationsmall region near the toe creating a low WSS region
2) Turbulencehigh Urms,Vrms, RS at these Re #s and localized near the toe
3) Secondary Flowstrong and complicated
4) Pulsatility
5) WSS

(2D)21Aug1998
-6.8-6-5.2-4.4-3.6-2.8-2-1.2-0.40.41.222.83.64.4
05m/s
(2D)21Aug1998
Systolic Peak
Diastole
(2D)21Aug1998
-6.8-6-5.2-4.4-3.6-2.8-2-1.2-0.40.41.222.83.64.4
05m/s
(2D)21Aug1998
Velocity Profiles at Systolic Peak and DiastoleFlow rates in Graft and DVS
0
500
1000
1500
2000
0 60 120 180 240 300 360
Phase Angle (degrees)
Flo
w R
ate
(ml/m
in)
Flow rate, Graft
Flow rate, DVS
Flow rates in Graft and DVS
0
500
1000
1500
2000
0 60 120 180 240 300 360
Phase Angle (degrees)
Flo
w R
ate
(ml/m
in)
Flow rate, Graft
Flow rate, DVS

Turbulent Fluctuations (Urms)
Phase Angles 60 and 300
(2D)21Aug1998
-6.8-6-5.2-4.4-3.6-2.8-2-1.2-0.40.41.2 2 2.83.64.4
00.5m/s
(2D)21Aug1998
(2D)21Aug1998
-6.8-6-5.2-4.4-3.6-2.8-2-1.2-0.40.41.2 2 2.83.64.4
00.5m/s
(2D)21Aug1998
Flow rates in Graft and DVS
0
500
1000
1500
2000
0 60 120 180 240 300 360
Phase Angle (degrees)
Flo
w R
ate
(ml/m
in)
Flow rate, Graft
Flow rate, DVS
Flow rates in Graft and DVS
0
500
1000
1500
2000
0 60 120 180 240 300 360
Phase Angle (degrees)
Flo
w R
ate
(ml/m
in)
Flow rate, Graft
Flow rate, DVS

Turbulence Intensity for Pulsatile FlowRepeak = 2470 x/D=+1.2
0
0.1
0.2
0.3
0.4
0.5
0.6
0.7
0 10 20 30
Location (mm)
Urm
s (
m/s
)
Systolic AccelarationSystolic PeakSystolic DecelarationDiastoleSteady, Re=1820Steady, Re=2530
Toe side Floor side

-0.5
0
0.5
1
1.5
2
0 5 10 15 20 25 30
Location (mm)
Rey
no
lds
stre
ss *
(0.0
01)
dyn
es/c
m2
Systolic AccelarationSystolic Peak
Systolic DecelarationDiastole
Steady, Re=1820Steady, Re=2530
Reynolds Stress for Pulsatile FlowRepeak = 2470 x/D=+1.2
Toe side Floor side

Animation

Results Under AV Flow Conditions
1) Separationsmall region near the toe creating a low WSS region
2) Turbulencehigh Urms,Vrms, RS at these Re #s and localized near the toe
3) Secondary Flowstrong and complicated
4) Pulsatilitysimilar to steady flow results in general with slightly lower turbulence levels
5) WSS

WSS in the Present Study and Low Re# Study (Loth 1993)
(2D)21Oct1998
50
9 247
EstimationofWSS(dynes/cm2)insidethecurrentstudy
(2D)21Oct1998

Results Under AV Flow Conditions1) Separation
small region near the toe creating a low WSS region
2) Turbulencehigh Urms,Vrms, RS at these Re #s and localized near the toe
3) Secondary Flowstrong and complicated
4) Pulsatilitysimilar to steady flow results in general with slightly lower turbulence levels
5) WSSgenerally high in graft and PVS

Discussion

-6.6 -0.4 0.4 1.2 2 2.8 3.6 4.4
0 0.5m/s
-6.6 -0.4 0.4 1.2 2 2.8 3.6 4.4
0 3000dynes/cm2
-6.6 -0.4 0.4 1.2 2 2.8 3.6 4.4
0 0.5m/s
Separation Regions
(2D)21Aug1998
-6.8-6-5.2-4.4-3.6-2.8-2-1.2-0.40.41.222.83.64.4
05m/s
(2D)21Aug1998
(2D)21Aug1998
-6.8-6-5.2-4.4-3.6-2.8-2-1.2-0.40.41.222.83.64.4
05m/s
(2D)21Aug1998
Phase=300
Phase=60
Shu et al., 1987 Present Study

0
0.1
0.2
0.3
0.4
0.5
0.6
0.7
0.8
0.9
1
-1 -0.5 0 0.5 1
Radial Position (r/R)
No
nd
ime
nsi
on
al v
elo
city
(U
/Um
ax)
LDA measurements
Theoretical Parabolicprofile
Mean Velocity Profiles at Graft Inlet and Upstream of a Constricted Tube
Deshpande(1980)Present study

0
0.02
0.04
0.06
0.08
0.1
0.12
0.14
0.16
-1 -0.5 0 0.5 1
Urms/Umax
Turbulent Measurements in a Straight TubeU
rms/
Uc
Urm
s/U
c
r/Rr/R

Conclusions Reynolds stress can be high between 1000-2000
dynes/cm2
Turbulent intensity can be high 10-20% Both are focal in our model at the toe inside PVS Secondary flow are significantly altered due to Re number
(as I described before) Pulsatility does not have a dramatic effect due to large
steady component in our mode Pulsatility reduces Urms by greater amount 30% Urms and
15% RS Less turbulent under pulsatile flow Low WSS present, however focal at the toe

FUTURE STUDIES
Clinical Studies
Different models (geometry, elastic, Q)
Vibration experiments (coherent structures)
WSS calculations
Cellular studies (mechanistic approach)
VenafloVenaflo

Nomenclature-AV Loop Graft
ArterialAnastomosis
PTFE Graft(Polytetrafluoroethylene)
VenousAnastomosis
PVS(Proximal vein Segment)
DVS(Distal vein Segment)

+v’
U(y)
+v´
-v´
y
x
Reynolds Stress(u´v´)BL Theory, Schlichting,
7th Ed., page 560
Fluid particles with v´ > 0 arrive at a layer from a region where a smaller u prevails which gives rise to a u´ > 0
Hence u´v´ < 0

Main frame
Slygard model
Shaker
Schematic for the Vibration Experiments(Top view)
Function generator
Power amplifier

No Shaker
0
0.01
0.02
0.03
0 20 40 60 80 100 120
Frequency (Hz)
Power Spectrum
Power spectrum(40Hz)
0
0.01
0.02
0.03
0 20 40 60 80 100 120
Frequency (Hz)
Power Spectrum
Power spectrum(20Hz)
0
0.01
0.02
0.03
0.04
0.05
0.06
0.07
0.08
0 20 40 60 80 100 120
Frequency (Hz)
Power Spectrum
Velocity Power Spectra1.2 D from toe, 0.16 D from wall

(2D)31Aug1998
-6.8 -6 -5.2 -4.4 -3.6 -2.8 -2 -1.2 -0.4 0.4 1.2
0 0.7m/s
(2D)31Aug1998
Mean Velocities at the Plane Perpendicular to Midplane (0.8D from hood and 0.5D from floor
Re = 1060)
-6.6
-6.6
-6.6
-6.6 -1.2 -0.4 0.4 1.2 2 2.8 3.6 4.4
0 4m/s
(a)
-1.2 -0.4 0.4 1.2 2 2.8 3.6 4.4
0 0.5m/s
(b)
-1.2 -0.4 0.4 1.2 2 2.8 3.6 4.4
0 0.5m/s
(c)
-1.2 -0.4 0.4 1.2 2 2.8 3.6 4.4
0 500dynes/cm2
(d)

Turbulent fluctuation (Vrms)
Re = 1060
-6.8-6-5.2-4.4-3.6-2.8-2-1.2-0.40.41.222.83.64.4
02m/s
(a)
-6.8-6-5.2-4.4-3.6-2.8-2-1.2-0.40.41.222.83.64.4
00.5m/s
(b)
-6.8-6-5.2-4.4-3.6-2.8-2-1.2-0.40.41.222.83.64.4
00.5m/s
(c)
-6.8-6-5.2-4.4-3.6-2.8-2-1.2-0.40.41.222.83.64.4
0500dynes/cm2
(d)

Reynolds Stress( ) Re = 1060'v'u
-6.8-6-5.2-4.4-3.6-2.8-2-1.2-0.40.41.222.83.64.4
02m/s
(a)
-6.8-6-5.2-4.4-3.6-2.8-2-1.2-0.40.41.222.83.64.4
00.5m/s
(b)
-6.8-6-5.2-4.4-3.6-2.8-2-1.2-0.40.41.222.83.64.4
00.5m/s
(c)
-6.8-6-5.2-4.4-3.6-2.8-2-1.2-0.40.41.222.83.64.4
0500dynes/cm2
(d)