18th National Award for “Excellence in Energy Management...
42
18 th National Award for “Excellence in Energy Management – 2017” ICICI Bank Gachibowli, Hyderabad August 30 & 31, 2017
Transcript of 18th National Award for “Excellence in Energy Management...

18th National Award for “Excellence in
Energy Management – 2017”
ICICI Bank Gachibowli, Hyderabad
August 30 & 31, 2017

Profile1
EnCon Management2
Innovation Projects3
Renewable Energy4
Environment Projects5
Agenda

Profile
Global presence in 19 countries
Branch Banking 4850 branches &
13,882 ATMs
24/7 Customer Care 23 Skill Academy’s 72,391 Trained

Awards & Recognitions
CII : 2016 Excellence in Energy
Management
CII : 2015 Excellence in Energy
Management
IGBC Gold Rating (C & S)
CII Southern Region : 4 Star
Environment, Health & Safety
8 Accredited Professionals Certified
from IGBC

ICICI Bank
Gachibowli
3,71,747 sqm, built up area (77 mts
height)
Single floor plate of
13,950 sqm(21 floors)
14.4 mtrLong
Escalator
22000 WS & 230 Guest
rooms
70 Elevators, 52
Escalators
750 & 200 Seat
Auditorium
Unique Features

Orientation
West100%
East100%
South100%

2014….Turning Point
Occupancy increased significantly
Design with actual performance measured
EPI…?
Opex cost higher…!!!

Service Partners, OEM’s & Employee inputs
Explored Options
Management Involvement
Target & Projects Identified
Budget Allocation
Execution & Monitoring
Baseline & Our Approach
Susta
inabili
ty

20
15 In-house
management Reviews & analysis
Waste elimination
Set points defined
Air balancing
Descaling of chillers
Close monitoring
Lighting transformer
20
16 Work station
realignment
Conversion CFL to LED
Duct modification
Optimization Lift
20
17 VFD’s
Cassette FCU
UPS optimization
Replacement of fills
Pump optimization
Transformer optimization
Y-o-Y Implementation (3 year road map)
25% improvement
over FY 14 in EPI
20% 1% 5%
Units saved over last year – 6.64 lac
kWh

?
FY-2014
EPI - 112
?!
FY-2015
EPI - 89
…
FY-2016
EPI - 88
FY-2017
EPI - 84
EPI (Normalized) Trends

SEC Global Best
190-165
165-140
140-115
115-90
< 90

Energy Trends
Apr May Jun Jul Aug Sep Oct Nov Dec Jan Feb Mar
FY 14 235 248 231 210 190 203 165 167 161 140 136 135
FY 15 177 172 182 154 151 149 149 132 128 123 122 117
FY 16 137 146 152 136 146 130 123 118 109 105 109 110
FY 17 126 129 131 112 117 114 113 109 104 103 104 103
80
100
120
140
160
180
200
220
240
260
kWh per Head Count
FY 14
FY 15
FY 16
FY 17

84 88 97 100 105 113 123 124 126 129 125 129 131 160 145 1930
50
100
150
200
EPI
Internal Benchmarking

Load Distribution
HVAC
49%
IT
25%
Lighting
11%
Utilities
15%

EnCon – Investment (No Funds)
UPS optimization – 2.97 lac per annum units saved
Pump optimization – 0.22 lac per annum units saved
Lift optimization – 0.17 lac per annum units saved
Employee awareness and ownership mapped to Energy Champions
Controls governed by performance level SLA
Total savings achieved: 3.36 lac kWh

UPS Optimization
South (OF1, OF2, OF3)
UPS 1
South (OF4, OF5, OF6)
UPS 2
Parking (Tech Rooms)
UPS 3
Stand by
UPS 4
North (OF1, OF2, OF3)
UPS 5
North (OF4, OF5, OF6)
UPS 6
South (OF1, OF2, OF3, OF4, OF5, OF6
UPS 1
Disconnected
UPS 2
Stand by
UPS 3 & 4 North (OF1,
OF2, OF3, OF4, OF5, OF6)
UPS 5
Disconnected
UPS 6
Capacity 600 kVA x 6
Savings achieved: 2.97 lac kWh
Before
After

EnCon Completed Projects

EnCon Completed Project Details
ActivityProjected (in lac
kWh)
Achieved (in lac
kWh)
Cassette units 4.84 3.32
Replacement of fills 0.67 0.85
Transformer optimization 0.85 0.80
LED 0.57 0.55
Pumps optimization 0.05 0.05
Standby time for
Escalators reductionPilot being explored at OEM
Synchronous belts Feasibility explored, found not viable
Total savings achieved: 5.57 lac kWh

Equipment Level Monitoring -
CAT Before
After
High power consumption
iKW/TR increased beyond
design
Scale formation in condenser
tubes
Abnormality in parameters
Tubes cleaning by descaling
activity
CAT reduced from 4.600 C to
0.300 C
iKW/TR decreased

Equipment Level Monitoring -
AHU
Command: 0%
Feedback : 6%

EnCon – Cassette Units
Investment: ₹ 32 lac
ROI: 16 months
Issue
• Consumption during non-peak hours
• 24X7 operating hours
• High operational cost
Solution
• Zone segregation
• Optimization of AHU’s operating hours
• Chilled water based cassette units
Benefit
• Annualized savings: 3.32 lac kWh
• Localized cooling met

Innovation Projects
I
I
I
A
TN
NN
O
O
V
INNOVATION

VFD Installation (1) – Pumps
Issue
• High power consumption (unit : 132 kWh)
• Multiple pumps
• High flow rate
Solution
• Single VFD installation
• Minimal modifications
Benefit
• Annualized savings : 2.93 lac kWh
• Desired flow rate met
• Optimized iKW/TR

Issue
• Fan running at constant speed for all climatic conditions
• High power consumption
• Water evaporation levels are high
Solution
• VFD installation
• Logic with delta T
Benefit
• Annualized savings: 1.14 lac kWh
VFD Installation (2) - Cooling Tower
Fans
Investment: ₹ 16.5 lac
ROI: 6 months

Issue
• High power consumption
• Noise level high
• Frequent maintenance
Solution
• Installation EC fans
Benefit
• Reduce consumption
• dB 70 to 60
• Annualized savings: 1.84 lac kWh
EC Blowers for AHUs
Investment: ₹ 23.79 lac
ROI: 16 months

Lean at Cafeteria
Queue-less Cashless Paperless
Just in time
Reduction in power consumption through
kitchen equipment optimization
Eliminate POS printers thus saving
power/paper
Employee is notified when the food is ready to
pickup (app based)

Best Practices – AHU Actuator Routine checks & calibrations
Monitoring command & feedback
Eliminate wastage of water flow
Reduction in chiller consumption

Best Practice Pump Optimization
(Hydro-pneumatic)
Aerator installation resulted in flow
reduction
Reduced cycle of pump operation
Power consumption 9360 units per
annum
4.5 lts per minute
1.5 lts per minute
B
e
f
o
r
eA
f
t
e
r
Investment: ₹ 0.84 lac
ROI: 8 months

Planned Projects

Issue
• Effective thermal exchange
• High power consumption
Solution
• Improves chiller efficiency
• Avoid deformation /damages & scale formation
Benefit
• Annualized savings : 1.20 lac kWh
Planned Project - I Automatic tube cleaning system for water cooled chiller
Investment: ₹ 8.10 lac
ROI: 12 months

Issue
• To schedule during weekly off & holidays
• High power consumption
Solution
• Reduction in power consumption
• Improves cooling efficiency
Benefit
• Annualized savings : 0.75 lac kWh
Planned Project - II DX units with dual coil for critical areas like EPABX &
Server room
Investment: ₹ 16 lac
ROI: 36 months

Team & Target
• Central Team
• Tower Team
• Procurement team
Plan & Budget• EnCon Planning
• Pre-sanctioned CAPEX Budget
Monitoring & Reporting
• Energy Usage and savings monitoring
• EPI reporting
Review & Correction
• Monthly review
• Corrective action
EnCon Management

Team Engagement
Escalator
maintenance works
Load test for
Lifts
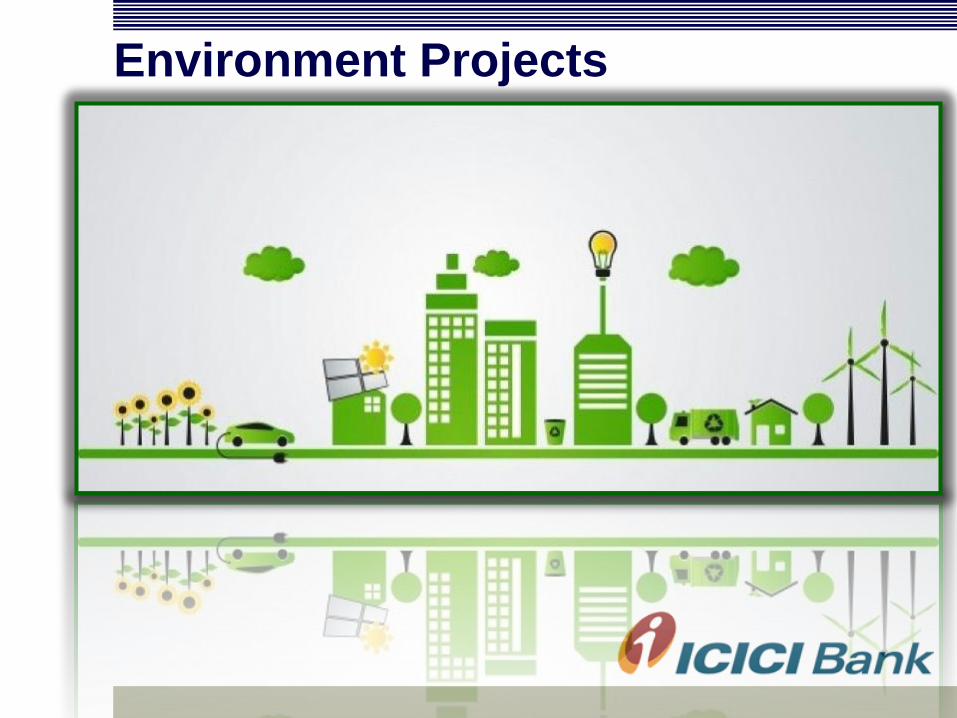
Environment Projects

Solar – Renewable Energy
49% power through
green
Units consumed
through solar – 67.60
lac in FY 17
5543 ton of CO2
emission avoided
Exploring solar roof top

Water Consumption
Average per capita per day: 32 ltrs
Zero Wastage
Zero Leakages
Awareness

Waste Management
Prevention
Reduce
Recycle
Recovery
Disposal
Least
Preferred
Most
Preferred
E-Waste only through
approved vendor
100% recycling -
STP
Reduce travel
Car pooling
Point pickups Paper &
Water
Paper less
Both sides print
Packing material

Organic Compost
200 kgs of food recycled per day
Food waste is converted to manure

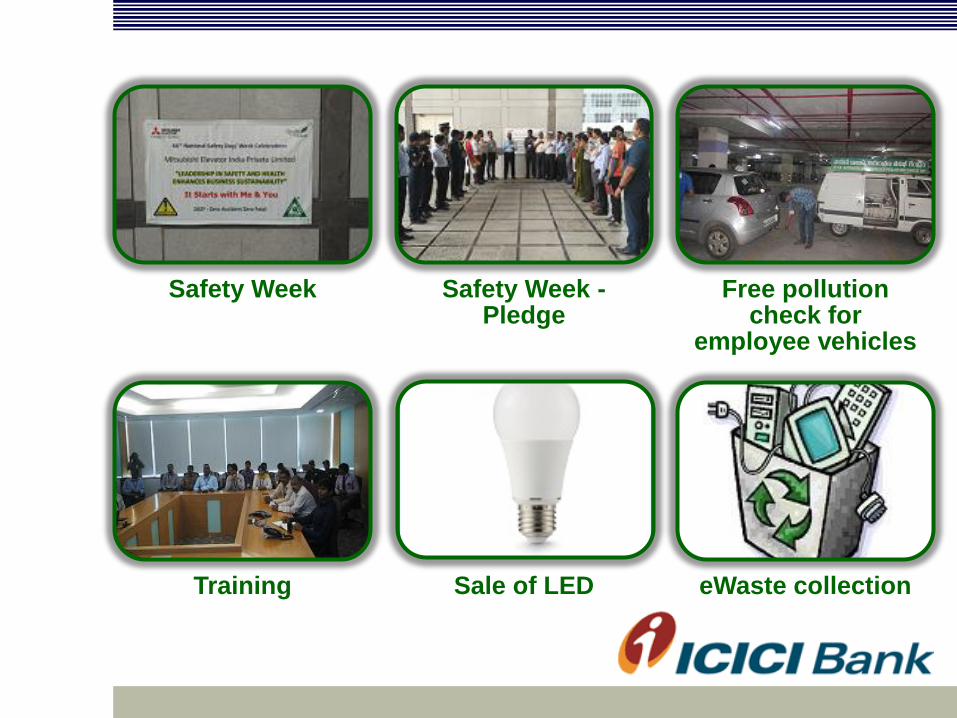
Safety Week Safety Week -Pledge
Free pollution check for
employee vehicles
Training Sale of LED eWaste collection

GHG Inventory & Certification
Internal Controls
Environment Projects
EnConProject
s

Be eco friendly and go green