18 September 20091 Health Plan Actuarial Value Variation Among Employers Actuarial Research...
39
18 September 2009 1 Health Plan Actuarial Value Variation Among Employers Actuarial Research Corporation Sarah Yi Jim Mays Middle Atlantic Actuarial Club 2009 Annual Meeting Session 6A
-
Upload
gwendolyn-maxwell -
Category
Documents
-
view
217 -
download
0
Transcript of 18 September 20091 Health Plan Actuarial Value Variation Among Employers Actuarial Research...
18 September 2009 1
Health Plan Actuarial Value Variation Among Employers
Actuarial Research CorporationSarah Yi
Jim Mays
Middle Atlantic Actuarial Club2009 Annual Meeting
Session 6A

18 September 2009 2
Outline of Presentation
• Background• EBSA Project• Data• Methodology• Results• Policy Applications• Questions and Comments

18 September 2009 3
Background

EBSA Project
• Research was funded by the Employee Benefits Security Administration (DoL/EBSA)
• The views and opinions contained in this report are solely those of the authors and do not necessarily reflect the official policy or position of the Department of Labor or the Employee Benefits Security Administration.
18 September 2009 4

18 September 2009 5
Background
• Context– Health finance reform design– Minimum coverage rules – Modification of tax exclusion

18 September 2009 6
Background
• Definition of Actuarial Value:the fraction of average recognized medical charges which a health plan would have paid, had it been covering a standardized population with standardized medical spending levels
• Actuarial Value is a single statistic that captures the effect of deductibles, copayments/coinsurance, and out-of-pocket maximums

18 September 2009 7
EBSA Project

18 September 2009 8
Research Questions/ Hypotheses
• How dispersed are employer-sponsored health insurance average actuarial values?
• To what degree does actuarial value predict plan cost?

18 September 2009 9
Goals
• Actuarial values for each health insurance plan in the NCS
• Percentile distributions of actuarial value• Summary distributions of plan costs within
actuarial value deciles

18 September 2009 10
Data

National Compensation Survey
• Produced by Bureau of Labor Statistics• Data not available for public use• Three stage survey design– Selection of areas– Selection of establishments (from private
industry)– Selection of occupations within establishments
• Plans remain in sample for 5 years
18 September 2009 11

18 September 2009 12
Uniqueness of NCS Data
• Definitive source for information on ESI parameters
• Well-established process• Detailed specifications• Large sample• More reliable than other datasets

18 September 2009 13
Use of NCS Data: Overview
• Plan provisions• Premiums• Plan characteristics• Worker characteristics• Establishment characteristics

18 September 2009 14
Use of NCS Data: Plan Provisions
• From Summary Plan Description documents abstracted by BLS analysts
• Consistent with National Compensation Survey: Employee Benefits in Private Industry in the United States, 2005
18 September 2009 15
Use of NCS Data: Plan Provisions
• Covered services (inpatient hospital, outpatient hospital, physician visits, mental health, prescription drugs)
• Cost-sharing parameters– Deductibles– Copayments– Coinsurance– Out-of-pocket maximums– Presence of benefit maximums
18 September 2009 16
Use of NCS Data: Premiums
• Collected in person or on phone by field economists
• Potential mismatch in plan types (medical, prescription, dental, vision) between provision and premium data
18 September 2009 17
Use of NCS Data: Premiums
• Premiums– Total premiums– Employer premiums– Employee premiums
18 September 2009 18
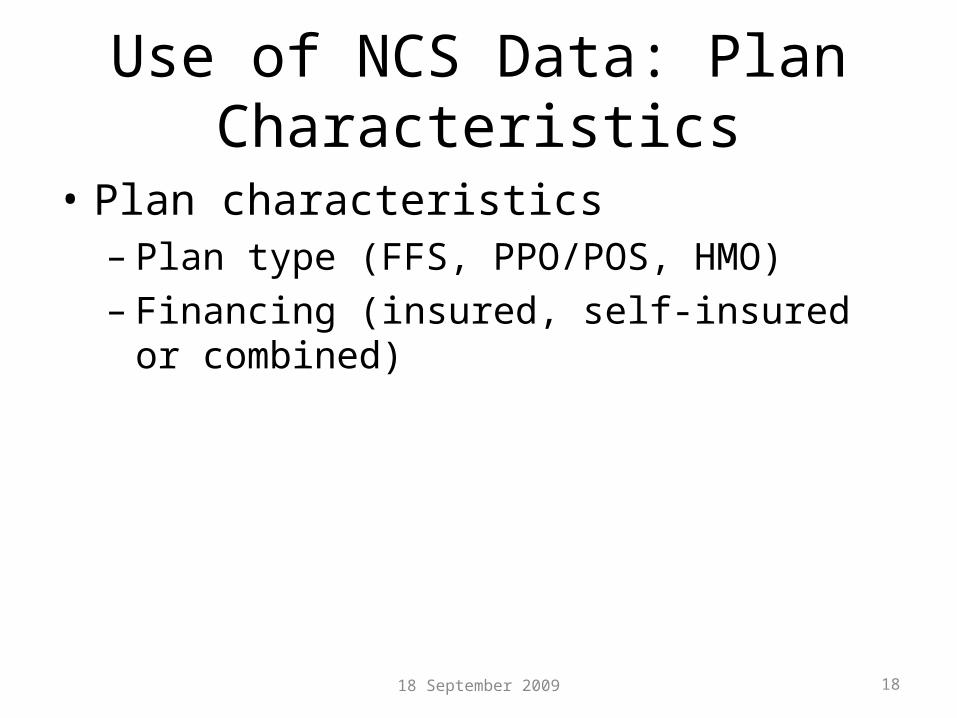
Use of NCS Data: Plan Characteristics
• Plan characteristics– Plan type (FFS, PPO/POS, HMO) – Financing (insured, self-insured or combined)
18 September 2009 19
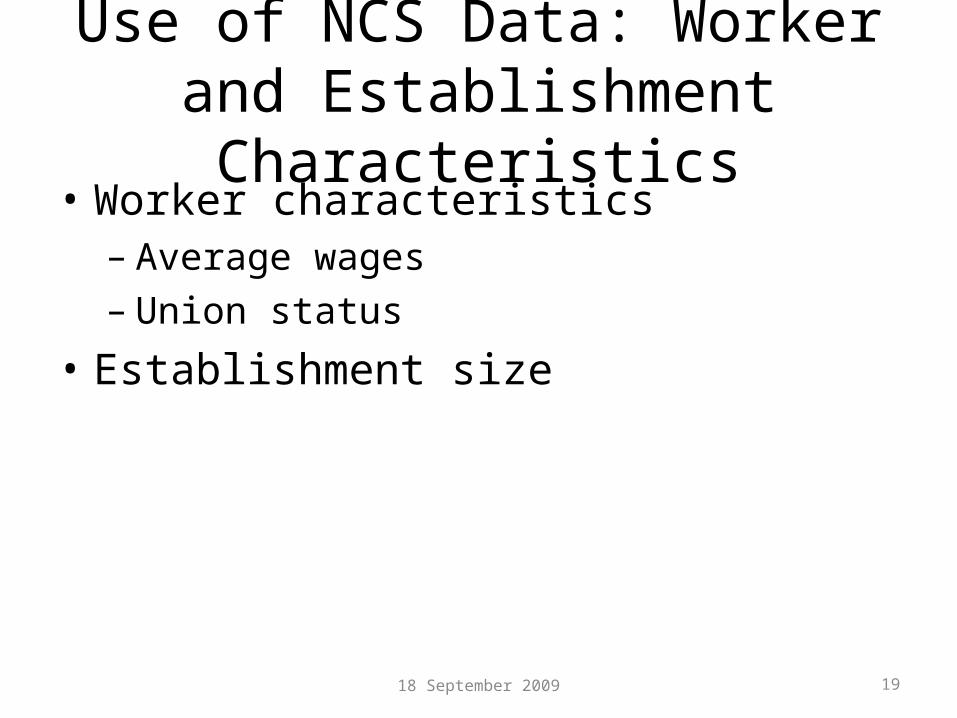
Use of NCS Data: Worker and Establishment Characteristics
• Worker characteristics– Average wages– Union status
• Establishment size

18 September 2009 20
Use of NCS Data
• Kept plans with medical and drug provisions• Kept plans with a known plan type

18 September 2009 21
Methodology

18 September 2009 22
Methodology
• Run a claims payment program on each plan to calculate actuarial value
• Sort plans into deciles of actuarial value• Sort plans into deciles of premium• Make two-way tables
18 September 2009 23
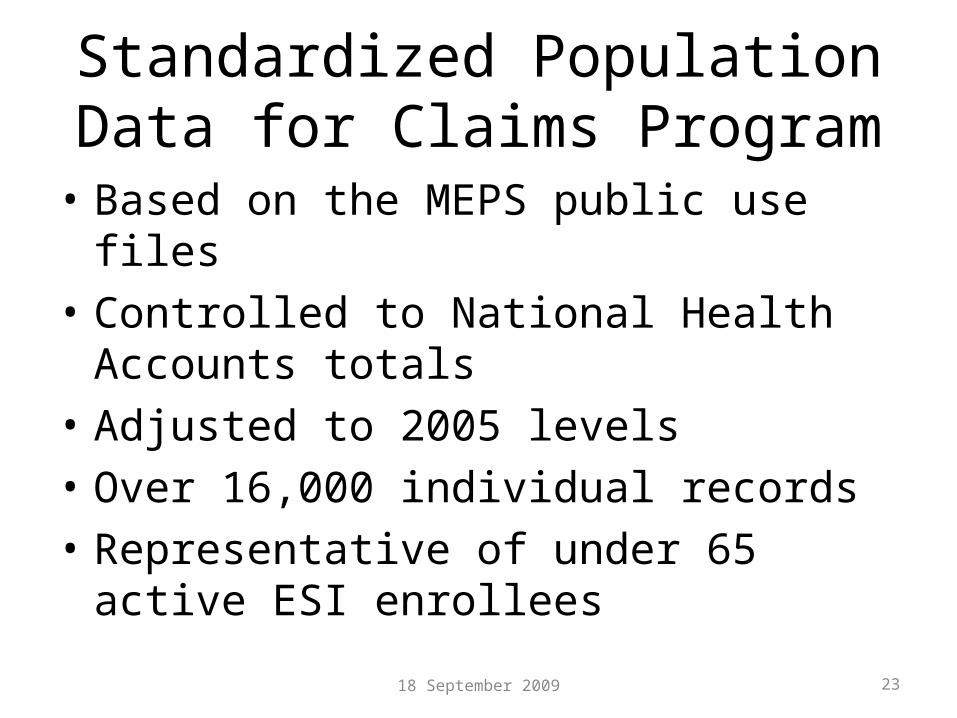
Standardized Population Data for Claims Program
• Based on the MEPS public use files• Controlled to National Health Accounts totals• Adjusted to 2005 levels• Over 16,000 individual records• Representative of under 65 active ESI
enrollees

18 September 2009 24
Simplified Cost-Sharing Provisions for Plan A
• $20 copay for each physician visit• $450 deductible for each hospital
confinement

18 September 2009 25
Person 1’s Utilization and Covered Charges
• Total covered charges = $5,000
• Physician office visits = 5• Physician office visit covered charges = $1,000
• Hospital confinements = 2• Inpatient hospital covered charges = $4,000

18 September 2009 26
Person 1’s Cost-Sharing for Plan A
• Physician ($1,000, 5 visits, subject to $20 copay per visit)
Cost-sharing collected is 5*$20 = $100• Hospital (2 confinements at $2,000 each,
subject to $450 deductible per confinement)Cost-sharing collected is 2*$450 = $900
• Total cost-sharing = physician cost-sharing + hospital cost-sharing = $100 + $900 = $1000

18 September 2009 27
Plan Share for Plan A with Person 1’s Utilization and Covered Charges
• Plan payment = total covered charges – cost-sharing
• For Person 1, plan payment = $5,000 - $1,000 = $4,000
• Plan share = plan payment/ total covered charges• Plan share for Plan A for Person 1 =
$4,000/$5,000 = .8

18 September 2009 28
Actuarial Value for Plan A
• Weighted average plan shares for each of the 16,000 people
18 September 2009 29
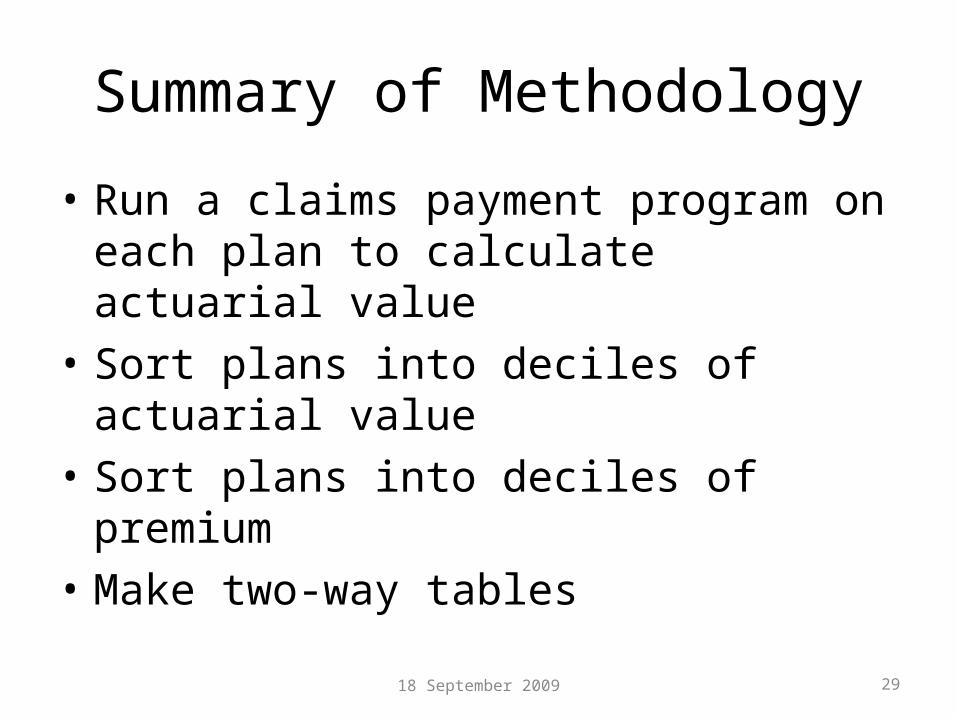
Summary of Methodology
• Run a claims payment program on each plan to calculate actuarial value
• Sort plans into deciles of actuarial value• Sort plans into deciles of premium• Make two-way tables

18 September 2009 30
Results
18 September 2009 31
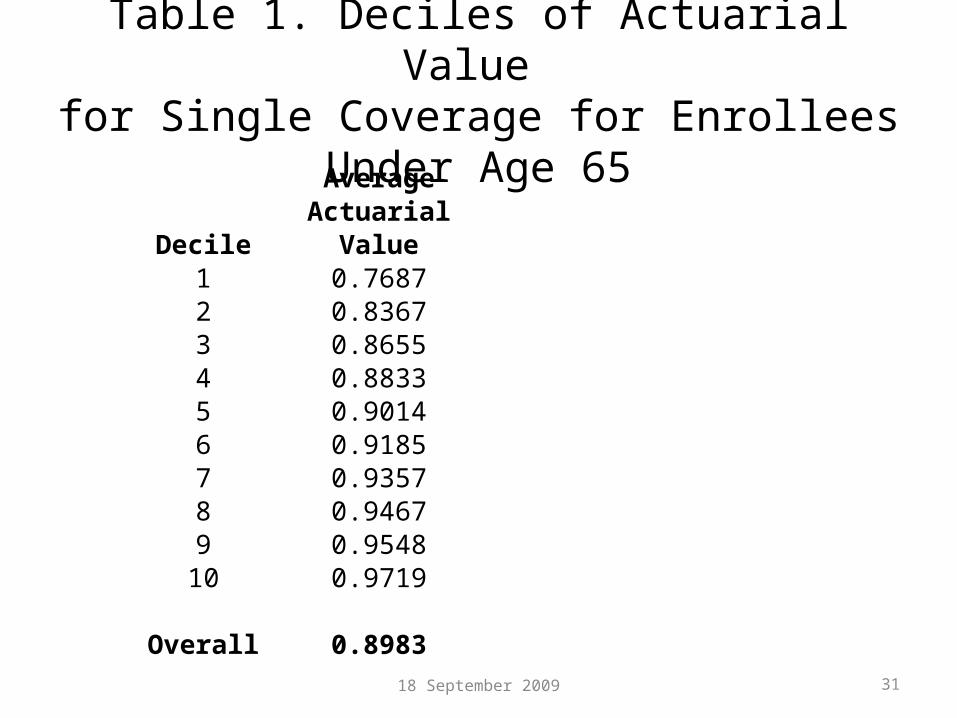
Table 1. Deciles of Actuarial Value for Single Coverage for Enrollees Under Age 65
AverageActuarial
Decile Value1 0.76872 0.83673 0.86554 0.88335 0.90146 0.91857 0.93578 0.94679 0.9548
10 0.9719
Overall 0.8983

18 September 2009 32
Table 2. Average Total Premium within Each Decile of Actuarial Value for Single Coverage for Enrollees Under Age 65
Average AverageActuarial Total
Decile Value Premium1 0.7687 344.752 0.8367 308.043 0.8655 311.484 0.8833 324.915 0.9014 324.266 0.9185 318.597 0.9357 333.088 0.9467 322.289 0.9548 332.49
10 0.9719 348.15
Overall 0.8983 326.81

Table 3. Average Actuarial Value within Each Decile of Total Premium for Single Coverage for Enrollees Under Age 65
18 September 2009 33
Average AverageTotal Actuarial
Decile Premium Value1 155.93 0.89602 228.03 0.89643 259.23 0.89514 284.93 0.89025 303.71 0.90396 328.55 0.90657 353.53 0.89568 377.27 0.90339 421.59 0.8951
10 555.87 0.9011
Overall 326.81 0.8983
18 September 2009 34
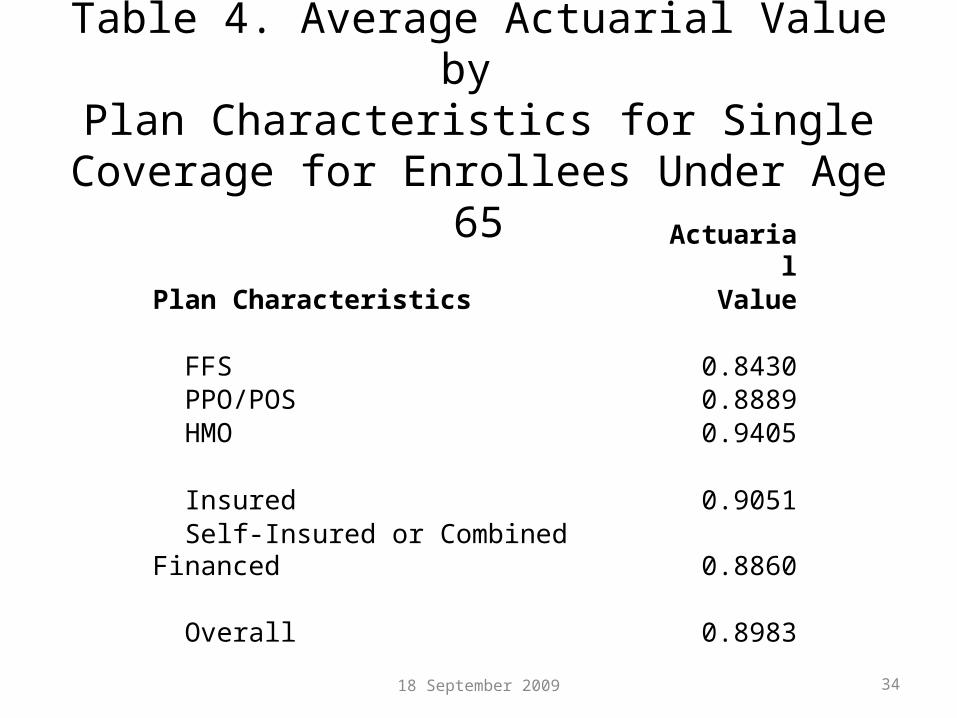
Table 4. Average Actuarial Value by Plan Characteristics for Single Coverage for
Enrollees Under Age 65
ActuarialPlan Characteristics Value
FFS 0.8430 PPO/POS 0.8889 HMO 0.9405
Insured 0.9051
Self-Insured or Combined Financed 0.8860
Overall 0.8983
18 September 2009 35
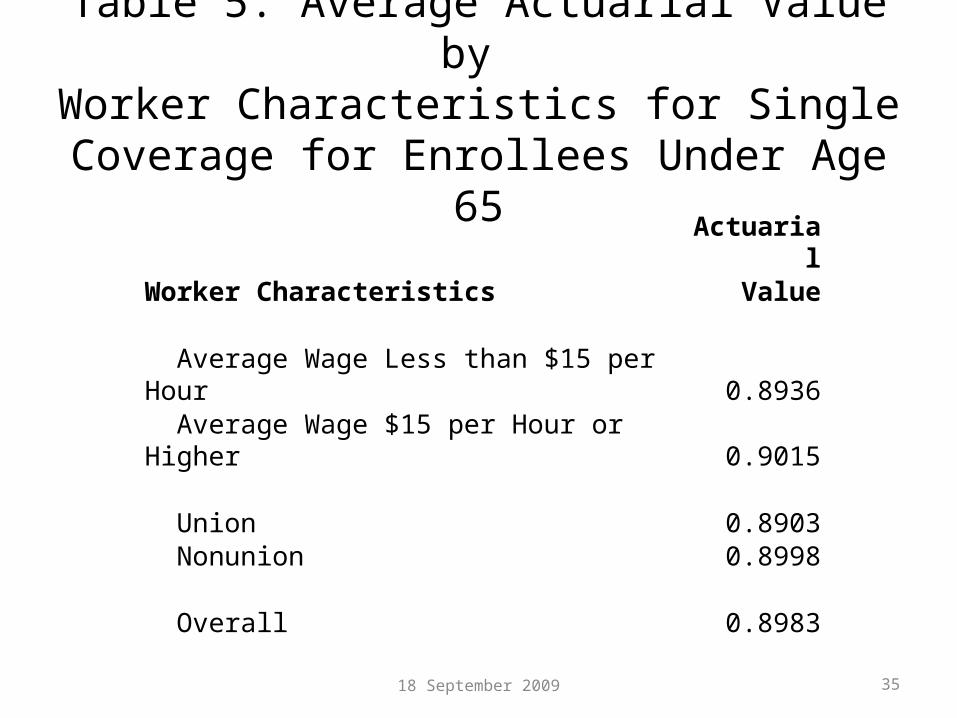
Table 5. Average Actuarial Value by Worker Characteristics for Single Coverage for
Enrollees Under Age 65
ActuarialWorker Characteristics Value
Average Wage Less than $15 per Hour 0.8936
Average Wage $15 per Hour or Higher 0.9015
Union 0.8903 Nonunion 0.8998
Overall 0.8983

18 September 2009 36
Table 6. Average Actuarial Value by Establishment Characteristics for Single Coverage
for Enrollees Under Age 65Actuarial
Establishment Characteristics Value
Fewer than 10 Workers 0.8687 10 to 24 Workers 0.9037 25 to 49 Workers 0.9036 50 to 99 Workers 0.8848 100 to 499 Workers 0.9000 500 to 999 Workers 0.8990
1000 Workers or More 0.9082
Overall 0.8983

18 September 2009 37
Policy Applications

18 September 2009 38
Policy Applications
• Minimum standards design
• Actuarial Value-based changes to tax exclusion (e.g., taxing of “Cadillac Plans”)

18 September 2009 39
Questions and Comments