1785 - diw.de · increased slightly immediately after reuni cation.2 In the 1990s, it decreased...
26
Discussion Papers Mortality in Midlife for Subgroups in Germany Peter Haan, Anna Hammerschmid, Julia Schmieder 1785 Deutsches Institut für Wirtschaftsforschung 2019
Transcript of 1785 - diw.de · increased slightly immediately after reuni cation.2 In the 1990s, it decreased...

Discussion Papers
Mortality in Midlife for Subgroups in Germany
Peter Haan, Anna Hammerschmid, Julia Schmieder
1785
Deutsches Institut für Wirtschaftsforschung 2019

Opinions expressed in this paper are those of the author(s) and do not necessarily reflect views of the institute.
IMPRESSUM
© DIW Berlin, 2019
DIW Berlin German Institute for Economic Research Mohrenstr. 58 10117 Berlin
Tel. +49 (30) 897 89-0 Fax +49 (30) 897 89-200 http://www.diw.de
ISSN electronic edition 1619-4535
Papers can be downloaded free of charge from the DIW Berlin website: http://www.diw.de/discussionpapers
Discussion Papers of DIW Berlin are indexed in RePEc and SSRN: http://ideas.repec.org/s/diw/diwwpp.html http://www.ssrn.com/link/DIW-Berlin-German-Inst-Econ-Res.html

Mortality in midlife for subgroups in Germany∗
Peter Haan†, Anna Hammerschmid‡, Julia Schmieder§,
This version: January 28, 2019
Abstract
Case and Deaton (2015) document that, since 1998, midlife mortality rates are increasing forwhite non-Hispanics in the US. This trend is driven by deaths from drug overdoses, suicides, andalcohol-related diseases, termed as deaths of despair, and by the subgroup of low-educated indi-viduals. In contrast, average mortality for middle-aged men and women continued to decrease inseveral other high-income countries including Germany. However, average mortality rates can dis-guise important differences between subgroups and the phenomenon of increasing mortality ratesmight also be present for subpopulations in these countries. Hence, we analyze how mortality inmidlife is changing for several important demographic subgroups in Germany over the 1990 to 2015period with a focus on deaths of despair. Our results show a very clear pattern: We find thatmortality rates declined between 1990 and 2015, with no increases in deaths of despair for any ofthe subgroups. Thus, our findings starkly contrast with those for the US.
Keywords: Mortality, lifetime inequality, causes of death, deaths of despair, Germany.JEL classification: I10, I14, J11.
∗Corresponding author: Julia Schmieder; Mohrenstraße 58, 10117 Berlin, Germany; phone: +49 30 89789-334. For helpful discussions and comments, we thank Adam Lederer and Hannes Kroger and participants atthe conference Demographics, Immigration, and the Labor Market. We thank Robert Lindner for his excellentresearch assistance. We are grateful for financial support from the DFG (Project HA5526/4-2) and from theGerman Federal Ministry of Education and Research within the JPI MYBL framework (Bundesministerium furBildung und Forschung, Forderlinie: “IKT 2020 - Forschung und Innovation”, Forderkennzeichen: 16SV7585,Projekt LONGLIVES). The support of the JPI MYBL is gratefully acknowledged.†DIW & FU Berlin, NETSPAR; e-mail: [email protected]‡DIW Berlin, BERA; e-mail: [email protected]§DIW Berlin, WU Vienna and IZA, e-mail: [email protected]
1


1 Introduction
Overall, life expectancy in most high-income countries is increasing over time. Mid-age mortal-
ity has become less of an issue for most of these countries and thus received only minor public
attention in the past years. However, studies for the US show that, since 1998, mortality rates
in midlife are increasing for white non-Hispanics (Case and Deaton, 2015, 2017). This trend is
driven by deaths from drug overdoses, suicides, and alcohol-related diseases, termed as deaths
of despair, and by the subgroup of low-educated individuals. This points at rising inequality in
mortality by socioeconomic status within this ethnic group. Case and Deaton (2017) argue that
the mechanism behind this development is likely to be the deterioration of life circumstances
for low-educated white non-Hispanics over time, e.g. worsening of employment opportunities or
increasing instability of marriages.1 At the same time Case and Deaton (2015, 2017) illustrate
that in several other high-income countries, including Germany, average mortality in midlife
continued to decrease after 1998. However, since the average mortality rates can disguise im-
portant differences between specific subgroups, it is unclear if the phenomenon of increasing
mortality rates is also present for subpopulations in these countries.
In this paper, we focus on Germany by analyzing the trend in mortality rates for the middle-
aged by gender, marital status, and migrant background across both East and West Germany.
Germany is particularly interesting because middle-aged individuals in East Germany lived
through a period of severe changes due to the reunification of Germany in 1990. The transition
for East Germany was remarkable: The socialist system that had prevailed for decades was
changed to the West German setup of a social market economy. This led to higher average
incomes, but also to substantial discontinuities in employment careers and to exclusion from
the labor market (Mayer, 2006). About 75% of East German workers left their employer of
1989 and more than 40% experienced a spell of unemployment before 1996. Over the same
time period, the unemployment rate in East Germany increased from around 1 to more than 20
percent (Krueger and Pischke, 1995; Goedicke, 2006a,b). There were also drastic developments
in fertility, marriage, and divorce rates in East Germany in the years around reunification
(Nolte, 2000). The age-standardized all-cause mortality rate for East German men and women
1In contrast, Ruhm (2018) argues that the availability and cost of drugs is the main force behind increasesin drug deaths.
1

increased slightly immediately after reunification.2 In the 1990s, it decreased faster than for
West German men and women, respectively, due to a substantial improvement in medical care
in East Germany, a rapid change in diet because of greater availability of fruits and vegetable
oils, and improving living standards (Nolte et al., 2000; Diehl, 2008; Kibele, 2012; Vogt and
Vaupel, 2015). Since the early 2000s, women in East and West Germany have similar all-cause
mortality rates and life expectancy at birth, while there is a stagnating gap between East and
West German men (Robert Koch Institute, 2011; Vogt and Vaupel, 2015).
We extend the analyses of Case and Deaton (2015, 2017) for Germany in the time period
from 1990 to 2015, analyzing how mortality in midlife changed for East and West German
subpopulations with a focus on deaths of despair. For this study, we use the official cause-of-
death statistics (“Todesursachenstatistik”) in which all deaths and the reasons of deaths are
recorded. We follow the analysis in Case and Deaton (2017) and calculate the mortality rates
of the 50–54 age group, defined as the number of deaths in the given age group per 100,000
persons at risk. As a sensitivity analysis, we also look at mortality rates of the neighboring age
groups 40–44, 45–49, and 55–59.
Our results show a very clear pattern. We find that mortality rates declined between 1990
and 2015, with no increases in deaths of despair for any of the subgroups. Thus, our findings
stand in contrast with the experience in the US. Reasons for this difference might be related to
the German welfare system, which provides a more generous safety net in dimensions essential
to life.
2 Data
The analysis is based on data from the official cause-of-death statistics (“Todesursachenstatis-
tik”), which is available from the Federal Health Reporting (Federal Health Reporting, 2018). It
covers all deaths in Germany and is based on death certificates issued by a medical practitioner.
The data is available at an aggregate level: we can look at the number of deaths from different
causes in groups defined by year of death, age at death in five-year categories, residence at the
state level, gender, and German nationality.
According to the rules of the WHO, the statistics are mono-causal, which means that only
one underlying disease is recorded. The selection of a single cause is especially problematic
2This temporary increase in mortality during the transition affected mainly young and middle-aged men andwas especially striking for deaths attributable to external causes and circulatory diseases (Nolte, 2000).
2

for the elderly, since they often suffer from multiple diseases related to their death (Mathers
et al., 2005; Robert Koch Institute, 2011). The statistics are based on the 9th revision of the
International Statistical Classification of Diseases (ICD-9) through 1997; thereafter based on
ICD-10. This revision involved substantial changes. Therefore, comparisons of statistics on
causes of death before and after 1998 must be made with caution. Moreover, the accuracy in
the determination of the cause of death in Germany is not undisputed (Robert Koch Institute,
2011). However, using the proportion of deaths that have an undetermined cause as a measure
for low reporting quality, we observe that the latter is much lower for the age group of 50–54
compared to the overall rate of 14% reported in Mathers et al. (2005) (see Appendix Figure A1).
The proportion of unspecified deaths relative to all deaths in the age group 50–54 is well below
10% for all subgroups. It increases slightly between 1990 and 2015, while being a bit higher for
men than for women and for West than for East Germans.
Using population statistics3 provided by the Federal Statistical Office, the absolute numbers
of deaths are translated into death rates. The death rate is obtained as the number of persons
in a selected group who died in a reference period in relation to 100,000 living persons in this
group in the same reference period (Federal Health Reporting, 2018; Federal Statistical Office,
2018a).
We report all-cause death rates and deaths of despair rates for several subgroups aged
50–54 years4 in the 1990 to 2015 time period. The deaths of despair are defined according
to Case and Deaton (2015), who provide the respective ICD-10 codes for their classification.
These include suicide and intentional self-harm, chronic liver disease (alcoholic liver disease
and cirrhosis), and poisoning (accidental and intent undetermined drug overdose and alcohol
poisoning).5 There were different coding practices for death causes prior to reunification and
East Germany adopted the West German coding practices in the last quarter of 1990 (Nolte
3The population statistics are based on intercensal updates, which are produced using the latest populationcensus. Data on the population are rolled forward using statistical results on natural population change and onmigrations across municipal borders using administrative data. Case and Deaton (2017) use data for Germanythat rely on population statistics provided by the UN. There are some differences between the data sets, asillustrated in Appendix Figure A2, that explain the differences between this study and Case and Deaton (2017)for the German deaths rates.
4Case and Deaton (2015) study mortality rates for a longer age window, i.e. for ages 45–54. The longer theage window, the more likely the analysis is to suffer from an aggregation bias due to the changing composition ofthe age group (Gelman and Auerbach, 2016). Thus, we choose the shorter window of ages 50–54. We additionallyanalyze the mortality in the neighboring age groups 40–44, 45–49, and 55–59.
5The Statistical Office of the European Community arranged selected important groups of deaths in theEuropean Short List to ensure the continuity of the mortality data despite the changes in the ICD codes. Forsuicides and alcohol-related diseases, the classification coincides with the one by Case and Deaton (2015). Forpoisoning, we draw on the ICD-10 codes provided by Case and Deaton (2015) and identify the ICD-9 codes bycomparing the descriptions of the corresponding codes.
3
et al., 2000; Kibele, 2012). Importantly, deaths from suicide and liver cirrhosis that are crucial
for our analysis were underreported in the German Democratic Republic. Hence, deaths of
despair rates are expected to be understated for East Germany in 1990.
3 Results
3.1 Trends in death of despair by region
This section presents the results of our empirical analysis. We first show group-specific trends
in all-cause mortality before turning to a deeper investigation of deaths of despair. Specifically,
our analysis focuses on the differences between East and West German mortality trends.
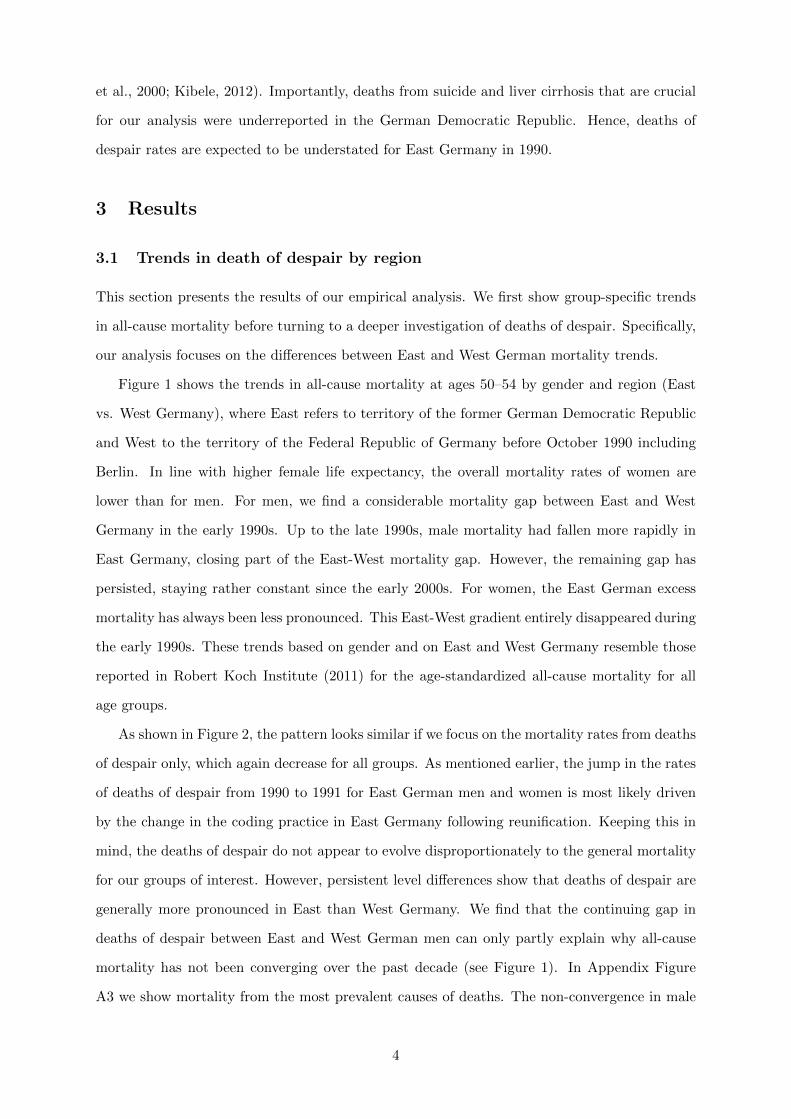
Figure 1 shows the trends in all-cause mortality at ages 50–54 by gender and region (East
vs. West Germany), where East refers to territory of the former German Democratic Republic
and West to the territory of the Federal Republic of Germany before October 1990 including
Berlin. In line with higher female life expectancy, the overall mortality rates of women are
lower than for men. For men, we find a considerable mortality gap between East and West
Germany in the early 1990s. Up to the late 1990s, male mortality had fallen more rapidly in
East Germany, closing part of the East-West mortality gap. However, the remaining gap has
persisted, staying rather constant since the early 2000s. For women, the East German excess
mortality has always been less pronounced. This East-West gradient entirely disappeared during
the early 1990s. These trends based on gender and on East and West Germany resemble those
reported in Robert Koch Institute (2011) for the age-standardized all-cause mortality for all
age groups.
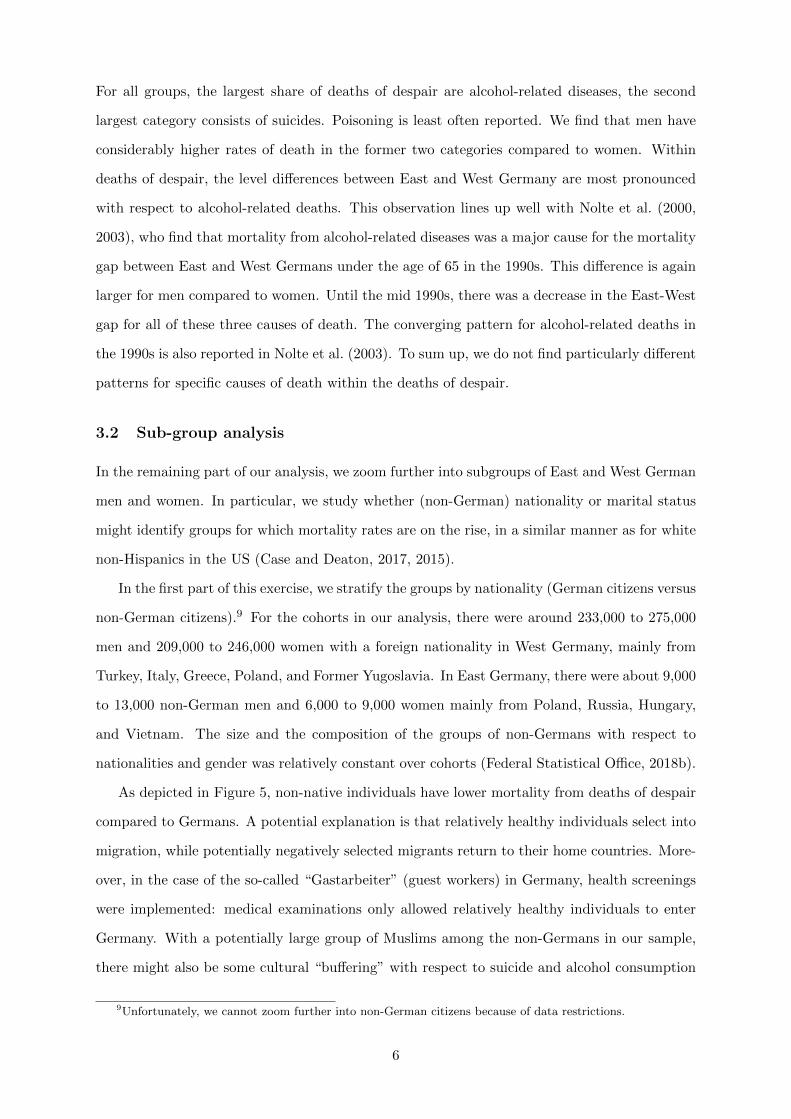
As shown in Figure 2, the pattern looks similar if we focus on the mortality rates from deaths
of despair only, which again decrease for all groups. As mentioned earlier, the jump in the rates
of deaths of despair from 1990 to 1991 for East German men and women is most likely driven
by the change in the coding practice in East Germany following reunification. Keeping this in
mind, the deaths of despair do not appear to evolve disproportionately to the general mortality
for our groups of interest. However, persistent level differences show that deaths of despair are
generally more pronounced in East than West Germany. We find that the continuing gap in
deaths of despair between East and West German men can only partly explain why all-cause
mortality has not been converging over the past decade (see Figure 1). In Appendix Figure
A3 we show mortality from the most prevalent causes of deaths. The non-convergence in male
4

all-cause mortality appears to be mainly explained by the non-decreasing East-West gap in
deaths from neoplasms and from diseases of the circulatory system since the early 2000s.
In a sensitivity analysis, we look at the age groups 40–44, 45–49 or 55–59 in Appendix
Figures A6, A7, and A8, respectively, and our observations do not change. Also, we extend
our definition of deaths of despair to include smoking-related deaths. Figure A5 shows that the
main conclusions of our analysis do not depend on the exclusion of smoking deaths. Death of
despair rates of men and women in both parts of Germany remain still to be non-increasing.6
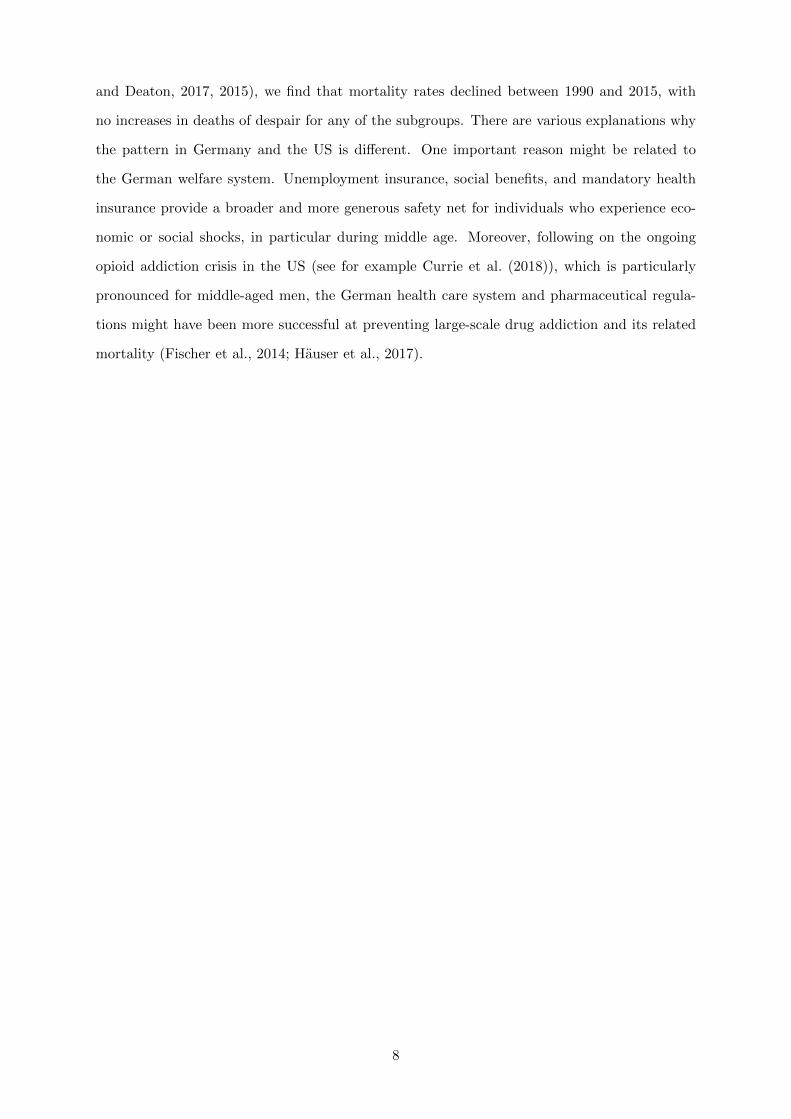
In Figure 3, we go beyond the geographical differentiation between East and West Germany
and show the number of deaths of despair by NUTS I region. Having this finer disaggregation,
we have a small number of cases of deaths for some regions and hence more volatile trajectories.7
Still, we can conclude from Figure 3 that there is no evidence for an increase in deaths of despair
in any of the NUTS I regions, neither for men nor for women. The convergence in deaths of
despair for women between East and West Germany is also found between the NUTS I regions.
For men, there is a convergence until the early 2000s. Beyond that, the gap in deaths of despair
between NUTS I regions in East and to West Germany remains rather constant. The within-
country convergence for females over the time period from 1990 to 2015 and for males from 1990
until the early 2000s is consistent with unconditional beta-convergence, as defined by Gachter
and Theurl (2011), which implies an inverse correlation between the starting values and the
rates of change of mortality rates.8
In the following, we examine the deaths of despair more closely. The analysis in Figure
4 is concerned with the different causes of death that are labeled as deaths of despair and
analyzes whether some of these sub-causes evolve differently over time for the different groups.
6Figure A4 shows only smoking related deaths by gender and region in the population of interest. We find arecent stronger increase in smoking related deaths for East compared to West German women, in line with Vogtet al. (2017). For men, we find a rather stable mortality in the East, whereas West German male mortality fromsmoking related diseases is downward sloped. The stronger upward trend for women as well as the non-decreasingtrend for men could technically be indicative of “soft” deaths of despair. However, we think that this is unlikelyfor two reasons. First, if the trends in smoking in the East were indeed caused mainly by despair, then we wouldexpect to see similar patterns in alcohol related deaths, which we do however not observe (see Figure 4). Second,it is unclear whether smoking is mainly considered as “drug of despair”. A discussion in Vogt et al. (2017, secondhalf of p. 1063) shows that evidence on the relationship between unemployment and smoking behavior is rathermixed.
7For example, the number of deaths of despair between age 50 and 54 in Bremen was on average about 8(16) for females (males) in each year in the time period of the study.
8Additionally, we divide the NUTS I regions in two groups depending on their relative increase in real per-capita household income and in their unemployment rate from 1990 to 2015. We find that regions with a higherincome growth (a faster decrease in unemployment) have higher initial levels in deaths of despair. These patternsthen converge for women. For men, there is first a convergence and then a stagnating gap in deaths of despairrates. It is important to notice that the group with relatively faster improvements in income (unemployment)includes all NUTS I regions in East plus three in West Germany. Results are available upon request.
5
For all groups, the largest share of deaths of despair are alcohol-related diseases, the second
largest category consists of suicides. Poisoning is least often reported. We find that men have
considerably higher rates of death in the former two categories compared to women. Within
deaths of despair, the level differences between East and West Germany are most pronounced
with respect to alcohol-related deaths. This observation lines up well with Nolte et al. (2000,
2003), who find that mortality from alcohol-related diseases was a major cause for the mortality
gap between East and West Germans under the age of 65 in the 1990s. This difference is again
larger for men compared to women. Until the mid 1990s, there was a decrease in the East-West
gap for all of these three causes of death. The converging pattern for alcohol-related deaths in
the 1990s is also reported in Nolte et al. (2003). To sum up, we do not find particularly different
patterns for specific causes of death within the deaths of despair.
3.2 Sub-group analysis
In the remaining part of our analysis, we zoom further into subgroups of East and West German
men and women. In particular, we study whether (non-German) nationality or marital status
might identify groups for which mortality rates are on the rise, in a similar manner as for white
non-Hispanics in the US (Case and Deaton, 2017, 2015).
In the first part of this exercise, we stratify the groups by nationality (German citizens versus
non-German citizens).9 For the cohorts in our analysis, there were around 233,000 to 275,000
men and 209,000 to 246,000 women with a foreign nationality in West Germany, mainly from
Turkey, Italy, Greece, Poland, and Former Yugoslavia. In East Germany, there were about 9,000
to 13,000 non-German men and 6,000 to 9,000 women mainly from Poland, Russia, Hungary,
and Vietnam. The size and the composition of the groups of non-Germans with respect to
nationalities and gender was relatively constant over cohorts (Federal Statistical Office, 2018b).
As depicted in Figure 5, non-native individuals have lower mortality from deaths of despair
compared to Germans. A potential explanation is that relatively healthy individuals select into
migration, while potentially negatively selected migrants return to their home countries. More-
over, in the case of the so-called “Gastarbeiter” (guest workers) in Germany, health screenings
were implemented: medical examinations only allowed relatively healthy individuals to enter
Germany. With a potentially large group of Muslims among the non-Germans in our sample,
there might also be some cultural “buffering” with respect to suicide and alcohol consumption
9Unfortunately, we cannot zoom further into non-German citizens because of data restrictions.
6

(Kohls, 2008). Overall mortality trends do not look substantially different.10
Figure 6 shows the mortality trends in deaths of despair over time if we stratify our popu-
lation groups by marital status. Looking into marital subgroups does not alter our conclusion.
Overall, we do not observe increasing mortality from causes of despair for any of the subgroups.
However, the interpretation of these trends is more difficult in this case, since the composition
of the analyzed subgroups changed substantially over time: the share of single women and men
increased by a factor of 2.5 from cohorts observed in 1998 to those in 2015, while the share
of married decreased substantially. Hence, there might be a very different selection of individ-
uals into a specific family status over time. The level differences by marital status, i.e. the
fact that married have on average lower mortality rates from deaths of despair than single or
widowed/divorced individuals, parallels the findings with respect to all-cause mortality in the
meta-analysis by Manzoli et al. (2007). Of course, the mortality advantage of married individu-
als can be driven by both selection and causation. Still, Bulanda et al. (2016) argue that there
is strong evidence of a causal relationship between marital status and mortality.
Overall, our empirical analysis cannot identify a specific group with rising mortality from
causes of despair within the demographic dimensions under study. Even middle-aged East
German men, who experienced severe changes in their lives for decades, do not face increasing
deaths of despair rates in a similar manner as white non-Hispanics in the US (Case and Deaton,
2015, 2017). We additionally analyze important demographic subgroups and do not find any
group by citizenship or marital status that experienced a reversal in their deaths of despair
mortality trends.
4 Discussion
In this study, we analyze mortality patterns and trends across important demographic groups
in Germany. We focus on population groups defined by key demographic dimensions, such as
gender, marital and migrant status across East and West Germany. These can be related to
societal and economic status. In particular, East Germans experienced decades of extreme eco-
nomic and societal change due to the division of the country and the transition of the political
system in the early 1990s. Our results show a very clear pattern. In contrast to the US (Case
10Note, however, that the trend gets very noisy for East German non-natives because of low cell sizes. Theabsolute number of deaths of despair in the group of East German non-native women is so small (and sometimeseven zero) that we decided not to include them in the graph.
7
and Deaton, 2017, 2015), we find that mortality rates declined between 1990 and 2015, with
no increases in deaths of despair for any of the subgroups. There are various explanations why
the pattern in Germany and the US is different. One important reason might be related to
the German welfare system. Unemployment insurance, social benefits, and mandatory health
insurance provide a broader and more generous safety net for individuals who experience eco-
nomic or social shocks, in particular during middle age. Moreover, following on the ongoing
opioid addiction crisis in the US (see for example Currie et al. (2018)), which is particularly
pronounced for middle-aged men, the German health care system and pharmaceutical regula-
tions might have been more successful at preventing large-scale drug addiction and its related
mortality (Fischer et al., 2014; Hauser et al., 2017).
8

5 Figures
200
300
400
500
600
700
800
900
1000
1100
1200
1990 1992 1994 1996 1998 2000 2002 2004 2006 2008 2010 2012 2014
De
ath
s p
er
100
,000
Year
Women, West Women, East Men, West Men, East
Fig. 1: All-cause mortality for age 50–54, Germany, 1990–2015, Source: Federal Health Reporting
20
40
60
80
100
120
140
160
180
200
1990 1992 1994 1996 1998 2000 2002 2004 2006 2008 2010 2012 2014
Dea
ths p
er
100
,000
Year
Women, West Women, East Men, West Men, East
Fig. 2: Deaths of despair for age 50–54, Germany, 1990–2015, Source: Federal Health Reporting
9

0
10
20
30
40
50
60
70
80
1990 1991 1992 1993 1994 1995 1996 1997 1998 1999 2000 2001 2002 2003 2004 2005 2006 2007 2008 2009 2010 2011 2012 2013 2014 2015
Dea
ths
per 1
00,0
00
Baden-Wurttemberg Bavaria Berlin Brandenburg Bremen Hamburg Hesse Mecklenburg Western Pomerania Lower Saxony North Rhine-Westphalia Rhineland-Palatinate Saarland Saxony Saxony Anhalt Schleswig-Holstein Thuringia
(a) Women
20
40
60
80
100
120
140
160
180
200
1990 1991 1992 1993 1994 1995 1996 1997 1998 1999 2000 2001 2002 2003 2004 2005 2006 2007 2008 2009 2010 2011 2012 2013 2014 2015
Dea
ths
per 1
00,0
00
Baden-Wurttemberg Bavaria Berlin Brandenburg Bremen Hamburg Hesse Mecklenburg Western Pomerania Lower Saxony North Rhine-Westphalia Rhineland-Palatinate Saarland Saxony Saxony Anhalt Schleswig-Holstein Thuringia
(b) Men
Fig. 3: Deaths of despair for age 50–54 by NUTS-I region, Germany, 1990–2015. Solid (dashed) lines show NUTS-Iregions in West (East) Germany. Source: Federal Health Reporting
10

0
5
10
15
20
25
30
35
40
45
1990 1992 1994 1996 1998 2000 2002 2004 2006 2008 2010 2012 2014
De
ath
s p
er
10
0,0
00
Year
Women, West, Chronic liver disease Women, West, Suicide Women, West, Poisoning
Women, East, Chronic liver disease Women, East, Suicide Women, East, Poisoning
(a) Women
0
20
40
60
80
100
120
1990 1992 1994 1996 1998 2000 2002 2004 2006 2008 2010 2012 2014
De
ath
s p
er
10
0,0
00
Year
Men, West, Chronic liver disease Men, West, Suicide Men, West, Poisoning
Men, East, Chronic liver disease Men, East, Suicide Men, East, Poisoning
(b) Men
Fig. 4: Deaths of despair by causes for age 50–54, Germany, 1990–2015. Source: Federal Health Reporting
11

0
5
10
15
20
25
30
35
40
45
2000 2002 2004 2006 2008 2010 2012 2014
De
ath
s p
er
100
,000
Year
Women, West, Natives Women, West, Non-Natives Women, East, Natives
(a) Women
0
20
40
60
80
100
120
140
2000 2002 2004 2006 2008 2010 2012 2014
De
ath
s p
er
100
,000
Year
Men, West, Natives Men, West, Non-Natives Men, East, Natives Men, East, Non-Natives
(b) Men
Fig. 5: Deaths of despair by nationality for age 50–54, Germany, 2000–2015. The absolute number of deaths of despair inthe group of East German non-native women is so small (and sometimes even zero) that we decided not to include themin the graph. Mortality figures by nationality are only available after 2000. Source: Federal Health Reporting.
12

10
20
30
40
50
60
70
80
90
100
1998 2000 2002 2004 2006 2008 2010 2012 2014
Death
s p
er
100,0
00
Year
Women, West, single Women, West, married Women, West, widowed/divorced
Women, East, single Women, East, married Women, East, widowed/divorced
(a) Women
0
50
100
150
200
250
300
350
400
1998 2000 2002 2004 2006 2008 2010 2012 2014
De
ath
s p
er
100
,00
0
Year
Men, West, single Men, West, married Men, West, widowed/divorced
Men, East, single Men, East, married Men, East, widowed/divorced
(b) Men
Fig. 6: Deaths of despair by marital status for age 50–54, Germany, 1998–2015. Mortality figures by family status areonly available after 1998. Source: Federal Health Reporting and population statistics.
13

References
Bulanda, J. R., Brown, J. S., and Yamashita, T. (2016). Marital Quality, Marital Dissolution,
and Mortality Risk During the Later Life Course. Social Science & Medicine, 165:119–127.
Case, A. and Deaton, A. (2015). Rising Morbidity and Mortality in Midlife among White Non-
Hispanic Americans in the 21st Century. Proceedings of the National Academy of Sciences,
112(49):15078–15083.
Case, A. and Deaton, A. (2017). Mortality and Morbidity in the 21st Century. Brookings Papers
on Economic Activity, 2017:397–476.
Currie, J., Jin, J. Y., and Schnell, M. (2018). US Employment and Opioids: Is There a
Connection? NBER Working Paper No. 24440, National Bureau of Economic Research,
Cambridge, MA.
Diehl, K. (2008). Mogliche Faktoren fur die rasche Reduktion der ostdeutschen Ubersterblichkeit
nach der Wiedervereinigung. Zeitschrift fur Bevolkerungswissenschaft, 33(1):89–109.
Federal Health Reporting (2018). Statistics on the Causes of Death (“Todesursachenstatistik”);
Deaths, mortality figures (from 1980); Primary source: Federal Statistical Office, Causes of
Death Statistics. Data retrieved from http://www.gbe-bund.de, Retrieval date: 11/14/2018.
Federal Statistical Office (2018a). Population Statistics by Sex, Age, and Region. Data requested
via https://www.destatis.de/EN/Service/Contact/Contact.html, Date: 03/14/2018.
Federal Statistical Office (2018b). Statistics of Foreigners (“Auslanderzentralregister”). Data
retrieved from https://www.destatis.de, Retrieval date: 11/14/2018.
Fischer, B., Keates, A., Buhringer, G., Reimer, J., and Rehm, J. (2014). Non-Medical Use of
Prescription Opioids and Prescription Opioid-related Harms: Why so Markedly Higher in
North America Compared to the Rest of the World? Addiction, 109(2):177–181.
Gachter, M. and Theurl, E. (2011). Health Status Convergence at the Local Level: Empirical
Evidence from Austria. International Journal for Equity in Health, 10(1):34.
Gelman, A. and Auerbach, J. (2016). Age-aggregation Bias in Mortality Trends. Proceedings
of the National Academy of Sciences, 113(7):E816–E817.
14

Goedicke, A. (2006a). A “Ready-Made State”: The Mode of Institutional Transition in East
Germany after 1989. In After the Fall of the Wall: Life Courses in the Transformation of
East Germany. Stanford University Press, Stanford, CA.
Goedicke, A. (2006b). Firms and Fortune: The Consequences of Privatization and Reorgani-
zation. In After the Fall of the Wall: Life Courses in the Transformation of East Germany.
Stanford University Press, Stanford, CA.
Hauser, W., Schug, S., and Furlan, A. D. (2017). The Opioid Epidemic and National Guidelines
for Opioid Therapy for Chronic Noncancer Pain: A Perspective from Different Continents.
Pain Reports, 2(3):e599.
Kibele, E. U. (2012). Regional Mortality Differences in Germany. Springer Science & Business
Media, Dordrecht, The Netherlands.
Kohls, M. (2008). Healthy-Migrant-Effect, Erfassungsfehler und andere Schwierigkeiten bei der
Analyse der Mortalitat von Migranten: Eine Bestandsaufnahme. Bundesamt fur Migration
und Fluchtlinge, Berlin, Germany.
Krueger, A. B. and Pischke, J.-S. (1995). A Comparative Analysis of East and West German
Labor Markets: Before and After Unification. In Freeman, R. B. and Katz, L. F., editors,
Differences and Changes in Wage Structures. University of Chicago Press, Chicago, IL.
Manzoli, L., Villari, P., Pirone, G. M., and Boccia, A. (2007). Marital Status and Mortality in
the Elderly: A systematic Review and Meta-Analysis. Social Science & Medicine, 64(1):77–
94.
Mathers, C. D., Fat, D. M., Inoue, M., Rao, C., and Lopez, A. D. (2005). Counting the Dead
and What They Died From: An Assessment of the Global Status of Cause of Death Data.
Bulletin of the World Health Organization, 83(3):171–177.
Mayer, K. (2006). After the Fall of the Wall: Living Through the Post-Socialist Transformation
in East Germany. In After the Fall of the Wall: Life Courses in the Transformation of East
Germany. Stanford University Press, Stanford, CA.
Nolte, E. (2000). The Health Impact of German Unification: Still Much to Learn. Journal of
Epidemiology & Community Health, 54(8):565–565.
15

Nolte, E., Britton, A., and McKee, M. (2003). Trends in Mortality Attributable to Current
Alcohol Consumption in East and West Germany. Social Science & Medicine, 56(7):1385–
1395.
Nolte, E., Shkolnikov, V., and McKee, M. (2000). Changing Mortality Patterns in East and
West Germany and Poland II: Short-Term Trends during Transition and in the 1990s. Journal
of Epidemiology and Community Health, 54(12):899–906.
Robert Koch Institute (2011). Sterblichkeit, Todesursachen und Regionale Unterschiede. Federal
Health Reporting, Robert Koch Institute, Berlin.
Ruhm, C. J. (2018). Deaths of Despair or Drug Problems? NBER Working Paper No. 24188,
National Bureau of Economic Research, Cambridge, MA.
Vogt, T., van Raalte, A., Grigoriev, P., and Myrskyla, M. (2017). The German East-West
Mortality Difference: Two Crossovers Driven by Smoking. Demography, 54:1051–1071.
Vogt, T. C. and Vaupel, J. W. (2015). The Importance of Regional Availability of Health
Care for Old Age Survival - Findings from German Reunification. Population Health Metrics,
13(1):26.
16

A Appendix: For Online Publication
0
0,01
0,02
0,03
0,04
0,05
0,06
0,07
0,08
0,09
1990 1992 1994 1996 1998 2000 2002 2004 2006 2008 2010 2012 2014
Un
sp
ecifie
d d
ea
ths r
ela
tive
to
all
de
ath
s
Year
Women, West Women, East Men, West Men, East
Fig. A1: Unspecified relative to all deaths for age 50–54, Germany, 1990–2015. Source: Federal Health Reporting.
4,000,000
4,500,000
5,000,000
5,500,000
6,000,000
6,500,000
7,000,000
1991 1993 1995 1997 1999 2001 2003 2005 2007 2009 2011 2013 2015
Num
ber o
f ind
ivid
uals
in a
ge g
roup
50-
54 in
Ger
man
y
Year
UN Federal Statistical Office Federal Statistical Office (t-1) Federal Health Reporting
Fig. A2: Number of individuals aged 50–54 by data source, Germany, 1990–2015. Source: Federal Health Reporting,population data from the UN and the Federal Statistical Office.
17

0
50
100
150
200
250
300
350
1990 1991 1992 1993 1994 1995 1996 1997 1998 1999 2000 2001 2002 2003 2004 2005 2006 2007 2008 2009 2010 2011 2012 2013 2014 2015
Deat
hs p
er 1
00,0
00
Axis Title
West, Neoplasms
West, Mental and behavioural disorders
West, Diseases of the circulatory system
West, Diseases of the respiratory system
West, Diseases of the digestive system*
West, External causes*
West, Death of despair
East, Neoplasms
East, Mental and behavioural disorders
East, Diseases of the circulatory system
East, Diseases of the respiratory system
East, Diseases of the digestive system*
East, External causes*
East, Death of despair
Fig. A3: Mortality for age 50-54 by cause of death, Men, Germany, 1990-2015. This figure shows mortality rates fromthe six most prevalent cause of deaths categories plus deaths of despair. Categories marked with a * exclude deaths fromdespair within the category: Diseases of the digestive system exclude chronic liver diseases and external causes excludepoisoning and suicides. Source: Federal Health Reporting.
0
20
40
60
80
100
120
1990 1992 1994 1996 1998 2000 2002 2004 2006 2008 2010 2012 2014
Dea
ths
per 1
00,0
00
Year
Women, West Women, East Men, West Men, East
Fig. A4: Deaths by smoking for age 50-54, Germany, 1990-2015. Deaths by smoking refer to deaths from malignantneoplasms of lip, oral cavity, pharynx, larynx, trachea, bronchus and lung. Source: Federal Health Reporting.
18

0
50
100
150
200
250
300
1990 1992 1994 1996 1998 2000 2002 2004 2006 2008 2010 2012 2014
Dea
ths
per 1
00,0
00
Year
Women, West Women, East Men, West Men, East
Fig. A5: Deaths of despair including deaths by smoking for age 50-54, Germany, 1990-2015. This figure shows thedeaths of despair defined as in Figure 2 adding also deaths by smoking as described in Figure A4. Source: Federal HealthMonitoring.
19

0
100
200
300
400
500
600
1990 1992 1994 1996 1998 2000 2002 2004 2006 2008 2010 2012 2014
Dea
ths
per 1
00,0
00
Year
Women, West Women, East Men, West Men, East
(a) All-cause
0
20
40
60
80
100
120
140
1990 1992 1994 1996 1998 2000 2002 2004 2006 2008 2010 2012 2014
Dea
ths p
er
100
,000
Year
Women, West Women, East Men, West Men, East
(b) Deaths of despair
Fig. A6: All-cause mortality and deaths of despair for age 40–44, Germany, 1990–2015. Source: Federal Health Reporting
20

0
100
200
300
400
500
600
700
800
900
1990 1992 1994 1996 1998 2000 2002 2004 2006 2008 2010 2012 2014
Dea
ths
per 1
00,0
00
Year
Women, West Women, East Men, West Men, East
(a) All-cause
0
20
40
60
80
100
120
140
160
1990 1992 1994 1996 1998 2000 2002 2004 2006 2008 2010 2012 2014
Dea
ths p
er
100
,000
Year
Women, West Women, East Men, West Men, East
(b) Deaths of despair
Fig. A7: All-cause mortality and deaths of despair for age 45–49, Germany, 1990–2015. Source: Federal Health Reporting
21

200
400
600
800
1000
1200
1400
1600
1800
1990 1992 1994 1996 1998 2000 2002 2004 2006 2008 2010 2012 2014
Dea
ths
per 1
00,0
00
Year
Women, West Women, East Men, West Men, East
(a) All-cause
0
50
100
150
200
250
1990 1992 1994 1996 1998 2000 2002 2004 2006 2008 2010 2012 2014
Dea
ths p
er
100
,000
Year
Women, West Women, East Men, West Men, East
(b) Deaths of despair
Fig. A8: All-cause mortality and deaths of despair for age 55–59, Germany, 1990–2015. Source: Federal Health Reporting
22