170802 02Management Report 2016 - Trianel · 3 | Management Report 2016 MANAGEMENT REPORT...
60
MANAGEMENT REPORT 2016 DESK Trianel
-
Upload
hoangthuan -
Category
Documents
-
view
216 -
download
0
Transcript of 170802 02Management Report 2016 - Trianel · 3 | Management Report 2016 MANAGEMENT REPORT...
MANAGEMENT REPORT
2016
DESKTrianel
2 | Management Report 2016 3 | Management Report 2016
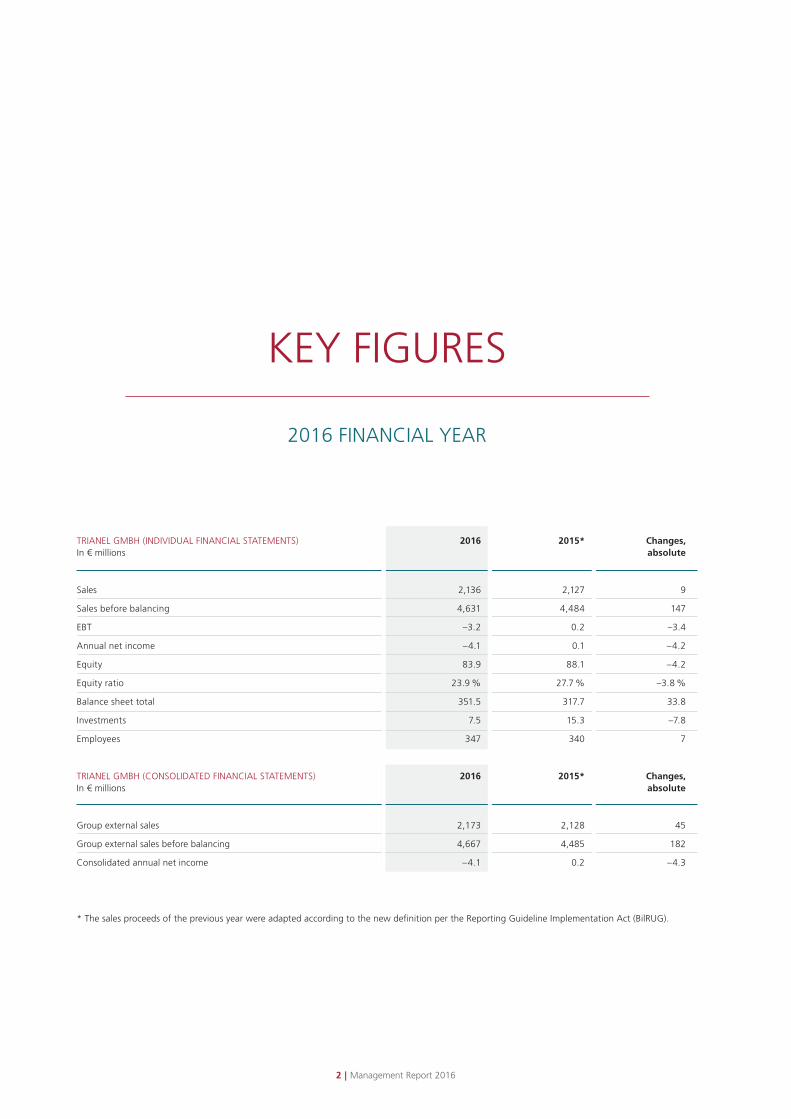
TRIANEL GMBH (INDIVIDUAL FINANCIAL STATEMENTS) 2016 2015* Changes, In € millions absolute
Sales 2,136 2,127 9
Sales before balancing 4,631 4,484 147
EBT –3.2 0.2 –3.4
Annual net income –4.1 0.1 –4.2
Equity 83.9 88.1 –4.2
Equity ratio 23.9 % 27.7 % –3.8 %
Balance sheet total 351.5 317.7 33.8
Investments 7.5 15.3 –7.8
Employees 347 340 7
TRIANEL GMBH (CONSOLIDATED FINANCIAL STATEMENTS) 2016 2015* Changes, In € millions absolute
Group external sales 2,173 2,128 45
Group external sales before balancing 4,667 4,485 182
Consolidated annual net income –4.1 0.2 –4.3
* The sales proceeds of the previous year were adapted according to the new definition per the Reporting Guideline Implementation Act (BilRUG).
KEY FIGURES
2016 FINANCIAL YEAR
3 | Management Report 2016
MANAGEMENT REPORT
Summarised management report of Trianel GmbH 5
Financial Statements of Trianel GmbH 35
Consolidated Financial Statements 57
Publishing details 60
2016
4 | Management Report 2016 5 | Management Report 2016
“Trianel GmbH’s business activities aim to enhance the competitiveness and therefore independence of municipal utilities.”

5 | Management Report 2016
SUMMARISEDMANAGEMENT REPORT
OF TRIANEL GMBH
Company situation 6
Business model 6
Strategy and management of the company 11
Economic report 14
General conditions 14
Business development 16
Company situation 17
Report on forecast, opportunities and risks 20
Forecast 20
Opportunity report 24
Risk report 26
Supplementary report 32
Reporting 33
6 | Management Report 2016 7 | Management Report 2016
Energie- und Wasserversorgung
Mittleres Ruhrgebiet GmbH, Bochum
24.69 %
Stadtwerke Aachen AG 11.97 %
RhönEnergie Fulda GmbH 7.44 %
Stadtwerke Bonn GmbH 5.81 %
Stadtwerke Lübeck Holding GmbH 5.12 %
SWU Energie GmbH, Ulm 4.78 %
Stadtwerke Energie Jena-Pößneck GmbH 2.99 %
NEW Viersen GmbH 2.87 %
N.V. HVC, Netherlands 2.48 %
enwor – energie & wasser vor ort GmbH, Herzogenrath 2.21 %
Salzburg AG für Energie, Verkehr und
Telekommunikation, Austria
1.76 %
Allgäuer Überlandwerk GmbH 1.74 %
Stadtwerke Halle GmbH 1.57 %
SWT Stadtwerke Trier Versorgungs-GmbH 1.49 %
Stadtwerke Heidelberg GmbH 1.24 %
Nvb Nordhorner Versorgungsbetriebe GmbH 1.19 %
Trianel Suisse AG, Switzerland 1.18 %
Stadtwerke Hamm GmbH 1.12 %
Stadtwerke Solingen GmbH 0.99 %
Stadtwerke Lindau (B) GmbH & Co.KG 0.97 %
GSW Gemeinschaftsstadtwerke GmbH
Kamen, Bönen, Bergkamen
0.83 %
Stadtwerke Aalen GmbH 0.74 %
Stadtwerke Borken/Westf. GmbH 0.74 %
Stadtwerke Lünen GmbH 0.66 %
Energie- und Wasserversorgung Rheine GmbH 0.57 %
Hertener Energiehandelsgesellschaft mbH 0.54 %
Stadtwerke Fröndenberg GmbH 0.53 %
BBSW Energie GmbH, Steinheim 0.50 %
ENNI Energie & Umwelt Niederrhein GmbH 0.50 %
Gemeindewerke Steinhagen GmbH 0.50 %
Osterholzer Stadtwerke GmbH & Co. KG 0.50 %
GWS Stadtwerke Hameln GmbH 0.50 %
Schleswiger Stadtwerke GmbH 0.50 %
Stadtwerke Bad Salzuflen GmbH 0.50 %
Stadtwerke Dachau 0.50 %
Stadtwerke Elmshorn 0.50 %
Stadtwerke Gronau GmbH 0.50 %
Stadtwerke Mosbach GmbH 0.50 %
Stadtwerke Rüsselsheim GmbH 0.50 %
Stadtwerke Sindelfingen GmbH 0.50 %
Stadtwerke Tuttlingen GmbH 0.50 %
Stadtwerke Wedel GmbH 0.50 %
T.W.O Technische Werke Osning GmbH 0.50 %
Stadtwerke Bad Pyrmont Beteiligungs und Bäder GmbH 0.37 %
Stadtwerke Uelzen GmbH 0.37 %
Stadtwerke Detmold GmbH 0.36 %
Stadtwerke Unna GmbH 0.33 %
Stadtwerke EVB Huntetal GmbH 0.30 %
Regio Energie Solothurn, Switzerland 0.30 %
Stadtwerke Soest GmbH 0.29 %
Stadtwerke Schwäbisch Hall GmbH 0.26 %
Stadtwerke Georgsmarienhütte GmbH 0.25 %
Stadtwerke Herford GmbH 0.25 %
Stadtwerke Lengerich GmbH 0.25 %
Stadtwerke Verden GmbH 0.25 %
Teutoburger Energie Netzwerk e.G., Hagen a.T.W. 0.25 %
A. COMPANY SITUATION
1. BUSINESS MODEL
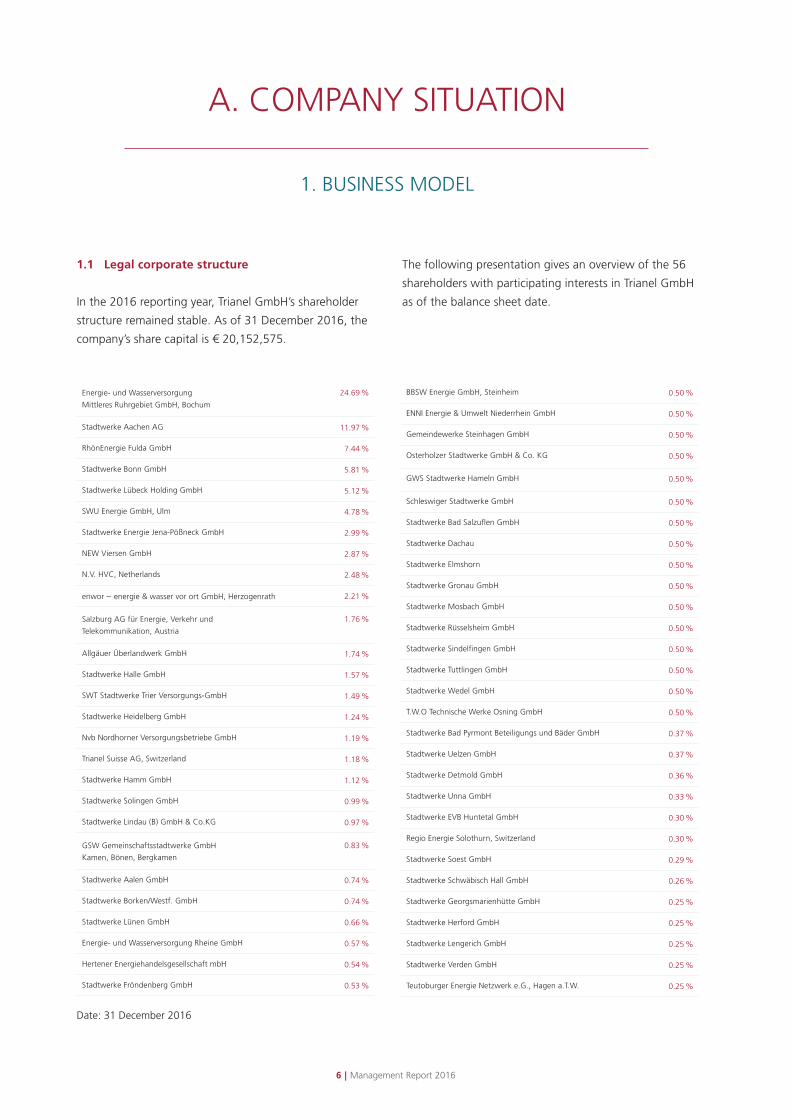
1.1 Legal corporate structure
In the 2016 reporting year, Trianel GmbH’s shareholder
structure remained stable. As of 31 December 2016, the
company’s share capital is € 20,152,575.
The following presentation gives an overview of the 56
shareholders with participating interests in Trianel GmbH
as of the balance sheet date.
Date: 31 December 2016

7 | Management Report 2016
GENERATION
GENERATION
GENERATION
GAS STORAGE
GENERATION
GENERATION
Trianel Gaskraftwerk Hamm GmbH & Co. KG 6.12 %
Trianel Kohlekraftwerk Lünen GmbH & Co. KG 6.34 %
Trianel Windkraftwerk Borkum GmbH & Co. KG 2.69 %
Trianel Gasspeicher EPE GmbH & Co. KG 7.60 %
Trianel Erneuerbare Energie GmbH & Co. KG 8.173 %
Trianel Onshore Windkraftwerke GmbH & Co. KG 5.35 %
GREEN POWER MARKETING
GESY Green Energy Systems GmbH 24.90 %
PORTFOLIO MANAGEMENT / FINANCIAL SERVICES
Trianel Finanzdienste GmbH 100 %
Trianel Gaskraftwerk Hamm Verwaltungs GmbH 100 %
Trianel Kohlekraftwerk Lünen Verwaltungs GmbH
Trianel Windkraftwerk Borkum Verwaltungs GmbH
Trianel Gasspeicher EPE Verwaltungs GmbH
Trianel Kraftwerk Krefeld Verwaltungs GmbH*
Trianel Service GmbH
Trianel Energie B.V.
* After economic allocation | Date: 31 December 2015
TRIANEL
GMBH
Taking into account the loss for the year of € 4,139
thousand for the 2016 financial year, Trianel GmbH has
equity of € 83,938 thousand on the balance sheet date.
On the reporting date of 31 December 2016, Trianel
GmbH had direct shares in 15 subsidiaries and participa-
ting interests.
100 %
100 %
100 %
100 %
100 %
100 %

8 | Management Report 2016 9 | Management Report 2016
As shown in the overview, Trianel GmbH holds shares in
the following companies:
Gaskraftwerk Hamm GmbH & Co. KG, domiciled in
Aachen, has operated the first municipal gas and steam
turbine power plant with a capacity of 840 megawatts
since 2008 in Hamm-Uentrop (North Rhine-Westphalia).
Trianel Gasspeicher Epe GmbH & Co. KG, domiciled in
Aachen, manages a natural gas storage facility located
in Epe in the district of Borken (North Rhine-Westphalia)
since 2009/2010. Trianel Kohlekraftwerk Lünen GmbH &
Co. KG, domiciled in Lünen, has been operating a mod-
ern, highly efficient 750 megawatt hard coal-fired pow-
er station in Lünen (North Rhine-Westphalia) since 2013.
Trianel Windkraftwerk Borkum GmbH & Co. KG, dom-
iciled in Aachen, is the project developer and operator
of the Trianel offshore wind farm Borkum (formerly Bor-
kum-West II), with a total capacity of 400 megawatts
roughly 40 kilometres off the coast of the North Sea
island of Borkum (Lower Saxony). The first expansion
stage, with a capacity of 200 megawatts began com-
mercial regular operation in 2015. In the 2016 report-
ing year, planning commenced for the second expansion
stage of a further 200 megawatts.
As general partners, the personally liable companies
Trianel Gaskraftwerk Hamm Verwaltungs GmbH,
Trianel Gasspeicher Epe Verwaltungs GmbH, Trianel
Kohlekraftwerk Lünen Verwaltungs GmbH, as well as
Trianel Windkraftwerk Borkum Verwaltungs GmbH
assume the management for the above limited partner-
ships as the general partners. Trianel Kraftwerk Krefeld
Verwaltungs GmbH manages Trianel Kraftwerk Krefeld
GmbH & Co. KG for the development of a gas and
steam turbine power plant at the CHEMPARK site in
Krefeld-Uerdingen (North Rhine-Westphalia); it is wholly
commercially attributed to Trianel GmbH. All companies
are domiciled in Aachen.
Established in 2013 as a standard limited partnership
(Einheits-KG), Trianel Onshore Windkraftwerke GmbH &
Co. KG (TOW), domiciled in Aachen, plans, builds and
operates systems for generating electricity from renew-
able sources and is also responsible for investment in
companies domiciled in Germany that operate systems
for generating electricity from renewable sources. In the
2016 reporting year, the targets were reached and Tri-
anel GmbH’s participating interest in TOW was reduced
from 14.81% to 5.35% effective to 31 December 2016.
Trianel Erneuerbare Energien GmbH & Co. KG was
founded in the 2015 calendar year, also as a standard
limited partnership (Einheits-KG) domiciled in Aachen,
with the same business purpose as TOW.
Trianel Finanzdienste GmbH, domiciled in Aachen, is a
wholly owned subsidiary of Trianel GmbH. The activities
of the Trianel Group which require authorisation for the
provision of financial services pursuant to Section 32,
para. 1 of the German Banking Act (Kreditwesengesetz,
KWG) are pooled in this company.
The Dutch sales and distribution company Trianel Ener-
gie B.V. domiciled in Maastricht was forced to apply for
insolvency at the end of 2012 due to customer default.
The insolvency proceedings are still ongoing.
GESY Green Energy Systems GmbH is domiciled in Ber-
lin, and was once again successful in direct marketing of
renewable energy sources.
The strategic orientation of Trianel Service GmbH dom-
iciled in Aachen is currently under review, as a result of
which business operations have been suspended.
After abandoning the originally planned business activi-
ties of Trianel Erdgasförderung Nordsee GmbH & Co. KG
domiciled in Aachen, the company was wound up. The
personally liable shareholder Trianel Erdgasförderung
Nordsee Verwaltungs GmbH merged with Trianel GmbH
on 16 December 2015 in accordance with the merger
agreement. It was entered in the trade register with
Aachen District Court on 26 February 2016.

9 | Management Report 2016
1.2 Business fields
Trianel GmbH’s business activities aim to enhance the
competitiveness and therefore independence of munici-
pal utilities. As the largest European municipal utilities
cooperation, Trianel GmbH opens up the potential of
liberalised energy markets by pooling similar inter-
ests from the municipal environment. For example, this
opens up business fields which would not be economi-
cally viable for individual municipal utilities.
Trianel GmbH operates in multiple sectors of the energy
industry throughout the entire value chain. Its core busi-
ness is the procurement and supply of energy. Our com-
pany procures energy for redistributors and municipal
utilities on wholesale markets. In this way, Trianel helps
municipal utilities supply their end customers. The second
focal point of Trianel GmbH is the development of large-
scale electricity generation and gas storage systems for
the energy industry. For existing projects, Trianel takes on
the energy business and commercial management and
system optimisation. Our third pillar is the planning and
support of business activities for the municipal utilities at
end customer levels, such as smart metering, energy effi-
ciency and expansion of electromobility.
All activities of Trianel GmbH are developed in close
coordination with the business aims of the share-
holder companies and tailored for their needs and
circumstances.
1.3 Important products and services, business
processes and projects
Trianel GmbH is active in all trading markets for electric-
ity and gas products, both as a trading partner for bilat-
eral transactions (OTC market) and as a member of the
most important energy exchanges. Market access for
electricity includes the German, Dutch, Belgian, Swiss
and French market areas. In the gas sector, Trianel cov-
ers the German market areas, for H-gas and L-gas, as
well as the liquid TTF market. Diverse sales products in
the delivery sector are based on activities on the market.
That allows the Trianel customer to purchase trade prod-
ucts directly.
Energy business products and services:
In 2016, the portfolio management on the procurement
and generation side again formed a main pillar of the
activities in the energy business sector. It consists of
electricity and gas procurement, marketing and securing
electricity from own generation plants and management
of storage facilities for our customers.
The performance achieved for each individual custom-
er in procurement portfolio management electricity was
measured objectively against a quantitative benchmark
again in 2016. Last year’s already high performance val-
ue of 3.60% was confirmed again at 3.49%. In gas pro-
curement, a performance of 2.89% was achieved. As
a result, Trianel GmbH secured an eight-figure procure-
ment cost advantage overall for its customers in the
electricity procurement portfolio management sector.
Trianel managed the generation portfolios for its cus-
tomers equally successfully. In the ranking of generation
portfolio managers for shareholders in the Trianel coal-
fired power station in Lünen, Trianel Finanzdienste
GmbH (TFD) once again came in first place when com-
paring all companies involved in power station optimi-
sation, generating a seven-figure revenue surplus for its
customers. In addition to this, TFD is expanding its role
as a comprehensive service provider for optimised mar-
keting of generation plants of all types.
Kohlekraftwerk Lünen (TKL) achieved an additional
€ 4 million via marketing activities in the spot, intraday
and balancing energy markets.
In addition to this, € 4 million was saved as part of
shortfall management compared with the failure reserve

10 | Management Report 2016 11 | Management Report 2016
contract. The shareholders in TKL benefit from both.
Trianel also benefits as part of the contractually defined
variable remuneration of these results achieved.
For Gaskraftwerk Hamm, the “warm reserve” agreed
with the TGH shareholders achieved a result of € 5.3
million. This value is approx. € 0.6 million above the
originally planned value. In addition to this, a block of
the power station was marketed to a market partner as
part of an option transaction for 2017. Compared with
leasing in 2016, the price for this has tripled. Trianel
receives a success-related remuneration from these
results for its service activities and therefore also benefit-
ed from the excellent management. However, the trans-
fer implemented in 2015 of Trianel’s Hamm gas-fired
power station to the warm power reserve in the report-
ing year eliminated the basis for services related to man-
aging the individual customer segments.
In sales of flexible and standard products for electricity
and gas, the introduction of the ¼-hour EPEX spot
auction contributed positively to minimising structural
risks from day one. When marketing renewable energy
sources in 2016, Trianel was able to rely on its years of
experience. Together with GESY Green Energy Systems
GmbH, Trianel GmbH expanded its green electricity
portfolio to almost 5,000 megawatts by the end of
2016. The portfolio consists primarily of wind energy.
The success story of the Energy Roof product continued
in 2016. At the end of the year, 50 municipal utilities
were already marketing the Energy Roof, including
large-scale municipal utility companies like Stadtwerke
München, entega and Stadtwerke Bochum. In addition
to the Energy Roof, further products were added, which
are all marketed to end customers together via the
Trianel PED digital platform.
In the energy efficiency sector, the regulatory require-
ments for companies to perform energy audits, led to
greater utilisation and corresponding results. The topic
of smart metering has passed all regulatory hurdles and
reached market maturity by passing the digitisation act.
However, the market is still hesitant, but demand is set
to increase for 2017.
Trianel has successfully completed the project to prepare
for the heightened requirements of the financial and
energy market regulation under EMIR and REMIT. In
operative regular operation, approx. 1,000 standard
transactions and approx. 10 non-standard transactions
are reported monthly. In addition to this, Trianel also per-
forms the REMIT reports for 340 other companies as part
of its supplier relationship or on a pure service basis.
Project development and projects
The project development business of Trianel GmbH now
focuses almost entirely on renewable energy projects.
For example, the second expansion stage of the Borkum
offshore wind farm was launched successfully in 2015.
Together with 23 municipal utilities from the Trianel
Group and EWE Oldenburg, Trianel GmbH will develop
the next 200 megawatts for the shareholders and
project partners. 2016 was dominated by the tenders
and award of the major subsections and start of equity
and borrowed capital process. The decision to build for
the offshore wind farm was passed by the shareholders
on 7 April 2017. The financial close was approved on
28 April 2017.
In the reporting year, Trianel Onshore Windkraftwerke
GmbH & Co. KG (TOW) concluded its investment activ-
ities as planned, and now operates eight wind farms,
with a total capacity of 101.3 megawatts after the lat-
est turbines were commissioned. The development pro-
jects which remain in the portfolio were sold with value
retention. Trianel Erneuerbare Energien GmbH & Co.
KG (TEE), founded in 2015, continued its investment ac-
tivities consistently in 2016. Investments were made in
eight wind farms and solar plants with a total of 138.6
megawatts. In addition to this, another roughly 200
megawatts are in development. Besides Trianel, 37 other

11 | Management Report 2016
municipal utilities and suppliers hold shares in TEE.
Investment activities are to end with a portfolio of at
least 275 megawatts by 2020 at the latest. In the on-
shore project development sector, an uninterrupted
transition of project development from TOW to TEE was
achieved. At the same time, the project volume imple-
mented successfully was increased significantly. In the
conventional major projects and pumped-storage hydro-
electric plants, the priority was to preserve the existing
options. This reduces the corresponding project devel-
opment activities significantly.
1.4 Management and control
In addition to Sven Becker as Management Spokesman,
Dr. Oliver Runte has been appointed as Managing Di-
rector of Trianel GmbH since 16 January 2017. Dr. Jörg
Vogt resigned from the Management Board on 31 De-
cember 2016. The Shareholders’ Committee and the
fifteen-strong Supervisory Board are among the other
corporate bodies.
2. STRATEGY AND MANAGEMENT OF THE COMPANY
2.1 Corporate strategy
Current orientation
Trianel GmbH sees itself as an energy service provider
that develops and provides services along the entire
value chain in particular for municipal utilities, which
enable individual municipal utilities to overcome market
entry barriers with size and specialisation advantages
and by pooling expertise. Trianel GmbH is supported by
municipal utilities. Trianel is the most successful Europe-
an municipal utilities cooperation in Germany and strives
to become the most significant value driver for munici-
pal utilities in Germany. After an extended phase of high
growth, Trianel is pursuing a strategy of consolidation
and selective growth. Project development and market
integration of renewable energy sources, advanced
energy services standardised in platforms and amalga-
mation of high-resolution data on generation, consump-
tion and customers, including the respective influencing
factors, are currently the fields for our selective growth.
They result from the new opportunities afforded by the
transformation of the energy industry due to digitisation
and the expansion of decentralised, renewable generation.
Trianel views itself as an independent company that
supports the interests of municipal utilities, which are
also independent. The business model borne by the
shareholders is aimed at common success. The advan-
tages developed by Trianel GmbH are to be passed on
to the shareholders as customers.
Thanks to our energy business trend scouting, Trianel
and its shareholders are in a position to identify possible
business opportunities resulting from the changing
general conditions at an early stage, to develop new
products and services given the right potential.
Products and services
For value-optimised consolidation and to grow with the
planned focus, Trianel adapts its product range and
services for the current general conditions. The adapta-
tions are made on the basis of an in-house market
appraisal and energy industry expert reports. The
diversified product portfolio stabilises Trianel GmbH’s
business development and facilitates comprehensive
support of shareholders and customers.
12 | Management Report 2016 13 | Management Report 2016
Customers
Independent municipal utilities and regional suppliers of
various sizes are typical customers of Trianel, which
offers them tailored and efficient solutions for their
respective individual requirements. High quality services
can be implemented at reasonable prices thanks to the
size and specialisation advantages.
Employees
In a highly-competitive environment, Trianel GmbH
develops advantages over its competitors through its
expert and committed colleagues with innovation,
product depth and maturity, as well as market penetra-
tion. The employees are one of the most important
assets at Trianel GmbH.
Trianel GmbH had a staff of 347 employees on
31 December 2016, representing an overall increase of
six employees (approx. 2%) compared to the end of
2015. Around 31% of the staff are female, and five of
these are second and third-level managers. At the end of
2016, the average age of staff in Trianel GmbH was 39.
The pillars of the personnel strategy are positioning
Trianel as an attractive employer, developing and
binding talent and optimisation of the structural and
process organisation. In 2016, Trianel GmbH positioned
itself again as a fair, respectful and attractive company
in Germany, once again earning the “Fair Company”
label from trade journal “Junge Karriere” (Young
Career) as so often before. In addition, Trianel success-
fully took part in the 2016 employer benchmark study
“Top Job 2017” for the first time. According to the
independent evaluation, Trianel is one of the best
employers among German medium-sized enterprises.
Binding and developing qualified staff remain a main
focus of human resources at Trianel. Regular status
evaluations in terms of success-critical skills for all
employees allow targeted and systematic derivation and
addressing of individual and strategic personnel training
requirements.
Society and the environment
Trianel GmbH was established as a result of the liberali-
sation of the energy markets and is therefore not only
wholly dedicated to competition, but also strives to
promote it through its activities. With its shareholders,
Trianel pursues the common goal of ensuring decentral-
ised citizen and customer-oriented energy supply. Strong
municipal utilities and regional suppliers now character-
ise the competition on the energy markets. Trianel views
the energy transition as an entrepreneurial opportunity.
Accordingly, Trianel and its shareholders are jointly and
actively shaping the energy transition as a holistic and
multi-sector project - also as a constructive and critical
dialogue partner for a consistent energy policy.
2.2 Internal corporate control system
The management board uses a variety of systems and
processes to control and monitor the company and to
analyse and document risks and opportunities of the
company. The control system focuses on the develop-
ment of profit and liquidity of the company and
monitoring risks. To map this system, profit contribu-
tions, structure costs and result figures are calculated.
The company’s liquidity is monitored via a rolling daily
liquidity forecast. By allocating risk capital for the risk
types relevant in our sector and continuous measure-
ment of the respective utilisation, we ensure that risks
and opportunities are dealt with appropriately. Extreme
value considerations provide findings on events not
covered by standard processes (see also Risk report).
Auditors commissioned by the shareholder companies
confirm compliance with the risk guideline on a
quarterly basis. The product development strategy is
characterised by careful observation of customer
requirements as well as the latest market developments
and the evaluation of the resulting future developments.
Important investment decisions are made using dis-
counted cash flow models. The Management Board
regularly checks the progress of the main projects and
monitors compliance with project plans and targets.

13 | Management Report 2016
The management and control mechanisms are adapted
to the growing company structures on an ongoing basis.
The Supervisory Board is regularly informed of all major
economic developments at Trianel GmbH.
The internal audit tasks are performed by an employee
of Trianel GmbH and external service providers who
each report directly to the management board.
Financial targets
Trianel GmbH’s business model is primarily aimed at
contributing to creating value for its customers with its
services. At the same time, Trianel strives to earn pre-tax
profits which are an appropriate return on equity. Boost-
ing the equity basis is another important financial target,
in order to finance the investments required to imple-
ment the energy transition, and put the development
goals into practice.
Moreover, Trianel wants to increase the value of the
company for its shareholders, not just by balance sheet
figures, but also contribute in particular to increasing
the company value for shareholders.
Non-financial targets
Shareholder and customer satisfaction is Trianel’s main
non-financial target. For this purpose, Trianel wants to
anticipate the arising demand of its customers as early
and well as possible. Trianel continuously and intensively
observes market and industry developments together
with its shareholders. With a rapid development of
potential business fields and products to market
maturity, Trianel also wants to give its shareholders and
customers a time and technical advantage in competi-
tion. Trianel also attempts to support and shape the
relevant energy policy topics to benefit an independent
municipal energy supply.
Trianel strives to reach as many shareholders as possible
with its products and services. At the same time, Trianel
also aims to achieve above-average customer satisfaction.
These two goals require utmost process quality and
reliability as a basis for service provision.
In addition to this, Trianel pursues and promotes socially
acceptable, sustainable and reliable power generation.
Trianel wants to continue the path it has taken in this
area and implement the energy transition entrepre-
neurially.
Employees are a key foundation for achieving any goals.
Their high qualifications and far above average commit-
ment are what makes success possible. Trianel has set
itself a goal to create conditions to optimally promote
the capability and capacity of its employees while
maintaining high employee satisfaction.
2.3 Innovation management
The changes in the energy business have now reached
an almost disruptive level. As an innovative service
company, Trianel GmbH views the changes as a result of
the implementation of the energy transition and the
development of the energy markets as an opportunity.
It is important for Trianel to continually earn the trust of
its shareholders and customers with new, innovative
products and services. The good relationship between
Trianel GmbH and its customers is also based on close
cooperation in a very early phase of product develop-
ment. Trianel constantly strives to be a step ahead of
the market with the market-oriented and customised
solutions it develops. The success of innovation man-
agement at Trianel GmbH is also revealed in particular in
repeated wins of the “TOP 100” innovation award.
Innovation management is embedded in our trend
scouting. New trends are systematically identified and
evaluated in a multi-stage process. In the past year,
innovation management was further intensified through
closer interaction of trend scouting, product develop-
ment and market introduction via pilot projects.

14 | Management Report 2016 15 | Management Report 2016
B. ECONOMIC REPORT
1. GENERAL CONDITIONS
In 2016, the German economy was in very good shape.
The primary energy consumption in Germany in 2016
rose 1.0% compared with the previous year, having
already risen by 0.9% in 2015. According to AGEB, the
reason for the rise was the positive economic develop-
ment, the population increase and the colder weather
compared with the previous year, with the resulting high-
er demand for heating energy. Added to this was the
fact that 2016 was a leap year with an additional day in
the energy consumption-intensive February.
The gross power consumption in Germany decreased by
0.4% to 592.7 billion kilowatt hours compared with the
previous year. According to AGEB, the gross power gen-
eration increased from 646.9 billion kilowatt hours to
648.2 billion kilowatt hours. The balance of the electric-
ity exchange with other countries was –55.4 billion kilo-
watt hours. Accordingly, Germany exported roughly the
annual electricity demand of Switzerland.
Renewable energy sources increased from 29.0% to
29.5% of German gross power generation, at 191.4
billion kilowatt hours, becoming the most important
energy source. Of the renewables, wind energy account-
ed for the highest percentage of gross power genera-
tion at roughly 12.3% and roughly 80 billion kilowatt
hours. This was followed by biomass with a slight decline
to 7.0% and photovoltaics with a slight decrease to 5.9%.
The gross power generation from natural gas increased
significantly from 62.0 billion kilowatt hours to 78.5
billion kilowatt hours, and thus a percentage of 12.1%.
In particular, the reason was the temporary loss of nu-
clear generation capacity in other European countries,
which led to increasing prices on the exchange. Pow-
er generation from hard coal and lignite decreased rel-
atively significantly from 272.2 billion kilowatt hours to
260 billion kilowatt hours. However, at 41.1% of the
total electricity mix, it remains an important part. Due
to power station closures, the gross power generation
from nuclear energy decreased by 6.9 billion kilowatt
hours to roughly 85 billion kilowatt hours and 13.1%.
In 2016, the exchange electricity price in Germany
dropped again, with the average on the spot market
at 2.99 cents/kWh. The prices did not recover from the
11-year low reached in the previous year. In spite of the
problems with the French nuclear power stations in
autumn 2016, the average price also decreased in France.
It decreased from 3.84 cents/kWh in 2015 to 3.68 cents/
kWh in 2016. The political measures to support the CO2
pollution certificates had little success in 2016. In spite
of the introduction of the market stability reserve, the
price for European Emission Allowances (EUA) at EEX did
not stay above € 8/t CO2. In the first months of 2016,
the value of the certificates decreased by almost half
and closed at just € 6.57/t CO2 after a volatile lateral
movement.
The primary energy consumption of petroleum rose by
2% to 4,562 PJ or 155.8 million tonnes of coal equiva-
lent (CE) in 2016. Compared with 2015, consumption
of natural gas increased by 8.7% to 3043 PJ or 103.8
million tonnes of CE. The contribution of nuclear power
to German primary energy consumption was subject to
a significant decline of 8% again, largely due to decom-
missioning of capacities.
At a national level, 2016 was shaped by important
energy policy decisions: on electricity market 2.0, on
the German Renewable Energy Sources Act (EEG) and
the CHP Act (KWKG) and digitisation of the energy
transition.
The restructuring of the electricity market was largely
concerned with the question of how reinvestment and
new investments in the necessary guaranteed power
can be ensured with a continuously increasing percent-
age of renewable energy sources. Fundamentally, the
legislature decided to continue the energy only market
for this purpose, supplementing various capacity ele-
ments. Like many other companies in the energy
industry, Trianel believes that the amendment of the

15 | Management Report 2016
electricity market act does not reliably ensure the nec-
essary investments in guaranteed power. In addition to
this, Trianel does not believe that the provision of securi-
ty meets the requirements under European law.
The previous power station plans in Southern Germany
are at risk based on the new legislation, as the text of the
new law no longer requires capacity tenders, with the
transmission system operators (TSO) to negotiate capac-
ities finally and bilaterally with the German Federal Net-
work Agency, which the TSO plan and build themselves.
Trianel also views critically the insufficient compensation
under the Electricity Market Act for plants which must
be used for grid stabilisation (redispatch) at the request
of the TSO.
With the 2017 German Renewable Energy Sources Act
(EEG 2017), the legislature is implementing a systemic
change in support for renewable energy sources: the
transition in support from fixed remuneration to a quan-
tity tender with maximum prices. At the same time, the
quantity framework of the German Renewable Energy
Sources Act (EEG) 2014 was changed, whereby the tar-
get of 40% to 45% of renewable electricity in the gross
electricity consumption in 2025 remains unchanged.
The previous experiences from the pilot tenders for
ground-mounted PV plants reveal a significant down-
ward trend in bidding levels, and thus significantly
decreasing costs for supporting renewable energy sourc-
es. However, to date, there are no final findings on the
percentage of ground-mounted projects actually im-
plemented. Trianel successfully participated in multiple
rounds of tenders.
Due to concerns on the part of the EU Commission
regarding the subsidy law status, the CHP Act (KWKG),
that entered into force on 1 January 2016, had to be
amended in 2016. The most important change is the
new tender segment from 1–50 megawatts. In this class,
the support level for CHP plants is only determined in
competitive processes. After more than three years of
preliminary work, the German Bundestag passed the
law to digitise the energy transition in June 2016. In
2032, 95% of all metering points are to be equipped
with modern measuring equipment. The rollout includes
both simple digital meters and modern measuring
equipment, which facilitate communication and control
of the renewable energy plants and electricity consum-
ers. The data collected and prepared in the smart meter
gateway also facilitates more reliable grid control. The
law results in interesting new business fields for Trianel.
The regulatory requirements and stipulations of the
financial market authority under MiFiD II cover the ener-
gy sector increasingly. Trianel, along with the entire sec-
tor, greatly regret that fewer and fewer exceptions are
allowed for the energy sector. Accordingly the differenti-
ation in political debates, justified on its merits, between
the system-relevant world of finance and physically driv-
en procurement trade for electricity and gas, is disap-
pearing more and more. The regulatory requirements
per EMIR and REMIT in the past two years have faced
Trianel and the sector as a whole with a major challenge.
However, Trianel has not only succeeded in meeting the
necessary requirements, it has also managed to position
itself as a service provider for regulatory reports by third
parties.
Delays in market deregulation in Switzerland persist.
It remains unclear when the market will be deregulat-
ed for customers with less than 100 megawatt hours
of annual electricity sales. For Trianel, that means that
the growth potential for energy industry services is still
low although the structural requirements in this market
with its granularity offer ideal cooperation requirements.
However, incentives for a greater market orientation of
municipal utilities and redistributors were derived from
a judgement by the Federal Supreme Court, which stip-
ulated that free and “captive” customers must not be
priced based on different logic.
16 | Management Report 2016 17 | Management Report 2016
For the 2016 financial year, the planned pre-tax result
of € 0.4 million was not reached. The result of € –3.2
million represents a shortfall of € 3.6 million. The
result was largely due to the continuing asset crisis,
which meant that significant losses from marketing
our virtual long-term energy supply segment in the
Lünen coal-fired power station and the storage bundles
of Epe natural gas storage facility had to be absorbed.
Failure to reach targets for intraday, proprietary trading
and market access business and in direct marketing of
renewable generation capacities also had a significant
influence on the annual result. These effects were not
compensated by successful development of wind pow-
er and photovoltaic projects, and the effects of capitalis-
ing accounts receivable from asserted feed management
(FeMan) damage claims and writing up of accounts
receivable from the insolvent Dutch subsidiary (TEBV).
The equity ratio of 24% only decreased slightly com-
pared with the previous year (28%). As in previous
years, the balance sheet total is also characterised by
the high level of accounts receivable with simultaneous-
ly high accounts payable. Both reflect the established
process in energy wholesale trade of invoicing and
paying for energy accounts on a monthly basis. This
means that at the end of the year, the accounts
receivable and payable from deliveries in December –
one of the months with the highest turnover – must be
stated regularly. Since Trianel customers are mainly
municipal utility companies with a good credit rating
and/or their subsidiaries, both with very low default
risks, we regard the equity level as being stable and
conservative.
The company’s liquidity increased over the course of the
year by € 9.5 million to € 32.5 million and was in an ad-
equate situation at any time. The primary reason for the
increase in liquid assets as of 31 December 2016 were
improved working capital effects, which overcompensat-
ed the 2016 investments in Trianel Erneuerbare Energien
GmbH & Co. KG (TEE) and interest deferrals for Trianel
Windkraftwerk Borkum GmbH & Co. KG and Trianel
Gaskraftwerk Hamm GmbH & Co. KG.
On the cut off date of 31 December 2016, the
number of employees increased marginally by 6 to
347 compared with the previous year.
2. BUSINESS DEVELOPMENT
“As Trianel’s customers are largely municipal utilities, we view the equity base as sound and conservative.”
17 | Management Report 2016
3. COMPANY SITUATION
3.1 Earnings situation
The earnings before tax of Trianel GmbH decreased
significantly by € 3,447 thousand compared with the
previous year to € –3,234 thousand. The negative
earnings before tax in 2016 is largely due to the losses
from the power purchase obligations of the Lünen
coal-fired power station and the storage facility use
contract with Epe gas storage facility, which could
not be compensated even with successful activities
in the development of renewable power station
projects and one-off effects from asserted damage
claims (FeMan) and write-ups of accounts receivable
vis-à-vis the insolvent Dutch subsidiary (TEBV). The risk
provisions for Trianel GmbH’s virtual long-term energy
supply segment in the Trianel Lünen coal-fired power
station (TKL) and our stored bundle shares in the
Trianel Epe natural gas storage facility (TGE) was
increased slightly.
Taxes on income accrued to the amount of € 899
thousand (prev. year € 85 thousand) and other taxes
were € 6 thousand (prev. year € 5 thousand), resulting
in a loss for the year of € 4,139 thousand (prev. year
annual net income of € 124 thousand). € 899 thousand
of the tax expenditures were incurred entirely for cor-
poration tax for previous years.
An analysis of the consolidated net income, which
includes Trianel Finanzdienste GmbH in particular in
addition to Trianel GmbH, reveals the following compo-
nents of net income:
The income after tax is € –4,126 thousand (prev. year
€ +179 thousand) and is dominated by the annual
financial statements of Trianel GmbH and the losses
posted there from power purchase obligations and
the storage facility use contract. Taking into account
the financial result of € 662 thousand (prev. year
€ 929 thousand) and the taxes on income of
€ –906 thousand (prev. year € –94 thousand),
the consolidated loss for the year amounted to € 4,132
thousand (prev. year € 174 thousand).
Trianel GmbH’s turnover largely reflects its function as
providers of market access for customers, short-term
optimisation transactions and proprietary trading
activities. Added to this are the activities for third parties
in procuring and marketing energy, which in turn are
associated with corresponding back-to-back transac-
tions on the wholesale market. The resulting energy
purchases are mapped in the costs of materials of the
profit and loss statement of Trianel GmbH. There were
hardly any effects on the net income. Fundamentally,
the absolute turnover total and the associated total
material expenditures do not allow any significant
conclusions to be drawn on the economic success of
the company.
The sales proceeds amounted to € 2,136 million in the
2016 financial year (prev. year € 2,127 million) and thus
increased by 0.4% compared with the previous year.
In order to increase the clarity, the proprietary turnover
was balanced with the corresponding material expendi-
tures in the reporting year, totalling € 2,494 million
(prev. year € 2,357 million).
Other operating income rose by € 5,738 thousand to
€ 17,074 thousand. They essentially include income
from the reversal of short-term provisions (€ 4,371
thousand; prev. year € 332 thousand) and income from
write-up of accounts receivable from the TEBV insolven-
cy (€ 3,900 thousand; prev. year € 0 thousand) as well
as income from compensation and damage claims
(€ 3,573 thousand; prev. year € 198 thousand).
At 98.4%, the cost of materials share rose slightly
compared to the previous year.
Personnel expenses rose from € 27,635 thousand to
€ 29,978 thousand.

18 | Management Report 2016 19 | Management Report 2016
Other operating expenditures totalled € 20,511 thousand,
down from € 23,060 thousand in the previous year.
The non-adjusted financial result amounted to € 2,114
thousand (prev. year € 2,022 thousand). Adjusted for
the neutral effects from the deduction of accounts
receivable and addition of provisions totalling € –1,073
thousand (prev. year € 852 thousand), the resulting
adjusted financial result is € 3,187 thousand (prev. year
€ 2,873 thousand). The result from participating inter-
ests, at € 1,725 thousand (prev. year € 2,124 thousand),
decreased slightly compared to the previous year.
The pressure on net income in the sector can also be
seen in Trianel’s 2016 accounts. To tackle this develop-
ment head-on, a comprehensive restructuring and
efficiency boosting program was passed to implement
significant cost savings in personnel expenditures and
third-party services by 2019. Based on the success of
measures already in implementation, we assume that
Trianel will achieve sustainable positive operating
income once the project has been implemented fully.
3.2 Financial situation
Trianel GmbH’s operating cashflow in the reporting year
was € 12,581 thousand, following € –19,227 thousand
in the previous year. The positive cash flow was primar-
ily due to an increase in liabilities, whereby the highest
growth was in the accounts payable to associate com-
panies, at € 13,831 thousand. The cashflow from invest-
ment activities totalling € 2,687 thousand (prev. year
€ –11,579 thousand) involved investments in intangible
assets, current investments in the participating interest
in Trianel Erneuerbare Energien GmbH & Co. KG and,
offsetting these, the write-down of the participating
interest in Trianel Onshore Windkraftwerke GmbH
& Co. KG. The cashflow from financing activities total-
ling € –5,850 thousand (prev. year € –3,748 thousand)
contains loan repayments. The cashflow from invest-
ment activities in the Group was € –5,850 thousand
following € –5,236 thousand in the previous year. Over-
all, the total financial resources increased to € 32,528
thousand (prev. year € 23,021 thousand) as of the bal-
ance sheet date. The Group had total financial resources
of € 36,298 (prev. year € 27,152 thousand). The invest-
ments planned for the years to come are to be refinanced
suitably in 2017 with matching maturities. Additional
borrowing over a 7-year period will give Trianel the secu-
rity and scope necessary for its future business orien-
tation in the transition phase. Over all, the financial
situation in the 2016 financial year was adequate at all
times.
3.3 Asset situation
The balance sheet total of Trianel GmbH was € 351,540
thousand on 31 December 2016 (balance sheet total of
the Group: € 354,329 thousand) and thus increased on
the previous year by € 33,857 thousand or 10.7%
(Group: € 35,316 thousand).
On the assets side, the increase is largely due to the
significant increase in current assets.
In 2016, the inventories of Trianel GmbH increased by
€ 573 thousand (Group: € 573 thousand) to € 3,908
thousand (Group: € 3,908 thousand). The inventories
primarily comprise Trianel GmbH’s share of working gas
which was fed to the caverns of Trianel Gasspeicher Epe
GmbH & Co. KG, as well as unfinished service resulting
from advance performance for project developments and
rights.
The accounts receivable and other assets totalling
€ 213,755 thousand (31/12/2015: € 190,049 thousand)
remained unchanged at 60.8% (31/12/2015: 59.8%)
of the balance sheet total, and are the largest item on
the assets side, and have increased significantly. Trade
receivables account for the largest share of this develop-
ment, increasing considerably by € 18,095 thousand to
€ 105,260 thousand, and the other assets, which

19 | Management Report 2016
increased by € 11,839 thousand to € 50,861 thousand.
As in the previous year, trade receivables were balanced
against similar trade payables from the same business
partners. On 31 December 2016, trade receivables and
trade payables were balanced to the value of € 301,207
thousand, following an offset of € 248,251 thousand
on the previous balance sheet date.
The liquid funds increased significantly by € 9,508
thousand to € 32,528 thousand. On the liabilities side,
the increase in the balance sheet total is largely due to
the increase in accounts payable.
In the financial year, Trianel GmbH’s equity ratio
decreased to 23.9% (31/12/2015: 27.7%). The equity
ratio for the Group dropped to 23.7%. In absolute
figures, the equity fell by € 4,139 thousand to € 83,938
thousand. This change is the result of the loss for the
year 2016 of € 4,139 thousand (consolidated loss for
the year 2016: € 4,132 thousand). The provisions
decreased by a total of € 4,068 thousand to € 45,414
thousand. The other provisions dropped by € 4,096
thousand to € 45,312 thousand (31/12/2015: € 49,408
thousand), and primarily comprise provisions for antici-
pated losses from pending transactions (€ 38,486
thousand; 31/12/2015: € 41,742 thousand) and for
outstanding invoices (€ 612 thousand; 31/12/2015:
€ 2,634 thousand).
The development of the balance sheet structure and the
key balance sheet figures largely matched the budget,
even if individual investments in participating interests
were not made and long-term loans were not taken on
in 2016.

20 | Management Report 2016 21 | Management Report 2016
1. FORECAST
C. REPORT ON FORECAST, OPPORTUNITIES AND RISKS
1.1 Strategic orientation of Trianel GmbH in the
next two financial years
In the next few years, Trianel GmbH’s business activities
will be highly affected by the following developments:
1. Digitisation of the energy business
2. Decentralisation of generation
3. Consolidation of markets for
energy business services
With Trianel DESK, Trianel plays a pioneering role in dig-
itising energy business processes. From forecasts to
pricing, portfolio structuring to trading standard and
non-standard products, all energy business procurement
and sales functions are provided interactively in a con-
sistent, web-based customer interface. Roughly 10
municipal utilities with different performance require-
ments were integrated in the web-based Trianel DESK
platform and manage their electricity and gas portfo-
lios digitally, simply and efficiently. In the last twelve
months, Trianel DESK was expanded with a wide range
of functions for managing electricity and gas portfolios.
Among other things, contribution margin calculation,
load cycle calculation per upload, various risk and mar-
ket valuation functions and currency conversion for
Euros and Swiss francs applications were added.
Digital processes are the basis for implementing future
(detailed and decentralised) business models that a
municipal utility must incorporate to satisfy changing
customer requirements. The system infrastructure pres-
ent in the company is focused on mapping mass pro-
cesses and only suitable for implementing detailed
business models to a limited extent and with high adap-
tation costs. Establishing a central platform for the pro-
cessing and invoicing such complex products could be
a sustainable business for Trianel. Trianel already started
creating a digital business model for municipal utilities
in the end customer market with the Trianel platform for
energy services, Trianel PED. Trianel PED is a digital plat-
form that can coordinate and manage providers, trades-
people and end customers.
PV systems, heating systems and charging stations for
electric vehicles are currently marketed via Trianel PED.
Trianel agreed a strategic partnership for smart metering
with rku.it GmbH from Herne in early 2016, to meet the
increasing legal requirements at an early stage. Helping
municipal utility sales departments market these new
products is another growth area for the future.
A mega-trend in the energy business, decentralisation
of generation via weather-dependent generation plants,
will provide further impetus for the business develop-
ment of Trianel GmbH. Trianel GmbH intends to con-
tinue to position itself as the leading provider in the
municipal environment, and in the industrial environ-
ment for optimised marketing and the use of all forms
of physical and virtual generation units. Managing and
optimising flexibilities as part of demand response man-
agement will be key challenges for shaping the energy
transition. The further increase of weather-dependent
energy feed-in and the resulting price pressure on the
electricity exchanges will lead to a replacement of base
load power stations for providing balancing energy.
Using existing load and generation flexibilities in the
industrial environments in conjunction with a “24/7
Market Access” service product is a new area of activity
for Trianel GmbH.
Trianel is responding to the current trend away from
structured procurement to full supply in its core business
with appropriate products, whereby forecast improve-
ments and intraday management based on online meas-
urement data will contribute to optimisation. In order
to achieve economies of scale and portfolio advantages,

21 | Management Report 2016
Trianel aims to grow its market share further in this core
segment, focusing increasingly on large municipal
utilities and regional cooperations. Companies and
regional purchasing groups, which previously covered
the wholesale value chain stage independently, are in-
creasingly forced to outsource supplementary servic-
es to fulfil the advancing regulatory requirements, for
example reporting requirements and balancing group
compliance.
As in the previous years, the consolidation of the price
level for direct marketing based on the market bonus
model continued in 2016. In spite of the continued
competitive pressure, Trianel succeeded in securing a
joint marketing portfolio of roughly 5,000 megawatts
for 2017. Trianel operates successfully in this business
field together with its joint venture GESY Green Energy
Systems GmbH, a marketing platform for medium-sized
operators of renewable generation plants. Mandatory
direct marketing has created good fundamental condi-
tions for this. In this way, Trianel is expanding its expe-
rience as direct marketers into new segments. After the
successful launch of balancing energy marketing, mar-
keting quantities grew strongly. In the industrial cus-
tomer environment in particular, we recorded significant
gains. Trianel GmbH will continue this success story
with its “Flexibility Management” and “Market Access”
products.
In future, Trianel expects increased demand from
municipal utilities for renewable generation capacities.
Accordingly, Trianel GmbH has continued to focus its
project development on developing renewable genera-
tion plants since 2014. In the 2016 reporting year, pro-
ject development of the second construction phase of
the Borkum wind farm continued, with an expected
investment volume of approximately € 800 million.
The activities focus on implementing tenders and pre-
paring for the decision to build. For this purpose, the
offshore team was expanded and will be working on
the TWB, TWB II and the shared infrastructure company
IWB projects in the next few years.
In the onshore wind and photovoltaics sectors, project
development and procurement is the priority for Trianel
Erneuerbare Energien GmbH (TEE), with equity of € 140
million.
In order to serve growing requirements professionally
and efficiently, Trianel will restructure its IT and process
environment fundamentally, to meet both the require-
ments on wholesale markets and the individual custom-
er requirements of the municipal utilities.

22 | Management Report 2016 23 | Management Report 2016
1.2 Anticipated earnings situation
For 2017 and subsequent years in the medium term
planning period, Trianel expects continued significant
burdens from the long-term energy supply segment and
gas storage bundles and participating interests in a gas-
fired power station. Also in light of the margin pressure
in operative business fields, Trianel has therefore under-
taken a comprehensive restructuring project (“Horizon
2018”). In addition to improvements in supporting and
optimising business processes, this also includes organ-
isational adjustments and a review of product portfolio
compositions. As part of this, Trianel is considering sell-
ing individual business activities.
Trianel’s activities are grouped in three business fields:
Midstream, project development and new business
(municipal utilities sales solutions). In addition, the mar-
keting of power stations and gas storage bundles and
the participating interest and financial result have more
significant effects on the company’s net income.
Midstream: In particular, the trade and portfolio man-
agement activities, and the IT skills required for this are
pooled here. In addition to this, operational manage-
ment services will remain a key aspect of the profitabil-
ity of this business field in 2017. The targeted product
portfolio streamlining and the efficiency boosting and
cost reduction project “Horizon 2018” take the increas-
ing pressure on margins into account. The targeted cost
reductions include both third-party services and person-
nel costs.
Project development: After successful orientation of the
activities from conventional to regenerative power sta-
tion projects, the business field focuses exclusively on
developing photovoltaics and wind generation projects.
This also includes construction of a second offshore
wind farm off Borkum. The decision to build has already
been made for this. New business/sales solutions for
municipal utilities: This is to focus on “energy-related
services” and “smart meters” as part of the increasing
digitisation of the energy sector. As part of the concen-
tration on this, the sale of the successfully positioned
sales and logistics platform “Trianel PED” was initiat-
ed as a restructuring measure. This will result in positive
one-off effects for the 2017 financial year.
With the measures taken, Trianel expects that 2017,
when first groundbreaking steps will be taken as part
of restructuring Trianel, will end with a slightly positive
net income. In the following years, the full implemen-
tation of the restructuring measures will lead to sus-
tainable stabilisation of the net income situation in an
environment which remains difficult. Opportunities and
risks result largely from the regulatory environment and
the change in phasing out existing excess capacity in the
conventional power station mix. Trading activities are
naturally associated with more volatile result develop-
ment than our service activities. To restrict the resulting
risks, further limits were introduced to control the activ-
ities. In addition, the processes and systems will also be
continuously assessed for potential for improvement and
the organisational structure is developed accordingly if
necessary in 2017. As has now been established, it may
not be possible to streamline business activities through
the planned sales in every individual case. By contrast,
the targeted efficiency boosting and cost saving objec-
tives should be achieved faster than planned according
to current assessments.
The key performance figures which guide Trianel’s busi-
ness indicate a gross margin (revenues less cost of mate-
rials) of € 48.4 million, a pre-tax result of € 0.7 million,
investments of € 16.6 million for the 2017 budget year.
The budgeted staff level was 329 employees; however,
it will develop depending on the speed of implementa-
tion of the restructuring measures.

23 | Management Report 2016
1.3 Anticipated financial situation
For 2017, Trianel expects similar investment expenditure
on intangible assets, tangible assets and financial assets
as 2016, concentrated in particular on its commitments
in the renewable energy sector. The current funding re-
quirements will be financed as previously via bank loans
and own cash flow. Trianel succeeded in expanding its
credit lines in the 2nd quarter of 2017 to give us greater
flexibility. The planned investments in financial assets are
to be refinanced suitably by placing a fixed term bond
with matching maturities.
The new clearing partner has given the opportunity to
replace funds previously bound in initial margins via
bank guarantees, freeing up liquidity. In the 1st quarter
of 2017, a new surety line was opened primarily for this
purpose.
Trianel still expects no restrictions in servicing of debts.
1.4 General statement on the business outlook
and development forecast of Trianel GmbH by cor-
porate management
The efficiency boosting targets set with the “Horizon
2018” restructuring project incorporate all business
activities and Trianel’s cross-cutting functions. Among
other things, this will focus on pooling IT-related and
energy logistics processes in midstream sectors. Here,
efficiency increases are to be achieved via increasing
standardisation and automation as well as clear respon-
sibilities. In addition to quality improvements and
increasing process speeds, Trianel expects significant
cost reductions resulting from this in the next two years.
The situation in the industry still has serious repercus-
sions for many market participants. In spite of this
challenging framework, Trianel believes it is well-posi-
tioned for the upcoming years based on the flexibility
it has exhibited in the past and in particular due to the
optimisation measures already taken and planned for
the future. The employees’ approach to opportunities
makes us optimistic that Trianel GmbH will continue to
confirm its status as a highly active and key partner for
the municipal utility shareholders in coping with the
challenges. In spite of this, Trianel will not be able to
extricate itself from the general industry development,
in particular in the power station market.
“With the measures introduced, Trianel assumes that the net income for 2017 will be slightly positive.”

24 | Management Report 2016 25 | Management Report 2016
The extent of closures of power station capacities and
the further development of energy and raw material
prices determine the profitability of our fuel-based asset
items to a significant extent. The current market design
(Energy-only 2.0 market) has not led to a market recov-
ery in the short term. Based on the decommissioning
of many nuclear power stations in the next legislative
period, combined with the closure of lignite capacities
set down in the Energy Industry Act (EnWG) and given
the current list of the notifications of power station clo-
sures at the Federal Network Agency and the continued
high political pressure on the introduction of emission-
based control elements in addition to ETS, we still expect
an improvement in the relevant price spreads, which will
have a positive influence on the profitability of highly
efficient modern power stations.
Also due to the current difficult economic situation of
the Trianel Group’s conventional assets (including gas
storage facilities), the associated services are under pres-
sure as part of commercial operations management.
As the service fees are increasingly success-based, a
clear commitment to high quality value-added servic-
es must be displayed. The associated risk of inadequate
performance is counterbalanced by the opportunity
to participate in the success through profit sharing on
above-expected performance. In particular for the cur-
rent warm reserve phase of Trianel’s Hamm-Uentrop
gas-fired power station (2016 to 2018), we have agreed
a purely success-based compensation model with the
power station company. In addition to successful use of
all market opportunities, we can also benefit from
a positive development of the market environment.
With regard to projects in the renewable energy sector,
there are opportunities as a result of a favourable devel-
opment of system prices and financing costs. The exist-
ing tender process for photovoltaics and the upcoming
tender process for wind from 2017 is exerting significant
cost pressure in the project development sector. Trianel
sees opportunities here to pool activities in this market
with further professionalisation.
The energy transition requires municipal utilities to
expand and adapt existing procurement strategies. They
currently have to work on areas such as direct market-
ing, generation from renewable energy sources, smart
metering, decentralised generation and flexibility mar-
keting. Trianel sees good opportunities to offer munic-
ipal utilities increased support in these new challenges
over the coming years with innovative services and
products.
Increasing pressure on margins for most of the munici-
pal utilities applies growing pressure on the company to
be efficient. This will enhance the trend to more cooper-
ation and optimisation in procurement of electricity and
gas. The “cooperation of cooperations” area will also
become increasingly dynamic. Regional cooperations in
particular must assess whether they can and want to
master the increasingly strict regulatory requirements,
especially reporting requirements and balancing group
compliance on their own. For example, Trianel GmbH’s
existing 24/7 services are ideal to efficiently support oth-
er cooperations and even larger municipal utilities which
have processed all wholesale processes independently.
Trianel plays a pioneering role in digitisation and aims
to remain market leader in the automation of energy
business processes and customer interfaces. The Trianel
DESK platform takes energy business services to a new
dimension that offers customers greater benefits and
efficiency potential. As a result, Trianel expects to expand
its market share in the saturated market of energy ser-
vices with continued high margin pressure, and increase
its profitability.
In future, municipal utilities will be forced to utilise as
yet unused own generation potential via professional
optimisation. Pilot projects in this area have already
revealed considerable potential. Not least the obligatory
direct marketing of CHP plants in the current CHP
2. OPPORTUNITY REPORT
25 | Management Report 2016
Act (KWKG) offers significant growth potential for Trianel
GmbH’s professional wholesale generation marketing
services.
For 2017, Trianel’s goal is to increasingly automate pro-
cesses in the rapidly growing intraday trading, to enable
it to implement further volume growth in short-term
trading. In spot and futures trading, Trianel offers a mar-
ket platform for external trade partners, which enables
them to conclude wholesale transactions. That gives
external market participants access to wholesale activi-
ties and reduces the costs of credit lines, as Trianel
GmbH is a central trade partner. As a result, we see
significant development opportunities here.
The arrival of digitisation in the energy business and
thus also into the operative business of municipal util-
ities offers Trianel GmbH immense opportunities. The
system infrastructure in the companies focused on
mass processes is not able to cope with the growing
requirements of digitisation and must tackle the detail
and complexity of new business models. There are
opportunities here to build many new products and
the associated processes centrally, and develop a sus-
tainable business model from this.

26 | Management Report 2016 27 | Management Report 2016
The business activity of Trianel GmbH demands that risks
are consciously entered into in order to take advantage
of opportunities. Also the development of new business
fields and markets means that the resulting risks and
opportunities must be integrated into a comprehensive
risk and opportunity management system.
Since an event can lead to both opportunities and risks,
depending on its nature, the term “risk” will be used
below to describe both opportunities and risks.
3.1 Risk management system
Trianel GmbH’s risk-bearing capacity forms the frame-
work for the risk management system. This is aligned
with the equity capital and liquid funds available, and
derived from the company’s risk strategy.
Risk management organisation
Risk controlling is responsible for the creation, develop-
ment and implementation of guidelines, methods and
processes for risk assessment and management, and for
reporting on the risk situation. Central risk management
also monitors compliance with risk guidelines and
defined risk limits. In order to support the central unit,
management appoints risk officers for every organisa-
tional unit. The risk officers are responsible for the con-
trol and development tasks assigned to them within the
risk management system. In addition to the convention-
al risk management tasks, Trianel GmbH’s central risk
management also covers the compliance function. The
compliance management system implemented at Trianel
ensures that compliance risks are identified in good time
and the employees are aware of this and violations of
rules are prevented or discovered. The central compli-
ance body is supported in its implementation by
compliance field delegates in various organisational
units. Regular exchanges by all compliance officers and
monitoring of the effectiveness and systematic develop-
ment of the compliance management system are
guaranteed by the compliance committee.
The Trianel GmbH Risk Committee regularly meets to
discuss the implementation and need for changes to
the risk management system. In addition to this, the
risk committee is involved in specific matters such as
the development of solution and decision-making sub-
missions and in new risk-relevant matters, market and
product clearances, business partner clearances as part
of know-your-customer processes, limit assignments for
trade partners and allocation of risk capital to risk areas.
The risk management system fulfils the legal require-
ments. Since Trianel GmbH acts as a service provider
for Trianel Finanzdienste GmbH, the standards and or-
dinances which apply to financial service providers al-
so apply to the Trianel GmbH risk management system.
The suitability and functionality of the risk management
system are monitored by internal audit, currently per-
formed by two audit service providers, as well as of the
external auditors commissioned by the shareholders.
Risk management process
The professionalisation of the risk management process
at Trianel GmbH comprises the systematic identification,
evaluation, aggregation, control and monitoring of risks
and internal and external reporting.
In order to guarantee systematic risk identification,
various risk areas and fields are defined. They are areas
for monitoring which could result in risks for Trianel
GmbH. Risk detection also includes identifying interde-
pendences between risks.
Risk control comprises all measures and tools used for
avoiding, reducing or shifting detected risks, as well as
consciously entering into certain (residual) risks. The
control period is determined by the underlying risks.
Trianel GmbH’s risk-bearing capacity and the provision
of risk capital derived from this form the framework
for risk management. The risk capital approved by the
Shareholders’ Meeting represents the upper limit of the
3. RISK REPORT

27 | Management Report 2016
overall risk accepted. The risk capital allocation to the
risk areas which are defined in this context – market,
credit, operational and other risks – is approved by the
Management Board.
In order to evaluate the effectiveness of the risk control
measures which have been put in place, the target and
actual risk situations are continuously compared as part
of risk monitoring. In this context, the amount and
distribution of the approved risk capital are regularly
assessed for appropriateness.
Internal and external addressees are informed on a regu-
lar basis of the current results, liquidity and risk situation
as well as concerning the accounting precautions taken.
The frequency, type and scope of the reporting vary
according to the type and the significance of the risk.
The Supervisory Board and Shareholders’ Meeting were
informed of the current results, liquidity and risk situa-
tion on a quarterly basis during the reporting year.
The specific design of the phases of the risk manage-
ment process is documented per risk area and regularly
checked for a need to update.
3.2 Risk areas and individual risks
The main risks of Trianel GmbH are allocated to the fol-
lowing risk areas in the risk management process.
Market risks
Market risks can significantly influence the results situa-
tion at Trianel GmbH in the form of market price fluctu-
ations, market liquidity changes and quantity deviations.
Market risks as a result of price fluctuations result from
open items, for example. These arise when the volume
of purchasing transactions is greater or less than the
sales transactions of similar products. The related mar-
ket risk is determined by the extent of the discrepancy,
and by the course the price fluctuation takes. Due to the
sales, direct marketing and trading activities of the com-
pany, together with its holdings in power stations, the
gas storage facility in Epe, the offshore wind farm off
Borkum and various onshore wind farms, market price
developments and open items in the commodities elec-
tricity, gas and CO2 are particularly relevant to the com-
pany’s success.
If the supply of certain products or the demand for them
fall, their tradability decreases and the market liquid-
ity drops. This creates the risk for Trianel GmbH that
items which are still open can only be closed to a lim-
ited degree, or closed at less favourable conditions. To
minimise risks, volume limitations are used for certain
products and time periods; adherence to these is moni-
tored each working day.
If physical delivery transactions are concluded on the
basis of forecast generation or consumption quantities,
deviations between the actual physical fulfilment and
the planned quantity may occur, leading to open items.
Deviations from the forecast must be offset, and thus
incur additional costs. Further changes in quantity can
occur due to failed or restricted physical deliveries, for
example as a result of generation, transportation or
storage capacity shortfalls. Measures such as regular
updates of forecast load curves, agreement of tolerance
ranges in combination with a transfer of the risk to third
parties when the tolerances are exceeded, as well as
optimisations on the basis of the latest forecast can
reduce this type of risk.
For example, the risk of open forward transactions is
assessed and limited by calculating the value-at-risk
(VaR) figure each working day, with a confidence lev-
el of 99%, and a defined holding period. This means
that the loss due to an open trading position within the
holding period does not exceed the calculated value to
a degree of probability of 99%. The VaR is determined
and monitored both mandate-specifically for individual
assets and for the trade items.
28 | Management Report 2016 29 | Management Report 2016
In the 2016 financial year, the VaR figure for the trade
mandate was between € 97.1 and € 1,267.6 thousand
and always within the specified VaR limits.
The risk reporting is supplemented by stress values.
Stress tests are used to examine the effects of external
market situations on the portfolio values. The result
specified is the assumed worst case loss that can be
expected within the holding period.
In addition, the profit-at-risk (PaR) is calculated with a
confidence level of 99% to evaluate open spot and
balancing energy positions. This process calculates the
potential value deterioration, to a degree of probability
of 99%, which will not be exceeded in the respective
period studied.
In wholesale business, margin payments triggered by
market price changes result in fluctuations of the com-
pany’s free cash flow. At Trianel GmbH, the associated
liquidity is limited via position management, monitored
each working day and taken into account as part of
liquidity control. For example, in order to measure risk,
the liquidity-at-risk is calculated at a confidence level
of 99%, and with defined holding periods. This means
that the maximum liquidity change due to market price
fluctuations within the holding periods does not exceed
the calculated value to a degree of probability of 99%.
Stress tests are used to simulate the effects of extreme
market price fluctuation on the forecast free cash flow.
Trianel GmbH also restricts the potential risks via bind-
ing market and product release processes. In addition
to this, product, portfolio and portfolio group-related
loss limits are defined, which serve to limit concentra-
tion risks. Overall, roughly 50% of the risk capital used
in 2017 is assigned to the market risks (the calculation
date for this was 31 December 2016).
Limit systems, measuring methods and the limits of in-
dividual portfolios and products are documented in the
appendix of the risk manual.
The current portfolio values and anticipated results and
cash flow are regularly calculated and reported, if nec-
essary every working day. The methods and assumptions
used are checked regularly during the clean back test-
ing, among other times, and are modified as necessary.
Economic collateral relationships are reported as
valuation units in accordance with commercial law
regulations.
Credit risks
Unlike exchange transactions, with non-exchange ener-
gy trading transactions (OTC), Trianel GmbH is exposed
to the risk that contract partners do not fulfil their
contractual duties to deliver or pay for a commodity,
or do so late.
In order to limit these counterparty risks, every poten-
tial business partner of Trianel GmbH is subjected to
a multi-stage evaluation process to classify their cred-
it standing (rating). This also takes externally available
information, e.g. assessments by renowned rating
agencies, into account. In addition, the credit standing
evaluation of the trading partners is reviewed once a year.
The individual counterparty limit assigned is assigned
based on this credit standing classification and the
total risk capital reserved for the counterparty default
risk.
In addition to this, business partners provide collateral
which increases the flexibility for performing transactions,
and/or in the event of a default of a Trianel business
partner, can be used to reduce the damage. Compliance
with the credit lines granted is monitored and reported
on every working day by calculating the credit risks and
the remaining flexibility for each business partner. Map-
ping, monitoring and reporting of the credit risks is sup-
ported by a central, database-backed IT system.
29 | Management Report 2016
The risk from the overall loan portfolio is also simulated
regularly. Assuming default and price change scenarios,
a credit value at risk (CVaR) is calculated with a confi-
dence level of 99%. As of the balance sheet date, this
value was a low-seven figure total for the overall loan
portfolio for 2017. For 2017, roughly 20% of the
planned risk capital was attributed to the credit risks.
Operational and other risks
Risks arising from the legal, personnel, process and
systems areas are generally referred to as operational
and other risks.
Legal risks are defined as the risk that a contract or a
group of contracts may not include the legal items
required by Trianel GmbH. For example, this includes
contractual implementation of payment terms suitable
from a liquidity perspective. Furthermore, the uncertainty
must be taken into account that (unforeseeable) chang-
es to the legal or regulatory framework may have neg-
ative effects on the achievement of planned corporate
goals, and that damage may occur as a result. Trianel
GmbH counteracts these risks for example by involv-
ing its own legal department in all relevant procedures,
through the mandatory market and product clearance
process described above and by the use of standardised
contracts wherever possible.
In addition to this, developments of general business-
relevant legal and regulatory conditions are monitored
on an ongoing basis, and influenced via involvement in
the corresponding association committees where pur-
poseful and possible. In this way, Trianel GmbH faces up
to the constantly growing scope of regulatory require-
ments, among other things with a dedicated organisa-
tional unit, “Compliance & Market Regulation”.
As part of Trianel GmbH’s trend-scouting, political, so-
cial, economic and regulatory developments are also an-
alysed intensely to identify opportunities and risks of
these developments at an early stage and react to them.
Active and purposeful participation in the political
debate is supported to a decisive extent through the
presence of Trianel GmbH’s Berlin office.
Risks for Trianel GmbH arise in this context in particular
from the EU-wide tightening of regulations for the
energy trading sector. In this context, the European
Market Infrastructure Regulation (EMIR) and Regulation
on Wholesale Energy Market Integrity and Transparen-
cy (REMIT) and the revision of the Markets in Financial
Instruments Directive (MiFID) are of key importance. In
2016, as in previous years, the legal framework drasti-
cally changed by this resulted in significant workloads
on implementation of the far-reaching requirements and
obligations for organisation, processes and systems, and
the associated resources required on a permanent basis.
This development will continue in 2017 and in the fol-
lowing years.
In this context, portfolios and funding requirements are
repeatedly checked and adjusted; products and process-
es are adapted in accordance with the regulatory require-
ments via project teams created for this purpose. The
necessary project budgets were taken into account in
budgeting.
The company’s success is also determined to a large
extent by the specific expertise, commitment and con-
tacts of its employees. Thanks to flat hierarchies,
interdepartmental work and a high degree of personal
responsibility, employees are able to use their qualifica-
tions in the most effective way at Trianel. The on-going
development of all employees, together with support
for potential managers from an early stage, is aimed
at facilitating the sustainable achievement of corporate
goals.
In order to enable effective risk management, there is
an organisational separation between those areas, posts
and functions that enter into risks in the course of their
activities and those that monitor the risks entered into
30 | Management Report 2016 31 | Management Report 2016
and limit and report them where necessary. The specific
design of the risk management system, particularly
in relation to the content, responsibilities, processes,
reporting obligations and documentation requirements
is documented in the company’s Risk Manual. Trianel
GmbH also handles further organisational and process
risks with binding regulations and process descriptions
which are documented for example in the Organisation
Manual and in the Compliance Guideline. Compliance
with these regulations is ensured via independent audit-
ing and reporting, and by adherence to the dual-control
principle.
Communication and information systems are of key
importance for the business processes at Trianel GmbH.
In particular the IT security, data security and data pro-
tection aspects have to be taken into account in this
respect. Alongside the general security of applications
and data in the IT network, framework contracts and
service level agreements oblige IT service providers to
guarantee that the required standards are met. All
Trianel GmbH employees are instructed with regard to
data protection according to Section 5 of the German
Federal Data Protection Act (BDSG), and are obliged to
observe data privacy. An IT security and data privacy
officer has been appointed. Employees are regularly
made aware of IT security topics on training courses
and via the Intranet. Regulations on this issue are also
an integral part of the corporate guidelines.
Other risks arise in particular as a result of possible
deviations from the budget for associate companies
and the development of asset projects. A simulation-
based participation risk model is used to evaluate the
participation risks and calculate the associated risk capi-
tal requirements. This models the loss of the portfolio
of participating interests which will not be exceeded
within a defined period (generally the current financial
year) at a probability of 99%. For 2017, the resulting
risk (PaR99) is estimated to be a high seven-figure or
low eight-figure total, depending on the course of time.
This corresponds to roughly 30% of the risk capital used
in 2017 (the calculation date for this was 31 December
2016). Also, circumstances leading to key changes in
individual risk positions, e.g. granting loans to companies
in which a participating interest exists, are only entered
into after a case-specific decision by the Shareholders’
Committee of Trianel GmbH.
Trianel holds minority participating interests in the key
operating project companies (in particular TKL, TGH,
TGE, TWB, TOW, TEE) and is informed on the develop-
ments and risk situation of the companies via committee
documents.
Use of financial instruments
The financial instruments include original and derivative
financial instruments. The original financial instruments
on the assets side fundamentally include accounts
receivable, liquid funds and financial assets. On the
liabilities side, the original financial instruments funda-
mentally include the accounts payable valued at the
amount repayable. The level of the financial assets in
the balance sheet indicates the maximum default risk
for the items mentioned. When default risks exist, they
are taken into account by value adjustments.
Trianel GmbH uses derivative financial instruments to
hedge against market risks. These include financial
swaps, futures on energy or emission certificates. In
addition, financial instruments in the form of interest
swap agreements are used to secure bank loans. Trans-
actions with financial instruments are subject to risk
guidelines in accordance with the risk management
system described above.
3.3 General statement on the risk situation
In 2016, neither individual risks nor the overall risk
endangered the company’s status as a going concern.
Precautions were taken in the balance sheet for risks
that are likely to take place.
31 | Management Report 2016
According to the current assessment, the market risks
will not be higher than in the previous year in the
subsequent years.
In spite of the declining credit standing, including public
sector companies, compared with previous years, Trianel
GmbH’s business model focusing on municipal utilities
as customers is assumed to entail a low risk of insolvent
business partners in terms of counterparty default risks.
The operational and other risks will likely also be domi-
nated by risks from asset projects and participating
interests, as well as risks from general regulatory and
legal conditions in the future.
We believe that the enforcement of claims from feed
management measures (FeMan) is likely to be success-
ful. The political will to strengthen the role of direct
marketers is present, but has not been secured yet
through regulatory measures. For this reason, the claims
were assessed with an appropriate level of caution. The
write-up of accounts receivable vis-à-vis our insolvent
Dutch subsidiary (TEBV) was derived from the latest
report of the insolvency administrator. Besides the
uncertainty regarding the further time sequence, there
are also risks in the amount of insolvency assets and
dividend.
In spite of the described developments and uncertain-
ties, there are no risks apparent to the Management
Board from the current perspective, that could endanger
Trianel GmbH’s continuation as a going concern.

32 | Management Report 2016
D. SUPPLEMENTARY REPORT
No significant events occurred following the end of
the financial year.

33 | Management Report 2016
E. REPORTING
PURSUANT TO SECTION 108 PARA. 3 NO. 2 OF THE NORTH RHINE-WEST-PHALIAN LOCAL GOVERNMENT ORDINANCE (GO NRW)
The purpose of the company is national and international
energy trading, with the objective of improving local energy
supply. The company may undertake the following tasks to
implement this objective:
1. Trading in a. Energy (electricity, gas, oil, coal) b. Energy derivatives and energy-related fi nancial derivatives (as defi ned in the German Banking Act [Kreditwesengesetz, KWG]; proprietary trading) c. Financial products relating to energy supply, such as weather derivatives and emission certifi cates (pursuant to the German Banking Act (KWG): proprietary trading)2. Energy sales3. Provision of consulting and other fee-based services directly related to energy supply.
The company is entitled to conduct all measures and business
transactions through which the purpose of the company can
directly or indirectly be promoted. It may, in order to fulfi l
its tasks, operate other companies, participate in them or
establish, acquire and lease such companies as well as aux-
iliary and ancillary companies, furthermore it may enter
into joint ventures and establish subsidiary branches.
The comments and data in the Notes and the Management
Report illustrate that we have conformed fully with the
public purpose based on our terms of reference as per the
Articles of Association.
Aachen, Germany, 27 April 2017
Trianel GmbH
Sven Becker Dr. Oliver Runte
Management Board of Trianel GmbH
35 | Management Report 2016
ANNUAL FINANCIAL STATEMENTS OF TRIANEL GMBH
Balance Sheet 35
Profit and loss statement 37
Notes for the Financial Year 2016 39
Form and presentation of the annual financial statements 39
Accounting and valuation principles 39
Balance sheet notes 41
Notes on the profit and loss statement 49
Other information 51
Development of fixed assets 53
Auditor’s Certificate 55
34

36 | Management Report 2016 37 | Management Report 2016
BALANCE SHEET
In € 31/12/2016 31/12/2015
A. Fixed assets
I. Intangible assets
1. Internally generated intangible assets 851,722.00 0.00
2. Purchased rights of use and similar rights 2,452,347.50 2,438,560.50
3. Down payments made 202,522.00 493,062.96
3,506,591.50 2,931,623.46
II. Tangible assets
1. Real property, rights equivalent to real property and buildings, including buildings on third-party land
18,312,703.00 18,862,160.00
2. Technical plant and machinery 84,228.00 80,815.00
3. Furniture and fixtures 1,279,286.00 1,435,844.00
4. Down payments made and plants under construction 734.90 0.00
19,676,951.90 20,378,819.00
III. Financial assets
1. Shares in affiliated companies 2,819,031.57 2,844,031.57
2. Participating interests 28,727,711.33 32,515,480.13
3. Loans to companies with which a participating interest exists 43,944,933.38 39,975,525.20
4. Other loans 19,962.19 21,937.85
75,511,638.47 75,356,974.75
98,695,181.87 98,667,417.21
B. Current assets
I. Inventories
1. Work in progress 1,289,036.69 427,260.41
2. Merchandise 2,619,334.95 2,907,326.43
3,908,371.64 3,334,586.84
II. Accounts receivable and other assets
1. Trade receivables 105,259,964.94 87,164,855.00
2. Accounts receivable from affiliated companies 2,299,129.83 2,346,340.07
3. Accounts receivable from shareholders 23,127,214.62 28,640,096.89
4. Accounts receivable from companies with which a participating interest exists
32,207,307.81 32,875,995.24
5. Other assets 50,861,085.09 39,021,891.69
213,754,702.29 190,049,178.89
III. Cash in hand, cash at bank 32,528,227.77 23,020,691.54
C. Accruals and deferrals 2,653,105.78 2,610,600.13
Total 351,539,589.35 317,682,474.61
ASSETS
AS OF 31 DECEMBER 2016
35

37 | Management Report 2016
In € 31/12/2016 31/12/2015
A. Equity
I. Capital stock 20,152,575.00 20,152,575.00
II. Capital reserves 26,129,469.24 26,129,469.24
III. Earnings reserves, other earnings reserves 41,795,066.46 41,670,793.39
IV. Annual net income/loss for the year –4,139,058.53 124,273.07
83,938,052.17 88,077,110.70
B. Provisions
1. Provisions for pensions 102,685.00 74,985.00
2. Other provisions 45,311,606.75 49,407,776.29
45,414,291.75 49,482,761.29
C. Liabilities
1. Accounts payable to credit institutions 20,882,458.61 24,094,528.34
2. Down payments received for orders 495,611.34 495,611.34
3. Trade accounts payable 140,482,565.64 118,374,304.61
4. Accounts payable to affiliated companies 928.90 161,146.22
5. Accounts payable to shareholders 11,385,928.84 16,156,007.87
6. Accounts payable to companies with which a participating interest exists
27,778,573.43 13,947,270.86
7. Other accounts payable 20,380,701.04 6,354,385.29
221,406,767.80 179,583,254.53
D. Accruals and deferrals 780,477.63 539,348.09
Total 351,539,589.35 317,682,474.61
EQUITY AND LIABILITIES
36
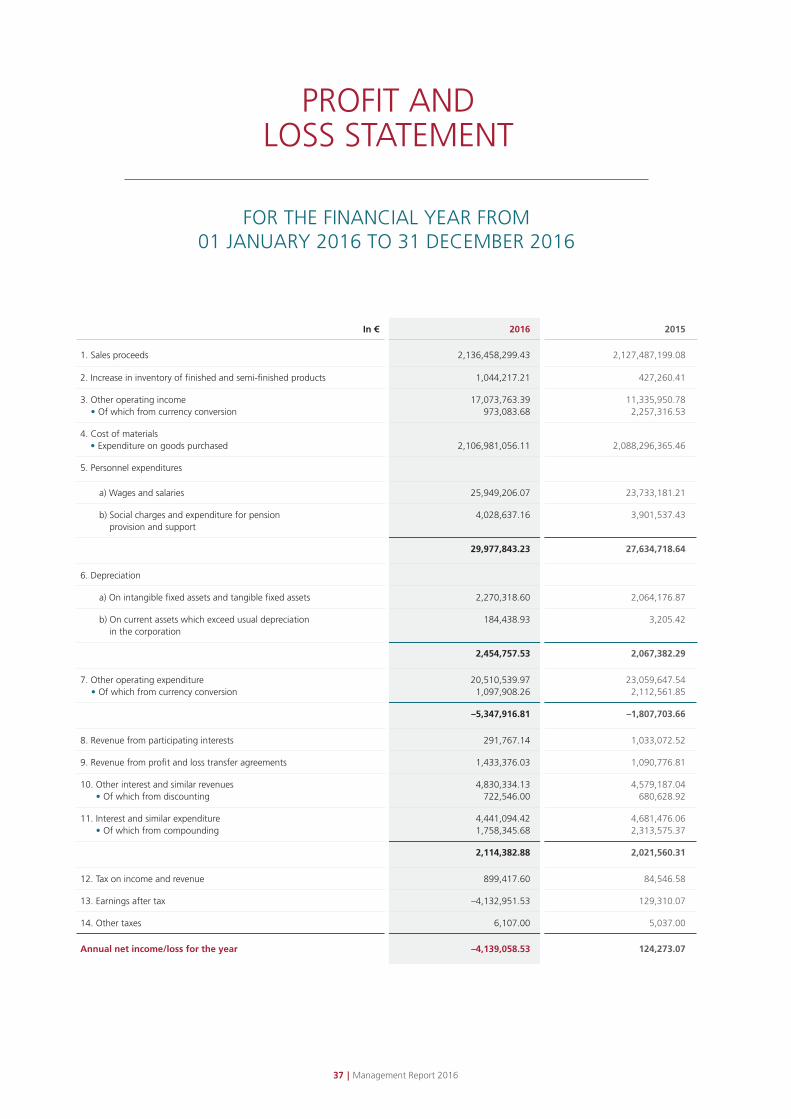
38 | Management Report 2016 39 | Management Report 2016
In € 2016 2015
1. Sales proceeds 2,136,458,299.43 2,127,487,199.08
2. Increase in inventory of finished and semi-finished products 1,044,217.21 427,260.41
3. Other operating income • Of which from currency conversion
17,073,763.39973,083.68
11,335,950.782,257,316.53
4. Cost of materials • Expenditure on goods purchased 2,106,981,056.11 2,088,296,365.46
5. Personnel expenditures
a) Wages and salaries 25,949,206.07 23,733,181.21
b) Social charges and expenditure for pension provision and support
4,028,637.16 3,901,537.43
29,977,843.23 27,634,718.64
6. Depreciation
a) On intangible fixed assets and tangible fixed assets 2,270,318.60 2,064,176.87
b) On current assets which exceed usual depreciation in the corporation
184,438.93 3,205.42
2,454,757.53 2,067,382.29
7. Other operating expenditure • Of which from currency conversion
20,510,539.971,097,908.26
23,059,647.542,112,561.85
–5,347,916.81 –1,807,703.66
8. Revenue from participating interests 291,767.14 1,033,072.52
9. Revenue from profit and loss transfer agreements 1,433,376.03 1,090,776.81
10. Other interest and similar revenues • Of which from discounting
4,830,334.13722,546.00
4,579,187.04680,628.92
11. Interest and similar expenditure • Of which from compounding
4,441,094.421,758,345.68
4,681,476.062,313,575.37
2,114,382.88 2,021,560.31
12. Tax on income and revenue 899,417.60 84,546.58
13. Earnings after tax –4,132,951.53 129,310.07
14. Other taxes 6,107.00 5,037.00
Annual net income/loss for the year –4,139,058.53 124,273.07
PROFIT AND LOSS STATEMENT
FOR THE FINANCIAL YEAR FROM 01 JANUARY 2016 TO 31 DECEMBER 2016
37

39 | Management Report 2016

40 | Management Report 2016 41 | Management Report 2016
The accounting and valuation were performed based on
the assumption that company activities would be
continued.
The intangible assets and tangible fixed assets were
valued at acquisition cost less depreciation.
Depreciation was scheduled on a straight-line basis or
using the declining balance method based on the
normal useful life of the capital assets.
The financial assets are evaluated at acquisition cost,
taking account of repayment, depreciation and write-
ups. Interest receivables which have not been subjected
to interest with a residual term of more than one year
are discounted using a market interest rate adequate for
the residual term. The evaluation of the value retention
of the participation book value and the shareholder
loans of Trianel Windkraftwerk Borkum GmbH & Co. KG
was made in summarised form due to the close contrac-
tual link of the participating interests and loans.
Inventories are valued at acquisition cost using the lower
of cost or market principle for depreciation. Accounts
receivable and other assets are shown in the balance
sheet at their nominal value; necessary value adjustments
2. ACCOUNTING AND VALUATION PRINCIPLES
Trianel GmbH is domiciled in Aachen and entered in
Commercial Register B of Aachen District Court under
number HRB 7729.
The annual financial statements have been prepared in
accordance with the regulations of the German Com-
mercial Code (HGB) for large incorporated companies in
conjunction with the supplementary provisions of the
GmbH-Gesetz (German Limited Liability Companies Act).
To improve the clarity of the presentation we have
provided details on affiliations to other items in the
balance sheet in the Notes. The profit and loss statem-
ent is structured according to the expenditure format.
Separate explanatory notes have been provided in
respect of the main items in the balance sheet and the
profit and loss statement.
For better presentation of the earnings situation, the
sales proceeds and costs of materials for proprietary
business transactions are balanced against one another
for reporting.
NOTES FOR THE FINANCIAL YEAR 2016
1. FORM AND PRESENTATION OF THE ANNUAL FINANCIAL STATEMENTS
39
41 | Management Report 2016
were taken into account. In the financial year, the
previous general value adjustment was amended from
1% to 0.5%.
Accounts receivable and payable in foreign currencies
are converted at the applicable exchange rate on the
posting date unless a fixed exchange rate for the Euro
exists. Profits and losses incurred due to exchange rate
movements up to the balance sheet date are taken into
account per Section 256a of the German Commercial
Code (HGB).
Liquid funds are stated at nominal value in the balance
sheet.
The subscribed capital is included at nominal value.
In the profit use resolution on 8 July 2016, a decision
was made to add the 2015 annual net income of € 124
thousand to the earnings reserves.
Pension obligations are calculated according to actuarial
principles using the Projected Unit Credit Method (PUC
Method). In the PUC Method, the provision amount is
defined as the actuarial cash value of the pension obli-
gations earned by the employees until this time based
on work performed in the past in accordance with the
pension formula and vesting regulation. The “Guide
Tables 2005 G” by Klaus Heubeck are used as a bio-
metric calculation basis. The mathematical interest rate
is 4.01%, which is equal to the average market interest
rate for an assumed residual term of the obligations of
15 years. The pension trend was also incorporated at
1%. The wage trend was not incorporated due to the
contractual basis. The difference to a provision approach
based on an average market interest rate over the past
seven years totals € 22 thousand. The option per
Article 67 para. 1 no. 1 of the Introductory Act for the
German Commercial Code (EGHGB) was not exercised.
The provisions are reported at the settlement value
necessary according to prudent commercial assessment.
Provisions took into account all identifiable risks and
contingent liabilities. Provisions with a residual term of
over one year were discounted with the average market
interest rate of the last 7 financial years in accordance
with their residual term as per the German Bundes-
bank’s provision discounting regulations.
The option of capitalising deferred taxes was not
exercised.
Accounts payable are stated at the settlement value.
In order to evaluate the physical trade transactions, the
posted and pending transactions and gas inventories
are always combined in an annual consideration with
the corresponding financial transactions to the Asset
Electricity, Asset Gas, Trade, Electricity Sales and Gas
Sales portfolios, i.e. in the event of the use of the
option to form an accounting valuation unit.
Derivative financial instruments were used to secure
bank loans and foreign currency transactions, which
each form a valuation unit together with the debt
items.
40

42 | Management Report 2016 43 | Management Report 2016
3. BALANCE SHEET NOTES
3.1 Fixed assets
The development of fixed assets and depreciation
during the financial year under review is shown in the
fixed-asset movement schedule, which is enclosed as a
separate document with the Notes.
In 2016, modules of the integrated Trianel DESK energy
industry suite were developed and capitalised as
internally generated intangible fixed assets. There is a
payout block per Section 286 (8) of the German
Commercial Code (HGB) to a total of the current book
value of € 852 thousand, however there is sufficient
freely available equity.
Shares to the amount of € 2,819,031.57 are held in the
following affiliated companies:
COMPANY Registered Participation Participation Equity Annual office book value result
% € € €
Trianel
Finanzdienste GmbH Aachen 100.0 2,500,000 2,500,000 * 0
Trianel
Gaskraftwerk Hamm
Verwaltungs GmbH Aachen 100.0 25,000 40,039 1,194
Trianel
Gasspeicher Epe
Verwaltungs GmbH Aachen 100.0 25,000 95,754 23,570
Trianel
Kraftwerk Krefeld
Verwaltungs GmbH Aachen 100.0** 25,000 21,212 –3,788
Trianel
Kohlekraftwerk Lünen
Verwaltungs GmbH Aachen 100.0 25,000 36,174 1,053
Trianel
Windkraftwerk Borkum
Verwaltungs GmbH Aachen 100.0 25,000 62,907 12,626
Trianel
Service GmbH Aachen 100.0 194,032 137,767 –7,656
* A profit and loss transfer agreement exists between Trianel Finanzdienste GmbH and Trianel GmbH.
** The shares are wholly commercially attributed to Trianel GmbH.
41
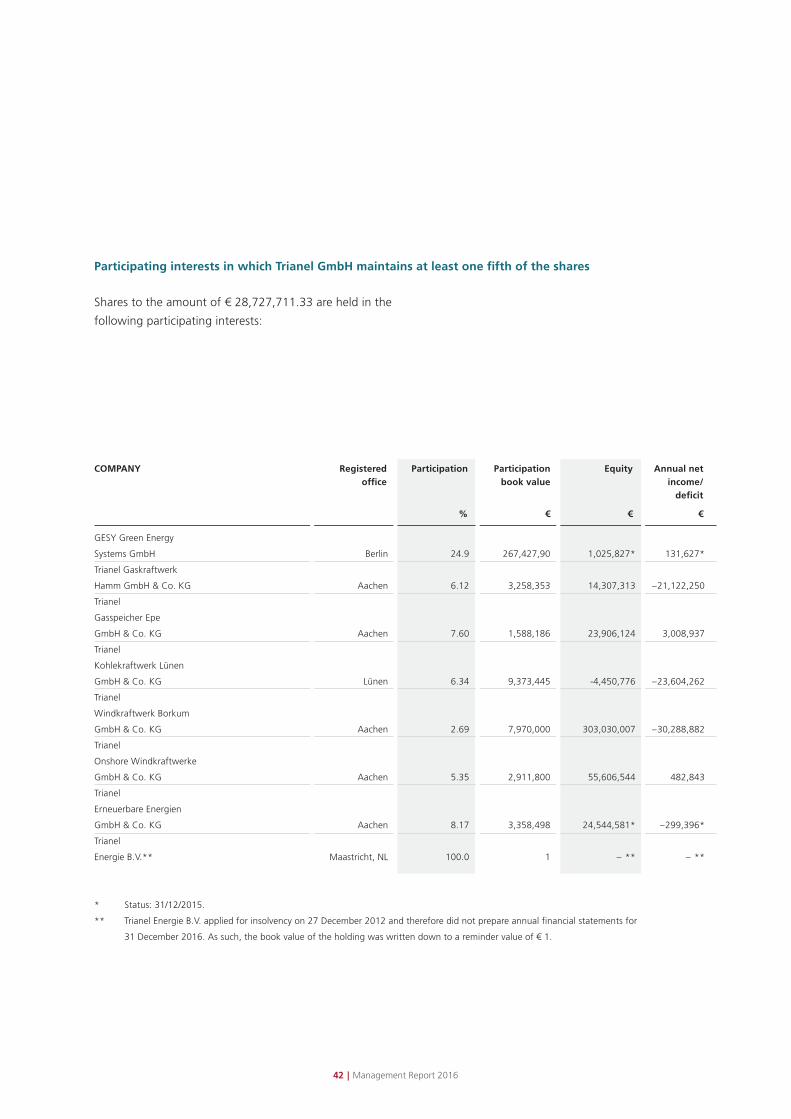
43 | Management Report 2016
Participating interests in which Trianel GmbH maintains at least one fifth of the shares
Shares to the amount of € 28,727,711.33 are held in the
following participating interests:
COMPANY Registered Participation Participation Equity Annual net office book value income/ deficit
% € € €
GESY Green Energy
Systems GmbH Berlin 24.9 267,427,90 1,025,827* 131,627*
Trianel Gaskraftwerk
Hamm GmbH & Co. KG Aachen 6.12 3,258,353 14,307,313 –21,122,250
Trianel
Gasspeicher Epe
GmbH & Co. KG Aachen 7.60 1,588,186 23,906,124 3,008,937
Trianel
Kohlekraftwerk Lünen
GmbH & Co. KG Lünen 6.34 9,373,445 -4,450,776 –23,604,262
Trianel
Windkraftwerk Borkum
GmbH & Co. KG Aachen 2.69 7,970,000 303,030,007 –30,288,882
Trianel
Onshore Windkraftwerke
GmbH & Co. KG Aachen 5.35 2,911,800 55,606,544 482,843
Trianel
Erneuerbare Energien
GmbH & Co. KG Aachen 8.17 3,358,498 24,544,581* –299,396*
Trianel
Energie B.V.** Maastricht, NL 100.0 1 – ** – **
* Status: 31/12/2015.
** Trianel Energie B.V. applied for insolvency on 27 December 2012 and therefore did not prepare annual financial statements for
31 December 2016. As such, the book value of the holding was written down to a reminder value of € 1.
42

44 | Management Report 2016 45 | Management Report 2016
3.2 Current assets
The current assets largely comprise stored quantities of
gas, CO2 certificates and work in progress as a result
of advance performances for project developments and
rights.
Trade receivables mainly consist of outstanding payments
for electricity and gas supplies, which were offset against
similar payables to the value of € 301,207 thousand
(prev. year € 248,251 thousand).
Of the accounts receivable from affiliated companies,
€ 866 thousand (prev. year € 1,256 thousand) are trade
accounts receivable.
Of the accounts receivable from shareholders, € 22,762
thousand (prev. year € 28,367 thousand) are trade ac-
counts receivable. Similar accounts payable totalling
€ 7,111 thousand (prev. year € 569 thousand) were
offset against the accounts receivable.
In addition to trade receivables from energy supplies and
service provision, the accounts receivable from affiliated
companies include receivables from the insolvent Trianel
Energie B.V. (TEBV) totalling € 13,851 thousand, which
have been adjusted individually at € 9,946 thousand.
The other assets primarily contain collateral security
relating to energy trading, including non-accessible
bank credit balances of € 15,030 thousand, input tax
of € 7,306 thousand which is not deductible until the
following year and damages claimed vis-à-vis grid oper-
ators totalling € 3,500 thousand. In addition to this, the
other assets include accounts receivable from tax reim-
bursement claims totalling € 11,814 thousand. They are
primarily for income tax reimbursement claims for the
2014 to 2016 assessment periods.
All accounts receivable and other assets are due within
one year, with the exception of accounts receivable
and other assets from smart metering, totalling
€ 2 thousand.
3.3 Provisions
Other provisions totalling € 45,312 thousand (prev. year
€ 49,408 thousand) include provisions for uncertain
accounts payable totalling € 6,826 thousand (prev. year
€ 7,665 thousand), mainly pertaining to personnel costs.
Otherwise, provisions are included for anticipated losses
from pending transactions to the amount of € 38,486
thousand (prev. year € 41,742 thousand). As of the
balance sheet date, provisions for anticipated losses for
asset items totalling € 37,662 thousand (prev. year
€ 37,564 thousand), totalling € 594 thousand (prev.
year € 4,121 thousand) for the trade mandate and
€ 229 thousand (prev. year € 57 thousand) for the sales
mandates were included on the liabilities side.
3.4 Accounts payable
The accounts payable to credit institutions include long-
term bank loans and accrued interest.
The down payments received for orders are for instal-
ments from B2B customers.
Trade accounts payable predominantly result from energy
procurement and consulting services.
Accounts payable to shareholders mainly relate to trade
accounts payable resulting from energy supplies.
Accounts payable to companies with which a participat-
ing interest exists are exclusively trade accounts payable.
Other accounts payable include accounts payable from
wages and church tax totalling € 423 thousand (prev.
year € 316 thousand) and from social security totalling
€ 164 thousand (prev. year € 176 thousand).
43

45 | Management Report 2016
Accounts payable to companies with which a participat-
ing interest exists are exclusively trade accounts payable.
Other accounts payable include accounts payable from
wages and church tax totalling € 423 thousand (prev.
year € 316 thousand) and from social security totalling
€ 164 thousand (prev. year € 176 thousand).
3.5 Valuation units (VU)/derivative financial
instruments
The option of forming balance sheet valuation units per
Section 254 of the German Commercial Code (HGB) was
utilised to the extent stated below. The effectiveness is
documented by measuring the physical delivery equiva-
lents or compliance with specified rules, such as VaR
limits as part of the existing risk management system.
Trianel GmbH’s operative business is managed and con-
trolled in mandates. Control via mandates does not ex-
clude the possibility of individual contract groups being
shown and valued separately in partial portfolios within
the mandates, to enable more detailed mapping as well
as the delegation of partial tasks if necessary. The items
in the electricity asset mandate which cannot be grouped
in a valuation unit must be evaluated according to classic
rules under balance sheet aspects. Provisions for poten-
tial losses were formed for negative valuation balances
for the year.
The figures specified on the risks secured via valuation
units and losses reported limited via balancing are theoret-
ical, as all individual transactions were evaluated here,
while mandate-specific controlling means that open trade
items are restricted appropriately at all times.
Individually, the following valuation units existed on the
balance sheet date:
Valuation unit: Electricity asset mandate
This valuation unit (VU) combines the shares of existing
contracts in relation to our holdings in power station
companies with corresponding hedging transactions as
portfolio hedges. The risk of price changes from market
price fluctuations is hedged. Pending transactions are
incorporated in the VUs, which are each considered on
an annual basis.
31/12/2016 31/12/2016 31/12/2015
LIABILITIES MOVEMENT SCHEDULE In € TOTAL Residual terms Residual term
Previous year Up to 1 year 1 year to 5 years Over 5 years Up to 1 year
Accounts payable to credit institutions 20,882,458.61 2,843,525.34 18,038,933.27 11,828,799.91 4,503,061.73
Down payments received on orders 495,611.34 495,611.34 0.00 0.00 495,611.34
Trade accounts payable 140,482,565.64 140,482,565.64 0.00 0.00 118,374,304.61
Accounts payable to affiliated companies 928.90 928.90 0.00 0.00 161,146.22
Accounts payable to shareholders 11,385,928.84 11,385,928.94 0.00 0.00 16,156,007.87
Accounts payable to affiliated companies 27,778,573.43 27,778,573.43 0.00 0.00 13,947,270.86
Other liabilities 20,380,701.04 19,916,227.73 464,473.31 0.00 5,723,226.28
Total liabilities 221,406,767.80 202,903,361.32 18,503,406.58 11,828,799.91 159,360,628.91
44

46 | Management Report 2016 47 | Management Report 2016
The 2017 VU contains base transactions totalling
€ 18,947 thousand and hedge transactions totalling
€ 9,103 thousand. The VU hedges risks from an indi-
vidual transaction perspective to a total of € 3,759
thousand for 2017. A provision was also formed for
2017 for potential losses from pending transactions
totalling € 8,160 thousand. The 2018 VU contains base
transactions totalling € 17,621 thousand and hedge
transactions totalling € 6,910 thousand. The VU hedges
risks from an individual transaction perspective to a total
of € 3,642 thousand for 2018. A provision was also
formed for 2018 for potential losses from pending
transactions totalling € 8,810 thousand. The 2019 VU
contains base transactions totalling € 17,626 thousand
and hedge transactions totalling € 0 thousand. The VU
hedges risks from an individual transaction perspective
to a total of € 1,437 thousand for 2019. A provision was
also formed for 2019 for potential losses from pending
transactions totalling € 8,362 thousand. A provision was
formed for potential losses from pending transactions
totalling € 7,609 thousand for purchase obligations
after the managed periods.
The opposing value changes compensate one another as
a result of the existing spread hedging in the respective
years in question.
Valuation unit: Gas asset mandate
This VU combines contractual obligations from storage
facility user contracts including gas stocks with the cor-
responding hedge transactions as a portfolio hedge.
The risk of price changes from market price fluctuations
is hedged. Pending transactions are incorporated in the
VUs, which are each considered on an annual basis.
The 2017 VU contains base transactions totalling
€ 1,612 thousand and hedge transactions totalling
€ 466 thousand and a balance sheet stock value of
€ 1,847 thousand. The VU hedges risks from an indi-
vidual transaction perspective to a total of € 824 thou-
sand for 2017. The VU hedges risks from an individual
transaction perspective to a total of € 824 thousand for
2017. A provision was also formed for 2017 for poten-
tial losses from pending transactions totalling € 812
thousand. The 2018 VU contains base transactions total-
ling € 1,816 thousand and hedge transactions totalling
€ 47 thousand. The VU hedges risks from an individual
transaction perspective to a total of € 618 thousand for
2018. A provision was also formed for 2018 for poten-
tial losses from pending transactions totalling € 1,226
thousand. The 2019 VU contains base transactions total-
ling € 1,801 thousand and hedge transactions totalling
€ 47 thousand. The VU hedges risks from an individual
transaction perspective to a total of € 652 thousand for
2019. A provision was also formed for 2019 for poten-
tial losses from pending transactions totalling € 1,179
thousand. A provision was formed for potential losses
from pending transactions totalling € 1,505 thousand
for storage facility use obligations after the managed
periods.
The opposing value changes compensate one another as
a result of the existing spread hedging in the respective
years in question.
Valuation unit: Trade mandate
This VU combines the existing wholesale energy trans-
actions with the corresponding hedging transactions as
a portfolio hedge. The risk of price changes from market
price fluctuations is hedged. Pending transactions are
incorporated in the VUs, which are each generally con-
sidered on an annual basis. In deviation from this,
spread hedges explicitly designated in the mandate
trade, which aim for a multi-year spread development,
multi-year offsetting is also taken into account in the
balance sheet. The compensating part plus any excess
liability from the designated spread transactions is
attributed to the first of the two following spread years.
The 2017 VU contains base transactions totalling
€ 3,969,075 thousand and hedge transactions totalling
€ 3,956,952 thousand. The VU hedges risks from an
individual transaction perspective to a total of
45
47 | Management Report 2016
€ 1,164,871 thousand for 2017. The 2017/2018 spread
hedge results in a result balance totalling – € 3,142
thousand, which is incorporated in the 2017 VU. A
provision was also formed for 2017 for potential losses
from pending transactions totalling € 414 thousand.
The 2018 VU contains base transactions totalling
€ 1,200,363 thousand and hedge transactions totalling
€ 1,211,264 thousand. The VU hedges risks from an
individual transaction perspective to a total of
€ 294,630 thousand for 2018. The 2019 VU contains
base transactions totalling € 158,251 thousand and
hedge transactions totalling € 158,152 thousand. The
VU hedges risks from an individual transaction perspec-
tive to a total of € 30 thousand for 2019. A provision
was also formed for 2019 for potential losses from
pending transactions totalling € 180 thousand.
The opposing value changes compensate one another
as a result of the existing hedging relationships in the
respective years in question.
Valuation unit: Electricity sales mandate (EW)
This VU combines the existing electricity contracts with
customers with the corresponding hedging transactions
as a portfolio hedge. The risk of price changes from
market price fluctuations is hedged. Pending transac-
tions are incorporated in the VUs, which are each
considered on an annual basis.
The 2017 VU contains base transactions totalling
€ 628,532 thousand and hedge transactions totalling
€ 613,572 thousand. The VU hedges risks from an
individual transaction perspective to a total of
€ 142,643 thousand for 2017. The 2018 VU contains
base transactions totalling € 215,539 thousand and
hedge transactions totalling € 209,718 thousand. The
VU hedges risks from an individual transaction perspec-
tive to a total of € 44,216 thousand for 2018. A provision
was also formed for 2018 for potential losses from
pending transactions totalling € 35 thousand. The 2019
VU contains base transactions totalling € 73,781
thousand and hedge transactions totalling € 71,948
thousand. The VU hedges risks from an individual
transaction perspective to a total of € 10,499 thousand
for 2019. A provision was also formed for 2019 for
potential losses from pending transactions totalling
€ 118 thousand. The opposing value changes largely
compensate one another as a result of the existing
hedging relationships in the respective years in question.
Valuation unit: Electricity sales mandate (T&O)
This VU combines the existing electricity contracts with
customers with the corresponding hedging transactions
as a portfolio hedge. The risk of price changes from
market price fluctuations is hedged. Pending transac-
tions are incorporated in the VUs, which are each
considered on an annual basis.
The 2017 VU contains base transactions totalling € 48
thousand and hedge transactions totalling € 195
thousand. The VU hedges risks from an individual trans-
action perspective to a total of € 0 thousand for 2017.
The opposing value changes largely compensate one
another as a result of the existing hedging relationships
in the respective years in question.
Valuation unit: Gas sales mandate (EW)
This VU combines the existing gas contracts with
customers with the corresponding hedging transactions
as a portfolio hedge. The risk of price changes from
market price fluctuations is hedged. Pending transac-
tions are incorporated in the VUs, which are each
considered on an annual basis.
The 2017 VU contains base transactions totalling
€ 29,454 thousand and hedge transactions totalling
€ 28,976 thousand. The VU hedges risks from an
individual transaction perspective to a total of € 3,899
thousand for 2017. The 2018 VU contains base transac-
tions totalling € 11,659 thousand and hedge transactions
totalling € 11,346 thousand. The VU hedges risks from
46

48 | Management Report 2016 49 | Management Report 2016
an individual transaction perspective to a total of
€ 1,743 thousand for 2018. The 2019 VU contains base
transactions totalling € 3,475 thousand and hedge
transactions totalling € 3,438 thousand. The VU hedges
risks from an individual transaction perspective to a total
of € 551 thousand for 2019. The 2020 VU contains
base transactions totalling € 44 thousand and hedge
transactions totalling € 0 thousand. The VU hedges risks
from an individual transaction perspective to a total of
€ 0 thousand for 2020.
The opposing value changes largely compensate one
another as a result of the existing hedging relationships
in the respective years in question.
Valuation unit: Gas sales mandate (T&O)
This VU combines the existing gas contracts with cus-
tomers with the corresponding hedging transactions as
a portfolio hedge. The risk of price changes from market
price fluctuations is hedged. Pending transactions are
incorporated in the VUs, which are each considered on
an annual basis.
The 2017 VU contains base transactions totalling
€ 4,857 thousand and hedge transactions totalling
€ 4,672 thousand. The VU hedges risks from an individ-
ual transaction perspective to a total of € 863 thousand
for 2017. A provision was also formed for 2017 for
potential losses from pending transactions totalling
€ 75 thousand. The 2018 VU contains base transactions
totalling € 1,979 thousand and hedge transactions
totalling € 1,977 thousand. The VU hedges risks from
an individual transaction perspective to a total of € 257
thousand for 2018. The 2019 VU contains base transac-
tions totalling € 1,842 thousand and hedge transactions
totalling € 1,840 thousand. The VU hedges risks from
an individual transaction perspective to a total of € 336
thousand for 2019. The opposing value changes large-
ly compensate one another as a result of the existing
hedging relationships in the respective years in question.
Interest rate swaps
The option of forming valuation units was utilised in
full. The freezing method was used to map the effective
parts of the valuation units formed in the accounts.
Individually, there are two micro-hedges from one base
transaction and one hedging transaction each on the
balance sheet date. The two base transactions are
reported as accounts payable for bank loans of € 2,600
and € 991 thousand (prev. year € 4,312 thousand in
total), while the two hedge transactions are not reported
as derivative financial instruments (interest rate swaps)
as they are pending transactions. The accounts payable
for loans are subject to interest at the 6 month EURIBOR
plus 75 base points. The interest rate swaps exchange
an interest received at the 6 month EURIBOR for a fixed
interest rate to be paid of 4.88% and 5.09%. The risk
of interest rate changes from interest rate fluctuation is
hedged.
Trianel GmbH has concluded the following unreported
derivative financial instruments:
• Interest rate swap (€ 2,600 thousand)
In this transaction, starting from 27 May 2008, a
variable interest rate account payable with an initial
total of € 6,000 thousand is exchanged for a fixed
interest rate account payable, thus hedging against
market fluctuations. This agreement matures in June
2023. The fair value according to the lending bank’s
internal risk models is € -443 thousand as of 31
December 2016.
• Interest rate swap (€ 991 thousand)
In this transaction, starting from 17 July 2008, a variable
interest rate account payable with an initial total of
€ 2,288 thousand is exchanged for a fixed interest rate
account payable, thus hedging against market fluctua-
tions. This agreement matures in June 2023. The fair
value according to the lending bank’s internal risk
models is € -176 thousand as of 31 December 2016.
47

49 | Management Report 2016
The market values were determined using the cash
value method. According to this, all future payments,
on both the fixed and variable side of the interest rate
swap, are discounted on the valuation date. Payments
on the variable side are determined on the basis of
additional due dates which result from the current
interest rate structure curve.
The market value changes of the derivatives are offset
by opposing market value changes of the base
transactions.
3.6 Latent taxes
The trade and tax law value assessments of the internally
generated intangible assets, the financial assets, the
pension provisions and other provisions result in differ-
ences, which are compensated in subsequent financial
years. These differences led to latent tax accruals and
deferrals. A tax rate of 32.45% is applied when
determining the latent taxes.
The calculation results in a surplus of latent tax accruals.
The option under Section 274 para. 1 no. 2 of the
German Commercial Code (HGB) is not used, and thus
no latent tax accrual is formed.
48

50 | Management Report 2016 51 | Management Report 2016
31/12/2016 31/12/2015
Business field Sales in € Sales in % Sales in € Sales in % thousands thousands
Electricity (unbalanced) 2,802,398 60.5 % 3,130,774 69.8 %
Balancing –1,629,033 65.3 % –1,785,445 75.8 %
Electricity 1,173,365 54.9 % 1,345,329 63.2 %
Gas (unbalanced) 1,735,778 37.5 % 1,209,137 27.0 %
Balancing –865,139 34.7 % –571,369 24.2 %
Gas 870,639 40.8 % 637,768 1.2 %
Certificates trading (unbalanced) 18,441 0.4 % 25,212 0.6 %
Balancing 0 0.0 % –169 0.1 %
Emissions trading 18,441 0.9 % 25,043 30.0 %
Coal (unbalanced) 34,343 0.7 % 77,156 1.7 %
Balancing 0 0.0 % 0 0.0 %
Coal 34,343 1.6 % 77,156 3.6 %
Services (unbalanced) 39,737 0.9 % 42,274 0.9 %
Balancing 0 0.0 % 0 0.0 %
Services 39,737 1.9 % 42,274 2.0 %
Services (unbalanced) 4,630,697 100.0 % 4,484,554 100.0 %
Total (unbalanced) –2,494,172 100.0 % –2,356,983 100.0 %
Total (balanced) 2,136,525 100.0 % 2,127,571 100.0 %
4.1 Sales revenues
There is no comparability to the 2015 financial year due
to the Reporting Guideline Implementation Act (BilRUG)
Section 277 (1) of the German Commercial Code (HGB)
in conjunction with Sect. 75 (2) of Introductory Act for
the German Commercial Code (EGHGB) and the initial
application. The balanced sales proceeds for 2015
would have been € 2,127,554 thousand per Section
277 (1) of the German Commercial Code (HGB) in the
BilRUG version. The gross sales less electricity tax can be
broken down into the following areas of activity:
In the financial year, customer discounts of
€ 67 thousand (prev. year € 84 thousand)
were granted. These have not been taken
into account in the list.
Non-period turnover totalled € 1,533 thousand
(prev. year € 1,073 thousand).
4. NOTES ON THE PROFIT AND LOSS STATEMENT
49

51 | Management Report 2016
4.2 Other operating revenues
There is no comparability to the 2015 financial year due
to the Reporting Guideline Implementation Act (BilRUG)
Section 277 (1) of the German Commercial Code (HGB)
in conjunction with Sect. 75 (2) of Introductory Act for
the German Commercial Code (EGHGB) and the initial
application. The other operating revenues for 2015
would have been € 11,269 thousand per Section 277
(1) of the German Commercial Code (HGB) in the
BilRUG version.
The other operating revenues generally largely result
from the reversal of provisions to a total of € 4,371
thousand (prev. year € 332 thousand), write-up of
accounts receivable from the TEBV insolvency (€ 3,900
thousand) as well as revenues from claimed damages
vis-à-vis grid operators (€ 3,500 thousand). They include
earnings not relating to the period totalling € 4,383
thousand (prev. year € 529 thousand).
Sales not relating to the period totalled € 1,533
thousand (prev. year € 1,073 thousand).
4.3 Cost of materials
There is no comparability to the 2015 financial year
due to the Reporting Guideline Implementation Act
(BilRUG) Section 277 (1) of the German Commercial
Code (HGB) in conjunction with Sect. 75 (2) of Intro-
ductory Act for the German Commercial Code (EGHGB)
and the initial application. The costs of materials for
2015 would have been € 2,088,383 thousand per
Section 277 (1) of the German Commercial Code (HGB)
in the BilRUG version.
The cost of materials not relating to the period totalled
€ 2,392 thousand (prev. year € 454 thousand).
4.4 Personnel expenditure
Personnel expenditures were incurred in respect of an
average of 346 employees (prev. year 336 employees).
Personnel expenditures include costs for pension
provision to the amount of € 296 thousand (prev. year
€ 454 thousand) and expenditures not relating to the
period of € 6 thousand (prev. year € 17 thousand).
4.5 Other operating expenditure
There is no comparability to the 2015 financial year due
to the Reporting Guideline Implementation Act (BilRUG)
Section 277 (1) of the German Commercial Code (HGB)
in conjunction with Sect. 75 (2) of Introductory Act for
the German Commercial Code (EGHGB) and the initial
application.
The other operating expenditures for 2015 would have
been € 22,973 thousand per Section 277 (1) of the
German Commercial Code (HGB) in the BilRUG version.
Other operating expenditures include expenditure not
relating to the period totalling € 106 thousand (prev.
year € 273 thousand) and expenditures from currency
conversion to a total of € 1,098 thousand (prev. year
€ 2,113 thousand).
4.6 Interest expenditures
The interest expenditures to the amount of € 4,441
thousand (prev. year € 4,681 thousand) include
compounding provisions or discounting provisions on
accounts receivable totalling € 1,757 thousand (prev.
year € 2,315 thousand).
4.7 Tax on income
€ 899 thousand (prev. year € 46 thousand) of the tax
expenditures in the reporting year were incurred for corpo-
ration tax and the solidarity surcharge for previous years.
50

52 | Management Report 2016 53 | Management Report 2016
In € thousands In € thousands
Obligations from power purchase agreements 4,195,764 (3,028,976)
• Of which payable to shareholders 202,805 (166,117)
Obligations arising from gas supply agreements 1,365,831 (1,143,966)
• Of which payable to shareholders 10,982 (10,982)
Obligations arising from emission certificates 15,711 (12,752)
• Of which payable to shareholders 90 (90)
Obligations arising from coal swaps 5,650 (5,544)
Obligations from leasing and rental agreements 2,104 (348)
Obligations arising from certificates 91 (91)
Obligations from currency transactions 2,610 (927)
( ) = Of which due in 2017
5.2 Contingencies
As collateral for bank loans to Trianel Kohlekraftwerk
Lünen GmbH & Co. KG, Trianel Gasspeicher Epe GmbH
& Co. KG and Trianel Windkraftwerk Borkum GmbH &
Co. KG, Trianel GmbH has pledged its shares in these
companies, and in Trianel Kohlekraftwerk Lünen
Verwaltungs GmbH, including dividends, to the banks
concerned. Due to the credit standing of these compa-
nies, we consider it unlikely that this will be claimed.
5.3 Auditor’s fees
In accordance with Section 285 no. 17 of the German
Commercial Code (HGB), this information is provided in
the consolidated financial statements of Trianel GmbH.
5.4 Supervisory Board
In the 2016 financial year, the Supervisory Board was
composed of the following members:
• Dietmar Spohn, Bochum, Management Spokesman
of Stadtwerke Bochum Holding GmbH (Chairman)
• Waldemar Opalla, Diepholz, Managing Director of
Stadtwerke EVB Huntetal GmbH (Vice Chairman),
until 16 February 2016
• Christoph Hüls, Detmold, Managing Director of
Stadtwerke Detmold GmbH (Vice Chairman), from
16 February 2016
• Dr. Christian Becker, Aachen, Member of the
Management Board of Stadtwerke Aachen
Aktiengesellschaft
• Prof. Dr. Marc Oliver Bettzüge, Cologne, Director of
the Institute of Energy at the University of Cologne,
(elected Expert Member of the Supervisory Board)
• Dr. Ulf Böge, Meckenheim, retired President of the
German Federal Cartel Office (elected Expert
Member of the Supervisory Board)
5.1 Other financial obligations
5. OTHER INFORMATION
51
53 | Management Report 2016
• Klaus Eder, Ulm, Managing Director of SWU Energie
GmbH
• Dr. Achim Grunenberg, Lünen, Managing Director
of Stadtwerke Lünen GmbH
• Michael Hegel, Cologne, Banker (elected Expert
Member of the Supervisory Board)
• Martin Heun, Fulda, Management Spokesman of
RhönEnergie Fulda GmbH
• Ulrich Koch, Herne, Member of the Management
Board of Stadtwerke Herne AG
• Michael Lucke, Kempten, Managing Director of
Allgäuer Überlandwerk GmbH
• Christian Meyer-Hammerström, Lilienthal, Manag-
ing Director of Osterholzer Stadtwerke GmbH
• Jürgen Schäffner, Lübeck, Managing Director of
Stadtwerke Lübeck Holding GmbH
• Dr. Leonhard Schitter, Salzburg, Member of the
Management Board of Salzburg AG für Energie,
Verkehr und Telekommunikation
• Marco Westphal, Bonn, Managing Director of
Stadtwerke Bonn GmbH
• Thomas Zaremba, Jena, Managing Director of
Stadtwerke Energie Jena-Pößneck GmbH
Trianel GmbH reimbursed a total of € 41 thousand (prev.
year € 38 thousand) as expenses in the 2016 fi nancial
year.
5.5 Management Board
As of the balance sheet date 31 December 2016, the
Managing Directors of the company on the balance
sheet date were Dipl.-Volkswirt Sven Becker, certifi ed
economist (Spokesman) and Dr. Jörg Vogt (Dipl.-Ver-
waltungswissenschaftler; certifi ed public administrator).
As of 31 December 2016, Dr. Vogt stepped down as a
managing director. Effective from 16 January 2017,
Dr. Oliver Runte (Dipl.-Chemiker, certifi ed chemist) has
been appointed as another Managing Director of the
company.
The company has opted not to disclose the emoluments
paid to the Managing Directors in the fi nancial year
under review in accordance with Section 286, para. 4
of the German Commercial Code (HGB).
5.6 Annual fi nancial statements
The annual fi nancial statements are published in the
Electronic Federal Bulletin under number HRB 7729.
5.7 Appropriation of earnings
The management board will propose to the sharehold-
ers‘ committee to carry the loss for the year 2016
totalling € 4,139,058.53 forward to new account.
Aachen, 27 April 2017
Trianel GmbH
Sven Becker Dr. Oliver Runte
Management Board of Trianel GmbH
2. CHANCENBERICHT
52
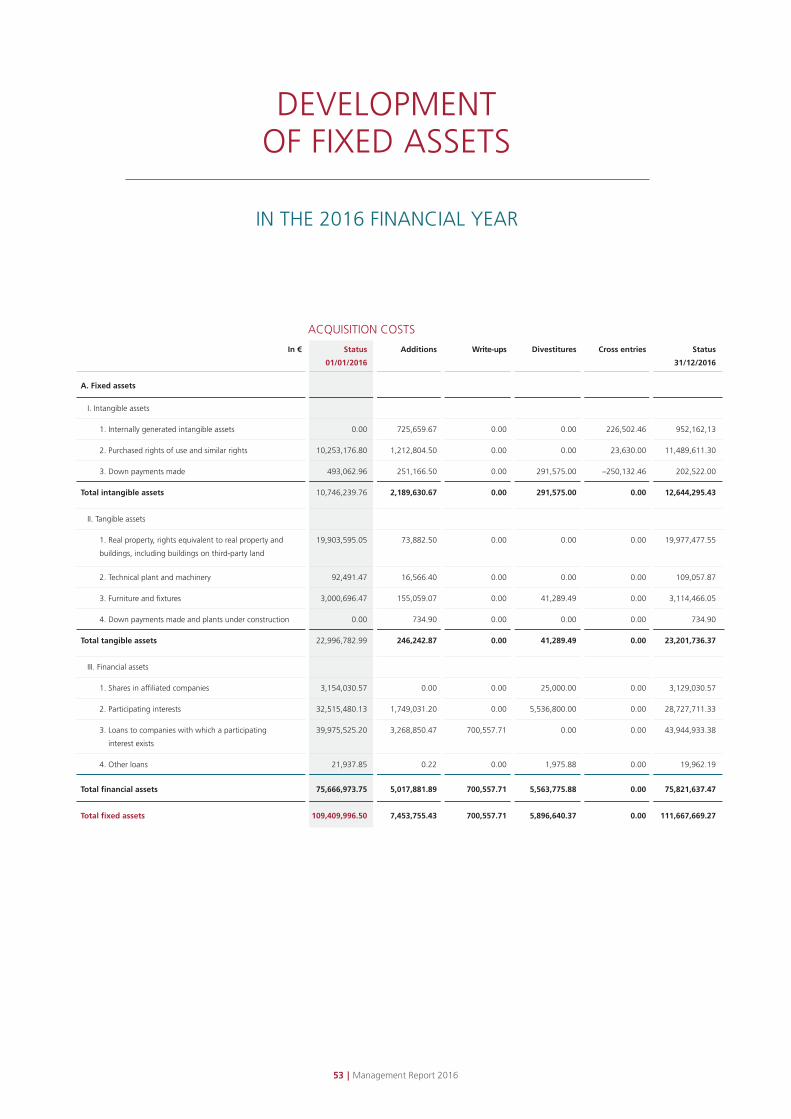
54 | Management Report 2016 55 | Management Report 2016
DEVELOPMENT OF FIXED ASSETS
In € Status
01/01/2016
Additions Write-ups Divestitures Cross entries Status
31/12/2016
A. Fixed assets
I. Intangible assets
1. Internally generated intangible assets 0.00 725,659.67 0.00 0.00 226,502.46 952,162,13
2. Purchased rights of use and similar rights 10,253,176.80 1,212,804.50 0.00 0.00 23,630.00 11,489,611.30
3. Down payments made 493,062.96 251,166.50 0.00 291,575.00 –250,132.46 202,522.00
Total intangible assets 10,746,239.76 2,189,630.67 0.00 291,575.00 0.00 12,644,295.43
II. Tangible assets
1. Real property, rights equivalent to real property and
buildings, including buildings on third-party land
19,903,595.05 73,882.50 0.00 0.00 0.00 19,977,477.55
2. Technical plant and machinery 92,491.47 16,566.40 0.00 0.00 0.00 109,057.87
3. Furniture and fixtures 3,000,696.47 155,059.07 0.00 41,289.49 0.00 3,114,466.05
4. Down payments made and plants under construction 0.00 734.90 0.00 0.00 0.00 734.90
Total tangible assets 22,996,782.99 246,242.87 0.00 41,289.49 0.00 23,201,736.37
III. Financial assets
1. Shares in affiliated companies 3,154,030.57 0.00 0.00 25,000.00 0.00 3,129,030.57
2. Participating interests 32,515,480.13 1,749,031.20 0.00 5,536,800.00 0.00 28,727,711.33
3. Loans to companies with which a participating
interest exists
39,975,525.20 3,268,850.47 700,557.71 0.00 0.00 43,944,933.38
4. Other loans 21,937.85 0.22 0.00 1,975.88 0.00 19,962.19
Total financial assets 75,666,973.75 5,017,881.89 700,557.71 5,563,775.88 0.00 75,821,637.47
Total fixed assets 109,409,996.50 7,453,755.43 700,557.71 5,896,640.37 0.00 111,667,669.27
IN THE 2016 FINANCIAL YEAR
ACQUISITION COSTS
53

55 | Management Report 2016
In € Status
01/01/2016
Additions Divestitures Status
31/12/2016
Status
31/12/2016
Status
31/12/2015
A. Fixed assets
I. Intangible assets
1. Internally generated intangible assets 0.00 100,440.13 0.00 100,440.13 851,722.00 0.00
2. Purchased rights of use and similar rights 7,814,616.30 1,222,647.50 0.00 9,037,263.80 2,452,347.50 2,438,560.50
3. Down payments made 0.00 0.00 0.00 0.00 202,522.00 493,062.96
Total intangible assets 7,814,616.30 1,323,087.63 0.00 9,137,703.93 3,506,591.50 2,931,623.46
II. Tangible assets
1. Real property, rights equivalent to real property and
buildings, including buildings on third-party land
1,041,435.05 623,339.50 0.00 1,664,774.55 18,312,703.00 18,862,160.00
2. Technical plant and machinery 11,676.47 13,153.40 0.00 24,829.87 84,228.00 80,815.00
3. Furniture and fixtures 1,564,852.47 310,738.07 40,410.49 1,835,180,05 1,279,286,00 1,435,844.00
4. Down payments made and plants under construction 0.00 0.00 0.00 0.00 734.90 0.00
Total tangible assets 2,617,963.99 947,230.97 40,410,49 3,524,784,47 19,676,951.90 20,378,819.00
III. Financial assets
1. Shares in affiliated companies 309,999.00 0.00 0.00 309,999.00 2,819,031.57 2,844,031.57
2. Participating interests 0.00 0.00 0.00 0.00 28,727,711.33 32,515,480.13
3. Loans to companies with which a participating
interest exists
0.00 0.00 0.00 0.00 43,944,933.38 39,975,525.20
4. Other loans 0.00 0.00 0.00 0.00 19,962.19 21,937.85
Total financial assets 309,999.00 0.00 0.00 309,999.00 75,511,638.47 75,356,974.75
Total fixed assets 10,742,579.29 2,270,318.60 40,410.49 12,972,487.40 98,695,181.87 98,667,417.21
DEPRECIATION BOOK VALUES
54
56 | Management Report 2016 57 | Management Report 2016
AUDITOR’S CERTIFICATE
FOR THE FINANCIAL YEAR 2016
We audited the consolidated financial statements
drawn up by Trianel GmbH – consisting of the balance
sheet, profit and loss statement, notes, cash flow
statement and equity capital analysis – and the Group
Management Report for the financial year from
1 January to 31 December 2016. The consolidated
annual financial statements and Group Management
Report were prepared in accordance with the German
Commercial Code and the supplementary provisions
of the articles of association at the responsibility of the
company’s legal representatives. Our assignment is to
issue an assessment of the consolidated accounts and of
the group management report on the basis of the audit
carried out by us.
We conducted our audit of the annual financial state-
ments in accordance with Section 317 of the German
Commercial Code (HGB) and observing the auditing
principles generally accepted in Germany as stipulated
by the Institute of German Certified Public Accountants
(IDW). Those principles require that we plan and perform
the audit to obtain reasonable assurance regarding the
detection of any errors or irregularities with respect
to the impression given of the company’s net worth,
financial and profit situation, as reported through
its annual financial statements, set up in accordance
with the generally accepted accounting principles, its
company accounts, and its management report. When
determining audit procedures, knowledge of the
company’s business operations, as well as its economic
and legal environment, and anticipation of possible
errors are taken into consideration. As part of the audit,
the effectiveness of the accounting-related internal
control systems and documentation of the data in
the consolidated financial statements and Group
Management Report are judged largely on a test basis.
The audit includes the assessment of the correctness
of the annual financial statements for the companies
incorporated in the consolidated financial statements,
the definition of the consolidated group, the accounting
and consolidation principles applied, and of the funda-
mental assessments of the legal representatives, and a
consideration of the overall presentation of the consoli-
dated financial statements and Group Management
Report. In our view, our audit provides a sufficiently
reliable basis for our opinion.
Our audit did not result in any objections.
In our opinion, based on the information gained in the
audit, the consolidated annual financial statements are
in conformity with statutory requirements and the
supplementary provisions of the articles of association
and, in compliance with the generally accepted
accounting principles, they give a true and fair view
of the net assets, financial situation and results of
operations of the group. The Group Management
Report tallies with the consolidated financial statements,
complies with the statutory requirements, conveys an
accurate representation of the situation of the group
overall, and presents the opportunities and risks of
future developments accurately.
Duisburg, 28 April 2017
PKF FASSELT SCHLAGE
Partnerschaft mbB
Auditing Firm
Tax Consultants
Attorneys
Jahn Hesse
Certified Public Accountant Certified Public Accountant
55

57 | Management Report 2016
CONSOLIDATED ANNUAL FINANCIAL STATEMENTS
Consolidated balance sheet 57
Consolidated profit and loss statement 59
56
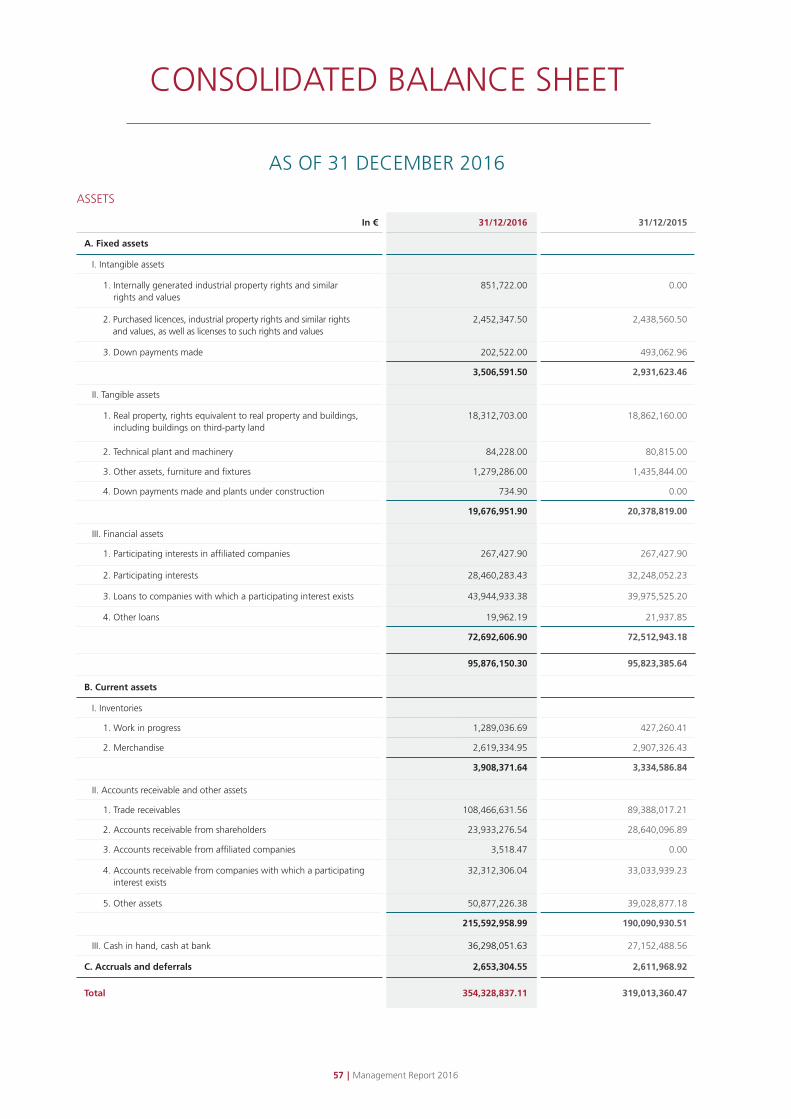
58 | Management Report 2016 59 | Management Report 2016
CONSOLIDATED BALANCE SHEET
In € 31/12/2016 31/12/2015
A. Fixed assets
I. Intangible assets
1. Internally generated industrial property rights and similar rights and values
851,722.00 0.00
2. Purchased licences, industrial property rights and similar rights and values, as well as licenses to such rights and values
2,452,347.50 2,438,560.50
3. Down payments made 202,522.00 493,062.96
3,506,591.50 2,931,623.46
II. Tangible assets
1. Real property, rights equivalent to real property and buildings, including buildings on third-party land
18,312,703.00 18,862,160.00
2. Technical plant and machinery 84,228.00 80,815.00
3. Other assets, furniture and fixtures 1,279,286.00 1,435,844.00
4. Down payments made and plants under construction 734.90 0.00
19,676,951.90 20,378,819.00
III. Financial assets
1. Participating interests in affiliated companies 267,427.90 267,427.90
2. Participating interests 28,460,283.43 32,248,052.23
3. Loans to companies with which a participating interest exists 43,944,933.38 39,975,525.20
4. Other loans 19,962.19 21,937.85
72,692,606.90 72,512,943.18
95,876,150.30 95,823,385.64
B. Current assets
I. Inventories
1. Work in progress 1,289,036.69 427,260.41
2. Merchandise 2,619,334.95 2,907,326.43
3,908,371.64 3,334,586.84
II. Accounts receivable and other assets
1. Trade receivables 108,466,631.56 89,388,017.21
2. Accounts receivable from shareholders 23,933,276.54 28,640,096.89
3. Accounts receivable from affiliated companies 3,518.47 0.00
4. Accounts receivable from companies with which a participating interest exists
32,312,306.04 33,033,939.23
5. Other assets 50,877,226.38 39,028,877.18
215,592,958.99 190,090,930.51
III. Cash in hand, cash at bank 36,298,051.63 27,152,488.56
C. Accruals and deferrals 2,653,304.55 2,611,968.92
Total 354,328,837.11 319,013,360.47
ASSETS
AS OF 31 DECEMBER 2016
57

59 | Management Report 2016
In € 31/12/2016 31/12/2015
A. Equity
I. Capital stock 20,152,575.00 20,152,575.00
II. Capital reserves 26,129,469.24 26,129,469.24
III. Earnings reserves 41,840,473.94 41,679,763.26
IV. Consolidated loss for the year (prev. yr. net income) –4,132,222.18 173,686.22
83,990,296.00 88,135,493.72
B. Difference from capital consolidation 29,683.58 29,683.58
C. Provisions
1. Provisions for pensions 102,685.00 74,985.00
2. Provisions for taxes 582.00 178.50
3. Other provisions 45,457,390.86 49,557,041.65
45,560,657.86 49,632,205.15
D. Liabilities
1. Accounts payable to credit institutions 20,882,533.21 24,094,617.48
2. Down payments received for orders 495,611.34 495,611.34
3. Trade accounts payable 142,223,096.47 119,549,465.79
4. Accounts payable to shareholders 12,166,430.44 16,156,007.87
5. Accounts payable to affiliated companies 42,180.04 0.00
6. Accounts payable to companies with which a participating interest exists
27,736,938.71 13,947,270.86
7. Other accounts payable 20,420,931.83 6,433,656.59
• Of which from taxes € 387,336.72 (prev. year € 336,338.18)
• Of which for social security € 164,894.96 (prev. year € 175,542.09)
223,967,722.04 180,676,629.93
E. Accruals and deferrals 780,477.63 539,348.09
Total 354,328,837.11 319,013,360.47
EQUITY AND LIABILITIES
58

60 | Management Report 2016 61 | Management Report 2016
In € 2016 2015
1. Sales proceeds 2,172,947,047.82 2,128,237,238.37
2. Increase in inventory of finished and semi-finished products 1,044,217.21 427,260.41
3. Other operating income • Of which from currency conversion: € 973,500.57 (prev. year € 2,263,989.01)
17,034,520.84 11,258,271.48
4. Cost of materials • Expenditures associated with raw materials and supplies and for purchased goods
–2,141,622,388.32 –2,087,474,637.86
5. Personnel expenditures
a) Wages and salaries –26,150,748.30 –23,950,035.49
b) Social charges and expenditure for pension provision and support
–4,043,187.54 –3,915,631.15
–30,193,935.84 –27,865,666.64
6. Depreciation
a) On intangible fixed assets and tangible fixed assets –2,270,318.60 –2,064,176.87
b) On current assets which exceed usual depreciation in the corporation
–184,438.93 –3,205.42
–2,454,757.53 –2,067,382.29
7. Other operating expenditure • Of which from currency conversion: € 1,099,661.79 (prev. year € 2,115,803.61)
–20,634,831.17 –23,170,674.45
8. Revenue from participating interests 271,605.78 1,033,072.52
9. Other interest and similar revenues • Of which from discounting: € 722,546.00 (prev, year € 680,628.92)
4,830,512.28 4,579,368.55
10. Interest and similar expenditure • Of which from compounding: € 1,758,468.43 (prev. year € 2,316,479.80)
–4,441,217.17
660,900.89
–4,683,225.82
929,215.25
11. Tax on income and revenue –906,514.08 –94,595.82
12. Earnings after tax –4,125,740.18 179,028.45
13. Other taxes –6,482.00 –5,342.23
Consolidated loss for the year (prev. yr. net income) –4,132,222.18 173,686.22
CONSOLIDATED PROFIT AND LOSS STATEMENT
FOR THE FINANCIAL YEAR FROM 01 JANUARY 2016 TO 31 DECEMBER 2016
59
61 | Management Report 2016
Trianel GmbH
Unternehmenskommunikation
Krefelder Straße 203
52070 Aachen
Germany
Fon +49 241 413 20-0
Fax +49 241 413 20-300
www.trianel.com
Pictures: Trianel GmbH
Layout and typesetting:
Jessica Bala, Aachen
www.la-bala.com
Publishing details
www.trianel.com
60