17 September 2018 LSE: PDL Petra Diamonds Limited “Petra ... · "Johan has led Petra through a...
57
Page 1 of 57 17 September 2018 LSE: PDL Petra Diamonds Limited (“Petra”, “the Company” or “the Group”) Preliminary Results Announcement for the Year ended 30 June 2018 (unaudited) Petra Diamonds Limited announces its preliminary results (unaudited) for the year ended 30 June 2018 (“the Year” or “FY 2018”). Note: Unless stated otherwise, the financial results in this announcement are adjusted to exclude the results of KEM JV, which has been reclassified as a discontinued operation for FY 2018 and FY 2017. An appendix has been included on page 25 to show operational results prior to its reclassification, for reference only. Financial Highlights Revenue up 25% to US$495.3 million (FY 2017: US$394.8 million). Adjusted EBITDA 3 up 37% to US$195.4 million (FY 2017: US$142.6 million); adjusted EBITDA margin of 39% (FY 2017: 36%). Profit from mining activities up 33% to US$205.1 million (FY 2017: US$153.9 million). Previously reported Koffiefontein impairment charge of US$66 million. Total loss on discontinued operations relating to KEM JV of US$104.3 million (US$52.0 million impairment passed in H1 FY 2018, further impairments of US$40.7 million in H2 FY 2018, and a trading loss of US$11.6 million for the Year). Net loss after tax of US$203.1 million (FY 2017 net profit after tax: US$20.7 million), including KEM JV. Adjusted EPS 6 from continuing operations: 0.50 US$ cents per share (FY 2017: 5.50 US$ cents per share). Basic loss per share from continuing operations: 15.85 US$ cents per share, as a result of Koffiefontein impairment charges (FY 2017 basic profit per share from continuing operations: 3.14 US$ cents per share). Adjusted operating cashflow 13 up 7% to US$157.0 million (FY 2017: US$147.0 million), despite the negative impact of the blocked Williamson parcel and overdue VAT receivables in Tanzania. Net debt reduced to US$445.7 million (US$520.7 million net of diamond debtors of US$75.0 million) further to the receipt of Rights Issue net proceeds (30 June 2017: US$522.7 million (US$555.3 million net of diamond debtors of US$32.6 million)). Excluding the effect of cash inflow from the Rights Issue, net debt reduced to US$615.7 million at 30 June 2018 from a peak of US$644.7 million at 31 December 2017. Depreciation increased to US$128.0 million (FY 2017: US$63.3 million) due to the commissioning of new infrastructure, coupled with accelerated depreciation of US$25.2 million relating to old mining areas at Cullinan and Finsch and the old Cullinan plant.
Transcript of 17 September 2018 LSE: PDL Petra Diamonds Limited “Petra ... · "Johan has led Petra through a...
Page 1 of 57
17 September 2018 LSE: PDL
Petra Diamonds Limited (“Petra”, “the Company” or “the Group”)
Preliminary Results Announcement for the Year ended 30 June 2018 (unaudited)
Petra Diamonds Limited announces its preliminary results (unaudited) for the year ended 30 June 2018 (“the Year” or “FY 2018”). Note: Unless stated otherwise, the financial results in this announcement are adjusted to exclude the results of KEM JV, which has been reclassified as a discontinued operation for FY 2018 and FY 2017. An appendix has been included on page 25 to show operational results prior to its reclassification, for reference only. Financial Highlights
Revenue up 25% to US$495.3 million (FY 2017: US$394.8 million).
Adjusted EBITDA3 up 37% to US$195.4 million (FY 2017: US$142.6 million); adjusted EBITDA margin of 39% (FY 2017: 36%).
Profit from mining activities up 33% to US$205.1 million (FY 2017: US$153.9 million).
Previously reported Koffiefontein impairment charge of US$66 million.
Total loss on discontinued operations relating to KEM JV of US$104.3 million (US$52.0 million impairment passed in H1 FY 2018, further impairments of US$40.7 million in H2 FY 2018, and a trading loss of US$11.6 million for the Year).
Net loss after tax of US$203.1 million (FY 2017 net profit after tax: US$20.7 million), including KEM JV.
Adjusted EPS6 from continuing operations: 0.50 US$ cents per share (FY 2017: 5.50 US$ cents per share).
Basic loss per share from continuing operations: 15.85 US$ cents per share, as a result of Koffiefontein impairment charges (FY 2017 basic profit per share from continuing operations: 3.14 US$ cents per share).
Adjusted operating cashflow13 up 7% to US$157.0 million (FY 2017: US$147.0 million), despite the negative impact of the blocked Williamson parcel and overdue VAT receivables in Tanzania.
Net debt reduced to US$445.7 million (US$520.7 million net of diamond debtors of US$75.0 million) further to the receipt of Rights Issue net proceeds (30 June 2017: US$522.7 million (US$555.3 million net of diamond debtors of US$32.6 million)).
Excluding the effect of cash inflow from the Rights Issue, net debt reduced to US$615.7 million at 30 June 2018 from a peak of US$644.7 million at 31 December 2017.
Depreciation increased to US$128.0 million (FY 2017: US$63.3 million) due to the commissioning of new infrastructure, coupled with accelerated depreciation of US$25.2 million relating to old mining areas at Cullinan and Finsch and the old Cullinan plant.
Page 2 of 57
Current Trading
Total production of 718,635 carats for July and August; on track to achieve previously stated guidance of 3.8 – 4.0 Mcts for FY 2019 (excluding KEM JV).
Grades recovered in FY 2019 to date are in line with expectations, with Cullinan recording a ROM grade of 40.6 cpht in the financial year to date.
Previously reported turnaround at Koffiefontein being maintained, in line with FY 2019 targeted throughput.
Sales of ca. US$78 million from the September tender, with prices down ca. 5% on a like-for-like basis, compared with H2 FY 2018, affected by seasonal weakness as in previous years. Cullinan average price in the lower end of historical price ranges. Six further tenders planned for FY 2019.
Current ZAR:USD weakness is expected to have positive impact on ZAR cashflows. Operational Highlights
Safety: Group Lost Time Injury Frequency Rate (‘LTIFR’) improved to 0.23 (FY 2017: 0.27).
Production excluding KEM JV up 19% to 3.8 Mcts (FY 2017: 3.2 Mcts); including KEM JV, up 15% to 4.6 Mcts (FY 2017: 4.0 Mcts).
Operational Capex (excluding capitalised borrowing costs) of US$129.6 million (FY 2017: US$226.2 million), reflecting the declining trend due to the advanced stage of the Group’s expansion programmes.
In Rand terms, the Group achieved absolute on mine costs in line with expectations, however the strength of the Rand in FY 2018, as well as the effect of accelerated depreciation, has had a negative impact on US Dollar reported operating costs.
Corporate
Net proceeds of ca. US$170 million raised via the Rights Issue; ca. US$107 million used to fully pay down outstanding drawn indebtedness with the South African Lending Group post Year end, whilst retaining both facilities.
Binding Heads of Agreement reached post Year end with regards to the disposal of the Company's interest in the KEM JV to Petra's joint venture partner Ekapa Mining (Pty) Ltd (“Ekapa Mining”).
As noted in the FY 2018 Trading Update, the Nomination Committee is currently in year two of its three year succession plan and is continuing to review its Board, board committee and senior management structures. Good progress is being made with plans to make additional changes in FY 2019 in order to ensure the Company has the right mix of expertise and skills. New non-executive appointments are currently being confirmed with a view to making an announcement in this regard in October 2018.
As part of the Nomination Committee Succession plan, a process to identify a successor for the CEO position has now commenced. In line with the Company's development from a phase of intensive capital expenditure and expansion to a focus on steady state operations, Johan Dippenaar will be stepping down from the role when an appointment has been made.
No covenant measurement required for June 2018, further to the South African lender group agreeing to waive this covenant measurement period.
Outlook
Focus on operational cost efficiencies; total FY 2019 absolute on-mine cash costs are expected to remain largely flat compared to FY 2018 costs in ZAR local currency.
FY 2019 Capex (excluding capitalised borrowing costs) is guided at ca. US$93 million, continuing the declining trend since peak Capex was reached in FY 2016.
The recent ZAR:USD weakness has provided favourable hedging opportunities and the Board is reviewing the potential to take a longer view and increase percentages of US Dollar denominated sales covered.
Whilst noting the typical seasonal weakness experienced at the first tender of FY 2019, the Company expects prices to be broadly stable in FY 2019.
Page 3 of 57
Johan Dippenaar, CEO, said: “FY 2018 yielded good operational results, the highest on record to date, in spite of the challenges experienced in FY 2017 and H1 FY 2018, and this was underpinned by strong safety performance across the Group. Learning from past challenges, the Group’s focus is to regain investor confidence by the continued optimisation of operations, thereby delivering consistent production output with efficient operating and capital expenditure. Petra remains on track to generate free cash flow, enabling the Company to achieve a reduction in leverage to its target of two times or less consolidated net debt to consolidated EBITDA by the end of FY 2020.” Commenting on the Succession Plan announcements, Adonis Pouroulis, Chairman, said: "Johan has led Petra through a long period of significant growth, taking the Company’s annual production from approximately 175,000 carats in FY 2006 to 4.6 million carats in FY 2018, and establishing the Company as a leading independent diamond producer. As Petra now approaches the final stage of its expansion plans, it is positioned to reap the benefits and, in line with the Nomination Committee's Succession Plan, a successor for the CEO position will be appointed in due course. Johan will continue in the role of CEO until this time and will work closely with the Board to ensure an efficient handover. I would like to take this opportunity to express the Board's sincere gratitude for all that he has done for Petra. We look forward to updating the market with new non-executive appointments in October." Results Presentation, Webcast and Conference Call Presentation: A presentation for analysts will be held at 9:30am BST on 17 September 2018 at the offices of Buchanan, 107 Cheapside, London EC2V 6DN. Webcast: A live webcast of the presentation will be available on Petra’s website at www.petradiamonds.com and on: https://www.investis-live.com/petra-diamonds/5b88fe18a2d81c0a0082b43c/pdpr. A recording will be available from 1:00pm BST on 17 September 2018 on the same link. A conference call line will also be available to allow participants to listen to the webcast by dialling one of the following numbers shortly before 9:30am BST: From the UK (toll free): 0808 237 0040 From South Africa (toll free): 0800 222 290 From the rest of the world: +44 20 3428 1542 Participant passcode: 72931911# Conference Call A conference call with management to cater for North American and other international investors will be held at 4:00pm BST on 17 September 2018. Participants are advised to view the results presentation webcast in advance of the call, as the full management commentary on the results will not be repeated. From the United States (toll free): 1866 928 7517 From the rest of the world: +44 203 428 1542 From the UK (toll free): 0808 237 0040 Participant passcode: 72472759#
Page 4 of 57
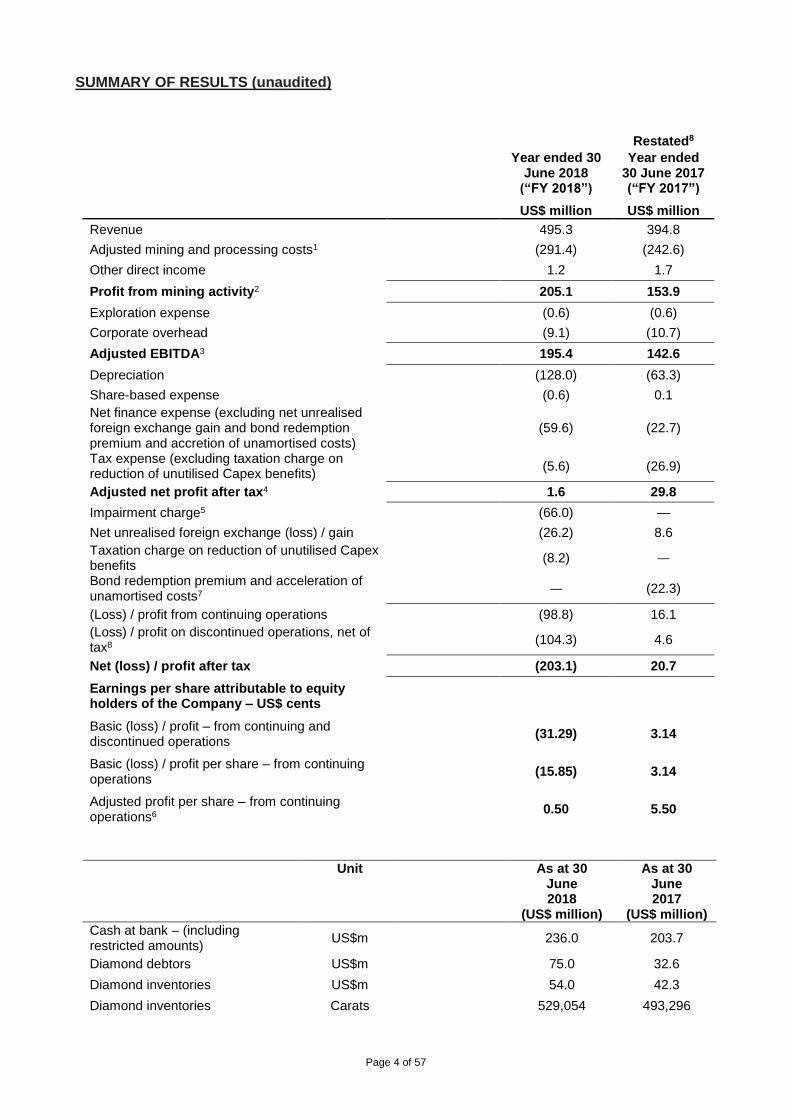
SUMMARY OF RESULTS (unaudited)
Restated8
Year ended 30 June 2018
(“FY 2018”)
Year ended 30 June 2017 (“FY 2017”)
US$ million US$ million
Revenue 495.3 394.8
Adjusted mining and processing costs1 (291.4) (242.6)
Other direct income 1.2 1.7
Profit from mining activity2 205.1 153.9
Exploration expense (0.6) (0.6)
Corporate overhead (9.1) (10.7)
Adjusted EBITDA3 195.4 142.6
Depreciation (128.0) (63.3)
Share-based expense (0.6) 0.1
Net finance expense (excluding net unrealised foreign exchange gain and bond redemption premium and accretion of unamortised costs)
(59.6) (22.7)
Tax expense (excluding taxation charge on reduction of unutilised Capex benefits)
(5.6) (26.9)
Adjusted net profit after tax4 1.6 29.8
Impairment charge5 (66.0) —
Net unrealised foreign exchange (loss) / gain (26.2) 8.6
Taxation charge on reduction of unutilised Capex benefits
(8.2) —
Bond redemption premium and acceleration of unamortised costs7 — (22.3)
(Loss) / profit from continuing operations (98.8) 16.1
(Loss) / profit on discontinued operations, net of tax8
(104.3) 4.6
Net (loss) / profit after tax (203.1) 20.7
Earnings per share attributable to equity holders of the Company – US$ cents
Basic (loss) / profit – from continuing and discontinued operations
(31.29) 3.14
Basic (loss) / profit per share – from continuing operations (15.85) 3.14
Adjusted profit per share – from continuing operations6
0.50 5.50
Unit
As at 30 June 2018
(US$ million)
As at 30 June 2017
(US$ million)
Cash at bank – (including restricted amounts) US$m 236.0 203.7
Diamond debtors US$m 75.0 32.6
Diamond inventories US$m 54.0 42.3
Diamond inventories Carats 529,054 493,296
Page 5 of 57
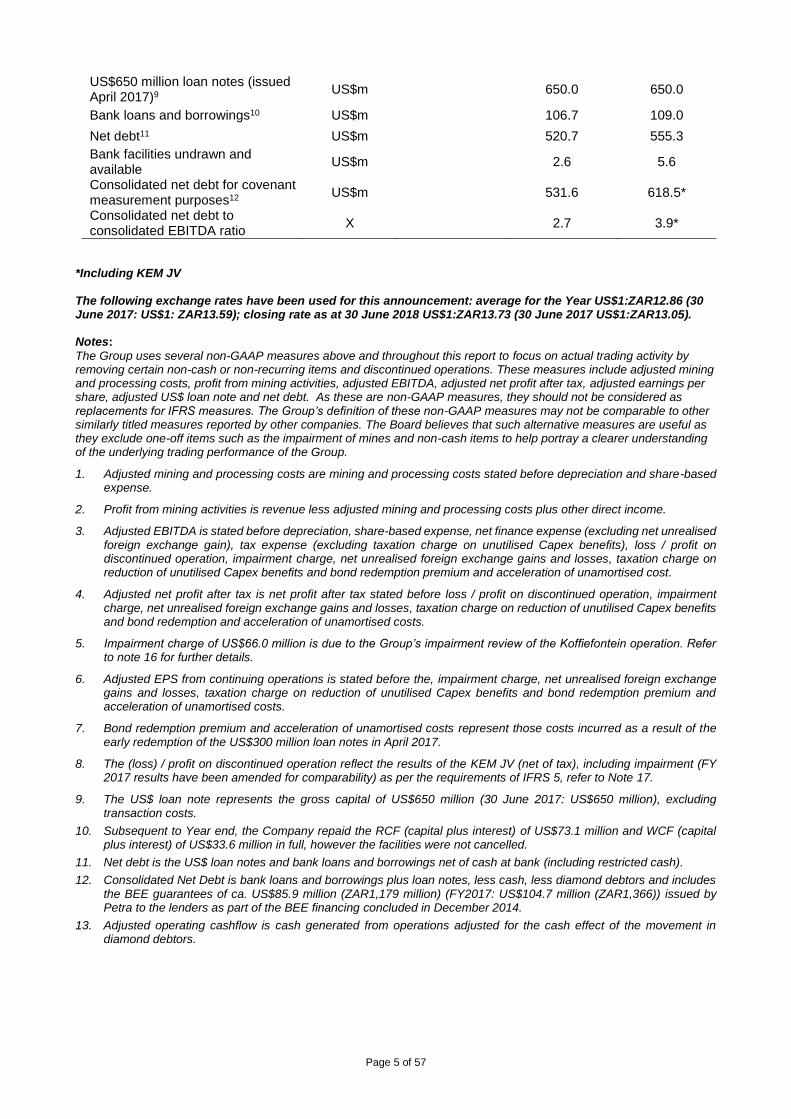
US$650 million loan notes (issued April 2017)9
US$m 650.0 650.0
Bank loans and borrowings10 US$m 106.7 109.0
Net debt11 US$m 520.7 555.3
Bank facilities undrawn and available
US$m 2.6 5.6
Consolidated net debt for covenant measurement purposes12
US$m 531.6 618.5*
Consolidated net debt to consolidated EBITDA ratio
X 2.7 3.9*
*Including KEM JV The following exchange rates have been used for this announcement: average for the Year US$1:ZAR12.86 (30 June 2017: US$1: ZAR13.59); closing rate as at 30 June 2018 US$1:ZAR13.73 (30 June 2017 US$1:ZAR13.05). Notes:
The Group uses several non-GAAP measures above and throughout this report to focus on actual trading activity by removing certain non-cash or non-recurring items and discontinued operations. These measures include adjusted mining and processing costs, profit from mining activities, adjusted EBITDA, adjusted net profit after tax, adjusted earnings per share, adjusted US$ loan note and net debt. As these are non-GAAP measures, they should not be considered as replacements for IFRS measures. The Group’s definition of these non-GAAP measures may not be comparable to other similarly titled measures reported by other companies. The Board believes that such alternative measures are useful as they exclude one-off items such as the impairment of mines and non-cash items to help portray a clearer understanding of the underlying trading performance of the Group.
1. Adjusted mining and processing costs are mining and processing costs stated before depreciation and share-based expense.
2. Profit from mining activities is revenue less adjusted mining and processing costs plus other direct income.
3. Adjusted EBITDA is stated before depreciation, share-based expense, net finance expense (excluding net unrealised foreign exchange gain), tax expense (excluding taxation charge on unutilised Capex benefits), loss / profit on discontinued operation, impairment charge, net unrealised foreign exchange gains and losses, taxation charge on reduction of unutilised Capex benefits and bond redemption premium and acceleration of unamortised cost.
4. Adjusted net profit after tax is net profit after tax stated before loss / profit on discontinued operation, impairment charge, net unrealised foreign exchange gains and losses, taxation charge on reduction of unutilised Capex benefits and bond redemption and acceleration of unamortised costs.
5. Impairment charge of US$66.0 million is due to the Group’s impairment review of the Koffiefontein operation. Refer to note 16 for further details.
6. Adjusted EPS from continuing operations is stated before the, impairment charge, net unrealised foreign exchange gains and losses, taxation charge on reduction of unutilised Capex benefits and bond redemption premium and acceleration of unamortised costs.
7. Bond redemption premium and acceleration of unamortised costs represent those costs incurred as a result of the early redemption of the US$300 million loan notes in April 2017.
8. The (loss) / profit on discontinued operation reflect the results of the KEM JV (net of tax), including impairment (FY 2017 results have been amended for comparability) as per the requirements of IFRS 5, refer to Note 17.
9. The US$ loan note represents the gross capital of US$650 million (30 June 2017: US$650 million), excluding transaction costs.
10. Subsequent to Year end, the Company repaid the RCF (capital plus interest) of US$73.1 million and WCF (capital plus interest) of US$33.6 million in full, however the facilities were not cancelled.
11. Net debt is the US$ loan notes and bank loans and borrowings net of cash at bank (including restricted cash).
12. Consolidated Net Debt is bank loans and borrowings plus loan notes, less cash, less diamond debtors and includes the BEE guarantees of ca. US$85.9 million (ZAR1,179 million) (FY2017: US$104.7 million (ZAR1,366)) issued by Petra to the lenders as part of the BEE financing concluded in December 2014.
13. Adjusted operating cashflow is cash generated from operations adjusted for the cash effect of the movement in diamond debtors.
Page 6 of 57
The information communicated in this announcement is inside information for the purposes of Article 7 of Regulation 596/2014.
For further information, please contact: Petra Diamonds, London Telephone: +44 20 7494 8203 Cornelia Grant Marianna Bowes [email protected] Buchanan Telephone: +44 20 7466 5000 (PR Adviser) Bobby Morse [email protected] About Petra Diamonds Limited Petra Diamonds is a leading independent diamond mining group and a consistent supplier of gem quality rough diamonds to the international market. The Company has a diversified portfolio incorporating interests in three underground producing mines in South Africa (Finsch, Cullinan and Koffiefontein) and one open pit producing mine in Tanzania (Williamson). It announced in July 2018 the proposed disposal of its interest in the Kimberley Ekapa Mining JV in South Africa. It also maintains an exploration programme in Botswana and South Africa. Petra's strategy is to focus on value rather than volume production by optimising recoveries from its high quality asset base in order to maximise their efficiency and profitability. The Group has a significant resource base of ca. 290 million carats, which supports the potential for long-life operations. Petra conducts all operations according to the highest ethical standards and will only operate in countries which are members of the Kimberley Process. The Company aims to generate tangible value for each of its stakeholders, thereby contributing to the socio-economic development of its host countries and supporting long-term sustainable operations to the benefit of its employees, partners and communities. Petra is quoted with a premium listing on the Main Market of the London Stock Exchange under the ticker 'PDL' and is a constituent of the FTSE4Good Index. For more information, visit www.petradiamonds.com. CEO’S REVIEW The number one priority of any business like ours is safety and this sits at the heart of everything we do. We are therefore greatly encouraged by the strong performance in this area over the Year, with the Group reporting an LTIFR of 0.23 (FY 2017: 0.27). Whilst this is a noteworthy achievement, reaching a zero-harm workplace remains our key priority and we strive towards this goal. Based on production recorded in the first two months of FY 2019, the Group is on track to achieve its FY 2019 target of 3.8 – 4.0 Mcts (excluding KEM JV). Grades recovered to date are also in line with expectations, with Cullinan recording a ROM grade of 40.6 cpht in the first two months of the year. Taking into account the operational delays we experienced in FY 2017, including bringing the new plant at Cullinan on stream and a slower than anticipated ramp up of the new Sub Level Cave (“SLC”) at Finsch, coupled with the business challenges in H1 FY 2018, relating to strikes in South Africa (resolved after two weeks) and the parcel of ca. 72,000 carats from Williamson in Tanzania that remains blocked from export, we achieved solid operational results for the Year which is testament to the continued hard work of our team. Excluding KEM JV, group production saw an increase of 19% to 3.8 Mcts and revenue grew by 25% to US$495.3 million. As a result of the increased revenue achieved, we recorded a 33% increase in profit from mining activities of US$205.1 million (FY 2017: US$153.9 million), which, coupled with a
Page 7 of 57
continued tight control on overheads, resulted in a healthy adjusted EBITDA margin of 39% (FY 2017: 36%). Optimisation of the new plant at Cullinan is ongoing and the recovered ROM grade achieved in Q4 FY 2018 demonstrated the progress being made, and was in line with guidance at 39 cpht. Reflecting the advanced stages of the Group’s expansion programmes, the growth in diamond production for the Year was driven by an increase in higher value carats from ROM operations, with the contribution from lower value diamonds from surface tailings operations decreasing as planned. ROM carats represented 95% of the overall production profile in FY 2018, increasing from 86% in the prior year. In Rand terms, the Group achieved absolute on mine costs in line with expectations (excluding KEM JV, where expenditure relating to security and other measures associated with illegal mining activities inflated costs), however the strength of the Rand, as well as the effect of accelerated depreciation, has had a negative impact on US Dollar reported operating costs. Driving cost efficiencies across our asset portfolio will be a focus for the Company going forward. Operational Capex (excluding capitalised interest) decreased 46% as a result of our reducing capital profile, and in line with budget, and we expect this trend to continue with ca. US$93 million of Capex in FY 2019 (excluding KEM JV and capitalised borrowing costs) and ca. US$72 million in FY 20201. Taking into account the lower levels of capital expenditure going forward, Petra’s future focus will be on the continued optimisation of operations and the generation of free cash flow. A key part of the Company’s strategy going forward will be to drive operational efficiencies throughout the portfolio, with an emphasis on value-over-volume production. Petra completed a Rights Issue in June 2018 to raise net proceeds of ca. US$170 million, in which all directors who are shareholders took up their full allocation of rights amounting to ca. 14.4 million shares. The Rights Issue enabled a reduction in leverage to 2.7x Consolidated Net Debt to Consolidated EBITDA at 30 June 2018 (30 June 2017 2017: 3.9x). The Board has set a target to further reduce this ratio to a more sustainable level of 2x or less by the end of FY 2020. Another important element of the Company’s strategy is the ongoing review of its assets to maximise return on capital. In H1 FY 2018, Koffiefontein and KEM JV were subject to impairments totalling a combined US$118.0 million, due to the fact that each of the operations has a high level of sensitivity to the strengthening of the Rand on the US Dollar operating costs, coupled with execution risk related to their remaining expansion targets, as well as lower than forecast pricing for KEM JV, as a result of a higher than anticipated proportion of smaller, low value goods, and revised lower pricing at Koffiefontein. In response to the unsatisfactory performance at these operations, a number of management interventions were implemented, including the relocation of key personnel to local management positions, as well as restructuring capital and operational costs. We are pleased to note that Koffiefontein saw improvements towards the end of the Year, as a result of the commissioning of the new ground handling system in Q3 FY 2018; this improved operational delivery was also evident in the first two months of FY 2019. We believe that we have now put the right conditions in place for this mine to start making a positive contribution to the Group in the current financial year. Shortly after Year end, we announced the proposed disposal of KEM JV, demonstrating the effective rationalisation of the Group’s portfolio. The operation will be transferred to the sole ownership of Ekapa Mining, thereby ensuring its sustainable future, under the stewardship of an operator best suited to maximise its value. We continue to review our Board, Board committees and senior management structures in line with the Company’s development from a phase of intensive capital expenditure and expansion to a focus
1 Future Capex figures are provided in FY 2019 money term, at an exchange rate of US$1:ZAR12.75
Page 8 of 57
on steady state operations. As part of this process, Jacques Breytenbach was appointed as Finance Director during the Year. As previously announced, Jim Davidson retired from his position as Petra’s Technical Director at the end of FY 2018. As per the Nomination Committee Succession plan, I will be stepping down from the Company but will be working closely with the Board to ensure a smooth transition and handover. Turning to labour relations, whilst we saw a short period of disruption at the Company’s South African mines (except for Cullinan) in September 2017, the new three year wage agreement agreed at the end of that month provided for a more stable environment going forward and the Group continues to enjoy good relations. Petra makes a valuable economic contribution to the countries in which we operate and a vital part of this is to maintain supportive relationships and open communication with our host governments and regulators. Petra is in ongoing dialogue with the Government of Tanzania and local advisers in relation to recent legislative developments. In South Africa, a revised draft Mining Charter was published for public comments in June 2018 and the Company subsequently worked with the Minerals Council South Africa to provide submissions. We welcome ongoing engagement in relation to the finalisation of the Mining Charter in due course. DIVIDEND Distribution covenants were not met for the measurement period to 30 June 2018. Petra will not declare a dividend for FY 2018. Returns to shareholders remain a priority for the Board and as the Company becomes increasingly cash generative, it intends to resume dividend payments. The decision as to whether to pay a dividend is reviewed by the Board regularly and the market will be updated on this when appropriate. THE DIAMOND MARKET The diamond market was stable throughout FY 2018, though subject to normal seasonal fluctuations in pricing, with Petra’s prices on a like-for-like basis were up ca. 2% for the Year, compared to FY 2017. The market saw seasonal weakness in July to October 2017, with Petra prices on a like-for-like basis down approximately 5% before recovering approximately 1.5% in December 2017, and since increasing by approximately 5% in H2 FY 2018. Such fluctuations in part reflect the seasonal nature of the rough market, due to the fact that retailers are ready to restock after the festive selling season, which includes Thanksgiving in the U.S., Christmas, Chinese New Year and Valentine’s Day, thereby serving to introduce fresh liquidity into the diamond pipeline and draw down inventory levels of polished diamonds. The start of FY 2019 saw typical seasonal weakness during Petra’s first tender of the year with prices down ca. 5% on a like-for-like basis, compared with H2 FY 2018, mainly due to softer prices in smaller size ranges. The Company expects the diamond market to be broadly stable during FY 2019. The Company will hold two more tenders during H1 FY 2019 and four tenders in H2 FY 2019, as usual. An important factor in the long-term sustainability of our market is the Diamond Producers Association (“DPA”), of which Petra is a founder member and which aims to support consumer demand for diamonds. The DPA committed a significantly increased investment of US$70 million to generic marketing for 2018 to enabling the expansion of its efforts in the major US market, where it is focussing on female self-purchasing, as well as in India (where it launched in November 2017) and China (initiating in the summer of 2018). The DPA’s media campaigns have shown a strong performance in terms of influencing consumer sentiment and a study published on the efficacy of the “Real is Rare” campaign noted the successful achievement of its objective to drive perceptions and affinity towards diamonds.
Page 9 of 57
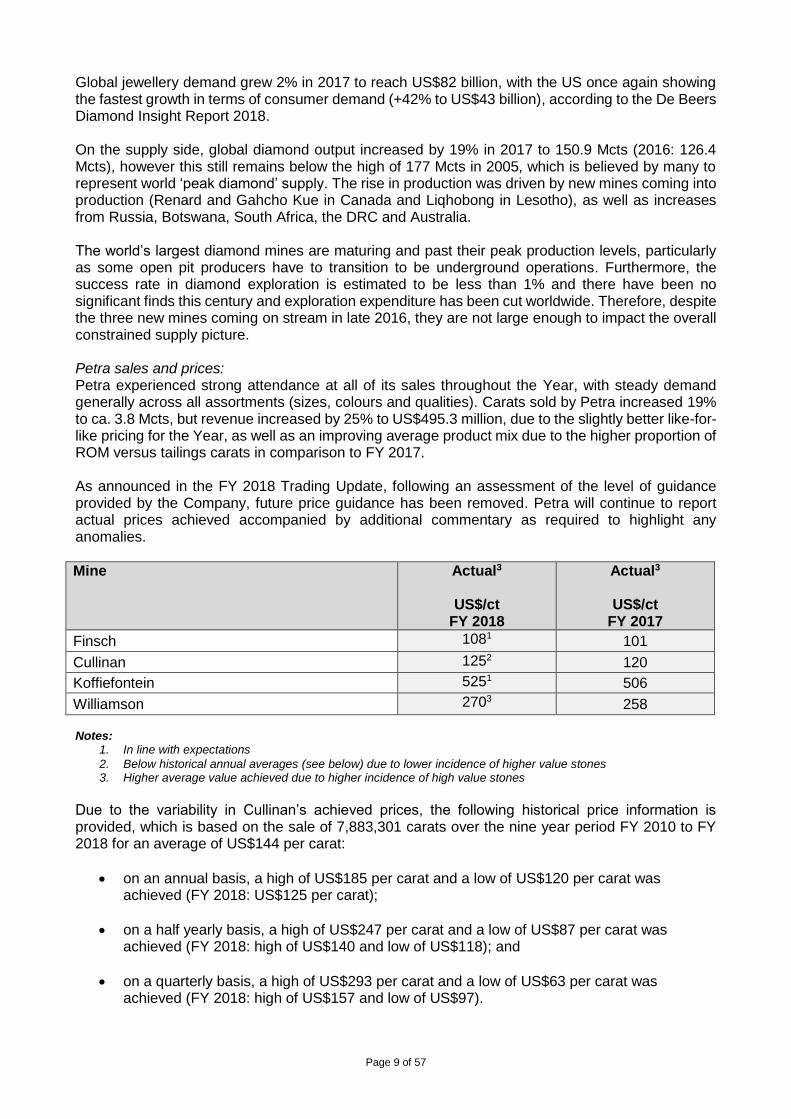
Global jewellery demand grew 2% in 2017 to reach US$82 billion, with the US once again showing the fastest growth in terms of consumer demand (+42% to US$43 billion), according to the De Beers Diamond Insight Report 2018. On the supply side, global diamond output increased by 19% in 2017 to 150.9 Mcts (2016: 126.4 Mcts), however this still remains below the high of 177 Mcts in 2005, which is believed by many to represent world ‘peak diamond’ supply. The rise in production was driven by new mines coming into production (Renard and Gahcho Kue in Canada and Liqhobong in Lesotho), as well as increases from Russia, Botswana, South Africa, the DRC and Australia. The world’s largest diamond mines are maturing and past their peak production levels, particularly as some open pit producers have to transition to be underground operations. Furthermore, the success rate in diamond exploration is estimated to be less than 1% and there have been no significant finds this century and exploration expenditure has been cut worldwide. Therefore, despite the three new mines coming on stream in late 2016, they are not large enough to impact the overall constrained supply picture. Petra sales and prices: Petra experienced strong attendance at all of its sales throughout the Year, with steady demand generally across all assortments (sizes, colours and qualities). Carats sold by Petra increased 19% to ca. 3.8 Mcts, but revenue increased by 25% to US$495.3 million, due to the slightly better like-for-like pricing for the Year, as well as an improving average product mix due to the higher proportion of ROM versus tailings carats in comparison to FY 2017. As announced in the FY 2018 Trading Update, following an assessment of the level of guidance provided by the Company, future price guidance has been removed. Petra will continue to report actual prices achieved accompanied by additional commentary as required to highlight any anomalies.
Mine Actual3
US$/ct FY 2018
Actual3
US$/ct FY 2017
Finsch 1081 101
Cullinan 1252 120
Koffiefontein 5251 506
Williamson 2703 258 Notes:
1. In line with expectations
2. Below historical annual averages (see below) due to lower incidence of higher value stones 3. Higher average value achieved due to higher incidence of high value stones
Due to the variability in Cullinan’s achieved prices, the following historical price information is provided, which is based on the sale of 7,883,301 carats over the nine year period FY 2010 to FY 2018 for an average of US$144 per carat:
on an annual basis, a high of US$185 per carat and a low of US$120 per carat was achieved (FY 2018: US$125 per carat);
on a half yearly basis, a high of US$247 per carat and a low of US$87 per carat was achieved (FY 2018: high of US$140 and low of US$118); and
on a quarterly basis, a high of US$293 per carat and a low of US$63 per carat was achieved (FY 2018: high of US$157 and low of US$97).
Page 10 of 57
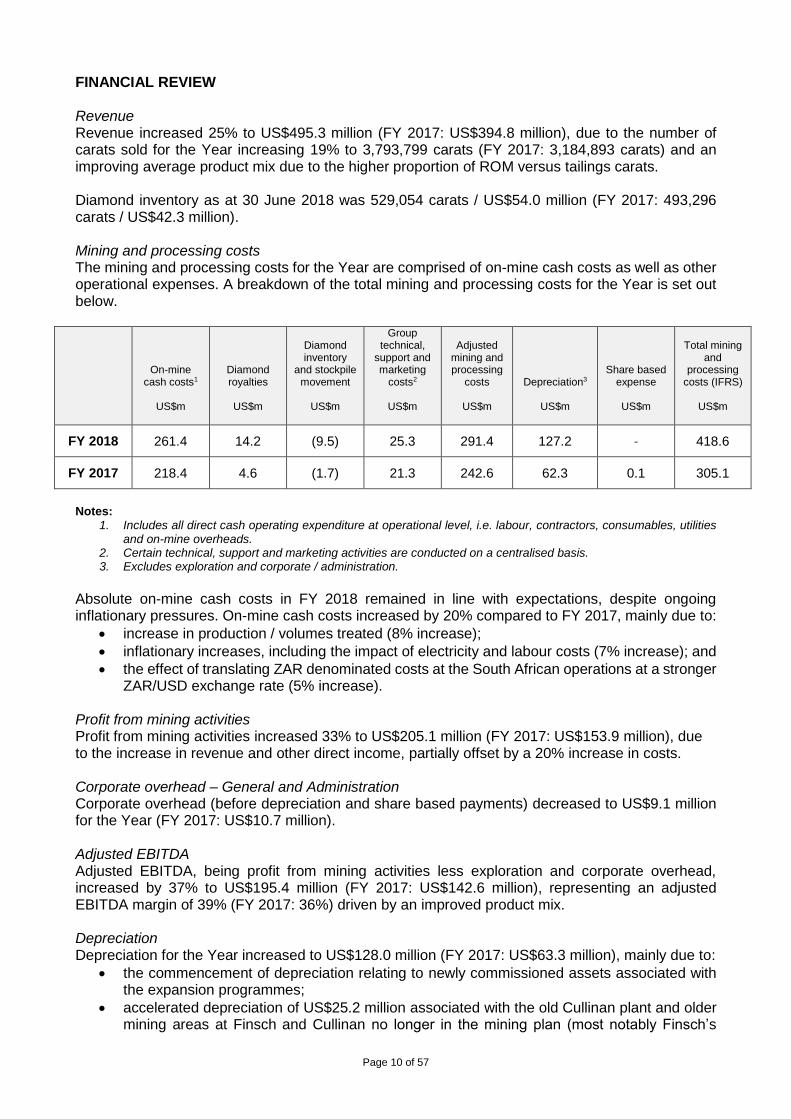
FINANCIAL REVIEW Revenue Revenue increased 25% to US$495.3 million (FY 2017: US$394.8 million), due to the number of carats sold for the Year increasing 19% to 3,793,799 carats (FY 2017: 3,184,893 carats) and an improving average product mix due to the higher proportion of ROM versus tailings carats. Diamond inventory as at 30 June 2018 was 529,054 carats / US$54.0 million (FY 2017: 493,296 carats / US$42.3 million). Mining and processing costs The mining and processing costs for the Year are comprised of on-mine cash costs as well as other operational expenses. A breakdown of the total mining and processing costs for the Year is set out below.
On-mine cash costs1
US$m
Diamond royalties
US$m
Diamond inventory
and stockpile movement
US$m
Group technical,
support and marketing
costs2
US$m
Adjusted mining and processing
costs
US$m
Depreciation3
US$m
Share based expense
US$m
Total mining and
processing costs (IFRS)
US$m
FY 2018 261.4 14.2 (9.5) 25.3 291.4 127.2 - 418.6
FY 2017 218.4 4.6 (1.7) 21.3 242.6 62.3 0.1 305.1
Notes:
1. Includes all direct cash operating expenditure at operational level, i.e. labour, contractors, consumables, utilities and on-mine overheads.
2. Certain technical, support and marketing activities are conducted on a centralised basis. 3. Excludes exploration and corporate / administration.
Absolute on-mine cash costs in FY 2018 remained in line with expectations, despite ongoing inflationary pressures. On-mine cash costs increased by 20% compared to FY 2017, mainly due to:
increase in production / volumes treated (8% increase);
inflationary increases, including the impact of electricity and labour costs (7% increase); and
the effect of translating ZAR denominated costs at the South African operations at a stronger ZAR/USD exchange rate (5% increase).
Profit from mining activities Profit from mining activities increased 33% to US$205.1 million (FY 2017: US$153.9 million), due to the increase in revenue and other direct income, partially offset by a 20% increase in costs. Corporate overhead – General and Administration Corporate overhead (before depreciation and share based payments) decreased to US$9.1 million for the Year (FY 2017: US$10.7 million). Adjusted EBITDA Adjusted EBITDA, being profit from mining activities less exploration and corporate overhead, increased by 37% to US$195.4 million (FY 2017: US$142.6 million), representing an adjusted EBITDA margin of 39% (FY 2017: 36%) driven by an improved product mix. Depreciation Depreciation for the Year increased to US$128.0 million (FY 2017: US$63.3 million), mainly due to:
the commencement of depreciation relating to newly commissioned assets associated with the expansion programmes;
accelerated depreciation of US$25.2 million associated with the old Cullinan plant and older mining areas at Finsch and Cullinan no longer in the mining plan (most notably Finsch’s
Page 11 of 57
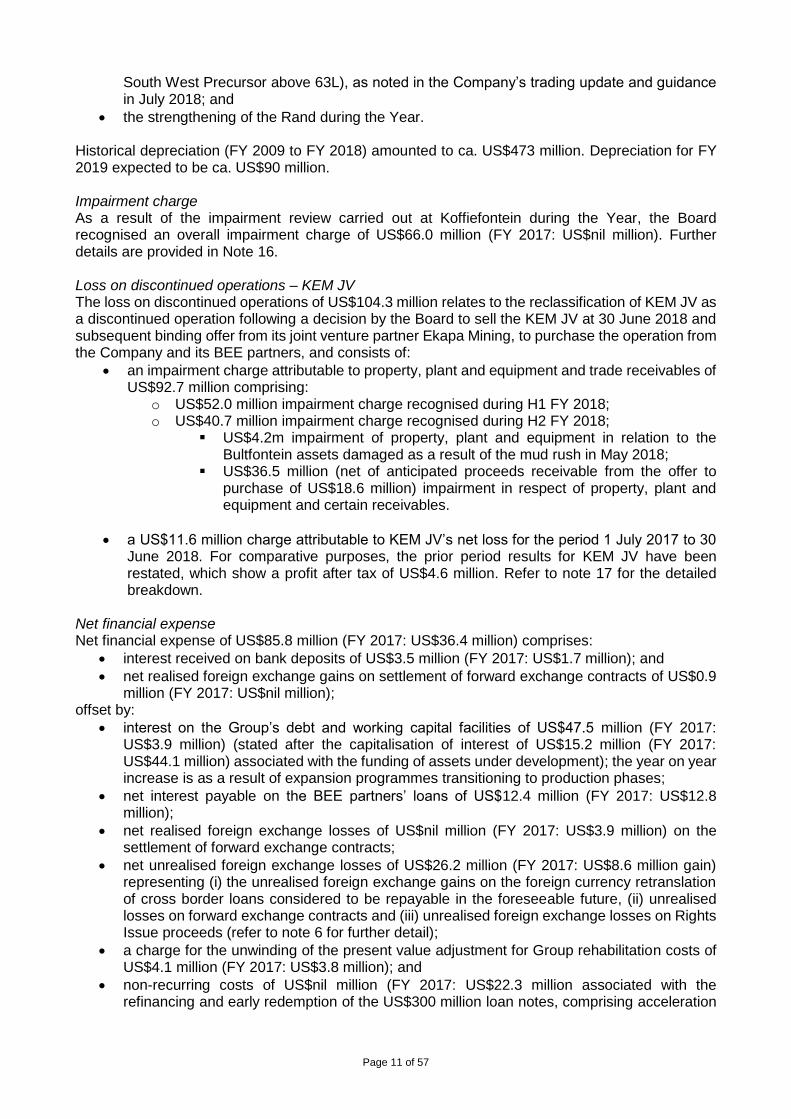
South West Precursor above 63L), as noted in the Company’s trading update and guidance in July 2018; and
the strengthening of the Rand during the Year.
Historical depreciation (FY 2009 to FY 2018) amounted to ca. US$473 million. Depreciation for FY 2019 expected to be ca. US$90 million. Impairment charge As a result of the impairment review carried out at Koffiefontein during the Year, the Board recognised an overall impairment charge of US$66.0 million (FY 2017: US$nil million). Further details are provided in Note 16. Loss on discontinued operations – KEM JV The loss on discontinued operations of US$104.3 million relates to the reclassification of KEM JV as a discontinued operation following a decision by the Board to sell the KEM JV at 30 June 2018 and subsequent binding offer from its joint venture partner Ekapa Mining, to purchase the operation from the Company and its BEE partners, and consists of:
an impairment charge attributable to property, plant and equipment and trade receivables of US$92.7 million comprising:
o US$52.0 million impairment charge recognised during H1 FY 2018; o US$40.7 million impairment charge recognised during H2 FY 2018;
US$4.2m impairment of property, plant and equipment in relation to the Bultfontein assets damaged as a result of the mud rush in May 2018;
US$36.5 million (net of anticipated proceeds receivable from the offer to purchase of US$18.6 million) impairment in respect of property, plant and equipment and certain receivables.
a US$11.6 million charge attributable to KEM JV’s net loss for the period 1 July 2017 to 30 June 2018. For comparative purposes, the prior period results for KEM JV have been restated, which show a profit after tax of US$4.6 million. Refer to note 17 for the detailed breakdown.
Net financial expense Net financial expense of US$85.8 million (FY 2017: US$36.4 million) comprises:
interest received on bank deposits of US$3.5 million (FY 2017: US$1.7 million); and
net realised foreign exchange gains on settlement of forward exchange contracts of US$0.9 million (FY 2017: US$nil million);
offset by:
interest on the Group’s debt and working capital facilities of US$47.5 million (FY 2017: US$3.9 million) (stated after the capitalisation of interest of US$15.2 million (FY 2017: US$44.1 million) associated with the funding of assets under development); the year on year increase is as a result of expansion programmes transitioning to production phases;
net interest payable on the BEE partners’ loans of US$12.4 million (FY 2017: US$12.8 million);
net realised foreign exchange losses of US$nil million (FY 2017: US$3.9 million) on the settlement of forward exchange contracts;
net unrealised foreign exchange losses of US$26.2 million (FY 2017: US$8.6 million gain) representing (i) the unrealised foreign exchange gains on the foreign currency retranslation of cross border loans considered to be repayable in the foreseeable future, (ii) unrealised losses on forward exchange contracts and (iii) unrealised foreign exchange losses on Rights Issue proceeds (refer to note 6 for further detail);
a charge for the unwinding of the present value adjustment for Group rehabilitation costs of US$4.1 million (FY 2017: US$3.8 million); and
non-recurring costs of US$nil million (FY 2017: US$22.3 million associated with the refinancing and early redemption of the US$300 million loan notes, comprising acceleration
Page 12 of 57
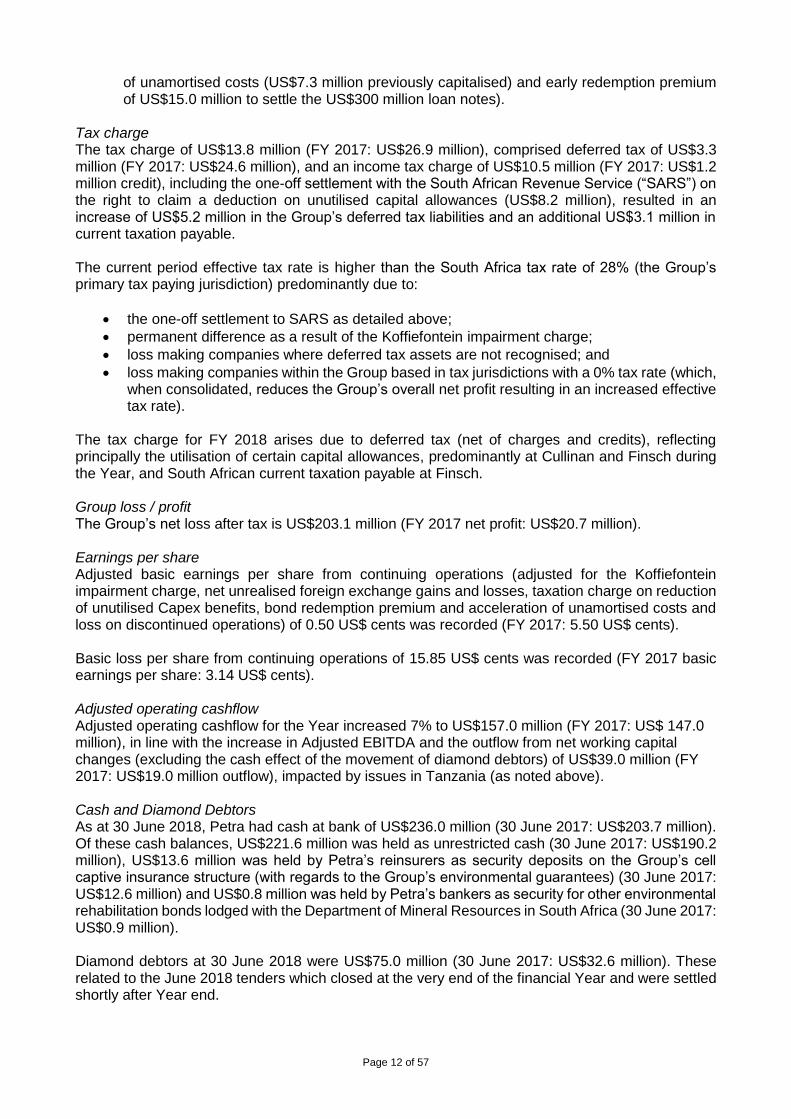
of unamortised costs (US$7.3 million previously capitalised) and early redemption premium of US$15.0 million to settle the US$300 million loan notes).
Tax charge The tax charge of US$13.8 million (FY 2017: US$26.9 million), comprised deferred tax of US$3.3 million (FY 2017: US$24.6 million), and an income tax charge of US$10.5 million (FY 2017: US$1.2 million credit), including the one-off settlement with the South African Revenue Service (“SARS”) on the right to claim a deduction on unutilised capital allowances (US$8.2 million), resulted in an increase of US$5.2 million in the Group’s deferred tax liabilities and an additional US$3.1 million in current taxation payable. The current period effective tax rate is higher than the South Africa tax rate of 28% (the Group’s primary tax paying jurisdiction) predominantly due to:
the one-off settlement to SARS as detailed above;
permanent difference as a result of the Koffiefontein impairment charge;
loss making companies where deferred tax assets are not recognised; and
loss making companies within the Group based in tax jurisdictions with a 0% tax rate (which, when consolidated, reduces the Group’s overall net profit resulting in an increased effective tax rate).
The tax charge for FY 2018 arises due to deferred tax (net of charges and credits), reflecting principally the utilisation of certain capital allowances, predominantly at Cullinan and Finsch during the Year, and South African current taxation payable at Finsch. Group loss / profit The Group’s net loss after tax is US$203.1 million (FY 2017 net profit: US$20.7 million). Earnings per share Adjusted basic earnings per share from continuing operations (adjusted for the Koffiefontein impairment charge, net unrealised foreign exchange gains and losses, taxation charge on reduction of unutilised Capex benefits, bond redemption premium and acceleration of unamortised costs and loss on discontinued operations) of 0.50 US$ cents was recorded (FY 2017: 5.50 US$ cents). Basic loss per share from continuing operations of 15.85 US$ cents was recorded (FY 2017 basic earnings per share: 3.14 US$ cents). Adjusted operating cashflow Adjusted operating cashflow for the Year increased 7% to US$157.0 million (FY 2017: US$ 147.0 million), in line with the increase in Adjusted EBITDA and the outflow from net working capital changes (excluding the cash effect of the movement of diamond debtors) of US$39.0 million (FY 2017: US$19.0 million outflow), impacted by issues in Tanzania (as noted above). Cash and Diamond Debtors As at 30 June 2018, Petra had cash at bank of US$236.0 million (30 June 2017: US$203.7 million). Of these cash balances, US$221.6 million was held as unrestricted cash (30 June 2017: US$190.2 million), US$13.6 million was held by Petra’s reinsurers as security deposits on the Group’s cell captive insurance structure (with regards to the Group’s environmental guarantees) (30 June 2017: US$12.6 million) and US$0.8 million was held by Petra’s bankers as security for other environmental rehabilitation bonds lodged with the Department of Mineral Resources in South Africa (30 June 2017: US$0.9 million). Diamond debtors at 30 June 2018 were US$75.0 million (30 June 2017: US$32.6 million). These related to the June 2018 tenders which closed at the very end of the financial Year and were settled shortly after Year end.
Page 13 of 57
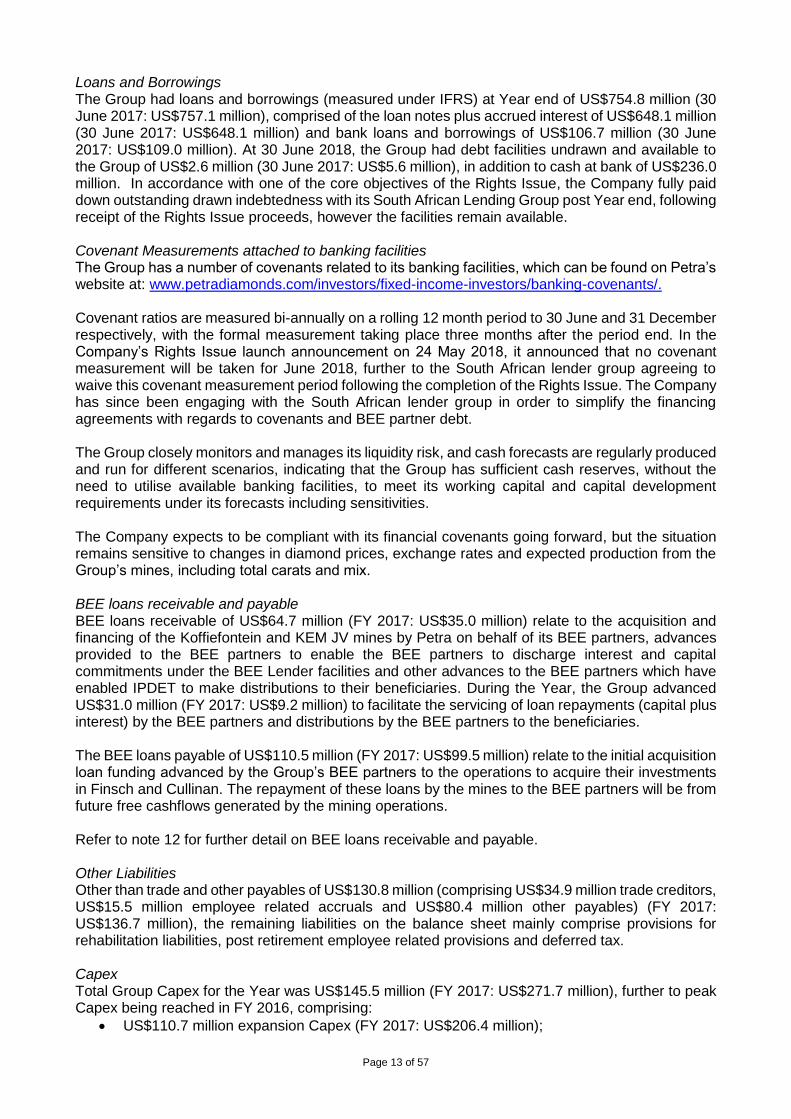
Loans and Borrowings The Group had loans and borrowings (measured under IFRS) at Year end of US$754.8 million (30 June 2017: US$757.1 million), comprised of the loan notes plus accrued interest of US$648.1 million (30 June 2017: US$648.1 million) and bank loans and borrowings of US$106.7 million (30 June 2017: US$109.0 million). At 30 June 2018, the Group had debt facilities undrawn and available to the Group of US$2.6 million (30 June 2017: US$5.6 million), in addition to cash at bank of US$236.0 million. In accordance with one of the core objectives of the Rights Issue, the Company fully paid down outstanding drawn indebtedness with its South African Lending Group post Year end, following receipt of the Rights Issue proceeds, however the facilities remain available. Covenant Measurements attached to banking facilities The Group has a number of covenants related to its banking facilities, which can be found on Petra’s website at: www.petradiamonds.com/investors/fixed-income-investors/banking-covenants/. Covenant ratios are measured bi-annually on a rolling 12 month period to 30 June and 31 December respectively, with the formal measurement taking place three months after the period end. In the Company’s Rights Issue launch announcement on 24 May 2018, it announced that no covenant measurement will be taken for June 2018, further to the South African lender group agreeing to waive this covenant measurement period following the completion of the Rights Issue. The Company has since been engaging with the South African lender group in order to simplify the financing agreements with regards to covenants and BEE partner debt. The Group closely monitors and manages its liquidity risk, and cash forecasts are regularly produced and run for different scenarios, indicating that the Group has sufficient cash reserves, without the need to utilise available banking facilities, to meet its working capital and capital development requirements under its forecasts including sensitivities. The Company expects to be compliant with its financial covenants going forward, but the situation remains sensitive to changes in diamond prices, exchange rates and expected production from the Group’s mines, including total carats and mix. BEE loans receivable and payable BEE loans receivable of US$64.7 million (FY 2017: US$35.0 million) relate to the acquisition and financing of the Koffiefontein and KEM JV mines by Petra on behalf of its BEE partners, advances provided to the BEE partners to enable the BEE partners to discharge interest and capital commitments under the BEE Lender facilities and other advances to the BEE partners which have enabled IPDET to make distributions to their beneficiaries. During the Year, the Group advanced US$31.0 million (FY 2017: US$9.2 million) to facilitate the servicing of loan repayments (capital plus interest) by the BEE partners and distributions by the BEE partners to the beneficiaries. The BEE loans payable of US$110.5 million (FY 2017: US$99.5 million) relate to the initial acquisition loan funding advanced by the Group’s BEE partners to the operations to acquire their investments in Finsch and Cullinan. The repayment of these loans by the mines to the BEE partners will be from future free cashflows generated by the mining operations. Refer to note 12 for further detail on BEE loans receivable and payable. Other Liabilities Other than trade and other payables of US$130.8 million (comprising US$34.9 million trade creditors, US$15.5 million employee related accruals and US$80.4 million other payables) (FY 2017: US$136.7 million), the remaining liabilities on the balance sheet mainly comprise provisions for rehabilitation liabilities, post retirement employee related provisions and deferred tax. Capex Total Group Capex for the Year was US$145.5 million (FY 2017: US$271.7 million), further to peak Capex being reached in FY 2016, comprising:
US$110.7 million expansion Capex (FY 2017: US$206.4 million);
Page 14 of 57
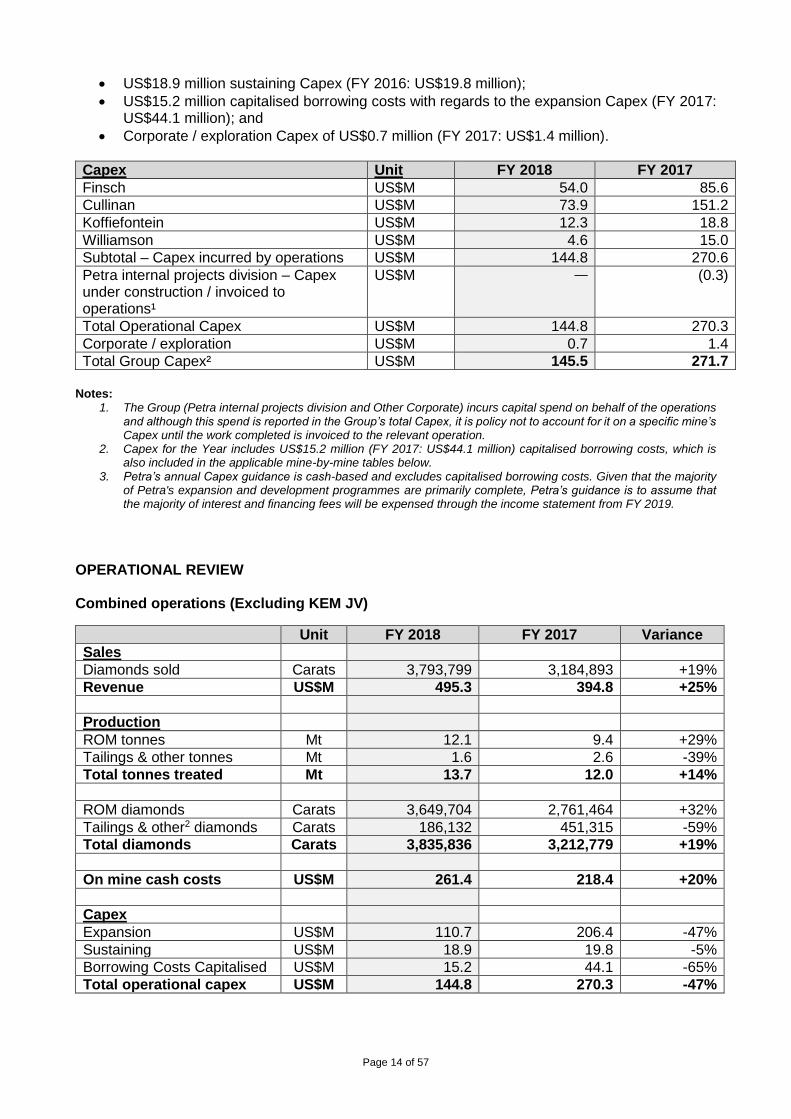
US$18.9 million sustaining Capex (FY 2016: US$19.8 million);
US$15.2 million capitalised borrowing costs with regards to the expansion Capex (FY 2017: US$44.1 million); and
Corporate / exploration Capex of US$0.7 million (FY 2017: US$1.4 million).
Capex Unit FY 2018 FY 2017
Finsch US$M 54.0 85.6
Cullinan US$M 73.9 151.2
Koffiefontein US$M 12.3 18.8
Williamson US$M 4.6 15.0
Subtotal – Capex incurred by operations US$M 144.8 270.6
Petra internal projects division – Capex under construction / invoiced to operations¹
US$M — (0.3)
Total Operational Capex US$M 144.8 270.3
Corporate / exploration US$M 0.7 1.4
Total Group Capex² US$M 145.5 271.7
Notes:
1. The Group (Petra internal projects division and Other Corporate) incurs capital spend on behalf of the operations and although this spend is reported in the Group’s total Capex, it is policy not to account for it on a specific mine’s Capex until the work completed is invoiced to the relevant operation.
2. Capex for the Year includes US$15.2 million (FY 2017: US$44.1 million) capitalised borrowing costs, which is also included in the applicable mine-by-mine tables below.
3. Petra’s annual Capex guidance is cash-based and excludes capitalised borrowing costs. Given that the majority of Petra's expansion and development programmes are primarily complete, Petra’s guidance is to assume that the majority of interest and financing fees will be expensed through the income statement from FY 2019.
OPERATIONAL REVIEW
Combined operations (Excluding KEM JV)
Unit FY 2018 FY 2017 Variance
Sales
Diamonds sold Carats 3,793,799 3,184,893 +19%
Revenue US$M 495.3 394.8 +25%
Production
ROM tonnes Mt 12.1 9.4 +29%
Tailings & other tonnes Mt 1.6 2.6 -39%
Total tonnes treated Mt 13.7 12.0 +14%
ROM diamonds Carats 3,649,704 2,761,464 +32%
Tailings & other2 diamonds Carats 186,132 451,315 -59%
Total diamonds Carats 3,835,836 3,212,779 +19%
On mine cash costs US$M 261.4 218.4 +20%
Capex
Expansion US$M 110.7 206.4 -47%
Sustaining US$M 18.9 19.8 -5%
Borrowing Costs Capitalised US$M 15.2 44.1 -65%
Total operational capex US$M 144.8 270.3 -47%
Page 15 of 57
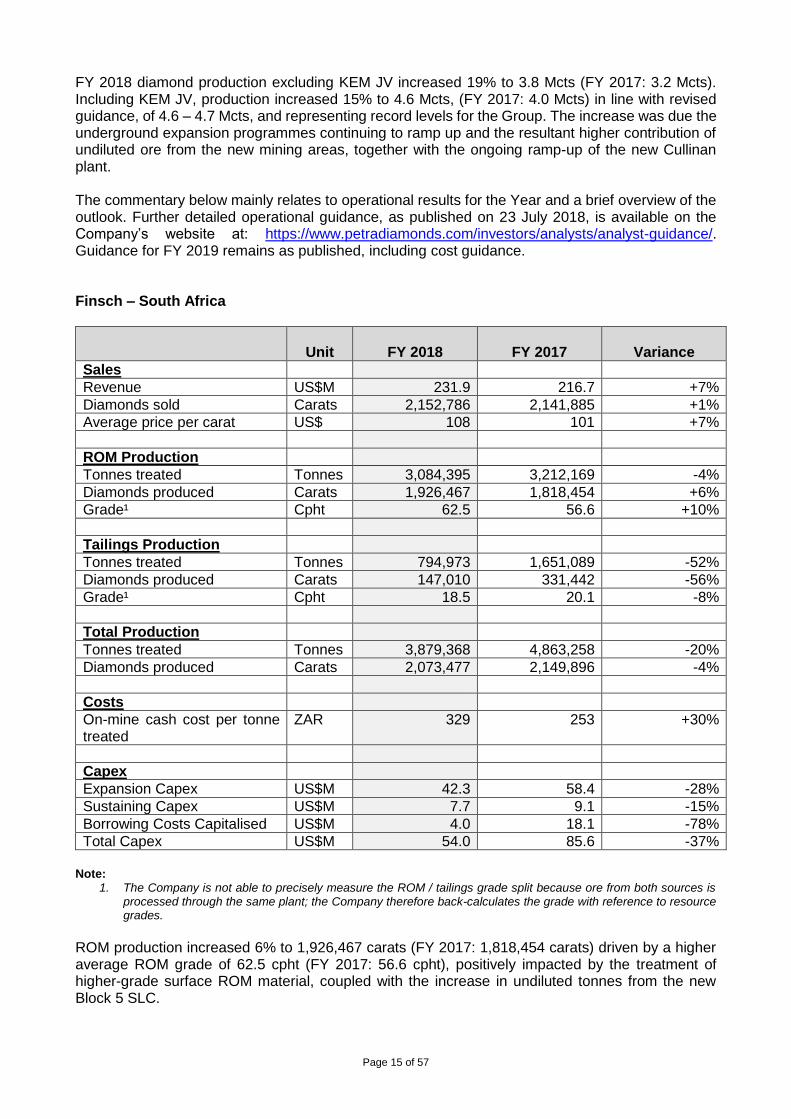
FY 2018 diamond production excluding KEM JV increased 19% to 3.8 Mcts (FY 2017: 3.2 Mcts). Including KEM JV, production increased 15% to 4.6 Mcts, (FY 2017: 4.0 Mcts) in line with revised guidance, of 4.6 – 4.7 Mcts, and representing record levels for the Group. The increase was due the underground expansion programmes continuing to ramp up and the resultant higher contribution of undiluted ore from the new mining areas, together with the ongoing ramp-up of the new Cullinan plant. The commentary below mainly relates to operational results for the Year and a brief overview of the outlook. Further detailed operational guidance, as published on 23 July 2018, is available on the Company’s website at: https://www.petradiamonds.com/investors/analysts/analyst-guidance/. Guidance for FY 2019 remains as published, including cost guidance. Finsch – South Africa
Unit
FY 2018
FY 2017
Variance
Sales
Revenue US$M 231.9 216.7 +7%
Diamonds sold Carats 2,152,786 2,141,885 +1%
Average price per carat US$ 108 101 +7%
ROM Production
Tonnes treated Tonnes 3,084,395 3,212,169 -4%
Diamonds produced Carats 1,926,467 1,818,454 +6%
Grade¹ Cpht 62.5 56.6 +10%
Tailings Production
Tonnes treated Tonnes 794,973 1,651,089 -52%
Diamonds produced Carats 147,010 331,442 -56%
Grade¹ Cpht 18.5 20.1 -8%
Total Production
Tonnes treated Tonnes 3,879,368 4,863,258 -20%
Diamonds produced Carats 2,073,477 2,149,896 -4%
Costs
On-mine cash cost per tonne treated
ZAR 329 253 +30%
Capex
Expansion Capex US$M 42.3 58.4 -28%
Sustaining Capex US$M 7.7 9.1 -15%
Borrowing Costs Capitalised US$M 4.0 18.1 -78%
Total Capex US$M 54.0 85.6 -37%
Note:
1. The Company is not able to precisely measure the ROM / tailings grade split because ore from both sources is processed through the same plant; the Company therefore back-calculates the grade with reference to resource grades.
ROM production increased 6% to 1,926,467 carats (FY 2017: 1,818,454 carats) driven by a higher average ROM grade of 62.5 cpht (FY 2017: 56.6 cpht), positively impacted by the treatment of higher-grade surface ROM material, coupled with the increase in undiluted tonnes from the new Block 5 SLC.
Page 16 of 57
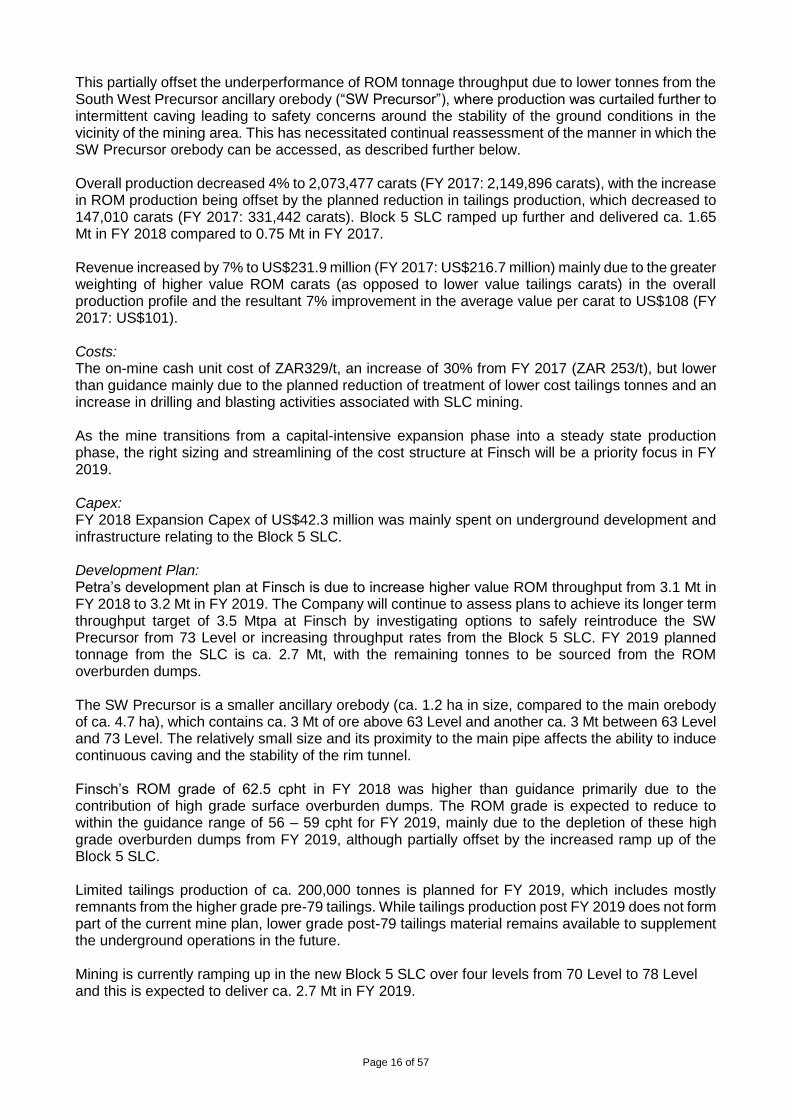
This partially offset the underperformance of ROM tonnage throughput due to lower tonnes from the South West Precursor ancillary orebody (“SW Precursor”), where production was curtailed further to intermittent caving leading to safety concerns around the stability of the ground conditions in the vicinity of the mining area. This has necessitated continual reassessment of the manner in which the SW Precursor orebody can be accessed, as described further below. Overall production decreased 4% to 2,073,477 carats (FY 2017: 2,149,896 carats), with the increase in ROM production being offset by the planned reduction in tailings production, which decreased to 147,010 carats (FY 2017: 331,442 carats). Block 5 SLC ramped up further and delivered ca. 1.65 Mt in FY 2018 compared to 0.75 Mt in FY 2017. Revenue increased by 7% to US$231.9 million (FY 2017: US$216.7 million) mainly due to the greater weighting of higher value ROM carats (as opposed to lower value tailings carats) in the overall production profile and the resultant 7% improvement in the average value per carat to US$108 (FY 2017: US$101). Costs: The on-mine cash unit cost of ZAR329/t, an increase of 30% from FY 2017 (ZAR 253/t), but lower than guidance mainly due to the planned reduction of treatment of lower cost tailings tonnes and an increase in drilling and blasting activities associated with SLC mining. As the mine transitions from a capital-intensive expansion phase into a steady state production phase, the right sizing and streamlining of the cost structure at Finsch will be a priority focus in FY 2019. Capex: FY 2018 Expansion Capex of US$42.3 million was mainly spent on underground development and infrastructure relating to the Block 5 SLC. Development Plan: Petra’s development plan at Finsch is due to increase higher value ROM throughput from 3.1 Mt in FY 2018 to 3.2 Mt in FY 2019. The Company will continue to assess plans to achieve its longer term throughput target of 3.5 Mtpa at Finsch by investigating options to safely reintroduce the SW Precursor from 73 Level or increasing throughput rates from the Block 5 SLC. FY 2019 planned tonnage from the SLC is ca. 2.7 Mt, with the remaining tonnes to be sourced from the ROM overburden dumps. The SW Precursor is a smaller ancillary orebody (ca. 1.2 ha in size, compared to the main orebody of ca. 4.7 ha), which contains ca. 3 Mt of ore above 63 Level and another ca. 3 Mt between 63 Level and 73 Level. The relatively small size and its proximity to the main pipe affects the ability to induce continuous caving and the stability of the rim tunnel. Finsch’s ROM grade of 62.5 cpht in FY 2018 was higher than guidance primarily due to the contribution of high grade surface overburden dumps. The ROM grade is expected to reduce to within the guidance range of 56 – 59 cpht for FY 2019, mainly due to the depletion of these high grade overburden dumps from FY 2019, although partially offset by the increased ramp up of the Block 5 SLC. Limited tailings production of ca. 200,000 tonnes is planned for FY 2019, which includes mostly remnants from the higher grade pre-79 tailings. While tailings production post FY 2019 does not form part of the current mine plan, lower grade post-79 tailings material remains available to supplement the underground operations in the future. Mining is currently ramping up in the new Block 5 SLC over four levels from 70 Level to 78 Level and this is expected to deliver ca. 2.7 Mt in FY 2019.
Page 17 of 57
Cullinan – South Africa
Unit
FY 2018
FY 2017
Variance
Sales
Revenue US$M 167.0 91.3 +83%
Diamonds sold Carats 1,335,669 760,957 +76%
Average price per carat US$ 125 120 +4%
ROM Production
Tonnes treated Tonnes 3,741,086 1,882,911 +99%
Diamonds produced Carats 1,342,020 679,622 +97%
Grade¹ Cpht 35.9 36.1 -1%
Tailings Production
Tonnes treated Tonnes 412,749 506,176 -18%
Diamonds produced Carats 26,700 106,887 -75%
Grade¹ Cpht 6.5 21.1 -69%
Total Production
Tonnes treated Tonnes 4,153,835 2,389,087 +74%
Diamonds produced Carats 1,368,720 786,509 +74%
Costs
On-mine cash cost per tonne treated
ZAR 239 316 -24%
Capex
Expansion Capex US$M 56.2 120.9 -54%
Sustaining Capex US$M 6.5 4.3 +51%
Borrowing Costs Capitalised US$M 11.2 26.0 -57%
Total Capex US$M 73.9 151.2 -51%
Notes:
1. The Company is not able to precisely measure the ROM / tailings grade split because ore from both sources is processed through the same plant; the Company therefore back-calculates the grade with reference to resource grades.
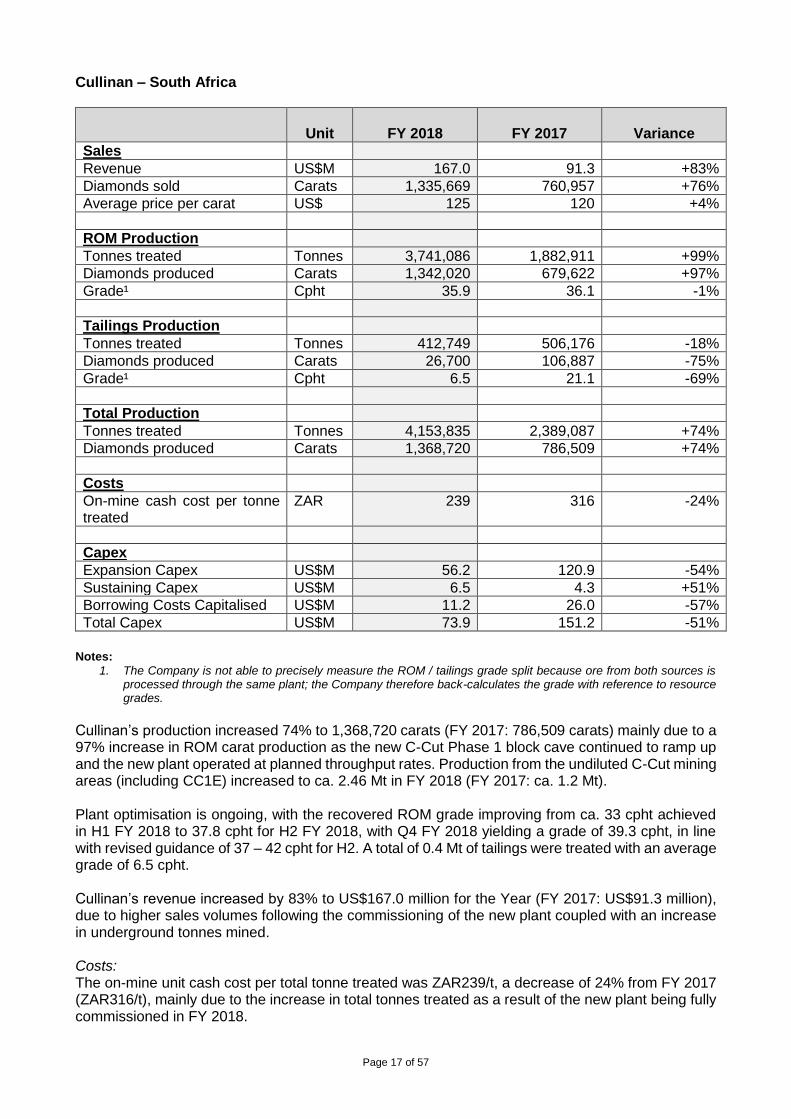
Cullinan’s production increased 74% to 1,368,720 carats (FY 2017: 786,509 carats) mainly due to a 97% increase in ROM carat production as the new C-Cut Phase 1 block cave continued to ramp up and the new plant operated at planned throughput rates. Production from the undiluted C-Cut mining areas (including CC1E) increased to ca. 2.46 Mt in FY 2018 (FY 2017: ca. 1.2 Mt). Plant optimisation is ongoing, with the recovered ROM grade improving from ca. 33 cpht achieved in H1 FY 2018 to 37.8 cpht for H2 FY 2018, with Q4 FY 2018 yielding a grade of 39.3 cpht, in line with revised guidance of 37 – 42 cpht for H2. A total of 0.4 Mt of tailings were treated with an average grade of 6.5 cpht. Cullinan’s revenue increased by 83% to US$167.0 million for the Year (FY 2017: US$91.3 million), due to higher sales volumes following the commissioning of the new plant coupled with an increase in underground tonnes mined. Costs: The on-mine unit cash cost per total tonne treated was ZAR239/t, a decrease of 24% from FY 2017 (ZAR316/t), mainly due to the increase in total tonnes treated as a result of the new plant being fully commissioned in FY 2018.
Page 18 of 57
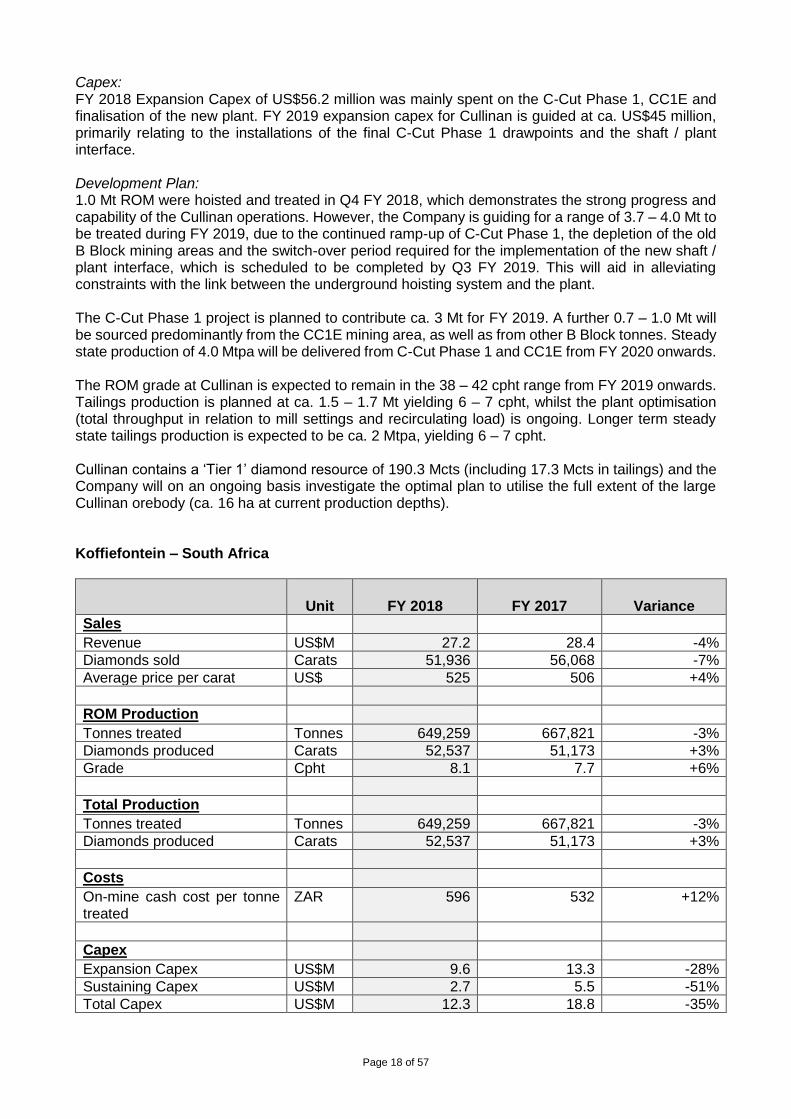
Capex: FY 2018 Expansion Capex of US$56.2 million was mainly spent on the C-Cut Phase 1, CC1E and finalisation of the new plant. FY 2019 expansion capex for Cullinan is guided at ca. US$45 million, primarily relating to the installations of the final C-Cut Phase 1 drawpoints and the shaft / plant interface. Development Plan: 1.0 Mt ROM were hoisted and treated in Q4 FY 2018, which demonstrates the strong progress and capability of the Cullinan operations. However, the Company is guiding for a range of 3.7 – 4.0 Mt to be treated during FY 2019, due to the continued ramp-up of C-Cut Phase 1, the depletion of the old B Block mining areas and the switch-over period required for the implementation of the new shaft / plant interface, which is scheduled to be completed by Q3 FY 2019. This will aid in alleviating constraints with the link between the underground hoisting system and the plant. The C-Cut Phase 1 project is planned to contribute ca. 3 Mt for FY 2019. A further 0.7 – 1.0 Mt will be sourced predominantly from the CC1E mining area, as well as from other B Block tonnes. Steady state production of 4.0 Mtpa will be delivered from C-Cut Phase 1 and CC1E from FY 2020 onwards. The ROM grade at Cullinan is expected to remain in the 38 – 42 cpht range from FY 2019 onwards. Tailings production is planned at ca. 1.5 – 1.7 Mt yielding 6 – 7 cpht, whilst the plant optimisation (total throughput in relation to mill settings and recirculating load) is ongoing. Longer term steady state tailings production is expected to be ca. 2 Mtpa, yielding 6 – 7 cpht. Cullinan contains a ‘Tier 1’ diamond resource of 190.3 Mcts (including 17.3 Mcts in tailings) and the Company will on an ongoing basis investigate the optimal plan to utilise the full extent of the large Cullinan orebody (ca. 16 ha at current production depths). Koffiefontein – South Africa
Unit
FY 2018
FY 2017
Variance
Sales Revenue US$M 27.2 28.4 -4%
Diamonds sold Carats 51,936 56,068 -7%
Average price per carat US$ 525 506 +4%
ROM Production
Tonnes treated Tonnes 649,259 667,821 -3%
Diamonds produced Carats 52,537 51,173 +3%
Grade Cpht 8.1 7.7 +6%
Total Production
Tonnes treated Tonnes 649,259 667,821 -3%
Diamonds produced Carats 52,537 51,173 +3%
Costs
On-mine cash cost per tonne treated
ZAR 596 532 +12%
Capex
Expansion Capex US$M 9.6 13.3 -28%
Sustaining Capex US$M 2.7 5.5 -51%
Total Capex US$M 12.3 18.8 -35%
Page 19 of 57
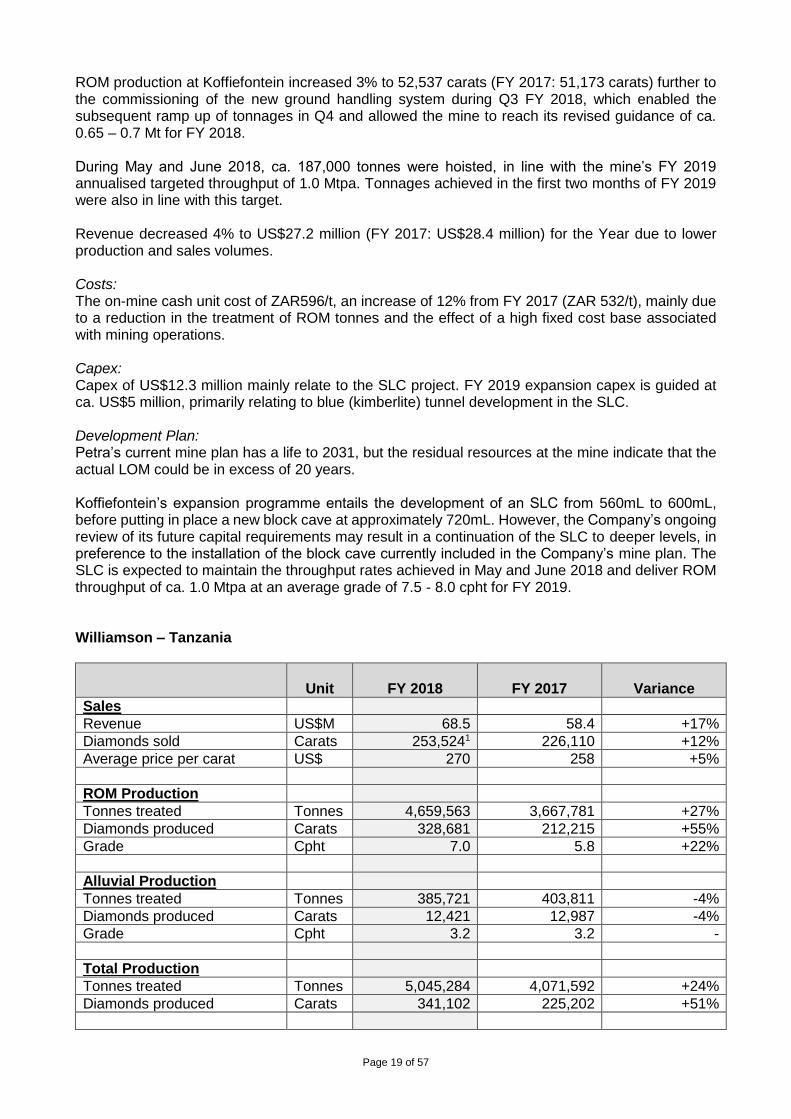
ROM production at Koffiefontein increased 3% to 52,537 carats (FY 2017: 51,173 carats) further to the commissioning of the new ground handling system during Q3 FY 2018, which enabled the subsequent ramp up of tonnages in Q4 and allowed the mine to reach its revised guidance of ca. 0.65 – 0.7 Mt for FY 2018. During May and June 2018, ca. 187,000 tonnes were hoisted, in line with the mine’s FY 2019 annualised targeted throughput of 1.0 Mtpa. Tonnages achieved in the first two months of FY 2019 were also in line with this target. Revenue decreased 4% to US$27.2 million (FY 2017: US$28.4 million) for the Year due to lower production and sales volumes. Costs: The on-mine cash unit cost of ZAR596/t, an increase of 12% from FY 2017 (ZAR 532/t), mainly due to a reduction in the treatment of ROM tonnes and the effect of a high fixed cost base associated with mining operations. Capex: Capex of US$12.3 million mainly relate to the SLC project. FY 2019 expansion capex is guided at ca. US$5 million, primarily relating to blue (kimberlite) tunnel development in the SLC. Development Plan: Petra’s current mine plan has a life to 2031, but the residual resources at the mine indicate that the actual LOM could be in excess of 20 years. Koffiefontein’s expansion programme entails the development of an SLC from 560mL to 600mL, before putting in place a new block cave at approximately 720mL. However, the Company’s ongoing review of its future capital requirements may result in a continuation of the SLC to deeper levels, in preference to the installation of the block cave currently included in the Company’s mine plan. The SLC is expected to maintain the throughput rates achieved in May and June 2018 and deliver ROM throughput of ca. 1.0 Mtpa at an average grade of 7.5 - 8.0 cpht for FY 2019. Williamson – Tanzania
Unit
FY 2018
FY 2017
Variance
Sales
Revenue US$M 68.5 58.4 +17%
Diamonds sold Carats 253,5241 226,110 +12%
Average price per carat US$ 270 258 +5%
ROM Production
Tonnes treated Tonnes 4,659,563 3,667,781 +27%
Diamonds produced Carats 328,681 212,215 +55%
Grade Cpht 7.0 5.8 +22%
Alluvial Production
Tonnes treated Tonnes 385,721 403,811 -4%
Diamonds produced Carats 12,421 12,987 -4%
Grade Cpht 3.2 3.2 -
Total Production
Tonnes treated Tonnes 5,045,284 4,071,592 +24%
Diamonds produced Carats 341,102 225,202 +51%
Page 20 of 57
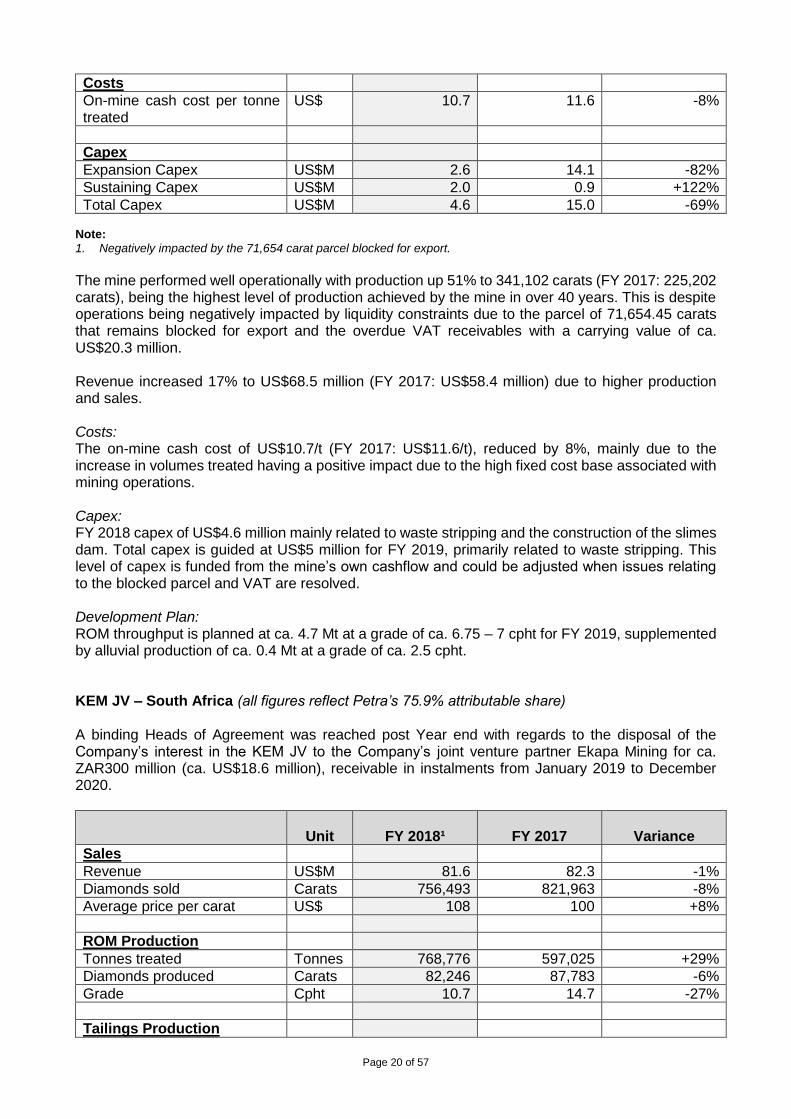
Costs
On-mine cash cost per tonne treated
US$ 10.7 11.6 -8%
Capex
Expansion Capex US$M 2.6 14.1 -82%
Sustaining Capex US$M 2.0 0.9 +122%
Total Capex US$M 4.6 15.0 -69% Note:
1. Negatively impacted by the 71,654 carat parcel blocked for export.
The mine performed well operationally with production up 51% to 341,102 carats (FY 2017: 225,202 carats), being the highest level of production achieved by the mine in over 40 years. This is despite operations being negatively impacted by liquidity constraints due to the parcel of 71,654.45 carats that remains blocked for export and the overdue VAT receivables with a carrying value of ca. US$20.3 million. Revenue increased 17% to US$68.5 million (FY 2017: US$58.4 million) due to higher production and sales. Costs: The on-mine cash cost of US$10.7/t (FY 2017: US$11.6/t), reduced by 8%, mainly due to the increase in volumes treated having a positive impact due to the high fixed cost base associated with mining operations. Capex: FY 2018 capex of US$4.6 million mainly related to waste stripping and the construction of the slimes dam. Total capex is guided at US$5 million for FY 2019, primarily related to waste stripping. This level of capex is funded from the mine’s own cashflow and could be adjusted when issues relating to the blocked parcel and VAT are resolved. Development Plan: ROM throughput is planned at ca. 4.7 Mt at a grade of ca. 6.75 – 7 cpht for FY 2019, supplemented by alluvial production of ca. 0.4 Mt at a grade of ca. 2.5 cpht. KEM JV – South Africa (all figures reflect Petra’s 75.9% attributable share) A binding Heads of Agreement was reached post Year end with regards to the disposal of the Company’s interest in the KEM JV to the Company’s joint venture partner Ekapa Mining for ca. ZAR300 million (ca. US$18.6 million), receivable in instalments from January 2019 to December 2020.
Unit
FY 2018¹
FY 2017
Variance
Sales
Revenue US$M 81.6 82.3 -1% Diamonds sold Carats 756,493 821,963 -8%
Average price per carat US$ 108 100 +8%
ROM Production
Tonnes treated Tonnes 768,776 597,025 +29%
Diamonds produced Carats 82,246 87,783 -6%
Grade Cpht 10.7 14.7 -27%
Tailings Production
Page 21 of 57
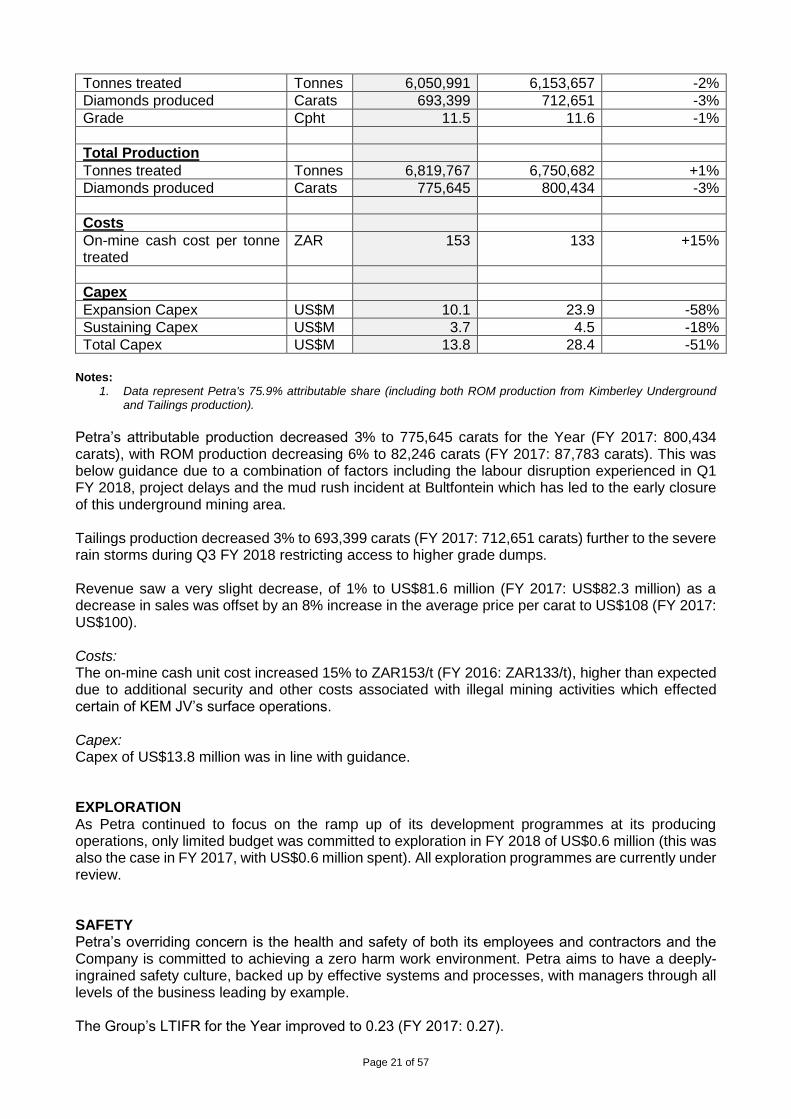
Tonnes treated Tonnes 6,050,991 6,153,657 -2%
Diamonds produced Carats 693,399 712,651 -3%
Grade Cpht 11.5 11.6 -1%
Total Production
Tonnes treated Tonnes 6,819,767 6,750,682 +1%
Diamonds produced Carats 775,645 800,434 -3%
Costs
On-mine cash cost per tonne treated
ZAR 153 133 +15%
Capex
Expansion Capex US$M 10.1 23.9 -58%
Sustaining Capex US$M 3.7 4.5 -18%
Total Capex US$M 13.8 28.4 -51%
Notes:
1. Data represent Petra's 75.9% attributable share (including both ROM production from Kimberley Underground and Tailings production).
Petra’s attributable production decreased 3% to 775,645 carats for the Year (FY 2017: 800,434 carats), with ROM production decreasing 6% to 82,246 carats (FY 2017: 87,783 carats). This was below guidance due to a combination of factors including the labour disruption experienced in Q1 FY 2018, project delays and the mud rush incident at Bultfontein which has led to the early closure of this underground mining area. Tailings production decreased 3% to 693,399 carats (FY 2017: 712,651 carats) further to the severe rain storms during Q3 FY 2018 restricting access to higher grade dumps. Revenue saw a very slight decrease, of 1% to US$81.6 million (FY 2017: US$82.3 million) as a decrease in sales was offset by an 8% increase in the average price per carat to US$108 (FY 2017: US$100). Costs: The on-mine cash unit cost increased 15% to ZAR153/t (FY 2016: ZAR133/t), higher than expected due to additional security and other costs associated with illegal mining activities which effected certain of KEM JV’s surface operations. Capex: Capex of US$13.8 million was in line with guidance. EXPLORATION As Petra continued to focus on the ramp up of its development programmes at its producing operations, only limited budget was committed to exploration in FY 2018 of US$0.6 million (this was also the case in FY 2017, with US$0.6 million spent). All exploration programmes are currently under review. SAFETY Petra’s overriding concern is the health and safety of both its employees and contractors and the Company is committed to achieving a zero harm work environment. Petra aims to have a deeply-ingrained safety culture, backed up by effective systems and processes, with managers through all levels of the business leading by example. The Group’s LTIFR for the Year improved to 0.23 (FY 2017: 0.27).
Page 22 of 57
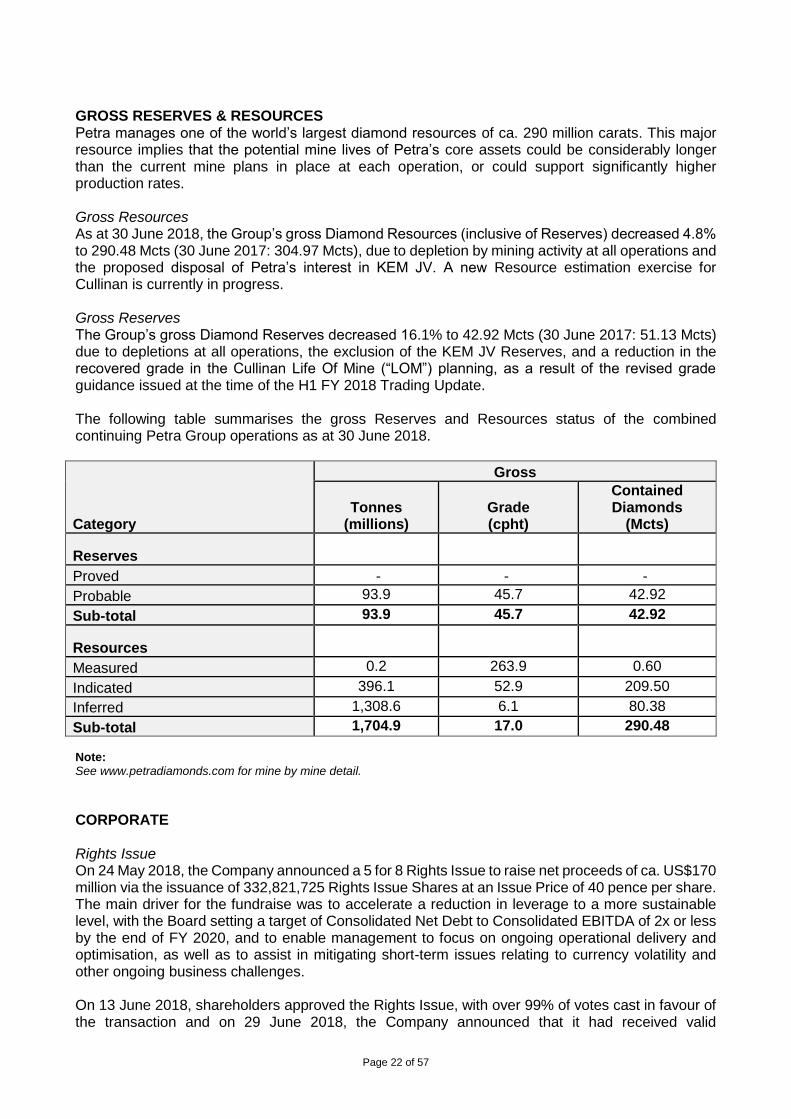
GROSS RESERVES & RESOURCES Petra manages one of the world’s largest diamond resources of ca. 290 million carats. This major resource implies that the potential mine lives of Petra’s core assets could be considerably longer than the current mine plans in place at each operation, or could support significantly higher production rates. Gross Resources As at 30 June 2018, the Group’s gross Diamond Resources (inclusive of Reserves) decreased 4.8% to 290.48 Mcts (30 June 2017: 304.97 Mcts), due to depletion by mining activity at all operations and the proposed disposal of Petra’s interest in KEM JV. A new Resource estimation exercise for Cullinan is currently in progress. Gross Reserves The Group’s gross Diamond Reserves decreased 16.1% to 42.92 Mcts (30 June 2017: 51.13 Mcts) due to depletions at all operations, the exclusion of the KEM JV Reserves, and a reduction in the recovered grade in the Cullinan Life Of Mine (“LOM”) planning, as a result of the revised grade guidance issued at the time of the H1 FY 2018 Trading Update. The following table summarises the gross Reserves and Resources status of the combined continuing Petra Group operations as at 30 June 2018.
Category
Gross
Tonnes (millions)
Grade (cpht)
Contained Diamonds
(Mcts)
Reserves
Proved - - -
Probable 93.9 45.7 42.92
Sub-total 93.9 45.7 42.92
Resources
Measured 0.2 263.9 0.60
Indicated 396.1 52.9 209.50
Inferred 1,308.6 6.1 80.38
Sub-total 1,704.9 17.0 290.48 Note: See www.petradiamonds.com for mine by mine detail. CORPORATE Rights Issue On 24 May 2018, the Company announced a 5 for 8 Rights Issue to raise net proceeds of ca. US$170 million via the issuance of 332,821,725 Rights Issue Shares at an Issue Price of 40 pence per share. The main driver for the fundraise was to accelerate a reduction in leverage to a more sustainable level, with the Board setting a target of Consolidated Net Debt to Consolidated EBITDA of 2x or less by the end of FY 2020, and to enable management to focus on ongoing operational delivery and optimisation, as well as to assist in mitigating short-term issues relating to currency volatility and other ongoing business challenges. On 13 June 2018, shareholders approved the Rights Issue, with over 99% of votes cast in favour of the transaction and on 29 June 2018, the Company announced that it had received valid
Page 23 of 57
acceptances representing ca. 95% of the total number of Rights Issue Shares offered to shareholders. The remaining ca. 5% of Rights Issue Shares were subsequently placed with institutions on the same day at a price of 52.25 pence per share. Petra’s number of shares in issue is now 865,336,485. All directors who are shareholders took up their rights in full and hold 3.8% of the Company’s issued share capital. Further to the receipt of the funds from the Rights Issue, the Company utilised ca. US$107 million to fully pay down outstanding drawn indebtedness with its South African Lending Group post Year end, (thereby realising cash interest savings of ca. US$10 – 12 million per annum), whilst retaining both of these facilities. South African Mining Legislation On 15 June 2018, the South African Department of Mineral Resources gazetted a revised draft Mining Charter which was open for comments from stakeholders until 31 August 2018. The Minerals Council South Africa, which represents the South African mining industry and of which Petra is a member, has provided submissions in relation to the draft Charter. Petra welcomes ongoing engagement with the Minister through the Minerals Council in relation to the finalisation of the Mining Charter. On 22 August 2018 the Minister of Mineral Resources informed Parliament’s Mineral Resources Portfolio Committee of his intention to withdraw the Mineral and Petroleum Resources Development Amendment Bill. Removal of the uncertainty around changes to legislation in this regard has been endorsed by the mining industry. Update on Tanzania In Tanzania, Petra is in ongoing dialogue with the Government and local advisers in relation to recent legislative developments and overdue VAT receivables. Petra also continues to communicate with the Government in relation to the blocked parcel of diamonds from Williamson. AGM In advance of the AGM on 23 November 2018, Petra would like to remind shareholders that the Company has decided to move to a more digital approach to voting and therefore requests that all shareholders vote electronically. The Company will not be sending paper proxy forms and instead, shareholders can vote either via the shareholder portal or, for CREST holders, via the CREST Network. Voting in this way is cost effective, efficient and mitigates the risk of lost items via postal systems thus ensuring your vote is received and recorded. Shareholders who still wish to receive a hard copy proxy card should contact Link Market Services to obtain this. Link’s contact details can be found here: https://www.petradiamonds.com/investors/advisers/. OUTLOOK The Company’s capital programmes have required major underground development work at each of the South African assets, significant pit re-shaping at Williamson in Tanzania and substantial processing changes across each of the mines, including the construction of a new fit-for-purpose plant at Cullinan and the rebuilding of the existing plant at Williamson. Over the period FY 2006 to FY 2018, Petra has produced a total of 27.4 million carats, generating revenue of approximately US$3.6 billion, operating cashflow of US$1.2 billion and thereby facilitating capital investment of approximately US$1.7 billion. This significant investment period has resulted in the Company’s annual production growing from circa 175,000 carats to 4.6 Mcts and its annual revenue growing from US$21.0 million to US$576.4 million (including KEM JV). As Petra now approaches the final stage of its expansion plans, it is positioned to reap the benefits of this capital intensive phase by moving the focus to cost efficient production from the new undiluted mining blocks, with a reduced capital spend profile. Petra remains on track to generate free cash flow, enabling the Company to achieve a reduction in leverage to its target of two times or less consolidated net debt to consolidated EBITDA by the end of FY 2020.
Page 24 of 57
Johan Dippenaar Chief Executive 17 September 2018
Notes 1. The following exchange rates have been used for this announcement: average for the Year US$1:ZAR12.86 (30
June 2017: US$1: ZAR13.59); closing rate as at 30 June 2018 US$1:ZAR13.73 (30 June 2017 US$1:ZAR13.05). 2. The following definitions have been used in this announcement:
a. ct: carat b. cpht: carats per hundred tonnes c. Mctpa: million carats per annum d. Mcts: million carats e. mL: metre level f. Mt: million tonnes g. Mtpa: million tonnes per annum h. ROM: run-of-mine, i.e. relating to production from the primary orebody i. SLC: sub-level cave, a variation of block caving
Page 25 of 57
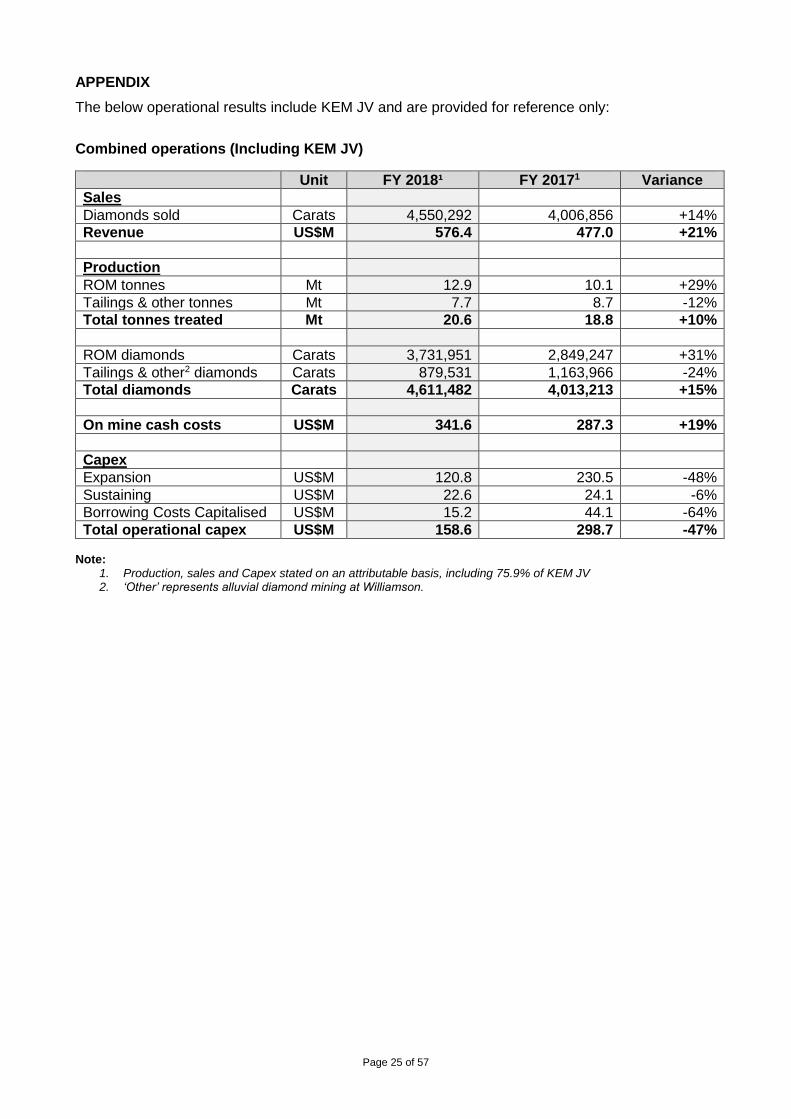
APPENDIX
The below operational results include KEM JV and are provided for reference only:
Combined operations (Including KEM JV)
Unit FY 2018¹ FY 20171 Variance
Sales
Diamonds sold Carats 4,550,292 4,006,856 +14%
Revenue US$M 576.4 477.0 +21%
Production
ROM tonnes Mt 12.9 10.1 +29%
Tailings & other tonnes Mt 7.7 8.7 -12%
Total tonnes treated Mt 20.6 18.8 +10%
ROM diamonds Carats 3,731,951 2,849,247 +31%
Tailings & other2 diamonds Carats 879,531 1,163,966 -24%
Total diamonds Carats 4,611,482 4,013,213 +15%
On mine cash costs US$M 341.6 287.3 +19%
Capex
Expansion US$M 120.8 230.5 -48%
Sustaining US$M 22.6 24.1 -6%
Borrowing Costs Capitalised US$M 15.2 44.1 -64%
Total operational capex US$M 158.6 298.7 -47% Note:
1. Production, sales and Capex stated on an attributable basis, including 75.9% of KEM JV 2. ‘Other’ represents alluvial diamond mining at Williamson.
Page 26 of 57
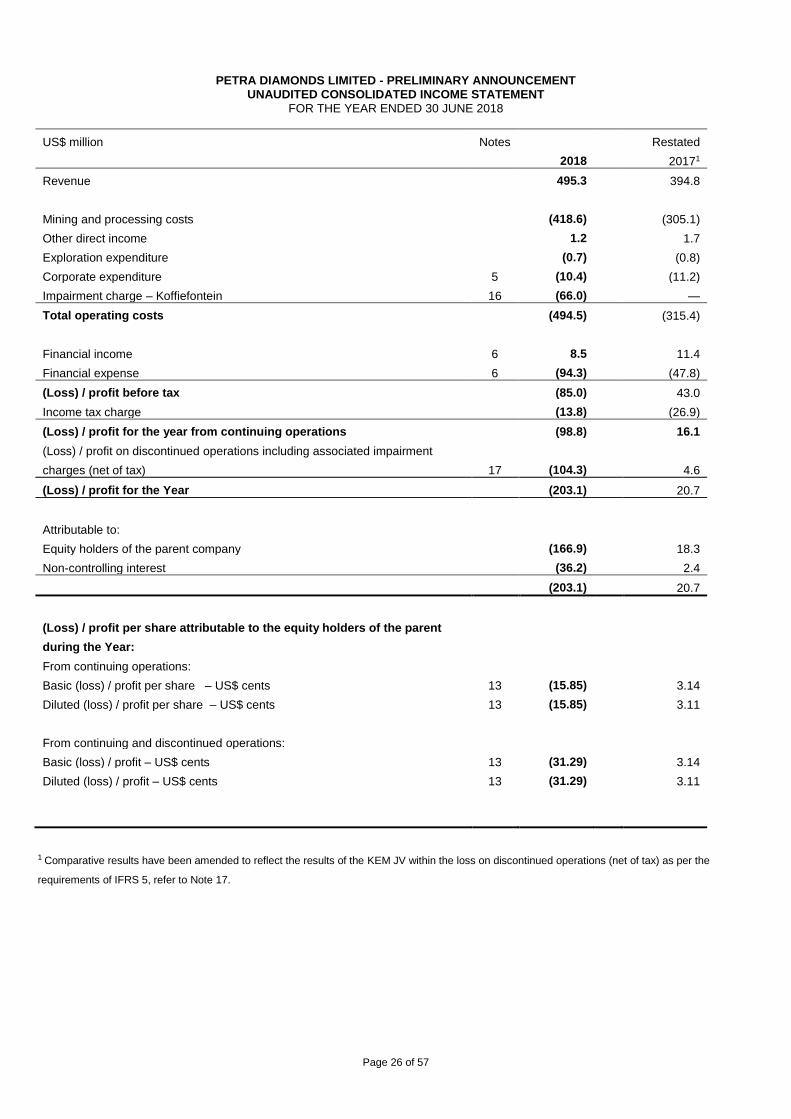
PETRA DIAMONDS LIMITED - PRELIMINARY ANNOUNCEMENT UNAUDITED CONSOLIDATED INCOME STATEMENT
FOR THE YEAR ENDED 30 JUNE 2018
US$ million Notes
2018
Restated
20171
Revenue 495.3 394.8
Mining and processing costs (418.6) (305.1)
Other direct income 1.2 1.7
Exploration expenditure (0.7) (0.8)
Corporate expenditure 5 (10.4) (11.2)
Impairment charge – Koffiefontein 16 (66.0) —
Total operating costs (494.5) (315.4)
Financial income 6 8.5 11.4
Financial expense 6 (94.3) (47.8)
(Loss) / profit before tax (85.0) 43.0
Income tax charge (13.8) (26.9)
(Loss) / profit for the year from continuing operations (98.8) 16.1
(Loss) / profit on discontinued operations including associated impairment
charges (net of tax) 17 (104.3) 4.6
(Loss) / profit for the Year (203.1) 20.7
Attributable to:
Equity holders of the parent company (166.9) 18.3
Non-controlling interest (36.2) 2.4
(203.1) 20.7
(Loss) / profit per share attributable to the equity holders of the parent
during the Year:
From continuing operations:
Basic (loss) / profit per share – US$ cents 13 (15.85) 3.14
Diluted (loss) / profit per share – US$ cents 13 (15.85) 3.11
From continuing and discontinued operations:
Basic (loss) / profit – US$ cents 13 (31.29) 3.14
Diluted (loss) / profit – US$ cents 13 (31.29) 3.11
1 Comparative results have been amended to reflect the results of the KEM JV within the loss on discontinued operations (net of tax) as per the
requirements of IFRS 5, refer to Note 17.
Page 27 of 57
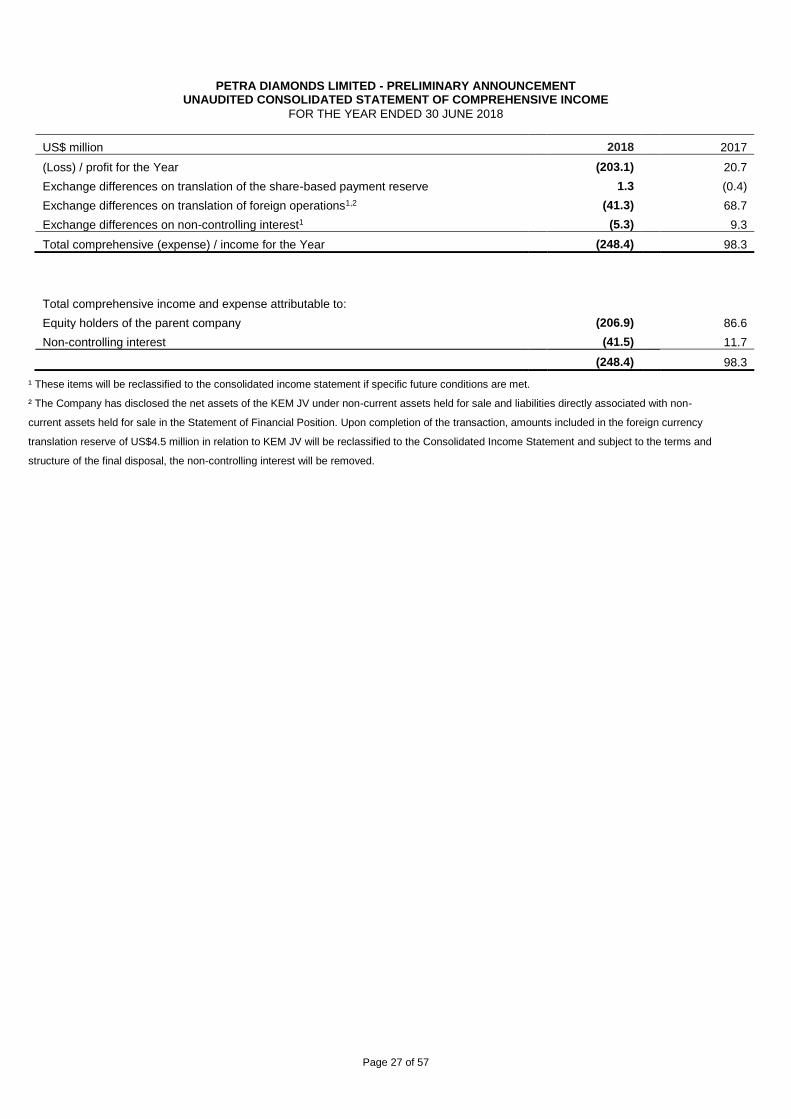
PETRA DIAMONDS LIMITED - PRELIMINARY ANNOUNCEMENT UNAUDITED CONSOLIDATED STATEMENT OF COMPREHENSIVE INCOME
FOR THE YEAR ENDED 30 JUNE 2018
US$ million 2018 2017
(Loss) / profit for the Year (203.1) 20.7
Exchange differences on translation of the share-based payment reserve 1.3 (0.4)
Exchange differences on translation of foreign operations1,2 (41.3) 68.7
Exchange differences on non-controlling interest1 (5.3) 9.3
Total comprehensive (expense) / income for the Year (248.4) 98.3
Total comprehensive income and expense attributable to:
Equity holders of the parent company (206.9) 86.6
Non-controlling interest (41.5) 11.7
(248.4) 98.3
¹ These items will be reclassified to the consolidated income statement if specific future conditions are met.
² The Company has disclosed the net assets of the KEM JV under non-current assets held for sale and liabilities directly associated with non-
current assets held for sale in the Statement of Financial Position. Upon completion of the transaction, amounts included in the foreign currency
translation reserve of US$4.5 million in relation to KEM JV will be reclassified to the Consolidated Income Statement and subject to the terms and
structure of the final disposal, the non-controlling interest will be removed.
Page 28 of 57
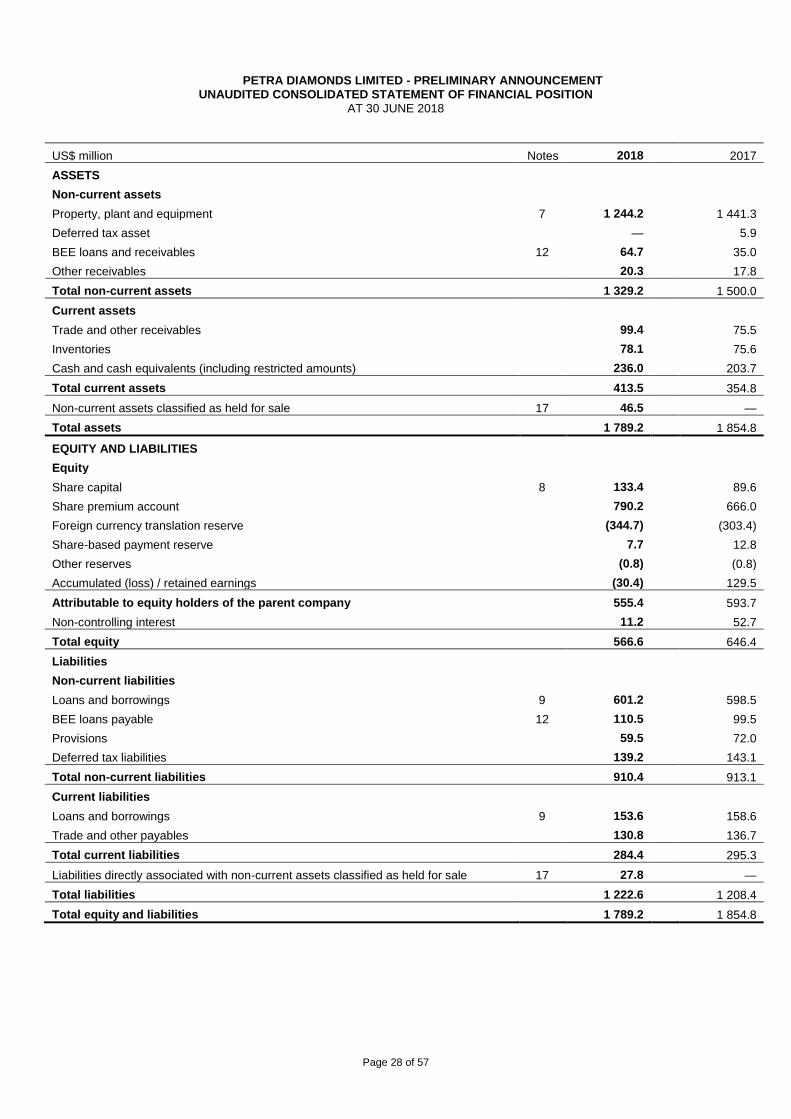
PETRA DIAMONDS LIMITED - PRELIMINARY ANNOUNCEMENT UNAUDITED CONSOLIDATED STATEMENT OF FINANCIAL POSITION
AT 30 JUNE 2018
US$ million Notes 2018 2017
ASSETS
Non-current assets
Property, plant and equipment 7 1 244.2 1 441.3
Deferred tax asset — 5.9
BEE loans and receivables 12 64.7 35.0
Other receivables 20.3 17.8
Total non-current assets 1 329.2 1 500.0
Current assets
Trade and other receivables 99.4 75.5
Inventories 78.1 75.6
Cash and cash equivalents (including restricted amounts) 236.0 203.7
Total current assets 413.5 354.8
Non-current assets classified as held for sale 17 46.5 —
Total assets 1 789.2 1 854.8
EQUITY AND LIABILITIES
Equity
Share capital 8 133.4 89.6
Share premium account 790.2 666.0
Foreign currency translation reserve (344.7) (303.4)
Share-based payment reserve 7.7 12.8
Other reserves (0.8) (0.8)
Accumulated (loss) / retained earnings (30.4) 129.5
Attributable to equity holders of the parent company 555.4 593.7
Non-controlling interest 11.2 52.7
Total equity 566.6 646.4
Liabilities
Non-current liabilities
Loans and borrowings 9 601.2 598.5
BEE loans payable 12 110.5 99.5
Provisions 59.5 72.0
Deferred tax liabilities 139.2 143.1
Total non-current liabilities 910.4 913.1
Current liabilities
Loans and borrowings 9 153.6 158.6
Trade and other payables 130.8 136.7
Total current liabilities 284.4 295.3
Liabilities directly associated with non-current assets classified as held for sale 17 27.8 —
Total liabilities 1 222.6 1 208.4
Total equity and liabilities 1 789.2 1 854.8
Page 29 of 57
PETRA DIAMONDS LIMITED – PRELIMINARY ANNOUNCEMENT
UNAUDITED CONSOLIDATED STATEMENT OF CASHFLOWS
FOR THE YEAR ENDED 30 JUNE 2018
US$ million Notes 2018 2017
(Loss) / profit before taxation for the Year from continuing and discontinued
operation (183.2) 46.5
Depreciation of property plant and equipment 135.7 79.6
Impairment charge 16 66.0 —
Impairment charge in relation to discontinued operation 17 92.7 —
Movement in provisions (3.0) (0.6)
Fair value uplift on Kimberley Ekapa Mining Joint Venture — (4.1)
Financial income 6 (8.9) (14.2)
Financial expense 6 95.6 49.5
Profit on disposal of property, plant and equipment — (0.3)
Share based payment provision 0.6 0.2
Operating profit before working capital changes 195.5 156.6
(Increase)/ decrease in trade and other receivables (76.8) 18.5
Increase/ (decrease) in trade and other payables 14.2 (5.4)
Increase in inventories (18.8) (9.5)
Cash generated from operations 114.1 160.2
Net realised gains / (losses) on foreign exchange contracts 0.2 (3.8)
Finance expense (38.9) (3.9)
Income tax paid (7.5) —
Net cash generated from operating activities 67.9 152.5
Cashflows from investing activities
Acquisition of property, plant and equipment (including capitalised cash interest paid of
US$13.3 million (30 June 2017 US$34.7 million)) (175.4) (282.9)
Proceeds from sale of property, plant and equipment 0.6 0.9
Loans advanced to BEE partners (31.0) (12.9)
Repayment from BEE partners — 0.5
Finance income 3.9 1.8
Net cash utilised in investing activities (201.9) (292.6)
Cashflows from financing activities
Proceeds from the issuance of share capital (net of cash issue costs paid of US$6.5
million) 166.9 1.1
Increase in borrowings 35.6 798.8
Repayment of borrowings (32.8) (508.8)
Net cash generated from financing activities 169.7 291.1
Net increase in cash and cash equivalents 35.7 151.0
Cash and cash equivalents at beginning of the Year 190.2 36.7
Effect of exchange rate fluctuations on cash held (2.9) 2.5
Cash and cash equivalents at end of the Year1 223.0 190.2
The cashflows specific to the discontinued operation (net of tax) are included in the amounts above and are disclosed in Note 17. ¹ Cash and cash equivalents in the Consolidated Statement of Financial Position includes restricted cash of US$14.4 million (30 June 2017: US$13.5 million) and unrestricted cash of US$221.6 million (30 June 2017: US$190.2 million) and excludes unrestricted cash attributable to KEM JV of US$1.4 million (refer to note 17).
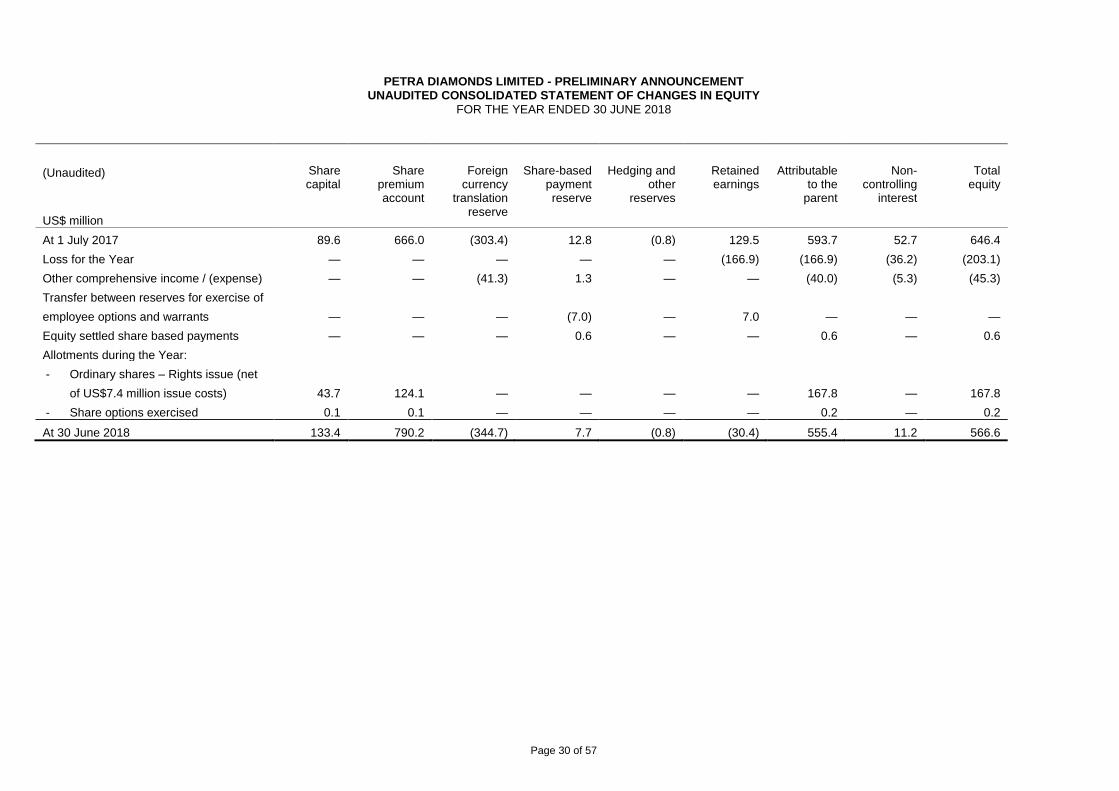
Page 30 of 57
PETRA DIAMONDS LIMITED - PRELIMINARY ANNOUNCEMENT UNAUDITED CONSOLIDATED STATEMENT OF CHANGES IN EQUITY
FOR THE YEAR ENDED 30 JUNE 2018
(Unaudited)
US$ million
Share capital
Share premium account
Foreign currency
translation reserve
Share-based payment reserve
Hedging and other
reserves
Retained earnings
Attributable to the
parent
Non-controlling
interest
Total equity
At 1 July 2017 89.6 666.0 (303.4) 12.8 (0.8) 129.5 593.7 52.7 646.4
Loss for the Year — — — — — (166.9) (166.9) (36.2) (203.1)
Other comprehensive income / (expense) — — (41.3) 1.3 — — (40.0) (5.3) (45.3)
Transfer between reserves for exercise of
employee options and warrants — — — (7.0) — 7.0 — — —
Equity settled share based payments — — — 0.6 — — 0.6 — 0.6
Allotments during the Year:
- Ordinary shares – Rights issue (net
of US$7.4 million issue costs) 43.7 124.1 — — — — 167.8 — 167.8
- Share options exercised 0.1 0.1 — — — — 0.2 — 0.2
At 30 June 2018 133.4 790.2 (344.7) 7.7 (0.8) (30.4) 555.4 11.2 566.6
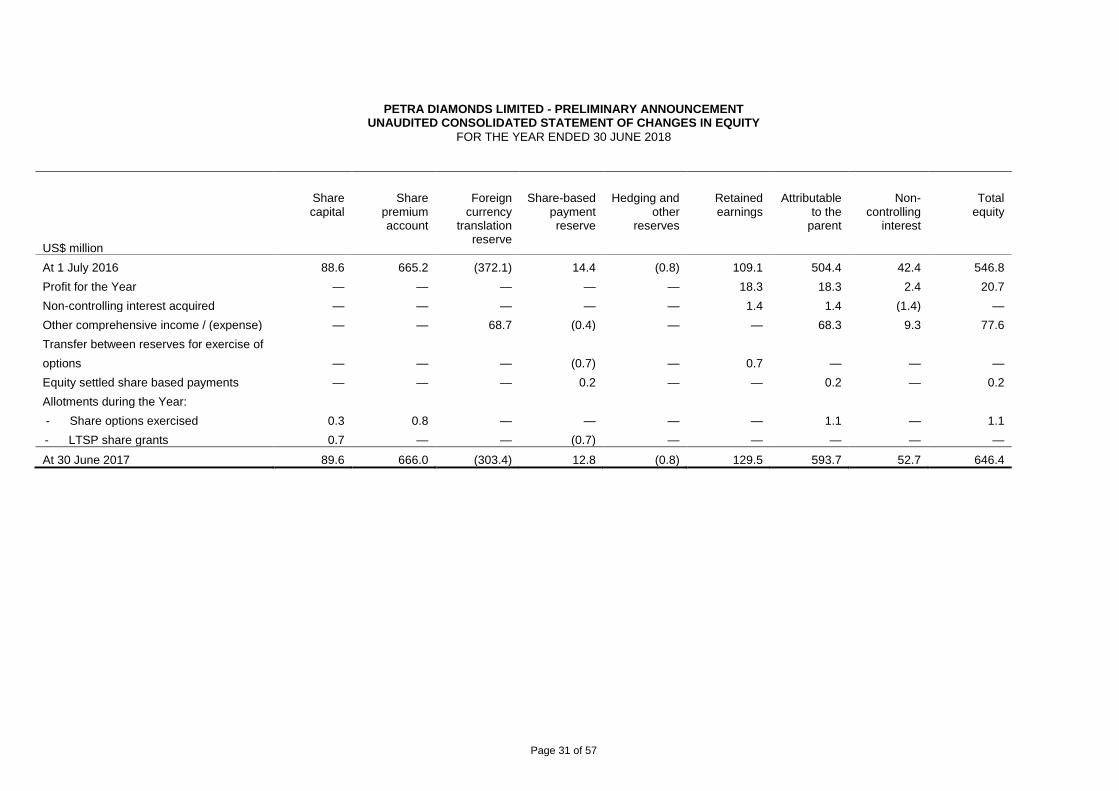
Page 31 of 57
PETRA DIAMONDS LIMITED - PRELIMINARY ANNOUNCEMENT UNAUDITED CONSOLIDATED STATEMENT OF CHANGES IN EQUITY
FOR THE YEAR ENDED 30 JUNE 2018
US$ million
Share capital
Share premium account
Foreign currency
translation reserve
Share-based payment reserve
Hedging and other
reserves
Retained earnings
Attributable to the
parent
Non-controlling
interest
Total equity
At 1 July 2016 88.6 665.2 (372.1) 14.4 (0.8) 109.1 504.4 42.4 546.8
Profit for the Year — — — — — 18.3 18.3 2.4 20.7
Non-controlling interest acquired — — — — — 1.4 1.4 (1.4) —
Other comprehensive income / (expense) — — 68.7 (0.4) — — 68.3 9.3 77.6
Transfer between reserves for exercise of
options — — — (0.7) — 0.7 — — —
Equity settled share based payments — — — 0.2 — — 0.2 — 0.2
Allotments during the Year:
- Share options exercised 0.3 0.8 — — — — 1.1 — 1.1
- LTSP share grants 0.7 — — (0.7) — — — — —
At 30 June 2017 89.6 666.0 (303.4) 12.8 (0.8) 129.5 593.7 52.7 646.4
Page 32 of 57
NOTES TO THE CONDENSED CONSOLIDATED PRELIMINARY FINANCIAL STATEMENTS
FOR THE YEAR ENDED 30 JUNE 2018
1. GENERAL INFORMATION
Petra Diamonds Limited (the “Company”), a limited liability company listed on the Main Market of the London Stock
Exchange, is registered in Bermuda with its Group management office domiciled in the United Kingdom (effective 01
May 2017).) The Consolidated Preliminary Financial Statements of the Company for the year ended 30 June 2018
comprise the Company and its subsidiaries, joint operations and associates (together referred to as the “Group”).
2. ACCOUNTING POLICIES
The preliminary results, which are unaudited, do not include all the notes of the type normally included in an annual
financial report. Accordingly, this unaudited preliminary report is to be read in conjunction with the Annual Report for
the year ended 30 June 2017, and any public announcements made by the Group during the reporting period. The
annual financial report for the year ended 30 June 2017 was prepared in accordance with International Financial
Reporting Standards as adopted by the European Union (“IFRS’s”) and the accounting policies applied in this
preliminary report are consistent with the polices applied in the annual financial report for the year ended 30 June
2017 unless otherwise noted.
Accounting policy for Non-current assets held for sale and discontinued operations
Where an operation within the Group is separately identified or forms part of a separate reporting structure, the
Group will classify the asset as held for sale, in accordance with IFRS 5, if management has committed to a plan to
sell, the operation is available for sale, an active search for a buyer is in place, the disposal is highly probably within
12 months of classifying as held for sale and completion of the disposal is unlikely to significantly change. The
KEMJV and Botswana exploration operations met the criteria mentioned above and as such have been classified as
held for sale. The assets held for sale are measured at the lower of their carrying amount and fair value less costs to
sell. An impairment loss is recognised for any initial or subsequent write-down of the asset to fair value less costs to
sell. A gain is recognised for any subsequent increases in fair value less costs to sell of an asset but not in excess of
any cumulative impairment loss previously recognised. A gain or loss not previously recognised by the date of the
sale of the non-current asset is recognised at the date of derecognition. Non-current assets classified as held for
sale and the assets of an operation classified as held for sale are presented separately from the other assets in the
statement of financial position. The liabilities of an identified operation classified as held for sale are presented
separately from other liabilities in the statement of financial position.
A discontinued operation is a component of the entity that has been disposed of or is classified as held for sale and
that represents a separate major line of business or geographical area of operations, is part of a single co-ordinated
plan to dispose of such a line of business or area of operations, or is a subsidiary acquired exclusively with a view to
resale. The results of discontinued operations are presented separately in the statement of profit or loss.
Unrealised foreign exchange gains and losses on historic retranslation of the subsidiaries results into US Dollars are
recycled to the consolidated income statement upon completion of the disposal. The non-controlling interest
attributable to minority shareholders is recycled to the consolidated income statement upon completion of the
disposal. The Group designates the results of discontinued activities, including those of disposed subsidiaries,
separately in accordance with IFRS and reclassifies the results of the operation in the comparative period from
continuing to discontinued operations. The Group does not consider mines held on care and maintenance to be
discontinued activities unless the mine is abandoned.
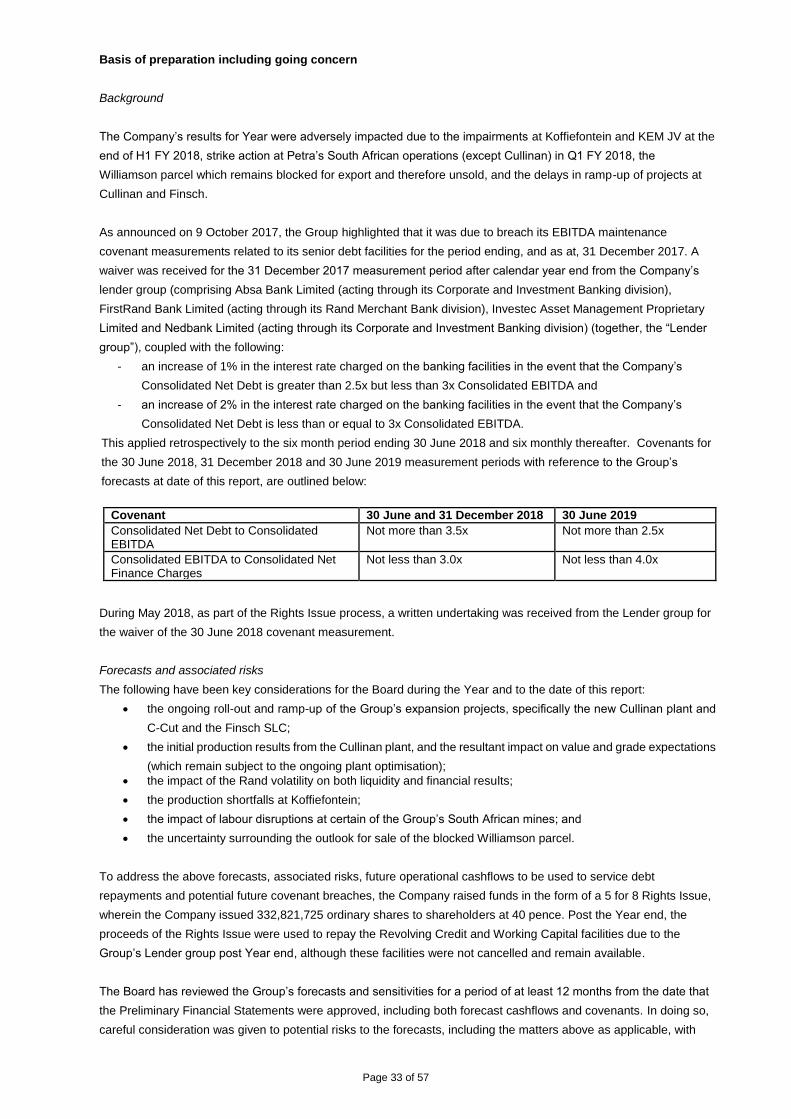
Page 33 of 57
Basis of preparation including going concern
Background
The Company’s results for Year were adversely impacted due to the impairments at Koffiefontein and KEM JV at the
end of H1 FY 2018, strike action at Petra’s South African operations (except Cullinan) in Q1 FY 2018, the
Williamson parcel which remains blocked for export and therefore unsold, and the delays in ramp-up of projects at
Cullinan and Finsch.
As announced on 9 October 2017, the Group highlighted that it was due to breach its EBITDA maintenance
covenant measurements related to its senior debt facilities for the period ending, and as at, 31 December 2017. A
waiver was received for the 31 December 2017 measurement period after calendar year end from the Company’s
lender group (comprising Absa Bank Limited (acting through its Corporate and Investment Banking division),
FirstRand Bank Limited (acting through its Rand Merchant Bank division), Investec Asset Management Proprietary
Limited and Nedbank Limited (acting through its Corporate and Investment Banking division) (together, the “Lender
group”), coupled with the following:
- an increase of 1% in the interest rate charged on the banking facilities in the event that the Company’s
Consolidated Net Debt is greater than 2.5x but less than 3x Consolidated EBITDA and
- an increase of 2% in the interest rate charged on the banking facilities in the event that the Company’s
Consolidated Net Debt is less than or equal to 3x Consolidated EBITDA.
This applied retrospectively to the six month period ending 30 June 2018 and six monthly thereafter. Covenants for
the 30 June 2018, 31 December 2018 and 30 June 2019 measurement periods with reference to the Group’s
forecasts at date of this report, are outlined below:
Covenant 30 June and 31 December 2018 30 June 2019
Consolidated Net Debt to Consolidated EBITDA
Not more than 3.5x Not more than 2.5x
Consolidated EBITDA to Consolidated Net Finance Charges
Not less than 3.0x Not less than 4.0x
During May 2018, as part of the Rights Issue process, a written undertaking was received from the Lender group for
the waiver of the 30 June 2018 covenant measurement.
Forecasts and associated risks
The following have been key considerations for the Board during the Year and to the date of this report:
the ongoing roll-out and ramp-up of the Group’s expansion projects, specifically the new Cullinan plant and
C-Cut and the Finsch SLC;
the initial production results from the Cullinan plant, and the resultant impact on value and grade expectations
(which remain subject to the ongoing plant optimisation);
the impact of the Rand volatility on both liquidity and financial results;
the production shortfalls at Koffiefontein;
the impact of labour disruptions at certain of the Group’s South African mines; and
the uncertainty surrounding the outlook for sale of the blocked Williamson parcel.
To address the above forecasts, associated risks, future operational cashflows to be used to service debt
repayments and potential future covenant breaches, the Company raised funds in the form of a 5 for 8 Rights Issue,
wherein the Company issued 332,821,725 ordinary shares to shareholders at 40 pence. Post the Year end, the
proceeds of the Rights Issue were used to repay the Revolving Credit and Working Capital facilities due to the
Group’s Lender group post Year end, although these facilities were not cancelled and remain available.
The Board has reviewed the Group’s forecasts and sensitivities for a period of at least 12 months from the date that
the Preliminary Financial Statements were approved, including both forecast cashflows and covenants. In doing so,
careful consideration was given to potential risks to the forecasts, including the matters above as applicable, with
Page 34 of 57
scenarios subsequently assessed for: a) reduced diamond prices; b) reduced value at Cullinan during the ramp up
of the C-cut and optimisation of the plant; c) potential volatility in the Rand; or d) increased operating costs.
The forecasts indicate that the Group retains sufficient liquidity from existing cash resources and operating
cashflows, without the need to utilise existing facilities, to meet its liabilities as they fall due under the forecasts and
reasonably possible sensitivities. Under the base case, the Company forecasts to maintain headroom against its
financial covenants going forward. Base case forecasts assume an average exchange rate of ZAR13.40:US$1 but
excludes the proceeds from the sale of the blocked Williamson parcel during the forecast period.
Conclusion
The Board is cognisant of the scope and significance of the projects undertaken to date, and the ongoing risks
around ramp-up and commissioning, coupled with the significant debt financing that has been required to
accompany this transformational expansion programme alongside the macro-economic factors relating to the
industry.
However, subsequent to the receipt of the Rights Issue proceeds, with the Cullinan plant having achieved nameplate
capacity, and Cullinan’s C-Cut and Finsch’s SLC in place and ramping up, the Board is of the opinion that the
fundamental business plan of the Group is intact, given that the operations will be mining the majority of their ROM
tonnes from new, undiluted areas from FY 2019 onwards.
Based on this, alongside the Group’s existing cash resources and facilities, the Board remains satisfied that the
liquidity headroom remains adequate under the Group’s current base case and reasonable sensitivities.
Furthermore, the Board recognises the Company has some ability to preserve cash should it be required in the
short-term (for example, by deferring non-essential cash payments, maintaining very tight control over costs and
overhead, and by potentially deferring certain elements of its capital expenditure that are not essential to the current
ramp-up plans).
Accordingly, the Board has concluded that the going concern basis in the preparation of the unaudited condensed
preliminary financial statements remains appropriate and that there are no material uncertainties that would cast
doubt on that basis of preparation.
The unaudited consolidated preliminary financial statements for the year ended 30 June 2018 do not constitute
statutory accounts and have been drawn up using accounting policies and presentation expected to be adopted in
the Group’s full financial statements for the year ended 30 June 2018, which are not expected to be significantly
different to those set out in notes 1 - 37 of the Group’s audited financial statements for the year ended 30 June
2017, except in relation to the accounting policy for non-current assets held for sale and discontinued operations.
The financial information for the year ended 30 June 2017 has been extracted from the statutory accounts for that
period. The 30 June 2017 statutory accounts have been restated to reflect the results of the KEM JV within the loss
on discontinued operations (net of tax) in the Consolidated Income Statement as per the requirements of IFRS 5,
refer to Note 17. The auditors’ report for the year ended 30 June 2017 was unqualified and did not include
references to any matters to which the auditors drew attention by way of emphasis without qualifying their report.
New standards and interpretations applied
The IASB has issued no new standards, amendments to published standards and interpretations to existing
standards with effective dates on or prior to 1 July 2017 which have a material effect on the Group.
New standards and interpretations not yet effective
Certain new standards, amendments and interpretations to existing standards have been published that are
mandatory for the Group’s accounting periods beginning after 1 July 2018 or later periods, which the Group has
decided not to adopt early or which are yet to be European Union endorsed.
Page 35 of 57
The only standards which are anticipated to be significant or relevant to the Group are:
IFRS 15 Revenue from Contracts with Customers
The Group is required to apply IFRS 15 for the reporting period beginning 1 July 2018. Management have assessed
the core principle of IFRS 15, that the Group will recognise revenue to depict the transfer of promised diamond sales
to customers in an amount that reflects the consideration to which the Group expects to be entitled in exchange for
the diamond sales.
Diamond sales are made through a competitive tender process. Diamond sales are recognised when significant
risks and rewards of ownership are transferred to the buyer, costs can be reliably measured and receipt of tender
proceeds probable – this is deemed to be the point at which the tender is awarded. The Group has reviewed the
terms and conditions of the current tender contract entered into with each of the buyers and are satisfied that, based
on the terms of the current contracts, there is no change to the timing of revenue recognition on tender sales under
IFRS 15.
Where the Group makes rough diamond sales to customers and retains a vested right in the future sale of a
polished diamond, the Group will record such revenue only at the date when the polished diamond is sold (and only
its interest therein). The Group has reviewed the terms and conditions of its current contracts pertaining to such
scenarios and is satisfied that there is no change, based on the terms of the current contracts, to the timing of
revenue recognition on such sales under IFRS 15.
IFRS 16 Leases
IFRS 16 introduces a single lease accounting model. This standard requires lessees to account for all leases under
a single on-balance sheet model. Under the new standard, a lessee is required to recognise all lease assets and
liabilities on the balance sheet; recognise amortisation of leased assets and interest on lease liabilities over the
lease term; and separately present the principal amount of cash paid and interest in the cashflow statement. The
requirements of IFRS 16 extend to certain service contracts, such as mining contractors in which the contractor
provides services and the use of assets, which may impact the Group. Accordingly, the Group is performing a
review of relevant contracts to complete an impact assessment.
IFRS 9 Financial Instruments
IFRS 9 “Financial instruments” addresses the classification and measurement of financial assets and financial
liabilities. The complete version of IFRS 9 was issued in July 2014. It replaces the guidance in IAS 39 that relates to
the classification and measurement of financial instruments. IFRS 9 retains but simplifies the mixed measurement
model and establishes three primary measurement categories for financial assets: amortised cost, fair value through
other comprehensive income (OCI) and fair value through profit or loss. The basis of classification depends on the
entity’s business model and the contractual cashflow characteristics of the financial asset. Investments in equity
instruments are required to be measured at fair value through profit or loss with the irrevocable option at inception to
present changes in fair value in OCI. There is now a new expected credit loss model that replaces the incurred loss
impairment model used in IAS 39. It is noted that VAT receivables are outside the scope of this standard. For
financial liabilities there were no changes to classification and measurement except for the recognition of changes in
credit risk in other comprehensive income, for liabilities designated at fair value through profit or loss. The impact of
IFRS 9 will be largely affected by the Group’s hedge accounting policies in place together with the assessment of
expected credit losses on financial assets such as the BEE trade receivables. The Group is finalising its assessment
however Management do not expect IFRS 9 to have a material impact.
Significant assumptions and judgements:
The preparation of the condensed consolidated preliminary financial statements requires management to make
estimates and judgements and form assumptions that affect the reported amounts of the assets and liabilities,
Page 36 of 57
reported revenue and costs during the periods presented therein, and the disclosure of contingent liabilities at the
date of the preliminary financial statements. Estimates and judgements are continually evaluated and based on
management’s historical experience and other factors, including future expectations and events that are believed to
be reasonable. The estimates and assumptions that have a significant risk of causing a material adjustment to the
financial results of the Group in future reporting periods are discussed below.
Key estimates and judgements:
Impairment reviews
The Group prepares impairment models and assesses mining assets for impairment. While conducting an
impairment review of its assets using value in use impairment models using the current life of mine plans, the Group
exercised judgement in making assumptions about future rough diamond prices, foreign exchange rates, volumes of
production, ore reserves and resources included in the current life of mine plans, future development and production
costs and factors such as inflation and discount rates. Changes in estimates used can result in significant changes
to the ‘Consolidated Income Statement’ and ‘Statement of Financial Position’.
Koffiefontein
The impairment test at Koffiefontein resulted in the recognition of an impairment charge of US$66.0 million on a
carrying value of property, plant and equipment of US$118.2 million. For further details of the inputs, assumptions
and sensitivities in the impairment model refer to note 16.
KEM JV
See separate section below for details of the impairment charge in relation to the KEM JV upon its classification to
an asset held for sale under IFRS 5.
Cullinan, Finsch and Williamson
The impairment test for Cullinan, Finsch and Williamson as at 30 June 2018 did not result in any impairment on the
carrying value of property, plant and equipment. For further details of the inputs, assumptions and sensitivities in the
impairment models refer to note 16.
Recoverability of diamond parcel in Tanzania
The Group holds diamond inventory valued at lower of cost and net realizable value of US$12.5 million (30 June
2017: US$ nil) in the Statement of Financial Position in respect of the Williamson mine’s confiscated diamond parcel.
During the Year, an investigation into the Tanzanian diamond sector by a parliamentary committee in Tanzania was
undertaken to determine if diamond royalty payments were being understated. In connection with this, Petra
announced on 11 September 2017 that a parcel of diamonds (71,654.45 carats) from the Williamson mine in
Tanzania (owned 75% by Petra and 25% by the Government of the United Republic of Tanzania (“GoT”)) had been
blocked for export to Petra’s marketing office in Antwerp.
The assessment of the recoverability of the diamond parcel required significant judgement. In making such a
judgement, the Group considered their ongoing discussions with the GoT, confirmation received from the GoT post
Year-end that they still hold the diamond parcel of 71,654.45 carats, an assessment of the internal process used for
the sale and export of diamonds confirming such process is in full compliance with legislation in Tanzania and the
Kimberley Process and legal advice received from the Group’s in-country attorneys which supports the Group’s
position,.
During the Year, Petra received authorisation from the GoT to resume diamond exports and sales from Williamson
and all subsequent parcels of diamonds have been exported from Tanzania, for eventual sale at the Company’s
marketing office in Antwerp. While a resolution has not yet been reached with regards to the parcel of diamonds that
was blocked from export, based on the above judgements and assessment thereof, management remain confident
that the diamond parcel will be released by GoT and will be available for future sale.
Page 37 of 57
Recoverability of VAT in Tanzania
The Group holds VAT receivables carried at US$20.3 million (30 June 2017: US$15.8 million) in the Statement of
Financial Position in respect of the Williamson mine, all of which is past due and the receivables have been
classified, after providing for a time-value of money provision, as non-current given the potential delays in receipt. Of
the total VAT receivable, US$12.7 million (30 June 2017: US$15.8 million) relates to historic VAT pre July 2017. The
assessment of the carrying value of the VAT receivable under the historic VAT legislation required significant
judgement over the timing of future payments, progress and finalisation of VAT audits, ongoing discussions with the
relevant authorities in Tanzania and the wider operating environment.
A further US$7.6 million of VAT is receivable which relates to VAT under the current legislation, effective from July
2017. The assessment of the carrying value of the VAT receivable under the current VAT legislation required
significant judgement over the timing of future payments, the definition of raw minerals under the new VAT
legislation, ongoing discussions with the relevant authorities in Tanzania, legal advice and the wider operating
environment. Management have considered the current legislation and consider that input VAT can continue be
recovered in relation to the export of rough diamonds, however note that the current legislation is unclear. As such,
Management consider the VAT receivables under the new VAT legislation to be valid. Accordingly, the Group is
pursuing near term payment in accordance with legislation.
While the total VAT balance is considered receivable, uncertainty exists regarding the timing of receipt. Accordingly,
the receivable has been discounted by US$3.9 million (30 June 2017: US$2.7 million) which required estimates as
to the timing of future receipts. A discount rate of 9.0% has been applied to the expected cash receipts. A 1%
increase in the discount rate would increase the provision by US$0.3 million and a one year delay would increase
the provision by US$1.7 million.
Kimberley Ekapa Mining Joint Venture (30 June 2018)
In line with IFRS 5 and the Group’s accounting policy for assets held for sale and discontinued, the Kimberley Ekapa
Mining Joint Venture (“KEM JV”) was classified as held for sale at the Year-end. Judgement was required in
determining the fair value adjustment on reclassification of the KEM JV to non-current assets held for sale, with
regards to the purchase offer, received from Ekapa Mining, for the Company’s and its black economic empowerment
(“BEE”) partners’ 75.9% interest. The fair value adjustment to property, plant and equipment, non-current trade and
other receivables and trade and other receivables was to ensure the asset values of the KEM JV were reflected at
fair value based on the consideration receivable under the purchase offer if the transaction completes. The
accounting treatment involved consideration of the structure of the arrangement, the legal form and the contractual
agreements between the parties. Refer to note 17 for further details.
Kimberley Ekapa Mining Joint Venture (30 June 2017)
Judgement was applied in determining the fair value adjustments in respect of the Kimberley Ekapa Mining Joint
Venture (“KEM JV”) acquisition in the prior Year. The fair value adjustments to mineral properties were to ensure the
asset values for Petra’s incremental share in Ekapa Minerals (Pty) Ltd (“Ekapa Minerals”) and Petra’s interest in
Super Stone were reflected at fair value. The Group has joint control over the KEM JV and recognises its share of
the assets, liabilities, income and expenses. The accounting treatment involved consideration of the structure of the
arrangement, the legal form and the contractual agreements between the parties.
BEE guarantee
The BEE partners obtained bank financing from ABSA, RMB and Investec (the “BEE Lenders”) to refinance
amounts owing by the BEE partners to Petra, which had provided funding to the BEE partners to enable them to
acquire their interests in Finsch and Cullinan. As part of the refinancing the Group provided a guarantee to the BEE
Lenders over the repayment of loans advanced to the Group’s BEE partners. The BEE partners will settle their loan
obligations with the BEE Lenders from their share of future operational cashflows, either through repayment of the
amounts owing to the BEE partners by Petra or through recoverable advances provided by Petra from Group
treasury.
Judgement has been applied by management is assessing the risk of the BEE partners defaulting under their
Page 38 of 57
obligations to the BEE Lenders. Management have considered the Group’s future cashflows forecasts and its ability
to meet planned forecast BEE partner distributions. Accordingly management are of the opinion the risk of default
by the BEE partners to the BEE Lenders is remote (refer to note 12 for further details).
Other key estimates and judgements
In addition to the key estimates and judgements disclosed above, the following estimates and judgements have not
significantly changed from those disclosed in the FY 2017 Annual Report and will be discussed in further detail in
the FY 2018 Annual Report:
- Life of mine and ore reserves and resources
- Capitalisation of borrowing costs
- Provision for rehabilitation
- Inventory and inventory stockpile
- Depreciation
- Pension and post-retirement medical fund schemes
- Net investments in foreign operations
3. DIVIDENDS
No dividends have been declared in respect of the current Year under review (30 June 2017: US$nil).
4. SEGMENTAL INFORMATION
Segment information is presented in respect of the Group’s operating and geographical segments:
Mining – the extraction and sale of rough diamonds from mining operations in South Africa and Tanzania.
Exploration – exploration activities in Botswana.
Corporate – administrative activities in United Kingdom.
Segments are based on the Group’s management and internal reporting structure. Management reviews the
Group’s performance by reviewing the results of the mining activities in South Africa and Tanzania, reviewing the
results of exploration activities in Botswana and reviewing the corporate administration expenses in United Kingdom.
Each segment derives, or aims to derive, its revenue from diamond mining and diamond sales, except for the
corporate and administration cost centre.
Segment results, assets and liabilities include items directly attributable to a segment, as well as those that can be
allocated on a reasonable basis. Segment results are calculated after charging direct mining costs, depreciation and
other income and expenses. Unallocated items comprise mainly interest-earning assets and revenue, interest-
bearing borrowings and expenses and corporate assets and expenses. Segment capital expenditure is the total cost
incurred during the year to acquire segment assets that are expected to be used for more than one period.
Eliminations comprise transactions between Group companies that are cancelled on consolidation. The results are
not materially affected by seasonal variations. Revenues are generated from tenders held in South Africa and
Antwerp for external customers from various countries, the ultimate customers of which are not known to the Group.
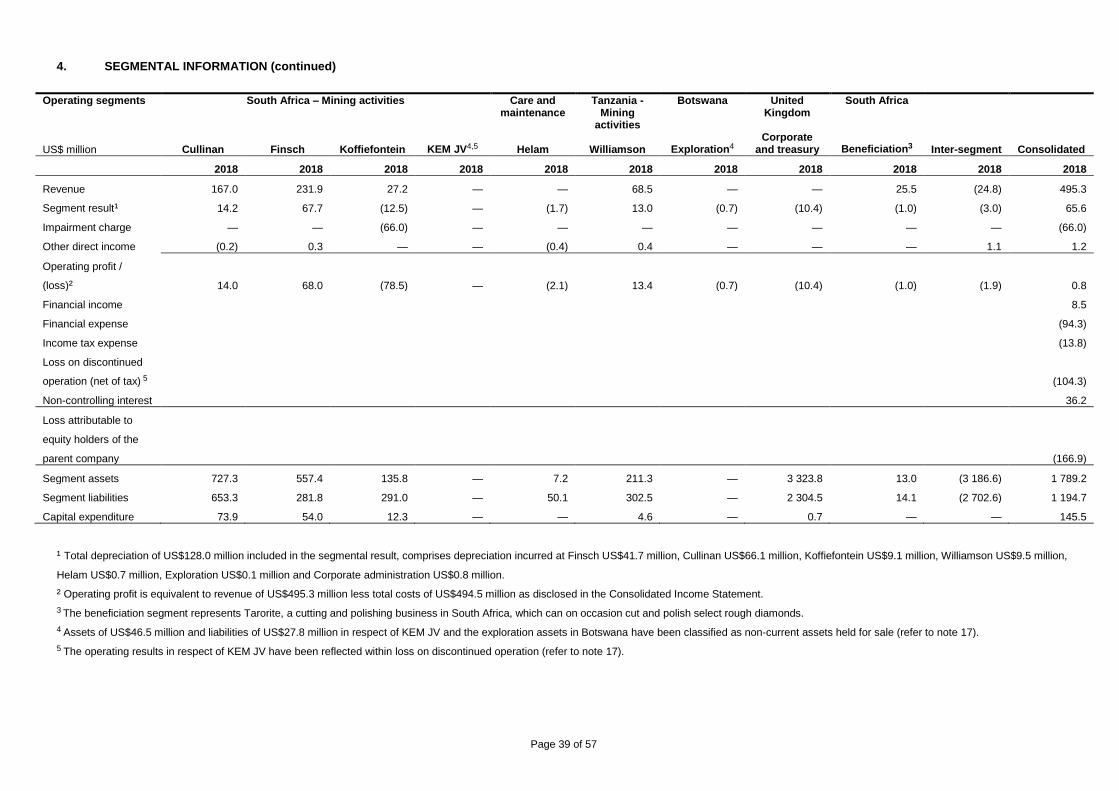
Page 39 of 57
4. SEGMENTAL INFORMATION (continued)
Operating segments South Africa – Mining activities Care and maintenance
Tanzania -Mining
activities
Botswana United Kingdom
South Africa
US$ million Cullinan Finsch Koffiefontein KEM JV4,5 Helam Williamson Exploration4
Corporate and treasury Beneficiation3 Inter-segment Consolidated
2018 2018 2018 2018 2018 2018 2018 2018 2018 2018 2018
Revenue 167.0 231.9 27.2 — — 68.5 — — 25.5 (24.8) 495.3
Segment result¹ 14.2 67.7 (12.5) — (1.7) 13.0 (0.7) (10.4) (1.0) (3.0) 65.6
Impairment charge — — (66.0) — — — — — — — (66.0)
Other direct income (0.2) 0.3 — — (0.4) 0.4 — — — 1.1 1.2
Operating profit /
(loss)²
14.0 68.0 (78.5)
— (2.1) 13.4 (0.7) (10.4)
(1.0) (1.9) 0.8
Financial income 8.5
Financial expense (94.3)
Income tax expense (13.8)
Loss on discontinued
operation (net of tax) 5
(104.3)
Non-controlling interest 36.2
Loss attributable to
equity holders of the
parent company
(166.9)
Segment assets 727.3 557.4 135.8 — 7.2 211.3 — 3 323.8 13.0 (3 186.6) 1 789.2
Segment liabilities 653.3 281.8 291.0 — 50.1 302.5 — 2 304.5 14.1 (2 702.6) 1 194.7
Capital expenditure 73.9 54.0 12.3 — — 4.6 — 0.7 — — 145.5
¹ Total depreciation of US$128.0 million included in the segmental result, comprises depreciation incurred at Finsch US$41.7 million, Cullinan US$66.1 million, Koffiefontein US$9.1 million, Williamson US$9.5 million,
Helam US$0.7 million, Exploration US$0.1 million and Corporate administration US$0.8 million.
² Operating profit is equivalent to revenue of US$495.3 million less total costs of US$494.5 million as disclosed in the Consolidated Income Statement.
3 The beneficiation segment represents Tarorite, a cutting and polishing business in South Africa, which can on occasion cut and polish select rough diamonds.
4 Assets of US$46.5 million and liabilities of US$27.8 million in respect of KEM JV and the exploration assets in Botswana have been classified as non-current assets held for sale (refer to note 17).
5 The operating results in respect of KEM JV have been reflected within loss on discontinued operation (refer to note 17).
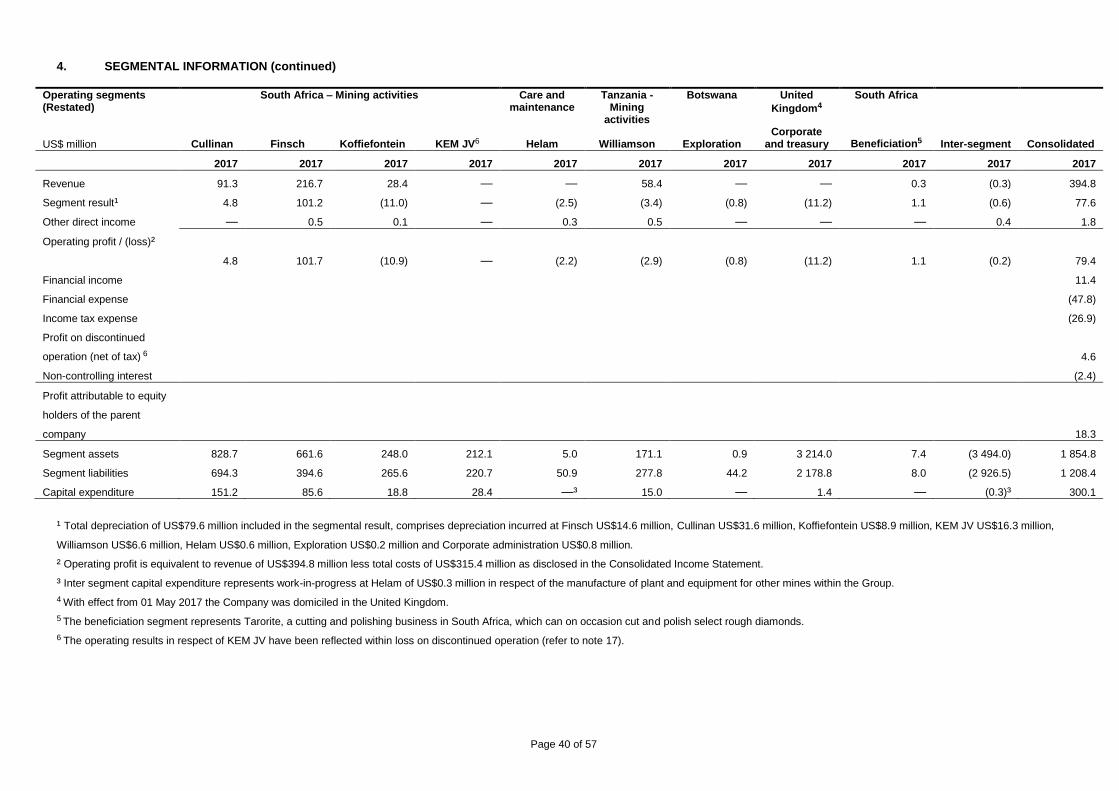
Page 40 of 57
4. SEGMENTAL INFORMATION (continued)
Operating segments (Restated)
South Africa – Mining activities Care and maintenance
Tanzania -Mining
activities
Botswana United
Kingdom4
South Africa
US$ million Cullinan Finsch Koffiefontein KEM JV6 Helam Williamson Exploration
Corporate and treasury Beneficiation5 Inter-segment Consolidated
2017 2017 2017 2017 2017 2017 2017 2017 2017 2017 2017
Revenue 91.3 216.7 28.4 — — 58.4 — — 0.3 (0.3) 394.8
Segment result¹ 4.8 101.2 (11.0) — (2.5) (3.4) (0.8) (11.2) 1.1 (0.6) 77.6
Other direct income — 0.5 0.1 — 0.3 0.5 — — — 0.4 1.8
Operating profit / (loss)²
4.8 101.7 (10.9)
— (2.2) (2.9) (0.8) (11.2)
1.1 (0.2) 79.4
Financial income 11.4
Financial expense (47.8)
Income tax expense (26.9)
Profit on discontinued
operation (net of tax) 6
4.6
Non-controlling interest (2.4)
Profit attributable to equity
holders of the parent
company
18.3
Segment assets 828.7 661.6 248.0 212.1 5.0 171.1 0.9 3 214.0 7.4 (3 494.0) 1 854.8
Segment liabilities 694.3 394.6 265.6 220.7 50.9 277.8 44.2 2 178.8 8.0 (2 926.5) 1 208.4
Capital expenditure 151.2 85.6 18.8 28.4 —³ 15.0 — 1.4 — (0.3)³ 300.1
¹ Total depreciation of US$79.6 million included in the segmental result, comprises depreciation incurred at Finsch US$14.6 million, Cullinan US$31.6 million, Koffiefontein US$8.9 million, KEM JV US$16.3 million,
Williamson US$6.6 million, Helam US$0.6 million, Exploration US$0.2 million and Corporate administration US$0.8 million.
² Operating profit is equivalent to revenue of US$394.8 million less total costs of US$315.4 million as disclosed in the Consolidated Income Statement.
³ Inter segment capital expenditure represents work-in-progress at Helam of US$0.3 million in respect of the manufacture of plant and equipment for other mines within the Group.
4 With effect from 01 May 2017 the Company was domiciled in the United Kingdom.
5 The beneficiation segment represents Tarorite, a cutting and polishing business in South Africa, which can on occasion cut and polish select rough diamonds.
6 The operating results in respect of KEM JV have been reflected within loss on discontinued operation (refer to note 17).
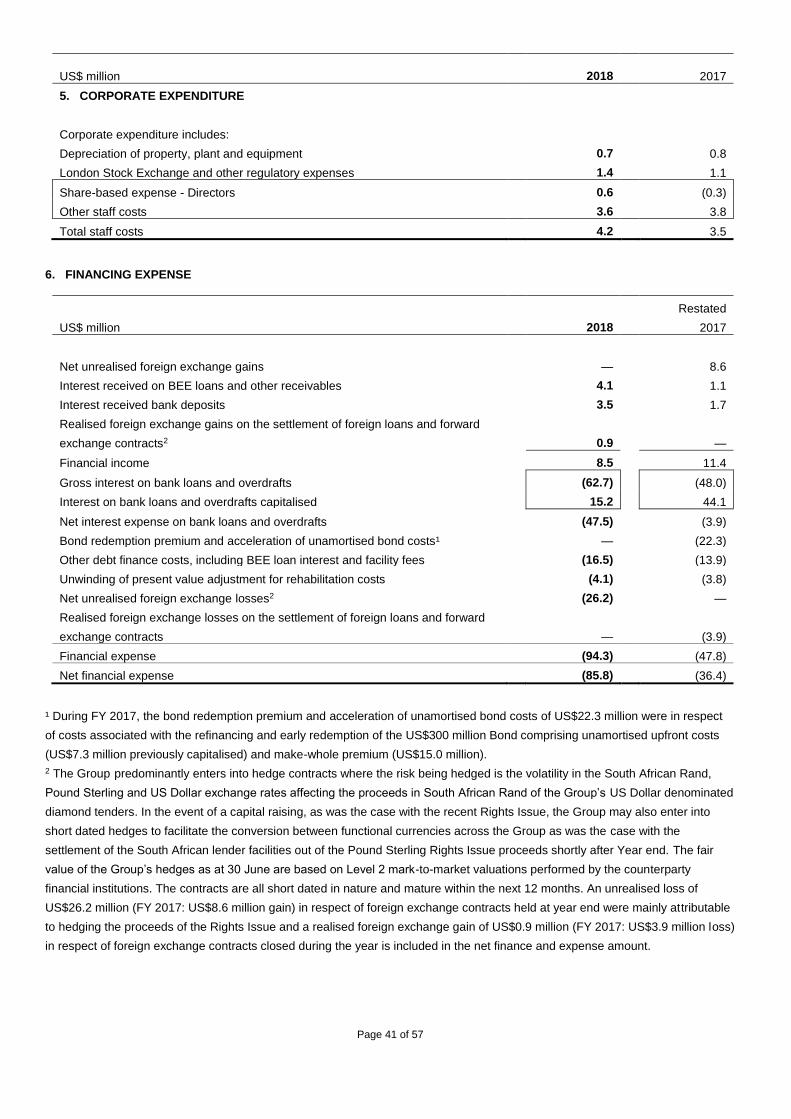
Page 41 of 57
US$ million
2018
2017
5. CORPORATE EXPENDITURE
Corporate expenditure includes:
Depreciation of property, plant and equipment 0.7 0.8
London Stock Exchange and other regulatory expenses 1.4 1.1
Share-based expense - Directors 0.6 (0.3)
Other staff costs 3.6 3.8
Total staff costs 4.2 3.5
6. FINANCING EXPENSE
US$ million
2018
Restated
2017
Net unrealised foreign exchange gains — 8.6
Interest received on BEE loans and other receivables 4.1 1.1
Interest received bank deposits 3.5 1.7
Realised foreign exchange gains on the settlement of foreign loans and forward
exchange contracts2 0.9 —
Financial income 8.5 11.4
Gross interest on bank loans and overdrafts (62.7) (48.0)
Interest on bank loans and overdrafts capitalised 15.2 44.1
Net interest expense on bank loans and overdrafts (47.5) (3.9)
Bond redemption premium and acceleration of unamortised bond costs¹ — (22.3)
Other debt finance costs, including BEE loan interest and facility fees (16.5) (13.9)
Unwinding of present value adjustment for rehabilitation costs (4.1) (3.8)
Net unrealised foreign exchange losses2 (26.2) —
Realised foreign exchange losses on the settlement of foreign loans and forward
exchange contracts — (3.9)
Financial expense (94.3) (47.8)
Net financial expense (85.8) (36.4)
¹ During FY 2017, the bond redemption premium and acceleration of unamortised bond costs of US$22.3 million were in respect
of costs associated with the refinancing and early redemption of the US$300 million Bond comprising unamortised upfront costs
(US$7.3 million previously capitalised) and make-whole premium (US$15.0 million).
2 The Group predominantly enters into hedge contracts where the risk being hedged is the volatility in the South African Rand,
Pound Sterling and US Dollar exchange rates affecting the proceeds in South African Rand of the Group’s US Dollar denominated
diamond tenders. In the event of a capital raising, as was the case with the recent Rights Issue, the Group may also enter into
short dated hedges to facilitate the conversion between functional currencies across the Group as was the case with the
settlement of the South African lender facilities out of the Pound Sterling Rights Issue proceeds shortly after Year end. The fair
value of the Group’s hedges as at 30 June are based on Level 2 mark-to-market valuations performed by the counterparty
financial institutions. The contracts are all short dated in nature and mature within the next 12 months. An unrealised loss of
US$26.2 million (FY 2017: US$8.6 million gain) in respect of foreign exchange contracts held at year end were mainly attributable
to hedging the proceeds of the Rights Issue and a realised foreign exchange gain of US$0.9 million (FY 2017: US$3.9 million loss)
in respect of foreign exchange contracts closed during the year is included in the net finance and expense amount.
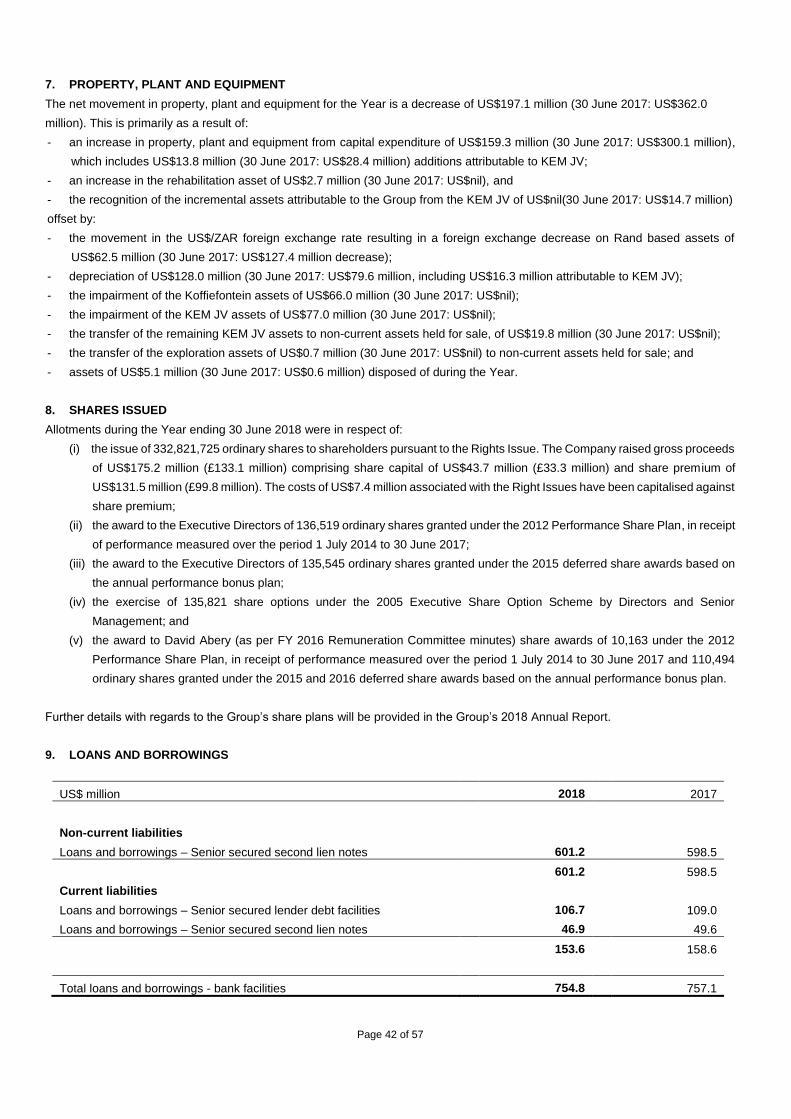
Page 42 of 57
7. PROPERTY, PLANT AND EQUIPMENT
The net movement in property, plant and equipment for the Year is a decrease of US$197.1 million (30 June 2017: US$362.0
million). This is primarily as a result of:
- an increase in property, plant and equipment from capital expenditure of US$159.3 million (30 June 2017: US$300.1 million),
which includes US$13.8 million (30 June 2017: US$28.4 million) additions attributable to KEM JV;
- an increase in the rehabilitation asset of US$2.7 million (30 June 2017: US$nil), and
- the recognition of the incremental assets attributable to the Group from the KEM JV of US$nil(30 June 2017: US$14.7 million)
offset by:
- the movement in the US$/ZAR foreign exchange rate resulting in a foreign exchange decrease on Rand based assets of
US$62.5 million (30 June 2017: US$127.4 million decrease);
- depreciation of US$128.0 million (30 June 2017: US$79.6 million, including US$16.3 million attributable to KEM JV);
- the impairment of the Koffiefontein assets of US$66.0 million (30 June 2017: US$nil);
- the impairment of the KEM JV assets of US$77.0 million (30 June 2017: US$nil);
- the transfer of the remaining KEM JV assets to non-current assets held for sale, of US$19.8 million (30 June 2017: US$nil);
- the transfer of the exploration assets of US$0.7 million (30 June 2017: US$nil) to non-current assets held for sale; and
- assets of US$5.1 million (30 June 2017: US$0.6 million) disposed of during the Year.
8. SHARES ISSUED
Allotments during the Year ending 30 June 2018 were in respect of:
(i) the issue of 332,821,725 ordinary shares to shareholders pursuant to the Rights Issue. The Company raised gross proceeds
of US$175.2 million (£133.1 million) comprising share capital of US$43.7 million (£33.3 million) and share premium of
US$131.5 million (£99.8 million). The costs of US$7.4 million associated with the Right Issues have been capitalised against
share premium;
(ii) the award to the Executive Directors of 136,519 ordinary shares granted under the 2012 Performance Share Plan, in receipt
of performance measured over the period 1 July 2014 to 30 June 2017;
(iii) the award to the Executive Directors of 135,545 ordinary shares granted under the 2015 deferred share awards based on
the annual performance bonus plan;
(iv) the exercise of 135,821 share options under the 2005 Executive Share Option Scheme by Directors and Senior
Management; and
(v) the award to David Abery (as per FY 2016 Remuneration Committee minutes) share awards of 10,163 under the 2012
Performance Share Plan, in receipt of performance measured over the period 1 July 2014 to 30 June 2017 and 110,494
ordinary shares granted under the 2015 and 2016 deferred share awards based on the annual performance bonus plan.
Further details with regards to the Group’s share plans will be provided in the Group’s 2018 Annual Report.
9. LOANS AND BORROWINGS
US$ million 2018 2017
Non-current liabilities
Loans and borrowings – Senior secured second lien notes 601.2 598.5
601.2 598.5
Current liabilities
Loans and borrowings – Senior secured lender debt facilities 106.7 109.0
Loans and borrowings – Senior secured second lien notes 46.9 49.6
153.6 158.6
Total loans and borrowings - bank facilities 754.8 757.1
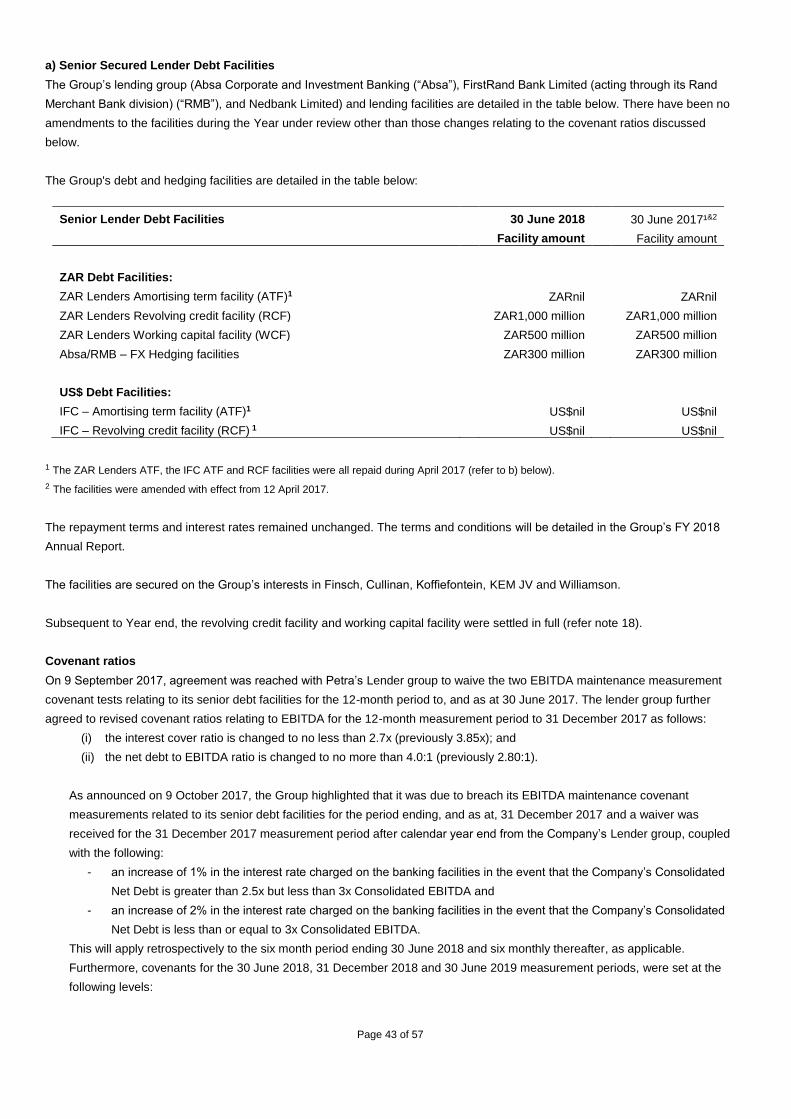
Page 43 of 57
a) Senior Secured Lender Debt Facilities
The Group’s lending group (Absa Corporate and Investment Banking (“Absa”), FirstRand Bank Limited (acting through its Rand
Merchant Bank division) (“RMB”), and Nedbank Limited) and lending facilities are detailed in the table below. There have been no
amendments to the facilities during the Year under review other than those changes relating to the covenant ratios discussed
below.
The Group's debt and hedging facilities are detailed in the table below:
Senior Lender Debt Facilities 30 June 2018 30 June 2017¹&2
Facility amount Facility amount
ZAR Debt Facilities:
ZAR Lenders Amortising term facility (ATF)1 ZARnil ZARnil
ZAR Lenders Revolving credit facility (RCF) ZAR1,000 million ZAR1,000 million
ZAR Lenders Working capital facility (WCF) ZAR500 million ZAR500 million
Absa/RMB – FX Hedging facilities ZAR300 million ZAR300 million
US$ Debt Facilities:
IFC – Amortising term facility (ATF)1 US$nil US$nil
IFC – Revolving credit facility (RCF) 1 US$nil US$nil
1 The ZAR Lenders ATF, the IFC ATF and RCF facilities were all repaid during April 2017 (refer to b) below).
2 The facilities were amended with effect from 12 April 2017.
The repayment terms and interest rates remained unchanged. The terms and conditions will be detailed in the Group’s FY 2018
Annual Report.
The facilities are secured on the Group’s interests in Finsch, Cullinan, Koffiefontein, KEM JV and Williamson.
Subsequent to Year end, the revolving credit facility and working capital facility were settled in full (refer note 18).
Covenant ratios
On 9 September 2017, agreement was reached with Petra’s Lender group to waive the two EBITDA maintenance measurement
covenant tests relating to its senior debt facilities for the 12-month period to, and as at 30 June 2017. The lender group further
agreed to revised covenant ratios relating to EBITDA for the 12-month measurement period to 31 December 2017 as follows:
(i) the interest cover ratio is changed to no less than 2.7x (previously 3.85x); and
(ii) the net debt to EBITDA ratio is changed to no more than 4.0:1 (previously 2.80:1).
As announced on 9 October 2017, the Group highlighted that it was due to breach its EBITDA maintenance covenant
measurements related to its senior debt facilities for the period ending, and as at, 31 December 2017 and a waiver was
received for the 31 December 2017 measurement period after calendar year end from the Company’s Lender group, coupled
with the following:
- an increase of 1% in the interest rate charged on the banking facilities in the event that the Company’s Consolidated
Net Debt is greater than 2.5x but less than 3x Consolidated EBITDA and
- an increase of 2% in the interest rate charged on the banking facilities in the event that the Company’s Consolidated
Net Debt is less than or equal to 3x Consolidated EBITDA.
This will apply retrospectively to the six month period ending 30 June 2018 and six monthly thereafter, as applicable.
Furthermore, covenants for the 30 June 2018, 31 December 2018 and 30 June 2019 measurement periods, were set at the
following levels:
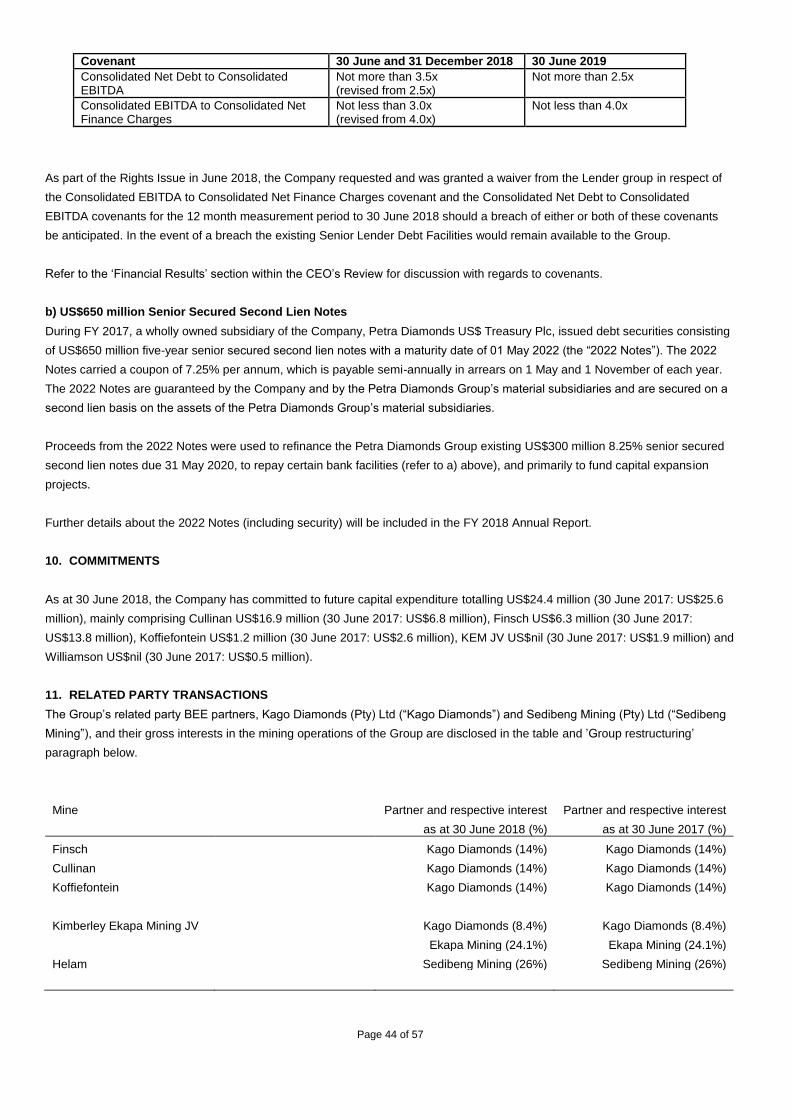
Page 44 of 57
Covenant 30 June and 31 December 2018 30 June 2019
Consolidated Net Debt to Consolidated EBITDA
Not more than 3.5x (revised from 2.5x)
Not more than 2.5x
Consolidated EBITDA to Consolidated Net Finance Charges
Not less than 3.0x (revised from 4.0x)
Not less than 4.0x
As part of the Rights Issue in June 2018, the Company requested and was granted a waiver from the Lender group in respect of
the Consolidated EBITDA to Consolidated Net Finance Charges covenant and the Consolidated Net Debt to Consolidated
EBITDA covenants for the 12 month measurement period to 30 June 2018 should a breach of either or both of these covenants
be anticipated. In the event of a breach the existing Senior Lender Debt Facilities would remain available to the Group.
Refer to the ‘Financial Results’ section within the CEO’s Review for discussion with regards to covenants.
b) US$650 million Senior Secured Second Lien Notes
During FY 2017, a wholly owned subsidiary of the Company, Petra Diamonds US$ Treasury Plc, issued debt securities consisting
of US$650 million five-year senior secured second lien notes with a maturity date of 01 May 2022 (the “2022 Notes”). The 2022
Notes carried a coupon of 7.25% per annum, which is payable semi-annually in arrears on 1 May and 1 November of each year.
The 2022 Notes are guaranteed by the Company and by the Petra Diamonds Group’s material subsidiaries and are secured on a
second lien basis on the assets of the Petra Diamonds Group’s material subsidiaries.
Proceeds from the 2022 Notes were used to refinance the Petra Diamonds Group existing US$300 million 8.25% senior secured
second lien notes due 31 May 2020, to repay certain bank facilities (refer to a) above), and primarily to fund capital expansion
projects.
Further details about the 2022 Notes (including security) will be included in the FY 2018 Annual Report.
10. COMMITMENTS
As at 30 June 2018, the Company has committed to future capital expenditure totalling US$24.4 million (30 June 2017: US$25.6
million), mainly comprising Cullinan US$16.9 million (30 June 2017: US$6.8 million), Finsch US$6.3 million (30 June 2017:
US$13.8 million), Koffiefontein US$1.2 million (30 June 2017: US$2.6 million), KEM JV US$nil (30 June 2017: US$1.9 million) and
Williamson US$nil (30 June 2017: US$0.5 million).
11. RELATED PARTY TRANSACTIONS
The Group’s related party BEE partners, Kago Diamonds (Pty) Ltd (“Kago Diamonds”) and Sedibeng Mining (Pty) Ltd (“Sedibeng
Mining”), and their gross interests in the mining operations of the Group are disclosed in the table and ’Group restructuring’
paragraph below.
Mine Partner and respective interest
as at 30 June 2018 (%)
Partner and respective interest
as at 30 June 2017 (%)
Finsch Kago Diamonds (14%) Kago Diamonds (14%)
Cullinan Kago Diamonds (14%) Kago Diamonds (14%)
Koffiefontein Kago Diamonds (14%) Kago Diamonds (14%)
Kimberley Ekapa Mining JV Kago Diamonds (8.4%)
Ekapa Mining (24.1%)
Kago Diamonds (8.4%)
Ekapa Mining (24.1%)
Helam Sedibeng Mining (26%) Sedibeng Mining (26%)
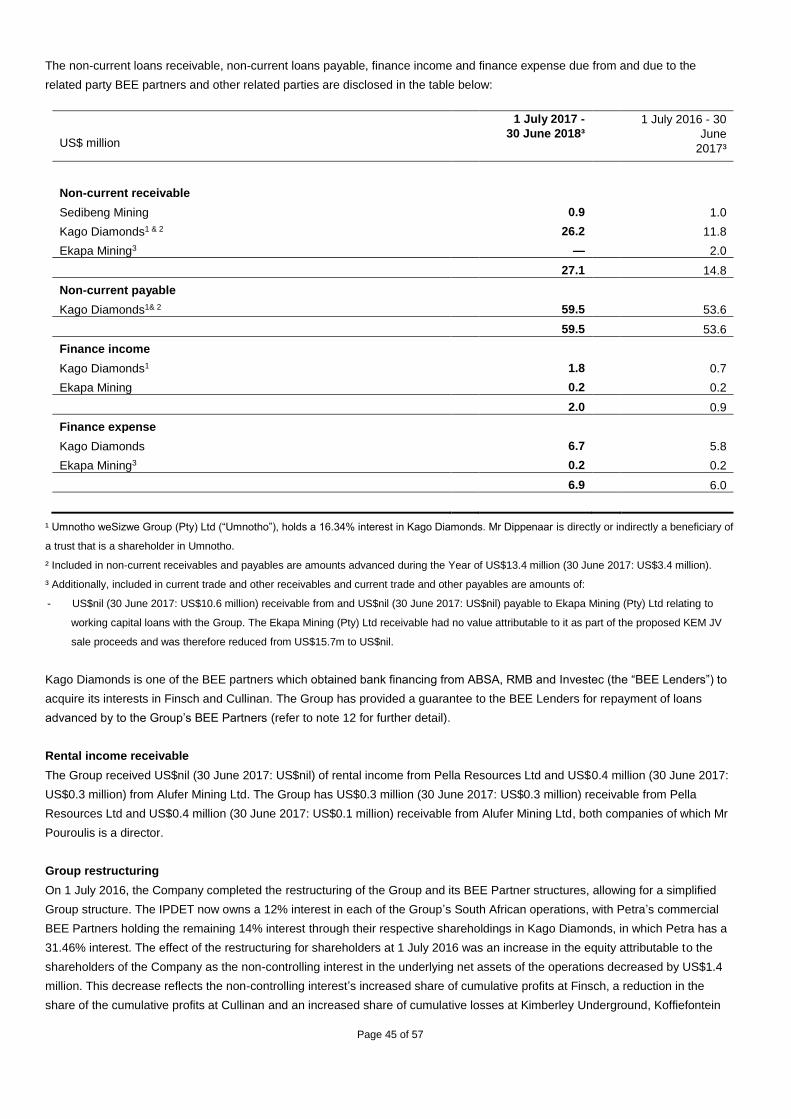
Page 45 of 57
The non-current loans receivable, non-current loans payable, finance income and finance expense due from and due to the
related party BEE partners and other related parties are disclosed in the table below:
US$ million
1 July 2017 -
30 June 2018³
1 July 2016 - 30
June
2017³
Non-current receivable
Sedibeng Mining 0.9 1.0
Kago Diamonds1 & 2 26.2 11.8
Ekapa Mining3 — 2.0
27.1 14.8
Non-current payable
Kago Diamonds1& 2 59.5 53.6
59.5 53.6
Finance income
Kago Diamonds1 1.8 0.7
Ekapa Mining 0.2 0.2
2.0 0.9
Finance expense
Kago Diamonds 6.7 5.8
Ekapa Mining3 0.2 0.2
6.9 6.0
¹ Umnotho weSizwe Group (Pty) Ltd (“Umnotho”), holds a 16.34% interest in Kago Diamonds. Mr Dippenaar is directly or indirectly a beneficiary of
a trust that is a shareholder in Umnotho.
² Included in non-current receivables and payables are amounts advanced during the Year of US$13.4 million (30 June 2017: US$3.4 million).
³ Additionally, included in current trade and other receivables and current trade and other payables are amounts of:
- US$nil (30 June 2017: US$10.6 million) receivable from and US$nil (30 June 2017: US$nil) payable to Ekapa Mining (Pty) Ltd relating to
working capital loans with the Group. The Ekapa Mining (Pty) Ltd receivable had no value attributable to it as part of the proposed KEM JV
sale proceeds and was therefore reduced from US$15.7m to US$nil.
Kago Diamonds is one of the BEE partners which obtained bank financing from ABSA, RMB and Investec (the “BEE Lenders”) to
acquire its interests in Finsch and Cullinan. The Group has provided a guarantee to the BEE Lenders for repayment of loans
advanced by to the Group’s BEE Partners (refer to note 12 for further detail).
Rental income receivable
The Group received US$nil (30 June 2017: US$nil) of rental income from Pella Resources Ltd and US$0.4 million (30 June 2017:
US$0.3 million) from Alufer Mining Ltd. The Group has US$0.3 million (30 June 2017: US$0.3 million) receivable from Pella
Resources Ltd and US$0.4 million (30 June 2017: US$0.1 million) receivable from Alufer Mining Ltd, both companies of which Mr
Pouroulis is a director.
Group restructuring
On 1 July 2016, the Company completed the restructuring of the Group and its BEE Partner structures, allowing for a simplified
Group structure. The IPDET now owns a 12% interest in each of the Group’s South African operations, with Petra’s commercial
BEE Partners holding the remaining 14% interest through their respective shareholdings in Kago Diamonds, in which Petra has a
31.46% interest. The effect of the restructuring for shareholders at 1 July 2016 was an increase in the equity attributable to the
shareholders of the Company as the non-controlling interest in the underlying net assets of the operations decreased by US$1.4
million. This decrease reflects the non-controlling interest’s increased share of cumulative profits at Finsch, a reduction in the
share of the cumulative profits at Cullinan and an increased share of cumulative losses at Kimberley Underground, Koffiefontein
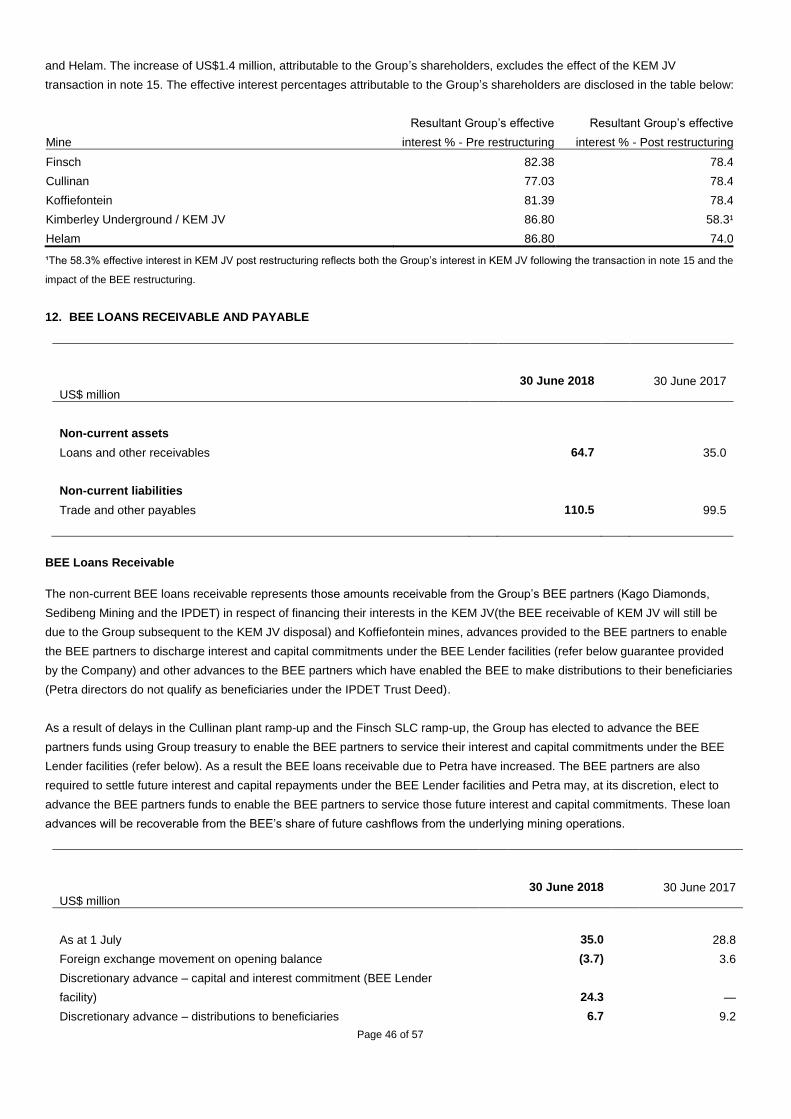
Page 46 of 57
and Helam. The increase of US$1.4 million, attributable to the Group’s shareholders, excludes the effect of the KEM JV
transaction in note 15. The effective interest percentages attributable to the Group’s shareholders are disclosed in the table below:
Mine
Resultant Group’s effective
interest % - Pre restructuring
Resultant Group’s effective
interest % - Post restructuring
Finsch 82.38 78.4
Cullinan 77.03 78.4
Koffiefontein 81.39 78.4
Kimberley Underground / KEM JV 86.80 58.3¹
Helam 86.80 74.0
¹The 58.3% effective interest in KEM JV post restructuring reflects both the Group’s interest in KEM JV following the transaction in note 15 and the
impact of the BEE restructuring.
12. BEE LOANS RECEIVABLE AND PAYABLE
US$ million
30 June 2018
30 June 2017
Non-current assets
Loans and other receivables 64.7 35.0
Non-current liabilities
Trade and other payables 110.5 99.5
BEE Loans Receivable
The non-current BEE loans receivable represents those amounts receivable from the Group’s BEE partners (Kago Diamonds,
Sedibeng Mining and the IPDET) in respect of financing their interests in the KEM JV(the BEE receivable of KEM JV will still be
due to the Group subsequent to the KEM JV disposal) and Koffiefontein mines, advances provided to the BEE partners to enable
the BEE partners to discharge interest and capital commitments under the BEE Lender facilities (refer below guarantee provided
by the Company) and other advances to the BEE partners which have enabled the BEE to make distributions to their beneficiaries
(Petra directors do not qualify as beneficiaries under the IPDET Trust Deed).
As a result of delays in the Cullinan plant ramp-up and the Finsch SLC ramp-up, the Group has elected to advance the BEE
partners funds using Group treasury to enable the BEE partners to service their interest and capital commitments under the BEE
Lender facilities (refer below). As a result the BEE loans receivable due to Petra have increased. The BEE partners are also
required to settle future interest and capital repayments under the BEE Lender facilities and Petra may, at its discretion, elect to
advance the BEE partners funds to enable the BEE partners to service those future interest and capital commitments. These loan
advances will be recoverable from the BEE’s share of future cashflows from the underlying mining operations.
US$ million
30 June 2018
30 June 2017
As at 1 July 35.0 28.8
Foreign exchange movement on opening balance (3.7) 3.6
Discretionary advance – capital and interest commitment (BEE Lender
facility)
24.3 —
Discretionary advance – distributions to beneficiaries 6.7 9.2
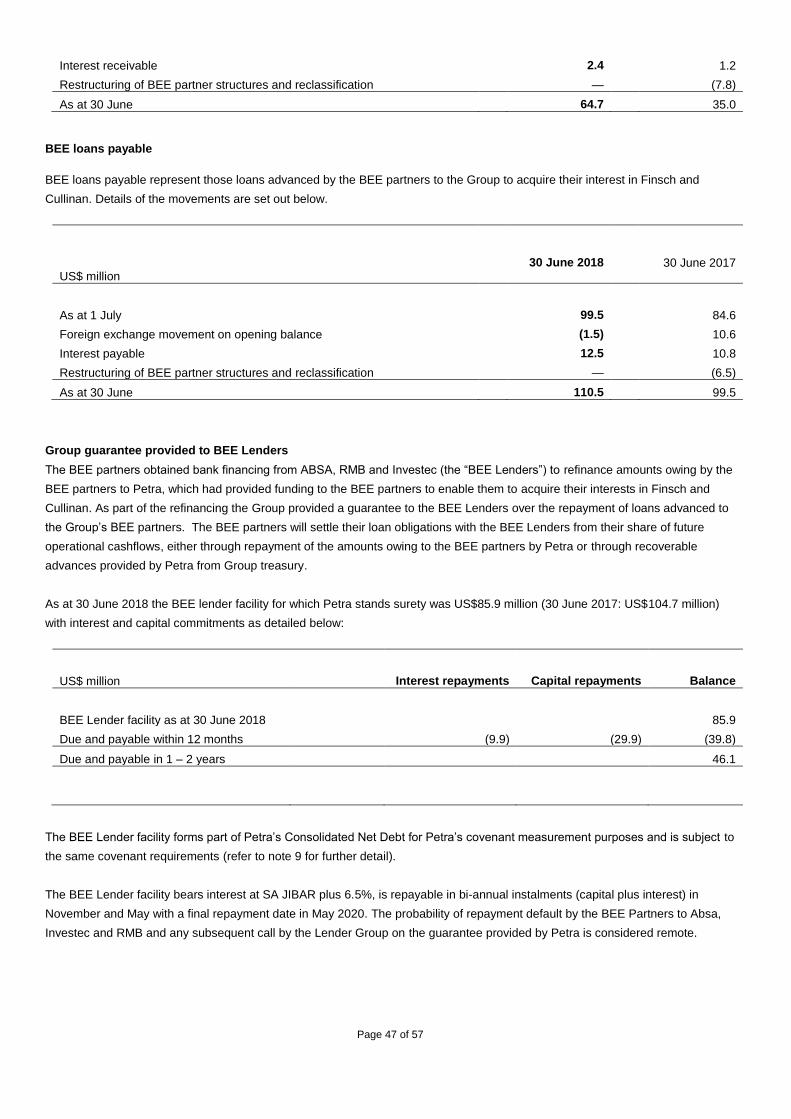
Page 47 of 57
Interest receivable 2.4 1.2
Restructuring of BEE partner structures and reclassification — (7.8)
As at 30 June 64.7 35.0
BEE loans payable
BEE loans payable represent those loans advanced by the BEE partners to the Group to acquire their interest in Finsch and
Cullinan. Details of the movements are set out below.
US$ million
30 June 2018
30 June 2017
As at 1 July 99.5 84.6
Foreign exchange movement on opening balance (1.5) 10.6
Interest payable 12.5 10.8
Restructuring of BEE partner structures and reclassification — (6.5)
As at 30 June 110.5 99.5
Group guarantee provided to BEE Lenders
The BEE partners obtained bank financing from ABSA, RMB and Investec (the “BEE Lenders”) to refinance amounts owing by the
BEE partners to Petra, which had provided funding to the BEE partners to enable them to acquire their interests in Finsch and
Cullinan. As part of the refinancing the Group provided a guarantee to the BEE Lenders over the repayment of loans advanced to
the Group’s BEE partners. The BEE partners will settle their loan obligations with the BEE Lenders from their share of future
operational cashflows, either through repayment of the amounts owing to the BEE partners by Petra or through recoverable
advances provided by Petra from Group treasury.
As at 30 June 2018 the BEE lender facility for which Petra stands surety was US$85.9 million (30 June 2017: US$104.7 million)
with interest and capital commitments as detailed below:
US$ million
Interest repayments Capital repayments Balance
BEE Lender facility as at 30 June 2018 85.9
Due and payable within 12 months (9.9) (29.9) (39.8)
Due and payable in 1 – 2 years 46.1
The BEE Lender facility forms part of Petra’s Consolidated Net Debt for Petra’s covenant measurement purposes and is subject to
the same covenant requirements (refer to note 9 for further detail).
The BEE Lender facility bears interest at SA JIBAR plus 6.5%, is repayable in bi-annual instalments (capital plus interest) in
November and May with a final repayment date in May 2020. The probability of repayment default by the BEE Partners to Absa,
Investec and RMB and any subsequent call by the Lender Group on the guarantee provided by Petra is considered remote.
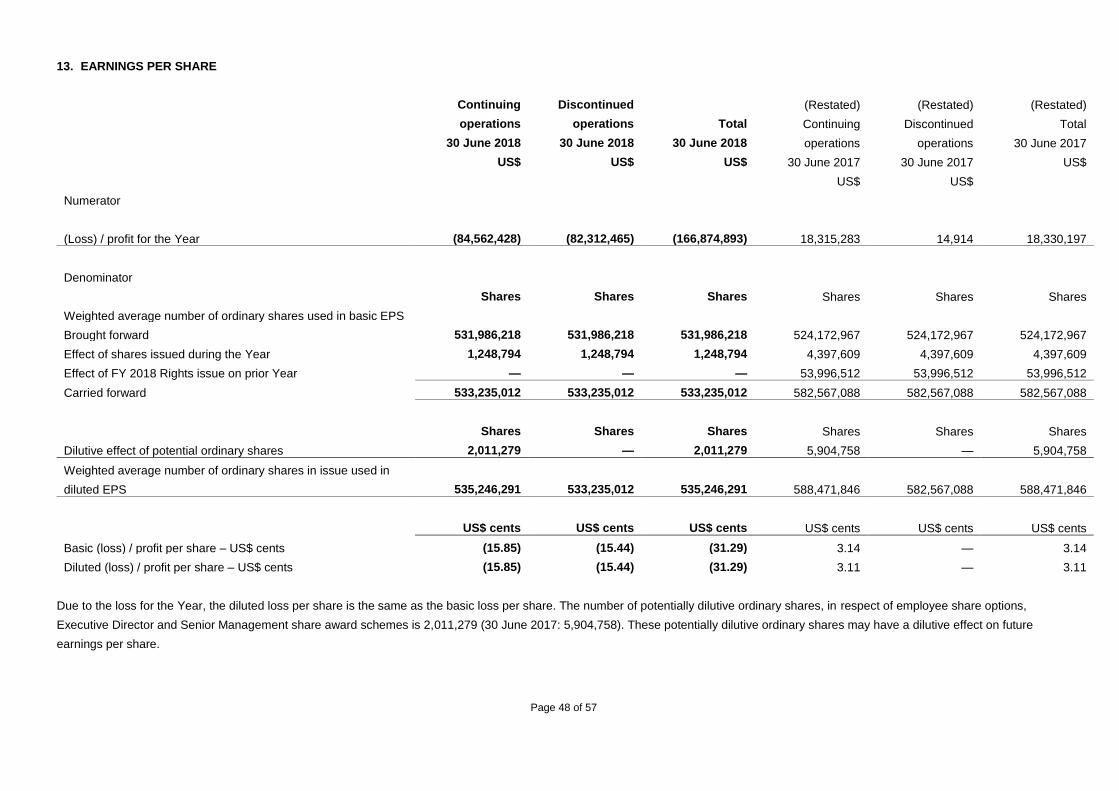
Page 48 of 57
13. EARNINGS PER SHARE
Continuing
operations
30 June 2018
US$
Discontinued
operations
30 June 2018
US$
Total
30 June 2018
US$
(Restated)
Continuing
operations
30 June 2017
US$
(Restated)
Discontinued
operations
30 June 2017
US$
(Restated)
Total
30 June 2017
US$
Numerator
(Loss) / profit for the Year (84,562,428) (82,312,465) (166,874,893) 18,315,283 14,914 18,330,197
Denominator
Shares Shares Shares Shares Shares Shares
Weighted average number of ordinary shares used in basic EPS
Brought forward 531,986,218 531,986,218 531,986,218 524,172,967 524,172,967 524,172,967
Effect of shares issued during the Year 1,248,794 1,248,794 1,248,794 4,397,609 4,397,609 4,397,609
Effect of FY 2018 Rights issue on prior Year — — — 53,996,512 53,996,512 53,996,512
Carried forward 533,235,012 533,235,012 533,235,012 582,567,088 582,567,088 582,567,088
Shares Shares Shares Shares Shares Shares
Dilutive effect of potential ordinary shares 2,011,279 — 2,011,279 5,904,758 — 5,904,758
Weighted average number of ordinary shares in issue used in
diluted EPS 535,246,291
533,235,012
535,246,291
588,471,846 582,567,088 588,471,846
US$ cents US$ cents US$ cents US$ cents US$ cents US$ cents
Basic (loss) / profit per share – US$ cents (15.85) (15.44) (31.29) 3.14 — 3.14
Diluted (loss) / profit per share – US$ cents (15.85) (15.44) (31.29) 3.11 — 3.11
Due to the loss for the Year, the diluted loss per share is the same as the basic loss per share. The number of potentially dilutive ordinary shares, in respect of employee share options,
Executive Director and Senior Management share award schemes is 2,011,279 (30 June 2017: 5,904,758). These potentially dilutive ordinary shares may have a dilutive effect on future
earnings per share.
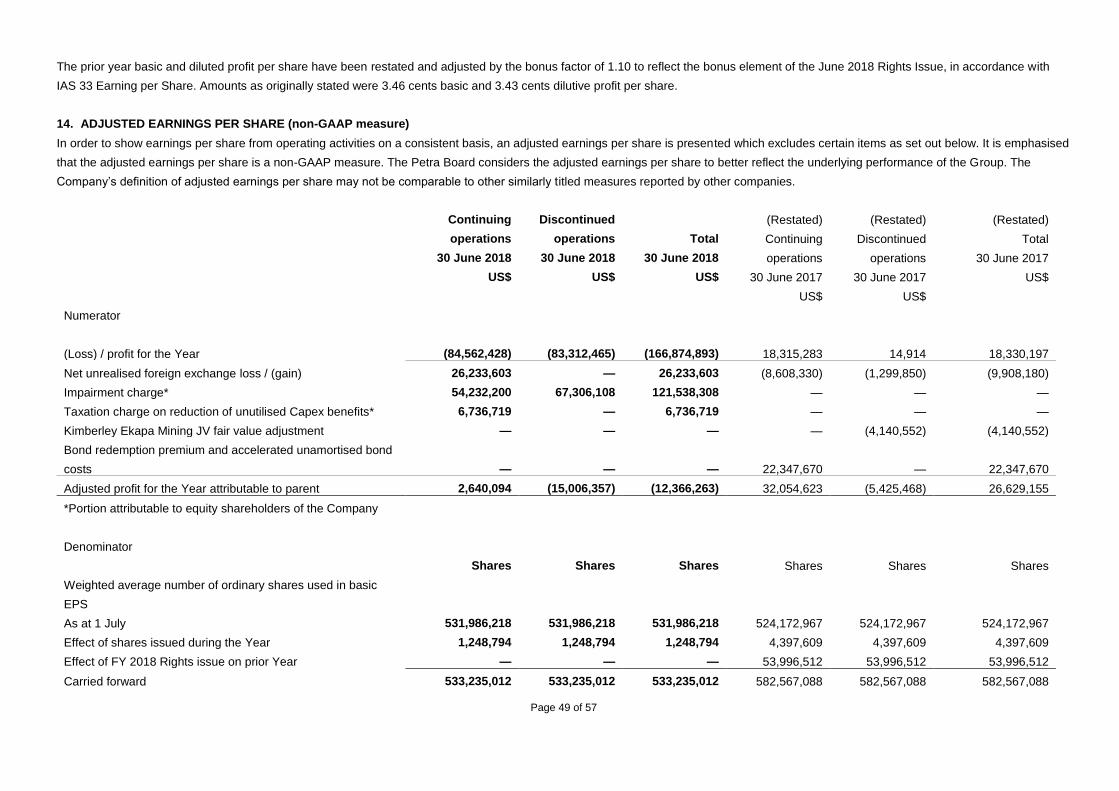
Page 49 of 57
The prior year basic and diluted profit per share have been restated and adjusted by the bonus factor of 1.10 to reflect the bonus element of the June 2018 Rights Issue, in accordance with
IAS 33 Earning per Share. Amounts as originally stated were 3.46 cents basic and 3.43 cents dilutive profit per share.
14. ADJUSTED EARNINGS PER SHARE (non-GAAP measure)
In order to show earnings per share from operating activities on a consistent basis, an adjusted earnings per share is presented which excludes certain items as set out below. It is emphasised
that the adjusted earnings per share is a non-GAAP measure. The Petra Board considers the adjusted earnings per share to better reflect the underlying performance of the Group. The
Company’s definition of adjusted earnings per share may not be comparable to other similarly titled measures reported by other companies.
Continuing
operations
30 June 2018
US$
Discontinued
operations
30 June 2018
US$
Total
30 June 2018
US$
(Restated)
Continuing
operations
30 June 2017
US$
(Restated)
Discontinued
operations
30 June 2017
US$
(Restated)
Total
30 June 2017
US$
Numerator
(Loss) / profit for the Year (84,562,428) (83,312,465) (166,874,893) 18,315,283 14,914 18,330,197
Net unrealised foreign exchange loss / (gain) 26,233,603 — 26,233,603 (8,608,330) (1,299,850) (9,908,180)
Impairment charge* 54,232,200 67,306,108 121,538,308 — — —
Taxation charge on reduction of unutilised Capex benefits* 6,736,719 — 6,736,719 — — —
Kimberley Ekapa Mining JV fair value adjustment — — — — (4,140,552) (4,140,552)
Bond redemption premium and accelerated unamortised bond
costs
—
—
— 22,347,670 — 22,347,670
Adjusted profit for the Year attributable to parent 2,640,094 (15,006,357) (12,366,263) 32,054,623 (5,425,468) 26,629,155
*Portion attributable to equity shareholders of the Company
Denominator
Shares Shares Shares Shares Shares Shares
Weighted average number of ordinary shares used in basic
EPS
As at 1 July 531,986,218 531,986,218 531,986,218 524,172,967 524,172,967 524,172,967
Effect of shares issued during the Year 1,248,794 1,248,794 1,248,794 4,397,609 4,397,609 4,397,609
Effect of FY 2018 Rights issue on prior Year — — — 53,996,512 53,996,512 53,996,512
Carried forward 533,235,012 533,235,012 533,235,012 582,567,088 582,567,088 582,567,088
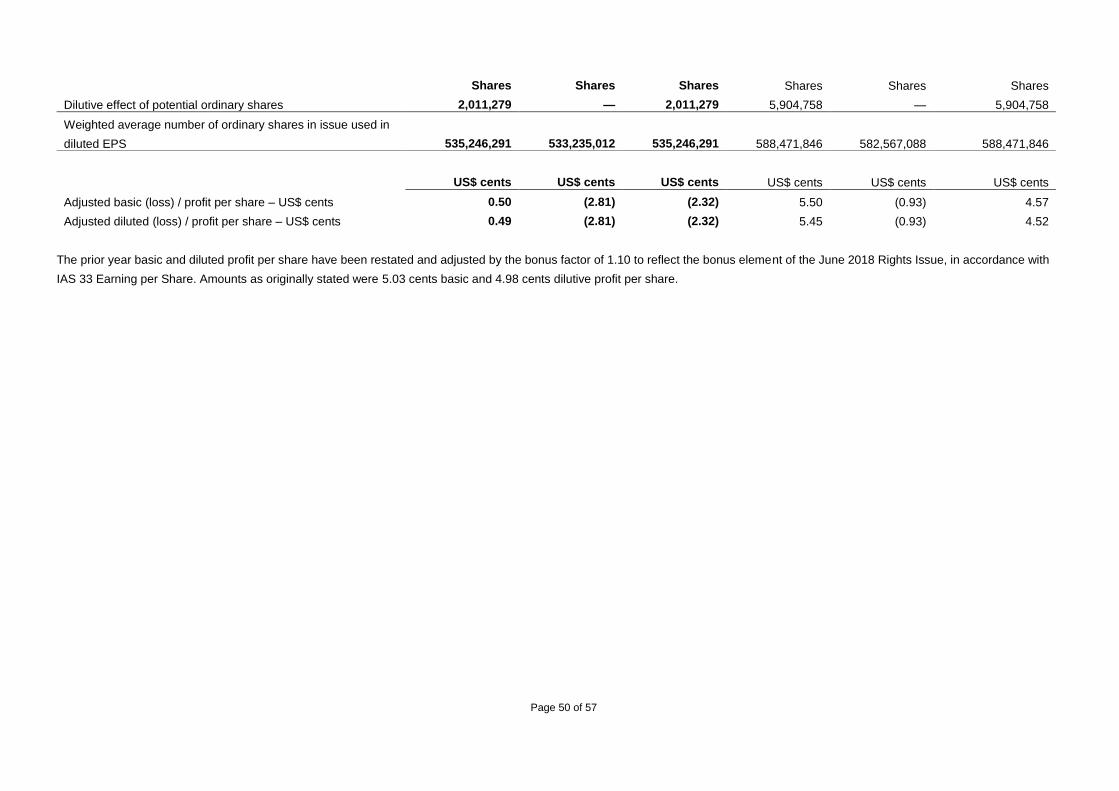
Page 50 of 57
Shares Shares Shares Shares Shares Shares
Dilutive effect of potential ordinary shares 2,011,279 — 2,011,279 5,904,758 — 5,904,758
Weighted average number of ordinary shares in issue used in
diluted EPS 535,246,291
533,235,012
535,246,291
588,471,846 582,567,088 588,471,846
US$ cents US$ cents US$ cents US$ cents US$ cents US$ cents
Adjusted basic (loss) / profit per share – US$ cents 0.50 (2.81) (2.32) 5.50 (0.93) 4.57
Adjusted diluted (loss) / profit per share – US$ cents 0.49 (2.81) (2.32) 5.45 (0.93) 4.52
The prior year basic and diluted profit per share have been restated and adjusted by the bonus factor of 1.10 to reflect the bonus element of the June 2018 Rights Issue, in accordance with
IAS 33 Earning per Share. Amounts as originally stated were 5.03 cents basic and 4.98 cents dilutive profit per share.
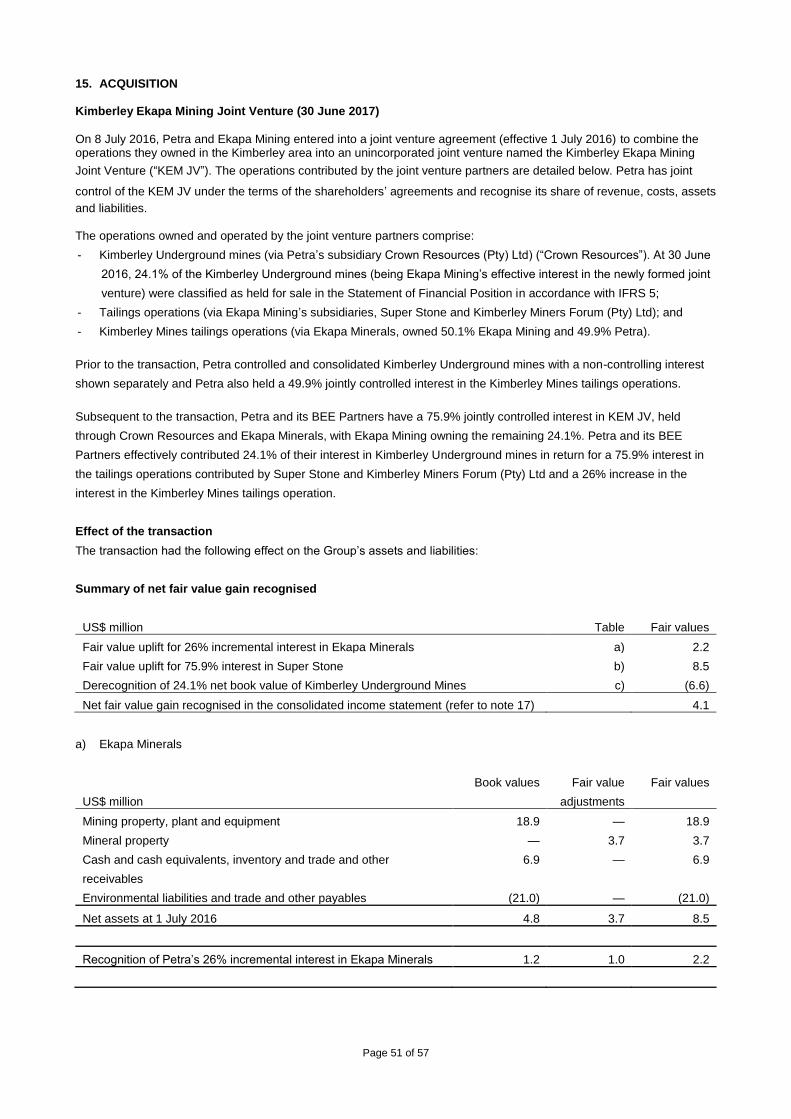
Page 51 of 57
15. ACQUISITION Kimberley Ekapa Mining Joint Venture (30 June 2017)
On 8 July 2016, Petra and Ekapa Mining entered into a joint venture agreement (effective 1 July 2016) to combine the operations they owned in the Kimberley area into an unincorporated joint venture named the Kimberley Ekapa Mining
Joint Venture (“KEM JV”). The operations contributed by the joint venture partners are detailed below. Petra has joint
control of the KEM JV under the terms of the shareholders’ agreements and recognise its share of revenue, costs, assets
and liabilities. The operations owned and operated by the joint venture partners comprise:
- Kimberley Underground mines (via Petra’s subsidiary Crown Resources (Pty) Ltd) (“Crown Resources”). At 30 June
2016, 24.1% of the Kimberley Underground mines (being Ekapa Mining’s effective interest in the newly formed joint
venture) were classified as held for sale in the Statement of Financial Position in accordance with IFRS 5;
- Tailings operations (via Ekapa Mining’s subsidiaries, Super Stone and Kimberley Miners Forum (Pty) Ltd); and
- Kimberley Mines tailings operations (via Ekapa Minerals, owned 50.1% Ekapa Mining and 49.9% Petra).
Prior to the transaction, Petra controlled and consolidated Kimberley Underground mines with a non-controlling interest
shown separately and Petra also held a 49.9% jointly controlled interest in the Kimberley Mines tailings operations.
Subsequent to the transaction, Petra and its BEE Partners have a 75.9% jointly controlled interest in KEM JV, held
through Crown Resources and Ekapa Minerals, with Ekapa Mining owning the remaining 24.1%. Petra and its BEE
Partners effectively contributed 24.1% of their interest in Kimberley Underground mines in return for a 75.9% interest in
the tailings operations contributed by Super Stone and Kimberley Miners Forum (Pty) Ltd and a 26% increase in the
interest in the Kimberley Mines tailings operation.
Effect of the transaction
The transaction had the following effect on the Group’s assets and liabilities:
Summary of net fair value gain recognised
US$ million Table Fair values
Fair value uplift for 26% incremental interest in Ekapa Minerals a) 2.2
Fair value uplift for 75.9% interest in Super Stone b) 8.5
Derecognition of 24.1% net book value of Kimberley Underground Mines c) (6.6)
Net fair value gain recognised in the consolidated income statement (refer to note 17) 4.1
a) Ekapa Minerals
US$ million
Book values Fair value
adjustments
Fair values
Mining property, plant and equipment 18.9 — 18.9
Mineral property — 3.7 3.7
Cash and cash equivalents, inventory and trade and other
receivables
6.9 — 6.9
Environmental liabilities and trade and other payables (21.0) — (21.0)
Net assets at 1 July 2016 4.8 3.7 8.5
Recognition of Petra’s 26% incremental interest in Ekapa Minerals 1.2 1.0 2.2
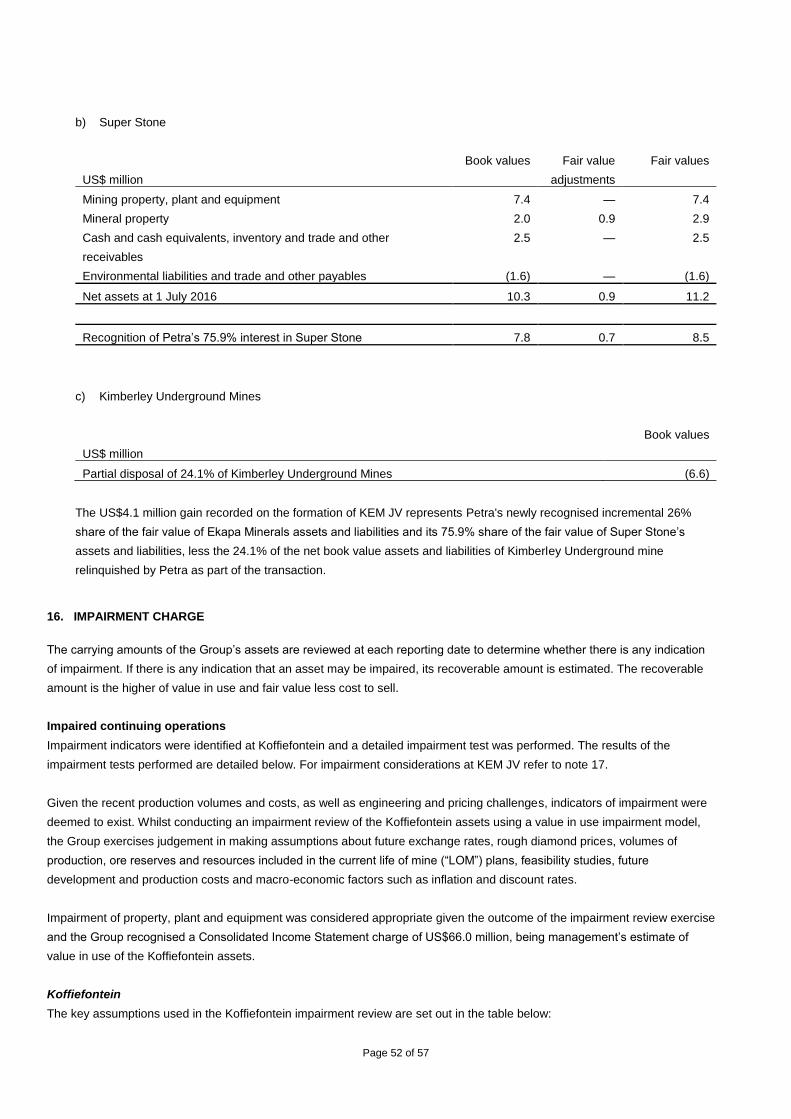
Page 52 of 57
b) Super Stone
US$ million
Book values Fair value
adjustments
Fair values
Mining property, plant and equipment 7.4 — 7.4
Mineral property 2.0 0.9 2.9
Cash and cash equivalents, inventory and trade and other
receivables
2.5 — 2.5
Environmental liabilities and trade and other payables (1.6) — (1.6)
Net assets at 1 July 2016 10.3 0.9 11.2
Recognition of Petra’s 75.9% interest in Super Stone 7.8 0.7 8.5
c) Kimberley Underground Mines
US$ million
Book values
Partial disposal of 24.1% of Kimberley Underground Mines (6.6)
The US$4.1 million gain recorded on the formation of KEM JV represents Petra's newly recognised incremental 26%
share of the fair value of Ekapa Minerals assets and liabilities and its 75.9% share of the fair value of Super Stone’s
assets and liabilities, less the 24.1% of the net book value assets and liabilities of Kimberley Underground mine
relinquished by Petra as part of the transaction.
16. IMPAIRMENT CHARGE
The carrying amounts of the Group’s assets are reviewed at each reporting date to determine whether there is any indication
of impairment. If there is any indication that an asset may be impaired, its recoverable amount is estimated. The recoverable
amount is the higher of value in use and fair value less cost to sell.
Impaired continuing operations
Impairment indicators were identified at Koffiefontein and a detailed impairment test was performed. The results of the
impairment tests performed are detailed below. For impairment considerations at KEM JV refer to note 17.
Given the recent production volumes and costs, as well as engineering and pricing challenges, indicators of impairment were
deemed to exist. Whilst conducting an impairment review of the Koffiefontein assets using a value in use impairment model,
the Group exercises judgement in making assumptions about future exchange rates, rough diamond prices, volumes of
production, ore reserves and resources included in the current life of mine (“LOM”) plans, feasibility studies, future
development and production costs and macro-economic factors such as inflation and discount rates.
Impairment of property, plant and equipment was considered appropriate given the outcome of the impairment review exercise
and the Group recognised a Consolidated Income Statement charge of US$66.0 million, being management’s estimate of
value in use of the Koffiefontein assets.
Koffiefontein
The key assumptions used in the Koffiefontein impairment review are set out in the table below:
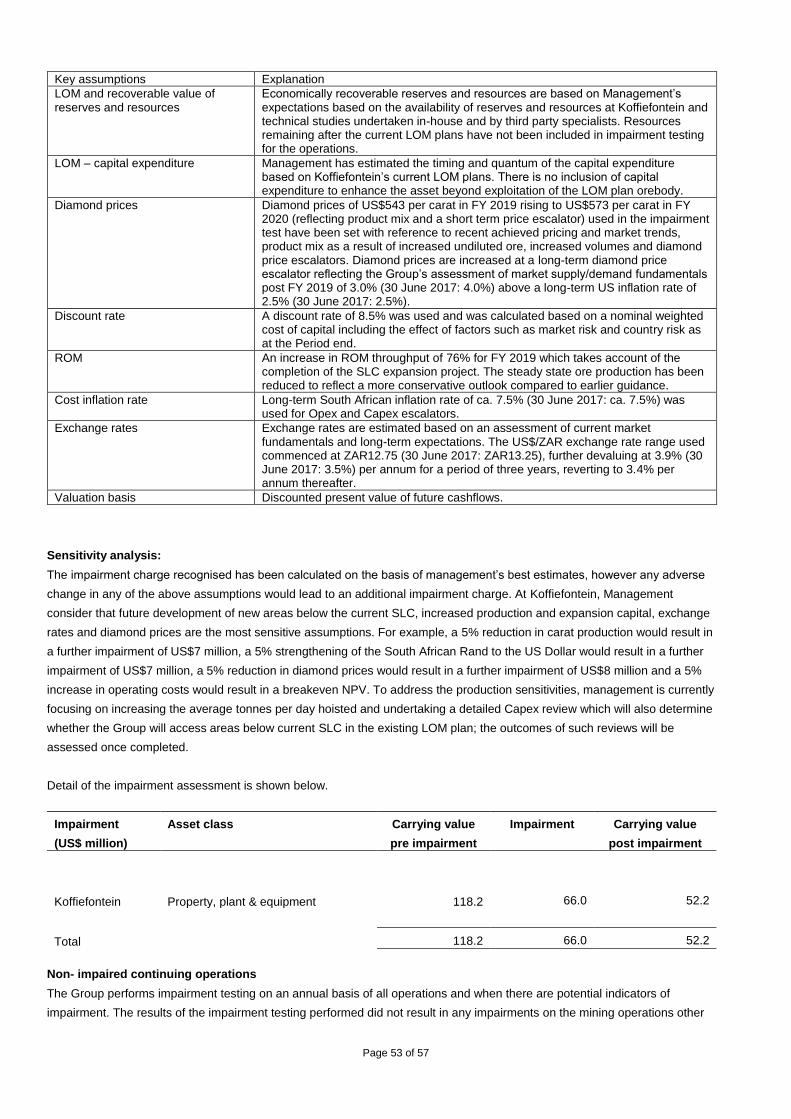
Page 53 of 57
Key assumptions Explanation
LOM and recoverable value of reserves and resources
Economically recoverable reserves and resources are based on Management’s expectations based on the availability of reserves and resources at Koffiefontein and technical studies undertaken in-house and by third party specialists. Resources remaining after the current LOM plans have not been included in impairment testing for the operations.
LOM – capital expenditure Management has estimated the timing and quantum of the capital expenditure based on Koffiefontein’s current LOM plans. There is no inclusion of capital expenditure to enhance the asset beyond exploitation of the LOM plan orebody.
Diamond prices Diamond prices of US$543 per carat in FY 2019 rising to US$573 per carat in FY 2020 (reflecting product mix and a short term price escalator) used in the impairment test have been set with reference to recent achieved pricing and market trends, product mix as a result of increased undiluted ore, increased volumes and diamond price escalators. Diamond prices are increased at a long-term diamond price escalator reflecting the Group’s assessment of market supply/demand fundamentals post FY 2019 of 3.0% (30 June 2017: 4.0%) above a long-term US inflation rate of 2.5% (30 June 2017: 2.5%).
Discount rate A discount rate of 8.5% was used and was calculated based on a nominal weighted cost of capital including the effect of factors such as market risk and country risk as at the Period end.
ROM An increase in ROM throughput of 76% for FY 2019 which takes account of the completion of the SLC expansion project. The steady state ore production has been reduced to reflect a more conservative outlook compared to earlier guidance.
Cost inflation rate Long-term South African inflation rate of ca. 7.5% (30 June 2017: ca. 7.5%) was used for Opex and Capex escalators.
Exchange rates Exchange rates are estimated based on an assessment of current market fundamentals and long-term expectations. The US$/ZAR exchange rate range used commenced at ZAR12.75 (30 June 2017: ZAR13.25), further devaluing at 3.9% (30 June 2017: 3.5%) per annum for a period of three years, reverting to 3.4% per annum thereafter.
Valuation basis Discounted present value of future cashflows.
Sensitivity analysis:
The impairment charge recognised has been calculated on the basis of management’s best estimates, however any adverse
change in any of the above assumptions would lead to an additional impairment charge. At Koffiefontein, Management
consider that future development of new areas below the current SLC, increased production and expansion capital, exchange
rates and diamond prices are the most sensitive assumptions. For example, a 5% reduction in carat production would result in
a further impairment of US$7 million, a 5% strengthening of the South African Rand to the US Dollar would result in a further
impairment of US$7 million, a 5% reduction in diamond prices would result in a further impairment of US$8 million and a 5%
increase in operating costs would result in a breakeven NPV. To address the production sensitivities, management is currently
focusing on increasing the average tonnes per day hoisted and undertaking a detailed Capex review which will also determine
whether the Group will access areas below current SLC in the existing LOM plan; the outcomes of such reviews will be
assessed once completed.
Detail of the impairment assessment is shown below.
Impairment
(US$ million)
Asset class Carrying value
pre impairment
Impairment Carrying value
post impairment
Koffiefontein Property, plant & equipment
118.2 66.0 52.2
Total 118.2 66.0 52.2
Non- impaired continuing operations
The Group performs impairment testing on an annual basis of all operations and when there are potential indicators of
impairment. The results of the impairment testing performed did not result in any impairments on the mining operations other
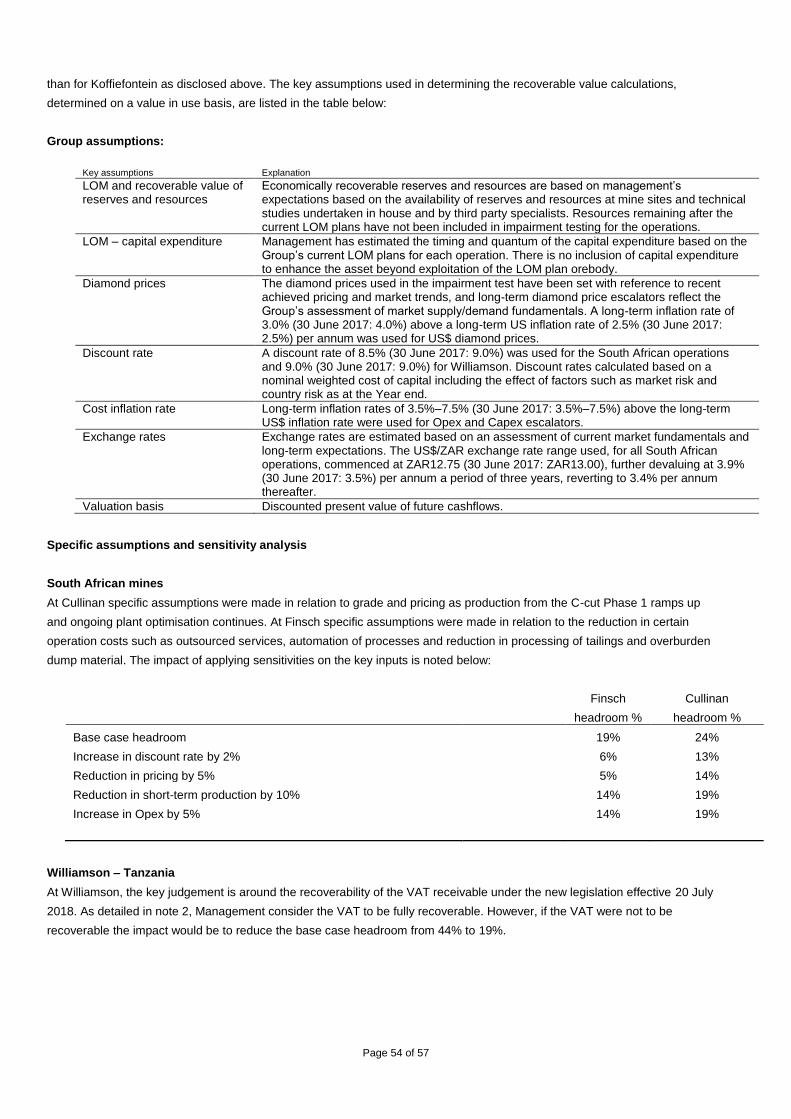
Page 54 of 57
than for Koffiefontein as disclosed above. The key assumptions used in determining the recoverable value calculations,
determined on a value in use basis, are listed in the table below:
Group assumptions:
Key assumptions Explanation
LOM and recoverable value of reserves and resources
Economically recoverable reserves and resources are based on management’s expectations based on the availability of reserves and resources at mine sites and technical studies undertaken in house and by third party specialists. Resources remaining after the current LOM plans have not been included in impairment testing for the operations.
LOM – capital expenditure Management has estimated the timing and quantum of the capital expenditure based on the Group’s current LOM plans for each operation. There is no inclusion of capital expenditure to enhance the asset beyond exploitation of the LOM plan orebody.
Diamond prices The diamond prices used in the impairment test have been set with reference to recent achieved pricing and market trends, and long-term diamond price escalators reflect the Group’s assessment of market supply/demand fundamentals. A long-term inflation rate of 3.0% (30 June 2017: 4.0%) above a long-term US inflation rate of 2.5% (30 June 2017: 2.5%) per annum was used for US$ diamond prices.
Discount rate A discount rate of 8.5% (30 June 2017: 9.0%) was used for the South African operations and 9.0% (30 June 2017: 9.0%) for Williamson. Discount rates calculated based on a nominal weighted cost of capital including the effect of factors such as market risk and country risk as at the Year end.
Cost inflation rate Long-term inflation rates of 3.5%–7.5% (30 June 2017: 3.5%–7.5%) above the long-term US$ inflation rate were used for Opex and Capex escalators.
Exchange rates Exchange rates are estimated based on an assessment of current market fundamentals and long-term expectations. The US$/ZAR exchange rate range used, for all South African operations, commenced at ZAR12.75 (30 June 2017: ZAR13.00), further devaluing at 3.9% (30 June 2017: 3.5%) per annum a period of three years, reverting to 3.4% per annum thereafter.
Valuation basis Discounted present value of future cashflows.
Specific assumptions and sensitivity analysis
South African mines
At Cullinan specific assumptions were made in relation to grade and pricing as production from the C-cut Phase 1 ramps up
and ongoing plant optimisation continues. At Finsch specific assumptions were made in relation to the reduction in certain
operation costs such as outsourced services, automation of processes and reduction in processing of tailings and overburden
dump material. The impact of applying sensitivities on the key inputs is noted below:
Finsch
headroom %
Cullinan
headroom %
Base case headroom 19% 24%
Increase in discount rate by 2% 6% 13%
Reduction in pricing by 5% 5% 14%
Reduction in short-term production by 10% 14% 19%
Increase in Opex by 5% 14% 19%
Williamson – Tanzania
At Williamson, the key judgement is around the recoverability of the VAT receivable under the new legislation effective 20 July
2018. As detailed in note 2, Management consider the VAT to be fully recoverable. However, if the VAT were not to be
recoverable the impact would be to reduce the base case headroom from 44% to 19%.
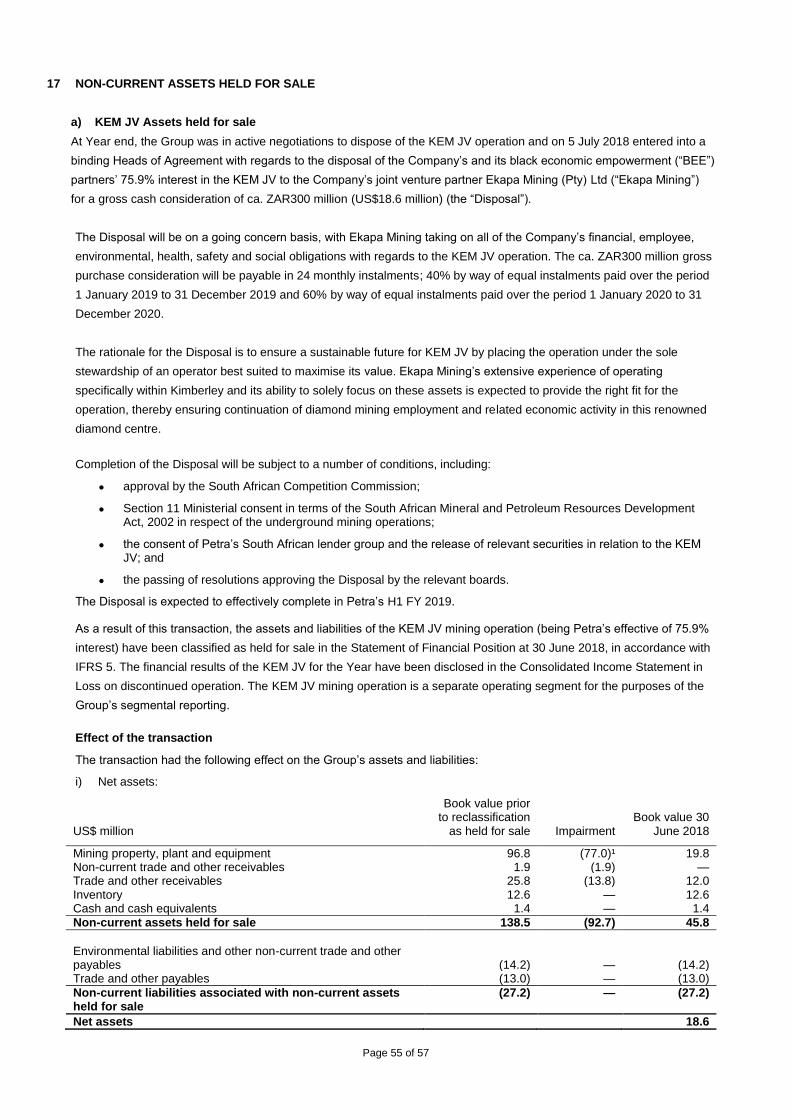
Page 55 of 57
17 NON-CURRENT ASSETS HELD FOR SALE
a) KEM JV Assets held for sale
At Year end, the Group was in active negotiations to dispose of the KEM JV operation and on 5 July 2018 entered into a
binding Heads of Agreement with regards to the disposal of the Company’s and its black economic empowerment (“BEE”)
partners’ 75.9% interest in the KEM JV to the Company’s joint venture partner Ekapa Mining (Pty) Ltd (“Ekapa Mining”)
for a gross cash consideration of ca. ZAR300 million (US$18.6 million) (the “Disposal”).
The Disposal will be on a going concern basis, with Ekapa Mining taking on all of the Company’s financial, employee,
environmental, health, safety and social obligations with regards to the KEM JV operation. The ca. ZAR300 million gross
purchase consideration will be payable in 24 monthly instalments; 40% by way of equal instalments paid over the period
1 January 2019 to 31 December 2019 and 60% by way of equal instalments paid over the period 1 January 2020 to 31
December 2020.
The rationale for the Disposal is to ensure a sustainable future for KEM JV by placing the operation under the sole
stewardship of an operator best suited to maximise its value. Ekapa Mining’s extensive experience of operating
specifically within Kimberley and its ability to solely focus on these assets is expected to provide the right fit for the
operation, thereby ensuring continuation of diamond mining employment and related economic activity in this renowned
diamond centre.
Completion of the Disposal will be subject to a number of conditions, including:
approval by the South African Competition Commission;
Section 11 Ministerial consent in terms of the South African Mineral and Petroleum Resources Development Act, 2002 in respect of the underground mining operations;
the consent of Petra’s South African lender group and the release of relevant securities in relation to the KEM JV; and
the passing of resolutions approving the Disposal by the relevant boards.
The Disposal is expected to effectively complete in Petra’s H1 FY 2019.
As a result of this transaction, the assets and liabilities of the KEM JV mining operation (being Petra’s effective of 75.9%
interest) have been classified as held for sale in the Statement of Financial Position at 30 June 2018, in accordance with
IFRS 5. The financial results of the KEM JV for the Year have been disclosed in the Consolidated Income Statement in
Loss on discontinued operation. The KEM JV mining operation is a separate operating segment for the purposes of the
Group’s segmental reporting.
Effect of the transaction
The transaction had the following effect on the Group’s assets and liabilities:
i) Net assets:
US$ million
Book value prior to reclassification
as held for sale Impairment Book value 30
June 2018
Mining property, plant and equipment 96.8 (77.0)¹ 19.8 Non-current trade and other receivables 1.9 (1.9) — Trade and other receivables 25.8 (13.8) 12.0 Inventory 12.6 — 12.6 Cash and cash equivalents 1.4 — 1.4
Non-current assets held for sale 138.5 (92.7) 45.8
Environmental liabilities and other non-current trade and other payables (14.2) — (14.2) Trade and other payables (13.0) — (13.0)
Non-current liabilities associated with non-current assets held for sale
(27.2) — (27.2)
Net assets 18.6
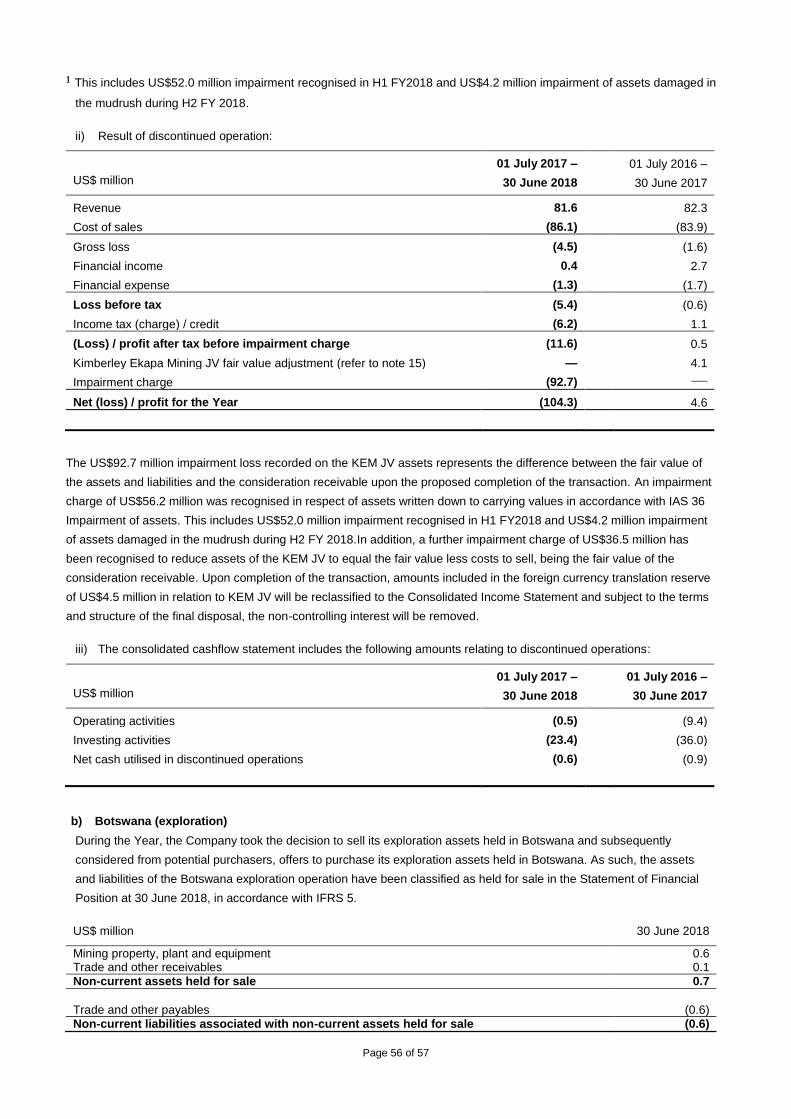
Page 56 of 57
¹ This includes US$52.0 million impairment recognised in H1 FY2018 and US$4.2 million impairment of assets damaged in
the mudrush during H2 FY 2018.
ii) Result of discontinued operation:
US$ million
01 July 2017 –
30 June 2018
01 July 2016 –
30 June 2017
Revenue 81.6 82.3
Cost of sales (86.1) (83.9)
Gross loss (4.5) (1.6)
Financial income 0.4 2.7
Financial expense (1.3) (1.7)
Loss before tax (5.4) (0.6)
Income tax (charge) / credit (6.2) 1.1
(Loss) / profit after tax before impairment charge (11.6) 0.5
Kimberley Ekapa Mining JV fair value adjustment (refer to note 15) — 4.1
Impairment charge (92.7) —
Net (loss) / profit for the Year (104.3) 4.6
The US$92.7 million impairment loss recorded on the KEM JV assets represents the difference between the fair value of
the assets and liabilities and the consideration receivable upon the proposed completion of the transaction. An impairment
charge of US$56.2 million was recognised in respect of assets written down to carrying values in accordance with IAS 36
Impairment of assets. This includes US$52.0 million impairment recognised in H1 FY2018 and US$4.2 million impairment
of assets damaged in the mudrush during H2 FY 2018.In addition, a further impairment charge of US$36.5 million has
been recognised to reduce assets of the KEM JV to equal the fair value less costs to sell, being the fair value of the
consideration receivable. Upon completion of the transaction, amounts included in the foreign currency translation reserve
of US$4.5 million in relation to KEM JV will be reclassified to the Consolidated Income Statement and subject to the terms
and structure of the final disposal, the non-controlling interest will be removed.
iii) The consolidated cashflow statement includes the following amounts relating to discontinued operations:
US$ million
01 July 2017 –
30 June 2018
01 July 2016 –
30 June 2017
Operating activities (0.5) (9.4)
Investing activities (23.4) (36.0)
Net cash utilised in discontinued operations (0.6) (0.9)
b) Botswana (exploration)
During the Year, the Company took the decision to sell its exploration assets held in Botswana and subsequently
considered from potential purchasers, offers to purchase its exploration assets held in Botswana. As such, the assets
and liabilities of the Botswana exploration operation have been classified as held for sale in the Statement of Financial
Position at 30 June 2018, in accordance with IFRS 5.
US$ million 30 June 2018
Mining property, plant and equipment 0.6 Trade and other receivables 0.1
Non-current assets held for sale 0.7
Trade and other payables (0.6)
Non-current liabilities associated with non-current assets held for sale (0.6)
Page 57 of 57
Net assets 0.1
18. POST BALANCE SHEET EVENTS
RCF and WCF settlement
On 09 July 2018, the Company settled its RCF loan (capital plus interest) of US$73.1 million with its lending group.
On 13 July 2018, the Company settled its WCF loan (capital plus interest) of US$33.6 million with its lending group.
As at date of this report, both the RCF and WCF remain undrawn. RESPONSIBILITY STATEMENT
We confirm that to the best of our knowledge: (a) the preliminary financial statements have been prepared in accordance with International Financial Reporting Standards as adopted by the European Union, and give a true and fair view of the assets, liabilities, financial position and profit of the Group for the Year; and (b) the preliminary management report for the Year includes a fair review of the information required by the FCA’s Disclosure and Transparency Rules (DTR 4.1.8 R and 4.1.9 R). By order of the Board Johan Dippenaar Chief Executive Officer 17 September 2018