1608 Horizons Master v06€¦ · Horizons report | November 2016 Horizons Examination of the burden...
68
Horizons report | November 2016 Horizons Examination of the burden of disease of intimate partner violence against women in 2011: Final report Issue 06 | 2016
Transcript of 1608 Horizons Master v06€¦ · Horizons report | November 2016 Horizons Examination of the burden...
Judicial education for domestic and family violence
H o r i z o n s r e p o r t | N o v e m b e r 2 0 1 6
HorizonsExamination of the burden of disease of intimate partner violence against women in 2011: Final report
I s s u e 0 6 | 2 0 1 6
i
ANROWS acknowledgement
This material was produced with funding from the Australian Government and the Australian state and territory governments. Australia’s National Research Organisation for Women’s Safety (ANROWS) gratefully acknowledges the fi nancial and other support it has received from these governments, without which this work would not have been possible. The fi ndings and views reported in this paper are those of the authors and cannot be attributed to the Australian Government, or any Australian state or territory government.
Acknowledgement of Country
ANROWS acknowledges the traditional owners of the land across Australia on which we work and live. We pay our respects to Aboriginal and Torres Strait Islander elders past, present and future; and we value Aboriginal and Torres Strait Islander history, culture and knowledge.
© ANROWS 2016
Published by
Australia’s National Research Organisation for Women’s Safety Limited (ANROWS)PO Box Q389, Queen Victoria Building, NSW, 1230 | www.anrows.org.au | Phone +61 2 8374 4000 ABN 67 162 349 171
Examination of the burden of disease of intimate partner violence against women in 2011: Final report / Julie Ayre, Miriam Lum On, Kim Webster, Michelle Gourley, Lynelle Moon.Sydney : ANROWS, c2016.Pages ; 30 cm. (ANROWS Horizons, Issue 06/2016)I. Abused women – Australia – Health. II. Intimate partner violence – Australia. III. Women – Violence against – Australia. I. Ayre, Julie. II. Lum On, Miriam. III. Webster, Kim. IV. Gourley, Michelle. V. Moon, Lynelle. ISSN: 2204-9657 (print) 2204-9665 (online) ISBN: 978-1-925372-46-5 (print) 978-1-925372-47-2 (online)
Creative Commons Licence
Attribution-Non Commercial
This licence lets others distribute, remix and build upon the work, but only if it is for non-commercial purposes and they credit the original creator/s (and any other nominated parties). They do not have to license their Derivative Works on the same terms.
Version 3.0 (CC Australia ported licence): View CC BY-NC Australia Licence Deed | View CC BY-NC 3.0 Australia Legal Code
Version 4.0 (international licence): View CC BY-NC 4.0 Licence Deed | View CC BY-NC 4.0 Legal Code
CC BY-NC
iiExamination of the burden of disease of intimate partner violence against women in 2011
Examination of the burden of disease of intimate partner violence against women in 2011: Final report
Authored by
Ms Julie Ayre, Analyst, Australian Burden of Disease Study, AIHW Ms Miriam Lum On, Project Manager, Australian Burden of Disease Study, AIHW Ms Kim Webster, Independent consultant Ms Michelle Gourley, Unit Head, Australian Burden of Disease Unit, AIHW Dr Lynelle Moon, National Lead Analyst, Australian Burden of Disease Study, AIHW
With input from:
Dr Vanessa Prescott, Senior Analyst, Australian Burden of Disease Study, AIHWMs Louise York, Acting Senior Executive, Health Group, AIHW Dr Fadwa Al-Yaman, Senior Exec utive, Indigenous and Children’s Group, AIHW
Suggested citation:
Ayre, J., Lum On, M., Webster, K., Gourley, M., & Moon, L. (2016). Examination of the burden of disease of intimate partner violence against women in 2011: Final report (ANROWS Horizons, 06/2016). Sydney: ANROWS.
This commissioned work is part of the ANROWS Horizons series. The Horizons report (in-depth research report) for this project is available below. A Compass (research to policy and practice) paper is also available as part of this project. Papers will draw on empirical research, including research produced under ANROWS’s research program, and/or practice knowledge.
This report addresses work covered in ANROWS research project 1.7 “The burden of disease impact of violence against women”. Please consult the ANROWS website for more information on this project.
Australian Institute of Health and WelfareGPO Box 570, Canberra, ACT 2601, Australia
iii
ANROWS Horizons | November 2016
Examination of the burden of disease of intimate partner violence against women in 2011
This page has intentionally been left blank.
1
ANROWS Horizons | November 2016
Examination of the burden of disease of intimate partner violence against women in 2011
Contents
Abbreviations 6
Symbols 6
Summary 7
Outline of this report 8
Introduction 9The impact of intimate partner violence 9Aim of this report and research questions 10The health impacts of exposure to IPV 11How burden of disease analysis estimates the health impact of IPV 11Previous burden of disease studies 12Extension topics 13
Definitions of IPV 15
Methods 16How is burden of disease measured and interpreted? 16Comparative risk assessment methodology 18Step 1: Estimate the population-level distribution of exposure 18Step 2: Select linked diseases 20Step 3: Calculate the effect of risk factors on disease 21Step 4: Theoretical minimum risk exposure 23Step 5: Calculation of population attributable fraction 23Combined risk factor analysis 24
Detailed estimates of effect 25Depressive disorders 25Anxiety disorders 26Alcohol-use disorders 27 Early pregnancy loss 27Preterm & low birth weight complications 28Suicide & self-inflicted injuries 29Homicide & violence 30
Findings 31Section 1: The burden of cohabiting IPV (physical/sexual IPV and emotional abuse) 32Section 2: The burden of cohabiting/non-cohabiting physical/sexual IPV 37Section 3: Accounting for overlaps between different types of IPV 41Section 4: The Indigenous burden of physical/sexual IPV 43Section 5: Changes in the burden of IPV between 2003 and 2011 45
2
ANROWS Horizons | November 2016
Examination of the burden of disease of intimate partner violence against women in 2011
Discussion 46Summary of aims and methods 46 Summary of results and comparison to ABDS 2011 46Limitations 47Gaps 48
Conclusion 50
Appendix A 51
Appendix B 53
References 59
3
ANROWS Horizons | November 2016
Examination of the burden of disease of intimate partner violence against women in 2011
Table 1.1 Health impacts associated with IPV 10Table 1.2 Intimate partner violence linked diseases and proportion (%) of female health burden attributed to IPV reported in
previous burden of disease studies 12Table 3.1 Diseases linked to physical/sexual IPV and emotional abuse for inclusion in burden of disease analysis 21Table 3.2 Relative risk and outcomes for IPV reported in GBD 2010 used in ABDS 2011 22Table 3.3 Odds ratios and outcomes for IPV reported in WHO 2013 22Table 3.4 Summary of relative risks for analysis used in this report 23Table 4.1 Proportion (%) of homicides for which the perpetrator was an intimate partner 29Table 4.2 Summary of issues in estimating effect of IPV on the burden of homicide & violence 30Table 5.1 Burden (number and %) attributable to cohabiting physical/sexual IPV, by disease, adult women, 2011 34Table 5.2 Deaths and burden of preterm & low birth weight complications (number) attributable to physical/sexual IPV exposure
in infants, 2011 36Table 5.3 Burden (number and %) attributable to cohabiting/non-cohabiting physical/sexual IPV, by disease, adult women, 2011 38Table 5.4 Burden (number and %) attributable to cohabiting IPV, adult women, 2011 41Table 5.5 Burden (number and %) attributable to cohabiting/non-cohabiting IPV, adult women, 2011 42Table 5.6 Burden (number and %) attributable to cohabiting/non-cohabiting physical/sexual IPV by disease, adult women
Indigenous Australians, 2011 43Table 5.7 Age-standardised rates of burden due to cohabiting/non-cohabiting physical/sexual IPV (DALY per 1000 people) and
rate ratios, by disease, adult women, Indigenous and non-Indigenous Australians, 2011 44Table A.1 Fatal (YLL), non-fatal (YLD) and total burden (DALY) for Australian adult women, selected diseases, 2011 51Table A.2 Burden (number and %) attributable to cohabiting physical/sexual IPV by disease based on ABDS 2011 analysis, adult women
2011 52Table B.1 Contribution of intimate partner violence to the total burden (%) in Australian women aged 18 years and over, 2011 53Table B.2 Leading risk factors (as reported in ABDS 2011) (% of total burden) in women aged 18 years and over, 2011 54Table B.3 Contribution (%) of each disease outcome to total IPV attributable burden, by disease, Australian women aged 18 years and
over, 2011 54Table B.4 Contribution of IPV to total disease burden (%), by disease, Australian women aged 18 years and over, 2011 54Table B.5 Contribution (%) of selected diseases to total burden, by disease, Australian women aged 18 years and over, 2011 55Table B.6 Contribution of intimate partner violence to the total burden (%) in Indigenous Australian women aged 18 years and
over, 2011 55Table B.7 Leading risk factors (% of total burden), Indigenous Australian women aged 18 years and over, 2011 55Table B.8 Contribution (%) of each disease outcome to physical/sexual IPV attributable burden, by disease, Indigenous Australian
women aged 18 years and over, 2011 56Table B.9 Contribution of IPV to total disease burden (%), by disease, Indigenous Australian women aged 18 years and over, 2011 56Table B.10 Contribution (%) of selected diseases to total burden, by disease, Indigenous Australian women aged 18 years and
over, 2011 56Table B.11 Age-standardised rates of burden attributable to physical/sexual IPV (DALY per 1000), by disease and Indigenous
status, adult women 2011 57Table B.12 Age-standardised rates of burden attributable to cohabiting/non-cohabiting physical/sexual IPV (DALY per 1000), by
disease and Indigenous status, adult women aged 18-44 years, 2011 57Table B.13 Age-standardised rates of attributable burden (DALY per 1000) for risk factors that contribute most greatly to difference
in rates of non-Indigenous and Indigenous burden, adult women, 2011 57Table B.14 Age-standardised rates of attributable burden (DALY per 1000) for risk factors that contribute most greatly to difference in
rates of non-Indigenous and Indigenous burden, adult women aged 18-44 years, 2011 58
List of tables
4
ANROWS Horizons | November 2016
Examination of the burden of disease of intimate partner violence against women in 2011
List of figures
Figure 4.1 Potential inputs for the relative risk of depressive disorders due to physical/sexual IPV 25Figure 4.2 Potential inputs for the relative risk of anxiety disorders due to physical/sexual IPV 26Figure 4.3 Potential inputs for the relative risk of pregnancy loss due to physical/sexual IPV 27Figure 4.4 Potential inputs for the relative risk of premature & low birth weight complications due to physical/sexual IPV 28Figure 5.1 Proportion (%) of burden attributed to cohabiting physical/sexual IPV by disease, adult women, 2011 32Figure 5.2 Proportion of fatal and non-fatal burden attributed to cohabiting physical/sexual IPV by disease, adult women, 2011
33Figure 5.3 Proportion of total burden (DALY) attributed to cohabiting physical/sexual IPV, by disease, adult women, 2011 33Figure 5.4 Burden (‘000 DALY) attributed to cohabiting physical/sexual IPV against women (males and females), by age, 2011 35Figure 5.5 Leading risk factor contribution to total burden (proportion, %), for cohabiting physical/sexual IPV in adult women, by
age groups, 2011 36Figure 5.6 Proportion (%) of burden attributed to cohabiting/non-cohabiting physical/sexual IPV by disease, adult women, 2011
37Figure 5.7 Proportion of total burden (DALY) attributed to cohabiting/non-cohabiting physical/sexual IPV, by disease, adult
women, 2011 37Figure 5.8 Burden (‘000 DALY) attributed to cohabiting/non-cohabiting physical/sexual IPV against women (males and females),
by age,2011 39Figure 5.9 Risk factor contribution to total burden (proportion, %), for cohabiting/non-cohabiting physical/sexual IPV in adult women,
by age groups, 2011 40Figure 5.10 Proportion of total burden (DALY) attributed to cohabiting physical/sexual IPV, non-cohabitating physical/sexual IPV and
cohabiting emotional abuse, by disease, adult women, 2011 42Figure 5.11 Comparison of age-standardised rates of burden (DALY per1000people)attributable to physical/sexual IPV, by disease,
Indigenous and non-Indigenous adult women, 2011 44Figure 5.12 Risk factor contribution to total burden (proportion, %), for cohabiting/non-cohabiting physical/sexual IPV in adult
Indigenous women, by age groups, 2011 45
5
ANROWS Horizons | November 2016
Examination of the burden of disease of intimate partner violence against women in 2011
List of boxes
Box 1.1 Key terms used in this report 14Box 2.1 Definitions of IPV used in this report 15Box 3.1 Example of how a disability-adjusted life year is estimated 16Box 3.2 Key methodological differences from ABDS 2011 17Box 3.3 Levels of evidence used by GBD 2010 20Box 3.4 Example of how a PAF is applied to the population 24
6
ANROWS Horizons | November 2016
Examination of the burden of disease of intimate partner violence against women in 2011
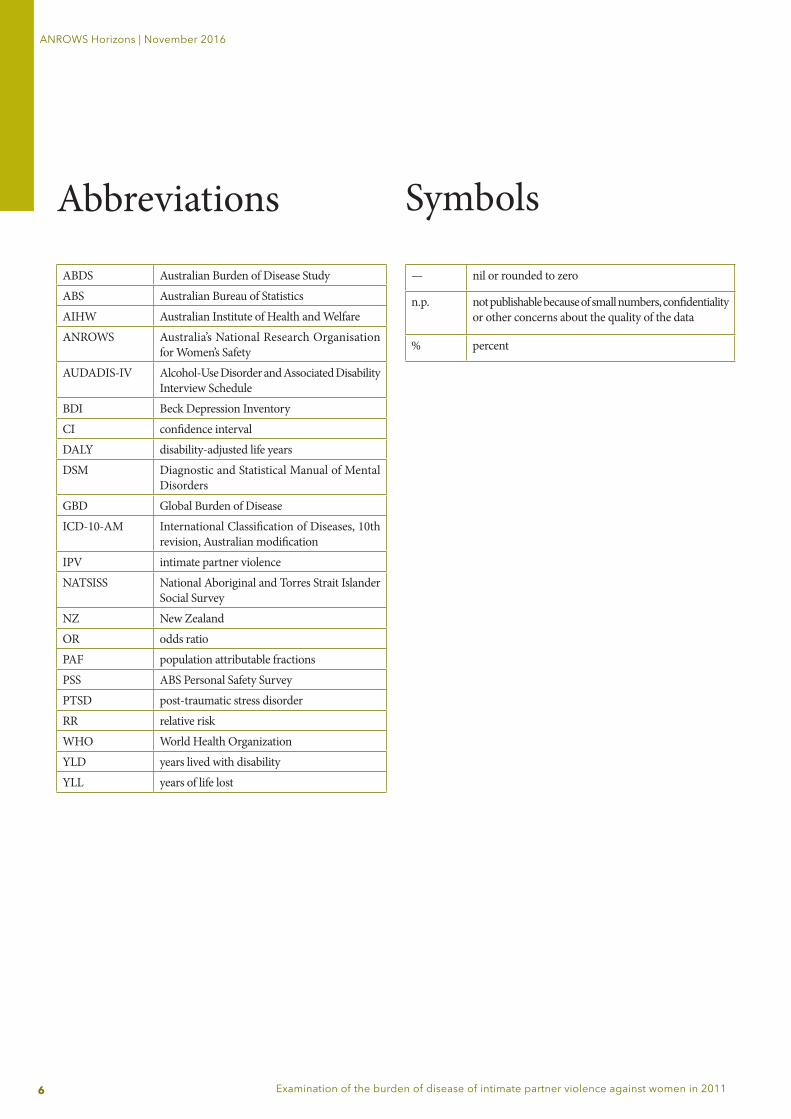
Abbreviations Symbols
— nil or rounded to zero
n.p. not publishable because of small numbers, confidentiality or other concerns about the quality of the data
% percent
ABDS Australian Burden of Disease StudyABS Australian Bureau of StatisticsAIHW Australian Institute of Health and WelfareANROWS Australia’s National Research Organisation
for Women’s Safety AUDADIS-IV Alcohol-Use Disorder and Associated Disability
Interview Schedule BDI Beck Depression InventoryCI confidence intervalDALY disability-adjusted life yearsDSM Diagnostic and Statistical Manual of Mental
DisordersGBD Global Burden of DiseaseICD-10-AM International Classification of Diseases, 10th
revision, Australian modificationIPV intimate partner violenceNATSISS National Aboriginal and Torres Strait Islander
Social SurveyNZ New ZealandOR odds ratioPAF population attributable fractionsPSS ABS Personal Safety SurveyPTSD post-traumatic stress disorderRR relative riskWHO World Health OrganizationYLD years lived with disabilityYLL years of life lost
7
ANROWS Horizons | November 2016
Examination of the burden of disease of intimate partner violence against women in 2011
SummaryExposure to intimate partner violence (IPV) has serious health outcomes for Australian women and their children, and its prevention is a recognised national priority.
Burden of disease studies measure the combined impact of living with illness and injury (non-fatal burden) and dying prematurely (fatal burden) on a population. This report estimated the amount of burden that could have been avoided if no adult women in Australia in 2011 had been exposed to IPV during their lifetime. This “attributable burden” is reported in terms of total, non-fatal and fatal burden.
This report extends results from the Australian Burden of Disease Study 2011 (ABDS 2011) to produce detailed estimates of the health burden due to exposure to intimate partner violence (IPV) that are specific to Australian women in 2011. Of note, this report also includes estimates of attributable burden using a broader definition of IPV than used in the ABDS 2011, one that includes non-cohabiting partners as well as partner emotional abuse.
Key results for national estimates of burdenOverall, it was estimated that 1.4% of the disease burden experienced by women aged 18 years and over in 2011 was attributable to physical/sexual IPV by a current or previous cohabiting partner. Anxiety disorders made up the greatest proportion of this attributable burden (35%), followed by depressive disorders (32%) and suicide & self-inflicted injuries (19%) (Figure 5.1). More than one-quarter (27%) of this burden was fatal (Figure 5.2).
Physical/sexual IPV was responsible for almost half (45%) of the total burden due to homicide & violence among adult women in 2011 (Figure 5.3).
When the definition of IPV was broadened to include physical/sexual IPV by non-cohabiting partners, it was estimated that 2% of the burden experienced by Australian adult women could have been avoided if no exposure to IPV occurred. When emotional abuse was also considered, it was estimated that 2.2% of all burden experienced by adult women was due to IPV (Table 5.5) and could have been avoided if no exposure to IPV occurred.
The burden of IPV among Indigenous womenUsing the broader definition of IPV (cohabiting and non-cohabiting), the rate of burden attributable to physical/sexual IPV was estimated to be five times greater among Indigenous women than non-Indigenous women in 2011 once the effects of age were removed (Table 5.7, Figure 5.11). In total, it was estimated that this type of IPV was responsible for 6.4% of overall burden among Indigenous women. A larger proportion of this burden was fatal for Indigenous (34%) compared to non-Indigenous (24%) women.
Little change in the rate of burden between 2003 and 2011
There was little change in age-standardised rates of burden attributable to IPV between 2003 and 20111 (there was an increase from 4.4 to 4.9 DALY per 1000 adult women). This was mostly because there was little change in the burden of many of the diseases linked to IPV (particularly anxiety and depressive disorders), and because the rate of exposure to IPV was fairly stable across these two time points based on available evidence.
1 The methods used to calculate national 2011 estimates were used to revise national 2003 estimates to ensure comparability.
Symbols
8
ANROWS Horizons | November 2016
Examination of the burden of disease of intimate partner violence against women in 2011
The report is divided into the following chapters: • Introduction: this chapter provides background
information on the impact of intimate partner violence and its associated health outcomes. It also highlights the main aim and rationale for the report.
• Definitions: this chapter describes the definitions of IPV used within the report.
• Methods: this chapter covers the comparative risk assessment methodology used to produce estimates of burden due to IPV as a risk factor and provides guidance on how to interpret burden of disease analysis.
• Estimates of effect: this chapter covers the effect sizes (relative risks) selected for each linked disease.
• Findings: this chapter describes the key findings of the report.
• Discussion: this chapter provides commentary on the implications of the findings as well as the limitations of the report and future directions.
• Appendix A: contains the results relating to intimate partner violence from the Australian Burden of Disease Study 2011 published by the AIHW in May 2016.
• Appendix B: contains the results relating to intimate partner violence for women aged 18-44 years, where the estimates for women aged 18-24 years and 25-44 years have been combined together. These tables provide the underlying data as reported in the Compass paper prepared from this study (Webster, 2016).
This report is the second of three documents within this ANROWS research project on “The burden of disease impact of violence against women”. The first paper was a state of knowledge paper examining health outcomes of intimate partner violence against women (Lum On, Ayre, Webster, & Moon, 2016). A third paper will draw together the technical detail of this Horizons report and the literature outlined in the state of knowledge paper in order to provide analysis that outlines some of the implications for future policy and practice in responding to, and preventing, IPV.
Outline of this report
9
ANROWS Horizons | November 2016
Examination of the burden of disease of intimate partner violence against women in 2011
The impact of intimate partner violenceThe social, economic and health burden of intimate partner violence (IPV) is increasingly recognised as a national priority in Australia. In 2012, one in six women (16.9%) in Australia reported experience of partner violence by a current or former cohabiting partner (Australian Bureau of Statistics (ABS), 2013a; Lum On et al., 2016). This figure increased to one in four women when non-cohabiting current and former partners were included (Cox, 2015). When emotional abuse in cohabiting relationships is also included, this rises again to one in three (ABS, 2013b).
The significance of the issue has been reflected by the development of The National Plan to Reduce Violence against Women and Their Children 2010-2022 (Council of Australian Governments, 2011). The plan aims to connect the important work being done by all Australian governments, community organisations and individuals to reduce violence so that they can work together to ensure each year, less women experience violence and more women and their children live safely. This includes preventing prevalent forms of violence against women such as IPV. An important component of the plan includes identifying and responding to the service needs of women and children. Understanding the health impacts of IPV can help inform and facilitate policy, planning and service delivery.
IPV describes physical and sexual violence and emotional abuse that occurs within the context of a current or previous intimate relationship. This can include formal partnerships such as marriage, as well as less formal partnerships such as dating relationships and unmarried (de facto or non-cohabiting) relationships (WHO, 2013).
IPV is an important public health issue and social determinant of health and can be analysed within the context of the circumstances in which people live (such as their education, occupation, income, gender) and the broader context of economics, social policies, the political environment, cultural norms and health systems (World Health Organization Commission on Social Determinants of Health, 2008). IPV can impact on factors within a person’s life that may influence health outcomes and behaviours, including difficulty obtaining education and employment (Banyard, Potter, & Turner, 2011; Flood & Fergus, 2008; Kimerling, Alvarez, Pavao, Mack, Smith, & Baumrind, 2009; Staggs, Long, Mason, Krishnan, & Riger, 2007), housing insecurity (Tually, Faulkner, Cutler, & Slatter, 2008), and social isolation (Wright, 2012).
Within the social determinants of a health framework, IPV can influence health directly (for example, in the form of injuries) or indirectly (through its influence on social, behavioural and
1. Introduction
biomedical factors). For example, IPV victimisation is associated with tobacco use (Jun, Rich-Edwards, Boynton-Jarrett, & Wright, 2008; Vos et al., 2006). IPV could therefore plausibly place a woman at greater risk of negative health outcomes associated with smoking, such as lung cancer. Similarly, IPV may influence an individual’s access to health care services such that they are less likely to participate in preventative healthcare such as cervical screening (Loxton, Powers, Schofield, Hussain, & Hosking, 2009). Given the breadth of potential direct and indirect impacts of IPV on health outcomes, it is unsurprising that IPV is associated with substantial economic costs to individual women, their children and the wider society. As noted in Lum On et al. (2016), a South African study suggests that the cost of IPV ranges between 1% and 2% of gross domestic product (KPMG, 2014). Assuming the prevalence of IPV remains unchanged from 2009 levels, its cost to the Australian economy in 2021-22 is estimated (using burden of disease estimates) to be some $15.6 billion per annum (National Council to Reduce Violence against Women and Their Children, 2009).
Furthermore, these impacts also extend to children who have witnessed IPV. Such children are more likely to have a range of health, development and social problems during childhood and later in life (Campo, Kaspiew, Moore, & Tayton, 2014; Flood & Fergus, 2008; Holt, Buckley, & Whelan, 2008; Humphreys, Houghton, & Ellis, 2008; Richards, 2011). They are also at greater risk of violence perpetration or victimisation, making IPV a significant contributor to intergenerational cycles of disadvantage (Stith, Rosen, Middleton, Busch, Lundeberg, & Carlton, 2000).
10
ANROWS Horizons | November 2016
Examination of the burden of disease of intimate partner violence against women in 2011
Aim of this report and research questions
This report aims to extend the results reported in the Australian Burden of Disease Study (ABDS) 2011 (AIHW, 2016a) and to produce refined estimates of the health burden due to exposure to IPV on Australian women in 2011 with improved documentation of methods and the inputs used. Based on the availability of data at the commencement of ABDS, 2011 was considered the most suitable choice for the primary reference year. The Study took 3 years to complete, which included building the infrastructure required and to review and implement major methodological changes made globally in the field of burden of disease analysis.
This report was informed by an initial systematic review of the literature (Lum On et al., 2016). The state of knowledge paper drew on the findings from a global literature review on the links between IPV and various health outcomes (WHO, 2013) and its findings have been incorporated into the burden of disease analysis presented in this report.
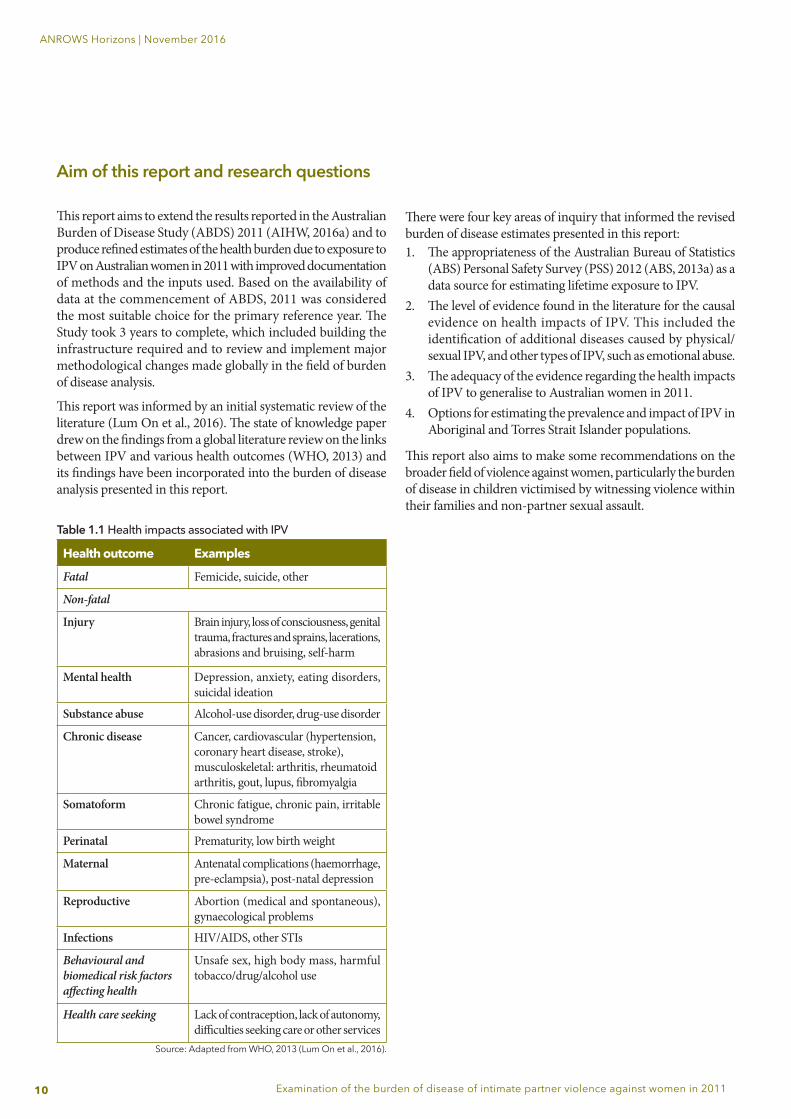
Table 1.1 Health impacts associated with IPV
Health outcome Examples
Fatal Femicide, suicide, other
Non-fatal
Injury Brain injury, loss of consciousness, genital trauma, fractures and sprains, lacerations, abrasions and bruising, self-harm
Mental health Depression, anxiety, eating disorders, suicidal ideation
Substance abuse Alcohol-use disorder, drug-use disorder
Chronic disease Cancer, cardiovascular (hypertension, coronary heart disease, stroke), musculoskeletal: arthritis, rheumatoid arthritis, gout, lupus, fibromyalgia
Somatoform Chronic fatigue, chronic pain, irritable bowel syndrome
Perinatal Prematurity, low birth weight
Maternal Antenatal complications (haemorrhage, pre-eclampsia), post-natal depression
Reproductive Abortion (medical and spontaneous), gynaecological problems
Infections HIV/AIDS, other STIs
Behavioural and biomedical risk factors affecting health
Unsafe sex, high body mass, harmful tobacco/drug/alcohol use
Health care seeking Lack of contraception, lack of autonomy, difficulties seeking care or other services
Source: Adapted from WHO, 2013 (Lum On et al., 2016).
There were four key areas of inquiry that informed the revised burden of disease estimates presented in this report: 1. The appropriateness of the Australian Bureau of Statistics
(ABS) Personal Safety Survey (PSS) 2012 (ABS, 2013a) as a data source for estimating lifetime exposure to IPV.
2. The level of evidence found in the literature for the causal evidence on health impacts of IPV. This included the identification of additional diseases caused by physical/sexual IPV, and other types of IPV, such as emotional abuse.
3. The adequacy of the evidence regarding the health impacts of IPV to generalise to Australian women in 2011.
4. Options for estimating the prevalence and impact of IPV in Aboriginal and Torres Strait Islander populations.
This report also aims to make some recommendations on the broader field of violence against women, particularly the burden of disease in children victimised by witnessing violence within their families and non-partner sexual assault.
11
ANROWS Horizons | November 2016
Examination of the burden of disease of intimate partner violence against women in 2011
The health impacts of exposure to IPV
Over the last decade, the literature investigating health impacts (also referred to in this report as diseases or health outcomes) associated with IPV has increased substantially. This is reflected in the many health impacts that can be associated with IPV (Table 1.1).
Despite this broad range of health impacts, for the purposes of burden of disease analysis the diseases included must be considered a direct consequence of IPV (as opposed to associations, which may lack causal evidence). Further, the evidence found in the literature must take into account: • Potential for bi-directional (or “two-way”) causal
relationships between diseases and IPV. • Discrepancies between studies in the strength of the causal
relationship between IPV and diseases. • Variation in the severity of the diseases reported on (for
example, from bruising to skull fractures). • Variation in how IPV is measured.
Consequently, despite the large amount of research on IPV it can be difficult to compare findings across studies, let alone incorporate quantitative findings into a single model on the health impact of IPV.
How burden of disease analysis estimates the health impact of IPVBurden of disease analysis is an internationally recognised method of assessing the health impact of diseases or risk factors across a population. It uses a standard method so that the impact of particular diseases and risk factors can be compared against each another or over time. This provides an important basis for governments and planners to prioritise health and social issues and, potentially, investments. Burden of disease results can also be used to raise public awareness about particular diseases or risk factors.
Understanding the population level impact of a disease or risk factor is especially important for determining the potential gains that may be realised through prevention.
Burden of disease analysis measures the total health loss (measured using a disability-adjusted life year, known as a DALY) from diseases and injuries, including both the fatal impact (from dying prematurely) and the non-fatal impact (from living with a disease or injury). These two components are combined to provide the total disease burden. The role of risk factors can also be quantified, by measuring the proportion of the disease burden due to the risk factor (Lum On et al., 2016). It is the risk factor part of the analysis that can be used to provide a broader picture of the impact of IPV (for example, the impact of IPV on the health of Australian women can be compared to other risk factors, for example the impact of physical inactivity or high blood pressure).
The methods for estimating the burden of diseases attributable to IPV are discussed in detail in Chapter 3.
12
ANROWS Horizons | November 2016
Examination of the burden of disease of intimate partner violence against women in 2011
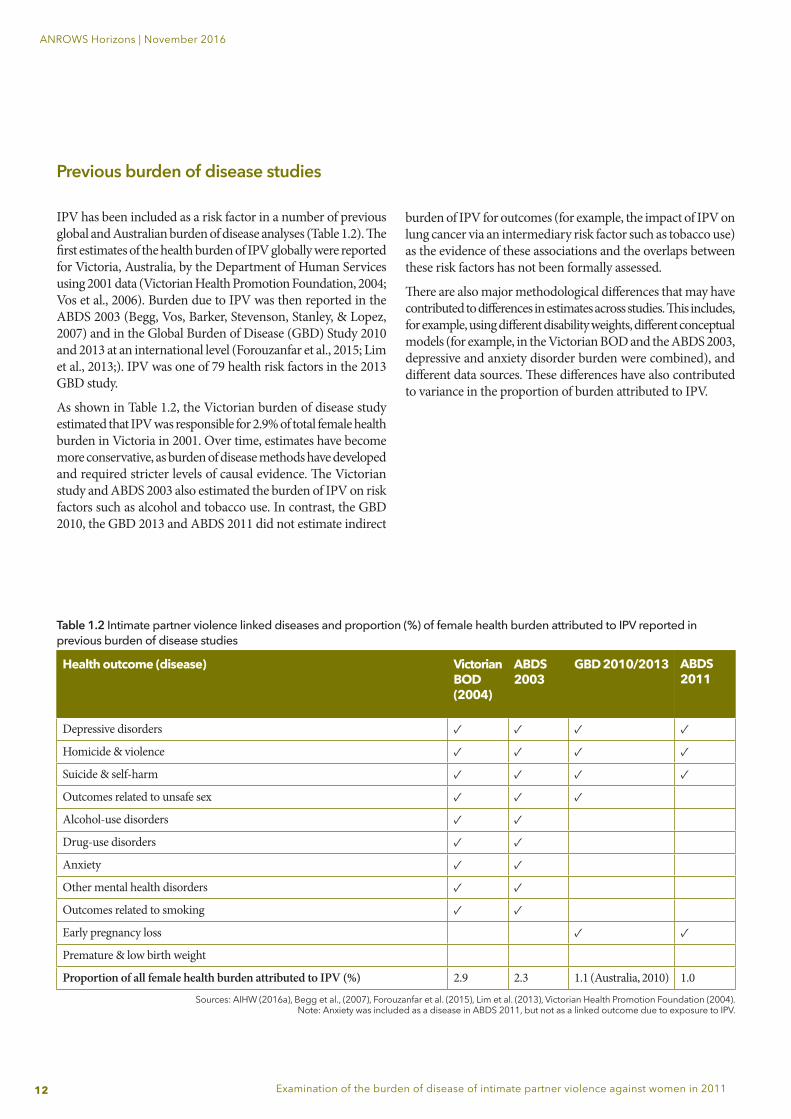
Previous burden of disease studies IPV has been included as a risk factor in a number of previous global and Australian burden of disease analyses (Table 1.2). The first estimates of the health burden of IPV globally were reported for Victoria, Australia, by the Department of Human Services using 2001 data (Victorian Health Promotion Foundation, 2004; Vos et al., 2006). Burden due to IPV was then reported in the ABDS 2003 (Begg, Vos, Barker, Stevenson, Stanley, & Lopez, 2007) and in the Global Burden of Disease (GBD) Study 2010 and 2013 at an international level (Forouzanfar et al., 2015; Lim et al., 2013;). IPV was one of 79 health risk factors in the 2013 GBD study.
As shown in Table 1.2, the Victorian burden of disease study estimated that IPV was responsible for 2.9% of total female health burden in Victoria in 2001. Over time, estimates have become more conservative, as burden of disease methods have developed and required stricter levels of causal evidence. The Victorian study and ABDS 2003 also estimated the burden of IPV on risk factors such as alcohol and tobacco use. In contrast, the GBD 2010, the GBD 2013 and ABDS 2011 did not estimate indirect
burden of IPV for outcomes (for example, the impact of IPV on lung cancer via an intermediary risk factor such as tobacco use) as the evidence of these associations and the overlaps between these risk factors has not been formally assessed.
There are also major methodological differences that may have contributed to differences in estimates across studies. This includes, for example, using different disability weights, different conceptual models (for example, in the Victorian BOD and the ABDS 2003, depressive and anxiety disorder burden were combined), and different data sources. These differences have also contributed to variance in the proportion of burden attributed to IPV.
Table 1.2 Intimate partner violence linked diseases and proportion (%) of female health burden attributed to IPV reported in previous burden of disease studies
Health outcome (disease) Victorian BOD (2004)
ABDS 2003
GBD 2010/2013 ABDS 2011
Depressive disorders ✓ ✓ ✓ ✓
Homicide & violence ✓ ✓ ✓ ✓
Suicide & self-harm ✓ ✓ ✓ ✓
Outcomes related to unsafe sex ✓ ✓ ✓
Alcohol-use disorders ✓ ✓
Drug-use disorders ✓ ✓
Anxiety ✓ ✓
Other mental health disorders ✓ ✓
Outcomes related to smoking ✓ ✓
Early pregnancy loss ✓ ✓
Premature & low birth weight
Proportion of all female health burden attributed to IPV (%) 2.9 2.3 1.1 (Australia, 2010) 1.0
Sources: AIHW (2016a), Begg et al., (2007), Forouzanfar et al. (2015), Lim et al. (2013), Victorian Health Promotion Foundation (2004). Note: Anxiety was included as a disease in ABDS 2011, but not as a linked outcome due to exposure to IPV.
13
ANROWS Horizons | November 2016
Examination of the burden of disease of intimate partner violence against women in 2011
The Australian Institute of Health and Welfare (AIHW) released a report on the third ABDS in 2016 (AIHW, 2016a). It provided updated estimates for around 200 diseases and injuries for the reference year 2011. It also included specific estimates for the Aboriginal and Torres Strait Islander population (AIHW, 2016b). These estimates differed from previous Australian studies as they incorporated the most recent data available of the prevalence of IPV in Australian women from the PSS 2012 (ABS, 2013a).
Extension topicsThe state of knowledge paper also explored several extension topics for potential inclusion in this analysis. Where possible, the findings were assessed and incorporated into analyses—for example, the burden of IPV in Indigenous Australian women was estimated, and the possibility of estimating burden by type of IPV was assessed and discussed at length. Other topics such as the burden of IPV for women with a disability, refugee and migrant women, and the burden of non-partner sexual assault and children witnessing IPV have not been incorporated into the analysis due to limitations in the exposure data and other required inputs. However, these provide insight into current gaps in the data available on IPV for future, more detailed estimates of burden.
The possibility of estimating the health burden of witnessing IPV as a child was also considered. However, this was not included as a component of burden attributable to IPV because the estimates of effect reported in the literature focused on internalising and externalising behaviours rather than the diagnostic conditions required for input into the ABDS analysis (these included, for example, depressive and anxiety disorders, conduct disorder and ADHD). This will be further discussed later in the report.
14
ANROWS Horizons | November 2016
Examination of the burden of disease of intimate partner violence against women in 2011
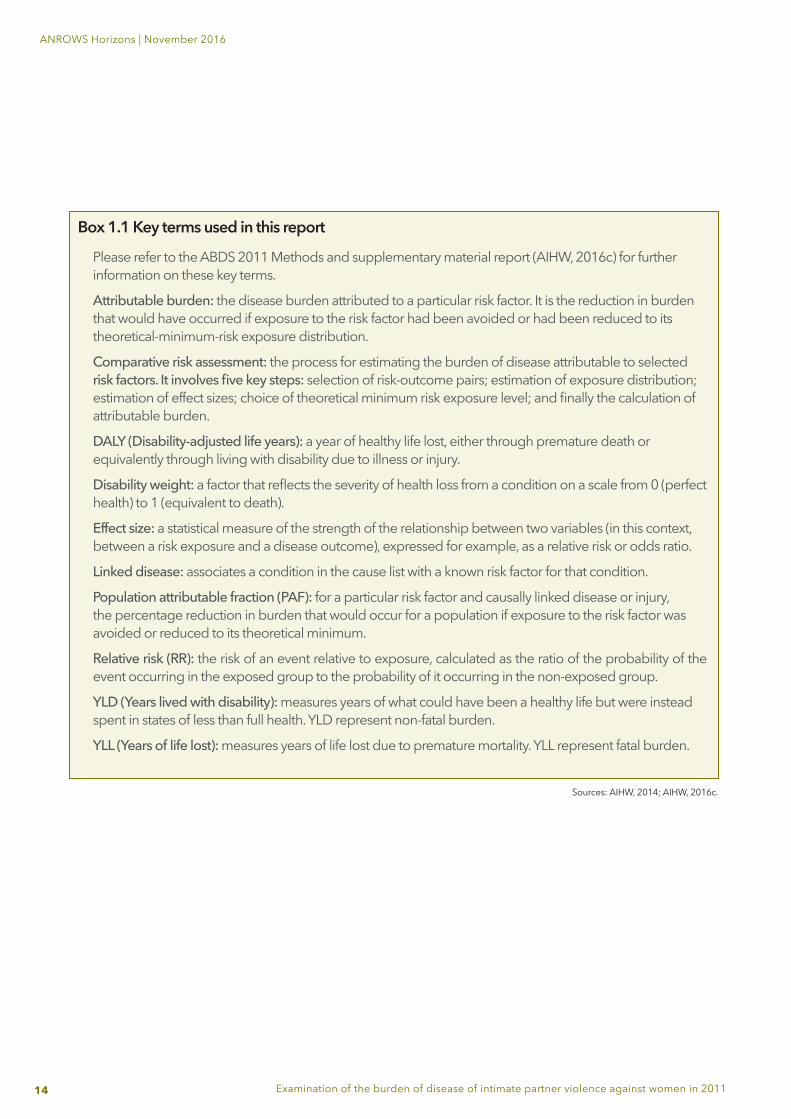
Box 1.1 Key terms used in this report
Please refer to the ABDS 2011 Methods and supplementary material report (AIHW, 2016c) for further information on these key terms.
Attributable burden: the disease burden attributed to a particular risk factor. It is the reduction in burden that would have occurred if exposure to the risk factor had been avoided or had been reduced to its theoretical-minimum-risk exposure distribution.
Comparative risk assessment: the process for estimating the burden of disease attributable to selected risk factors. It involves five key steps: selection of risk-outcome pairs; estimation of exposure distribution; estimation of effect sizes; choice of theoretical minimum risk exposure level; and finally the calculation of attributable burden.
DALY (Disability-adjusted life years): a year of healthy life lost, either through premature death or equivalently through living with disability due to illness or injury.
Disability weight: a factor that reflects the severity of health loss from a condition on a scale from 0 (perfect health) to 1 (equivalent to death).
Effect size: a statistical measure of the strength of the relationship between two variables (in this context, between a risk exposure and a disease outcome), expressed for example, as a relative risk or odds ratio.
Linked disease: associates a condition in the cause list with a known risk factor for that condition.
Population attributable fraction (PAF): for a particular risk factor and causally linked disease or injury, the percentage reduction in burden that would occur for a population if exposure to the risk factor was avoided or reduced to its theoretical minimum.
Relative risk (RR): the risk of an event relative to exposure, calculated as the ratio of the probability of the event occurring in the exposed group to the probability of it occurring in the non-exposed group.
YLD (Years lived with disability): measures years of what could have been a healthy life but were instead spent in states of less than full health. YLD represent non-fatal burden.
YLL (Years of life lost): measures years of life lost due to premature mortality. YLL represent fatal burden.
Sources: AIHW, 2014; AIHW, 2016c.
15
ANROWS Horizons | November 2016
Examination of the burden of disease of intimate partner violence against women in 2011
For a risk factor to be included in burden of disease analysis, the application of a clear and consistent definition of exposure is a key requirement for estimating the proportion of the population “at risk”. Multiple definitions of IPV exist to reflect the complexity of violence against women. This report has been able to include (as shown in Box 2.1): • Physical/sexual intimate partner violence
· by a cohabiting current or previous intimate partner; and
· by a non-cohabiting current or previous intimate partner.
• Emotional abuse by a current or previously cohabiting intimate partner.
The different aspects of intimate partner violence included in this report reflect the availability of the definitions in exposure data, notably the PSS 2012 (ABS, 2013a).
It is important to recognise that there are many overlaps between these definitions, and in some cases the proportion of overlap across a woman’s lifetime is not known (e.g. where a woman is exposed to both physical/sexual IPV by a cohabiting partner, and also from a non-cohabiting partner). At this stage, using the data in the PSS 2012, the lifetime exposure to emotional abuse by a cohabiting/non-cohabiting partner is unknown; however this highlights a key opportunity for future data collections.
2. Definitions of IPV
Box 2.1 Definitions of IPV used in this report
IPV: refers collectively to physical/sexual violence and emotional abuse by current or previously cohabiting or non-cohabiting partners.
Cohabiting IPV: refers collectively to physical/sexual violence and emotional abuse by current or previously cohabiting partners (note however, this does not apply to estimates for Indigenous Australian women, where estimates of emotional abuse were unable to be obtained).
Physical/sexual IPV: explicitly excludes emotional abuse.
Emotional abuse: explicitly excludes physical/sexual violence. In terms of estimates this refers only to emotional abuse by current—or previously—cohabiting partners.
16
ANROWS Horizons | November 2016
Examination of the burden of disease of intimate partner violence against women in 2011
3. Methods
How is burden of disease measured and interpreted?Burden of disease studies measure the combined impact of living with illness and injury (non-fatal burden) and dying prematurely (fatal burden) on a population. More than merely counting deaths and disease prevalence, it also takes into account age at death and severity of disease to count the years of healthy life lost from death and illness.
Burden of disease analysis quantifies the gap between a population’s actual health and an ideal level of health in the given year—that is, every individual living in full health for an ideal life span. This gap is measured using the disability-adjusted life year or DALY (see Box 3.1 for an example). The more DALY associated with a disease or injury, the greater the burden.
The term “disease” in this report refers to any health problem, and can include symptoms, diseases and injuries. It is used synonymously with condition, disorder or problem.
The DALY is made up of years lived with disability (non-fatal burden; YLD) and years of life lost (fatal burden; YLL): • YLD measures the proportion of healthy life lost due to
disease during a year compared to full health. Total YLD are influenced by the number of people with each disease, the time spent in less than full health and the severity for each disease. YLD are calculated from the point prevalence (the number of people with the condition on a given day) multiplied by a disability weight (which reflects the severity of the disease).
• YLL measures the years lost between the age at which a person dies against an “ideal lifespan”. Total YLL are influenced by both the total number of deaths and the ages at which those deaths occur. This ideal lifespan requires definition of an aspirational life span to be able to quantify the gap between the current mortality and the theoretical maximum lifespan (where all mortality is avoided until very old age). This is done using a standard life table—a key component of burden of disease studies.
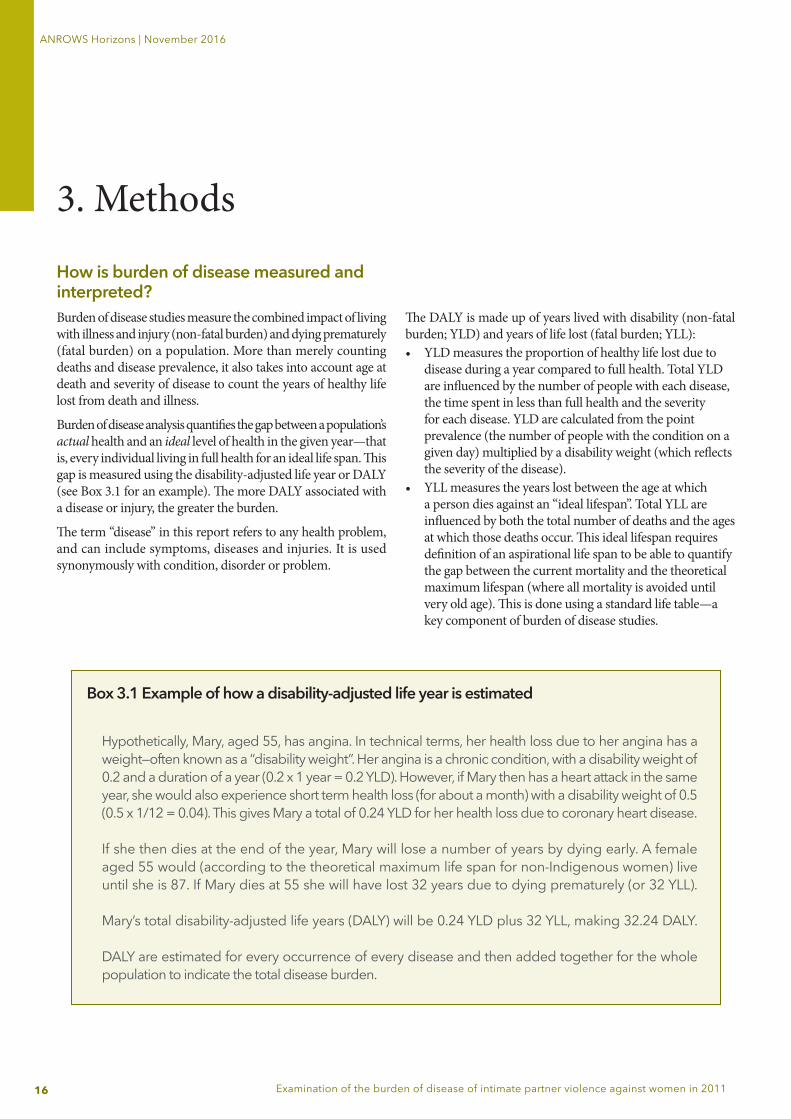
Box 3.1 Example of how a disability-adjusted life year is estimated
Hypothetically, Mary, aged 55, has angina. In technical terms, her health loss due to her angina has a weight—often known as a “disability weight”. Her angina is a chronic condition, with a disability weight of 0.2 and a duration of a year (0.2 x 1 year = 0.2 YLD). However, if Mary then has a heart attack in the same year, she would also experience short term health loss (for about a month) with a disability weight of 0.5 (0.5 x 1/12 = 0.04). This gives Mary a total of 0.24 YLD for her health loss due to coronary heart disease. If she then dies at the end of the year, Mary will lose a number of years by dying early. A female aged 55 would (according to the theoretical maximum life span for non-Indigenous women) live until she is 87. If Mary dies at 55 she will have lost 32 years due to dying prematurely (or 32 YLL). Mary’s total disability-adjusted life years (DALY) will be 0.24 YLD plus 32 YLL, making 32.24 DALY. DALY are estimated for every occurrence of every disease and then added together for the whole population to indicate the total disease burden.
17
ANROWS Horizons | November 2016
Examination of the burden of disease of intimate partner violence against women in 2011
Two diseases can have very similar DALY estimates, but the relative contribution of YLD and YLL can differ. For example anxiety is largely non-fatal, while for suicide & self-inflicted injuries the majority of burden is fatal.
Further information on the calculation of DALY, YLD and YLL for the diseases of interest in this report are found in Appendix B, and are described in the main report for ABDS 2011 (AIHW, 2016a) and the ABDS 2011 methods report (AIHW, 2016c). The key differences between the methods used to calculate attributable burden due to IPV are summarised in Box 3.2.
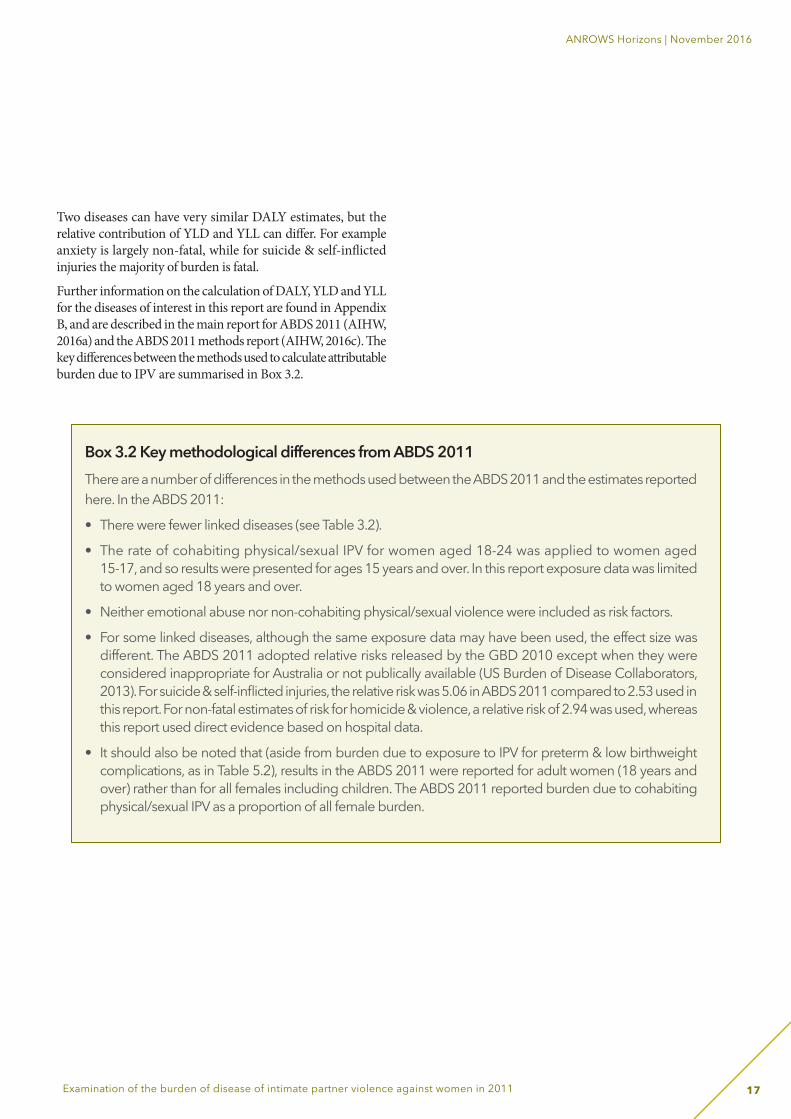
Box 3.2 Key methodological differences from ABDS 2011 There are a number of differences in the methods used between the ABDS 2011 and the estimates reportedhere. In the ABDS 2011:
• There were fewer linked diseases (see Table 3.2).
• The rate of cohabiting physical/sexual IPV for women aged 18-24 was applied to women aged 15-17, and so results were presented for ages 15 years and over. In this report exposure data was limited to women aged 18 years and over.
• Neither emotional abuse nor non-cohabiting physical/sexual violence were included as risk factors.
• For some linked diseases, although the same exposure data may have been used, the effect size was different. The ABDS 2011 adopted relative risks released by the GBD 2010 except when they were considered inappropriate for Australia or not publically available (US Burden of Disease Collaborators, 2013). For suicide & self-inflicted injuries, the relative risk was 5.06 in ABDS 2011 compared to 2.53 used in this report. For non-fatal estimates of risk for homicide & violence, a relative risk of 2.94 was used, whereas this report used direct evidence based on hospital data.
• It should also be noted that (aside from burden due to exposure to IPV for preterm & low birthweight complications, as in Table 5.2), results in the ABDS 2011 were reported for adult women (18 years and over) rather than for all females including children. The ABDS 2011 reported burden due to cohabiting physical/sexual IPV as a proportion of all female burden.
18
ANROWS Horizons | November 2016
Examination of the burden of disease of intimate partner violence against women in 2011
Comparative risk assessment methodology
Attributable burden is the reduction in burden that would have occurred if exposure to the risk factor had been avoided. For IPV, the results outlined in this report describe burden in 2011 that could have been avoided if no adult women in Australia in 2011 had been exposed to IPV during their lifetime.
Importantly, this risk factor analysis can only estimate attributable burden for diseases included in the study. Moreover, these should not be interpreted as the only diseases caused by IPV; rather, there was insufficient causal evidence in the literature of consistent associations between exposure and disease for inclusion in the study. These gaps highlight the need for further work to establish this evidence base for inclusion in future burden of disease analysis.
The comparative risk assessment (CRA) methodology was used to model the impact on health from exposure to IPV as a risk factor. This is standard practice in burden of disease risk factor analysis globally. The CRA methodology is a five-step process. In this report, the steps followed were:1. Identify risk factors and estimate the population-level
distribution of exposure to each risk factor.2. Select linked diseases. 3. Calculate the effect of risk factors on disease.4. Define the counterfactual exposure.5. Calculate the population attributable fraction.
These steps are further explored below and form the structure of this chapter.
Step 1: Estimate the population-level distribution of exposurePhysical/sexual intimate partner violenceAs part of ABDS 2011, exposure to IPV data were sourced from the PSS 2012 (ABS, 2013a). This survey provides nationally representative, high-quality data on women who reported exposure to IPV in 2012. The study sampled persons 18 years and older, but asked about IPV from 15 years onwards. There were 30,200 private dwellings included in the survey, with 17,050 persons participating nationally, in urban and non-urban areas (except very remote areas) and in all states and territories. Data were available for physical and sexual violence perpetrated by a cohabiting partner (married or de facto) and non-cohabiting partners (“boyfriend”, “girlfriend”, “ex-boyfriend”, “ex-girlfriend”, or “date”). These categories are not mutually exclusive; therefore individuals who have experienced IPV from both cohabiting and non-cohabiting partners at some point in time would fall under both categories.
One or more experiences of physical/sexual violence perpetrated by a partner were counted if they took place from the age of 15 years or more. This included assault and threat (where threat was defined as face-to-face attempt or suggestion of intent for an act that was able or likely to be carried out).
Physical violence (including physical assault and/or threat) is defined as any incident involving the occurrence, attempt or threat of physical assault experienced by a person since the age of 15 (ABS, 2013a). Examples of this can include being slapped, hit or having something thrown at the survey respondent, being pushed or shoved, being kicked, dragged or beaten up, being choked or burnt on purpose and/or being threatened with a gun, knife or other weapon. Similarly, sexual violence includes sexual assault and/or sexual threat (ABS, 2013a). This can include being physically forced, coerced or intimidated into acts of a sexual nature.
Two prevalence estimates can be derived from these data:
1. Physical/sexual IPV (cohabiting partners only, as was used by the ABDS 2011).
2. Physical/sexual IPV (cohabiting and non-cohabiting partners and dates).
19
ANROWS Horizons | November 2016
Examination of the burden of disease of intimate partner violence against women in 2011
Emotional abuse by an intimate partner (cohabitating only)The PSS 2012 also collected data on emotional abuse by a currently or previously cohabiting partner. Emotional abuse in this survey was characterised by, for example:• restriction or attempts to restrict access to family and friends,
modes of communication, food, shelter or household money;• control or attempts to control the respondent’s whereabouts;• constant insults to make the survey respondent feel ashamed,
belittled or humiliated; or• lies to children, family or friends to turn them against the
survey respondent, and threats to harm children, family or friends (ABS, 2013a).
The survey did not collect data on emotional abuse perpetrated by a non-cohabiting partner.
The prevalence data used from the PSS 2012 were obtained from the expanded Confidentialised Unit Record File (CURF) and customised data requests (ABS, Customised report, 2012).
Estimating the prevalence of IPV among Indigenous Australian womenThere is limited information and data sources available on the prevalence of IPV in the Indigenous population, as the ABS PSS 2012 did not collect data on the Indigenous status of respondents. Despite a lack of data, it is commonly understood that exposure to IPV in Indigenous women is a significant issue and can only be understood in the context of the historical, political, social and cultural environments in which it occurs (Blagg, 2008; Nancarrow, 2011).
In 2006, AIHW published a report which explored a range of data sources to assess whether they could provide information on the extent of family violence in the Indigenous population. The report found that at that time there were no national surveys that included questions corresponding closely to IPV that also sampled a sufficient number of Aboriginal and Torres Strait Islander people to produce reliable estimates (AIHW, 2006). The report also acknowledged that in addition to problems with the availability, quality and comparability of existing data, the true extent of family violence (including IPV) among Indigenous women is difficult to determine due to under-reporting by victims and lack of appropriate screening by service providers. More recently, the state of knowledge paper (Lum On et al., 2016) identified that there were notable difficulties in obtaining an estimate of the prevalence of IPV in Indigenous Australian women that used a comparable definition to that used by the PSS 2012.
Analyses of national hospitalisation data on diagnoses of assault by a partner show a much higher hospitalisation rate of assault among Indigenous women than other Australian women (AIHW, 2015). Despite this, the proportion of hospitalised assaults that are reported by Indigenous and other Australian women as perpetrated by spouse/domestic partners is similar (AIHW analyses of Steering Committee for the Review of Government Service Provision 2014, Table 4A.11.25).
This trend was also consistent with a comparison of data on self-reported physical assault from the 2008 National Aboriginal and Torres Strait Islander Social Survey (ABS, 2009) and the 2008-09 Crime Victimisation Survey (ABS, 2010). This analysis suggested that self-reported prevalence of physical assault including by a partner is much higher among Indigenous women compared to all Australian women, while the proportion of physical assaults reported as perpetrated by a partner was similar in both populations (AIHW unpublished analyses).
While not ideal, an Indigenous total population rate ratio was applied to the national prevalence estimates of IPV in this study to derive an estimate of Indigenous exposure to IPV. This rate ratio of 2.5 was based on age-standardised rates of 12-month female prevalence of physical or threatened violence victimisation from two surveys: the 2006 General Social Survey (for national estimates) and the 2008 National Aboriginal and Torres Strait Islander Social Survey (NATSISS) (for Indigenous estimates). This ratio was published in the Aboriginal and Torres Strait Islander Health Performance Framework 2014: detailed analyses report (AIHW, 2015), and was also used to calculate Indigenous estimates for IPV published in the Australian Burden of Disease Study: impact and causes of illness and death in Aboriginal and Torres Strait Islander people 2011 (AIHW, 2016b).
Exploration of data from the 2014-15 NATSISS, which included a more specific question relating to physical/threatened violence by a partner than that included in the 2008 NATSISS, resulted in rate ratios that were deemed implausibly high if applied to national exposure estimates (resulting in exposure estimates of over 100% for some age-groups). It was therefore decided to retain the 2008 NATSISS estimates described above, consistent with data used in the ABDS 2011 to produce estimates of IPV for the Aboriginal and Torres Strait Islander population.
No data sources were identified that were appropriate for estimating Indigenous exposure rates for emotional abuse. As such, the analysis in this report only includes burden due to physical/sexual IPV.
20
ANROWS Horizons | November 2016
Examination of the burden of disease of intimate partner violence against women in 2011
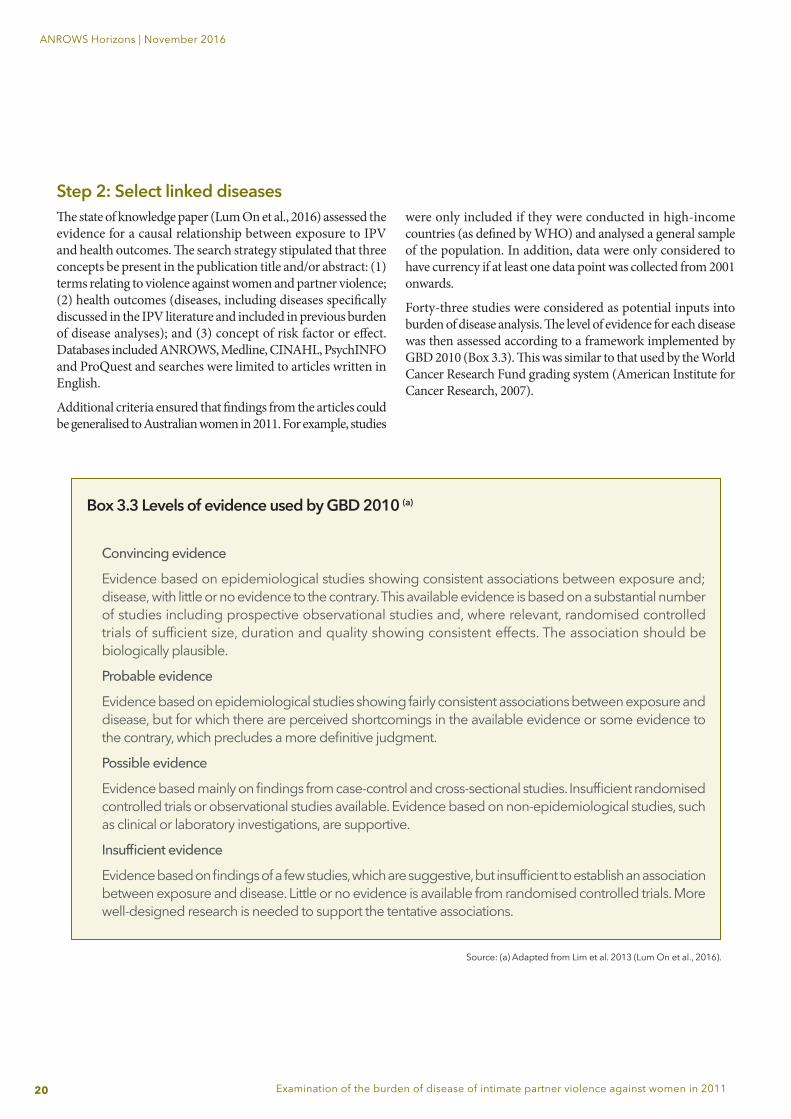
Step 2: Select linked diseasesThe state of knowledge paper (Lum On et al., 2016) assessed the evidence for a causal relationship between exposure to IPV and health outcomes. The search strategy stipulated that three concepts be present in the publication title and/or abstract: (1) terms relating to violence against women and partner violence; (2) health outcomes (diseases, including diseases specifically discussed in the IPV literature and included in previous burden of disease analyses); and (3) concept of risk factor or effect. Databases included ANROWS, Medline, CINAHL, PsychINFO and ProQuest and searches were limited to articles written in English.
Additional criteria ensured that findings from the articles could be generalised to Australian women in 2011. For example, studies
were only included if they were conducted in high-income countries (as defined by WHO) and analysed a general sample of the population. In addition, data were only considered to have currency if at least one data point was collected from 2001 onwards.
Forty-three studies were considered as potential inputs into burden of disease analysis. The level of evidence for each disease was then assessed according to a framework implemented by GBD 2010 (Box 3.3). This was similar to that used by the World Cancer Research Fund grading system (American Institute for Cancer Research, 2007).
Box 3.3 Levels of evidence used by GBD 2010 (a)
Convincing evidence
Evidence based on epidemiological studies showing consistent associations between exposure and; disease, with little or no evidence to the contrary. This available evidence is based on a substantial numberof studies including prospective observational studies and, where relevant, randomised controlled trials of sufficient size, duration and quality showing consistent effects. The association should be biologically plausible.
Probable evidence
Evidence based on epidemiological studies showing fairly consistent associations between exposure and disease, but for which there are perceived shortcomings in the available evidence or some evidence to the contrary, which precludes a more definitive judgment.
Possible evidence
Evidence based mainly on findings from case-control and cross-sectional studies. Insufficient randomised controlled trials or observational studies available. Evidence based on non-epidemiological studies, such as clinical or laboratory investigations, are supportive.
Insufficient evidence
Evidence based on findings of a few studies, which are suggestive, but insufficient to establish an association between exposure and disease. Little or no evidence is available from randomised controlled trials. More well-designed research is needed to support the tentative associations.
Source: (a) Adapted from Lim et al. 2013 (Lum On et al., 2016).
21
ANROWS Horizons | November 2016
Examination of the burden of disease of intimate partner violence against women in 2011
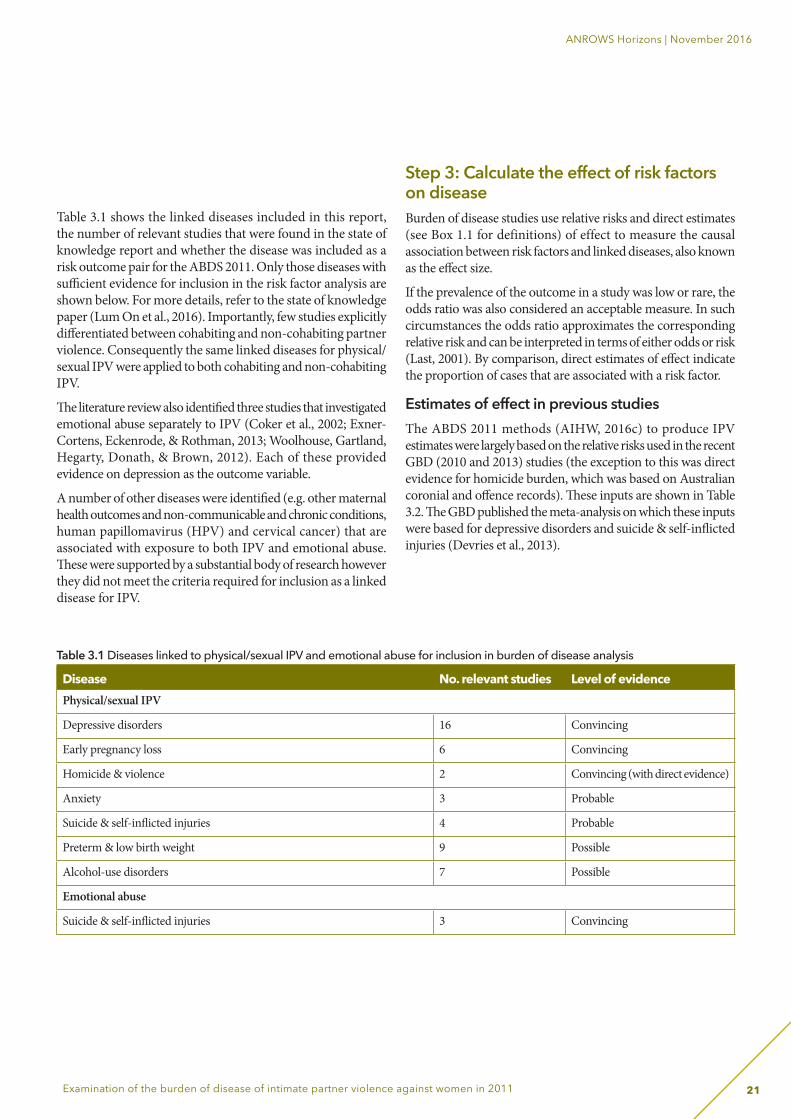
Table 3.1 shows the linked diseases included in this report, the number of relevant studies that were found in the state of knowledge report and whether the disease was included as a risk outcome pair for the ABDS 2011. Only those diseases with sufficient evidence for inclusion in the risk factor analysis are shown below. For more details, refer to the state of knowledge paper (Lum On et al., 2016). Importantly, few studies explicitly differentiated between cohabiting and non-cohabiting partner violence. Consequently the same linked diseases for physical/sexual IPV were applied to both cohabiting and non-cohabiting IPV.
The literature review also identified three studies that investigated emotional abuse separately to IPV (Coker et al., 2002; Exner-Cortens, Eckenrode, & Rothman, 2013; Woolhouse, Gartland, Hegarty, Donath, & Brown, 2012). Each of these provided evidence on depression as the outcome variable.
A number of other diseases were identified (e.g. other maternal health outcomes and non-communicable and chronic conditions, human papillomavirus (HPV) and cervical cancer) that are associated with exposure to both IPV and emotional abuse. These were supported by a substantial body of research however they did not meet the criteria required for inclusion as a linked disease for IPV.
Step 3: Calculate the effect of risk factors on disease Burden of disease studies use relative risks and direct estimates (see Box 1.1 for definitions) of effect to measure the causal association between risk factors and linked diseases, also known as the effect size.
If the prevalence of the outcome in a study was low or rare, the odds ratio was also considered an acceptable measure. In such circumstances the odds ratio approximates the corresponding relative risk and can be interpreted in terms of either odds or risk (Last, 2001). By comparison, direct estimates of effect indicate the proportion of cases that are associated with a risk factor.
Estimates of effect in previous studiesThe ABDS 2011 methods (AIHW, 2016c) to produce IPV estimates were largely based on the relative risks used in the recent GBD (2010 and 2013) studies (the exception to this was direct evidence for homicide burden, which was based on Australian coronial and offence records). These inputs are shown in Table 3.2. The GBD published the meta-analysis on which these inputs were based for depressive disorders and suicide & self-inflicted injuries (Devries et al., 2013).
Table 3.1 Diseases linked to physical/sexual IPV and emotional abuse for inclusion in burden of disease analysis
Disease No. relevant studies Level of evidencePhysical/sexual IPV
Depressive disorders 16 Convincing
Early pregnancy loss 6 Convincing
Homicide & violence 2 Convincing (with direct evidence)
Anxiety 3 Probable
Suicide & self-inflicted injuries 4 Probable
Preterm & low birth weight 9 Possible
Alcohol-use disorders 7 Possible
Emotional abuse
Suicide & self-inflicted injuries 3 Convincing
22
ANROWS Horizons | November 2016
Examination of the burden of disease of intimate partner violence against women in 2011
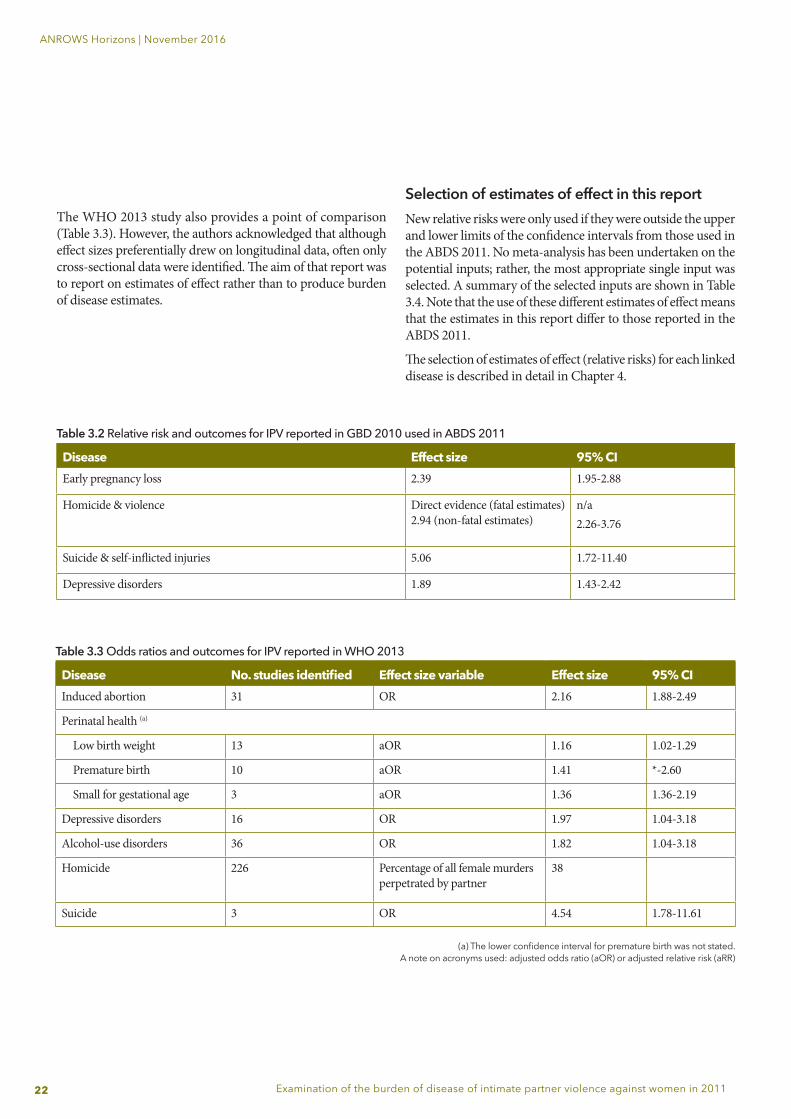
The WHO 2013 study also provides a point of comparison (Table 3.3). However, the authors acknowledged that although effect sizes preferentially drew on longitudinal data, often only cross-sectional data were identified. The aim of that report was to report on estimates of effect rather than to produce burden of disease estimates.
Table 3.2 Relative risk and outcomes for IPV reported in GBD 2010 used in ABDS 2011
Disease Effect size 95% CIEarly pregnancy loss 2.39 1.95-2.88
Homicide & violence Direct evidence (fatal estimates) 2.94 (non-fatal estimates)
n/a2.26-3.76
Suicide & self-inflicted injuries 5.06 1.72-11.40
Depressive disorders 1.89 1.43-2.42
Table 3.3 Odds ratios and outcomes for IPV reported in WHO 2013
Disease No. studies identified Effect size variable Effect size 95% CIInduced abortion 31 OR 2.16 1.88-2.49
Perinatal health (a)
Low birth weight 13 aOR 1.16 1.02-1.29
Premature birth 10 aOR 1.41 *-2.60
Small for gestational age 3 aOR 1.36 1.36-2.19
Depressive disorders 16 OR 1.97 1.04-3.18
Alcohol-use disorders 36 OR 1.82 1.04-3.18
Homicide 226 Percentage of all female murders perpetrated by partner
38
Suicide 3 OR 4.54 1.78-11.61
(a) The lower confidence interval for premature birth was not stated.A note on acronyms used: adjusted odds ratio (aOR) or adjusted relative risk (aRR)
Selection of estimates of effect in this reportNew relative risks were only used if they were outside the upper and lower limits of the confidence intervals from those used in the ABDS 2011. No meta-analysis has been undertaken on the potential inputs; rather, the most appropriate single input was selected. A summary of the selected inputs are shown in Table 3.4. Note that the use of these different estimates of effect means that the estimates in this report differ to those reported in the ABDS 2011.
The selection of estimates of effect (relative risks) for each linked disease is described in detail in Chapter 4.
23
ANROWS Horizons | November 2016
Examination of the burden of disease of intimate partner violence against women in 2011
Step 4: Theoretical minimum risk exposure
The estimated contribution of a risk factor to disease burden is calculated by comparing the observed risk factor distribution to an alternative, hypothetical scenario which represents the minimum exposure to risk that is possible (the counterfactual) (Lum On et al. 2016). The theoretical minimum risk exposure level is zero in this analysis; that is, no previous exposure to IPV.
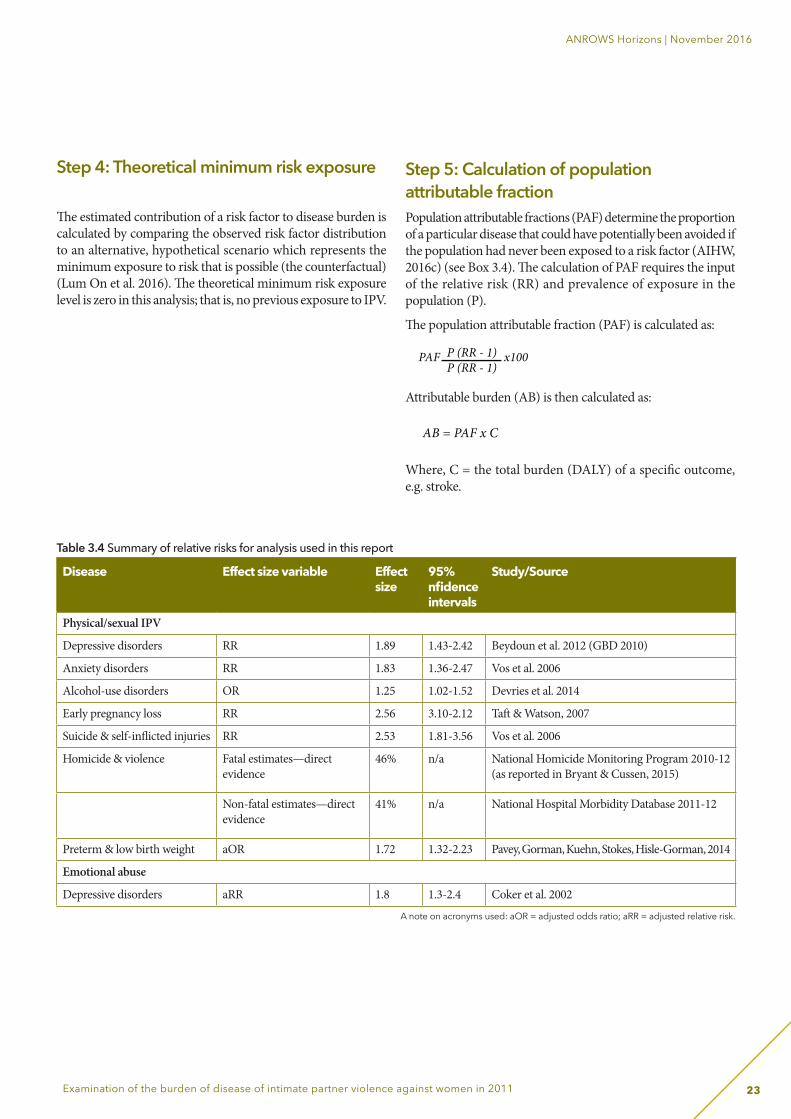
Step 5: Calculation of population attributable fractionPopulation attributable fractions (PAF) determine the proportion of a particular disease that could have potentially been avoided if the population had never been exposed to a risk factor (AIHW, 2016c) (see Box 3.4). The calculation of PAF requires the input of the relative risk (RR) and prevalence of exposure in the population (P).
The population attributable fraction (PAF) is calculated as:
Attributable burden (AB) is then calculated as:
Where, C = the total burden (DALY) of a specific outcome, e.g. stroke.
PAF x100P (RR - 1)P (RR - 1)
AB = PAF x C
0.087
PAF = P (RR - 1)P (RR - 1) +1
0.17 (1.56 -1)0.17 (1.56 -1) +1
Page 26
Page 27
PAF =
PAF =
PAF x100P (RR - 1)P (RR - 1)
AB = PAF x C
0.087
PAF = P (RR - 1)P (RR - 1) +1
0.17 (1.56 -1)0.17 (1.56 -1) +1
Page 26
Page 27
PAF =
PAF =
Table 3.4 Summary of relative risks for analysis used in this report
Disease Effect size variable Effect size
95% nfidence intervals
Study/Source
Physical/sexual IPV
Depressive disorders RR 1.89 1.43-2.42 Beydoun et al. 2012 (GBD 2010)
Anxiety disorders RR 1.83 1.36-2.47 Vos et al. 2006
Alcohol-use disorders OR 1.25 1.02-1.52 Devries et al. 2014
Early pregnancy loss RR 2.56 3.10-2.12 Taft & Watson, 2007
Suicide & self-inflicted injuries RR 2.53 1.81-3.56 Vos et al. 2006
Homicide & violence Fatal estimates—direct evidence
46% n/a National Homicide Monitoring Program 2010-12 (as reported in Bryant & Cussen, 2015)
Non-fatal estimates—direct evidence
41% n/a National Hospital Morbidity Database 2011-12
Preterm & low birth weight aOR 1.72 1.32-2.23 Pavey, Gorman, Kuehn, Stokes, Hisle-Gorman, 2014
Emotional abuse
Depressive disorders aRR 1.8 1.3-2.4 Coker et al. 2002
A note on acronyms used: aOR = adjusted odds ratio; aRR = adjusted relative risk.
24
ANROWS Horizons | November 2016
Examination of the burden of disease of intimate partner violence against women in 2011
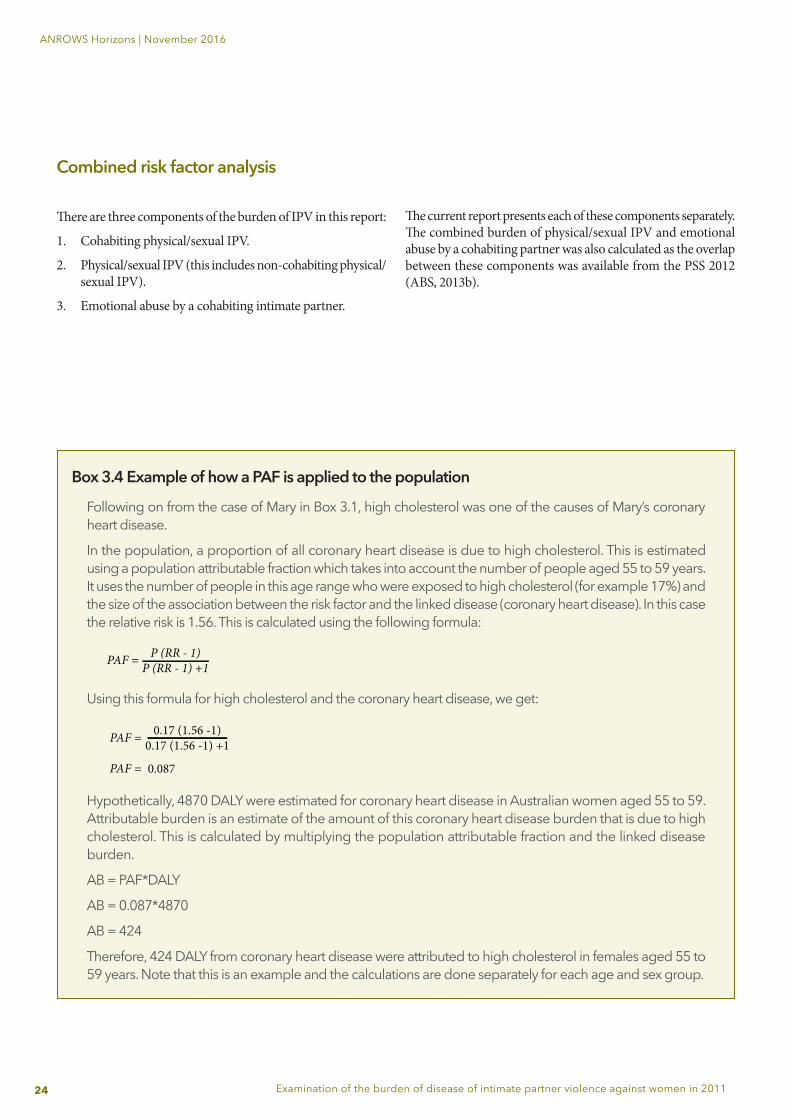
Box 3.4 Example of how a PAF is applied to the population
Following on from the case of Mary in Box 3.1, high cholesterol was one of the causes of Mary’s coronary heart disease.
In the population, a proportion of all coronary heart disease is due to high cholesterol. This is estimated using a population attributable fraction which takes into account the number of people aged 55 to 59 years. It uses the number of people in this age range who were exposed to high cholesterol (for example 17%) and the size of the association between the risk factor and the linked disease (coronary heart disease). In this case the relative risk is 1.56. This is calculated using the following formula:
Using this formula for high cholesterol and the coronary heart disease, we get:
Hypothetically, 4870 DALY were estimated for coronary heart disease in Australian women aged 55 to 59. Attributable burden is an estimate of the amount of this coronary heart disease burden that is due to high cholesterol. This is calculated by multiplying the population attributable fraction and the linked disease burden.
AB = PAF*DALY
AB = 0.087*4870
AB = 424
Therefore, 424 DALY from coronary heart disease were attributed to high cholesterol in females aged 55 to 59 years. Note that this is an example and the calculations are done separately for each age and sex group.
PAF x100P (RR - 1)P (RR - 1)
AB = PAF x C
0.087
PAF = P (RR - 1)P (RR - 1) +1
0.17 (1.56 -1)0.17 (1.56 -1) +1
Page 26
Page 27
PAF =
PAF =
PAF x100P (RR - 1)P (RR - 1)
AB = PAF x C
0.087
PAF = P (RR - 1)P (RR - 1) +1
0.17 (1.56 -1)0.17 (1.56 -1) +1
Page 26
Page 27
PAF =
PAF =
Combined risk factor analysis
There are three components of the burden of IPV in this report:
1. Cohabiting physical/sexual IPV.
2. Physical/sexual IPV (this includes non-cohabiting physical/sexual IPV).
3. Emotional abuse by a cohabiting intimate partner.
The current report presents each of these components separately. The combined burden of physical/sexual IPV and emotional abuse by a cohabiting partner was also calculated as the overlap between these components was available from the PSS 2012 (ABS, 2013b).
25
ANROWS Horizons | November 2016
Examination of the burden of disease of intimate partner violence against women in 2011
4. Detailed estimates of eff ect
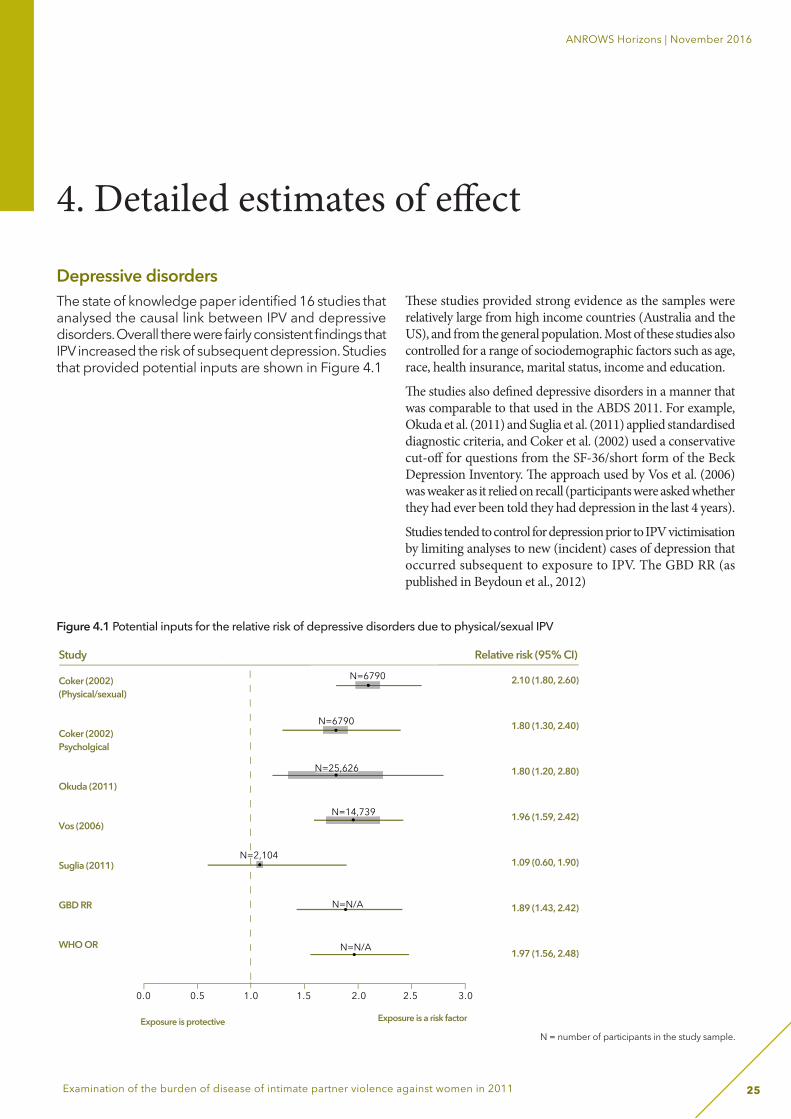
Depressive disorders The state of knowledge paper identifi ed 16 studies that analysed the causal link between IPV and depressive disorders. Overall there were fairly consistent fi ndings that IPV increased the risk of subsequent depression. Studies that provided potential inputs are shown in Figure 4.1
Th ese studies provided strong evidence as the samples were relatively large from high income countries (Australia and the US), and from the general population. Most of these studies also controlled for a range of sociodemographic factors such as age, race, health insurance, marital status, income and education.
Th e studies also defi ned depressive disorders in a manner that was comparable to that used in the ABDS 2011. For example, Okuda et al. (2011) and Suglia et al. (2011) applied standardised diagnostic criteria, and Coker et al. (2002) used a conservative cut-off for questions from the SF-36/short form of the Beck Depression Inventory. Th e approach used by Vos et al. (2006) was weaker as it relied on recall (participants were asked whether they had ever been told they had depression in the last 4 years).
Studies tended to control for depression prior to IPV victimisation by limiting analyses to new (incident) cases of depression that occurred subsequent to exposure to IPV. The GBD RR (as published in Beydoun et al., 2012)
Figure 4.1 Potential inputs for the relative risk of depressive disorders due to physical/sexual IPV
N = number of participants in the study sample.
N=N/A
N=N/A
2.10 (1.80, 2.60)
1.80 (1.30, 2.40)
1.80 (1.20, 2.80)
1.96 (1.59, 2.42)
1.09 (0.60, 1.90)
1.89 (1.43, 2.42)
1.97 (1.56, 2.48)
Exposure is protective Exposure is a risk factor
Study
N=6790
N=6790
Coker (2002)(Physical/sexual)
Coker (2002)Psycholgical
Okuda (2011)
Vos (2006)
Suglia (2011)
GBD RR
WHO OR
N=25,626
N=14,739
N=2,104
Relative risk (95% CI)
0.0 0.5 1.0 1.5 2.0 2.5 3.0
N=25,626
N=14,739
26
ANROWS Horizons | November 2016
Examination of the burden of disease of intimate partner violence against women in 2011
was chosen for use in this analysis, as it showed a clear overlap with the results from other studies.
Th ree studies were identifi ed in the state of knowledge paper that investigated emotional abuse as a risk factor for depressive disorders. However, only one of these (Coker et al., 2002) included a relative risk that could be used as an input into burden of disease analysis. Together with evidence shown in Figure 4.1 that the Coker et al. (2002) estimates for physical/sexual IPV were similar to other studies, this study was assessed as a reliable data source from which to estimate the eff ect of emotional abuse (only) on depression.
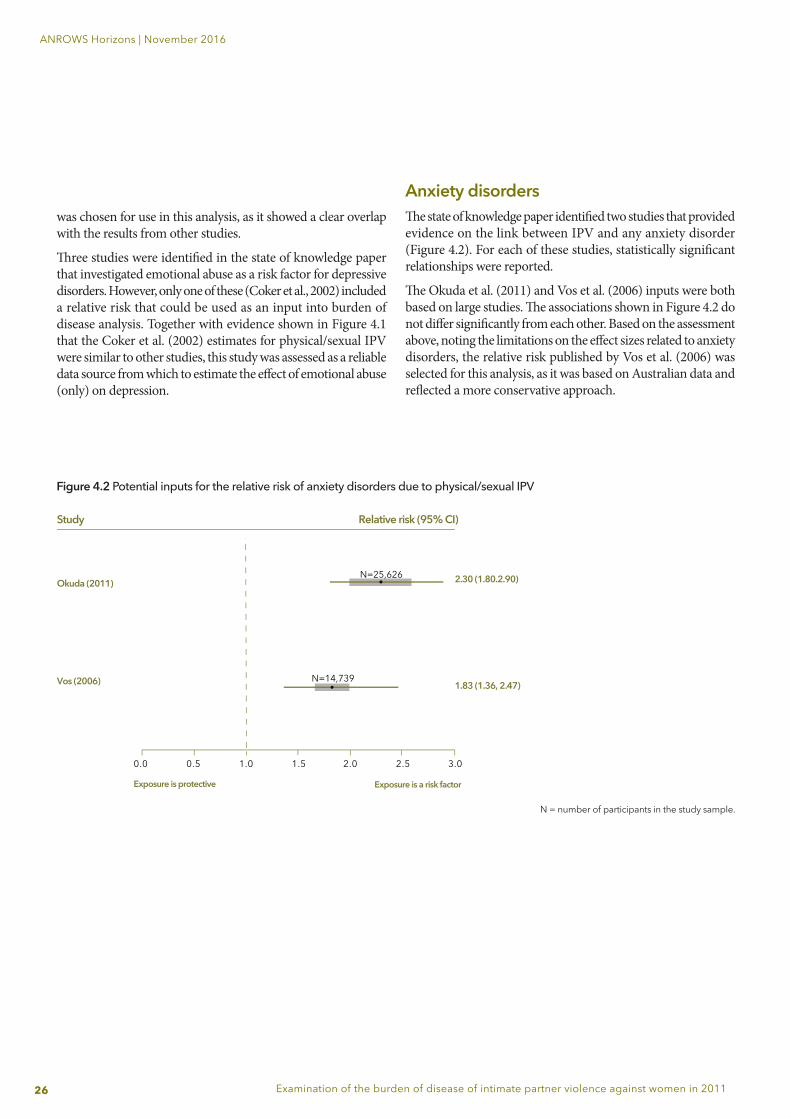
Anxiety disordersTh e state of knowledge paper identifi ed two studies that provided evidence on the link between IPV and any anxiety disorder (Figure 4.2). For each of these studies, statistically signifi cant relationships were reported.
Th e Okuda et al. (2011) and Vos et al. (2006) inputs were both based on large studies. Th e associations shown in Figure 4.2 do not diff er signifi cantly from each other. Based on the assessment above, noting the limitations on the eff ect sizes related to anxiety disorders, the relative risk published by Vos et al. (2006) was selected for this analysis, as it was based on Australian data and refl ected a more conservative approach.
N = number of participants in the study sample.
Figure 4.2 Potential inputs for the relative risk of anxiety disorders due to physical/sexual IPV
0.0 0.5 1.0 1.5 2.0 2.5 3.0
Exposure is protective Exposure is a risk factor
Study
N=25,626
N=14,739
Okuda (2011)
Vos (2006)
Relative risk (95% CI)
1.83 (1.36, 2.47)
2.30 (1.80.2.90)
27
ANROWS Horizons | November 2016
Examination of the burden of disease of intimate partner violence against women in 2011
Alcohol-use disordersAlcohol use is an important factor in the context of IPV, as suggested by a recent meta-analysis of the relationship between alcohol use and physical/sexual IPV (Devries et al., 2014). Th e literature infers that the relationship between alcohol-use disorders and IPV is bi-directional (that is, alcohol use predicts subsequent IPV and IPV predicted subsequent alcohol use) (Devries et al., 2014) and therefore it is important that studies control for previous alcohol use. Th e state of knowledge paper (Lum On et al., 2016) identifi ed seven relevant studies on the impact of IPV on alcohol-use disorders. However, the results were not consistent; three studies reported a signifi cant eff ect of IPV on subsequent alcohol-use disorders, and four studies reported non-signifi cant results. Summaries of these studies are reported in Appendix B of Lum On et al.’s (2016) paper. Ultimately the estimate of eff ect reported in the meta-analysis by Devries and colleagues (2014) (OR=1.25) was selected as it provided a conservative estimate, given the caution required for this linked disease due to inconsistency in the evidence. Th e latter meta-analysis included fi ve studies from the US and NZ, four of which controlled for baseline alcohol use.
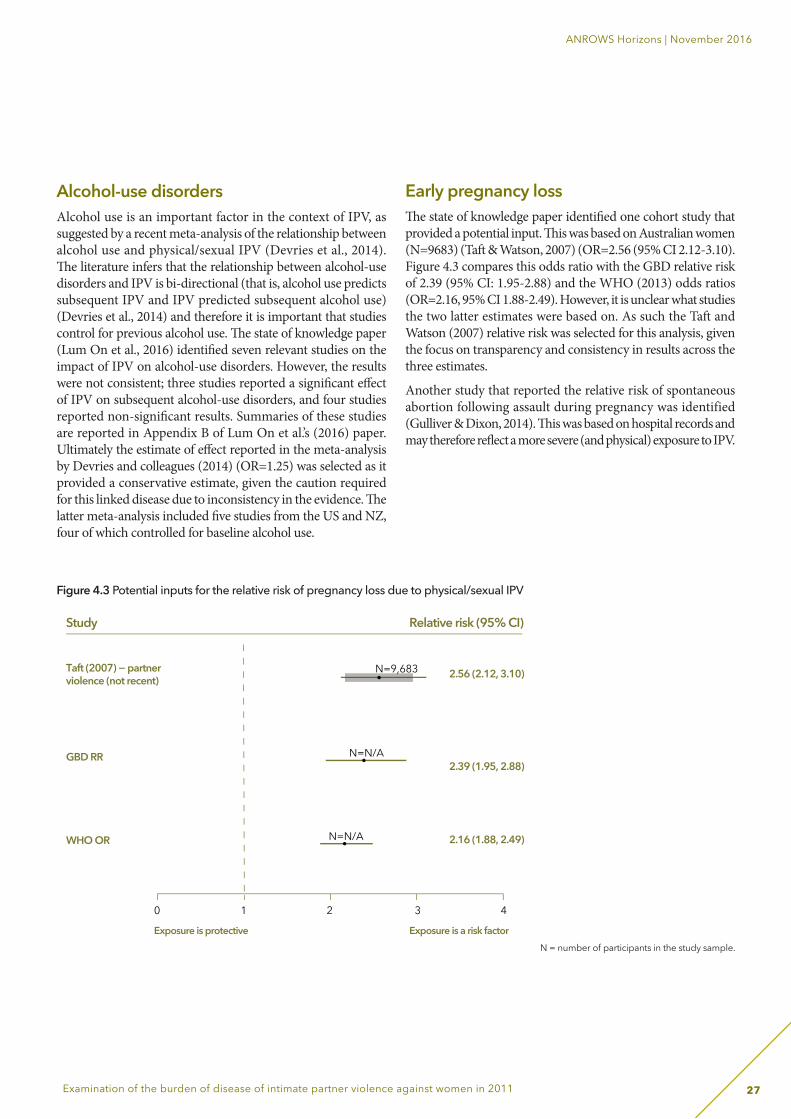
Early pregnancy loss Th e state of knowledge paper identifi ed one cohort study that provided a potential input. Th is was based on Australian women (N=9683) (Taft & Watson, 2007) (OR=2.56 (95% CI 2.12-3.10). Figure 4.3 compares this odds ratio with the GBD relative risk of 2.39 (95% CI: 1.95-2.88) and the WHO (2013) odds ratios (OR=2.16, 95% CI 1.88-2.49). However, it is unclear what studies the two latter estimates were based on. As such the Taft and Watson (2007) relative risk was selected for this analysis, given the focus on transparency and consistency in results across the three estimates.
Another study that reported the relative risk of spontaneous abortion following assault during pregnancy was identified (Gulliver & Dixon, 2014). Th is was based on hospital records and may therefore refl ect a more severe (and physical) exposure to IPV.
Figure 4.3 Potential inputs for the relative risk of pregnancy loss due to physical/sexual IPV
0 1 2 3 4
Exposure is protective Exposure is a risk factor
Study
N=9,683Taft (2007) − partnerviolence (not recent)
WHO OR
N=N/A
N=N/A
GBD RR
Relative risk (95% CI)
2.16 (1.88, 2.49)
2.56 (2.12, 3.10)
2.39 (1.95, 2.88)
N=9,683
N = number of participants in the study sample.
28
ANROWS Horizons | November 2016
Examination of the burden of disease of intimate partner violence against women in 2011
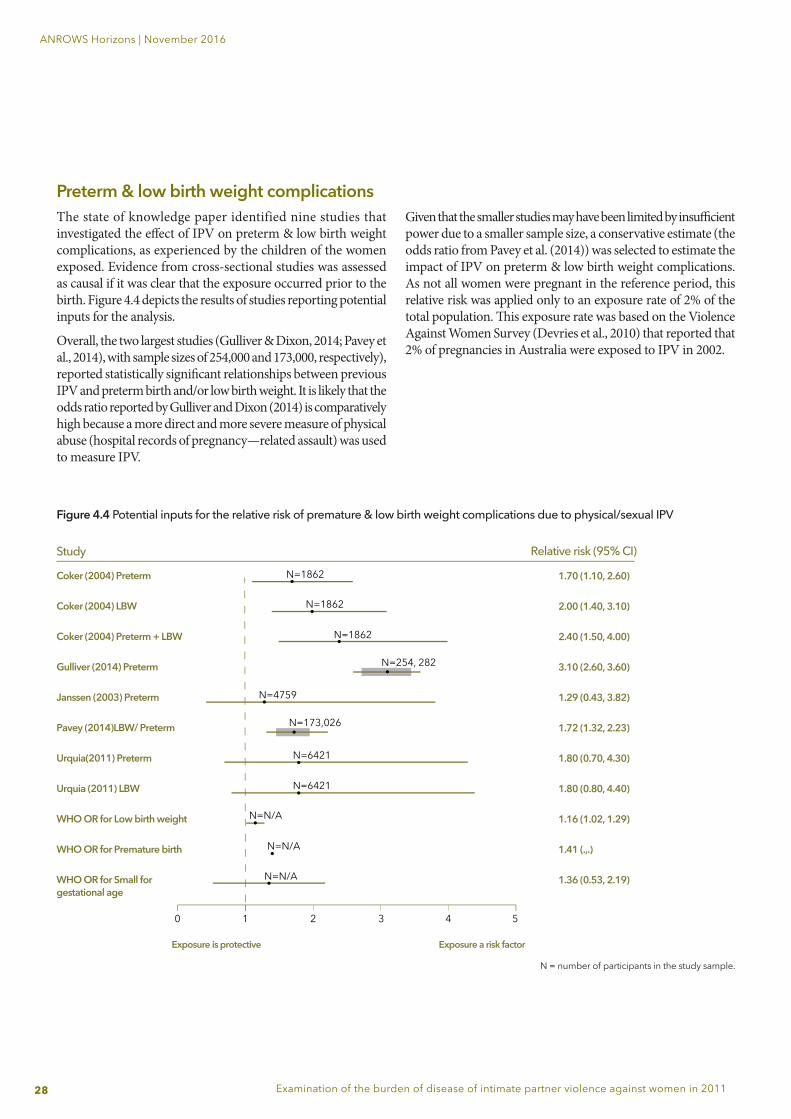
Preterm & low birth weight complicationsThe state of knowledge paper identified nine studies that investigated the eff ect of IPV on preterm & low birth weight complications, as experienced by the children of the women exposed. Evidence from cross-sectional studies was assessed as causal if it was clear that the exposure occurred prior to the birth. Figure 4.4 depicts the results of studies reporting potential inputs for the analysis.
Overall, the two largest studies (Gulliver & Dixon, 2014; Pavey et al., 2014), with sample sizes of 254,000 and 173,000, respectively), reported statistically signifi cant relationships between previous IPV and preterm birth and/or low birth weight. It is likely that the odds ratio reported by Gulliver and Dixon (2014) is comparatively high because a more direct and more severe measure of physical abuse (hospital records of pregnancy—related assault) was used to measure IPV.
Given that the smaller studies may have been limited by insuffi cient power due to a smaller sample size, a conservative estimate (the odds ratio from Pavey et al. (2014)) was selected to estimate the impact of IPV on preterm & low birth weight complications. As not all women were pregnant in the reference period, this relative risk was applied only to an exposure rate of 2% of the total population. Th is exposure rate was based on the Violence Against Women Survey (Devries et al., 2010) that reported that 2% of pregnancies in Australia were exposed to IPV in 2002.
Figure 4.4 Potential inputs for the relative risk of premature & low birth weight complications due to physical/sexual IPV
Exposure is protective Exposure a risk factor
Study
N=1862
N=1862
N=1862
Coker (2004) Preterm
Coker (2004) LBW
Coker (2004) Preterm + LBW
Gulliver (2014) Preterm
Janssen (2003) Preterm
Pavey (2014)LBW/ Preterm
Urquia(2011) Preterm
Urquia (2011) LBW
WHO OR for Low birth weight
WHO OR for Premature birth
WHO OR for Small for gestational age
N=4759
N=254, 282
N=173,026
N=6421
Relative risk (95% CI)
N=6421
N=N/A
N=N/A
N=N/A
1.70 (1.10, 2.60)
2.00 (1.40, 3.10)
2.40 (1.50, 4.00)
3.10 (2.60, 3.60)
1.29 (0.43, 3.82)
1.72 (1.32, 2.23)
1.80 (0.70, 4.30)
1.80 (0.80, 4.40)
1.16 (1.02, 1.29)
1.41 (.,.)
1.36 (0.53, 2.19)
0 1 2 3 4 5
N = number of participants in the study sample.
29
ANROWS Horizons | November 2016
Examination of the burden of disease of intimate partner violence against women in 2011
Suicide & self-inflicted injuries The evidence for an effect of IPV on suicide & self-inflicted injuries was less consistent. The selection of the most appropriate input was limited by the fact that in the meta-analyses that informed the GBD (as reported by Devries et al. (2013) and WHO (2013)), estimates of effect were both based on three studies with inconsistent results. Two of these studies indicated little or no effect of IPV on suicide attempts (Ackard, Eisenberg, & Neumark-Sztainer, 2007; Roberts, Klein, & Fisher, 2003), whilst the third study estimated a large effect (OR=7.97, 95% CI: 1.75-36.37) (Chowdhary & Patel, 2008). The latter would not have met criteria for inclusion as participants were recruited from India, thereby reducing the usefulness of these meta-analyses for this study. Therefore the estimates used by WHO and GBD were considered less appropriate for use in the current study as the relative risks were heavily influenced by the results by Chowdhary and Patel (2008).
The remaining studies identified by the state of knowledge paper also indicated inconsistent results. The longitudinal studies by Van Dulmen et al. (2012), Ackard et al. (2007) and Exner-Cortens et al. (2013) reported no significant effect when controlling for baseline suicide attempts. However, these studies also had limitations. In regards to the Van Dulmen et al. (2012) study, it is possible that some respondents had experienced IPV at baseline (although not in the previous 12 months), obscuring this measure of the long-term effect of IPV on risk of attempted suicide, particularly given the long (6-year) follow up time. The remaining two longitudinal studies were based on IPV exposure as adolescents; again this may have obscured the effect of IPV, given that fewer people in this age category would have experience of intimate relationships.
Lastly, two data sources reported similar results. Vos et al. (2006) found a significant effect of IPV on deliberate self-harm, reporting an adjusted relative risk of 2.53 (95% CI: 1.81-3.56). When the PSS 2012 exposure data were applied to this relative risk, it was estimated that around 21% of the burden of suicide & self-inflicted injuries could be attributed to cohabiting IPV, rising to 28% if non-cohabiting IPV was also included. This is similar to findings reported by the US Centers for Disease Control and Prevention analysis of the National Violent Death Reporting System (NVDRS), which reports on fatal suicides from 16 states in the US. In 2005, results indicated that 26.1% of female suicides listed “intimate partner problems in the previous two weeks” (noting that this is not specifically violence) as a precipitating factor (Karch, Lubell, Friday, Patel, & Williams, 2008), and a similar proportion was also reported for 2012 (25.5%; Karch, Logan, McDaniel, Parks, & Patel, 2012). Again, given the inconsistency of the evidence in the literature, the results from the Vos et al. (2006) study were selected for inclusion in this analysis as they provided a more conservative estimate than the GBD relative risk.
Table 4.1 Proportion (%) of homicides for which the perpetrator was an intimate partner
2003(a) 2011(b)
National 52% 46%
Indigenous 59% 65%
Source: National Homicide Monitoring Program
(a) The Indigenous 2003 results were based on 2006-07 data as this was not available for 2003.(b) Results were based on 2010-12 data
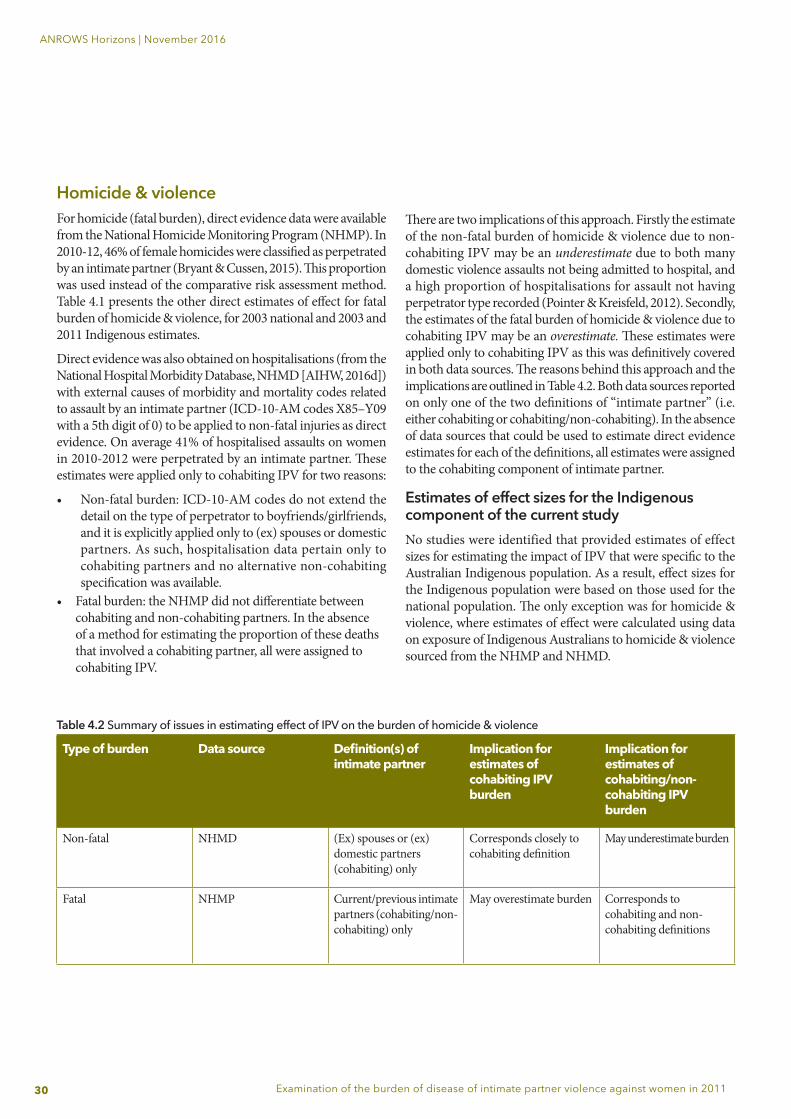
30
ANROWS Horizons | November 2016
Examination of the burden of disease of intimate partner violence against women in 2011
Homicide & violenceFor homicide (fatal burden), direct evidence data were available from the National Homicide Monitoring Program (NHMP). In 2010-12, 46% of female homicides were classified as perpetrated by an intimate partner (Bryant & Cussen, 2015). This proportion was used instead of the comparative risk assessment method. Table 4.1 presents the other direct estimates of effect for fatal burden of homicide & violence, for 2003 national and 2003 and 2011 Indigenous estimates.
Direct evidence was also obtained on hospitalisations (from the National Hospital Morbidity Database, NHMD [AIHW, 2016d]) with external causes of morbidity and mortality codes related to assault by an intimate partner (ICD-10-AM codes X85–Y09 with a 5th digit of 0) to be applied to non-fatal injuries as direct evidence. On average 41% of hospitalised assaults on women in 2010-2012 were perpetrated by an intimate partner. These estimates were applied only to cohabiting IPV for two reasons:
• Non-fatal burden: ICD-10-AM codes do not extend the detail on the type of perpetrator to boyfriends/girlfriends, and it is explicitly applied only to (ex) spouses or domestic partners. As such, hospitalisation data pertain only to cohabiting partners and no alternative non-cohabiting specification was available.
• Fatal burden: the NHMP did not differentiate between cohabiting and non-cohabiting partners. In the absence of a method for estimating the proportion of these deaths that involved a cohabiting partner, all were assigned to cohabiting IPV.
There are two implications of this approach. Firstly the estimate of the non-fatal burden of homicide & violence due to non-cohabiting IPV may be an underestimate due to both many domestic violence assaults not being admitted to hospital, and a high proportion of hospitalisations for assault not having perpetrator type recorded (Pointer & Kreisfeld, 2012). Secondly, the estimates of the fatal burden of homicide & violence due to cohabiting IPV may be an overestimate. These estimates were applied only to cohabiting IPV as this was definitively covered in both data sources. The reasons behind this approach and the implications are outlined in Table 4.2. Both data sources reported on only one of the two definitions of “intimate partner” (i.e. either cohabiting or cohabiting/non-cohabiting). In the absence of data sources that could be used to estimate direct evidence estimates for each of the definitions, all estimates were assigned to the cohabiting component of intimate partner.
Estimates of effect sizes for the Indigenous component of the current studyNo studies were identified that provided estimates of effect sizes for estimating the impact of IPV that were specific to the Australian Indigenous population. As a result, effect sizes for the Indigenous population were based on those used for the national population. The only exception was for homicide & violence, where estimates of effect were calculated using data on exposure of Indigenous Australians to homicide & violence sourced from the NHMP and NHMD.
Table 4.2 Summary of issues in estimating effect of IPV on the burden of homicide & violence
Type of burden Data source Definition(s) of intimate partner
Implication for estimates of cohabiting IPV burden
Implication for estimates of cohabiting/non-cohabiting IPV burden
Non-fatal NHMD (Ex) spouses or (ex) domestic partners (cohabiting) only
Corresponds closely to cohabiting definition
May underestimate burden
Fatal NHMP Current/previous intimate partners (cohabiting/non-cohabiting) only
May overestimate burden Corresponds to cohabiting and non-cohabiting definitions
31
ANROWS Horizons | November 2016
Examination of the burden of disease of intimate partner violence against women in 2011
5. FindingsThere are five sections to the findings, largely structured according to the definitions of IPV included in this report:• Section 1 covers the burden of cohabiting IPV
(physical/sexual IPV and emotional abuse).• Section 2 includes the broader definition of burden
of physical/sexual IPV (inclusive of both cohabiting/non-cohabiting partners).
• Section 3 shows how these two definitions can be interpreted together, noting that they cannot be simply added together given their overlaps.
• Section 4 relates to the attributable burden of IPV in Aboriginal and Torres Strait Islander women (as outlined in Chapter 3 under “Estimate the population-level distribution of exposure”, the available data does not include emotional abuse).
• Section 5 provides some results on changes in the burden of IPV between 2003 and 2011.
Unless otherwise specified, all results are specific to adult women aged over 18 years. See Appendix B for results specific to women aged 18-44 years as reported in the Compass paper (Webster, 2016).
Note also that the burden of preterm & low birth weight complications attributable to physical/sexual IPV exposure in infants is reported separately, as this burden also occurs in males.
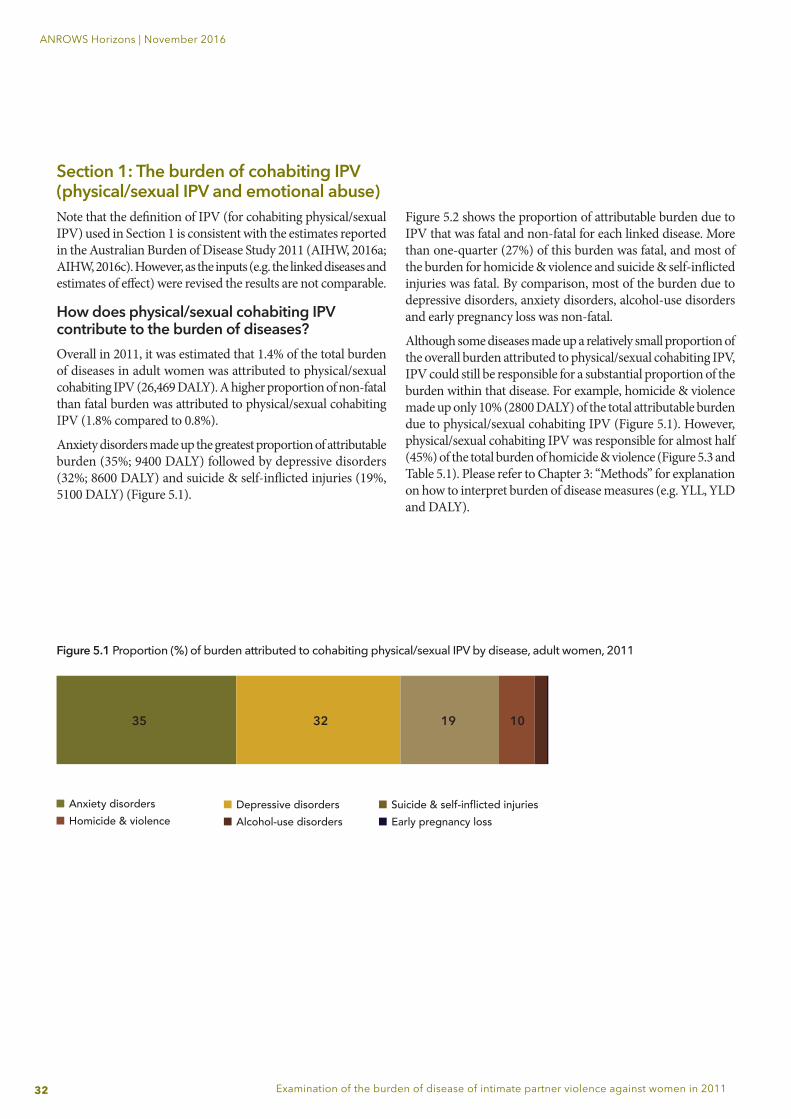
32
ANROWS Horizons | November 2016
Examination of the burden of disease of intimate partner violence against women in 2011
Figure 5.2 shows the proportion of attributable burden due to IPV that was fatal and non-fatal for each linked disease. More than one-quarter (27%) of this burden was fatal, and most of the burden for homicide & violence and suicide & self-infl icted injuries was fatal. By comparison, most of the burden due to depressive disorders, anxiety disorders, alcohol-use disorders and early pregnancy loss was non-fatal.
Although some diseases made up a relatively small proportion of the overall burden attributed to physical/sexual cohabiting IPV, IPV could still be responsible for a substantial proportion of the burden within that disease. For example, homicide & violence made up only 10% (2800 DALY) of the total attributable burden due to physical/sexual cohabiting IPV (Figure 5.1). However, physical/sexual cohabiting IPV was responsible for almost half (45%) of the total burden of homicide & violence (Figure 5.3 and Table 5.1). Please refer to Chapter 3: “Methods” for explanation on how to interpret burden of disease measures (e.g. YLL, YLD and DALY).
Section 1: The burden of cohabiting IPV (physical/sexual IPV and emotional abuse)Note that the defi nition of IPV (for cohabiting physical/sexual IPV) used in Section 1 is consistent with the estimates reported in the Australian Burden of Disease Study 2011 (AIHW, 2016a; AIHW, 2016c). However, as the inputs (e.g. the linked diseases and estimates of eff ect) were revised the results are not comparable.
How does physical/sexual cohabiting IPV contribute to the burden of diseases?Overall in 2011, it was estimated that 1.4% of the total burden of diseases in adult women was attributed to physical/sexual cohabiting IPV (26,469 DALY). A higher proportion of non-fatal than fatal burden was attributed to physical/sexual cohabiting IPV (1.8% compared to 0.8%).
Anxiety disorders made up the greatest proportion of attributable burden (35%; 9400 DALY) followed by depressive disorders (32%; 8600 DALY) and suicide & self-infl icted injuries (19%, 5100 DALY) (Figure 5.1).
Anxiety disordersHomicide & violence
Depressive disordersAlcohol-use disorders
Suicide & self-inflicted injuriesEarly pregnancy loss
32 19 1035
Figure 5.1 Proportion (%) of burden attributed to cohabiting physical/sexual IPV by disease, adult women, 2011
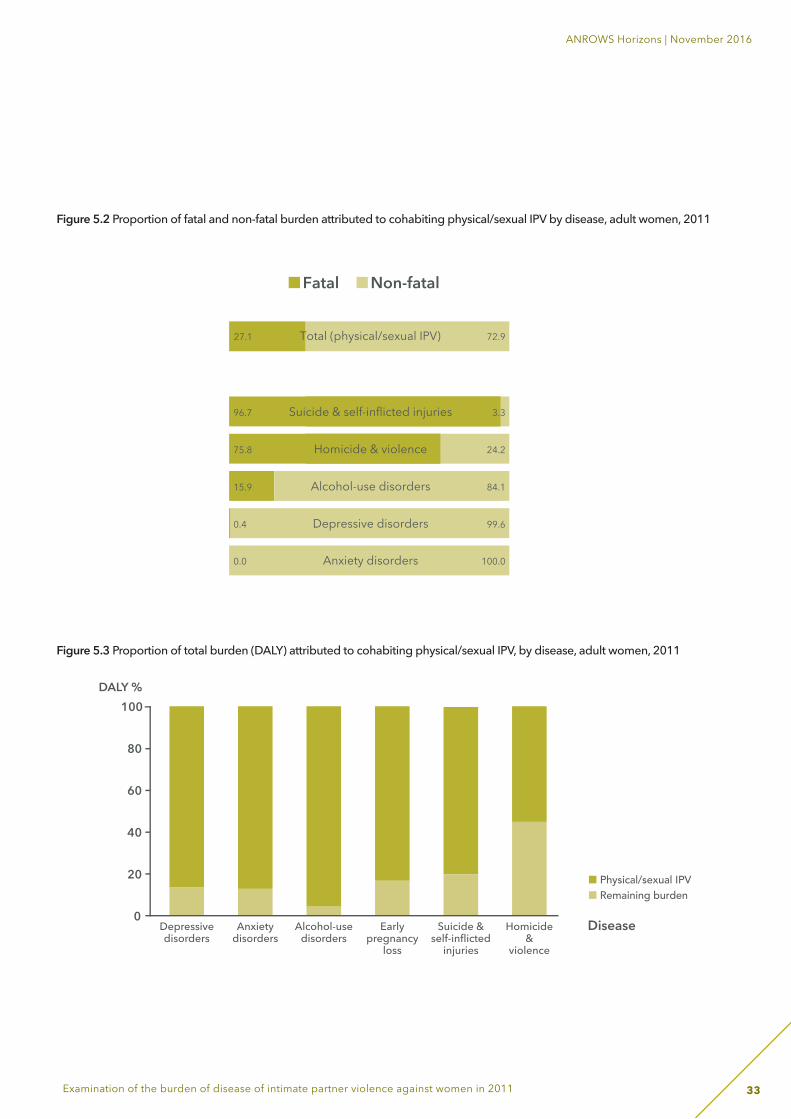
33
ANROWS Horizons | November 2016
Examination of the burden of disease of intimate partner violence against women in 2011
Figure 5.2 Proportion of fatal and non-fatal burden attributed to cohabiting physical/sexual IPV by disease, adult women, 2011
Fatal Non-fatal
27.1 72.9Total (physical/sexual IPV)
96.7 3.3Suicide & self-inflicted injuries
75.8 24.2Homicide & violence
15.9 84.1Alcohol-use disorders
0.4 99.6Depressive disorders
0.0 100.0Anxiety disorders
0.0 100.0Early pregnancy loss
100
80
60
40
20
0Depressivedisorders
Anxietydisorders
Alcohol-usedisorders
Earlypregnancy
loss
Suicide &self-inflicted
injuries
Homicide&
violence
DALY %
Disease
Physical/sexual IPVRemaining burden
Figure 5.3 Proportion of total burden (DALY) attributed to cohabiting physical/sexual IPV, by disease, adult women, 2011
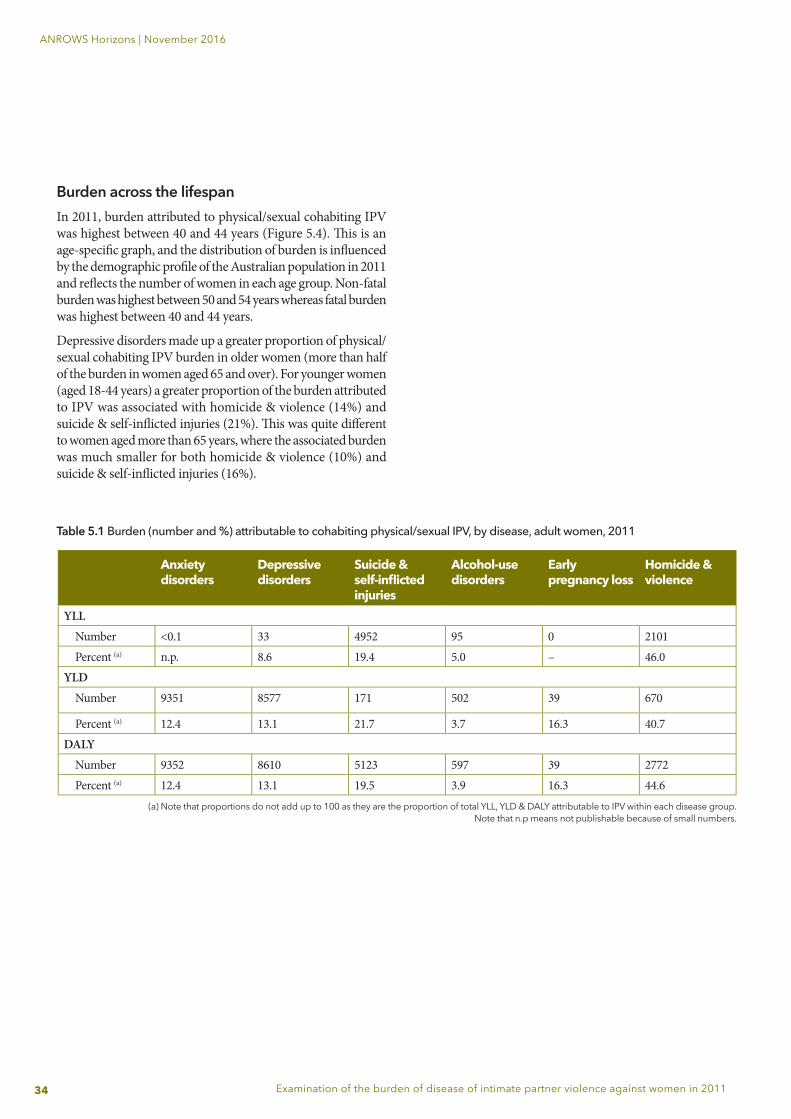
34
ANROWS Horizons | November 2016
Examination of the burden of disease of intimate partner violence against women in 2011
Burden across the lifespanIn 2011, burden attributed to physical/sexual cohabiting IPV was highest between 40 and 44 years (Figure 5.4). Th is is an age-specifi c graph, and the distribution of burden is infl uenced by the demographic profi le of the Australian population in 2011 and refl ects the number of women in each age group. Non-fatal burden was highest between 50 and 54 years whereas fatal burden was highest between 40 and 44 years.
Depressive disorders made up a greater proportion of physical/sexual cohabiting IPV burden in older women (more than half of the burden in women aged 65 and over). For younger women (aged 18-44 years) a greater proportion of the burden attributed to IPV was associated with homicide & violence (14%) and suicide & self-infl icted injuries (21%). Th is was quite diff erent to women aged more than 65 years, where the associated burden was much smaller for both homicide & violence (10%) and suicide & self-infl icted injuries (16%).
Table 5.1 Burden (number and %) attributable to cohabiting physical/sexual IPV, by disease, adult women, 2011
Anxiety disorders
Depressive disorders
Suicide & self-infl icted injuries
Alcohol-use disorders
Early pregnancy loss
Homicide & violence
YLLNumber <0.1 33 4952 95 0 2101Percent (a) n.p. 8.6 19.4 5.0 – 46.0
YLDNumber 9351 8577 171 502 39 670
Percent (a) 12.4 13.1 21.7 3.7 16.3 40.7DALY
Number 9352 8610 5123 597 39 2772Percent (a) 12.4 13.1 19.5 3.9 16.3 44.6
(a) Note that proportions do not add up to 100 as they are the proportion of total YLL, YLD & DALY attributable to IPV within each disease group.Note that n.p means not publishable because of small numbers.
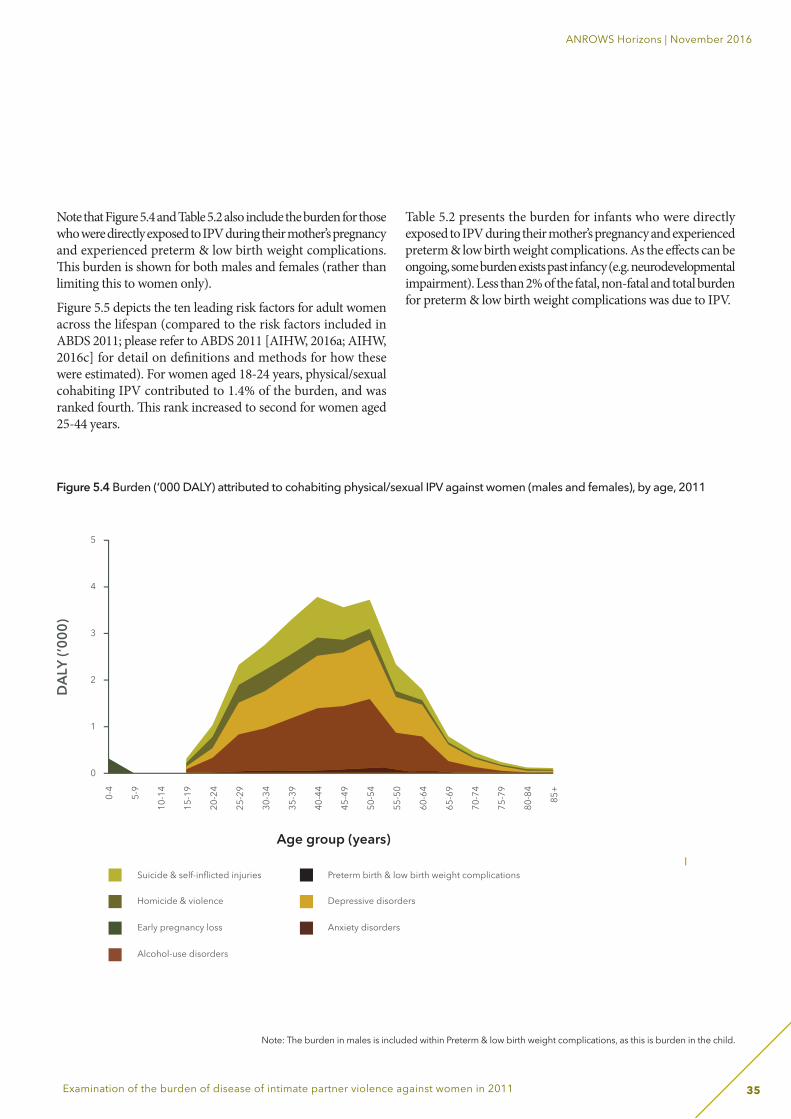
35
ANROWS Horizons | November 2016
Examination of the burden of disease of intimate partner violence against women in 2011
Note that Figure 5.4 and Table 5.2 also include the burden for those who were directly exposed to IPV during their mother’s pregnancy and experienced preterm & low birth weight complications. Th is burden is shown for both males and females (rather than limiting this to women only).
Figure 5.5 depicts the ten leading risk factors for adult women across the lifespan (compared to the risk factors included in ABDS 2011; please refer to ABDS 2011 [AIHW, 2016a; AIHW, 2016c] for detail on defi nitions and methods for how these were estimated). For women aged 18-24 years, physical/sexual cohabiting IPV contributed to 1.4% of the burden, and was ranked fourth. Th is rank increased to second for women aged 25-44 years.
Table 5.2 presents the burden for infants who were directly exposed to IPV during their mother’s pregnancy and experienced preterm & low birth weight complications. As the eff ects can be ongoing, some burden exists past infancy (e.g. neurodevelopmental impairment). Less than 2% of the fatal, non-fatal and total burden for preterm & low birth weight complications was due to IPV.
60-6
4
65-6
9
70-7
4
75-7
9
80-8
4
85+
t complications
60-6
4
65-6
9
70-7
4
75-7
9
80-8
4
85+
t complications
0-4
5-9
10-1
4
15-1
9
20-2
4
25-2
9
30-3
4
35-3
9
40-4
4
45-4
9
50-5
4
55-5
0
60-6
4
65-6
9
70-7
4
75-7
9
80-8
4
85+
5
4
3
2
1
0
Suicide & self-inflicted injuries
Homicide & violence
Early pregnancy loss
Alcohol-use disorders
Preterm birth & low birth weight complications
Depressive disorders
Anxiety disorders
Age group (years)
DAL
Y (’0
00)
Figure 5.4 Burden (‘000 DALY) attributed to cohabiting physical/sexual IPV against women (males and females), by age, 2011
Note: The burden in males is included within Preterm & low birth weight complications, as this is burden in the child.
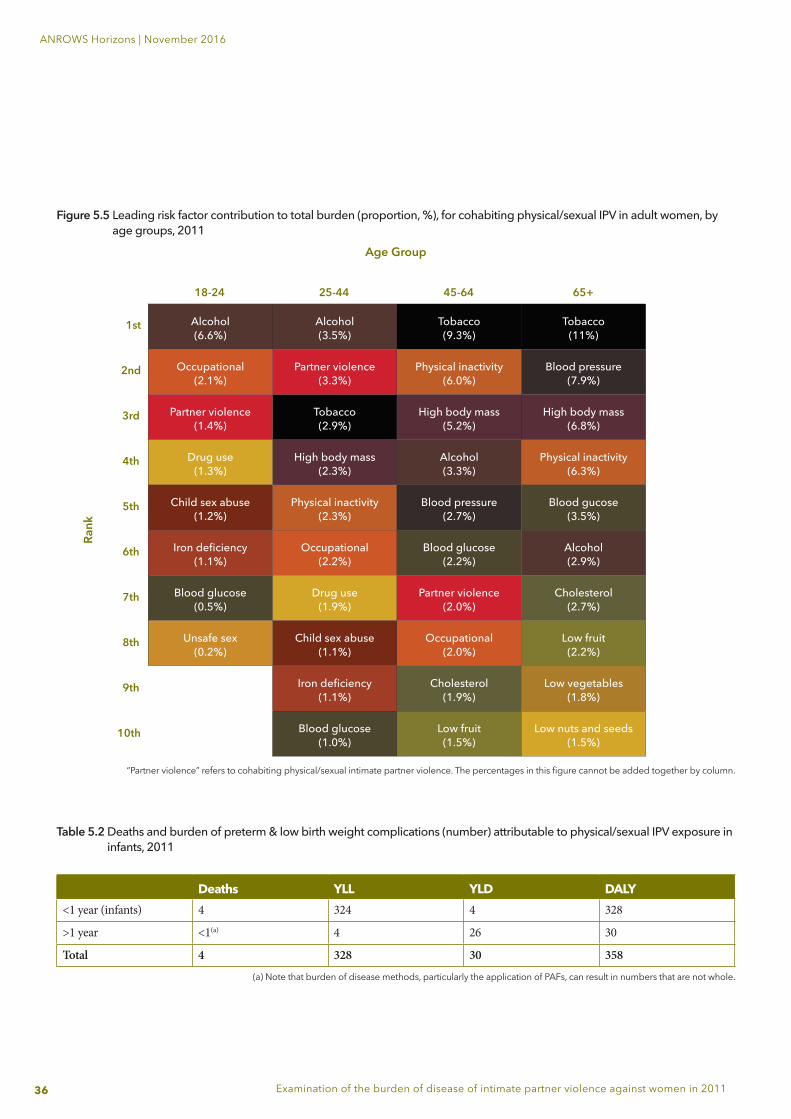
36
ANROWS Horizons | November 2016
Examination of the burden of disease of intimate partner violence against women in 2011
Figure 5.5 Leading risk factor contribution to total burden (proportion, %), for cohabiting physical/sexual IPV in adult women, by age groups, 2011
“Partner violence” refers to cohabiting physical/sexual intimate partner violence. The percentages in this figure cannot be added together by column.
Table 5.2 Deaths and burden of preterm & low birth weight complications (number) attributable to physical/sexual IPV exposure in infants, 2011
Deaths YLL YLD DALY<1 year (infants) 4 324 4 328
>1 year <1(a) 4 26 30
Total 4 328 30 358
(a) Note that burden of disease methods, particularly the application of PAFs, can result in numbers that are not whole.
Age Group
Rank
18-24
1st
2nd
3rd
4th
5th
6th
7th
8th
9th
10th
25-44 45-64 65+
Alcohol(6.6%)
Alcohol(3.5%)
Tobacco(9.3%)
Tobacco(11%)
Occupational(2.1%)
Partner violence(3.3%)
Physical inactivity(6.0%)
Blood pressure(7.9%)
Partner violence(1.4%)
Tobacco(2.9%)
High body mass(5.2%)
High body mass(6.8%)
Drug use(1.3%)
High body mass(2.3%)
Alcohol(3.3%)
Physical inactivity(6.3%)
Child sex abuse(1.2%)
Physical inactivity(2.3%)
Blood pressure(2.7%)
Blood gucose(3.5%)
Iron deficiency(1.1%)
Occupational(2.2%)
Blood glucose(2.2%)
Alcohol(2.9%)
Blood glucose(0.5%)
Drug use(1.9%)
Partner violence(2.0%)
Cholesterol(2.7%)
Unsafe sex(0.2%)
Child sex abuse(1.1%)
Occupational(2.0%)
Low fruit(2.2%)
Iron deficiency(1.1%)
Cholesterol(1.9%)
Low vegetables(1.8%)
Blood glucose(1.0%)
Low fruit(1.5%)
Low nuts and seeds(1.5%)
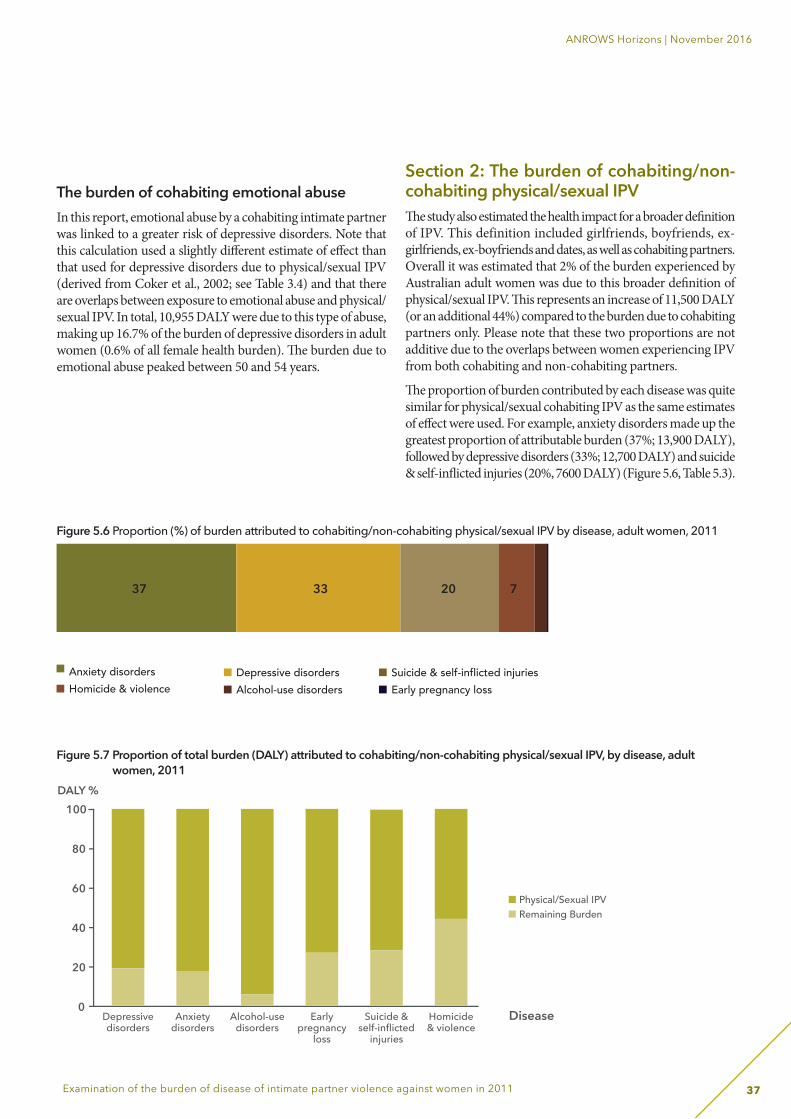
37
ANROWS Horizons | November 2016
Examination of the burden of disease of intimate partner violence against women in 2011
The burden of cohabiting emotional abuse In this report, emotional abuse by a cohabiting intimate partner was linked to a greater risk of depressive disorders. Note that this calculation used a slightly diff erent estimate of eff ect than that used for depressive disorders due to physical/sexual IPV (derived from Coker et al., 2002; see Table 3.4) and that there are overlaps between exposure to emotional abuse and physical/sexual IPV. In total, 10,955 DALY were due to this type of abuse, making up 16.7% of the burden of depressive disorders in adult women (0.6% of all female health burden). Th e burden due to emotional abuse peaked between 50 and 54 years.
Section 2: The burden of cohabiting/non-cohabiting physical/sexual IPVTh e study also estimated the health impact for a broader defi nition of IPV. This definition included girlfriends, boyfriends, ex-girlfriends, ex-boyfriends and dates, as well as cohabiting partners. Overall it was estimated that 2% of the burden experienced by Australian adult women was due to this broader defi nition of physical/sexual IPV. Th is represents an increase of 11,500 DALY (or an additional 44%) compared to the burden due to cohabiting partners only. Please note that these two proportions are not additive due to the overlaps between women experiencing IPV from both cohabiting and non-cohabiting partners.
Th e proportion of burden contributed by each disease was quite similar for physical/sexual cohabiting IPV as the same estimates of eff ect were used. For example, anxiety disorders made up the greatest proportion of attributable burden (37%; 13,900 DALY), followed by depressive disorders (33%; 12,700 DALY) and suicide & self-infl icted injuries (20%, 7600 DALY) (Figure 5.6, Table 5.3).
Figure 5.6 Proportion (%) of burden attributed to cohabiting/non-cohabiting physical/sexual IPV by disease, adult women, 2011
Anxiety disordersHomicide & violence
Depressive disordersAlcohol-use disorders
Suicide & self-inflicted injuriesEarly pregnancy loss
33 20 737
Figure 5.7 Proportion of total burden (DALY) attributed to cohabiting/non-cohabiting physical/sexual IPV, by disease, adult women, 2011
100
80
60
40
20
0Depressivedisorders
Anxietydisorders
Alcohol-usedisorders
Earlypregnancy
loss
Suicide &self-inflicted
injuries
Homicide& violence
DALY %
Disease
Physical/Sexual IPVRemaining Burden
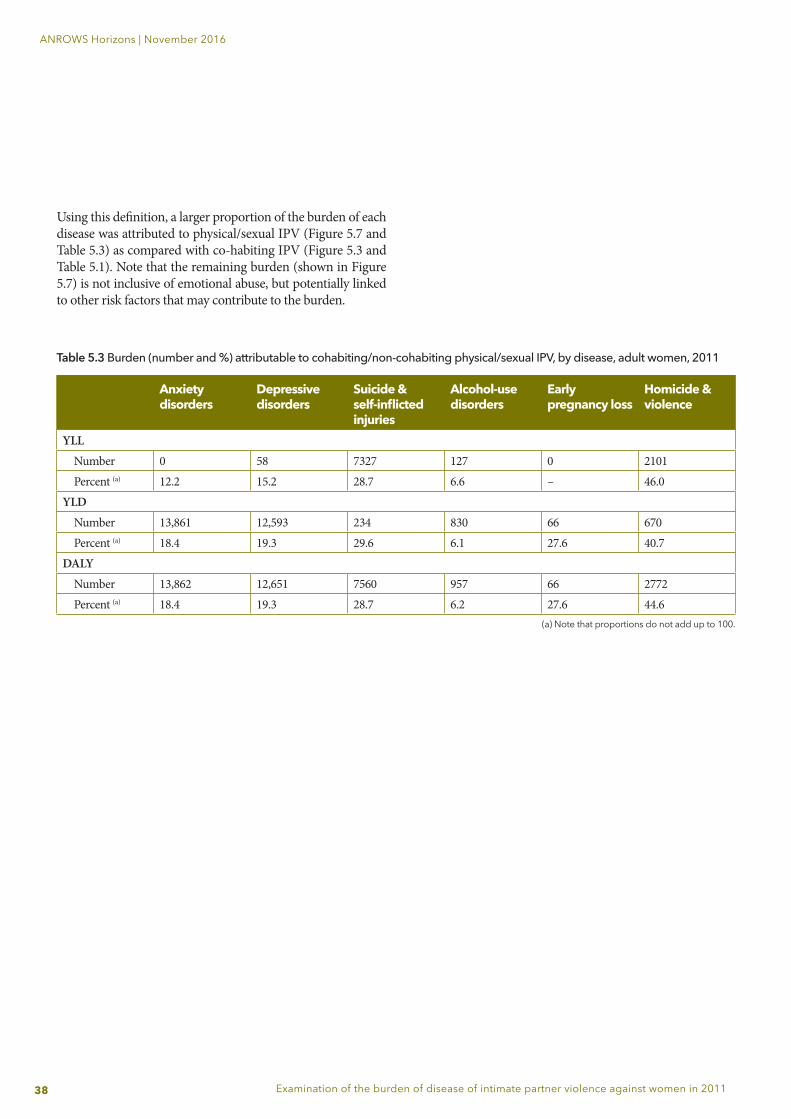
38
ANROWS Horizons | November 2016
Examination of the burden of disease of intimate partner violence against women in 2011
Using this definition, a larger proportion of the burden of each disease was attributed to physical/sexual IPV (Figure 5.7 and Table 5.3) as compared with co-habiting IPV (Figure 5.3 and Table 5.1). Note that the remaining burden (shown in Figure 5.7) is not inclusive of emotional abuse, but potentially linked to other risk factors that may contribute to the burden.
Anxiety disorders
Depressive disorders
Suicide & self-inflicted injuries
Alcohol-use disorders
Early pregnancy loss
Homicide & violence
YLLNumber 0 58 7327 127 0 2101Percent (a) 12.2 15.2 28.7 6.6 – 46.0
YLDNumber 13,861 12,593 234 830 66 670Percent (a) 18.4 19.3 29.6 6.1 27.6 40.7
DALYNumber 13,862 12,651 7560 957 66 2772Percent (a) 18.4 19.3 28.7 6.2 27.6 44.6
(a) Note that proportions do not add up to 100.
Table 5.3 Burden (number and %) attributable to cohabiting/non-cohabiting physical/sexual IPV, by disease, adult women, 2011
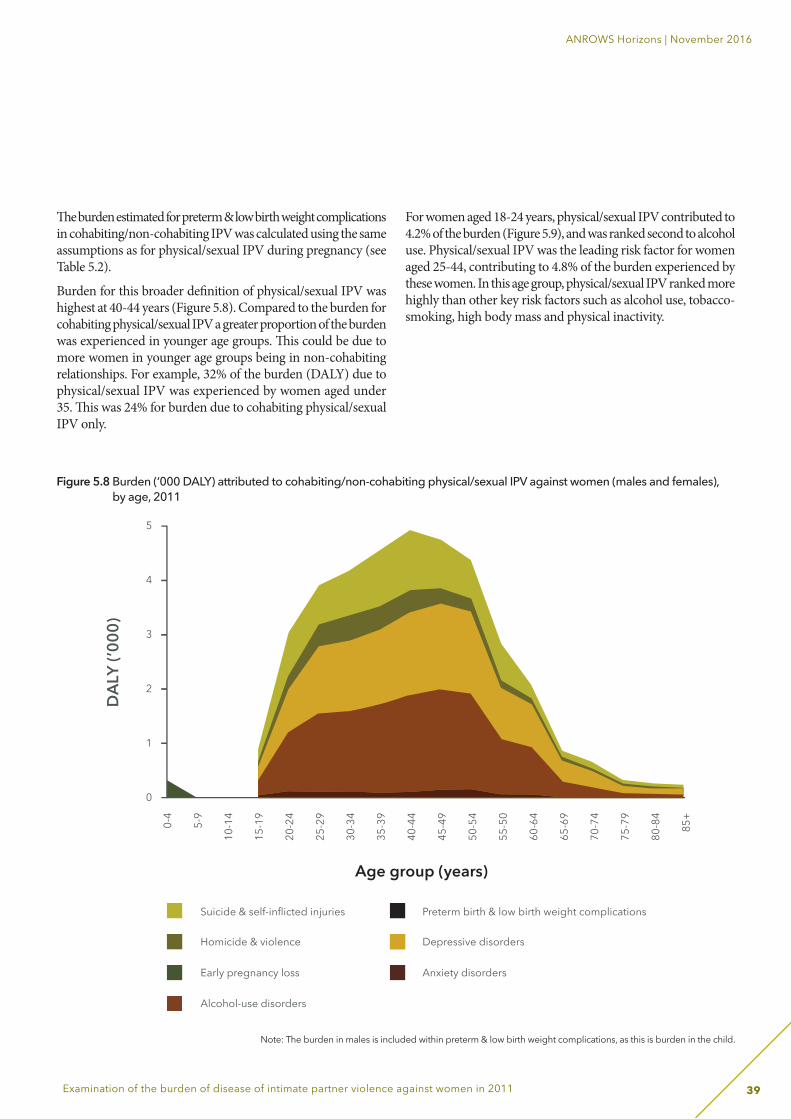
39
ANROWS Horizons | November 2016
Examination of the burden of disease of intimate partner violence against women in 2011
Th e burden estimated for preterm & low birth weight complications in cohabiting/non-cohabiting IPV was calculated using the same assumptions as for physical/sexual IPV during pregnancy (see Table 5.2).
Burden for this broader defi nition of physical/sexual IPV was highest at 40-44 years (Figure 5.8). Compared to the burden for cohabiting physical/sexual IPV a greater proportion of the burden was experienced in younger age groups. Th is could be due to more women in younger age groups being in non-cohabiting relationships. For example, 32% of the burden (DALY) due to physical/sexual IPV was experienced by women aged under 35. Th is was 24% for burden due to cohabiting physical/sexual IPV only.
For women aged 18-24 years, physical/sexual IPV contributed to 4.2% of the burden (Figure 5.9), and was ranked second to alcohol use. Physical/sexual IPV was the leading risk factor for women aged 25-44, contributing to 4.8% of the burden experienced by these women. In this age group, physical/sexual IPV ranked more highly than other key risk factors such as alcohol use, tobacco-smoking, high body mass and physical inactivity.
Figure 5.8 Burden (‘000 DALY) attributed to cohabiting/non-cohabiting physical/sexual IPV against women (males and females), by age, 2011
Note: The burden in males is included within preterm & low birth weight complications, as this is burden in the child.
0-4
5-9
10-1
4
15-1
9
20-2
4
25-2
9
30-3
4
35-3
9
40-4
4
45-4
9
50-5
4
55-5
0
60-6
4
65-6
9
70-7
4
75-7
9
80-8
4
85+
5
4
3
2
1
0
DAL
Y (’0
00)
Suicide & self-inflicted injuries
Homicide & violence
Early pregnancy loss
Alcohol-use disorders
Preterm birth & low birth weight complications
Depressive disorders
Anxiety disorders
Age group (years)
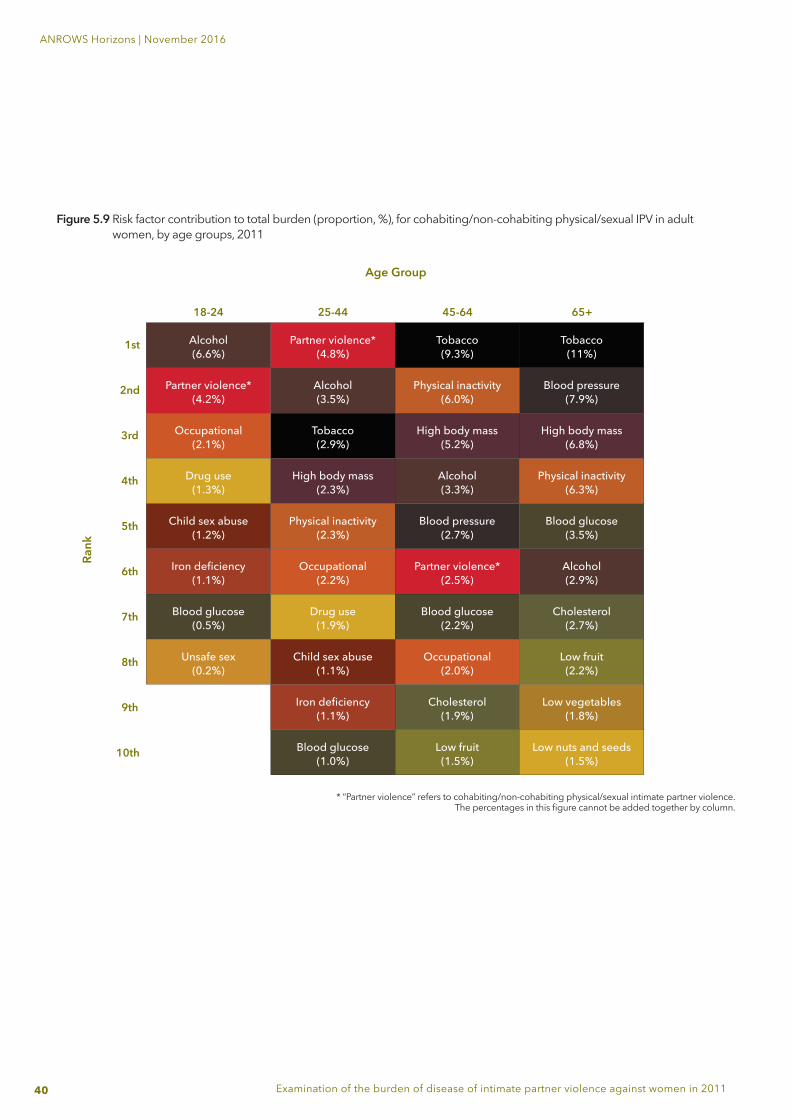
40
ANROWS Horizons | November 2016
Examination of the burden of disease of intimate partner violence against women in 2011
Figure 5.9 Risk factor contribution to total burden (proportion, %), for cohabiting/non-cohabiting physical/sexual IPV in adult women, by age groups, 2011
* “Partner violence” refers to cohabiting/non-cohabiting physical/sexual intimate partner violence.The percentages in this figure cannot be added together by column.
Age Group
Rank
18-24
1st
2nd
3rd
4th
5th
6th
7th
8th
9th
10th
25-44 45-64 65+
Alcohol(6.6%)
Partner violence*(4.8%)
Tobacco(9.3%)
Tobacco(11%)
Partner violence*(4.2%)
Alcohol(3.5%)
Physical inactivity(6.0%)
Blood pressure(7.9%)
Occupational(2.1%)
Tobacco(2.9%)
High body mass(5.2%)
High body mass(6.8%)
Drug use(1.3%)
High body mass(2.3%)
Alcohol(3.3%)
Physical inactivity(6.3%)
Child sex abuse(1.2%)
Physical inactivity(2.3%)
Blood pressure(2.7%)
Blood glucose(3.5%)
Iron deficiency(1.1%)
Occupational(2.2%)
Partner violence*(2.5%)
Alcohol(2.9%)
Blood glucose(0.5%)
Drug use(1.9%)
Blood glucose(2.2%)
Cholesterol(2.7%)
Unsafe sex(0.2%)
Child sex abuse(1.1%)
Occupational(2.0%)
Low fruit(2.2%)
Iron deficiency(1.1%)
Cholesterol(1.9%)
Low vegetables(1.8%)
Blood glucose(1.0%)
Low fruit(1.5%)
Low nuts and seeds(1.5%)
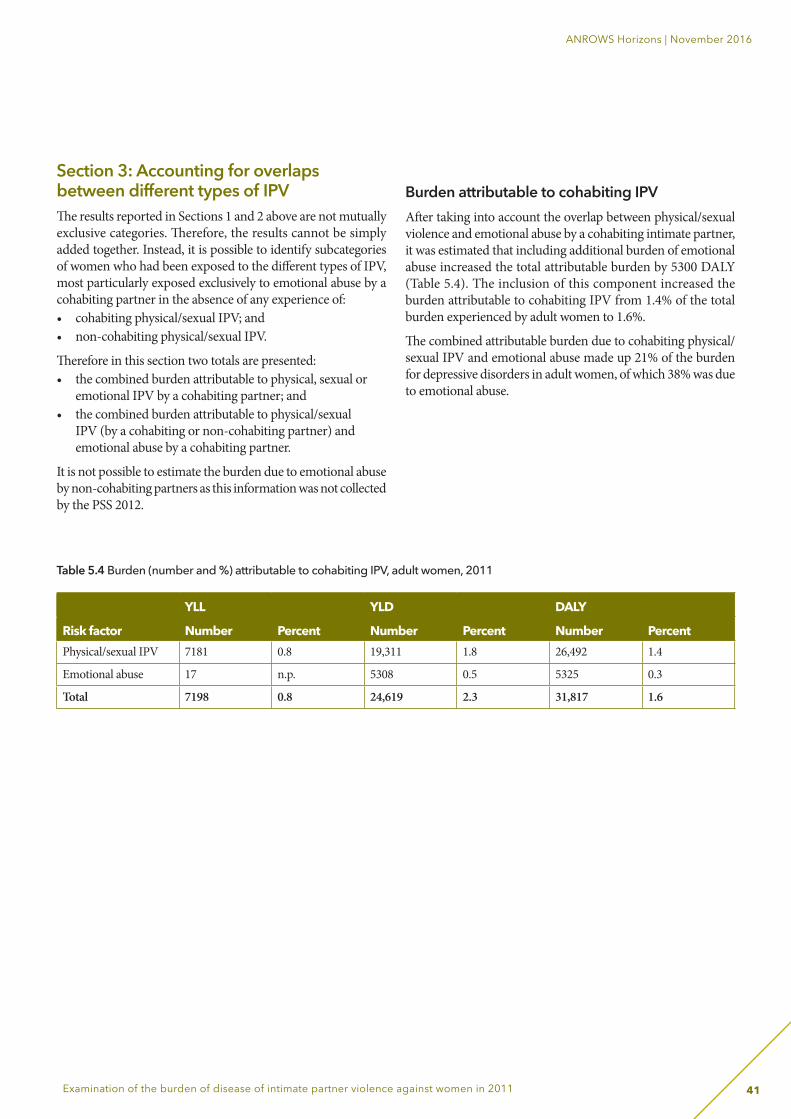
41
ANROWS Horizons | November 2016
Examination of the burden of disease of intimate partner violence against women in 2011
Section 3: Accounting for overlaps between different types of IPV The results reported in Sections 1 and 2 above are not mutually exclusive categories. Therefore, the results cannot be simply added together. Instead, it is possible to identify subcategories of women who had been exposed to the different types of IPV, most particularly exposed exclusively to emotional abuse by a cohabiting partner in the absence of any experience of: • cohabiting physical/sexual IPV; and • non-cohabiting physical/sexual IPV.
Therefore in this section two totals are presented: • the combined burden attributable to physical, sexual or
emotional IPV by a cohabiting partner; and • the combined burden attributable to physical/sexual
IPV (by a cohabiting or non-cohabiting partner) and emotional abuse by a cohabiting partner.
It is not possible to estimate the burden due to emotional abuse by non-cohabiting partners as this information was not collected by the PSS 2012.
Burden attributable to cohabiting IPV After taking into account the overlap between physical/sexual violence and emotional abuse by a cohabiting intimate partner, it was estimated that including additional burden of emotional abuse increased the total attributable burden by 5300 DALY (Table 5.4). The inclusion of this component increased the burden attributable to cohabiting IPV from 1.4% of the total burden experienced by adult women to 1.6%.
The combined attributable burden due to cohabiting physical/sexual IPV and emotional abuse made up 21% of the burden for depressive disorders in adult women, of which 38% was due to emotional abuse.
Table 5.4 Burden (number and %) attributable to cohabiting IPV, adult women, 2011
YLL YLD DALY
Risk factor Number Percent Number Percent Number PercentPhysical/sexual IPV 7181 0.8 19,311 1.8 26,492 1.4
Emotional abuse 17 n.p. 5308 0.5 5325 0.3
Total 7198 0.8 24,619 2.3 31,817 1.6
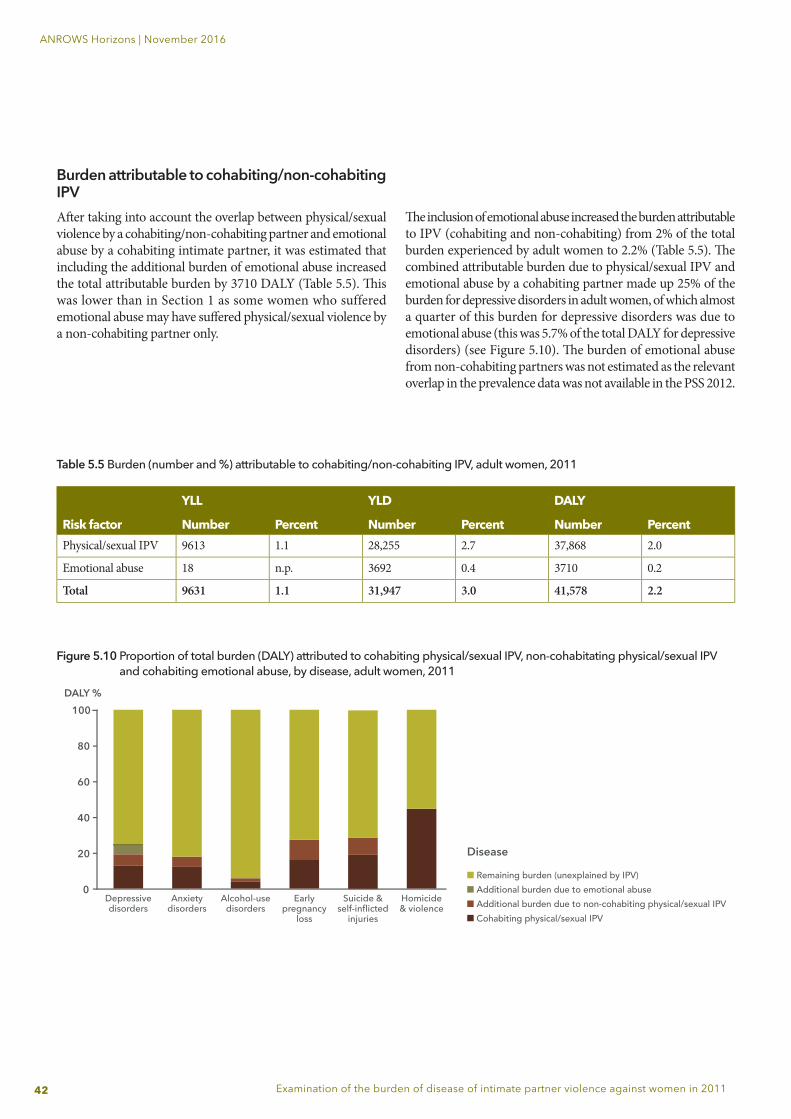
42
ANROWS Horizons | November 2016
Examination of the burden of disease of intimate partner violence against women in 2011
Burden attributable to cohabiting/non-cohabiting IPVAft er taking into account the overlap between physical/sexual violence by a cohabiting/non-cohabiting partner and emotional abuse by a cohabiting intimate partner, it was estimated that including the additional burden of emotional abuse increased the total attributable burden by 3710 DALY (Table 5.5). Th is was lower than in Section 1 as some women who suffered emotional abuse may have suff ered physical/sexual violence by a non-cohabiting partner only.
Th e inclusion of emotional abuse increased the burden attributable to IPV (cohabiting and non-cohabiting) from 2% of the total burden experienced by adult women to 2.2% (Table 5.5). Th e combined attributable burden due to physical/sexual IPV and emotional abuse by a cohabiting partner made up 25% of the burden for depressive disorders in adult women, of which almost a quarter of this burden for depressive disorders was due to emotional abuse (this was 5.7% of the total DALY for depressive disorders) (see Figure 5.10). Th e burden of emotional abuse from non-cohabiting partners was not estimated as the relevant overlap in the prevalence data was not available in the PSS 2012.
Table 5.5 Burden (number and %) attributable to cohabiting/non-cohabiting IPV, adult women, 2011
YLL YLD DALY
Risk factor Number Percent Number Percent Number PercentPhysical/sexual IPV 9613 1.1 28,255 2.7 37,868 2.0
Emotional abuse 18 n.p. 3692 0.4 3710 0.2
Total 9631 1.1 31,947 3.0 41,578 2.2
Figure 5.10 Proportion of total burden (DALY) attributed to cohabiting physical/sexual IPV, non-cohabitating physical/sexual IPV and cohabiting emotional abuse, by disease, adult women, 2011
100
80
60
40
20
0Depressivedisorders
Anxietydisorders
Remaining burden (unexplained by IPV)Additional burden due to emotional abuseAdditional burden due to non-cohabiting physical/sexual IPVCohabiting physical/sexual IPV
Alcohol-usedisorders
Earlypregnancy
loss
Suicide &self-inflicted
injuries
Homicide& violence
DALY %
Disease
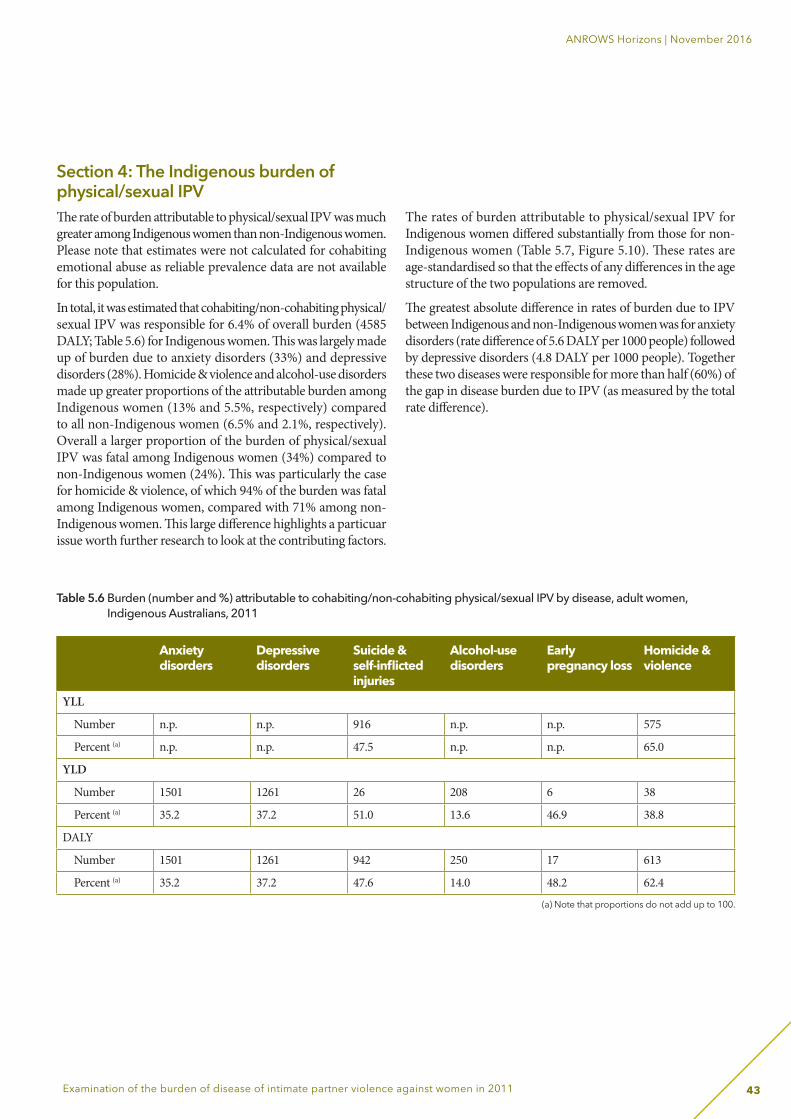
43
ANROWS Horizons | November 2016
Examination of the burden of disease of intimate partner violence against women in 2011
Section 4: The Indigenous burden of physical/sexual IPV The rate of burden attributable to physical/sexual IPV was much greater among Indigenous women than non-Indigenous women. Please note that estimates were not calculated for cohabiting emotional abuse as reliable prevalence data are not available for this population.
In total, it was estimated that cohabiting/non-cohabiting physical/sexual IPV was responsible for 6.4% of overall burden (4585 DALY; Table 5.6) for Indigenous women. This was largely made up of burden due to anxiety disorders (33%) and depressive disorders (28%). Homicide & violence and alcohol-use disorders made up greater proportions of the attributable burden among Indigenous women (13% and 5.5%, respectively) compared to all non-Indigenous women (6.5% and 2.1%, respectively). Overall a larger proportion of the burden of physical/sexual IPV was fatal among Indigenous women (34%) compared to non-Indigenous women (24%). This was particularly the case for homicide & violence, of which 94% of the burden was fatal among Indigenous women, compared with 71% among non-Indigenous women. This large difference highlights a particuar issue worth further research to look at the contributing factors.
The rates of burden attributable to physical/sexual IPV for Indigenous women differed substantially from those for non-Indigenous women (Table 5.7, Figure 5.10). These rates are age-standardised so that the effects of any differences in the age structure of the two populations are removed.
The greatest absolute difference in rates of burden due to IPV between Indigenous and non-Indigenous women was for anxiety disorders (rate difference of 5.6 DALY per 1000 people) followed by depressive disorders (4.8 DALY per 1000 people). Together these two diseases were responsible for more than half (60%) of the gap in disease burden due to IPV (as measured by the total rate difference).
Table 5.6 Burden (number and %) attributable to cohabiting/non-cohabiting physical/sexual IPV by disease, adult women, Indigenous Australians, 2011
Anxiety disorders
Depressive disorders
Suicide & self-inflicted injuries
Alcohol-use disorders
Early pregnancy loss
Homicide & violence
YLL
Number n.p. n.p. 916 n.p. n.p. 575
Percent (a) n.p. n.p. 47.5 n.p. n.p. 65.0
YLD
Number 1501 1261 26 208 6 38
Percent (a) 35.2 37.2 51.0 13.6 46.9 38.8
DALY
Number 1501 1261 942 250 17 613
Percent (a) 35.2 37.2 47.6 14.0 48.2 62.4
(a) Note that proportions do not add up to 100.
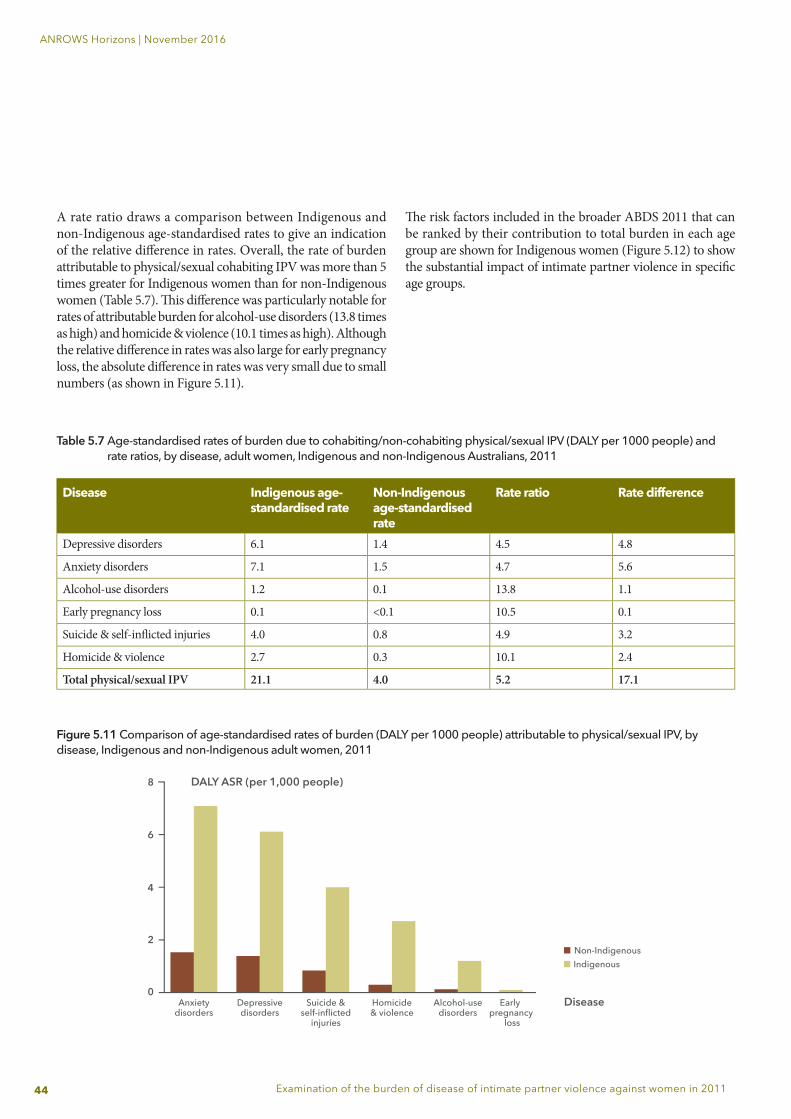
44
ANROWS Horizons | November 2016
Examination of the burden of disease of intimate partner violence against women in 2011
Table 5.7 Age-standardised rates of burden due to cohabiting/non-cohabiting physical/sexual IPV (DALY per 1000 people) and rate ratios, by disease, adult women, Indigenous and non-Indigenous Australians, 2011
Disease Indigenous age-standardised rate
Non-Indigenous age-standardised rate
Rate ratio Rate difference
Depressive disorders 6.1 1.4 4.5 4.8
Anxiety disorders 7.1 1.5 4.7 5.6
Alcohol-use disorders 1.2 0.1 13.8 1.1
Early pregnancy loss 0.1 <0.1 10.5 0.1
Suicide & self-infl icted injuries 4.0 0.8 4.9 3.2
Homicide & violence 2.7 0.3 10.1 2.4
Total physical/sexual IPV 21.1 4.0 5.2 17.1
A rate ratio draws a comparison between Indigenous and non-Indigenous age-standardised rates to give an indication of the relative diff erence in rates. Overall, the rate of burden attributable to physical/sexual cohabiting IPV was more than 5 times greater for Indigenous women than for non-Indigenous women (Table 5.7). Th is diff erence was particularly notable for rates of attributable burden for alcohol-use disorders (13.8 times as high) and homicide & violence (10.1 times as high). Although the relative diff erence in rates was also large for early pregnancy loss, the absolute diff erence in rates was very small due to small numbers (as shown in Figure 5.11).
Th e risk factors included in the broader ABDS 2011 that can be ranked by their contribution to total burden in each age group are shown for Indigenous women (Figure 5.12) to show the substantial impact of intimate partner violence in specifi c age groups.
Figure 5.11 Comparison of age-standardised rates of burden (DALY per 1000 people) attributable to physical/sexual IPV, by disease, Indigenous and non-Indigenous adult women, 2011
8
6
4
2
0Anxiety
disordersDepressivedisorders
Suicide &self-inflicted
injuries
Disease
DALY ASR (per 1,000 people)
Non-IndigenousIndigenous
Homicide& violence
Alcohol-usedisorders
Early pregnancy
loss
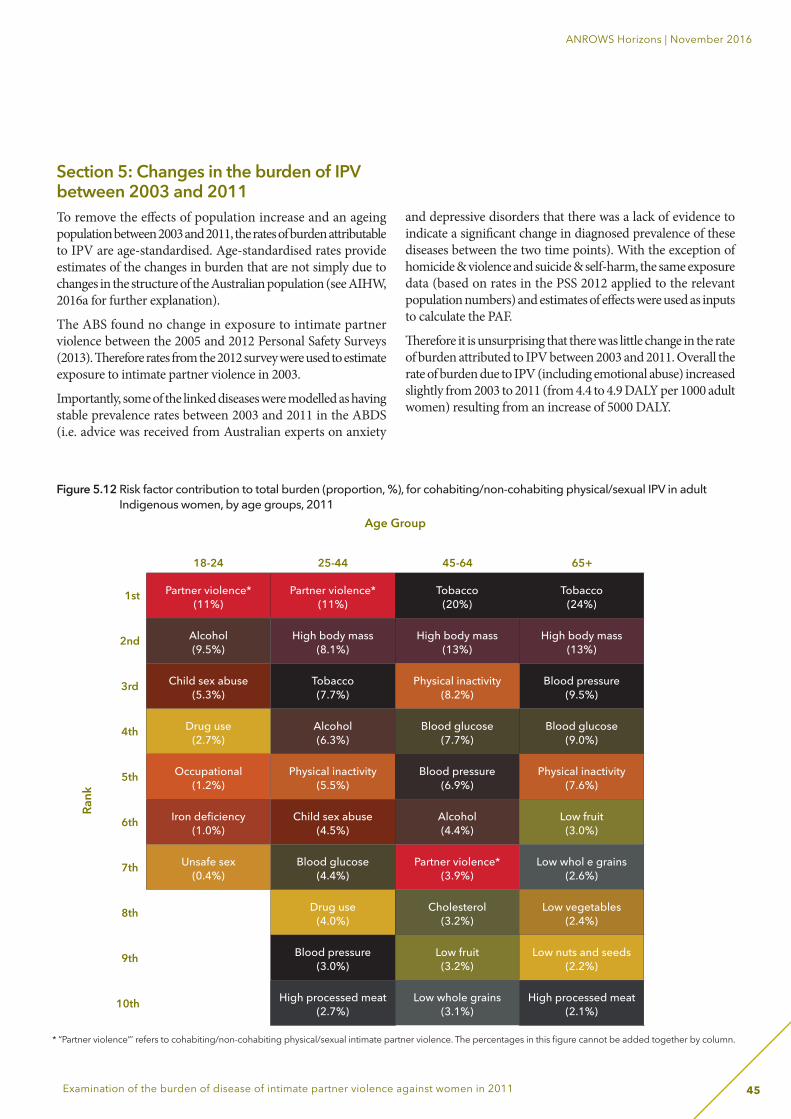
45
ANROWS Horizons | November 2016
Examination of the burden of disease of intimate partner violence against women in 2011
Figure 5.12 Risk factor contribution to total burden (proportion, %), for cohabiting/non-cohabiting physical/sexual IPV in adult Indigenous women, by age groups, 2011
* “Partner violence”’ refers to cohabiting/non-cohabiting physical/sexual intimate partner violence. The percentages in this figure cannot be added together by column.
Section 5: Changes in the burden of IPV between 2003 and 2011To remove the effects of population increase and an ageing population between 2003 and 2011, the rates of burden attributable to IPV are age-standardised. Age-standardised rates provide estimates of the changes in burden that are not simply due to changes in the structure of the Australian population (see AIHW, 2016a for further explanation).
The ABS found no change in exposure to intimate partner violence between the 2005 and 2012 Personal Safety Surveys (2013). Therefore rates from the 2012 survey were used to estimate exposure to intimate partner violence in 2003.
Importantly, some of the linked diseases were modelled as having stable prevalence rates between 2003 and 2011 in the ABDS (i.e. advice was received from Australian experts on anxiety
and depressive disorders that there was a lack of evidence to indicate a significant change in diagnosed prevalence of these diseases between the two time points). With the exception of homicide & violence and suicide & self-harm, the same exposure data (based on rates in the PSS 2012 applied to the relevant population numbers) and estimates of effects were used as inputs to calculate the PAF.
Therefore it is unsurprising that there was little change in the rate of burden attributed to IPV between 2003 and 2011. Overall the rate of burden due to IPV (including emotional abuse) increased slightly from 2003 to 2011 (from 4.4 to 4.9 DALY per 1000 adult women) resulting from an increase of 5000 DALY.
Partner violence*(11%)
Partner violence*(11%)
Tobacco(20%)
Tobacco(24%)
Alcohol(9.5%)
High body mass(8.1%)
High body mass(13%)
High body mass(13%)
Child sex abuse(5.3%)
Tobacco(7.7%)
Physical inactivity(8.2%)
Blood pressure(9.5%)
Drug use(2.7%)
Alcohol(6.3%)
Blood glucose(7.7%)
Blood glucose(9.0%)
Occupational(1.2%)
Physical inactivity(5.5%)
Blood pressure(6.9%)
Physical inactivity(7.6%)
Iron deficiency(1.0%)
Child sex abuse(4.5%)
Alcohol(4.4%)
Low fruit(3.0%)
Unsafe sex(0.4%)
Blood glucose(4.4%)
Partner violence*(3.9%)
Low whol e grains(2.6%)
Drug use(4.0%)
Cholesterol(3.2%)
Low vegetables(2.4%)
Blood pressure(3.0%)
Low fruit(3.2%)
Low nuts and seeds(2.2%)
High processed meat(2.7%)
Low whole grains(3.1%)
High processed meat(2.1%)
Age Group
Rank
18-24
1st
2nd
3rd
4th
5th
6th
7th
8th
9th
10th
25-44 45-64 65+
46
ANROWS Horizons | November 2016
Examination of the burden of disease of intimate partner violence against women in 2011
6. Discussion
Summary of aims and methodsThis report aimed to refine, and where appropriate, extend the ABDS 2011 analysis of the impact of IPV on the health of women in Australia. The inputs into the ABDS 2011 model of IPV, which had been based on those used in the Global Burden of Disease Study 2010, were scrutinised for their transparency and evidence base. The appropriateness of the exposure data, inclusion of different types of IPV, and the measures of effect for risk-outcome pairs were also assessed. Estimates of effect were adjusted where necessary, and additional linked diseases were incorporated where there was sufficient evidence in the literature. The burden of emotional abuse by a partner and the burden of non-cohabiting physical/sexual IPV were also incorporated into an Australian study for the first time. This process resulted in a more complex model of IPV; however it also had a greater level of transparency and increased specificity to Australian women.
Summary of results and comparison to ABDS 2011National burden of IPVOverall, IPV by a current or previous cohabiting partner contributed to 1.4% of the burden experienced by adult Australian women in 2011. This estimate is higher than the 1.1% estimated by the ABDS 2011 for the female burden attributable to IPV (see Appendix A). This is due to the inclusion of additional linked diseases and updated measures of effect following a thorough literature review. Most of this burden (83%) was attributed to women who had been exposed to physical/sexual IPV. Almost one-quarter (23%) of this burden was fatal. When the burden from emotional abuse was added, this figure rose to 1.6%.
When the burden of non-cohabiting physical/sexual abuse and emotional abuse was also included, the burden of IPV increased to 2.2% of the burden experienced by adult Australian women. Anxiety and depressive disorders contributed the largest proportion of the burden due to physical/sexual IPV, followed by suicide & self-inflicted injuries and homicide & violence. The current approach differed from the ABDS 2011 model of IPV in several key ways: • inclusion of physical/sexual non-cohabiting IPV and
cohabiting emotional abuse; • inclusion of anxiety disorders, alcohol-use disorders and
preterm & low birth weight as linked disease for IPV; • a substantially lower relative risk for suicide & self-
inflicted injuries and a small increase in the relative risk for early pregnancy loss; and
• use of direct estimates of effect for non-fatal homicide & violence.
The higher estimates in this report (that is, shaped by the broadening of the IPV definition) than in ABDS 2011 also resulted in changes in the risk factor rankings. In this report, IPV was the most burdensome risk factor for women aged 25-44 years, and responsible for a greater proportion of the burden in this age group than alcohol use and tobacco use. By comparison, cohabiting physical/sexual IPV was ranked third in this age group in the ABDS 2011 behind alcohol and tobacco use.
47
ANROWS Horizons | November 2016
Examination of the burden of disease of intimate partner violence against women in 2011
Burden of IPV among Indigenous womenA larger proportion of total disease burden was attributed to physical/sexual IPV for Indigenous women (6.4%) than for non-Indigenous women (around 1.8%). Using age-standardised rates, the rate of burden (DALY per 1000 people) was more than five times greater among Indigenous women than non-Indigenous women. This difference in rates was particularly notable for alcohol-use disorders (13.8 times greater among Indigenous women) and homicide & violence (10.1 times greater). The greatest absolute difference in rates of burden due to IPV between Indigenous and non-Indigenous women was for anxiety disorders and depressive disorders; together responsible for more than half (60%) of the gap in disease burden due to IPV.
In addition, a larger proportion of the burden attributable to cohabiting physical/sexual IPV was fatal (34%) compared to non-Indigenous women (24%), and this was particularly the case for the burden due to homicide & violence, of which 94% was fatal among Indigenous women, compared with 71% among non-Indigenous women.
Burden of IPV over time (2003 to 2011)There was little change in age-standardised rates of burden attributable to IPV between 2003 and 2011. This is mostly because: • the assumption of no change in prevalence rates was used
in the models for most of the linked diseases (particularly anxiety and depressive disorders, which were key contributors to attributable burden); and
• the age-specific rates of exposure and relative risks that were inputs to the PAFs were modelled as stable across time (with the exception of direct evidence used for non-fatal estimates of homicide & violence).
LimitationsDespite the improved specificity of the analysis compared to ABDS 2011, there are several limitations in the analysis presented here.
Firstly, an appropriate methodology has yet to be developed and assessed to incorporate the role of other risk factors. The estimate of the burden attributable to IPV would be more comprehensive if it could also account for the burden due to associations with tobacco use or unsafe sex. Once such a methodology has been developed, future studies could investigate the causal evidence that IPV increases an individual’s risk of exposure to other risk factors.
Secondly, in general, more conservative effect sizes were selected in cases where more than one effect size was considered appropriate. This approach was taken in order to apply a consistent and more defensible method, however it has potentially also underestimated the burden of IPV. In future studies, meta-analysis techniques could be used to combine results from different studies to provide more robust estimates of effect.
It is important to acknowledge that comorbidity between diseases (the existence of more than one disease or injury in an individual at the same time) can occur (e.g. between anxiety and depression). An understanding of comorbidity is important to assess and improve health outcomes, and they may differ across population groups. In the ABDS, comorbidity is accounted for, though, in a fairly straightforward assumption due to lack of sufficient data on the prevalence of possible disease pairs in the Australian population. Further details on these methods are documented in the ABDS 2011 Methods and supplementary material report (AIHW, 2016c). Further, an understanding of the quality and limitations of the estimates is crucial, especially to reflect errors or uncertainties in the data or methods. All estimates within the ABDS 2011 were produced using the best possible data that were available within the scope and time frame of the study. All data used in the ABDS were required to meet strict inclusion criteria via protocols endorsed by subject matter experts. All standard inputs were reviewed and assessed for relevance and applicability in the Australian context. All models and inputs used in YLL and YLD estimates were reviewed by disease-specific experts to ensure their appropriateness for Australia. A quality index to assist users to interpret the reliability of risk factor estimates within ABDS 2011 is published in the ABDS Methods and supplementary material report (AIHW, 2016c).
Lastly, in most cases the estimates of effect sourced from the literature were not age-specific. It is plausible that the relationship between exposure to IPV and diseases may be stronger in some age groups than in others. In particular, it is possible that using a “lifetime” exposure measure, as applied in this report, will overestimate the burden in older ages as there is a greater chance that the most recent incident occurred a relatively long time
48
ANROWS Horizons | November 2016
Examination of the burden of disease of intimate partner violence against women in 2011
ago, and so may have weaker effects on diseases. In contrast, the lifetime measure in women aged 30 (for example) is limited to incidents that took place in the previous 15 years (that is, from age 15 onwards, as defined by the PSS 2012). This is particularly relevant as most of the studies that provided inputs in the current report used follow-up periods of less than 10 years.
GapsIt is crucial to understand that any burden of disease study is limited by the strength of the research on which the prevalence data and inputs are based. For this analysis, a conservative approach was generally taken, such that the burden of some associated health outcomes (e.g. chronic diseases such as hypertensive heart disease or coronary heart disease) were not estimated due to notable weaknesses or gaps of longitudinal evidence in the research base. Likewise, there were several extension topics that were not able to be included in this analysis. These are discussed below.
Causal evidence of the impacts of IPVSome diseases that may be brought about by IPV were not included as there was insufficient causal evidence in the literature. Although there was a substantial body of literature on the association between a disease and IPV these studies were often correlational. This reflects gaps in the literature rather than a limitation of this analysis itself. There were notable gaps on suicide & self-injury, alcohol-use disorders and chronic conditions. There was also limited evidence on the impact of emotional abuse (independently of physical/sexual IPV).
Estimates for children witnessing IPVAlthough the analysis included more direct impacts of children exposed to IPV (that is, impact of physical/sexual IPV in infants as seen in preterm & low birth weight complications), no estimates were calculated for the burden of witnessing IPV as a child. There is a substantial body of literature reporting on these impacts (see, for example, Evans, Davies, & DiLillo, 2008), however, there are large differences in methodology, particularly in regards to the definition of “children witnessing of IPV” (for example, whether this includes overhearing IPV or witnessing cuts and bruises but not acts of violence). The literature was also difficult to assess because the age and the sex of the child may play a role in the subsequent development of mental health problems, and because of reduced reliability and validity of diagnostic tools in very young children. Most of the studies tended to be correlational, with very few longitudinal studies. The ability to incorporate findings into a burden of disease analysis was also limited by the tendency of these studies to report on broader externalising/internalising behaviours rather than mental health diagnoses.
Lastly, there is clear evidence that childhood adverse events (such as neglect, childhood physical or sexual abuse and witnessing IPV) co-occur (Afifi, Enns, Cox, Asmundson, Stein, & Sareen, 2008; Gilbert, Spatz Widom, Browne, Fergusson, Webb, & Janson, 2009). Therefore any adult estimates of the effects of children witnessing IPV should be based on studies that also account for other types of childhood adverse events. There is also some evidence for a relationship between exposure to childhood witnessing of IPV and subsequent IPV victimisation in adulthood
49
ANROWS Horizons | November 2016
Examination of the burden of disease of intimate partner violence against women in 2011
(Capaldi, Knoble, Shortt, & Kim, 2012). None of the identified studies on the impact of IPV as an adult controlled specifically for whether the respondent had witnessed IPV as a child. If the impact of children witnessing IPV and the impact of IPV exposure as an adult are to be aggregated into an overall impact of IPV it is crucial that any estimates of the effect of exposure as an adult have also controlled for witnessing IPV as a child. This was not the case in the present study due to limitations of the literature.
Estimates for non-partner sexual assaultThe estimates presented in this report were not able to specifically include non-partner sexual assault as a separate exposure. This was because a review of the literature was not able to identify any longitudinal studies which demonstrated a causal relationship between exposure to non-partner sexual assault specifically and health outcomes. Such evidence would be required in order to include non-partner sexual assault as a risk factor in future burden of disease analysis.
The state of knowledge paper (Lum On et al., 2016) did however identify a number of studies which analysed health outcomes associated with sexual assault more broadly, such as post-traumatic stress disorder (PTSD), depression, anxiety, alcohol and drug use, and suicidal ideation and attempts (Campbell, Dworkin, & Cabral, 2009; Chen et al., 2010; Mason & Lodrick, 2013; Walsh, Galea, & Koenen, 2012). Furthermore, the literature review highlighted that there were many definitional overlaps between the different types of IPV and the associated health outcomes (WHO, 2013). For example, there is likely to be strong overlaps between non-partner sexual assault and non-cohabitating physical/sexual IPV that is perpetrated by boyfriends, girlfriends or dates. Therefore some of the burden caused by non-partner sexual assault is likely to be captured in the estimates presented in this report.
Estimates of the burden of IPV in Indigenous womenThis study importantly identifyed a key data gap in information available on exposure to IPV among Indigenous Australians that is directly comparable to information available for non-Indigenous Australians. Ideally the data source used for national exposure estimates would include an Indigenous identifier, or similar questions would be asked in Indigenous-specific surveys. While there were some similarities between national and Indigenous survey variables, these asked about the most recent incidence of violence and were not deemed suitable for use in estimating lifetime exposure to IPV. In the absence of such information, a proxy method for indirectly deriving lifetime exposure to IPV in Indigenous women was assessed as the most appropriate method. This was based on Indigenous:total population rate ratios of 12- month prevalence of physical or threatened violence victimisation reported by females from ABS social surveys. Additionally, in
lieu of specific data this rate ratio was also assumed to apply to exposure to sexual violence.
The analysis also applied the national estimates of effect size to the Indigenous model (with the exception of homicide & violence). It is plausible that these estimates of effect may differ between the two population groups, although the higher rate of exposure and higher rate of burden (in for example, depressive disorders) in Indigenous women had already been accounted for.
50
ANROWS Horizons | November 2016
Examination of the burden of disease of intimate partner violence against women in 2011
7. Conclusion
This report provides detailed estimates of the burden attributable to IPV for Australian and Indigenous Australian women in 2011. These estimates are built upon the methods used in the ABDS 2011 for risk factor analysis, which were largely drawn from the Global Burden of Disease Study 2010, to produce new and improved estimates based on the latest available evidence in the literature. The definition of IPV was also broadened for the first time in a burden of disease study to encompass physical/sexual non-cohabiting IPV and emotional abuse by a cohabiting partner. This is an important development which aims to more accurately reflect the health outcomes of violence against women.
This study also identified important gaps in the literature that limit the linked diseases that can be included in the estimates of attributable burden, as well as gaps in the literature for estimating this burden among Indigenous women. This report provides informed, transparent and current best-estimates of the proportion of female burden in Australia that can be attributed to IPV.
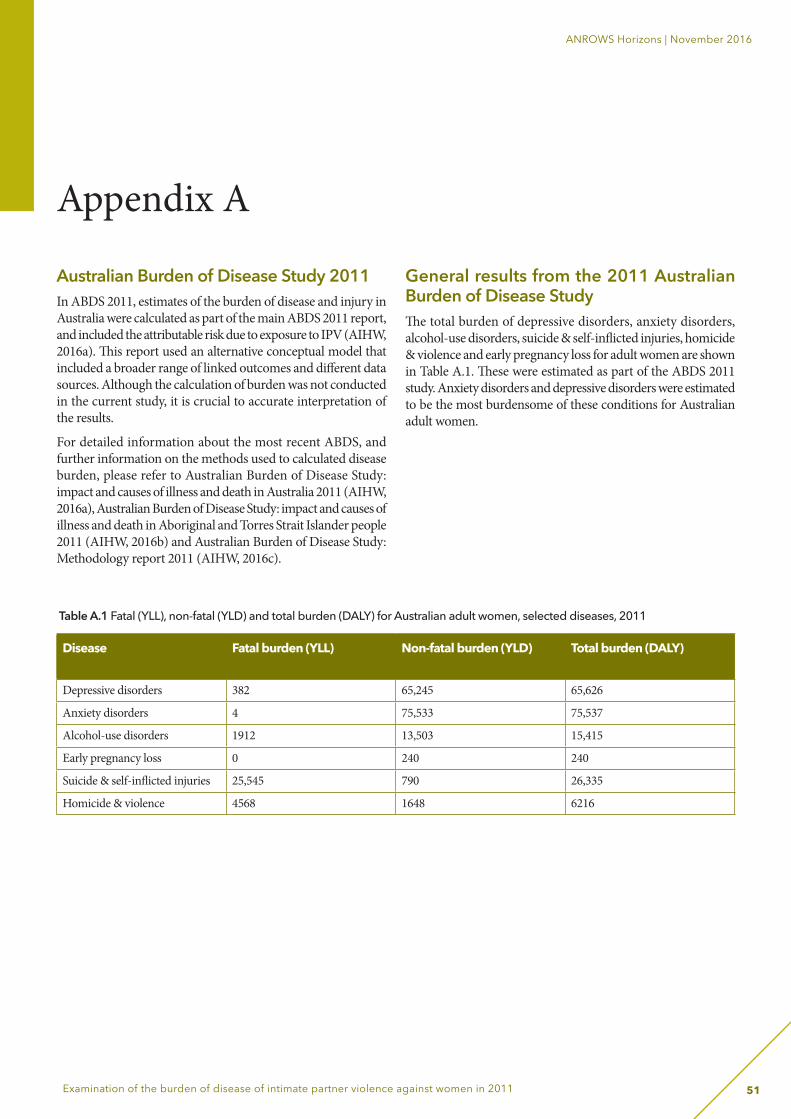
51
ANROWS Horizons | November 2016
Examination of the burden of disease of intimate partner violence against women in 2011
Australian Burden of Disease Study 2011In ABDS 2011, estimates of the burden of disease and injury in Australia were calculated as part of the main ABDS 2011 report, and included the attributable risk due to exposure to IPV (AIHW, 2016a). This report used an alternative conceptual model that included a broader range of linked outcomes and different data sources. Although the calculation of burden was not conducted in the current study, it is crucial to accurate interpretation of the results.
For detailed information about the most recent ABDS, and further information on the methods used to calculated disease burden, please refer to Australian Burden of Disease Study: impact and causes of illness and death in Australia 2011 (AIHW, 2016a), Australian Burden of Disease Study: impact and causes of illness and death in Aboriginal and Torres Strait Islander people 2011 (AIHW, 2016b) and Australian Burden of Disease Study: Methodology report 2011 (AIHW, 2016c).
General results from the 2011 Australian Burden of Disease StudyThe total burden of depressive disorders, anxiety disorders, alcohol-use disorders, suicide & self-inflicted injuries, homicide & violence and early pregnancy loss for adult women are shown in Table A.1. These were estimated as part of the ABDS 2011 study. Anxiety disorders and depressive disorders were estimated to be the most burdensome of these conditions for Australian adult women.
Disease Fatal burden (YLL) Non-fatal burden (YLD) Total burden (DALY)
Depressive disorders 382 65,245 65,626
Anxiety disorders 4 75,533 75,537
Alcohol-use disorders 1912 13,503 15,415
Early pregnancy loss 0 240 240
Suicide & self-inflicted injuries 25,545 790 26,335
Homicide & violence 4568 1648 6216
Table A.1 Fatal (YLL), non-fatal (YLD) and total burden (DALY) for Australian adult women, selected diseases, 2011
Appendix A
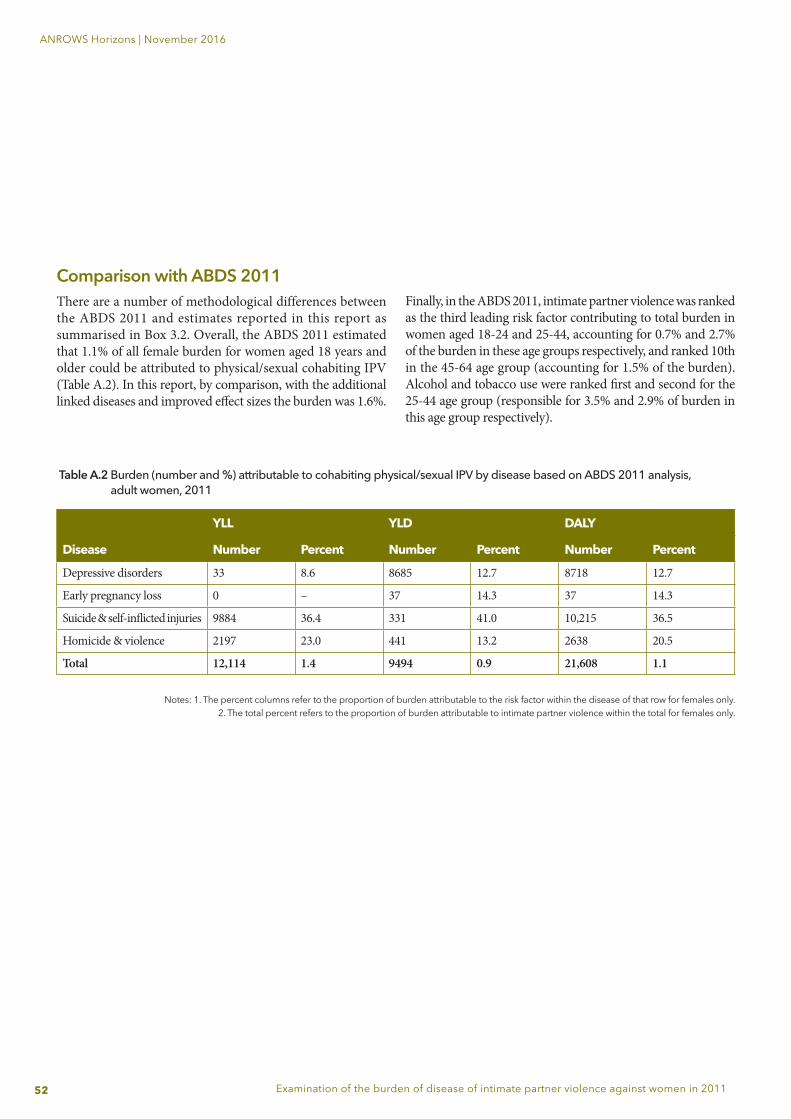
52
ANROWS Horizons | November 2016
Examination of the burden of disease of intimate partner violence against women in 2011
Comparison with ABDS 2011There are a number of methodological differences between the ABDS 2011 and estimates reported in this report as summarised in Box 3.2. Overall, the ABDS 2011 estimated that 1.1% of all female burden for women aged 18 years and older could be attributed to physical/sexual cohabiting IPV (Table A.2). In this report, by comparison, with the additional linked diseases and improved effect sizes the burden was 1.6%.
Table A.2 Burden (number and %) attributable to cohabiting physical/sexual IPV by disease based on ABDS 2011 analysis, adult women, 2011
Notes: 1. The percent columns refer to the proportion of burden attributable to the risk factor within the disease of that row for females only. 2. The total percent refers to the proportion of burden attributable to intimate partner violence within the total for females only.
YLL YLD DALY
Disease Number Percent Number Percent Number Percent
Depressive disorders 33 8.6 8685 12.7 8718 12.7
Early pregnancy loss 0 – 37 14.3 37 14.3
Suicide & self-inflicted injuries 9884 36.4 331 41.0 10,215 36.5
Homicide & violence 2197 23.0 441 13.2 2638 20.5
Total 12,114 1.4 9494 0.9 21,608 1.1
Finally, in the ABDS 2011, intimate partner violence was ranked as the third leading risk factor contributing to total burden in women aged 18-24 and 25-44, accounting for 0.7% and 2.7% of the burden in these age groups respectively, and ranked 10th in the 45-64 age group (accounting for 1.5% of the burden). Alcohol and tobacco use were ranked first and second for the 25-44 age group (responsible for 3.5% and 2.9% of burden in this age group respectively).
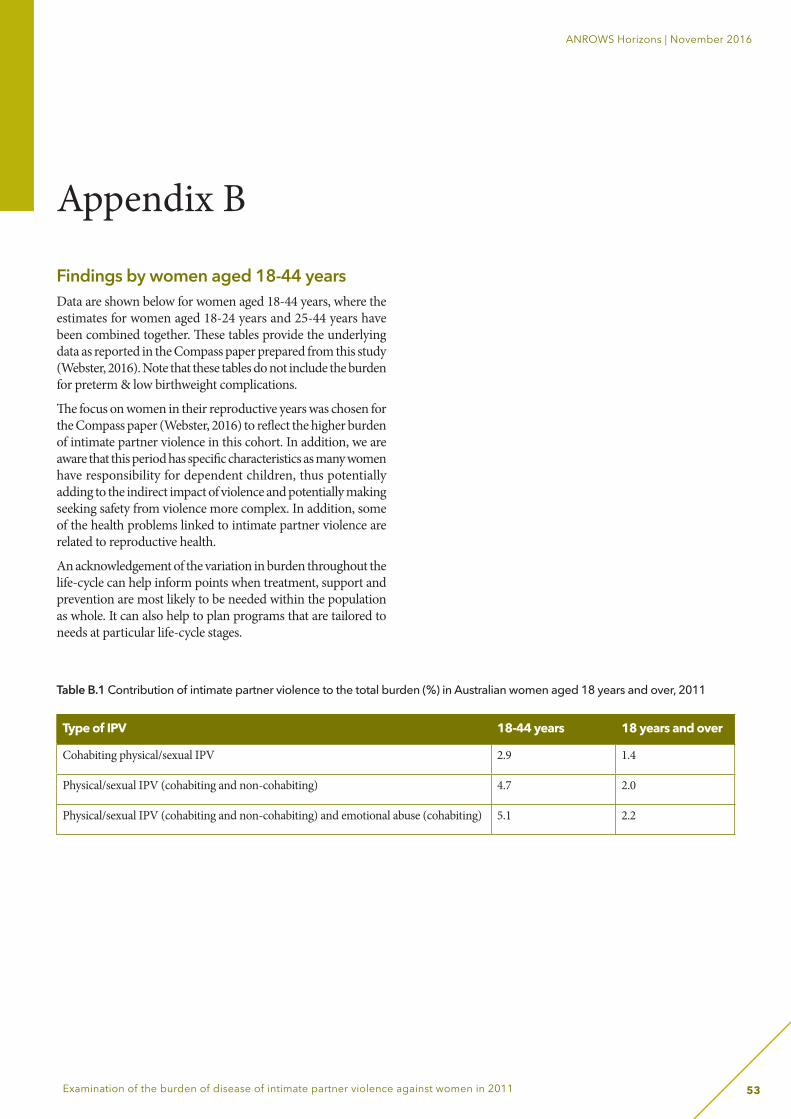
53
ANROWS Horizons | November 2016
Examination of the burden of disease of intimate partner violence against women in 2011
Appendix B
Findings by women aged 18-44 yearsData are shown below for women aged 18-44 years, where the estimates for women aged 18-24 years and 25-44 years have been combined together. These tables provide the underlying data as reported in the Compass paper prepared from this study (Webster, 2016). Note that these tables do not include the burden for preterm & low birthweight complications.
The focus on women in their reproductive years was chosen for the Compass paper (Webster, 2016) to reflect the higher burden of intimate partner violence in this cohort. In addition, we are aware that this period has specific characteristics as many women have responsibility for dependent children, thus potentially adding to the indirect impact of violence and potentially making seeking safety from violence more complex. In addition, some of the health problems linked to intimate partner violence are related to reproductive health.
An acknowledgement of the variation in burden throughout the life-cycle can help inform points when treatment, support and prevention are most likely to be needed within the population as whole. It can also help to plan programs that are tailored to needs at particular life-cycle stages.
Table B.1 Contribution of intimate partner violence to the total burden (%) in Australian women aged 18 years and over, 2011
Type of IPV 18-44 years 18 years and over
Cohabiting physical/sexual IPV 2.9 1.4
Physical/sexual IPV (cohabiting and non-cohabiting) 4.7 2.0
Physical/sexual IPV (cohabiting and non-cohabiting) and emotional abuse (cohabiting) 5.1 2.2
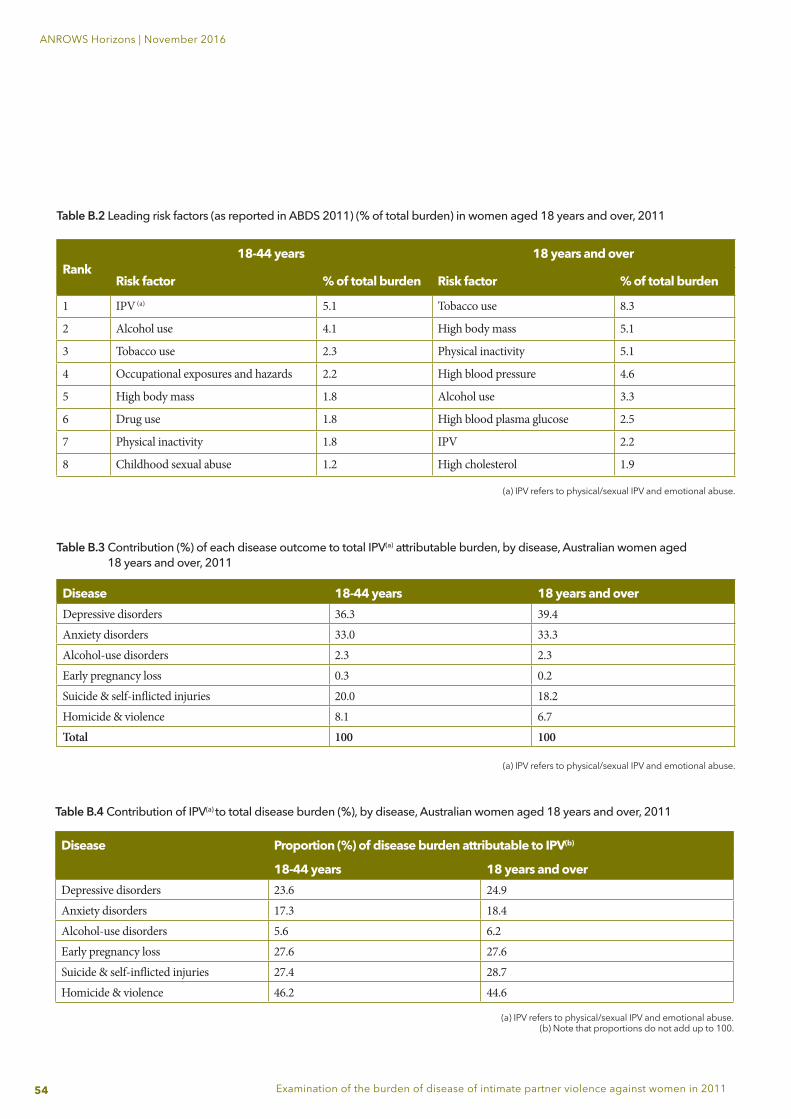
54
ANROWS Horizons | November 2016
Examination of the burden of disease of intimate partner violence against women in 2011
Table B.2 Leading risk factors (as reported in ABDS 2011) (% of total burden) in women aged 18 years and over, 2011
Rank18-44 years 18 years and over
Risk factor % of total burden Risk factor % of total burden
1 IPV (a) 5.1 Tobacco use 8.3
2 Alcohol use 4.1 High body mass 5.1
3 Tobacco use 2.3 Physical inactivity 5.1
4 Occupational exposures and hazards 2.2 High blood pressure 4.6
5 High body mass 1.8 Alcohol use 3.3
6 Drug use 1.8 High blood plasma glucose 2.5
7 Physical inactivity 1.8 IPV 2.2
8 Childhood sexual abuse 1.2 High cholesterol 1.9
(a) IPV refers to physical/sexual IPV and emotional abuse.
Table B.4 Contribution of IPV(a) to total disease burden (%), by disease, Australian women aged 18 years and over, 2011
Disease Proportion (%) of disease burden attributable to IPV(b)
18-44 years 18 years and overDepressive disorders 23.6 24.9Anxiety disorders 17.3 18.4Alcohol-use disorders 5.6 6.2Early pregnancy loss 27.6 27.6Suicide & self-inflicted injuries 27.4 28.7Homicide & violence 46.2 44.6
(a) IPV refers to physical/sexual IPV and emotional abuse.(b) Note that proportions do not add up to 100.
Table B.3 Contribution (%) of each disease outcome to total IPV(a) attributable burden, by disease, Australian women aged 18 years and over, 2011
(a) IPV refers to physical/sexual IPV and emotional abuse.
Disease 18-44 years 18 years and overDepressive disorders 36.3 39.4Anxiety disorders 33.0 33.3Alcohol-use disorders 2.3 2.3Early pregnancy loss 0.3 0.2Suicide & self-inflicted injuries 20.0 18.2Homicide & violence 8.1 6.7Total 100 100
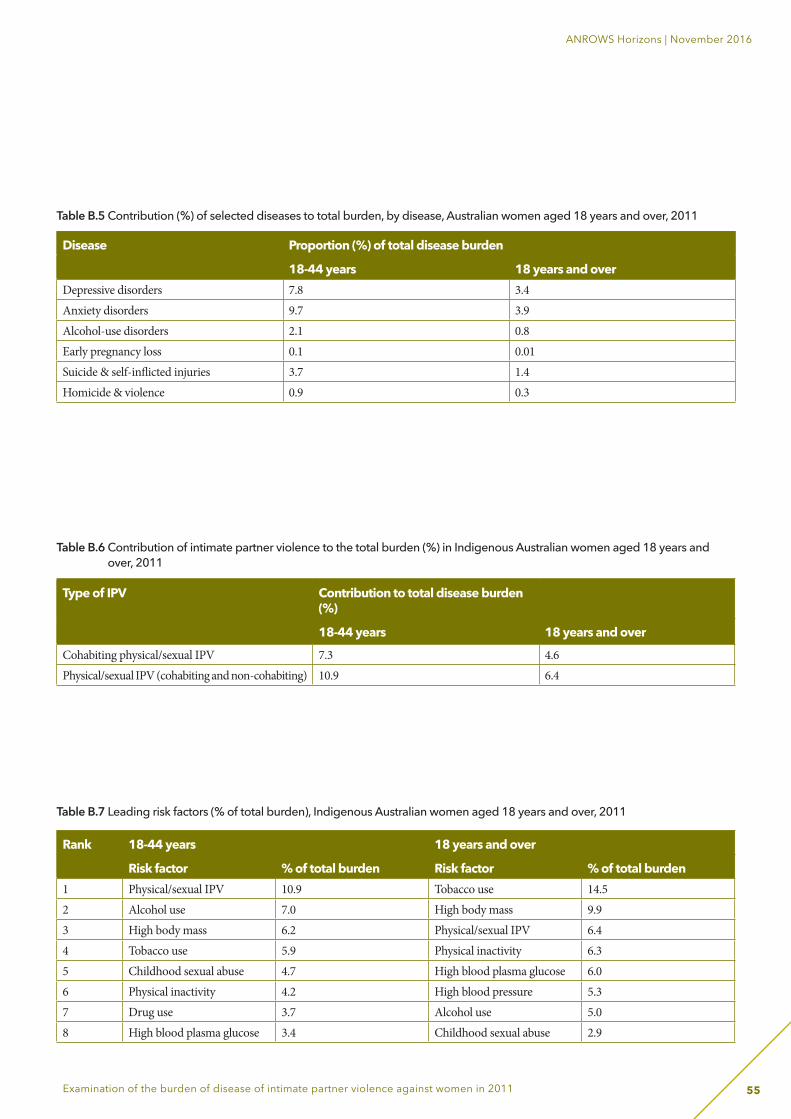
55
ANROWS Horizons | November 2016
Examination of the burden of disease of intimate partner violence against women in 2011
Table B.6 Contribution of intimate partner violence to the total burden (%) in Indigenous Australian women aged 18 years and over, 2011
Type of IPV Contribution to total disease burden (%)
18-44 years 18 years and over
Cohabiting physical/sexual IPV 7.3 4.6Physical/sexual IPV (cohabiting and non-cohabiting) 10.9 6.4
Table B.7 Leading risk factors (% of total burden), Indigenous Australian women aged 18 years and over, 2011
Rank 18-44 years 18 years and over
Risk factor % of total burden Risk factor % of total burden1 Physical/sexual IPV 10.9 Tobacco use 14.52 Alcohol use 7.0 High body mass 9.93 High body mass 6.2 Physical/sexual IPV 6.44 Tobacco use 5.9 Physical inactivity 6.35 Childhood sexual abuse 4.7 High blood plasma glucose 6.06 Physical inactivity 4.2 High blood pressure 5.37 Drug use 3.7 Alcohol use 5.08 High blood plasma glucose 3.4 Childhood sexual abuse 2.9
Disease Proportion (%) of total disease burden
18-44 years 18 years and overDepressive disorders 7.8 3.4Anxiety disorders 9.7 3.9Alcohol-use disorders 2.1 0.8Early pregnancy loss 0.1 0.01Suicide & self-inflicted injuries 3.7 1.4Homicide & violence 0.9 0.3
Table B.5 Contribution (%) of selected diseases to total burden, by disease, Australian women aged 18 years and over, 2011
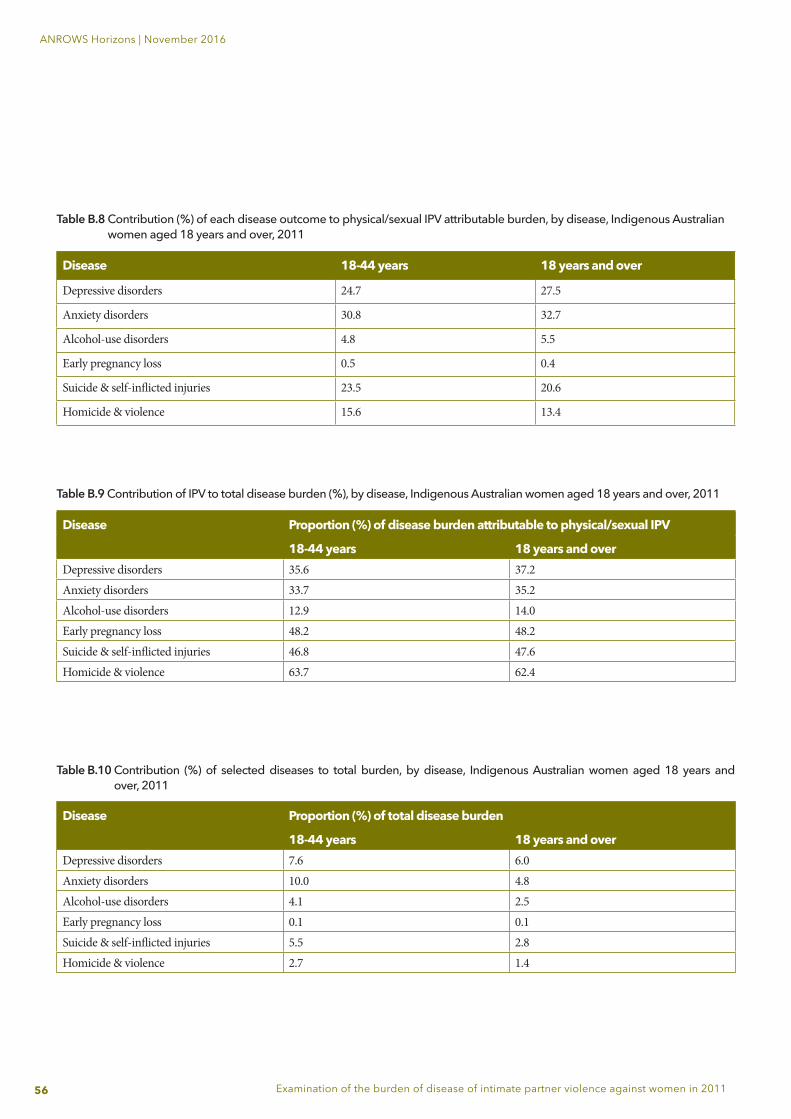
56
ANROWS Horizons | November 2016
Examination of the burden of disease of intimate partner violence against women in 2011
Table B.8 Contribution (%) of each disease outcome to physical/sexual IPV attributable burden, by disease, Indigenous Australian women aged 18 years and over, 2011
Disease 18-44 years 18 years and over
Depressive disorders 24.7 27.5
Anxiety disorders 30.8 32.7
Alcohol-use disorders 4.8 5.5
Early pregnancy loss 0.5 0.4
Suicide & self-inflicted injuries 23.5 20.6
Homicide & violence 15.6 13.4
Table B.9 Contribution of IPV to total disease burden (%), by disease, Indigenous Australian women aged 18 years and over, 2011
Disease Proportion (%) of disease burden attributable to physical/sexual IPV
18-44 years 18 years and overDepressive disorders 35.6 37.2Anxiety disorders 33.7 35.2Alcohol-use disorders 12.9 14.0Early pregnancy loss 48.2 48.2Suicide & self-inflicted injuries 46.8 47.6Homicide & violence 63.7 62.4
Table B.10 Contribution (%) of selected diseases to total burden, by disease, Indigenous Australian women aged 18 years and over, 2011
Disease Proportion (%) of total disease burden
18-44 years 18 years and overDepressive disorders 7.6 6.0Anxiety disorders 10.0 4.8Alcohol-use disorders 4.1 2.5Early pregnancy loss 0.1 0.1Suicide & self-inflicted injuries 5.5 2.8Homicide & violence 2.7 1.4
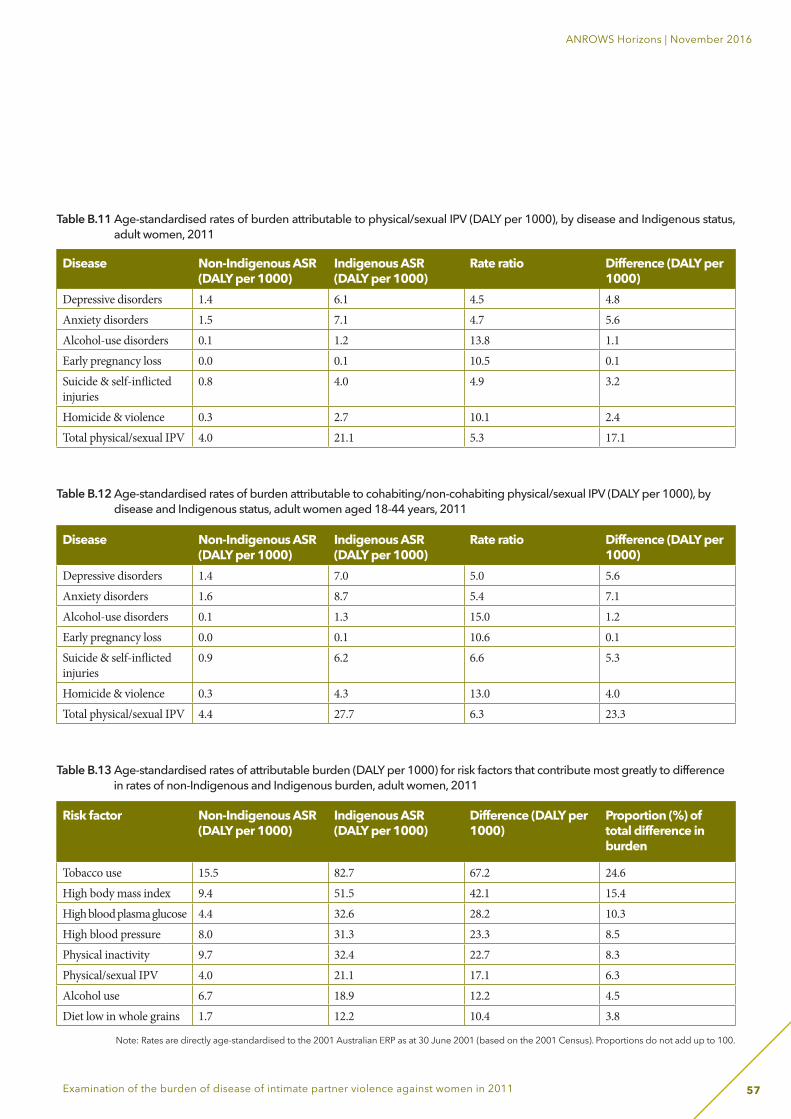
57
ANROWS Horizons | November 2016
Examination of the burden of disease of intimate partner violence against women in 2011
Table B.12 Age-standardised rates of burden attributable to cohabiting/non-cohabiting physical/sexual IPV (DALY per 1000), by disease and Indigenous status, adult women aged 18-44 years, 2011
Disease Non-Indigenous ASR (DALY per 1000)
Indigenous ASR (DALY per 1000)
Rate ratio Difference (DALY per 1000)
Depressive disorders 1.4 7.0 5.0 5.6Anxiety disorders 1.6 8.7 5.4 7.1Alcohol-use disorders 0.1 1.3 15.0 1.2Early pregnancy loss 0.0 0.1 10.6 0.1Suicide & self-inflicted injuries
0.9 6.2 6.6 5.3
Homicide & violence 0.3 4.3 13.0 4.0Total physical/sexual IPV 4.4 27.7 6.3 23.3
Table B.11 Age-standardised rates of burden attributable to physical/sexual IPV (DALY per 1000), by disease and Indigenous status, adult women, 2011
Disease Non-Indigenous ASR (DALY per 1000)
Indigenous ASR (DALY per 1000)
Rate ratio Difference (DALY per 1000)
Depressive disorders 1.4 6.1 4.5 4.8Anxiety disorders 1.5 7.1 4.7 5.6Alcohol-use disorders 0.1 1.2 13.8 1.1Early pregnancy loss 0.0 0.1 10.5 0.1Suicide & self-inflicted injuries
0.8 4.0 4.9 3.2
Homicide & violence 0.3 2.7 10.1 2.4Total physical/sexual IPV 4.0 21.1 5.3 17.1
Table B.13 Age-standardised rates of attributable burden (DALY per 1000) for risk factors that contribute most greatly to difference in rates of non-Indigenous and Indigenous burden, adult women, 2011
Risk factor Non-Indigenous ASR (DALY per 1000)
Indigenous ASR (DALY per 1000)
Difference (DALY per 1000)
Proportion (%) of total difference in burden
Tobacco use 15.5 82.7 67.2 24.6High body mass index 9.4 51.5 42.1 15.4High blood plasma glucose 4.4 32.6 28.2 10.3High blood pressure 8.0 31.3 23.3 8.5Physical inactivity 9.7 32.4 22.7 8.3Physical/sexual IPV 4.0 21.1 17.1 6.3Alcohol use 6.7 18.9 12.2 4.5Diet low in whole grains 1.7 12.2 10.4 3.8
Note: Rates are directly age-standardised to the 2001 Australian ERP as at 30 June 2001 (based on the 2001 Census). Proportions do not add up to 100.
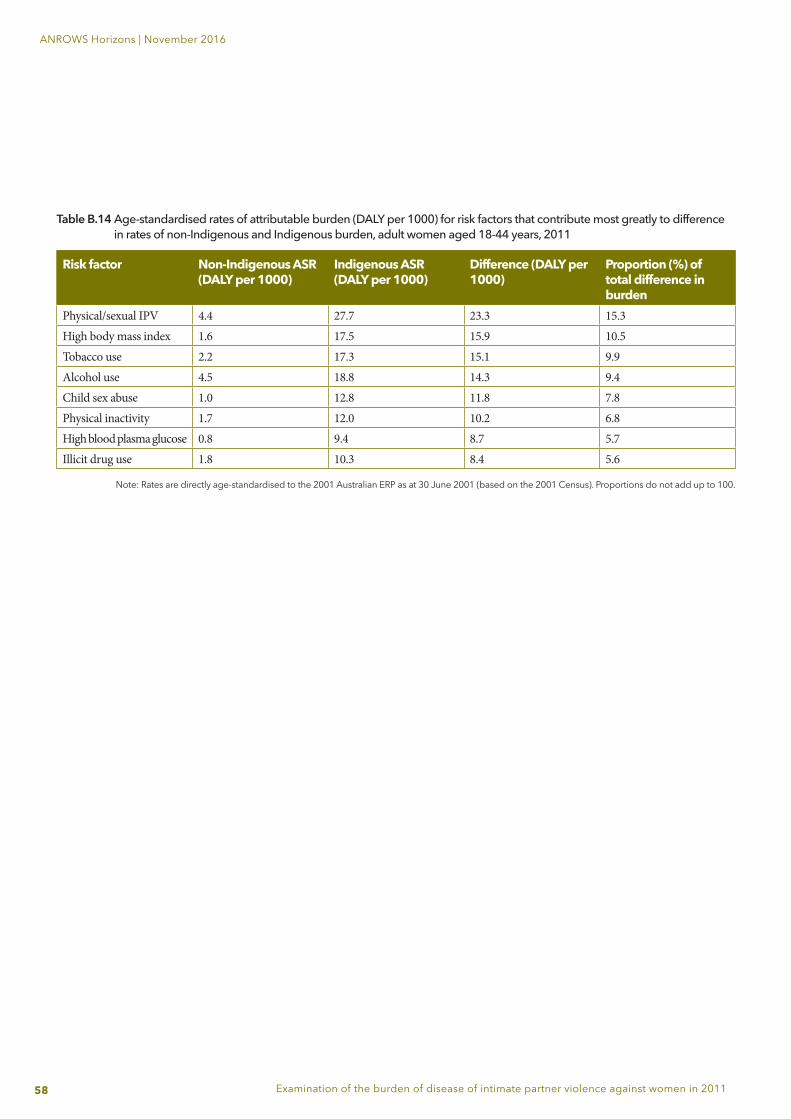
58
ANROWS Horizons | November 2016
Examination of the burden of disease of intimate partner violence against women in 2011
Risk factor Non-Indigenous ASR (DALY per 1000)
Indigenous ASR (DALY per 1000)
Difference (DALY per 1000)
Proportion (%) of total difference in burden
Physical/sexual IPV 4.4 27.7 23.3 15.3High body mass index 1.6 17.5 15.9 10.5Tobacco use 2.2 17.3 15.1 9.9Alcohol use 4.5 18.8 14.3 9.4Child sex abuse 1.0 12.8 11.8 7.8Physical inactivity 1.7 12.0 10.2 6.8High blood plasma glucose 0.8 9.4 8.7 5.7Illicit drug use 1.8 10.3 8.4 5.6
Table B.14 Age-standardised rates of attributable burden (DALY per 1000) for risk factors that contribute most greatly to difference in rates of non-Indigenous and Indigenous burden, adult women aged 18-44 years, 2011
Note: Rates are directly age-standardised to the 2001 Australian ERP as at 30 June 2001 (based on the 2001 Census). Proportions do not add up to 100.
59
ANROWS Horizons | November 2016
Examination of the burden of disease of intimate partner violence against women in 2011
ReferencesAckard, D. M., Eisenberg, M. E., & Neumark-Sztainer, D. (2007). Long-term impact of adolescent dating violence on the behavioral and psychological health of male and female youth. Journal of Pediatrics, 151, 476-81.
Afifi, T. O., Enns, M. W., Cox, B. J., Asmundson, G. J., Stein, M. B., & Sareen, J. (2008). Population attributable fractions of psychiatric disorders and suicide ideation and attempts associated with adverse childhood experiences. American Journal of Public Health, 98(5), 946-52.
American Institute for Cancer Research. (2007). Food, nutrition, and physical activity, and the prevention of cancer: A global perspective. Washington DC: AICR.
Astbury, J., Atkinson, J., Duke, J. E., Easteal, P. L., Kurrie, S. E., Tait, P. R., & Turner, J. (2000). The impact of domestic violence on individuals. Medical Journal of Australia, 173(8), 427-31.
Australian Bureau of Statistics. (2009). National Aboriginal and Torres Strait Islander Social Survey 2008 (cat. no. 4714.0). Canberra: ABS.
Australian Bureau of Statistics. (2010). Crime victimisation, Australia, 2008-09, (Cat. no. 4530.0). Canberra: ABS.
Australian Bureau of Statistics. (2013a). Personal Safety, Australia, 2012, (Cat. no. 4906.0). Canberra: ABS.
Australian Bureau of Statistics. (2012). Customised report on the 2012 Personal Safety Survey (Cat. no. 4906.0). Canberra: ABS.
Australian Institute of Health and Welfare. (2006). Family violence among Aboriginal and Torres Strait Islander peoples (Cat. no. IHW 17). Canberra: AIHW.
Australian Institute of Health and Welfare. (2014). Assessment of Global Burden of Disease 2010 methods for the Australian context (Australian Burden of Disease Study working paper no. 1). Canberra: AIHW.
Australian Institute of Health and Welfare. (2015). Aboriginal and Torres Strait Islander health performance framework 2014 report: Detailed analyses (Cat. no. IHW 167). Retrieved April 21, 2016 from http://www.aihw.gov.au/publication-detail/?id=60129550779
Australian Institute of Health and Welfare (2016a). Australian Burden of Disease Study: Impact and causes of illness and death in Australia 2011. Australian Burden of Disease Study series no. 3. BOD 4. Canberra: AIHW.
Australian Institute of Health and Welfare. (2016b). Australian Burden of Disease Study: impact and causes of illness and death in Aboriginal and Torres Strait Islander people 2011. Australian Burden of Disease Study series no. 6. Cat. no. BOD 7. Canberra: AIHW.
Australian Institute of Health and Welfare. (2016c). Australian Burden of Disease Study 2011: Methods and supplementary material. Australian Burden of Disease Study series no. 5. Cat. no. BOD 6. Canberra: AIHW.
Australian Institute of Health and Welfare. (2016d). National hospital morbidity database (NHMD). Retrieved 11 August from http://www.aihw.gov.au/hospitals-data/national-hospital-morbidity-database
Banyard, V. L., Potter, S., & Turner, H. (2011). The impact of interpersonal violence in adult women’s job satisfaction and productivity: The mediating roles of mental and physical health. Psychology of Violence, 1(1), 16-28.
Begg, S., Vos, T., Barker, B., Stevenson, C., Stanley, L., & Lopez, A. D. (2007). The burden of disease and injury in Australia 2003. Canberra: AIHW.
Beydoun, H. A., Beydoun, M. A., Kaufman, J. S., Lo, B., & Zonderman, A. B. (2012). Intimate partner violence against adult women and its association with major depressive disorder, depressive symptoms and postpartum depression: A systematic review and meta-analysis. Social Science & Medicine, 75, 959-75.
Blagg, H. (2008). Crime, Aboriginality and the decolonisation of justice. Sydney: Hawkins Press.
Bryant, W., & Cussen, T., (2015). Homicide in Australia: 2010-11 to 2011-12: National Homicide Monitoring Program Report (Monitoring report no. 23). Canberra: Australian Institute of Criminology.
Campbell, R., Dworkin, E., & Cabral, G. (2009). An ecological model of the impact of sexual assault on women's mental health. Trauma, Violence, & Abuse, 10(3), 225-46.
Campo, M., Kaspiew, R., Moore, S., & Tayton, S. (2014). Children affected by domestic and family violence: A review of domestic and family violence prevention, early intervention and response services. Melbourne: Australian Institute of Family Studies.
Capaldi, D. M., Knoble, N. B., Shortt, J. W., & Kim, H. K. (2012). A systematic review of risk factors for intimate partner violence. Partner Abuse, 3(2), 231.
60
ANROWS Horizons | November 2016
Examination of the burden of disease of intimate partner violence against women in 2011
Chen, L. P., Murad, M. H., Paras, M. L., Colbenson, K. M., Sattler, A. L., Goranson, E. N., ... & Zirakzadeh, A. (2010). Sexual abuse and lifetime diagnosis of psychiatric disorders: Systematic review and meta-analysis. Mayo Clinic Proceedings, 85(7), 618-29.
Chowdhary, N., & Patel, V. (2008). The effect of spousal violence on women’s health: Findings from the Stree Arogya Shodh in Goa, India. Journal of Postgraduate Medicine, 54(4), 306-12.
Coker, A. L., Davis, K. E., Arias, I., Desai, S., Sanderson, M., Brandt, H. M., & Smith, P. H. (2002). Physical and mental health effects of intimate partner violence for men and women. American Journal of Preventive Medicine, 23(4), 260-8.
Coker, A. L., Sanderson, M., & Dong, B. (2004). Partner violence during pregnancy and risk of adverse pregnancy outcomes. Paediatric and Perinatal Epidemiology, 18, 260-9.
Council of Australian Governments. (2011). The national plan to reduce violence against women and their children: Including the first three-year action plan. Canberra: FAHCSIA.
Cox, P. (2015). Violence against women in Australia: Additional analysis of the Australian Bureau of Statistics' Personal Safety Survey, 2012. Sydney: ANROWS.
Devries, K. M., Child, J. C., Bacchus, L. J., Mak, J., Falder, G., Graham, K., ... & Heise, L. (2014). Intimate partner violence victimization and alcohol consumption in women: A systematic review and meta‐analysis. Addiction, 109(3), 379-91.
Devries, K. M., Kishor, S., Johnson, H., Stöckl, H., Bacchus, L. J., Garcia-Moreno, C., & Watts, C. (2010). Intimate partner violence during pregnancy: Analysis of prevalence data from 19 countries. Reproductive Health Matters, 18(36), 158-70.
Devries, K. M., Mak, J. Y., Bacchus, L. J., Child, J. C., Falder, G., Petzold, M., ... & Watts, C. H. (2013). Intimate partner violence and incident depressive symptoms and suicide attempts: A systematic review of longitudinal studies. PLoS Medicine, 10(5).
Evans, S. E., Davies, C., & DiLillo, D. (2008). Exposure to domestic violence: A meta-analysis of child and adolescent outcomes. Aggression and Violent Behavior, 13(2), 131-40.
Exner-Cortens, D., Eckenrode, J., & Rothman, E. (2013). Longitudinal associations between teen dating violence victimization and adverse health outcomes. Pediatrics,131(1), 71-78.
Flood, M., & Fergus, L. (2008). An assault on our future: The impact of violence on young people and their relationships. Sydney: White Ribbon Foundation.
Forouzanfar, M. H., Alexander, L., Anderson, H. R., Bachman, V. F., Biryukov, S., Brauer, M., … Murray, C. J. (2015). Global, regional, and national comparative risk assessment of 79 behavioural, environmental and occupational, and metabolic risks or clusters of risks in 188 countries, 1990-2013: A systematic analysis for the Global Burden of Disease Study 2013. The Lancet, 386(10010), 2287-323.
Gilbert, R., Spatz Widom, C., Browne, K., Fergusson, D., Webb, E., & Janson, S. (2009). Burden and consequences of child maltreatment in high-income countries. The Lancet, 373(9657), 68-81.
Gulliver, P. J., & Dixon, R. S. (2014). Immediate and long-term outcomes of assault in pregnancy. Australian and New Zealand Journal of Obstetrics and Gynaecology, 54(3), 256-62.
Holt, S., Buckley, H., & Whelan, S. (2008). The impact of exposure to domestic violence on children and young people: A review of the literature. Child Abuse & Neglect, 32(8), 797-810.
Humphreys, C., Houghton, C., & Ellis, J. (2008). Literature review: Better outcomes for children and young people experiencing domestic abuse—directions for good practice. Edinburgh: The Scottish Government.
Janssen, P. A., Holt, V. L., Sugg, N. K., Emanuel, I., Critchlow, C. M., & Henderson, A. D. (2003). Intimate partner violence and adverse pregnancy outcomes: A population-based study. American Journal of Obstetrics and Gynecology, 188(5), 1341-7.
Jun, H. J., Rich-Edwards, J. W., Boynton-Jarrett, R., & Wright, R. J. (2008). Intimate partner violence and cigarette smoking: Association between smoking risk and psychological abuse with and without co-occurrence of physical and sexual abuse. American Journal of Public Health, 98(3), 527-35.
Karch, D. L., Logan, J., McDaniel, D., Parks, S., & Patel, N. (2012). Surveillance for violent deaths—National violent death reporting system, 16 states, 2009. Surveillance summaries, 61(SS06) 1-43.
Karch, D. L., Lubell, K. M., Friday, J., Patel, N., & Williams, D. D. (2008). Surveillance for violent deaths—National violent death reporting system, 16 states, 2005. Surveillance summaries, 57(SS03) 1-45, 45.
Kimerling, R., Alvarez, J., Pavao, J., Mack, K. P., Smith, M. W., & Baumrind, N. (2009). Unemployment among women: Examining the relationship of physical and psychological intimate partner violence and posttraumatic stress disorder. Journal of Interpersonal Violence, 24(3), 450-63.
61
ANROWS Horizons | November 2016
Examination of the burden of disease of intimate partner violence against women in 2011
KPMG Human and Social Services. (2014). Too costly to ignore: The economic impact of gender based violence in South Africa. [n.p.]:KPMG Services.
Last, J. (Ed.). (2001). A dictionary of epidemiology (4th ed.). New York: Oxford University Press.
Lim, S. S., Vos, T., Flaxman, A. D., Danaei, G., Shibuya, K., Adair-Rohani, H., ... & Davis, A. (2013). A comparative risk assessment of burden of disease and injury attributable to 67 risk factors and risk factor clusters in 21 regions, 1990-2010: A systematic analysis for the Global Burden of Disease Study 2010. The Lancet, 380(9859), 2224-60.
Loxton, D., Powers, J., Schofield, M., Hussain, R., & Hosking, S. (2009). Inadequate cervical cancer screening among mid-aged Australian women who have experienced partner violence. Preventive Medicine, 48(2), 184-88.
Lum On, M., Ayre, J., Webster, K., & Moon, L. (2016). Examination of the health outcomes of intimate partner violence against women: State of knowledge paper (ANROWS Landscapes, 03/2016). Sydney: ANROWS.
Mason, F., & Lodrick, Z. (2013). Psychological consequences of sexual assault. Best Practice & Research Clinical Obstetrics & Gynaecology, 27(1), 27-37.
Nancarrow, H. (2010). Restorative justice for domestic and family violence: Hopes and fears of Indigenous and non-Indigenous Australian women. In J. Ptacek (Ed.), Restorative Justice and Violence Against Women (p. 123-149). New York: Oxford University Press.
National Council to Reduce Violence against Women and their Children. (2009). The cost of violence against women and their children. Canberra: FAHCSIA.
Oberin, J. (2001). Domestic and family violence: The latest research. Parity, 14(2), 25-7.
Okuda, M., Olfson, M., Hasin, D., Grant, B. F., Lin, K. H., & Blanco, C. (2011). Mental health of victims of intimate partner violence: Results from a national epidemiologic survey. Psychiatric Services, 62(8), 959-62.
Pavey, A. R., Gorman, G. H., Kuehn, D., Stokes, T. A., & Hisle-Gorman, E. (2014). Intimate partner violence increases adverse outcomes at birth and in early infancy. The Journal of Pediatrics, 165(5), 1034-9.
Pointer, S. & Kreisfeld, R. (2012). Hospitalised interpersonal violence and perpetrator coding, Australia, 2002-05. Injury research and statistics series no. 77. Cat. no. INJCAT 153. Canberra: Australian Institute of Health and Welfare.
Richards, K. (2011). Children’s exposure to domestic violence in Australia (Trends and issues in crime and criminal justice, no. 419). Canberra: Australian Institute of Criminology.
Roberts, T. A., Klein, J. D., & Fisher, S. (2003). Longitudinal effect of intimate partner abuse on high-risk behavior among adolescents. Archives of Pediatrics & Adolescent Medicine, 157(9), 875-81.
Steering Committee for the Review of Government Service Provision, (2014). Overcoming Indigenous Disadvantage: Key Indicators 2014. Canberra: Productivity Commission.
Staggs, S. L., Long, S. M., Mason, G. E., Krishnan, S., & Riger, S. (2007). Intimate partner violence, social support, and employment in the post-welfare reform era. Journal of Interpersonal Violence, 22(3), 345-67.
Stith, S. M., Rosen, K. H., Middleton, K. A., Busch, A. L., Lundeberg, K., & Carlton, R. P. (2000). The intergenerational transmission of spouse abuse: A meta-analysis. Journal of Marriage and Family, 62(3), 640-54.
Suglia, S. F., Duarte, C. S., & Sandel, M. T. (2011). Housing quality, housing instability, and maternal mental health. Journal of Urban Health, 88(6), 1105-16.
Taft, A. J., & Watson, L. F. (2007). Termination of pregnancy: Associations with partner violence and other factors in a national cohort of young Australian women. Australian and New Zealand Journal of Public Health, 31(2), 135-42.
Tually, S., Faulkner, D., Cutler, C., & Slatter, M. (2008). Women, domestic and family violence and homelessness: A synthesis report. Adelaide: Flinders Institute for Housing, Urban and Regional Research Flinders University.
US Burden of Disease Collaborators. (2013). The state of US health, 1990-2010: Burden of diseases, injuries, and risk factors. The Journal of the American Medical Association, 210(6): 591-606.
Urquia, M. L., O'Campo, P. J., Heaman, M. I., Janssen, P. A., & Thiessen, K. R. (2011). Experiences of violence before and during pregnancy and adverse pregnancy outcomes: An analysis of the Canadian Maternity Experiences Survey. BMC Pregnancy and Childbirth, 11(1), 42.
62
ANROWS Horizons | November 2016
Examination of the burden of disease of intimate partner violence against women in 2011
Van Dulmen, M. H., Klipfel, K. M., Mata, A. D., Schinka, K. C., Claxton, S. E., Swahn, M. H., & Bossarte, R. M. (2012). Cross-lagged effects between intimate partner violence victimization and suicidality from adolescence into adulthood. Journal of Adolescent Health, 51(5), 510-16.
Victorian Health Promotion Foundation. (2004). The health costs of violence: Measuring the burden of disease associated with intimate partner violence. Melbourne: Victorian Health Promotion Foundation.
Vos, T., Astbury, J., Piers, L. S., Magnus, A., Heenan, M., Stanley, L., ... & Webster, K. (2006). Measuring the impact of intimate partner violence on the health of women in Victoria, Australia. Bulletin of the World Health Organization, 84(9), 739-44.
Walsh, K., Galea, S., & Koenen, K. C. (2012). Mechanisms underlying sexual violence exposure and psychosocial sequelae: A theoretical and empirical review. Clinical Psychology, 19(3), 260-75.
Webster, K. (2016). A preventable burden: Measuring and addressing the prevalence and health impacts of intimate partner violence in Australian women (ANROWS Compass, 07/2016). Sydney: ANROWS.
Woolhouse, H., Gartland., D., Hegarty, K., Donath, S., & Brown, S. J. (2012). Depressive symptoms and intimate partner violence in the 12 months after childbirth: A prospective pregnancy cohort study. BJOG: An International Journal of Obstetrics & Gynaecology, 119(3), 315-23.
World Health Organization. (2013). Global and regional estimates of violence against women: Prevalence and health effects of intimate partner violence and non-partner sexual violence. Geneva, Switzerland: WHO.
World Health Organization Commission on Social Determinants of Health. (2008). Closing the gap in a generation: Health equity through action on the social determinants of health: Final report. Geneva, Switzerland: WHO.
Wright, E. M. (2012). The relationship between social support and intimate partner violence in neighborhood context. Crime & Delinquency, 61(10), 1333-59.


6
ANROWS Horizons | Month 0000
Publication title