16. UNIT WISE-QUESTION BANK UNIT-1 1. TWO MARKS QUESTION...
85
16. UNIT WISE-QUESTION BANK UNIT-1 1. TWO MARKS QUESTION WITH ANSWERS: 1. What are the uses of multi feature cubes? Multi feature cubes, which compute complex queries involving multiple dependent aggregates at multiple granularity. These cubes are very useful in practice. Many complex data mining queries can be answered by multi feature cubes without any significant increase in computational cost, in comparison to cube computation for simple queries with standard data cubes. 2. Compare OLTP and OLAP Systems. If an on-line operational database systems is used for efficient retrieval, efficient storage and management of large amounts of data, then the system is said to be on-line transaction processing. Data warehouse systems serves users (or) knowledge workers in the role of data analysis and decision-making. Such systems can organize and present data in various formats. These systems are known as on-line analytical processing systems. 3. What is data warehouse metadata? Metadata are data about data. When used in a data warehouse, metadata are the data that define warehouse objects. Metadata are created for the data names and definitions of the given warehouse. Additional metadata are created and captured for time stamping any extracted data, the source of the extracted data, and missing fields that have been added by data cleaning or integration processes. 4. Explain the differences between star and snowflake schema. The dimension table of the snowflake schema model may be kept in normalized Form to reduce redundancies. Such a table is easy to maintain and saves storage space.
Transcript of 16. UNIT WISE-QUESTION BANK UNIT-1 1. TWO MARKS QUESTION...
16. UNIT WISE-QUESTION BANK
UNIT-1
1. TWO MARKS QUESTION WITH ANSWERS:
1. What are the uses of multi feature cubes?
Multi feature cubes, which compute complex queries involving multiple dependent
aggregates at multiple granularity. These cubes are very useful in practice. Many complex
data mining queries can be answered by multi feature cubes without any significant
increase in computational cost, in comparison to cube computation for simple queries with
standard data cubes.
2. Compare OLTP and OLAP Systems.
If an on-line operational database systems is used for efficient retrieval, efficient storage
and management of large amounts of data, then the system is said to be on-line
transaction processing. Data warehouse systems serves users (or) knowledge workers in
the role of data analysis and decision-making. Such systems can organize and present
data in various formats. These systems are known as on-line analytical processing
systems.
3. What is data warehouse metadata?
Metadata are data about data. When used in a data warehouse, metadata are the data that
define warehouse objects. Metadata are created for the data names and definitions of the
given warehouse. Additional metadata are created and captured for time stamping any
extracted data, the source of the extracted data, and missing fields that have been added
by data cleaning or integration processes.
4. Explain the differences between star and snowflake schema.
The dimension table of the snowflake schema model may be kept in normalized
Form to reduce redundancies. Such a table is easy to maintain and saves storage space.
5. In the context of data warehousing what is data transformation?
`In data transformation, the data are transformed or consolidated into forms appropriate
for mining. Data transformation can involve the following:
Smoothing, Aggregation, Generalization, Normalization, Attribute construction
6. Define Slice and Dice operation.
The slice operation performs a selection on one dimension of the cube resulting in
A sub cube. The dice operation defines a sub cube by performing a
selection on two (or) more dimensions.
7. List the characteristics of a data ware house.
There are four key characteristics which separate the data warehouse from
other major operational systems:
1. Subject Orientation: Data organized by subject
2. Integration: Consistency of defining parameters
3. Non-volatility: Stable data storage medium
4. Time-variance: Timeliness of data and access terms
8. What are the various sources for data warehouse?
Handling of relational and complex types of data: Because relational databases and
data warehouses are widely used, the development of efficient and effective data mining
systems for such data is important.
Mining information from heterogeneous databases and global information systems:
Local- and wide-area computer networks (such as the Internet) connect many sources of
data, forming huge, distributed, and heterogeneous databases.
2. THREE MARKS QUESTION WITH ANSWERS:
1. What is data warehouse?
A data warehouse is a repository of multiple heterogeneous data sources organized under a
unified schema at a single site to facilitate management decision making. (Or) A data
warehouse is a subject-oriented, time-variant and nonvolatile collection of data in support of
-making process.
2. Differentiate fact table and dimension table.
Fact table contains the name of facts (or) measures as well as keys to each of the related
dimensional tables. A dimension table is used for describing the dimension. (e.g.) A
dimension table for item may contain the attributes item_ name, brand and type.
3 Briefly discuss the schemas for multidimensional databases.
Stars schema: The most common modeling paradigm is the star schema, in which the data
warehouse contains (1) a large central table (fact table) containing the bulk of the data, with
no redundancy, and (2) a set of smaller attendant tables (dimension tables), one for each
dimension.
Snowflakes schema: The snowflake schema is a variant of the star schema model, where
Some dimension tables are normalized, thereby further splitting the data into additional
tables. The resulting schema graph forms a shape similar to a snowflake.
Fact Constellations: Sophisticated applications may require multiple fact tables to share
dimension tables. This kind of schema can be viewed as a collection of stars, and hence is
called a galaxy schema or a fact constellation.

4. How is a data warehouse different from a database? How are they similar?
Data warehouse is a repository of multiple heterogeneous data sources, organized under a
unified schema at a single site in order to facilitate management decision-making. A
relational database is a collection of tables, each of which is assigned a unique name. Each
table consists of a set of attributes (columns or fields) and usually stores a large set of
tuples(records or rows). Each tuple in a relational table represents an object identified by a
unique key and described by a set of attribute values. Both are used to store and manipulate
the data.
5. What is descriptive and predictive data mining?
Descriptive data mining, which describes data in a concise and summarative manner and
presents interesting general properties of the data.
Predictive data mining, which analyzes data in order to construct one or a set of models
and attempts to predict the behavior of new data sets. Predictive data mining, such as
classification, regression analysis, and trend analysis.
6. Differentiate data mining and data warehousing.
Data mining
term is actually a misnomer. Remember that the mining of gold from rocks or sand is
referred to as gold mining rather than rock or sand mining. Thus, data mining should have
A data warehouse is usually modeled by a multidimensional database structure, where each
dimension corresponds to an attribute or a set of attributes in the schema, and each cell
stores the value of some aggregate measure, such as count or sales amount

3. Five-marks questions and answers
1) Define data warehouse? Differentiate between operational database systems and data
warehouses?
A) A data warehouse is a subject-oriented, integrated, time-variant and non-volatile collection
of data in support of management's decision making process.
operational systems data warehousing systems
Operational systems are generally designed
to support high-volume transaction
processing with minimal back-end
reporting.
Data warehousing systems are generally
designed to support high-volume analytical
processing (i.e. OLAP) and subsequent, often
elaborate report generation.
Operational systems are generally process-
oriented or process-driven, meaning that
they are focused on specific business
processes or tasks. Example tasks include
billing, registration, etc.
Data warehousing systems are
generally subject-oriented, organized around
business areas that the organization needs
information about. Such subject areas are
usually populated with data from one or more
operational systems. As an example, revenue
may be a subject area of a data warehouse that
incorporates data from operational systems
that contain student tuition data, alumni gift
data, financial aid data, etc.
Operational systems are generally
concerned with current data.
Data warehousing systems are generally
concerned with historical data.
Data within operational systems are
generally updated regularly according to
need.
Data within a data warehouse is
generally non-volatile, meaning that new data
may be added regularly, but once loaded, the
data is rarely changed, thus preserving an

ever-growing history of information. In short,
data within a data warehouse is
generally read-only.
Operational systems are generally
optimized to perform fast inserts and
updates of relatively small volumes of data.
Data warehousing systems are generally
optimized to perform fast retrievals of
relatively large volumes of data.
Operational systems are
generally application-specific, resulting in a
multitude of partially or non-integrated
systems and redundant data (e.g. billing
data is not integrated with payroll data).
Data warehousing systems are
generally integrated at a layer above the
application layer, avoiding data redundancy
problems.
Operational systems generally require
a non-trivial level of computing
skills amongst the end-user community.
Data warehousing systems generally appeal to
an end-user community with a wide range of
computing skills, from novice to expert users.
2) Explain the architecture of data warehouse.
A) The Design of a Data Warehouse: A Business Analysis Framework
Four different views regarding the design of a data warehouse must be considered: the top-
down view, the data source view, the data warehouse view, and the business query view.
The top-down view allows the selection of relevant information necessary for the data
warehouse.
The data source view exposes the information being captured, stored and managed by
operational systems.
The data warehouse view includes fact tables and dimension tables.
Finally the business query view is the Perspective of data in the data warehouse from the
viewpoint of the end user.

Three-tier Data warehouse architecture
The bottom tier is ware-house database server which is almost always a relational
database system. The middle tier is an OLAP server which is typically implemented using either
(1) a Relational OLAP (ROLAP) model, (2) a Multidimensional OLAP (MOLAP) model. The
top tier is a client, which contains query and reporting tools, analysis tools, and/or data mining
tools (e.g., trend analysis, prediction, and so on).
From the architecture point of view, there are three data warehouse models: the enterprise
warehouse, the data mart, and the virtual warehouse
Enterprise warehouse: An enterprise warehouse collects all of the information about
subjects spanning the entire organization. It provides corporate-wide data integration, usually
from one or more operational systems or external information providers, and is cross-functional
in scope. It typically contains detailed data as well as summarized data, and can range in size
from a few gigabytes to hundreds of gigabytes, terabytes, or beyond.
Data mart: A data mart contains a subset of corporate-wide data that is of value to a specific
group of users. The scope is connected to specific, selected subjects. For example, a marketing
data mart may connect its subjects to customer, item, and sales. The data contained in data marts
tend to be summarized. Depending on the source of data, data marts can be categorized into the
following two classes:
(i).Independent data marts are sourced from data captured from one or more operational systems
or external information providers, or from data generated locally within a particular department
or geographic area.
(ii).Dependent data marts are sourced directly from enterprise data warehouses
Virtual warehouse: A virtual warehouse is a set of views over operational databases. For
efficient query processing, only some of the possible summary views may be materialized. A
virtual warehouse is easy to build but requires excess capacity on operational database servers.
3). Discuss Extraction-Transformation-loading with neat diagram?
A) The ETL (Extract Transformation Load) process
In this section we will discussed about the 4 major process of the data warehouse. They are
extract (data from the operational systems and bring it to the data warehouse), transform (the
data into internal format and structure of the data warehouse), cleanse (to make sure it is of
sufficient quality to be used for decision making) and load (cleanse data is put into the data
warehouse).
The four processes from extraction through loading often referred collectively as Data Staging.

EXTRACT: Some of the data elements in the operational database can be reasonably be
expected to be useful in the decision making, but others are of less value for that purpose. For
this reason, it is necessary to extract the relevant data from the operational database before
bringing into the data warehouse. Many commercial tools are available to help with the
extraction process. Data Junction is one of the commercial products. The user of one of these
tools typically has an easy-to-use windowed interface by which to specify the following:
TRANSFORM
The operational databases developed can be based on any set of priorities, which keeps changing
with the requirements. Therefore those who develop data warehouse based on these databases are
typically faced with inconsistency among their data sources. Transformation process deals with
data names in different databases. Employee Name may be EMP_NAME in one database,
ENAME in the other. Thus one set of Data Names are picked and used consistently in the data
warehouse. Once all the data elements have right names, they must be converted to common
formats. The conversion may encompass the following:

Characters must be converted ASCII to EBCDIC or vice versa.
Mixed Text may be converted to all uppercase for consistency.
Numerical data must be converted in to a common format.
Data Format has to be standardized.
Measurement may have to convert. (Rs/ $)
Coded data (Male/ Female, M/F) must be converted into a common format.
All these transformation activities are automated and many commercial products are available to
perform the tasks. Data MAPPER from Applied Database Technologies is one such
comprehensive tool.
CLEANSING
Information quality is the key consideration in determining the value of the information. The
developer of the data warehouse is not usually in a position to change the quality of its
underlying historic data, though a data warehousing project can put spotlight on the data quality
issues and lead to improvements for the future. It is, therefore, usually necessary to go through
the data entered into the data warehouse and make it as error free as possible. This process is
known as Data Cleansing.
Data Cleansing must deal with many types of possible errors. These include missing data and
incorrect data at one source; inconsistent data and conflicting data when two or more source is
involved. There are several algorithms followed to clean the data, which will be discussed in the
coming lecture notes.
LOADING
Loading often implies physical movement of the data from the computer(s) storing the source
database(s) to that which will store the data warehouse database, assuming it is different. This
takes place immediately after the extraction phase. The most common channel for data

movement is a high-speed communication link. Ex: Oracle Warehouse Builder is the API from
Oracle, which provides the features to perform the ETL task on Oracle Data Warehouse.
4). Discuss schemas for multi-dimensional tables?
A) Schemas for Multidimensional Databases
Star schema: The star schema is a modeling paradigm in which the data warehouse contains
(1) a large central table (fact table), and (2) a set of smaller attendant tables (dimension
tables), one for each dimension. The schema graph resembles a starburst, with the dimension
tables displayed in a radial pattern around the central fact table.
Figure Star schema of a data warehouse for sales.
Snowflake schema: The snowflake schema is a variant of the star schema model, where some
dimension tables are normalized, thereby further splitting the data into additional tables. The
resulting schema graph forms a shape similar to a snowflake. The major difference between the
snowflake and star schema models is that the dimension tables of the snowflake model may be
kept in normalized form. Such a table is easy to maintain and also saves storage space because a
large dimension table can be extremely large when the dimensional structure is included as
columns.
Figure: Snowflake schema of a data warehouse for sales.

Fact constellation: Sophisticated applications may require multiple facttables to share
dimension tables. This kind of schema can be viewed as a collection of stars, and hence is called
a galaxy schema or a fact constellation.
Figure Fact constellation schema of a data warehouse for sales and shipping
5) Discuss OLAP operations?
A) OLAP operations on multidimensional data.
Roll-up: The roll-up operation performs aggregation on a data cube, either byclimbing-up a
concept hierarchy for a dimension or by dimension reduction. Figure shows the result of a roll-up
operation performed on the central cube by climbing up the concept hierarchy for location. This
hierarchy was defined as the total order street < city < province or state <country.
Drill-down: Drill-down is the reverse of roll-up. It navigates from less detaileddata to more
detailed data. Drill-down can be realized by either stepping-down a concept hierarchy for a
dimension or introducing additional dimensions. Figure shows the result of a drill-down
operation performed on the central cube by stepping down a concept hierarchy for time defined
as day < month < quarter < year. Drill-down occurs by descending the time hierarchy from the
level of quarter to the more detailed level of month.

Slice and dice: The slice operation performs a selection on one dimension of thegiven cube,
resulting in a sub cube. Figure shows a slice operation where the sales data are selected from
the central cube for the dimension time using the criteria
dimensions.
4. Pivot (rotate): Pivot is a visualization operation which rotates the data axes in view in order
to provide an alternative presentation of the data. Figure shows a pivot operation where the item
and location axes in a 2-D slice are rotated.
Figure: Examples of typical OLAP operations on multidimensional data.

4. Objective question with answers
1. The full form of OLAP is
A)Online Analytical Processing
B) Online Advanced Processing
C) Online Advanced Preparation
D) Online Analytical Performance
-oriented, integrated, time-variant, nonvolatile collection or data in
support of management decisions.
A) Data Mining
B) Data Warehousing
C) Document Mining
D) Text Mining
3. The data is stored, retrieved and updated i
A) OLAP
B) OLTP
C) SMTP
D) FTP
-oriented and is used for data analysis by knowledge workers,
including managers, executives, and analysts.
A) OLAP
B) OLTP
C) Both of the above
D) None of the above
od alternative to the star schema.
A) Star schema
B) Snowflake schema
C) Fact constellation
D) Star-snowflake schema

systems.
A) top-down view
B) data warehouse view
C) data source view
D) business query view
A) Many to many
B) one to one
C) one to many
D) many to one
A) top-down view B) data warehouse view C) data source view D) business query view
9. Which of the following is not a component of a data warehouse?
A) Metadata B) Current detail data C) Lightly summarized data D) Component Key
10. Which of the following is not a kind of data warehouse application? A) Information processing B) Analytical processing C) Data mining D) Transaction processing
Answers:
1-A 6-C 2-B 7-C 3-B 8-A 4-A 9-D 5-C 10-D

5. Fill in the blanks questions with answers.
1. __________ is a subject-oriented, integrated, time-variant, nonvolatile collection of data in
support of management decisions.
2. The data Warehouse is__________..
3. Expansion for DSS in DW is__________
4. The important aspect of the data warehouse environment is that data found within the data
warehouse is___________.
5. The time horizon in Data warehouse is usually __________.
6. The data is stored, retrieved & updated in ____________..
7. __________describes the data contained in the data warehouse.
8. ____________predicts future trends & behaviors, allowing business managers to make
proactive,
knowledge-driven decisions.
9. __________ is the heart of the warehouse.
10. ________________ is the specialized data warehouse database.
Answers:
1. Data Warehousing.. 6. OLTP.
2. Read only. 7. Metadata
3. Decision Support system 8. Data mining.
4. subject-oriented, time-variant, integrated. 9. Data warehouse database servers
5. 5-10 years. 10. Redbrick

UNIT-2
1. TWO MARKS QUESTION WITH ANSWERS:
1. What is the need for preprocessing the data?
Incomplete, noisy, and inconsistent data are commonplace properties of large real world
databases and data warehouses. Incomplete data can occur for a number of reasons. Attributes
of interest may not always be available, such as customer information for sales transaction
data. Other data may not be included simply because it was not considered important at the
time of entry. Relevant data may not be recorded due to a misunderstanding, or because of
equipment malfunctions. Data that were inconsistent with other recorded data may have been
deleted. Furthermore, the recording of the history or modifications to the data may have been
overlooked. Missing data, particularly for tuples with missing values for some attributes, may
need to be inferred.
2. What is parallel mining of concept description? (OR) What is concept description?
Data can be associated with classes or concepts. It can be useful to describe individual classes
and concepts in summarized, concise, and yet precise terms. Such descriptions of a class or a
concept are called class/concept descriptions. These descriptions can be derived via (1) data
characterization, by summarizing the data of the class under study (often called the target
class) in general terms, or (2) data discrimination, by comparison of the target class with one
or a set of comparative classes (often called the contrasting classes), or (3) both data
characterization and discrimination.
3. What is dimensionality reduction?
In dimensionality reduction, data encoding or transformations are applied so as to obtain a
reconstructed from the compressed data without any loss of information, the data reduction is
called lossless.
4. Mention the various tasks to be accomplished as part of data pre-processing. (Nov/ Dec
2008)
1. Data cleaning
2. Data Integration
3. Data Transformation
4. Data reduction
5. What is data cleaning? (May/June 2009)
Data cleaning means removing the inconsistent data or noise and collecting necessary
information of a collection of interrelated data.
6. Define Data mining. (Nov/Dec 2008)
amounts of data. The term
is actually a misnomer. Remember that the mining of gold from rocks or sand is referred to as
gold mining rather than rock or sand mining. Thus, data mining should have been more
7. What are the types of concept hierarchies? (Nov/Dec 2009)
A concept hierarchy defines a sequence of mappings from a set of low-level concepts to
higher-level, more general concepts. Concept hierarchies allow specialization, or drilling
down, where by concept values are replaced by lower-level concepts.

2. THREE MARKS QUESTION WITH ANSWERS:
1. List the three important issues that have to be addressed during data integration.
(OR)
List the issues to be considered during data integration.
There are a number of issues to consider during data integration. Schema integration
and object matching can be tricky. How can equivalent real-world entities from multiple data
sources be matched up? This is referred to as the entity identification problem.
Redundancy is another important issue. An attribute (such as annual revenue, for
Inconsistencies in attribute or dimension naming can also cause redundancies in the resulting
data set.
A third important issue in data integration is the detection and resolution of data
value conflicts. For example, for the same real-world entity, attribute values from different
sources may differ. This may be due to differences in representation, scaling, or encoding. For
instance, a weight attribute may be stored in metric units in one system and British imperial
units in another.
2. Write the strategies for data reduction. (May/June 2010)
1. Data cube aggregation
2. Attribute subset selection
3. Dimensionality reduction
4. Numerosity reduction
5. Discretization and concept hierarchy generation.

3. Why is it important to have data mining query language? (May/June 2010)
The design of an effective data mining query language requires a deep understanding of
the power, limitation, and underlying mechanisms of the various kinds of data mining tasks.
A data mining query language can be used to specify data mining tasks. In particular,
we examine how to define data warehouses and data marts in our SQL-based data mining
query language, DMQL.
4. List the five primitives for specifying a data mining task. (Nov/Dec 2010)
The set of task-relevant data to be mined the kind of knowledge to be mined:
The background knowledge to be used in the discovery process the interestingness measures
and thresholds for pattern evaluation
The expected representation for visualizing the discovered pattern
5. What is data generalization? (Nov/Dec 2010)
It is process that abstracts a large set of task-relevant data in a database from relatively low
conceptual levels to higher conceptual levels 2 approaches for Generalization.
1) Data cube approach 2) Attribute-oriented induction approach
6. How concept hierarchies are useful in data mining? (Nov/Dec 2010)
A concept hierarchy for a given numerical attribute defines a discretization of the attribute.
Concept hierarchies can be used to reduce the data by collecting and replacing low-level
concepts (such as numerical values for the attribute age) with higher-level concepts (such as
youth, middle-aged, or senior). Although detail is lost by such data generalization, the
generalized data may be more meaningful and easier to interpret.

7. How do you clean the data? (Nov/Dec 2011)
Data cleaning (or data cleansing) routines attempt to fill in missing values, smooth out noise
while identifying outliers, and correct inconsistencies in the data. For Missing Values
1. Ignore the tuple
2. Fill in the missing value manually
3. Use a global constant to fill in the missing value
4. Use the attribute mean to fill in the missing value:
5. Use the attribute mean for all samples belonging to the same class as the given tuple
6. Use the most probable value to fill in the missing value For Noisy Data
1. Binning: Binning methods smooth a sorted data value by consulting its
values around it.
2. Regression: Data can be smoothed by fitting the data to a function, such as with
Regression
3. Clustering: Outliers may be detected by clustering, where similar values are
organized into groups, or
3. Five-marks question and answers
1. What is data mining?
are many other terms related to data mining, such as knowledge mining, knowledge
extraction, data/pattern analysis, data archaeology, and data dredging. Many people treat data
mining as a synonym for another popularly used term, Knowledge Discovery in
Databases or KDD
Essential step in the process of Knowledge Discovery in Databases.
Knowledge discovery as a process is depicted in following figure and consists of an
iterative sequence of the following steps:

Data cleaning: to remove noise or irrelevant data
Data integration: where multiple data sources may be combined
Data selection: where data relevant to the analysis task are retrieved from the
database
Data transformation: where data are transformed or consolidated into forms
appropriate for mining by performing summary or aggregation operations
Data mining :an essential process where intelligent methods are applied in order to
extract data patterns
Pattern evaluation to identify the truly interesting patterns representing knowledge based
on some interestingness measures
Knowledge presentation: where visualization and knowledge
representation techniques are used to present the mined knowledge to the
user.
2. Describe the Architecture of a typical data mining system/Major Components?
Data mining is the process of discovering interesting knowledge from large amounts of
data stored either in databases, data warehouses, or other information repositories. Based on
this view, the architecture of a typical data mining system may have the following major
components:
A database, data warehouse, or other information repository, which consists of the set of
databases, data warehouses, spreadsheets, or other kinds of information repositories
containing the student and course information.
mining requests.
A knowledge base that contains the domain knowledge used to guide the search or to
evaluate the interestingness of resulting patterns. For example, the knowledge
base may contain metadata which describes data from multiple Heterogeneous
sources.
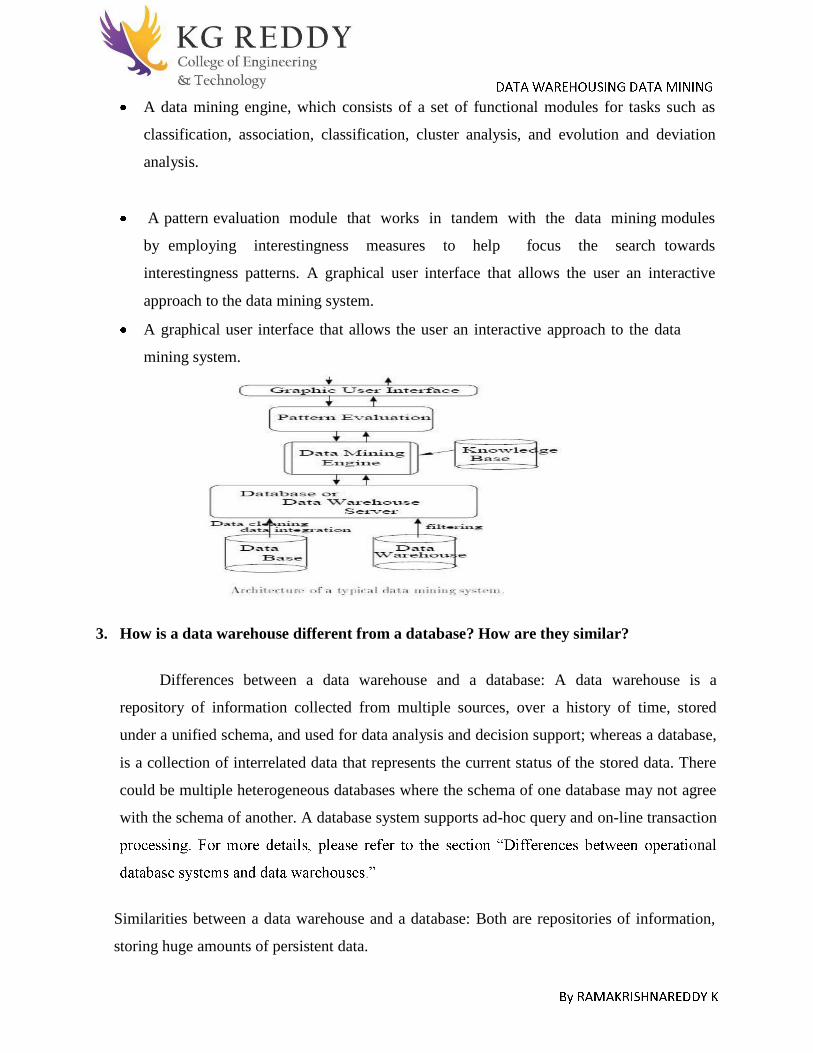
A data mining engine, which consists of a set of functional modules for tasks such as
classification, association, classification, cluster analysis, and evolution and deviation
analysis.
A pattern evaluation module that works in tandem with the data mining modules
by employing interestingness measures to help focus the search towards
interestingness patterns. A graphical user interface that allows the user an interactive
approach to the data mining system.
A graphical user interface that allows the user an interactive approach to the data
mining system.
3. How is a data warehouse different from a database? How are they similar?
Differences between a data warehouse and a database: A data warehouse is a
repository of information collected from multiple sources, over a history of time, stored
under a unified schema, and used for data analysis and decision support; whereas a database,
is a collection of interrelated data that represents the current status of the stored data. There
could be multiple heterogeneous databases where the schema of one database may not agree
with the schema of another. A database system supports ad-hoc query and on-line transaction
nal
Similarities between a data warehouse and a database: Both are repositories of information,
storing huge amounts of persistent data.

4. List out Data mining tasks?
The two "high-level" primary goals of data mining, in practice, are prediction and description.
1. Prediction involves using some variables or fields in the database to predict unknown or
future values of other variables of interest.
2. Description focuses on finding human-interpretable patterns describing the data.
The relative importance of prediction and description for particular data mining applications can
vary considerably. However, in the context of KDD, description tends to be more important than
prediction. This is in contrast to pattern recognition and machine learning applications (such as
speech recognition) where prediction is often the primary goal of the KDD process.
The goals of prediction and description are achieved by using the following primary data
mining tasks:
1. Classification is learning a function that maps (classifies) a data item into one of several
predefined classes.
2. Regression is learning a function which maps a data item to a real-valued prediction
variable.
3. Clustering is a common descriptive task where one seeks to identify a finite set of
categories or clusters to describe the data.
Closely related to clustering is the task of probability density estimation which
consists of techniques for estimating, from data, the joint multi-variate probability
density function of all of the variables/fields in the database.
4. Summarization involves methods for finding a compact description for a subset of data.
5. Dependency Modeling consists of finding a model which describes significant
dependencies between variables.
Dependency models exist at two levels:
1. The structural level of the model specifies (often graphically) which variables
are locally dependent on each other, and
2. The quantitative level of the model specifies the strengths of the dependencies
using some numerical scale.

Change and Deviation Detection focuses on discovering the most significant
changes in the data from previously measured or normative values.
5. What do you mean by Attribute sub selection / Feature selection?
Feature selection is a must for any data mining product. That is because, when you build
a data mining model, the dataset frequently contains more information than is needed to build
the model. For example, a dataset may contain 500 columns that describe characteristics of
customers, but perhaps only 50 of those columns are used to build a particular model. If you
keep the unneeded columns while building the model, more CPU and memory are required
during the training process, and more storage space is required for the completed model.
In which select a minimum set of features such that the probability distribution of
different classes given the values for those features is as close as possible to the original
distribution given the values of all features
Basic heuristic methods of attribute subset selection include the following techniques, some
of which are illustrated below:
Step-wise forward selection: The procedure starts with an empty set of attributes. Thebest of
the original attributes is determined and added to the set. At each subsequent iteration or step, the
best of the remaining original attributes is added to the set.
Step-wise backward elimination: The procedure starts with the full set of attributes. At each
step, it removes the worst attribute remaining in the set.
Combination forward selection and backward elimination: The step-wise forward
selection and backward elimination methods can be combined, where at each step one selects
the best attribute and removes the worst from among the remaining attributes.
Decision tree induction: Decision tree induction constructs a flow-chart-like structure where
each internal (non-leaf) node denotes a test on an attribute, each branch corresponds to an
outcome of the test, and each external (leaf) node denotes a class prediction. At each node, the
decision tree induction is used for attribute subset selection, a tree is constructed from the given
data. All attributes that do not appear in the tree are assumed to be irrelevant. The set of
attributes appearing in the tree form the reduced subset of attributes.
Wrapper approach/Filter approach:
The mining algorithm itself is used to determine the attribute sub set, then it is called
wrapper approach or filter approach. Wrapper approach leads to greater accuracy since it
optimizes the evaluation measure of the algorithm while removing attributes.
Data compression
In data compression, data encoding or transformations are applied so as to obtain a reduced
compressed" representation of the original data. If the original data can be reconstructed from
the compressed data without any loss of information, the data compression technique used is
called lossless. If, instead, we can reconstruct only an approximation of the original data, then
the data compression technique is called lossy. Effective methods of lossy data compression:

4. Objective question with answers
an essential process where intelligent methods are applied to extract data patterns.
A) Data Warehousing
B) Data mining
C) Text mining
D) Data selection
2. Data mining can a
i) Data streams
ii) Sequence data
iii) Networked data
iv) Text data
v) Spatial data
A) i, ii, iii and v only
B) ii, iii, iv and v only
C) i, iii, iv and v only
D) All i, ii, iii, iv and v
3. Which of the following is not a data mining functionality?
A) Characterization and Discrimination
B) Classification and regression
C) Selection and interpretation
D) Clustering and Analysis
lass of
data.
A) Data Characterization

B) Data Classification
C) Data discrimination
D) Data selection
general features of objects from one or multiple contrasting classes.
A) Data Characterization
B) Data Classification
C) Data discrimination
D) Data selection
A) cost-sensitive
B) work-sensitive
C) time-sensitive
D) technical-sensitive
s of finding a model that describes and distinguishes data classes or
concepts.
A) Data Characterization
B) Data Classification
C) Data discrimination
D) Data selection
i) Mining various and new kinds of knowledge
ii) Mining knowledge in multidimensional space
iii) Pattern evaluation and pattern or constraint-guided mining.
iv) Handling uncertainty, noise, or incompleteness of data
A) i, ii and iv only
B) ii, iii and iv only
C) i, ii and iii only

D) All i, ii, iii and iv
A) Knowledge Database
B) Knowledge Discovery Database
C) Knowledge Data House
D) Knowledge Data Definition
A) Data
B) Information
C) Query
D) Useful information
Answer:
1. B 6. C 2. D 7. B 3. C 8. D 4. A 9. B 5. C 10. D
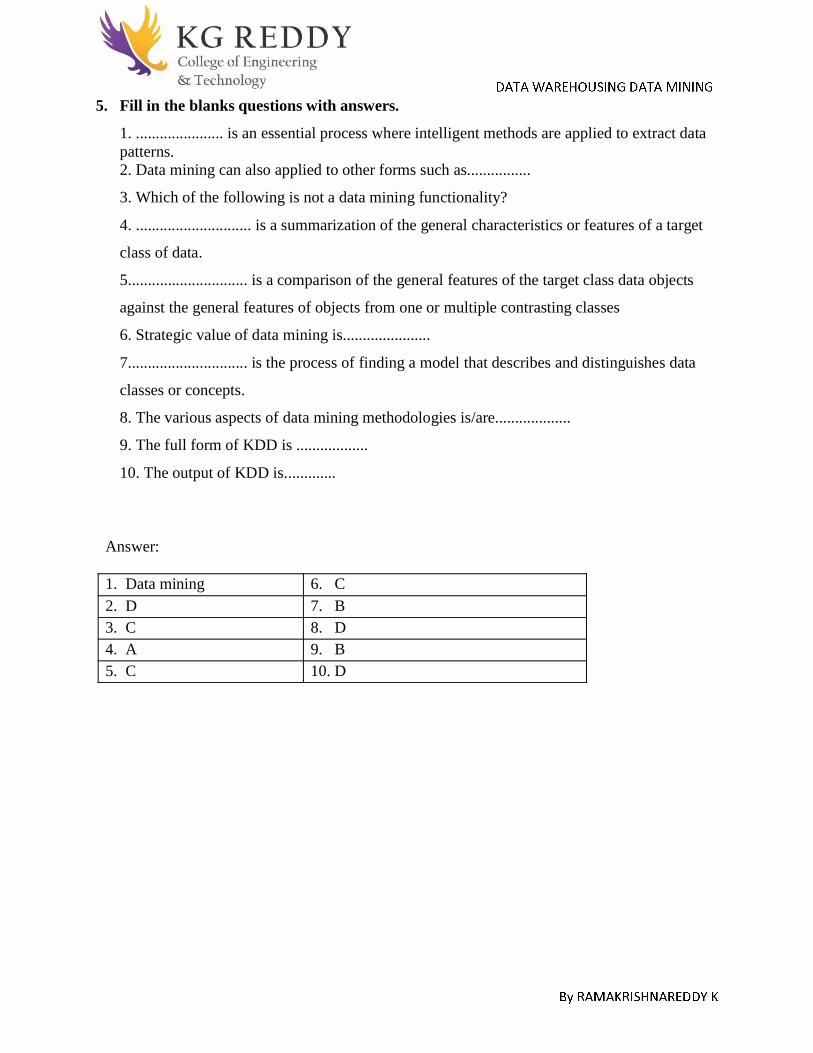
5. Fill in the blanks questions with answers.
1. ...................... is an essential process where intelligent methods are applied to extract data patterns. 2. Data mining can also applied to other forms such as................
3. Which of the following is not a data mining functionality?
4. ............................. is a summarization of the general characteristics or features of a target
class of data.
5.............................. is a comparison of the general features of the target class data objects
against the general features of objects from one or multiple contrasting classes
6. Strategic value of data mining is......................
7.............................. is the process of finding a model that describes and distinguishes data
classes or concepts.
8. The various aspects of data mining methodologies is/are...................
9. The full form of KDD is ..................
10. The output of KDD is.............
Answer:
1. Data mining 6. C 2. D 7. B 3. C 8. D 4. A 9. B 5. C 10. D

UNIT-3
1. TWO MARKS QUESTION WITH ANSWERS:
1. Define frequent set and border set. (Nov/Dec 2007)
A set of items is referred to as an itemset. An itemset that contains k items is a k-
itemset. The set Of computer, antivirus software is a 2-itemset. The occurrence frequency of
an itemset is the number of transactions that contain the itemset. This is also known, simply,
as the frequency, support count, or count of the itemset.Where each variation involves
in slightly different way.The variations, where nodes
indicate an item or itemset that has been examined, and nodes with thick borders indicate that
an examined item or itemset is frequent.
2. How is association rule mined from large databases? (Nov/Dec 2007)
Suppose, however, that rather than using a transactional database, sales and related
information are stored in a relational database or data warehouse. Such data stores are
multidimensional, by definition. For instance, in addition to keeping track of the items
purchased in sales transactions, a relational database may record other attributes associated
with the items, such as the quantity purchased or the price, or the branch location of the sale.
Additional relational information regarding the customers who purchased the items, such as
customer age, occupation, credit rating, income, and address, may also be stored.
3. List two interesting measures for association rules. (April/May 2008) (OR) Rule support
and confidence are two measures of rule interestingness.
They respectively reflect the usefulness and certainty of discovered rules. A support
of 2% for Association Rule (5.1) means that 2% of all the transactions under analysis show
that computer and antivirus software are purchased together. A confidence of 60% means
that 60% of the customers who purchased a computer also bought the software. Typically,
association rules are considered interesting if they satisfy both a minimum support threshold
and a minimum confidence threshold. Such thresholds can be set by users or domain experts.
Additional analysis can be performed to uncover interesting statistical correlations between

associated items.
4. What are Iceberg queries? (April/May 2008)
It computes an aggregate function over an attribute or set of attributes in order to
find aggregate values above some specified threshold. Given relation R with attributes
a1,a2,?..,an and b, and an aggregate function, agg_f, an iceberg query is the form.
Select
R.a1,R.a2,?..R.an,
agg_f(R,b) From
relation R
Group by
R.a1,R.a2
,?.,R.an
Having
agg_f(R.b
)>=threho
ld
5. What is over fitting and what can you do to prevent it? (Nov/Dec 2008)
Tree pruning methods address this problem of over fitting the data. Such methods
typically use statistical measures to remove the least reliable branches. An unpruned tree and a
pruned version of it. Pruned trees tend to be smaller and less complex and, thus, easier to
comprehend. They are usually faster and better at correctly classifying independent test data
(i.e., of previously unseen tuples) than unpruned trees.
2. THREE MARKS QUESTION WITH ANSWERS:
1. in classification trees, what are surrogate splits, and how are they used?
Decision trees can suffer from repetition and replication, making them overwhelming to
interpret. Repetition occurs when an attribute is repeatedly tested along a given branch of the
In replication, duplicate sub trees
exist within the tree. These situations can impede the accuracy and comprehensibility of a
decision tree. The use of Tree pruning methods addresses this problem of over fitting the data.
Such methods typically use statistical measures to remove the least reliable branches. An
unpruned tree and a pruned version of it. Pruned trees tend to be smaller and less complex and,
thus, easier to comprehend. They are usually faster and better at correctly classifying
independent test data (i.e., of previously unseen tuples) than unpruned trees.
2. Explain the market basket analysis problem. (May/June 2009)
Market basket analysis, which studies the buying habits of customers by searching for
sets of items that are frequently purchased together (or in sequence). This process analyzes
customer buying habits by finding associations between the different items that customers place
such associations can help retailers develop
marketing strategies by gaining insight into which items are frequently purchased together by
customers. For instance, if customers are buying milk, how likely are they to also buy bread (and
what kind of bread) on the same trip to the supermarket? Such information can lead to increased
sales by helping retailers do selective marketing and plan their shelf space.
3. Give the difference between Boolean association rule and quantitative Association rule.
Based on the types of values handled in the rule: If a rule involves associations between
the presence or absence of items, it is a Boolean association rule. For example, the following
three rules are Boolean association rules obtained from market basket analysis.
Computer => antivirus software [support = 2%; confidence =

Quantitative association rules involve numeric attributes that have an implicit ordering among
values (e.g., age). If a rule describes associations between quantitative items or attributes, then it
is a quantitative association rule. In these rules, quantitative values for items or attributes are
partitioned into intervals. Following rule is considered a quantitative association rule. Note that
the quantitative attributes, age and income, have been discretized.
4. List the techniques to improve the efficiency of Apriori algorithm.
Hash based technique
Transaction
Reduction
Portioning
Sampling
Dynamic item counting
5. What is FP growth? (May/June 2010)
FP-growth, which adopts a divide-and-conquer strategy as follows. First, it compresses the
database representing frequent items into a frequent-pattern tree, or FP-tree,which retains the
itemset association information. It then divides the compressed database into a set of conditional
databases (a special kind of projected database), each associated with one frequent item or

2. FIVE MARKS QUESTION WITH ANSWERS:
1. Explain Association rule?
It is an important data mining model studied extensively by the database and data mining
community.
Assume all data are categorical. No good algorithm for numeric data. Initially used for Market
Basket Analysis to find how items purchased by customers are related.
Bread Milk [sup = 5%, conf = 100%]
I = {i1, i2 im}: a set of items.
Transaction t :t a set of items, and t I.
Transaction Database T: a set of transactions T = {t1, t2 n}.
A transaction t contains X, a set of items (itemset) in I, if X t.
An association rule is an implication of the form:
X Y, where X, Y I, and X Y =
An itemset is a set of items.
E.g., X = {milk, bread, cereal} is an itemset.
A k-itemset is an itemset with k items.
E.g., {milk, bread, cereal} is a 3-itemset
Rule strength measures:
Support: The rule holds with support sup in T (the transaction data set) if sup% of transactions
contain X Y.

sup = Pr(X Y).
Confidence: The rule holds in T with confidence conf if conf% of tranactions that contain X
also contain Y.
conf = Pr(Y | X)
An association rule is a pattern that states when X occurs, Y occurs with certain probability.
Support count: The support count of an itemsetX, denoted by X.count, in a data set T is the
number of transactions in T that contain X. Assume T has n transactions.
Then,
2). Describe Apriori algorithm?
It involves Two steps:
a. Find all itemsets that have minimum support (frequent itemsets, also called large
itemsets).
b. Use frequent itemsets to generate rules.
Step 1: Mining all frequent itemsets
A frequent itemset
Key idea: The apriori property (downward closure property): any subsets of a frequent
itemset are also frequent itemsets

Iterative algo. (also called level-wise search): Find all 1-item frequent itemsets; then all 2-item
frequent itemsets, and so on.
In each iteration k, only consider itemsets that contain some k-1 frequent itemset.
Find frequent itemsets of size 1: F1
From k = 2
Ck = candidates of size k: those itemsets of size k that could be frequent, given
Fk-1
Fk = those itemsets that are actually frequent, Fk Ck(need to scan the database
once).
Example
Finding frequent itemsets
Minsup=0.5 dataset t
itemset:count
A B C D
AB AC AD BC BD CD
ABC ABD ACD BCD

1. scan T C1: {1}:2, {2}:3, {3}:3, {4}:1, {5}:3
F1: {1}:2, {2}:3, {3}:3, {5}:3
C
2: {1,2}, {1,3}, {1,5}, {2,3}, {2,5}, {3,5}
2.scan T C2: {1,2}:1, {1,3}:2, {1,5}:1, {2,3}:2, {2,5}:3, {3,5}:2
F2: {1,3}:2, {2,3}:2, {2,5}:3, {3,5}:2
C3:{2, 3,5}
3. scan T C3: {2, 3, 5}:2 F
3: {2, 3, 5}
TID Items
T100 1, 3, 4
T200 2, 3, 5
T300 1, 2, 3, 5
T400 2, 5
Ordering of Items:
The items in I are sorted in lexicographic order (which is a total order).
The order is used throughout the algorithm in each itemset.
{w[1], w w[k]} represents a k-itemsetw consisting of items w[1], w w[k],
where w[1] <w w[k] according to the total order.

Algorithm Apriori(T)
C1 init-pass(T);
F1 {f | f C1, f.count/n minsup}; // n: no. of transactions in T
for (k = 2; Fk-1 ; k++) do
Ck candidate-gen(Fk-1);
for each transaction t Tdo
for each candidate c Ckdo
ifc is contained in tthen
c.count++;
end
end
Fk {c Ck | c.count/n minsup}
end
returnF kFk;
Apriori candidate generation
The candidate-gen function takes Fk-1 and returns a superset (called the candidates) of the set of
all frequent k-itemsets. It has two steps
join step: Generate all possible candidate itemsetsCk of length k
prune step: Remove those candidates in Ck that cannot be frequent.

Function candidate-gen(Fk-1)
Ck ;
forallf1, f2 Fk-1
withf1 = {i1 ik-2, ik-1}
andf2 = {i1 ik-2, k-1}
andik-1< k-1do
c {i1 ik-1, k-1}; // join f1 and f2
Ck Ck {c};
foreach (k-1)-subset s of cdo
if(s Fk-1) then
deletec from Ck; // prune
end
end
returnCk;
Step 2: Generating rules from frequent itemsets
Frequent itemsets association rules. One more step is needed to generate association rules. For
each frequent itemsetX, For each proper nonempty subset A of X,
Let B = X - A

A B is an association rule if
Confidence(A
support(A B) = support(A B) = support(X)
confidence(A B) = support(A B) / support(A)
Generating rules:
To recap, in order to obtain A B, we need to have support(A B) and support(A). All the
required information for confidence computation has already been recorded in itemset
generation. No need to see the data T anymore. This step is not as time-consuming as frequent
itemsets generation.
3. Write The MSapriori algorithm?
Algorithm MSapriori(T, MS)
M sort(I, MS);
L init-pass(M, T);
F1 {{i} | i L, i.count/n MIS(i)};
for (k = 2; Fk-1 ; k++) do
ifk=2 then
Ck level2-candidate-gen(L)
elseCk MScandidate-gen(Fk-1);
end;
for each transaction t Tdo
for each candidate c Ckdo
ifc is contained in tthen
c.count++;
ifc {c[1]} is contained in tthen
c.tailCount++
end
end

Fk {c Ck | c.count/n MIS(c[1])}
end
returnF kFk;
Candidate itemset generation
Special treatments needed:
Sorting the items according to their MIS values
First pass over data (the first three lines)
Let us look at this in detail.
Candidate generation at level-2
Read it in the handout.
Pruning step in level-k (k> 2) candidate generation.
Read it in the handout.
First pass over data
It makes a pass over the data to record the support count of each item.
It then follows the sorted order to find the first item i in M that meets MIS(i).
i is inserted into L.
For each subsequent item j in M after i, if j.count/n MIS(i) then j is also inserted
into L, where j.count is the support count of j and n is the total number of
transactions in T. Why?
L is used by function level2-candidate-gen
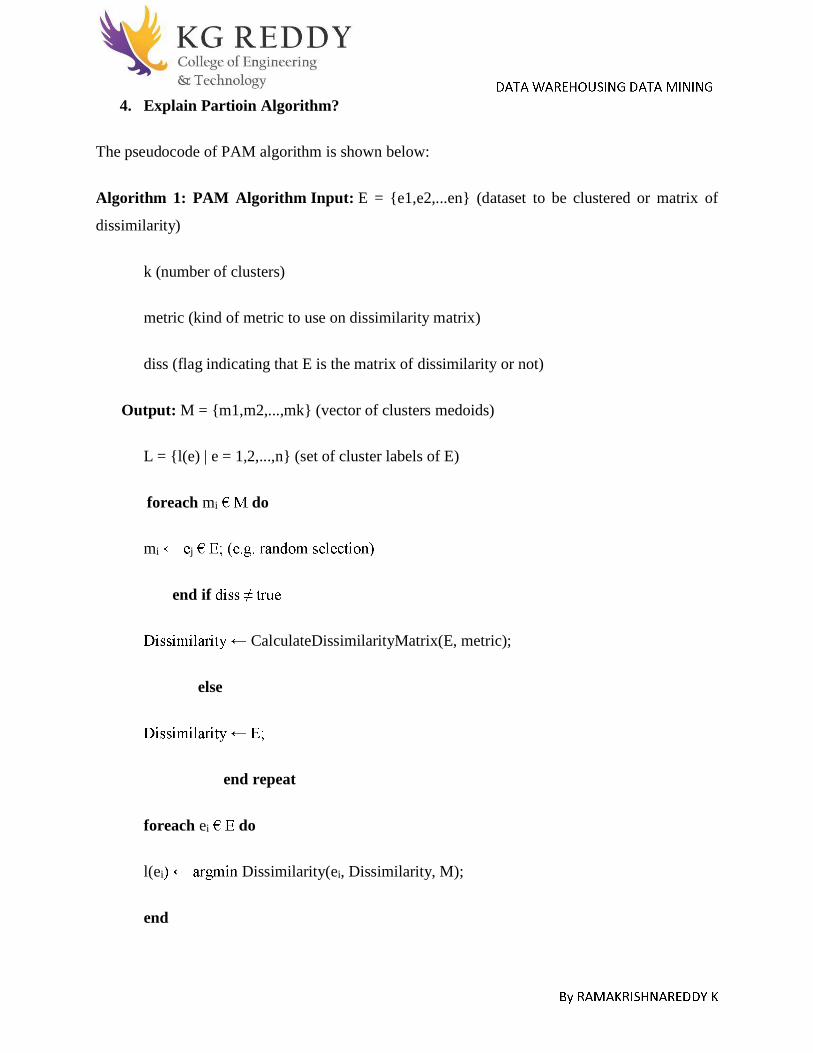
4. Explain Partioin Algorithm?
The pseudocode of PAM algorithm is shown below:
Algorithm 1: PAM Algorithm Input: E = {e1,e2,...en} (dataset to be clustered or matrix of
dissimilarity)
k (number of clusters)
metric (kind of metric to use on dissimilarity matrix)
diss (flag indicating that E is the matrix of dissimilarity or not)
Output: M = {m1,m2,...,mk} (vector of clusters medoids)
L = {l(e) | e = 1,2,...,n} (set of cluster labels of E)
foreach mi do
mi j
end if
CalculateDissimilarityMatrix(E, metric);
else
end repeat
foreach ei do
l(ei Dissimilarity(ei, Dissimilarity, M);
end

foreach mi do
end
if
end
until changed = true;
In the R programming language, the PAM algorithm is available in the cluster package and can
be called by the following command:
pam(x, k, diss, metric, medoids, stand, cluster.only, do.swap, keep.diss, keep.data,trace.lev)
Where the parameters are:
x: numerical data matrix representing the dataset entities, or can be the dissimilarity matrix, it
depends on the value of the diss parameter. In case x is a data matrix each row is an entity and
each column is an variable, and in this case missing values are allowed as long as every pair of
entities has at least one case not missing. In case x is a dissimilarity matrix it is not allowed to
have missing values.
k: number of clusters that the dataset will be partitioned where 0 < k < n, where n is the number
of entities.
diss: logical flag, if it is TRUE x is used as the dissimilarity matrix, if it is FALSE, then x will be
considered as a data matrix.

metric: an string specifying each of the two metrics will be used to calculate the dissimilarity
stand: logical flag, if it is TRUE then the measurements in x will be standardized before
calculating the dissimilarities. Measurements are standardized for each column, by subtracting
the column's mean value and dividing by the variable's mean absolute deviation. If x is a
dissimilarity matrix then this parameter is ignored.
cluster.only: logical flag, if it is TRUE, only the clustering will be computed and returned.
do.swap: logical flag, indicates if the swap phase should happen (TRUE) or not (FALSE).
keep.diss: logical flag indicating if the dissimilarities should (TRUE) or not (FALSE) be kept in
the result.
keep.data: logical flag indicating if the input data x should (TRUE) or not (FALSE) be kept in
the result.
trace.lev: an numeric parameters specifying a trace level for printing diagnostics during the
build and swap phase of the algorithm. Default 0 does not print anything.
The PAM algorithm returns a pam object that contains the information about the result of the
execution of the algorithm.

5. Illustrate FP-Growth algorithm?
The FP-Growth Algorithm is an alternative way to find frequent itemsets without using
candidate generations, thus improving performance. For so much it uses a divide-and-conquer
strategy. The core of this method is the usage of a special data structure named frequent-pattern
tree (FP-tree), which retains the itemset association information.
In simple words, this algorithm works as follows: first it compresses the input database creating
an FP-tree instance to represent frequent items. After this first step it divides the compressed
database into a set of conditional databases, each one associated with one frequent pattern.
Finally, each such database is mined separately. Using this strategy, the FP-Growth reduces the
search costs looking for short patterns recursively and then concatenating them in the long
frequent patterns, offering good selectivity. In -
tree in the main memory. A strategy to cope with this problem is to firstly partition the database
into a set of smaller databases (called projected databases), and then construct an FP-tree from
each of these smaller databases.
The next subsections describe the FP-tree structure and FP-Growth Algorithm, finally an
example is presented to make it easier to understand these concepts.
FP-Tree structure
The frequent-pattern tree (FP-tree) is a compact structure that stores quantitative information
about frequent patterns in a database
Han defines the FP-tree as the tree structure defined below
1. -prefix sub trees as children, and a frequent-
item-header table (presented in the left side of Figure 1);
2. Each node in the item-prefix sub tree consists of three fields:
1. Item-name: registers which item is represented by the node;
2. Count: the number of transactions represented by the portion of the path reaching
the node;

3. Node-link: links to the next node in the FP-tree carrying the same item-name, or
null if there is none.
1. Each entry in the frequent-item-header table consists of two fields:
1. Item-name: as the same to the node;
2. Head of node-link: a pointer to the first node in the FP-tree carrying the item-
name.
The original algorithm to construct the FP-Tree defined by Han in [1] is presented below in
Algorithm 1.
Algorithm 1: FP-tree construction
Input: A transaction database DB and a minimum support threshold ?.
Output: FP-tree, the frequent-pattern tree of DB.
Method: The FP-tree is constructed as follows.
1. Scan the transaction database DB once. Collect F, the set of frequent items, and
the support of each frequent item. Sort F in support-descending order as FList,
the list of frequent items.
2. Create the root of an FP-tree, T
in DB do the following:
Select the frequent items in Trans and sort them according to the order of FList. Let
the sorted frequent-item list in Trans be [ p | P], where p is the first element and P is
the remaining list. Call insert tree([ p | P], T ).
The function insert tree([ p | P], T ) is performed as follows. If T has a child N such
that N.item-name = p.item-
node N , with its count initialized to 1, its parent link linked to T , and its node-link
linked to the nodes with the same item-name via the node-link structure. If P is
nonempty, call insert tree(P, N ) recursively.

By using this algorithm, the FP-tree is constructed in two scans of the database. The
first scan collects and sort the set of frequent items, and the second constructs the
FP-Tree.
FP-Growth Algorithm
After constructing the FP-
patterns. To accomplish this job, Han in [1] presents a group of lemmas and properties, and
thereafter describes the FP-Growth Algorithm as presented below in Algorithm 2.
Algorithm 2: FP-Growth
Input: A database DB, represented by FP-tree constructed according to Algorithm 1, and
a minimum support threshold?.
Output: The complete set of frequent patterns.
Method: call FP-growth (FP-tree, null).
Procedure FP-growth (Tree, a) {
if Tree contains a single prefix path then { // Mining single prefix-path FP-tree
let P be the single prefix-path part of Tree;
let Q be the multipath part with the top branching node replaced by a null root;
for each combination (denoted as ß) of the nodes in the path P do
generate pattern ß a with support = minimum support of nodes in ß;
letfreq pattern set(P) be the set of patterns so generated;
}

else let Q be Tree;
for each item ai in Q do { // Mining multipath FP-tree
generate pattern ß = ai a with support = ai .support;
- -tree Tree ß;
call FP-growth(Tree ß , ß);
letfreq pattern set(Q) be the set of patterns so generated;
}
Return (freq pattern set(P) freq pattern set(Q) (freq pattern set(P) × freq pattern
set(Q)))
}

4. Objective question with answers
1. Data modeling technique used for data marts is
A) Dimensional modeling
B) ER model
C) Extended ER model
D) Physical model
E) Logical model.
2. A warehouse architect is trying to determine what data must be included in the warehouse. A meeting has
been arranged with a business analyst to understand the data requirements, which of the following should
be included in the agenda?
A) Number of users
B) Corporate objectives
C) Database design
D) Routine reporting
E) Budget.
3. An OLAP tool provides for
A) Multidimensional analysis
B) Roll-up and drill-down
C) Slicing and dicing
D) Rotation
E) Setting up only relations.
4. The Synonym for data mining is
A) Data warehouse
B) Knowledge discovery in database
C) ETL
D) Business intelligence
E) OLAP.

5. Which of the following statements is true?
A) A fact table describes the transactions stored in a DWH
B) A fact table describes the granularity of data held in a DWH
C) The fact table of a data warehouse is the main store of descriptions of the transactions stored in a DWH
D) The fact table of a data warehouse is the main store of all of the recorded transactions over time
E) A fact table maintains the old records of the database.
6. Most common kind of queries in a data warehouse
A) Inside-out queries
B) Outside-in queries
C) Browse queries
D) Range queries
E) All (a), (b), (c) and (d) above.
7. Concept description is the basic form of the
A) Predictive data mining
B) Descriptive data mining
C) Data warehouse
D) Relational data base
E) Proactive data mining.
8. The apriori property means
A) If a set cannot pass a test, all of its supersets will fail the same test as well
B) To improve the efficiency the level-wise generation of frequent item sets
C) If a set can pass a test, all of its supersets will fail the same test as well
D) To decrease the efficiency the level-wise generation of frequent item sets
E) All (a), (b), (c) and (d) above.
9. Which of following form the set of data created to support a specific short lived business situation?
A) Personal data marts
B) Application models
C) Downstream systems

D) Disposable data marts
E) Data mining models.
10. What is/are the different types of Meta data?
I. Administrative.
II. Business.
III. Operational.
A) Only (I) above
(b) Both (II) and (III) above
(c) Both (I) and (II) above
(d) Both (I) and (III) above
(e) All (I), (II) and (III) above.
Answers:
1 A 6 A
2 D 7 B
3 C 8 B
4 C 9 D
5 D 10 E

5. Fill in the blanks questions with answers
1. _____________ is a process of determining the preference of customer's majority.
2. Strategic value of data mining is ______________.
3. ____________ proposed the approach for data integration issues.
4. The terms equality and roll up are associated with ____________.
5. Exceptional reporting in data warehousing is otherwise called as __________.
6. ____________ is a metadata repository.
7. ________________ is an expensive process in building an expert system.
8. The full form of KDD is _________.
9. The first International conference on KDD was held in the year _____________.
10. Removing duplicate records is a process called _____________.
ANSWER: B
1. Referencing. 6. Prism solution directory manager.
2. In for time directory 7. Information collection. 3. Ralph Kimball 8. Knowledge discovery in database. 4. Data mart. 9. 1995 5. Alerts. 10. data cleaning

UNIT-4
2. TWO MARKS QUESTION WITH ANSWERS:
1. What is tree pruning?
Tree pruning attempts to identify and remove such branches, with the goal of improving
classification accuracy on unseen data.
2. List the requirements of clustering in data mining.
Mining data streams involves the efficient discovery of general patterns and dynamic
changes within stream data. For example, we may like to detect intrusions of a computer
network based on the anomaly of message flow, which may be discovered by clustering data
streams, dynamic construction of stream models, or comparing the current frequent patterns
with that at a certain previous time.
3. What is classification? (April/May 2008) (May/June 2009)
Classification is the process of finding a model (or function) that describes and
distinguishes data classes or concepts, for the purpose of being able to use the model to
predict the class of objects whose class label is unknown. The derived model is based on the
analysis of a set of training data (i.e., data objects whose class label is known).
4. What is the objective function of the K-means algorithm?
The k-means algorithm takes the input parameter, k, and partitions a set of n objects into
k clusters so that the resulting intra cluster similarity is high but the inter cluster similarity is
low. Cluster similarity is measured in regard to the mean value of the objects in a cluster,
First, it randomly selects k of the objects, each of which initially represents a cluster mean or
center. For each of the remaining objects, an object is assigned to the cluster to which it is the
most similar, based on the distance between the object and the cluster mean. It then computes
the new mean for each cluster. This process iterates until the criterion function converges.

Typically, the square-error criterion is used, defined as where E is the sum of the square error
for all objects in the data set; p is the point in space representing a given object; and mi is the
mean of cluster Ci (both p and mi are multidimensional).
5. The naïve Bayes classifier makes what assumption that motivates its name?
Studies comparing classification algorithms have found a simple Bayesian classifier
known as the naïve Bayesian classifier to be comparable in performance with decision tree
and selected neural network classifiers.
Bayesian classifiers have also exhibited high accuracy and speed when applied to large
databases. Naïve Bayesian classifiers assume that the effect of an attribute value on a given
class is independent of the values of the other attributes. This assumption is called class
conditional independence. It is made to simplify the computations involved and, in this sense,
is considered
2. THREE MARKS QUESTION WITH ANSWERS:
1. What is an outlier? (May/June 2009) (OR)
Define outliers. List various outlier detection approaches. (May/June 2010)
A database may contain data objects that do not comply with the general behavior or
model of the data. These data objects are outliers. Most data mining methods discard outliers
as noise or exceptions. These can be categorized into four approaches: the statistical
approach, the distance-based approach, the density-based local outlier approach, and the
deviation-based approach.
2. Compare clustering and classification. (Nov/Dec 2009)
Clustering techniques consider data tuples as objects. They partition the objects into
groups or clusters, so that objects within

be represented by its diameter, the maximum distance between any two objects in the cluster.
Outliers may be detected by clustering, where similar values are organized into groups, or
outliers.
3. What is meant by hierarchical clustering? (Nov/Dec 2009)
A hierarchical method creates a hierarchical decomposition of the given set of data
objects. A hierarchical method can be classified as being either agglomerative or divisive,
based on how the hierarchical decomposition is formed.
The agglomerative approach, also called the bottom-up approach, starts with each
object forming a separate group. It successively merges the objects or groups that are close to
one another, until all of the groups are merged into one (the topmost level of the hierarchy), or
until a termination condition holds. The divisive approach, also called the top-down approach,
starts with all of the objects in the same cluster. In each successive iteration, a cluster is split
up into smaller clusters, until eventually each object is in one cluster, or until a termination
condition holds.
4. What is Bayesian theorem? (May/June 2010)
described by measurements made on a set of n attributes. Let H be some hypothesis, such as
that the data tuple X belongs to a specified class C. For classification problems, we want to
observed data tuple X. In other words, we are looking for the probability that tuple X belongs
to class C, given that we know the attribute description of X.

5. What is Association based classification? (Nov/Dec 2010)
Association-based classification, which classifies documents based on a set of associated,
frequently occurring text patterns. Notice that very frequent terms are likely poor
discriminators. Thus only those terms that are not very frequent and that have good
discriminative power will be used in document classification. Such an association-based
classification method proceeds as follows: First, keywords and terms can be extracted by
information retrieval and simple association analysis techniques. Second, concept hierarchies
of keywords and terms can be obtained using available term classes, such as WordNet, or
relying on expert knowledge, or some keyword classification systems.
6. Compare the advantages of and disadvantages of eager classification (e.g.,
decision tree) versus lazy classification (k-nearest neighbor) (Nov/Dec 2010)
Eager learners, when given a set of training tuples, will construct a generalization (i.e.,
classification) model before receiving new (e.g., test) tuples to classify. We can think of the
learned model as being ready and eager to classify previously unseen tuples. Imagine a
contrasting lazy approach, in which the learner instead waits until the last minute before doing
any model construction in order to classify a given test tuple. That is, when given a training
tuple, a lazy learner simply stores it (or does only a little minor processing) and waits until it is
given a test tuple.

4. FIVE MARKS QUESTION AND ANSWERS
1) What is classification?
Classification:
Used for prediction (future analysis) to know the unknown attributes with theirvalues. By
using classifier algorithms and decision tree.(in data mining)
Which constructs some models (like decision trees) then which classifies the attributes.
Already we know the types of attributes are
1. Categorical attribute and
2. Numerical attribute
These classifications can work on both the above mentioned attributes.
Prediction: prediction also used for to know the unknown or missing values.
which also uses some models in order to predict the attributes
models like neural networks, if else rules and other mechanisms
Classification A Two-Step Process
Model construction: describing a set of predetermined classes
Each tuple/sample is assumed to belong to a predefined class, as determined by the
class label attribute
The set of tuples used for model construction: training set
The model is represented as classification rules, decision trees, or mathematical
formulae
Model usage: for classifying future or unknown objects
Estimate accuracy of the mode

The known label of test sample is compared with the classified result from the model
Accuracy rate is the percentage of test set samples that are correctly classified by the model
Test set is independent of training set, otherwise over-fitting will occur
Process (1): Model Construction
Process (2): Using the Model in Prediction
Supervised vs. Unsupervised Learning
Supervised learning (classification)

Supervision: The training data (observations, measurements, etc.) are accompanied by labels
indicating the class of the observations.
New data is classified based on the training set
Unsupervised learning (clustering)
The class labels of training data is unknown
Given a set of measurements, observations, etc. with the aim of establishing the
existence of classes or clusters in the data
2) What are the Issues regarding in classification?
There are two issues regarding classification and prediction they are Issues (1):
Data Preparation
Issues (2): Evaluating Classification Methods
Issues (1): Data Preparation: Issues of data preparation includes the following1) Data
cleaning
Preprocess data in order to reduce noise and handle missing values (refer preprocessing
techniques i.e. data cleaning notes)
2) Relevance analysis (feature selection)
Remove the irrelevant or redundant attributes (refer unit-iv AOI Relevance analysis)Data
transformation (refer preprocessing techniques i.e data cleaning notes) Generalize and/or
normalize data
Issues (2): Evaluating Classification Methods: considering classification methodsshould
satisfy the following properties
Predictive accuracy
Speed and scalability

*time to construct the model *time to use the model
3. Robustness
Handling noise and missing values
4. Scalability
Efficiency in disk-resident databases
5. Interpretability:
Understanding and insight provided by the model
6. Goodness of rules
Decision tree size
Compactness of classification rules
3). what is Decision Tree?
Decision tree
A flow-chart-like tree structure
Internal node denotes a test on an attribute
Branch represents an outcome of the test
Leaf nodes represent class labels or class distribution
Decision tree generation consists of two phases
Tree construction
At start, all the training examples are at the root

Partition examples recursively based on selected attributes
Tree pruning
Identify and remove branches that reflect noise or outliers
Use of decision tree: Classifying an unknown sample
Test the attribute values of the sample against the decision tree
Training Dataset
This follows
Age income student credit_rating
<=30 high no fair
<=30 high no excellent
high no fair
>40 medium no fair
>40 low yes fair
>40 low yes excellent
low yes excellent
<=30 medium no fair
<=30 low yes fair
>40 medium yes fair
<=30 medium yes excellent
medium no excellent
high yes fair
>40 medium no excellent

4) Write the Algorithm for Decision Tree?
Basic algorithm (a greedy algorithm)
Tree is constructed in a top-down recursive divide-and-conquer manner
At start, all the training examples are at the root
Attributes are categorical (if continuous-valued, they are discretized in advance)
Examples are partitioned recursively based on selected attributes
Test attributes are selected on the basis of a heuristic or statistical measure (e.g.,
information gain)
Conditions for stopping partitioning
All samples for a given node belong to the same class.
There are no remaining attributes for further partitioning majority voting is
employed for classifying the leaf.
There are no samples left.
5) Write down Tree Mining in Weka and Tree Mining in Clementine?
Tree Mining in Weka
Example:
Weather problem: build a decision tree to guide the decision about whether or
not to play tennis.
Dataset (weather.nominal.arff)
Validation:

Using training set as a test set will provide optimal classification accuracy.
Expected accuracy on a different test set will always be less.
10-fold cross validation is more robust than using the training set as a test set.
Divide data into 10 sets with about same proportion of class label values
as in original set.
Run classification 10 times independently with the remaining 9/10 of the
set as the training set.
Average accuracy.
Ratio validation: 67% training set / 33% test set.
Best: having a separate training set and test set.
Results:
Classification accuracy (correctly classified instances).
Kappa statistic (measures agreement between predicted and observed classification;
-100%-100% is the proportion of agreements after chance agreement has been
excluded; 0% means complete agreement by chance)
Results:
TP (True Positive) rate per class label
FP (False Positive) rate
Precision = TP rate = TP / (TP + FN)) * 100%
Recall = TP / (TP + FP)) * 100%

F-measure = 2* recall * precision / recall + precision
D3 characteristics:
Requires nominal values
Improved into C4.5
Dealing with numeric attributes
Dealing with missing values
Dealing with noisy data
Generating rules from trees
Tree Mining in Clementine
Methods:
C5.0: target field must be categorical, predictor fields may be numeric or
categorical, provides multiple splits on the field that provides the maximum
information gain at each level
QUEST: target field must be categorical, predictor fields may be numeric ranges or
categorical, statistical binary split
C&RT: target and predictor fields may be numeric ranges or categorical, statistical
binary split based on regression
CHAID: target and predictor fields may be numeric ranges or categorical, statistical
binary split based on chi-square
Extracting Classification Rules from Trees
Represent the knowledge in the form of IF-THEN rules
One rule is created for each path from the root to a leaf
Each attribute-value pair along a path forms a conjunction

The leaf node holds the class prediction
Rules are easier for humans to understand
Example
IF age student no THEN buys_computer no
IF age student yes buys_computer yes
IF age THEN buys_computer yes
IF age AND credit rating excellent THEN buys_computer yes
IF age credit_rating fair buys_computer no
Avoid Overfitting in Classification
The generated tree may overfit the training data
Too many branches, some may reflect anomalies due to noise or outliers
Result is in poor accuracy for unseen samples
Two approaches to avoid over fitting
Prepruning: Halt tree construction early do not split a node if this would result in
the goodness measure falling below a threshold
Difficult to choose an appropriate threshold
get a sequence of
progressively pruned trees
4. Objective question with answers

1. Highly summarized data is _______.
A. compact and easily accessible.
B. compact and expensive.
C. compact and hardly accessible.
D. compact.
2. A directory to help the DSS analyst locate the contents of the data warehouse is seen in
______.
A. Current detail data.
B. Lightly summarized data.
C. Metadata.
D. Older detail data.
3. Metadata contains at least _________.
A. the structure of the data.
B. the algorithms used for summarization.
C. the mapping from the operational environment to the data warehouse.
D. all of the above.
4. Which of the following is not a old detail storage medium?
A. Photo Optical Storage.
B. RAID.
C. Microfiches.
D. Pen drive.
5. The data from the operational environment enter _______ of data warehouse.
A. Current detail data.
B. Older detail data.
C. Lightly summarized data.
D. Highly summarized data.
6. The data in current detail level resides till ________ event occurs.
A. purge.
B. summarization.
C. achieved.

D. all of the above.
7. The dimension tables describe the _________.
A. entities.
B. facts.
C. keys.
D. units of measures.
8. The granularity of the fact is the _____ of detail at which it is recorded.
A. transformation.
B. summarization.
C. level.
D. transformation and summarization.
9. Which of the following is not a primary grain in analytical modeling?
A. Transaction.
B. Periodic snapshot.
C. Accumulating snapshot.
D. All of the above.
10. Granularity is determined by ______.
A. number of parts to a key.
B. granularity of those parts.
C. both A and B.
D. none of the above.
Answer:
1. A 6. D 2. C 7. B 3. D 8. C 4. D 9. B 5. A 10. C

5. Fill in the blanks questions with answers.
1. ____________ contains information that gives users an easy-to-understand perspective of the
information stored in the data warehouse.
2. _______________ helps to integrate, maintain and view the contents of the data warehousing
system.
3. Discovery of cross-sales opportunities is called ________________.
4. Data marts that incorporate data mining tools to extract sets of data are called ______.
5. ____________ can generate programs itself, enabling it to carry out new tasks.
6. The power of self-learning system lies in __________.
7. Building the informational database is done with the help of _______.
8. How many components are there in a data warehouse?
9. Which of the following is not a component of a data warehouse?
10. ________ is data that is distilled from the low level of detail found at the current detailed
level.
Answer:
1. Business metadata 6. Accuracy.
2. Information directory 7. Transformation or propagation tools. 3. association 8. Five. 4. Dependent data marts. 9. Component Key. 5. Productivity system 10. Lightly summarized data
UNIT-5
1. TWO MARKS QUESTION AND ANSWERS.
1. What do you go for clustering analysis? (Nov/Dec 2011)
Clustering can be used to generate a concept hierarchy for A by following either a top
down splitting strategy or a bottom- up merging strategy, where each cluster forms a node of
the concept hierarchy. In the former, each initial cluster or partition may be further
decomposed into several sub clusters, forming a lower level of the hierarchy. In the latter,
clusters are formed by repeatedly grouping neighboring clusters in order to form higher- level
concepts.
2. What are the requirements of cluster analysis? (Nov/Dec 2010)
Scalability
Ability to deal with different types of attributes Discovery of clusters with
arbitrary shape
Minimal requirements for domain knowledge to
determine input parameters Ability to deal with noisy
data
Incremental clustering and insensitivity to the
order of input records High dimensionality
Constraint-based clustering
3. What is mean by cluster analysis? (April/May 2008)
A cluster analysis is the process of analyzing the various clusters to organize the
different objects into meaningful and descriptive object.
4. Define CLARANS.
CLARANS(Cluster Large Applications based on Randomized Search) to improve the
quality of CLARA we go for CLARANS. It Draws sample with some randomness in each step
of search. It overcome the problem of scalability that K-Medoids suffers from.
5. Define BIRCH,ROCK and CURE.
BIRCH(Balanced Iterative Reducing and Clustering Using Hierarchies): Partitions objects
hierarchically using tree structures and then refines the clusters using other clustering
methods. It defines a clustering feature and an associated tree structure that summarizes a
cluster. The
Produce spherical Cluster and may produce unintended cluster.
ROCK(RObust Clustering using links): Merges clusters based on their interconnectivity.
Great for categorical data. Ignores information about the looseness of two clusters while
emphasizing interconnectivity.
CURE(Clustering Using Representatives): Creates clusters by sampling the database and
shrinks them toward the center of the cluster by a specified fraction. Obviously better in
runtime but lacking in precision.
6. What is meant by web usage mining? (Nov/Dec 2007)(April/May
2008)(Nov/Dec2009) (May/June 2010)
Web usage mining is the process of extracting useful information from server logs i.e.
users history. Web usage mining is the process of finding out what users are looking for on
the Internet. Some users might be looking at only textual data, whereas some others might be
interested in multimedia data.

2. THREE MARKS QUESTION AND ANSWERS.
1. What is mean by audio data mining? (Nov/Dec 2007)
Audio data mining uses audio signals to indicate the patterns of data or the features of
data mining results. Although visual data mining may disclose interesting patterns using
graphical displays, it requires users to concentrate on watching patterns and identifying
interesting or novel features within them. This can sometimes be quite tiresome. If patterns can
be transformed into sound and music, then instead of watching pictures, we can listen to pitches,
rhythms, tune, and melody in order to identify anything interesting or unusual. This may relieve
some of the burden of visual concentration and be more relaxing than visual mining. Therefore,
audio data mining is an interesting complement to visual mining.
2. Define visual data mining. (April/May 2008)
Visual data mining discovers implicit and useful knowledge from large data sets using data
and/or knowledge visualization techniques. The human visual system is controlled by the eyes
and brain, the latter of which can be thought of as a powerful, highly parallel processing and
reasoning engine containing a large knowledge base. Visual data mining essentially combines
the power of these components, making it a highly attractive and effective tool for the
comprehension of data distributions, patterns, clusters, and outliers in data.
3. What is mean by the frequency item set property? (Nov/Dec 008)
A set of items is referred to as an itemset. An itemset that contains k items is a k-itemset. The set
{computer, antivirus software} is a 2-itemset. The occurrence frequency of an itemset is the
number of transactions that contain the itemset. This is also known, simply, as the frequency,
support count, or count of the itemset.

4. Mention the advantages of hierarchical clustering. (Nov/Dec 2008)
Hierarchical clustering (or hierarchic clustering) outputs a hierarchy, a structure that is more
informative than the unstructured set of clusters returned by flat clustering. Hierarchical
clustering does not require us to prespecify the number of clusters and most hierarchical
algorithms that have been used in IR are deterministic. These advantages of hierarchical
clustering come at the cost of lower efficiency.
5. Define time series analysis. (May/June 2009)
Time series analysis comprises methods for analyzing time series data in order to extract
meaningful statistics and other characteristics of the data. Time series forecasting is the use of a
model to predict future values based on previously observed values. Time series are very
frequently plotted via line charts.
6. What is mean by web content mining? (May/June 2009)
Web content mining, also known as text mining, is generally the second step in Web data
mining. Content mining is the scanning and mining of text, pictures and graphs of a Web page to
determine the relevance of the content to the search query. This scanning is completed after the
clustering of web pages through structure mining and provides the results based upon the level of
relevance to the suggested query. With the massive amount of information that is available on
the World Wide Web, content mining provides the results lists to search engines in order of
highest relevance to the keywords in the query.

3. FIVE MARKS QUESTION AND ANSWERS
Partitioning algorithms: Construct various partitions and then evaluate them by some criterion
Hierarchy algorithms: Create a hierarchical decomposition of the set of
data (or objects) using some criterion
Density-based: based on connectivity and density functions
Grid-based: based on a multiple-level granularity structure
Model-based: A model is hypothesized for each of the clusters and the idea is to find the best fit of that model to each other.
Partitioning approach:
Construct various partitions and then evaluate them by some
criterion, e.g., minimizing the sum of square errors
Typical methods: k-means, k-medoids,CLARANS
Hierarchical approach:
Create a hierarchical decomposition of the set of data (or objects) using some criterion
Typical methods: Diana, Agnes, BIRCH, ROCK,CHAMELEON
Density-based approach:
Typical methods: DBSCAN, OPTICS,DenClue
Grid-based approach:
based on a multiple-level granularity structure
Typical methods: STING, WaveCluster,CLIQUE
Model-based:
A model is hypothesized for each of the clusters and tries to find the best fit of that model to each other
Typical methods: EM, SOM,COBWEB
Frequent pattern-based:

Based on the analysis of frequent patterns
Typical methods:pCluster
User-guided or constraint-based:
Clustering by considering user-specified or application-specific constraints
Typical methods: COD (obstacles), constrained clustering
2. Explain Hierarchical method clustering of classification with example?[Nov/Dec 2014]
Use distance matrix. This method does not require the number of clusters k as an input, but needs a termination condition
AGNES (Agglomerative Nesting):
Introduced in Kaufmann and Rousseeuw(1990)
Implemented in statistical analysis packages, e.g.,Splus
Use the Single-Link method and the dissimilarity matrix.
Merge nodes that have the least dissimilarity
Go on in a non-descending fashion
Eventually all nodes belong to the same cluster

Dendrogram: Shows How the Clusters are merged:
Decompose data objects into a several levels of nested partitioning (tree of clusters), called a
Dendrogram.
A clustering of the data objects is obtained by cutting the dendrogram at the desired level, and then each connected component forms a cluster.
DIANA (Divisive Analysis):
Introduced in Kaufmann and Rousseeuw(1990)
Implemented in statistical analysis packages, e.g.,Splus
Inverse order ofAGNES
Eventually each node forms a cluster on itsown
3. Explain CHAMELEON: Hierarchical Clustering Using Dynamic modeling?
Measures the similarity based on a dynamic model
Two clusters are merged only if the interconnectivity and closeness (proximity) between two clusters are high relative to the internal interconnectivity of the clusters and closeness of items within the clusters
Cure ignores information about interconnectivity of the objects, Rock ignores information about the closeness of two clusters
A two-phase algorithm
Use a graph partitioning algorithm: cluster
objects into a large number of relatively small sub-clusters
Use an agglomerative hierarchical clustering algorithm: find the genuine
clusters by repeatedly combining these sub-clusters

Overall Framework of CHAMELEON
4. Explain Density-Based Clustering Methods of classification with example?
Clustering based on density (local cluster criterion), such as density-connected points
Major features:
Discover clusters of arbitrary shape
Handle noise
One scan
Need density parameters as termination condition
Several interesting studies:
DBSCAN: Ester, et
DENCLUE: Hinneburg& D.
-based)
DBSCAN: The Algorithm:

Arbitrary select a point p
Retrieve all points density-reachable from p w.r.t. EpsandMinPts.
If p is a core point, a cluster is formed.
If p is a border point, no points are density-reachable from p and DBSCAN visits the next point of the database.
Continue the process until all of the points have been processed.
Grid-Based Clustering Method:
Using multi-resolution grid data structure
Several interesting methods
STING (a Statistical Information Grid approach) by Wang, Yang and Muntz(1997)
Wave Cluster by Sheikholeslami, Chatterjee, and
A multi-resolution clustering approach using wavelet method
On high-dimensional data (thus put in the section of clustering high- dimensional data
STING: A Statistical Information Grid Approach: Wang, Yang and
The spatial area area is divided into rectangular cells
There are several levels of cells corresponding to different levels of resolution
The STING Clustering Method:
Each cell at a high level is partitioned into a number of smaller cells in the next lower level
Statistical info of each cell is calculated and stored
beforehand and is used to answer queries
Parameters of higher level cells can be easily calculated from parameters of lower level cell
count, mean, s, min,max

type of distribution normal, uniform,etc.
Use a top-down approach to answer spatial data queries
Start from a pre-selected layer typically with a small number of cells
For each cell in the current level
compute the confidence interval Comments on
STING:
Remove the irrelevant cells from further consideration
When finish examining the current layer, proceed to the next lower level
Repeat this process until the bottom layer is reached
Advantages:
Query-independent, easy to parallelize, incremental update
O(K), where K is the number of grid cells at the lowest level
Disadvantages:
All the cluster boundaries are either horizontal or vertical, and no diagonal boundary is detected
EM (Expectation maximization),Auto Class
5. Explain Outlier analysis with example? Assume a model underlying distribution that generates data set (e.g. normal
distribution)
Use discordancy tests depending on
data distribution
distribution parameter (e.g., mean, variance)
number of expected outliers
Drawbacks

most tests are for single attribute
In many cases, data
distribution may not be
known Outlier Discovery:
Distance-Based Approach:
Introduced to counter the main limitations imposed by statistical methods
We need multi-dimensional analysis without knowing data distribution
Distance-based outlier: A DB(p, D)-outlier is an object O in a dataset T such that at least a fraction p of the objects in T lies at a distance greater than D from O
Algorithms for mining distance-based outliers
Index-based algorithm
Nested-loop algorithm
Cell-based algorithm
Density-Based Local Outlier Detection:
Distance-based outlier detection is based on global distance distribution
It encounters difficulties to identify outliers if data is not uniformly distributed
Ex. C1 contains 400 loosely distributed points, C2 has 100
tightly condensed points, 2 outlier points o1,o2
Distance-based method cannot identify o2 as an outlier Need the concept of local outlier
Outlier Discovery: Deviation-Based Approach:
Identifies outliers by examining the main characteristics of objects in a group
considered outliers

Sequential exception technique
simulates the way in which humans can distinguish unusual objects from among a series of supposedly like objects
OLAP data cube technique
uses data cubes to identify regions of anomalies in large multidimensional
data
Summary:
Cluster analysis groups objects based on their similarity and has wide applications
Measure of similarity can be computed for various types of data
Clustering algorithms can be categorized into partitioning methods, hierarchical methods, density-based methods, grid-based methods, and model-based methods
Outlier detection and analysis are very useful for fraud detection, etc. and can be performed by statistical, distance-based or deviation-based approaches
There are still lots of research issues on cluster analysis
Problems and Challenges:
Considerable progress has been made in scalable clustering methods
Partitioning: k-means, k-medoids,CLARANS
Hierarchical: BIRCH, ROCK,CHAMELEON
Density-based: DBSCAN, OPTICS,DenClue
Grid-based: STING, WaveCluster,CLIQUE
Model-based: EM, Cobweb,SOM
Frequent pattern-based:pCluster
Constraint-based: COD, constrained-clustering

Current clustering techniques do not address all the requirements adequately, still an active area of research
4. Objective question with answers.
1. A ___________ model identifies patterns or relationships.
A. Descriptive.
B. Predictive.
C. Regression.
D. Time series analysis.
2. A predictive model makes use of ________.
A. current data.
B. historical data.
C. both current and historical data.
D. assumptions.
3. ____________ maps data into predefined groups.
A. Regression.
B. Time series analysis
C. Prediction.
D. Classification.
4. __________ is used to map a data item to a real valued prediction variable.
A. Regression.
B. Time series analysis.
C. Prediction.
D. Classification.
5. In ____________, the value of an attribute is examined as it varies over time.
A. Regression.
B. Time series analysis.
C. Sequence discovery.
D. Prediction.
6. In ________ the groups are not predefined.
A. Association rules.
B. Summarization.
C. Clustering.
D. Prediction.
7. Link Analysis is otherwise called as ___________.
A. affinity analysis.
B. association rules.
C. both A & B.
D. Prediction.
8. _________ is a the input to KDD.
A. Data.
B. Information.
C. Query.
D. Process.
9. The output of KDD is __________.
A. Data.
B. Information.
C. Query.
D. Useful information.
10. The KDD process consists of ________ steps.
A. three.
B. four.
C. five.
D. six.
Answer:
1. A 6. C 2. B 7. C 3. D 8. A 4. B 9. D 5. B 10. C

5. Fill in the blanks questions with answers
1. Treating incorrect or missing data is called as ___________.
2. Converting data from different sources into a common format for processing is called as
________.
3. Various visualization techniques are used in ___________ step of KDD.
4. Extreme values that occur infrequently are called as _________.
5. Box plot and scatter diagram techniques are _______.
6. __________ is used to proceed from very specific knowledge to more general information.
7. Describing some characteristics of a set of data by a general model is viewed as
____________
8. _____________ helps to uncover hidden information about the data.
9. _______ are needed to identify training data and desired results.
10. Over fitting occurs when a model _________.
ANSWERS:
1. pre-processing 6. Induction. 2. transformation 7. Compression. 3. Interpretation. 8. Approximation. 4. Outliers. 9. Users. 5. Geometric. 10. Does not fit in future states.