16 Debugging Techniques
66
Debugging
-
Upload
versatile-human -
Category
Documents
-
view
72 -
download
4
Transcript of 16 Debugging Techniques
DebuggingDebugging
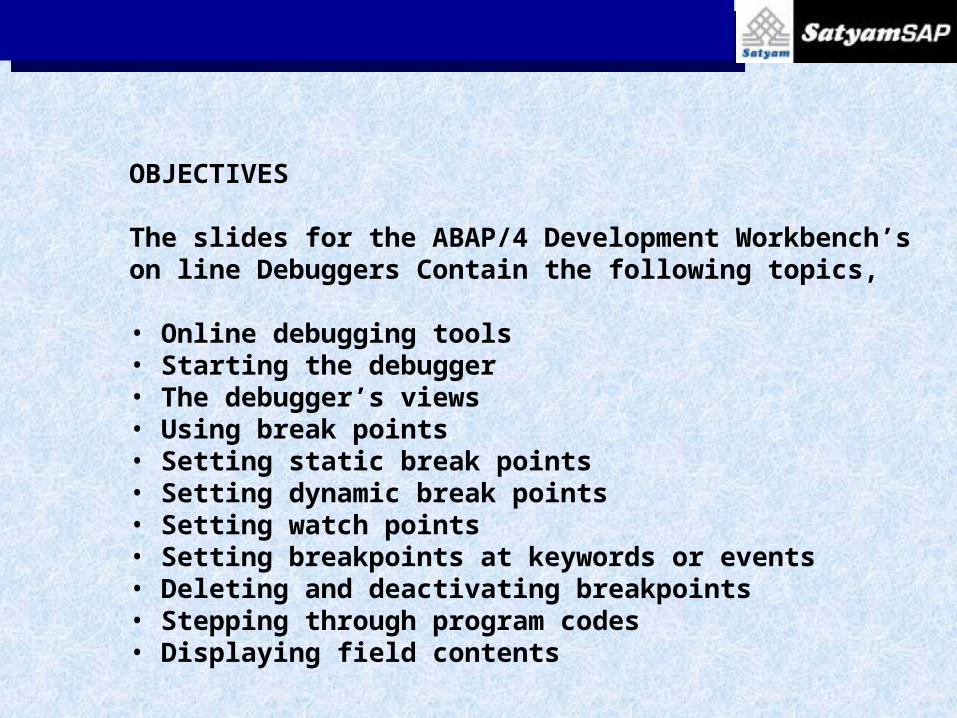
OBJECTIVES
The slides for the ABAP/4 Development Workbench’s on line Debuggers Contain the following topics, • Online debugging tools• Starting the debugger• The debugger’s views• Using break points• Setting static break points• Setting dynamic break points• Setting watch points• Setting breakpoints at keywords or events• Deleting and deactivating breakpoints• Stepping through program codes• Displaying field contents
Debugging Debugging
• Displaying Internal tables• Displaying ABAP/4 lists• Replacing field values at runtime• Changing internal tables at runtime• Switching to the ABAP/4 Editor• Releasing the database during debugging

Online debugging tools : A review
•The ABAP/4 Debugger lets you stop a program during runtime and examine the flow and results of each statement during execution.
•Stepping through a program with the debugger helps you to detect and correct errors in your code.
•This material is designed for developers new to the Workbench’s debugging facilities or for those who want to learn the tool to use the tool more effectively.
Debugging Debugging

After working through this slides , you should be able to debug both familiar and unfamiliar programs effectively. With this slides, you will learn how to
• Switch on the debugger• Set and delete static and dynamic break points.• Set watch points• Stop a program at specific key words or events or when a field contents change.• Continue processing after an interrupt.• Display field contents during runtime.• Display the contents of an internal table.• Change field contents for testing purposes.• Change the contents of an internal table.• Display and use debugger’s views.
Debugging Debugging
Debugging Strategies form within ABAP/4 Development Work bench.
We can set breakpoints in a program and then start the program within the Debugger.Alternatively, we can run the program in the debugger without any breakpoints.
A Breakpoint is a signal within a line of code that tells the ABAP/4 runtime processor to interrupt the program at the line.Setting break points is a good strategy if we want to examine a program:• After the system has already processed certain events• Just before a specific event is carried out• By skipping quickly to a specific routines or calls.
Debugging Debugging

•Starting the Debugger
On running a program in the debugging mode the following steps can be followed.
In the object browser ,Select a report or transaction.Choose debugging in the ABAP/4 editor initial screen.Choose Program Execute Debugging or choose debugging.
From any screen , Choose SystemUtilities Debug ABAP/4.
Debugging Debugging
•Debugger’s views
A debugger selects different views , by selecting appropriate view name by Push-Buttons ,in debugger.
These Push buttons has following specific meaning.
Debugging Debugging

Overview - Displays the structure of the program to be debugged. Call stack - Displays an active event chain and the call sequence up to the current breakpoint.
Fields - Displays the fields content and technical characteristics.
Table - Displays the content of an internal table.
Break-Points - Displays the Break-Points set in the program. Watchpoints - Displays the Watch-Points set in the program.
Debugging Debugging

Structure of the Debugging view.
• Each debugging view has the same structure.
• The top half of the screen displays a portion of the programs source code and the lower half shows information specific to that particular view
• At the Line ‘Source Code of’ in the debugging editor , appears two push buttons to scroll through the program code.
Debugging Debugging

The line currently ready for processing is indicated by “>”.A small stop sign appears to the left of each dynamic break point .
Using Breakpoints
• A breakpoint is a signal within a program’s code , which tells the ABAP/4 processor to interrupt the program at a particular point.
• The type of breakpoint depends on the purpose of debugging.
Debugging Debugging

Debugging
ABAP Debugging Screen
Following are the types of breakpoints.
•Static These are user independent , set directly into a program’s code with the editor. User dependent breakpoints also is possible.
•Dynamic Set within the ABAP/4 debugger or editor. This type is visible when the program is displayed in the editor.
•Watch points Set within the ABAP/4 debugger .Watch points are field-specific. This is used to observe changes to a particular field .The debugger interrupts the program when fields content change.
Debugging Debugging
• Key word (statement) or event breakpoints
Set within the ABAP/4 debugger. The debugger interrupts the program when the ABAP/4 processor comes in contact with a specific key word (statement) or event in program’s code.
Debugging Debugging
• When a static breakpoint is used? Static break point are generally user-independent. On setting this breakpoint , every use who executes the program encounters the breakpoint. This is used when several developers are working in the same program, and all wants to the program to interrupt at the same place during execution. These breakpoints are visible in the programs code.
• When a dynamic breakpoint is used?Dynamic break point is user-specific. If we want to interrupt a program when we execute and while others are running, we use dynamic break-point. Dynamic breakpoints are more flexible than static breakpoint , they can be removed or deactivated during runtime.
Debugging Debugging
•When to use watch points.
We can set watchpoints only from within the debugger.
They are useful if we want to interrupt a program only when there is a change in a particular field or a field string.
We can set and remove watch points as needed . Like dynamic breakpoint, it does not disturb the other users of the same program.
Debugging Debugging
When to use breakpoints at Keywords (statements) or Events.
From within debugger , we can allocate breakpoint for specific ABAP/4 keywords or program events.
This is useful if we do not know exactly where a key word or event occurs , but still want the program to be interrupted just before the command or event is carried out.
Debugging Debugging
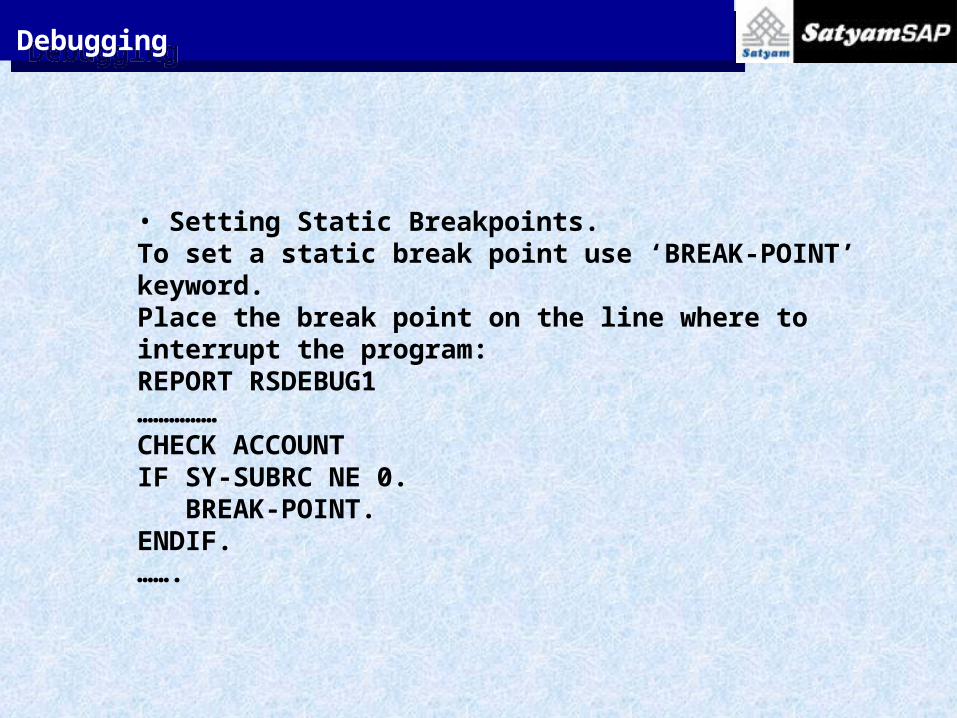
• Setting Static Breakpoints.To set a static break point use ‘BREAK-POINT’ keyword.Place the break point on the line where to interrupt the program:REPORT RSDEBUG1……………CHECK ACCOUNTIF SY-SUBRC NE 0. BREAK-POINT.ENDIF.…….
Debugging Debugging
…….When we start the report , ABAP/4 interrupts the processing at the break point. We can number breakpoints like BREAK-POINT1 ,BREAK-POINT2..for easier identification.
• Removing Breakpoints.It is necessary to remove the breakpoints after debugging .Use function Utilities Global search to help in locating break-points in larger programs. It is necessary to remove breakpoints since it may cause serious disruptions in productive process.
Debugging Debugging
•Setting Dynamic Breakpoints We can set dynamic breakpoint , without changing the program’s code.Following are the steps to set a breakpoint in ABAP/4 Editor.
Place the cursor on the line where to position the breakpoint.
Choose Utilities Breakpoint Set or press the ‘stop’ pushbutton at the Application tool bar.
Debugging Debugging
A display of all breakpoints in a program can be obtained by selecting
UtilitiesBreakpointDisplay , in the ABAP editor.
The dynamic breakpoint display leads to navigate to a certain breakpoint or delete one or all breakpoints from the program code.
Debugging Debugging
•Setting Watchpoints.
A watch point is set to interrupt a program when the contents of a specific field or a string change.Following are the steps to set a watch point.
Debugging Debugging

On the Debugging editor, enter the table-field.
Press the pushbutton ‘Watchpoint’ on the top left .
A dialog box appears , asking for the ‘local watch point’, relational operator. Fill in as per requirement.
Fill the appropriate value in the Comparison field or value,as per preference in the given check box or text field press the tick .
A display of watch points can be viewed by goto-->Control debugging--> Watchpoint or by pressing ‘Watchpoint’ pushbutton in the ABAP editor.
Debugging Debugging

•Setting Breakpoints at (statements) keywords or subroutines.
If we want to interrupt the program directly before a certain keyword event or a subroutine , we use this facility.We can achieve this with the following steps in the editor.
Debugging Debugging
Choose either Breakpoint Breakpoint at Statement or subroutine or function module in the menu.
The system will display a small screen prompting to enter statement keyword or subroutine etc., as per selection in the menu.
The system will set a breakpoint each time the statement
or subroutine appears in the program.
For break point in form routines , it is possible to access the current program , not external subroutine calls.
Debugging Debugging

•Deleting a dynamic Break-point.To delete a dynamic breakpoint , place the cursor in a line and choose BreakpointSet/Delete or Delete in the ABAP editor screen.
Deleting this breakpoint is also possible by double clicking the appropriate line.
From within the debugging editor, deleting the dynamic breakpoint is done by the following steps at the debugger’s menu bar.
Debugging Debugging
Choose Goto Control Debugging Breakpoint. The System will list all the breakpoints. Select one breakpoint. Choose individual by double clicking on the icon ‘Stop’ and it deletes .
Temporary deleting of Dynamic breakpoint is possible by selecting the appropriate line and select Breakpoint Deactivate/Activate in the ABAPDebugger’s menu bar.
Debugging Debugging

•Deleting Watchpoints.Watch points are special break points set for specific fields. To remove a watch point , the following steps will do.
From the debugger’s menu bar ,
Choose Goto Control debuggingWatchpoint or click ‘Watchpoint’ pushbutton in the editor.
Debugging Debugging
A display of the watch points occurs , and can be deleted by pressing ‘delete’ checkbox at the end (last column) of each Watchpoint display.
• Displaying the Location of breakpoints. From the debugging editor’s menu bar,
Select Goto Control DebuggingBreakpoints to get an overview of all existing breakpoints in a program’s code.
• From the breakpoint display , it is possible to set or delete individual breakpoints.
Debugging Debugging
Stepping through program code.From within the debugger several options for stepping through the code:
• Single step : Execute a program statement by statement. If single step is chosen while on a line that calls a FORM routine , for example the next mouse click carries to the called routine.After stepping the way through the subroutine, returns to the line of code directly following the subroutine call.
Debugging
• Execute : Process a program line by line. On choosing Execute while on a line, that calls a FORM routine, the debugger executes the subroutine subroutine and halts at the line of code directly following the call.Thus this skips over the lines of the subroutine itself.
• Continue: Processes the program up to the next active dynamic or static break point. If no further breakpoints exists, the system executes the report in its entirety without stopping.
• Return: Returns the debugger to where a calling program resumes control.Can be used from within a subroutine call.
Debugging
From the debugging editor,this can be performed by following :
• In the Menu bar , select debugging ,where it lists the menus for single step,execute , return and continue.
• Depending upon the mode of debugging, we can choose one option.
• Another method,we can select the appropriate push buttons for the Single step,Execute, Return and Continue placed at the top left of the application tool bar of the debugging editor.
• This facilitates to go through the program by various modes.
Debugging
Displaying the field contents:
• While debugging , display of the critical of the critical contents of the fields (up to eight fields) are possible.
• This can be performed by selecting the ‘Fields’ Push button in the view options buttons.
Debugging Debugging
• Enter the field names directly in the spaces provided or double click the field in the code display and the system lists it as a variable automatically.
• Deleting the fields are possible by an appropriate push button placed just above the field names table.
• We can use the variable screen to display the contents of any system field or all field that a program references.
Debugging Debugging
• Also the debugger to display fields defined in the ABAP/4 Dictionary can be performed by defining the relevant table in the TABLES statement of the current program.
• Additionally the contents of the fields from external programs can be displayed by placing the name of the external program in brackets in front of the field name.
Debugging Debugging

Displaying Internal tables.
• Within the debugger , we can display the contents of an internal table by choosing the ‘Table’ pushbutton.
• The system displays the Table view with the table rows numbered.
• Specify a table name in the Internal table field or double click on the table. If the internal table contains a header line, this line appears before the actual table contents and is marked in the display by >>>>>>>.
Debugging Debugging
• We can Scroll through the table display using the Index field or the scroll icons.
• Viewing the table on the left or right of the screen can be done by the push buttons in the application tool bar for horizontal scrolling or simply shift the title bar of the table.
Debugging Debugging
• Using the column header line, changing the sequence of the fields is possible .
• If we remove a field name from the column header line, then the system deletes the field from the display. If we specify an incorrect field name, the system displays a string of question marks.
Debugging

• If the space you leave to display a field is too small , the system truncates the display and indicates this by a “<” character.
• As with the field display , we can customize the display format for internal tables. The standard entry in the Format field is an E (for edited) .
• Once we have finished examining the internal table , return to the screen with the field display and program code by selecting the program button.
Debugging

A View of internal table display
Debugging

Displaying ABAP/4 Lists.
If we are debugging an online report that generates a list, we can display this list in the debugger. As soon as this list is started, the display list pushbutton appears.
Choose Display list to switch to the list display. The system displays all the lines generated so far in their respective formats.
Note : The current list line is formatted only after completion (NEW-LINE).
Debugging Debugging
Replacing fields at Runtime.
• While we are debugging a program , we might want to change the content of specific fields to influence our program’s flow.
• If error analysis reveals that a field contains a wrong value , for example , we can replace the faulty value at run time to determine if the program then runs correctly.
Debugging Debugging

We can change the values of all fields , database tables (with offset) and internal tables referenced in a report .
•If we alter the values of database fields , we do not change them in the database itself , but only in the work area ABAP/4 provides for one run of the report .
•The system displays an appropriate message if any format errors occur.
Debugging Debugging

To replace the value , we can do the following steps.
1.Go to the variable display screen. This is the Debugger’s default view.2.Double click on a variable to place it in the variables display.3.Enter a new value in the field contents row .4.Choose the ‘Change field content’ button.
Debugging Debugging

• ABAP/4 writes the new value back to the program field or fields and the system notes the change in the system log.
• If we forget to click on the ‘Change field content’ push-button , the system ignores the values we entered.
Note: ABAP/4 accepts our entries in the contents column exactly as we specified them. You need to pay special attention to the correct format.( Upper or lower case , right justified output with packed numbers).
Debugging Debugging
• Changing Internal Tables at Runtime
The debugger allows to manipulate the contents of an internal table during runtime. We can delete, edit or add a row to an internal table.
• Deleting a row
Debugging Debugging

To delete an entry from an internal table:1. Go to the table display screen2. Enter the table name in the internal table field.3. Choose Enter.
The system displays the table’s contents.4.Place the cursor on the line you wish to remove from the table.5.Press ‘Delete’ pushbutton.
The line disappears from the table and the system adjusts the line numbering accordingly.
Debugging Debugging
• Editing a row
The functions Change , Insert and append are field-specific in the Debugger and can be carried out only one field at a time by pressing the respective pushbuttons.
For example ,If we want to edit the following line:
LH001 FRANKFURT NEWYORK 145400 400 X,
we first need to decide which field to change.
Debugging Debugging

Then the following steps must be done.
1.Place the cursor on the row and field we want to edit.
2.Choose Change.
3.Enter a new value for the field.
4.Choose Enter.
The system updates the line and displays the new contents in the table.
Debugging Debugging
.
• Adding a Row
We can add a new row to an internal table by using either Append or the Insert function. Append places the new line at the end of the table.
Insert lets us to position the line anywhere.
To add a new row to the end of the table , the following steps will do.
1.Choose append.
2.Enter a value for the first field in the line.
3.Choose Enter.
Debugging Debugging

.
The system adds a line to the table and fills in the first field.
4.Enter the remaining fields of the line by following the procedure for editing a row as described above.
To insert a new line anywhere in the internal table ,position the cursor on the line directly following the line where we want the new row to appear. Then ,Choose Insert button and proceed as we want to append the line.
Debugging Debugging

.
Switching to the ABAP/4 Editor
• We can switch from the Debugger to ABAP/4 Editor at any time.
• If we discover a program error during the debugging process , for example,we can enter the ABAP/4 Editor to immediately correct the error in the program’s code.
Debugging Debugging
.
• We can also switch back to the editor in order to set new static break-points.
• After we set static breakpoints in the editor,they are not active in the debugger when we switch back.We must re-generate the program.Then the breakpoints appear in the debugger.
•To return to the ABAP/4 Editor for the program currently being debugged,
At the debugging editor’s menu bar,
Select DevelopmentABAP/4 Editor.
Debugging Debugging
• Releasing the Database during debugging
During debugging, the system normally suppresses the COMMIT statement. The COMMIT statement marks the end of a logical unit of work(LUW).
As a result , the system locks up the database for the course of that debugging session.
If we want to temporarily stop the program but do not want to end session,we should release the database that in use.If we forget to release this lock,no other user is able to modify data until we complete the test.To release the database explicitly during break in testing ,
From the debugger’s menu bar, choose
Debugging Database Commit.
To undo all changes made in the database since the last
COMMIT select DebuggingDatabaseRollback.

Debugging Debugging
Program ... . Breakpoint ... .
ABAP/4 Editor
ABAP/4 DebuggerABAP/4
Debugger
Debugging
Program B170D051
Breakpoints
Object List
Development object ... ... ...
. . .Test/execute. . .
Any screen
... ... ... System Help
. . .Utilities. . .
. . .Debug ABAP/4. . ./h
A SYNOPSIS A representation of Debugging Process -Branching to Debugging Mode

Debugging Mode
PROGRAM B170D051.DATA: DIFF TYPE P,
.
.
.COMPUTE DATE_1 = SY-DATUM.
.
.
.
Execute Single step Execute Continue Table
DATE_1 00000000
SY-DATUM 19940223
Variables
X R
R
R
R
R
O S V F T P
View pushbuttons
Debugging Debugging

The Most Important Debugging Functions
Single Step Processes the next program line.
Execute In contrast to the single step, executesall processing steps belonging to one line.
Continue
Table
Processing continues until the next breakpoint oruntil the end of the program.
Displays the contents of internal tables.
Breakpoint With the functions of this menu youdefine breakpoints.
Editor You go to the ABAP/4 editor.
Hexadecimal-display
Data contents can be displayed in hexadecimal format.
Debugging Debugging
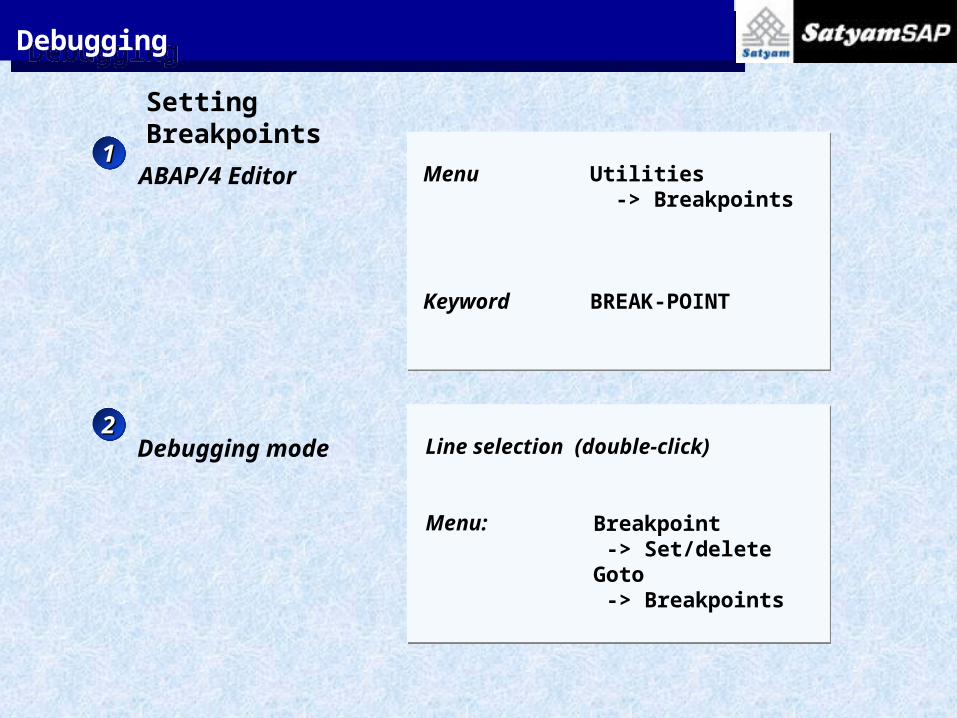
Setting Breakpoints
Menu
Keyword
Utilities -> Breakpoints
BREAK-POINT
Line selection (double-click)
Menu: Breakpoint -> Set/deleteGoto -> Breakpoints
ABAP/4 Editor
Debugging mode
11
22
Debugging Debugging

Debugging Debugging
General Queries
Question
• Static Break-point are user independent (YES/NO)
YES
• Dynamic Breakpoints are not user-specific(YES/NO)
NO
• Dynamic breakpoints are visible in the program(YES/NO)
YES
Debugging Debugging
• Dynamic Breakpoints are more flexible than Static Breakpoints(YES/NO)
YES
• Static Breakpoints are hard-coded in the program(YES/NO)
YES
• Temporary deletion of dynamic breakpoints are not possible(YES/NO)
NO

Debugging Debugging
• Watchpoints can be set only from within the debugger (YES/NO).
YES
• How can a temporary deletion of dynamic Breakpoints are done?
Temporary deletion of Breakpoints are done by option ACTIVATE/DEACTIVATE in the debugging editor.

Debugging Debugging
• What are the different options to step through the program in the debugger?
Single Step
Execute
Continue
Return
• While debugging ,it is impossible to correct wrong values in a table’s field dynamically during runtime (YES/NO)
NO
Debugging Debugging
• Addition and deletion of fields in a table is possible in Debugger(YES/NO).
YES
• From the ABAB Debugger , switching to ABAP/4 Editor is not allowed.
(YES/NO)
NO
• In internal table editing, ‘Append’ option adds a field at the end of the existing table. (YES/NO).
YES
Summary
Debugging Debugging
The above slides have given an idea of debugging , the debugging tools for various operations like usage of breakpoints , watch points ,internal tables display,stepping through a program code, switching to ABAP editor and associated utilities.

Thank You