16 April 2021 4QFY21 Results Preview Autos & Logistics
11
16 April 2021 4QFY21 Results Preview Autos & Logistics HSIE Research is also available on Bloomberg ERH HDF <GO> & Thomson Reuters Diverging growth outlook After the initial outperformance by the auto stocks, the sector returns are converging with those of the broader market due to moderating domestic growth trends across 2Ws and commodity-based inflation. OEMs expect an impact of ~300bps due to the rising base metal prices, which will limit the extent of margin expansion from improving leverage (as demand normalises over FY22-23E). Amidst this backdrop, we prefer stocks that have a diversified revenue model such as Tata Motors, Bharat Forge, and Bajaj Auto. We also have a BUY rating on Maruti Suzuki due to the sustained demand for PVs, given the shift towards personal mobility. Commodity inflation to impact 4QFY21 profitability: The commodity prices over the past six months are up sharply - aluminum (+26%), copper (+32%), crude (+55%), steel (+55%). In our discussion with Bajaj Auto, the company highlighted that the impact on margins will be 300-400bps. Most OEMs are highlighting similar views, with margin impact varying between 200-400bps due to the above. While OEMs will benefit from improved operating leverage as volumes normalise over FY22-23E, the extent of margin improvement will be contained due to the above. Demand revival – differing trends are emerging: Sales recovery trends have been mixed in 4Q, with PV and tractor demand remaining resilient while 2W sales have been tepid, particularly at the entry level (refer to our note: Divergent Trends in PVs and 2Ws). We believe the recovery in autos is a ‘K’ shaped one, where the COVID impact (closure of education institutes and dine-ins, weak SME activity, etc.) is affecting the lower end consumer segment. CV sales are recovering, though the expected benefit from the scrappage scheme will now be spread over FY22-24. Sector returns are converging with the broader market: The NIFTY Auto index returns in 4Q (+7% QoQ) has performed largely in line with the broader index (+5% QoQ) as commodity cost inflation and moderating growth trends across 2Ws have tempered stock price returns, after strong outperformance in 1HFY21. We believe that returns will be stock specific, going ahead, as the recovery is getting factored in (valuations are elevated) and growth rates are now diverging across segments. After several quarters, we have lowered estimates for FY22/23E due to the above factors. Key recommendations: We are positive on Bajaj Auto, Tata Motors, and Maruti amongst the OEMs. We have recently downgraded Hero to an ADD due to the moderating growth outlook. Amongst auto ancillaries, we have initiated on Bharat Forge with a BUY rating due to an improving outlook for global CVs as well as diversification initiatives (particularly in the defence segment). We continue to prefer Subros amongst domestic auto ancillaries due to its dominant presence in the car AC segment as well as expansion in the home and railway AC segment. Logistic companies: The rail-based logistic companies expect the benefits from the DFC to reflect from 2HFY22 as the 650km stretch from Rewari (Haryana) to Palanpur (Gujarat) will be commissioned by Apr-May. We reiterate our preference for Gateway Distriparks (BUY) as CONCOR (ADD) will have to contend with higher LLF charges levied by the Indian railways. CMP (INR/sh) * Reco Ashok Leyland 112 REDUCE Bajaj Auto 3,601 BUY Eicher 2,412 REDUCE Escorts 1,218 ADD Hero Moto 2,863 ADD Mahindra 805 ADD Maruti 6,652 BUY Tata Motors 304 BUY Amara Raja 802 ADD Bharat Forge 574 BUY Endurance 1,295 BUY Gulf Oil 706 BUY Subros 301 BUY Sundram 700 ADD CONCOR 565 ADD Gateway 176 BUY *CMP as of 15 th Apr-21 NIFTY Auto index Source: Bloomberg, HSIE Research; indexes rebased to 100 Aditya Makharia [email protected] +91-22-6171-7316 Mansi Lall [email protected] +91-22-6171-7357 80 100 120 140 160 180 Apr-20 May-20 Jun-20 Jul-20 Aug-20 Sep-20 Oct-20 Nov-20 Dec-20 Jan-21 Feb-21 Mar-21 Apr-21 NIFTY NIFTY AUTO
Transcript of 16 April 2021 4QFY21 Results Preview Autos & Logistics

16 April 2021 4QFY21 Results Preview
Autos & Logistics
HSIE Research is also available on Bloomberg ERH HDF <GO> & Thomson Reuters
Diverging growth outlook After the initial outperformance by the auto stocks, the sector returns are
converging with those of the broader market due to moderating domestic
growth trends across 2Ws and commodity-based inflation. OEMs expect an
impact of ~300bps due to the rising base metal prices, which will limit the
extent of margin expansion from improving leverage (as demand normalises
over FY22-23E). Amidst this backdrop, we prefer stocks that have a diversified
revenue model such as Tata Motors, Bharat Forge, and Bajaj Auto. We also
have a BUY rating on Maruti Suzuki due to the sustained demand for PVs,
given the shift towards personal mobility.
Commodity inflation to impact 4QFY21 profitability: The commodity
prices over the past six months are up sharply - aluminum (+26%), copper
(+32%), crude (+55%), steel (+55%). In our discussion with Bajaj Auto, the
company highlighted that the impact on margins will be 300-400bps. Most
OEMs are highlighting similar views, with margin impact varying between
200-400bps due to the above. While OEMs will benefit from improved
operating leverage as volumes normalise over FY22-23E, the extent of
margin improvement will be contained due to the above.
Demand revival – differing trends are emerging: Sales recovery trends
have been mixed in 4Q, with PV and tractor demand remaining resilient
while 2W sales have been tepid, particularly at the entry level (refer to our
note: Divergent Trends in PVs and 2Ws). We believe the recovery in autos
is a ‘K’ shaped one, where the COVID impact (closure of education institutes
and dine-ins, weak SME activity, etc.) is affecting the lower end consumer
segment. CV sales are recovering, though the expected benefit from the
scrappage scheme will now be spread over FY22-24.
Sector returns are converging with the broader market: The NIFTY Auto
index returns in 4Q (+7% QoQ) has performed largely in line with the
broader index (+5% QoQ) as commodity cost inflation and moderating
growth trends across 2Ws have tempered stock price returns, after strong
outperformance in 1HFY21. We believe that returns will be stock specific,
going ahead, as the recovery is getting factored in (valuations are elevated)
and growth rates are now diverging across segments. After several quarters,
we have lowered estimates for FY22/23E due to the above factors.
Key recommendations: We are positive on Bajaj Auto, Tata Motors, and
Maruti amongst the OEMs. We have recently downgraded Hero to an ADD
due to the moderating growth outlook. Amongst auto ancillaries, we have
initiated on Bharat Forge with a BUY rating due to an improving outlook for
global CVs as well as diversification initiatives (particularly in the defence
segment). We continue to prefer Subros amongst domestic auto ancillaries
due to its dominant presence in the car AC segment as well as expansion in
the home and railway AC segment.
Logistic companies: The rail-based logistic companies expect the benefits
from the DFC to reflect from 2HFY22 as the 650km stretch from Rewari
(Haryana) to Palanpur (Gujarat) will be commissioned by Apr-May. We
reiterate our preference for Gateway Distriparks (BUY) as CONCOR (ADD)
will have to contend with higher LLF charges levied by the Indian railways.
CMP
(INR/sh) * Reco
Ashok Leyland 112 REDUCE
Bajaj Auto 3,601 BUY
Eicher 2,412 REDUCE
Escorts 1,218 ADD
Hero Moto 2,863 ADD
Mahindra 805 ADD
Maruti 6,652 BUY
Tata Motors 304 BUY
Amara Raja 802 ADD
Bharat Forge 574 BUY
Endurance 1,295 BUY
Gulf Oil 706 BUY
Subros 301 BUY
Sundram 700 ADD
CONCOR 565 ADD
Gateway 176 BUY
*CMP as of 15th Apr-21
NIFTY Auto index
Source: Bloomberg, HSIE Research;
indexes rebased to 100
Aditya Makharia
+91-22-6171-7316
Mansi Lall
+91-22-6171-7357
80
100
120
140
160
180A
pr-
20
May
-20
Jun
-20
Jul-
20
Au
g-2
0
Sep
-20
Oct
-20
No
v-2
0
Dec
-20
Jan
-21
Feb
-21
Mar-
21
Ap
r-21
NIFTY NIFTY AUTO

Page | 2
Autos & Logistics: 4QFY21E Results Preview
4QFY21E earnings preview
Volume (in units '000) NET SALES (INR bn) EBITDA margin (%) APAT (INR bn) Adj. EPS (INR)
4Q
FY21E
QoQ
(%)
YoY
(%)
4Q
FY21E
QoQ
(%)
YoY
(%)
4Q
FY21E
QoQ
(bps)
YoY
(bps)
4Q
FY21E
QoQ
(%)
YoY
(%)
4Q
FY21E
3Q
FY21
4Q
FY20
AUTOS
Ashok
Leyland 44 32 73 63.8 32 66 10.3 507 558 4.2 1,475 3,577 1.4 0.1 0.0
Bajaj Auto 1,170 (10) 18 79.6 (11) 17 18.0 (140) (37) 15.1 (3) 15 52.3 53.8 45.3
Eicher 205 2 25 28.7 2 30 23.7 (3) 416 6.0 12 96 21.8 19.5 11.2
Escorts 33 3 62 20.3 0 47 16.9 (117) 279 2.6 (7) 86 25.9 27.8 13.9
Hero Moto 1,568 (15) 18 79.3 (19) 27 12.7 (173) 215 8.5 (22) 36 42.3 54.3 31.1
Mahindra 202 (10) 33 124.6 (11) 38 15.9 (112) 222 13.9 (21) 330 11.6 14.6 2.7
Maruti 492 (1) 28 231.3 (1) 27 9.8 28 127 17.2 (11) 33 56.9 64.3 42.8
Tata Motors 192 21 89 181.5 24 87 7.6 16 NA 0.0 (0) (0) 0.0 (1.6) (5.8)
Aggregate 3,905 (9) 23 809.0 1 41 12.0 (55) 320 67.4 2 251
Source: Company, HSIE Research
NET SALES (INR mn) EBITDA margin (%) APAT (INR mn) Adj. EPS (INR)
4Q
FY21E
QoQ
(%)
YoY
(%)
4Q
FY21E
QoQ
(bps)
YoY
(bps)
4Q
FY21E
QoQ
(%)
YoY
(%)
4Q
FY21E
3Q
FY21
4Q
FY20
AUTO ANCS
Amara Raja 18,390 (6) 16 15.3 (30) (4) 1,612 (17) 18 9.4 11.3 8.0
Bharat Forge 10,832 5 23 22.3 156 978 1,282 31 522 2.8 2.1 0.4
Endurance 19,967 (2) 25 16.3 (97) 139 1,666 (17) 56 11.8 14.3 7.6
Gulf Oil 4,941 3 37 16.8 (54) 135 579 (10) 61 11.6 12.9 7.2
Subros 6,426 6 40 10.6 (34) 156 271 (1) 68 4.2 4.2 2.5
Sundram Fasteners 11,113 0 34 19.5 (127) 473 1,304 (9) 139 6.2 6.8 2.6
Source: Company, HSIE Research
NET SALES (INR mn) EBITDA margin (%) APAT (INR mn) Adj. EPS (INR)
4Q
FY21E
QoQ
(%)
YoY
(%)
4Q
FY21E
QoQ
(bps)
YoY
(bps)
4Q
FY21E
QoQ
(%)
YoY
(%)
4Q
FY21E
3Q
FY21
4Q
FY20
LOGISTICS
CONCOR 19,225 10 23 20.5 (70) (975) 2,617 10 (15) 4.3 3.9 5.1
Gateway Distriparks 3,358 7 12 22.7 (362) 116 175 (47) 56 1.6 3.0 1.0
Source: Company, HSIE Research

Page | 3
Autos & Logistics: 4QFY21E Results Preview
Autos and Auto ancillaries
COMPANY 4QFY21
OUTLOOK WHAT’S LIKELY KEY MONITORABLES
Ashok Leyland GOOD
Volumes for the quarter came in at 44k units,
+32% QoQ (+73% YoY due to lower base).
This was led by demand recovery in the
MHCV segment.
Revenue is expected to grow 32/66%
QoQ/YoY, from a low base.
EBITDA margin is expected at 10.3%
(+500bps QoQ) owing to improved operating
leverage. We expect the company to report a
profit of INR 4bn vs INR 267/114mn
QoQ/YoY.
Market share gains in the LCV segment –
new product response
Recovery trends in MHCVs
Impact of scrappage scheme on CVs
Bajaj Auto AVERAGE
Volumes in the quarter are up 18% YoY due
to a lower base. However, it declined 10%
QoQ.
Operating margins are expected at 18% (-
140/35bps QoQ/YoY) due to increased
commodity costs.
PAT at INR 15bn to decline 3% QoQ.
Outlook on exports, particularly to the
African continent
Three-wheeler outlook in the Indian market
Updates on PLI scheme and benefits for
Bajaj Auto
Eicher Motors AVERAGE
RE volumes grew 2.5% QoQ to 205k units
(163k units YoY).
We expect revenue at INR 28.7bn (+2%
QoQ).
EBITDA margin at 23.7%, (similar to QoQ).
PAT growth of 12% QoQ to INR 5.9bn.
Progress on the production ramp-up
Demand trends for the new product-Meteor
Escorts GOOD
Volumes grew by 3% QoQ to 32.6k units
(20k units YoY).
We expect revenue to be flat QoQ. EBITDA
margins to contract by 120bps QoQ to 16.9%
owing to commodity cost led pressure.
PAT at INR 2.6bn to decline by 7% QoQ
(INR 1.4mn YoY).
Progress/plans of the recently
commissioned plant with Kubota
Impact of Agri reforms on the farm
segment
Hero
MotoCorp AVERAGE
Volumes for Hero declined 15% QoQ (+18%
YoY) to 1.5mn units.
We expect a revenue decline of 19% QoQ.
EBITDA margin at 12.7% (-175bps QoQ due
to cost pressures).
PAT at INR 8.5bn to decline 22% QoQ, +36%
YoY.
Market share trends in the premium
segment – response to Xtreme 160cc
Inventory levels
Mahindra AVERAGE
Total volumes (including tractors) declined
10% QoQ. Revenue is expected to have a
similar decline.
EBITDA margin at 15.9% to contract by
110bps QoQ.
PAT decline of 21% QoQ to INR 13.9bn.
Outlook for demand in tractors
Amidst rising competition in the SUV
segment, timelines on the launch of XUV
500
Further update on the impact of exit from
Ford JV / SsangYong stake sale
Source: HSIE Research

Page | 4
Autos & Logistics: 4QFY21E Results Preview
COMPANY 4QFY21
OUTLOOK WHAT’S LIKELY KEY MONITORABLES
Maruti Suzuki AVERAGE
We expect a revenue decline of 1% QoQ
owing to a similar decline in volumes.
EBITDA margin at 9.8% to expand 30bps
QoQ.
PAT to decline by 12% QoQ to INR 17bn
(vs12.9bn YoY).
Demand trends – particularly that of
entry-level cars
Status of model availability and waiting
periods thereof
Capacity utilization post the 3rd phase of
Gujarat plant getting commissioned
Tata Motors GOOD
Standalone: Volumes grew by 22/89%
QoQ/YoY. We expect standalone revenues to
grow by 24% QoQ to INR 181bn. EBITDA
margin of 7.6% (+20bps QoQ, EBITDA loss
YoY).
We expect JLR to report an EBITDA margin
at 13.5% (vs 15.8/4.8% QoQ/YoY)
Progress on the EV platforms, especially in
terms of hybrids.
Impact of lockdown on the near term on
volumes
Impact of scrappage scheme on CVs
Amara Raja
Batteries AVERAGE
We expect a revenue decline of 6% QoQ to
INR 18bn (vs INR 15.8bn YoY).
EBITDA margin at 15.3% to contract by
30bps QoQ.
PAT decline of 17% QoQ to INR 1.6bn (vs
INR 1.3bn YoY).
Impact of tightening pollution norms
(draft Battery Waste Management rules,
2020)
Initiatives to expand beyond conventional
LAB segment
Bharat Forge GOOD
We expect revenue to grow by 5% QoQ due
to improved CV sales.
EBITDA margin at 22.3% to expand 160bps
QoQ.
PAT at INR 1.28bn to expand by 31% QoQ.
US class 8 truck trends
Any update on defence sector orders
Endurance
Technologies AVERAGE
We expect consolidated revenue to decline
by 2% QoQ to Rs 19.9bn.
EBITDA margin at 16.3% to contract by
100bps QoQ owing to cost pressure.
PAT at INR 1.66bn to decline by 17% QoQ.
Market share gains by Endurance – update
on new order wins
Outlook on industry growth trends
Gulf Oil AVERAGE
We expect revenue to grow by 2.5% QoQ.
Operating margin at 16.8% to contract by
50bps QoQ.
We expect PAT decline of 10% QoQ to INR
579mn (vs INR 359mn YoY).
Volume outlook in the DEO segment
RM price trends as oil prices are now
firming up
Subros GOOD
We expect revenues to grow by 6% QoQ.
Operating margin to contract by 30bps QoQ
to 10.6%.
We expect PAT to decline by 1% QoQ to INR
271mn.
Expectations for demand pick up in the
passenger vehicle segment
The demand outlook for the home AC
business and any benefits from the PLI
scheme

Page | 5
Autos & Logistics: 4QFY21E Results Preview
COMPANY 4QFY21
OUTLOOK WHAT’S LIKELY KEY MONITORABLES
Sundram
Fasteners GOOD
We expect consolidated revenue to be flat
QoQ.
Operating margin at 19.5% to contract by
125bps QoQ.
We expect PAT decline of 9% QoQ.
Demand outlook in both India as well as
overseas markets
Any possible impact of separation from
the TVS group
Source: HSIE Research
Logistics
COMPANY 4QFY21
OUTLOOK WHAT’S LIKELY KEY MONITORABLES
Container
Corporation AVERAGE
We expect revenue to grow by 10% QoQ due
to similar growth in volumes. Volumes were
supported by a revival in domestic traffic.
EBITDA margin is expected at 20.5% (-70bps
QoQ)
We expect PAT to grow by 7/15% QoQ/YoY
to INR 2bn.
Impact of higher LLF payout to the Indian
Government on profitability.
Gateway
Distriparks GOOD
We expect consolidated revenues to grow by
7/12% QoQ/YoY.
Operating margin at 22.7% to contract by
360bps QoQ, +115bps YoY.
We expect PAT at INR 175mn (-47% QoQ,
+56% YoY).
Update on commissioning of the DFC
Margin/Volume gains as CONCOR raises
its charges due to the revised LLF
Source: HSIE Research
Change in estimates and target price
Coverage
companies
Old
Rating
New
Rating
Old
TP
(INR)
New
TP ^
(INR)
Old target
multiple
New target
multiple
Old EPS (INR) New EPS (INR) % change
FY
21E
FY
22E
FY
23E
FY
21E
FY
22E
FY
23E
FY
21E
FY
22E
FY
23E
Ashok Leyland # REDUCE REDUCE 97 108 11x
EV/EBITDA
11x
EV/EBITDA 0.1 3.8 5.2 -0.3 4.0 5.7 NA 6 8
Bajaj Auto BUY BUY 4,250 4,145 20x 20x 162.5 179.5 211.6 163.6 180.5 207.2 1 1 -2
Eicher REDUCE REDUCE 2,600 2,400
23x core
business
16x VECV
23x core
business
16x VECV
56.8 87.4 115.2 54.8 81.7 109.5 -4 -7 -5
Hero Motocorp ADD ADD 3,350 3,350 17.5x 17.5x 147.7 172.0 192.1 147.3 171.2 191.0 -0 -0 -1
M&M ADD ADD 880 880 14x core
business
15x core
business 40.5 42.7 50.7 37.6 39.2 47.4 -7 -8 -7
Maruti Suzuki BUY BUY 9,000 8,440 27x 27x 156.7 260.6 332.6 158.4 245.0 312.5 1 -6 -6
Tata Motors # BUY BUY 315 360
11x
EV/EBITDA
Standalone
11x
EV/EBITDA
Standalone
-13.3 3.3 14.0 -13.2 4.2 16.6 -1 27 19
Amara Raja ADD ADD 1,000 910 19x 19x 36.2 44.0 52.5 36.2 40.4 47.8 0 -8 -9
Bharat Forge BUY BUY 720 700 32x 32x 5.2 12.5 22.5 5.2 12.5 21.8 - - -3
Endurance BUY BUY 1,680 1,565 30x 30x 36.3 45.8 55.9 36.3 44.0 52.2 -0 -4 -7
Gulf Oil BUY BUY 880 870 20x 20x 37.8 40.7 44.0 39.6 41.2 43.5 5 1 -1
Subros BUY BUY 410 405 22x 22x 5.4 13.2 18.6 7.4 13.4 18.4 37 2 -1
Gateway
Distriparks # BUY BUY 165 200
9x
EV/EBITDA
Rail
business
10x
EV/EBITDA
Rail
business
4.1 5.2 7.4 5.2 6.3 8.4 28 20 13
Source: Company, HSIE Research, #valued on EV/EBITDA, ^FY23E TP
Page | 6
Autos & Logistics: 4QFY21E Results Preview
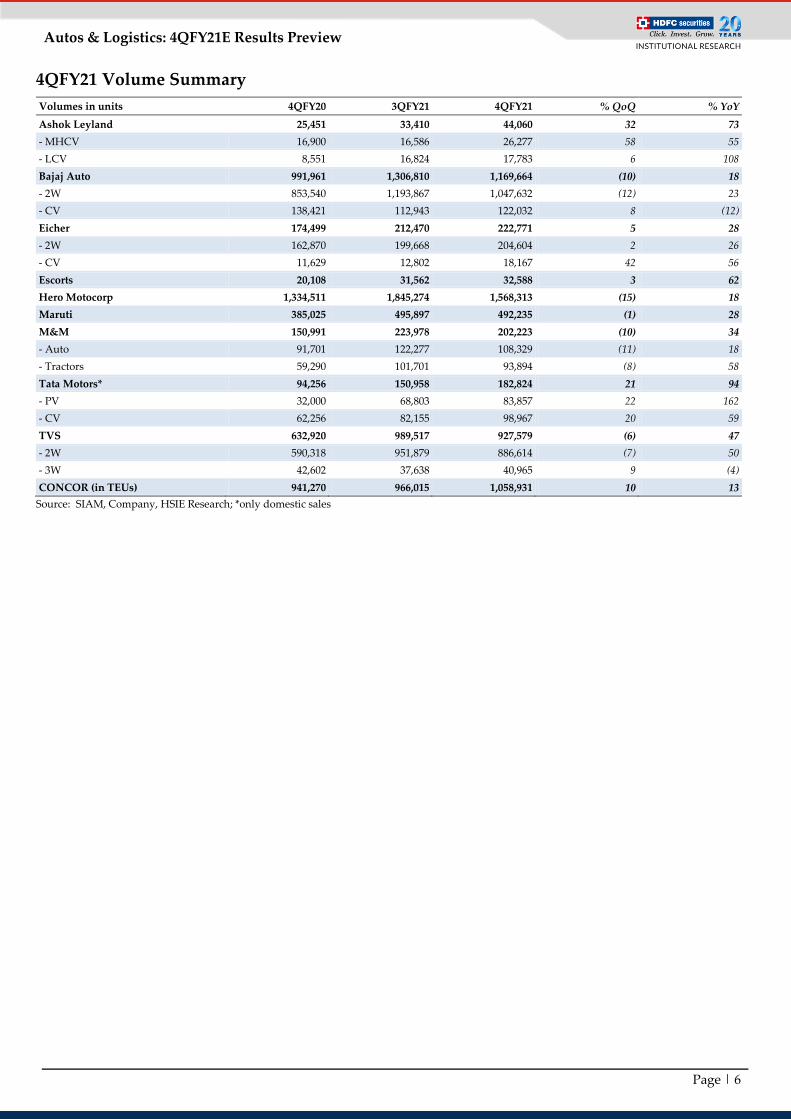
4QFY21 Volume Summary
Volumes in units 4QFY20 3QFY21 4QFY21 % QoQ % YoY
Ashok Leyland 25,451 33,410 44,060 32 73
- MHCV 16,900 16,586 26,277 58 55
- LCV 8,551 16,824 17,783 6 108
Bajaj Auto 991,961 1,306,810 1,169,664 (10) 18
- 2W 853,540 1,193,867 1,047,632 (12) 23
- CV 138,421 112,943 122,032 8 (12)
Eicher 174,499 212,470 222,771 5 28
- 2W 162,870 199,668 204,604 2 26
- CV 11,629 12,802 18,167 42 56
Escorts 20,108 31,562 32,588 3 62
Hero Motocorp 1,334,511 1,845,274 1,568,313 (15) 18
Maruti 385,025 495,897 492,235 (1) 28
M&M 150,991 223,978 202,223 (10) 34
- Auto 91,701 122,277 108,329 (11) 18
- Tractors 59,290 101,701 93,894 (8) 58
Tata Motors* 94,256 150,958 182,824 21 94
- PV 32,000 68,803 83,857 22 162
- CV 62,256 82,155 98,967 20 59
TVS 632,920 989,517 927,579 (6) 47
- 2W 590,318 951,879 886,614 (7) 50
- 3W 42,602 37,638 40,965 9 (4)
CONCOR (in TEUs) 941,270 966,015 1,058,931 10 13
Source: SIAM, Company, HSIE Research; *only domestic sales

Page | 7
Autos & Logistics: 4QFY21E Results Preview
Monthly volumes (in units)
Ashok Leyland: Demand is supported by recovery in
MHCV volumes
Bajaj Auto: Volume momentum sustaining due to
demand from the exports markets (54% of vols in 4Q)
Source: SIAM, Company, HSIE Research Source: SIAM, Company, HSIE Research
Royal Enfield: Volumes sustaining at 66k+ levels per
month
Hero: Volume growth has moderated over the past few
months
Source: SIAM, Company, HSIE Research Source: SIAM, Company, HSIE Research
Escorts: Tractor sales continue to witness healthy
momentum
Maruti Suzuki: Company is expanding capacity
Source: SIAM, Company, HSIE Research Source: SIAM, Company, HSIE Research
-
3,000
6,000
9,000
12,000
15,000
18,000
Jan
-20
Feb
-20
Mar
-20
Ap
r-20
May
-20
Jun
-20
Jul-
20
Au
g-2
0
Sep
-20
Oct
-20
No
v-2
0
Dec
-20
Jan
-21
Feb
-21
Mar
-21
-
50,000
100,000
150,000
200,000
250,000
300,000
Jan
-20
Feb
-20
Mar
-20
Ap
r-20
May
-20
Jun
-20
Jul-
20
Au
g-2
0
Sep
-20
Oct
-20
No
v-2
0
Dec
-20
Jan
-21
Feb
-21
Mar
-21
-
20,000
40,000
60,000
80,000
Jan
-20
Feb
-20
Mar
-20
Ap
r-20
May
-20
Jun
-20
Jul-
20
Au
g-2
0
Sep
-20
Oct
-20
No
v-2
0
Dec
-20
Jan
-21
Feb
-21
Mar
-21
-
150,000
300,000
450,000
600,000
750,000
900,000
Jan
-20
Feb
-20
Mar
-20
Ap
r-20
May
-20
Jun
-20
Jul-
20
Au
g-2
0
Sep
-20
Oct
-20
No
v-2
0
Dec
-20
Jan
-21
Feb
-21
Mar
-21
-
3,000
6,000
9,000
12,000
15,000
Jan
-20
Feb
-20
Mar
-20
Ap
r-20
May
-20
Jun
-20
Jul-
20
Au
g-2
0
Sep
-20
Oct
-20
No
v-2
0
Dec
-20
Jan
-21
Feb
-21
Mar
-21
-
50,000
100,000
150,000
200,000
Jan
-20
Feb
-20
Mar
-20
Ap
r-20
May
-20
Jun
-20
Jul-
20
Au
g-2
0
Sep
-20
Oct
-20
No
v-2
0
Dec
-20
Jan
-21
Feb
-21
Mar
-21

Page | 8
Autos & Logistics: 4QFY21E Results Preview
Commodity prices forming up
Brent crude Lead
Source: Bloomberg, HSIE Research Source: Bloomberg, HSIE Research
Copper Aluminium
Source: Bloomberg, HSIE Research Source: Bloomberg, HSIE Research
Steel prices
Source: Steelmint, HSIE Research
10
30
50
70
90
Mar
-16
Mar
-17
Mar
-18
Mar
-19
Mar
-20
Mar
-21
Brent price ($/bbl)
1,600
1,800
2,000
2,200
2,400
2,600
Mar
-16
Mar
-17
Mar
-18
Mar
-19
Mar
-20
Mar
-21
Lead Price ($)
4,000
6,000
8,000
10,000
Mar
-16
Mar
-17
Mar
-18
Mar
-19
Mar
-20
Mar
-21
Copper Price ($)
1,200
1,600
2,000
2,400M
ar-1
6
Mar
-17
Mar
-18
Mar
-19
Mar
-20
Mar
-21
Aluminium Price ($)

Page | 9
Autos & Logistics: 4QFY21E Results Preview
Index and stock price performance
Index/Stock Market price as of
31st Mar-21
% return
3M 6M 1Y
NIFTY 14,691 5% 31% 71%
NIFTY Auto 9,862 7% 25% 108%
Ashok Leyland 114 19% 53% 164%
Bajaj Auto 3,671 7% 27% 82%
Eicher 2,604 3% 18% 99%
Escorts 1,288 2% -2% 94%
Hero Motocorp 2,914 -6% -7% 83%
Mahindra 795 10% 31% 179%
Maruti Suzuki 6,859 -10% 2% 60%
Tata Motors 302 64% 126% 325%
Source: Bloomberg, HSIE Research
Ashok Leyland 1-yr forward
EV/EBITDA
Bajaj Auto 1-yr forward P/E band Eicher Motors 1-yr forward P/E
band
Source: Bloomberg, Company, HSIE Research
Escorts 1-yr forward P/E band Hero Motocorp 1-yr forward P/E
band
M&M 1-yr forward P/E band
Source: Bloomberg, Company, HSIE Research
0
5
10
15
20
25
30
35
Ma
r-1
4
Ma
r-1
5
Ma
r-1
6
Ma
r-1
7
Ma
r-1
8
Ma
r-1
9
Ma
r-2
0
Ma
r-2
1
EV/EBITDA Mean
8
12
16
20
24
Ma
r-1
0
Ma
r-1
1
Ma
r-1
2
Ma
r-1
3
Ma
r-1
4
Ma
r-1
5
Ma
r-1
6
Ma
r-1
7
Ma
r-1
8
Ma
r-1
9
Ma
r-2
0
Ma
r-2
1
PE Mean
+1 SD -1 SD
20
25
30
35
40
Ma
r-1
5
Sep
-15
Ma
r-1
6
Sep
-16
Ma
r-1
7
Sep
-17
Ma
r-1
8
Sep
-18
Ma
r-1
9
Sep
-19
Ma
r-2
0
Sep
-20
Ma
r-2
1
P/E Mean
+1 SD -1 SD
5
10
15
20
Ma
r-1
6
Sep
-16
Ma
r-1
7
Sep
-17
Ma
r-1
8
Sep
-18
Ma
r-1
9
Sep
-19
Ma
r-2
0
Sep
-20
Ma
r-2
1
P/E Mean
+1 SD -1 SD
6
12
18
24
Ma
r-0
7M
ar-
08
Ma
r-0
9M
ar-
10
Ma
r-1
1M
ar-
12
Ma
r-1
3M
ar-
14
Ma
r-1
5M
ar-
16
Ma
r-1
7M
ar-
18
Ma
r-1
9M
ar-
20
Ma
r-2
1
PE Mean
+1 SD -1 SD
0
5
10
15
20
25
30
Ma
r-0
7M
ar-
08
Ma
r-0
9M
ar-
10
Ma
r-1
1M
ar-
12
Ma
r-1
3M
ar-
14
Ma
r-1
5M
ar-
16
Ma
r-1
7M
ar-
18
Ma
r-1
9M
ar-
20
Ma
r-2
1P/E Mean
+1 SD -1 SD

Page | 10
Autos & Logistics: 4QFY21E Results Preview
Maruti Suzuki 1-yr forward P/E
band
Amara Raja 1-yr forward P/E band Bharat Forge 1-yr forward P/E band
Source: Bloomberg, Company, HSIE Research
Endurance 1-yr forward P/E band Gulf Oil 1-yr forward P/E band Subros 1-yr forward P/E band
Source: Bloomberg, Company, HSIE Research
Sundram Fasteners 1-yr forward P/E
band
CONCOR 1-yr forward P/E band
Source: Bloomberg, Company, HSIE Research
5
15
25
35
45
Ma
r-0
7M
ar-
08
Ma
r-0
9M
ar-
10
Ma
r-1
1M
ar-
12
Ma
r-1
3M
ar-
14
Ma
r-1
5M
ar-
16
Ma
r-1
7M
ar-
18
Ma
r-1
9M
ar-
20
Ma
r-2
1
P/E Mean+1 SD -1 SD
0
10
20
30
40
Ma
r-0
9
Ma
r-1
0
Ma
r-1
1
Ma
r-1
2
Ma
r-1
3
Ma
r-1
4
Ma
r-1
5
Ma
r-1
6
Ma
r-1
7
Ma
r-1
8
Ma
r-1
9
Ma
r-2
0
Ma
r-2
1
P/E Mean+1 SD -1 SD
0
20
40
60
80
Ma
r-1
1
Ma
r-1
2
Ma
r-1
3
Ma
r-1
4
Ma
r-1
5
Ma
r-1
6
Ma
r-1
7
Ma
r-1
8
Ma
r-1
9
Ma
r-2
0
Ma
r-2
1
P/E Mean+1 SD -1 SD
15
20
25
30
35
40
Ma
r-1
7
Sep
-17
Ma
r-1
8
Sep
-18
Ma
r-1
9
Sep
-19
Ma
r-2
0
Sep
-20
Ma
r-2
1
P/E Mean
+1 SD -1 SD
10
15
20
25
30
Ma
r-1
5
Sep
-15
Ma
r-1
6
Sep
-16
Ma
r-1
7
Sep
-17
Ma
r-1
8
Sep
-18
Ma
r-1
9
Sep
-19
Ma
r-2
0
Sep
-20
Ma
r-2
1
PE Mean
+1 SD -1 SD
5
15
25
35
Ma
r-1
3
Ma
r-1
4
Ma
r-1
5
Ma
r-1
6
Ma
r-1
7
Ma
r-1
8
Ma
r-1
9
Ma
r-2
0
Ma
r-2
1
P/E Mean
+1 SD -1 SD
0
10
20
30
40
50
Ma
r-1
5
Ma
r-1
6
Ma
r-1
7
Ma
r-1
8
Ma
r-1
9
Ma
r-2
0
Ma
r-2
1
P/E Mean
+1 SD -1 SD
10
20
30
40
50
Mar-
12
Mar-
13
Mar-
14
Mar-
15
Mar-
16
Mar-
17
Mar-
18
Mar-
19
Mar-
20
Mar-
21
P/E Mean
+1 SD -1 SD

Page | 11
Autos & Logistics: 4QFY21E Results Preview
HDFC securities
Institutional Equities
Unit No. 1602, 16th Floor, Tower A, Peninsula Business Park,
Senapati Bapat Marg, Lower Parel, Mumbai - 400 013
Board: +91-22-6171-7330 www.hdfcsec.com
Disclosure:
We, Aditya Makharia, CA & Mansi Lall, MBA, authors and the names subscribed to this report, hereby certify that all of the views expressed in this research report
accurately reflect our views about the subject issuer(s) or securities. HSL has no material adverse disciplinary history as on the date of publication of this report. We also
certify that no part of our compensation was, is, or will be directly or indirectly related to the specific recommendation(s) or view(s) in this report.
Research Analyst or his/her relative or HDFC Securities Ltd. does not have any financial interest in the subject company. Also Research Analyst or his relative or HDFC
Securities Ltd. or its Associate may have beneficial ownership of 1% or more in the subject company at the end of the month immediately preceding the date of publication
of the Research Report. Further Research Analyst or his relative or HDFC Securities Ltd. or its associate does not have any material conflict of interest.
Any holding in stock –YES
HDFC Securities Limited (HSL) is a SEBI Registered Research Analyst having registration no. INH000002475.
Disclaimer:
This report has been prepared by HDFC Securities Ltd and is solely for information of the recipient only. The report must not be used as a singular basis of any investment
decision. The views herein are of a general nature and do not consider the risk appetite or the particular circumstances of an individual investor; readers are requested to
take professional advice before investing. Nothing in this document should be construed as investment advice. Each recipient of this document should make such
investigations as they deem necessary to arrive at an independent evaluation of an investment in securities of the companies referred to in this document (including merits
and risks) and should consult their own advisors to determine merits and risks of such investment. The information and opinions contained herein have been compiled or
arrived at, based upon information obtained in good faith from sources believed to be reliable. Such information has not been independently verified and no guaranty,
representation of warranty, express or implied, is made as to its accuracy, completeness or correctness. All such information and opinions are subject to change without
notice. Descriptions of any company or companies or their securities mentioned herein are not intended to be complete. HSL is not obliged to update this report for such
changes. HSL has the right to make changes and modifications at any time.
This report is not directed to, or intended for display, downloading, printing, reproducing or for distribution to or use by, any person or entity who is a citizen or resident
or located in any locality, state, country or other jurisdiction where such distribution, publication, reproduction, availability or use would be contrary to law or regulation
or what would subject HSL or its affiliates to any registration or licensing requirement within such jurisdiction.
If this report is inadvertently sent or has reached any person in such country, especially, United States of America, the same should be ignored and brought to the attention
of the sender. This document may not be reproduced, distributed or published in whole or in part, directly or indirectly, for any purposes or in any manner.
Foreign currencies denominated securities, wherever mentioned, are subject to exchange rate fluctuations, which could have an adverse effect on their value or price, or
the income derived from them. In addition, investors in securities such as ADRs, the values of which are influenced by foreign currencies effectively assume currency risk.
It should not be considered to be taken as an offer to sell or a solicitation to buy any security.
This document is not, and should not, be construed as an offer or solicitation of an offer, to buy or sell any securities or other financial instruments. This report should not
be construed as an invitation or solicitation to do business with HSL. HSL may from time to time solicit from, or perform broking, or other services for, any company
mentioned in this mail and/or its attachments.
HSL and its affiliated company(ies), their directors and employees may; (a) from time to time, have a long or short position in, and buy or sell the securities of the
company(ies) mentioned herein or (b) be engaged in any other transaction involving such securities and earn brokerage or other compensation or act as a market maker in
the financial instruments of the company(ies) discussed herein or act as an advisor or lender/borrower to such company(ies) or may have any other potential conflict of
interests with respect to any recommendation and other related information and opinions.
HSL, its directors, analysts or employees do not take any responsibility, financial or otherwise, of the losses or the damages sustained due to the investments made or any
action taken on basis of this report, including but not restricted to, fluctuation in the prices of shares and bonds, changes in the currency rates , diminution in the NAVs,
reduction in the dividend or income, etc.
HSL and other group companies, its directors, associates, employees may have various positions in any of the stocks, securities and financial instruments dealt in the
report, or may make sell or purchase or other deals in these securities from time to time or may deal in other securities of the companies / organizations described in this
report.
HSL or its associates might have managed or co-managed public offering of securities for the subject company or might have been mandated by the subject company for
any other assignment in the past twelve months.
HSL or its associates might have received any compensation from the companies mentioned in the report during the period preceding twelve months from t date of this
report for services in respect of managing or co-managing public offerings, corporate finance, investment banking or merchant banking, brokerage services or other
advisory service in a merger or specific transaction in the normal course of business.
HSL or its analysts did not receive any compensation or other benefits from the companies mentioned in the report or third party in connection with preparation of the
research report. Accordingly, neither HSL nor Research Analysts have any material conflict of interest at the time of publication of this report. Compensation of our
Research Analysts is not based on any specific merchant banking, investment banking or brokerage service transactions. HSL may have issued other reports that are
inconsistent with and reach different conclusion from the information presented in this report.
Research entity has not been engaged in market making activity for the subject company. Research analyst has not served as an officer, director or employee of the subject
company. We have not received any compensation/benefits from the subject company or third party in connection with the Research Report.
HDFC securities Limited, I Think Techno Campus, Building - B, "Alpha", Office Floor 8, Near Kanjurmarg Station, Opp. Crompton Greaves, Kanjurmarg (East),
Mumbai 400 042 Phone: (022) 3075 3400 Fax: (022) 2496 5066 Compliance Officer: Binkle R. Oza Email: [email protected] Phone: (022) 3045 3600 HDFC
Securities Limited, SEBI Reg. No.: NSE, BSE, MSEI, MCX: INZ000186937; AMFI Reg. No. ARN: 13549; PFRDA Reg. No. POP: 11092018; IRDA Corporate Agent
License No.: CA0062; SEBI Research Analyst Reg. No.: INH000002475; SEBI Investment Adviser Reg. No.: INA000011538; CIN - U67120MH2000PLC152193
Rating Criteria
BUY: >+15% return potential
ADD: +5% to +15% return potential
REDUCE: -10% to +5% return potential
SELL: > 10% Downside return potential