16 - Pneusnews.it · 16 N. 8 . The ETRMA Statistics Report ETRMA. 2014/2015 Key Figures . VEHICLE...
52
16 N. 8
Transcript of 16 - Pneusnews.it · 16 N. 8 . The ETRMA Statistics Report ETRMA. 2014/2015 Key Figures . VEHICLE...

16
N. 8

The ETRMA Statistics Report
ETRMA
2014/2015 Key Figures
VEHICLE DATA from 2008 to 2015 and beyond
GENERAL RUBBER GOODS Production and Trade
TYRES: Production, New and Retread Sales, Trade and End of Life
RUBBER
Appendix: Export and Import Tariffs
What is this report: part of the work of ETRMA is that of collecting information and data with regard to the tyre and general rubber goods industry. This report should give you a clear picture of the size of the European Industry and its relations with the rest of the world.
How to use this report: as you can see on the right each section of the report is marked by a colour. These colours will guide you through the report and will help you skipping to the section you want to review.
Our sources: ETRMA used for this report a variety of sources. These include its own members, Eurostat, LMC, ACEA and the International Rubber Study Group.

FOREWORD ETRMA is the leading voice of tyre and rubber goods producers. Since 1959, the Association is devoted to advocating the interests of the tyre and rubber manufacturing industries with the European Union institutions and other international organizations.
ETRMA contributes to ensuring the development, competitiveness and growth of the tyre and rubber industry in contributing to all the initiatives in favour of health, safety & environment protection, transport and road safety and access to third markets in coordination with the European public authorities.
Statistical data are an important element of the knowledge about our sector consisting of a wide range of products, many of which are traded internationally. The product range of our Members is extensive from tyres, construction and automotive rubber goods to pharmaceutical, baby care, etc.
Trade has become a more important and sensitive issue than in the past with emerging countries catching up and rapidly increasing their market share in the EU.
For this reason it is essential to have a complete picture of the tyre and general rubber goods sector through accurate statistics.
For all other information, we invite you to visit our website www.etrma.org or contact the ETRMA secretariat.
3

The European Tyre and Rubber Industry
ETRMA This section will run you through the following points:
•Who are the Members of ETRMA;
•Where are their Brussels Offices;
•Where are their European plants;
•ETRMA’s Secretariat.
2014/2015 Key Figures
VEHICLE DATA from 2008 to 2015 and beyond
GENERAL RUBBER GOODS Production and Trade
TYRES: Production, New and Retread Sales, Trade and End of Life
RUBBER
Appendix: Export and Import Tariffs

ETRMA’s Members
5
www.pzpo.org.pl
www.apollovredestein.com www.bridgestone.eu
www.conti-online.com www.coopertire.co.uk
www.goodyear.eu www.hankooktire.com
www.michelin.com www.nokiantyres.com
www.pirelli.com www.trelleborg.com
*
* Mitas was bought by Trelleborg in 2016

ETRMA’s Secretariat
The Secretary General, Fazilet Cinaralp
Mirella Larsen, Office Manager
Jean Pierre Taverne, ELT EU Coordinator & Circular Economy
Marta Conti, Manager, Trade, Communication and Parliamentary Affairs
Heinz-Jürgen Schmidt, Director, Europool
6
Cornelia Tietz, Director, EHS and Climate Action
TO BE ANNOUNCED, Coordinator Chemicals and H&S

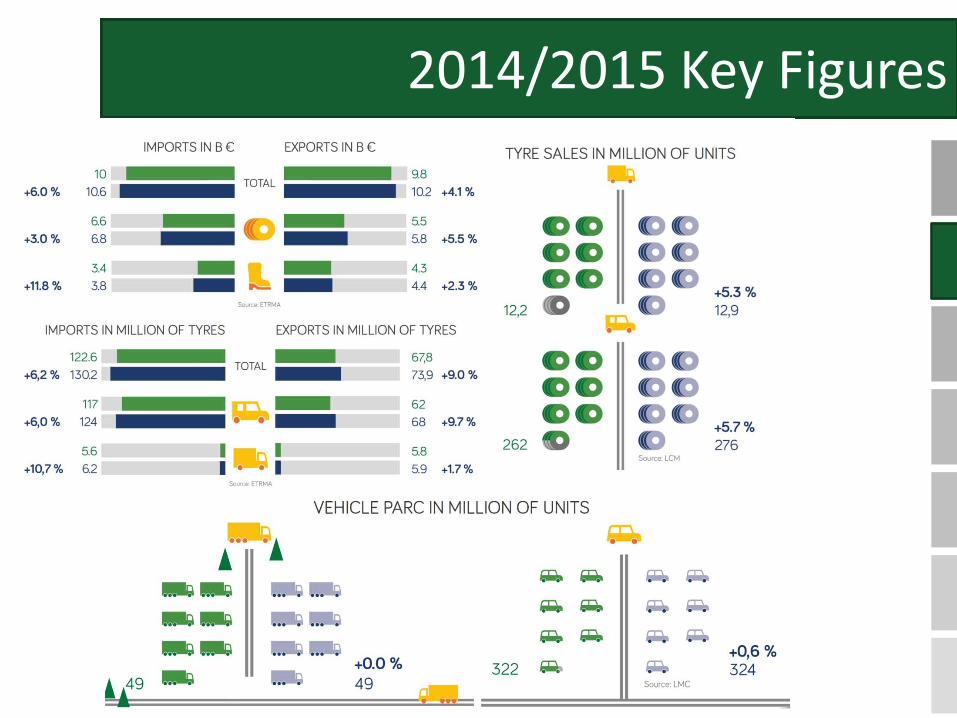
2014/2015 Key Figures
ETRMA
2014/2015 Key Figures
VEHICLE DATA from 2008 to 2015 and beyond
GENERAL RUBBER GOODS Production and Trade
TYRES: Production , Sales and Trade
RUBBER
Appendix: Export and Import Tariffs

2014/2015 Key Figures
31 32
40 41
71 73
2014/2015 Key Figures

Vehicle Data
ETRMA
2014/2015 Key Figures
VEHICLE DATA from 2008 to 2015 and beyond
GENERAL RUBBER GOODS Production and Trade
TYRES: Production, New and Retread Sales, Trade and End of Life
RUBBER
Appendix: Export and Import Tariffs

0
50
100
150
200
250
300
350
400
2009 2010 2011 2012 2013 2014 2015 2018 2021 2024 Europe* China NAFTA India Rest of the world
2009 2010 2011 2012 2013 2014 2015 2018 2021 2024 Africa 12 12 13 14 14 15 16 18 20 23 ASEAN 22 24 25 27 29 31 33 38 43 48 East Asia 77 78 79 80 81 83 84 86 87 87 Middle East 32 37 40 42 44 46 47 53 59 66 Oceania 15 15 16 16 16 17 17 18 19 20 South America 44 47 50 53 56 58 59 63 68 74 Europe* 301 305 311 315 319 323 326 334 342 349 China 39 50 61 74 90 107 125 184 246 305 India 18 20 22 25 27 29 31 38 47 58 NAFTA 233 230 234 234 237 241 245 256 265 274
Evolution of car parc on world major markets
India: in 2015, LMC removed the double counting of some buses. Furthermore, CV imports have also been reduced to bring them in line with official trade data.
NAFTA: double counting of buses was also removed from NAFTA. Furthermore, pick-up trucks were removed from LCV segment and placed in the PC one, correcting also historical data.
Rest
of t
he w
orld
*Europe includes all of Eastern, Central and Western Europe
Source: LMC/in 000.000 passenger cars
11

2009 2010 2011 2012 2013 2014 2015 2018 2021 2024 Africa 6 6 6 7 7 8 8 9 10 10 ASEAN 15 15 16 17 18 18 19 21 24 26 East Asia 22 22 22 22 22 21 21 21 20 20 Middle East 11 12 12 13 14 14 15 17 19 21 Oceania 4 4 4 4 4 4 5 5 5 6 South America 14 15 16 17 18 19 20 21 23 26 Europe* 48 48 48 48 49 49 49 51 53 56 China 35 40 44 48 52 56 58 66 76 84 India 11 12 13 14 14 15 16 19 23 26 NAFTA 56 56 57 57 58 59 61 65 67 70
Evolution of Commercial Vehicle parc on world major markets
Rest
of t
he w
orld
*Europe includes all of Eastern, Central and Western Europe
Source: LMC**/in 000.000 units
12
0
20
40
60
80
100
2009 2010 2011 2012 2013 2014 2015 2018 2021 2024 Rest of the World India Europe* China NAFTA
**LMC data were modified as explained in page 12.
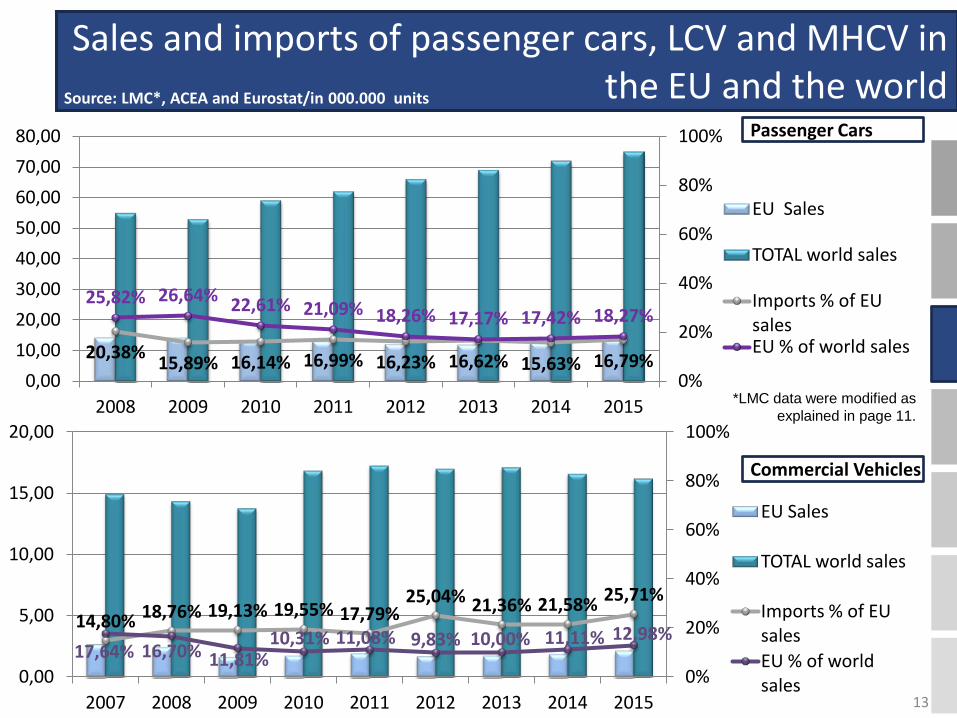
14,80% 18,76% 19,13% 19,55% 17,79% 25,04% 21,36% 21,58% 25,71%
17,64% 16,70% 11,81% 10,31% 11,08% 9,83% 10,00% 11,11% 12,98%
0%
20%
40%
60%
80%
100%
0,00
5,00
10,00
15,00
20,00
2007 2008 2009 2010 2011 2012 2013 2014 2015
EU Sales
TOTAL world sales
Imports % of EU sales EU % of world sales
20,38% 15,89% 16,14% 16,99% 16,23% 16,62% 15,63% 16,79%
25,82% 26,64% 22,61% 21,09% 18,26% 17,17% 17,42% 18,27%
0%
20%
40%
60%
80%
100%
0,00 10,00 20,00 30,00 40,00 50,00 60,00 70,00 80,00
2008 2009 2010 2011 2012 2013 2014 2015
EU Sales
TOTAL world sales
Imports % of EU sales EU % of world sales
Sales and imports of passenger cars, LCV and MHCV in the EU and the world
Passenger Cars
Commercial Vehicles
*LMC data were modified as explained in page 11.
Source: LMC*, ACEA and Eurostat/in 000.000 units
13

2,11 1,41
1,92 2,26 2,56 2,72 2,97 3,28 3,69
5,40
6,89 6,16
5,62 5,69 5,11
4,51
2,73
1,35 1,89 2,23 2,11 2,10 2,12 2,28
0,68 0,67 1,03 1,24 1,11 0,89 0,87 0,96
4,85
3,60
4,71 4,60 5,00 5,10 4,76 4,65
0
1
2
3
4
5
6
7
8
2008 2009 2010 2011 2012 2013 2014 2015
10,86
7,34
10,20 11,27 13,31 13,88
14,52 14,81
5,66 8,39
11,35 12,24 13,68
16,44
18,66 20,08
17,91
14,78 16,73 17,75 16,85 16,95 17,39 17,87
1,83 2,11 2,76 2,99 3,28 3,07 3,14 3,35
20,66
16,95
20,37 20,05 21,69 21,50
21,13 19,94
0,00
5,00
10,00
15,00
20,00
25,00
2008 2009 2010 2011 2012 2013 2014 2015 NAFTA China Europe India Rest of the world
Production of passenger cars, LCV and MHCV - major markets
Passenger Cars
Commercial Vehicles
Source: LMC */in 000.000 units *LMC data were modified as explained in page 11.
GENERAL RUBBER GOODS
ETRMA
2014/2015 Key Figures
VEHICLE DATA from 2008 to 2015 and beyond
GENERAL RUBBER GOODS Production and Trade
TYRES: Production, New and Retread Sales, Trade and End of Life
RUBBER
Appendix: Export and Import Tariffs

2000 2003 2007 2008 2009 2010 2011 2012 2013 2014 2015
France 444 453 398 330 280 375 390 340 330 340 344
Germany 582 667 793 770 610 770 830 800 785 800 785
Italy 426 391 392 354 264 290 259 223 223 225 229
Spain 253 237 232 216 161 178 183 168 172 180 193
Evolution of GRG production*
*Custom Code: 4005, 4006, 4007, 4008, 4009, 4010, 4014, 4015, 4016, and 4017
Source: ETRMA/in 000 tonnes
16
0
100
200
300
400
500
600
700
800
900
2000 2003 2007 2008 2009 2010 2011 2012 2013 2014 2015
France Germany Italy Spain
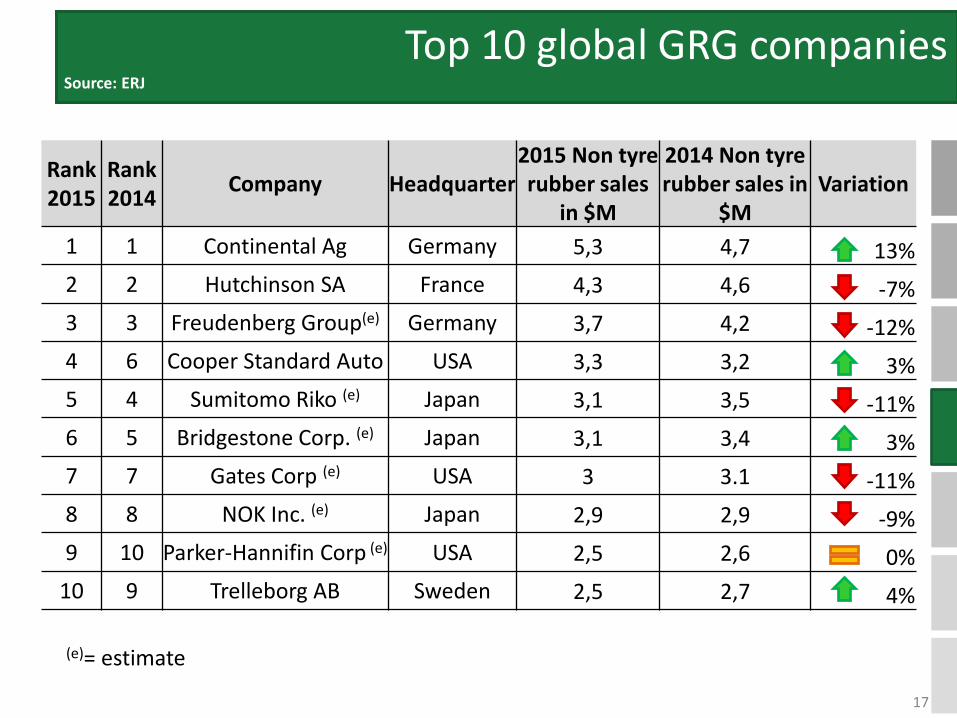
Rank 2015
Rank 2014 Company Headquarter
2015 Non tyre rubber sales
in $M
2014 Non tyre rubber sales in
$M Variation
1 1 Continental Ag Germany 5,3 4,7 13% 2 2 Hutchinson SA France 4,3 4,6 -7% 3 3 Freudenberg Group(e) Germany 3,7 4,2 -12% 4 6 Cooper Standard Auto USA 3,3 3,2 3% 5 4 Sumitomo Riko (e) Japan 3,1 3,5 -11% 6 5 Bridgestone Corp. (e) Japan 3,1 3,4 3% 7 7 Gates Corp (e) USA 3 3.1 -11% 8 8 NOK Inc. (e) Japan 2,9 2,9 -9% 9 10 Parker-Hannifin Corp (e) USA 2,5 2,6 0%
10 9 Trelleborg AB Sweden 2,5 2,7 4%
Top 10 global GRG companies Source: ERJ
17
(e)= estimate

GRG°Import/Export Source: Eurostat
Import and exports in M€
18
°HS Codes: 4007, 4008, 4009, 4010, 4014,
4015, 4016.9100, 4016.9200, 4016.9300
Import and exports in 000 tonnes
EU exports
EU imports

TYRES
ETRMA
2014/2015 Key Figures
VEHICLE DATA from 2008 to 2015 and beyond
GENERAL RUBBER GOODS Production and Trade
TYRES: Production, New and Retread Sales, Trade and End of Life
RUBBER
Appendix: Export and Import Tariffs

ETRMA’s tyre companies plants
20
ETRMA members account for •86 tyre plants •16 R&D centres •11 HQs
Situation at Jan. 2017
4900 5100 4740
3568
4500 4800 4580 4670 4800 4900
0 1000 2000 3000 4000 5000 6000
2006 2007 2008 2009 2010 2011 2012 2013 2014 2015
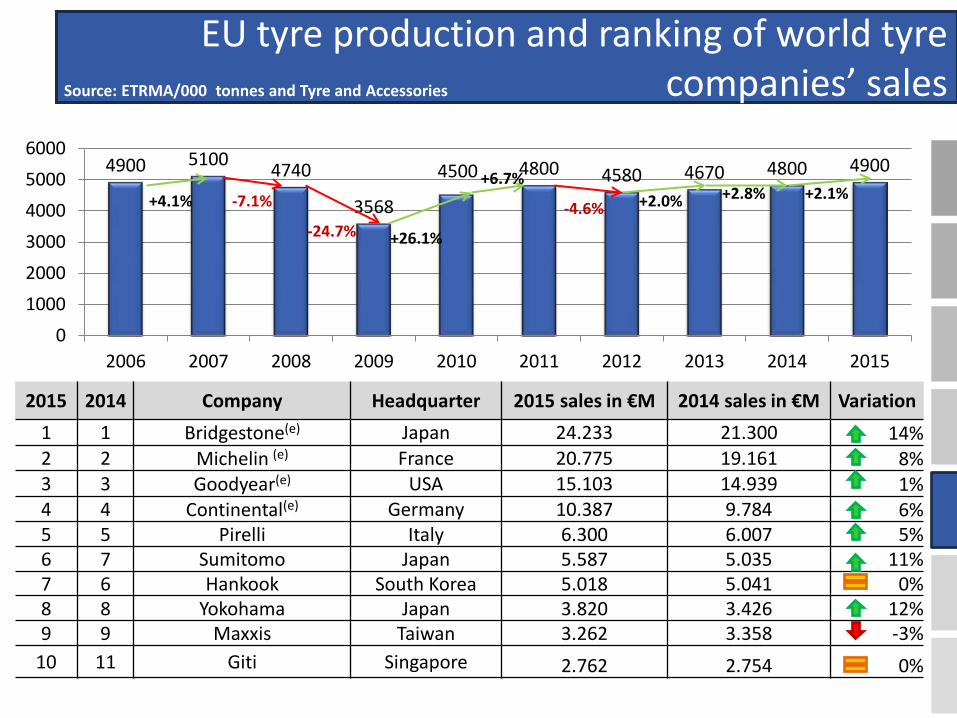
EU tyre production and ranking of world tyre companies’ sales
2015 2014 Company Headquarter 2015 sales in €M 2014 sales in €M Variation 1 1 Bridgestone(e) Japan 24.233 21.300 14% 2 2 Michelin (e) France 20.775 19.161 8% 3 3 Goodyear(e) USA 15.103 14.939 1% 4 4 Continental(e) Germany 10.387 9.784 6% 5 5 Pirelli Italy 6.300 6.007 5% 6 7 Sumitomo Japan 5.587 5.035 11% 7 6 Hankook South Korea 5.018 5.041 0% 8 8 Yokohama Japan 3.820 3.426 12% 9 9 Maxxis Taiwan 3.262 3.358 -3%
10 11 Giti Singapore 2.762 2.754 0%
Source: ETRMA/000 tonnes and Tyre and Accessories
+4.1% -7.1%
-24.7%
+6.7%
-4.6% +2.0% +2.8% +2.1%
+26.1%
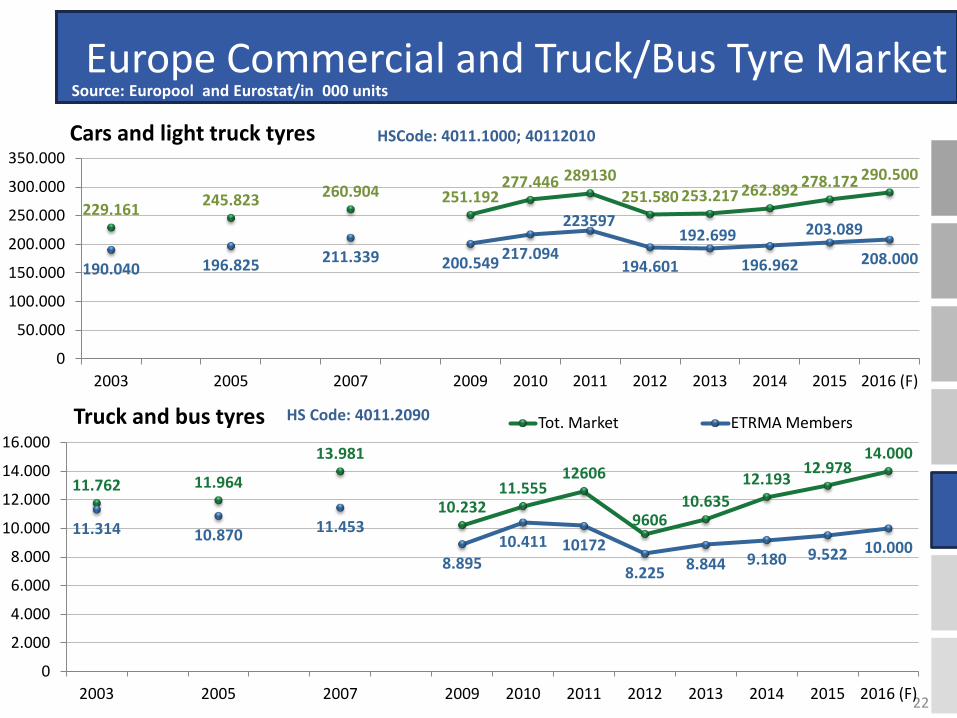
229.161 245.823 260.904 251.192 277.446 289130
251.580 253.217 262.892 278.172 290.500
190.040 196.825 211.339 200.549 217.094
223597
194.601
192.699
196.962
203.089
208.000
0
50.000
100.000
150.000
200.000
250.000
300.000
350.000
2003 2005 2007 2009 2010 2011 2012 2013 2014 2015 2016 (F)
Tot. Market ETRMA Members
Europe Commercial and Truck/Bus Tyre Market Cars and light truck tyres
Source: Europool and Eurostat/in 000 units
Truck and bus tyres HS Code: 4011.2090
HSCode: 4011.1000; 40112010
22
11.762 11.964
13.981
10.232 11.555
12606
9606 10.635
12.193 12.978
14.000
11.314 10.870 11.453
8.895 10.411 10172
8.225 8.844 9.180 9.522 10.000
0
2.000
4.000
6.000
8.000
10.000
12.000
14.000
16.000
2003 2005 2007 2009 2010 2011 2012 2013 2014 2015 2016 (F)

16.266 16.774 17.094 14.987 15.176
17.846 17.976
7744 7934 8240 7341 7485 8390 8591
0 2.000 4.000 6.000 8.000
10.000 12.000 14.000 16.000 18.000 20.000
2009 2010 2011 2012 2013 2014 2015
TOTAL EU Market ETRMA Members
Motorcycle and scooter tyres sales in the EU
Agricultural tyres sales in the EU
Europe Moto/Scooter and Agri Tyre Market Source: Europool and Eurostat/ ‘000 units
23
7.170 6.770 7.317 7.057 6.989
7.934
6.619
1701 1733 1690 1472 1517 1641 1501 0
1.000 2.000 3.000 4.000 5.000 6.000 7.000 8.000 9.000
2009 2010 2011 2012 2013 2014 2015
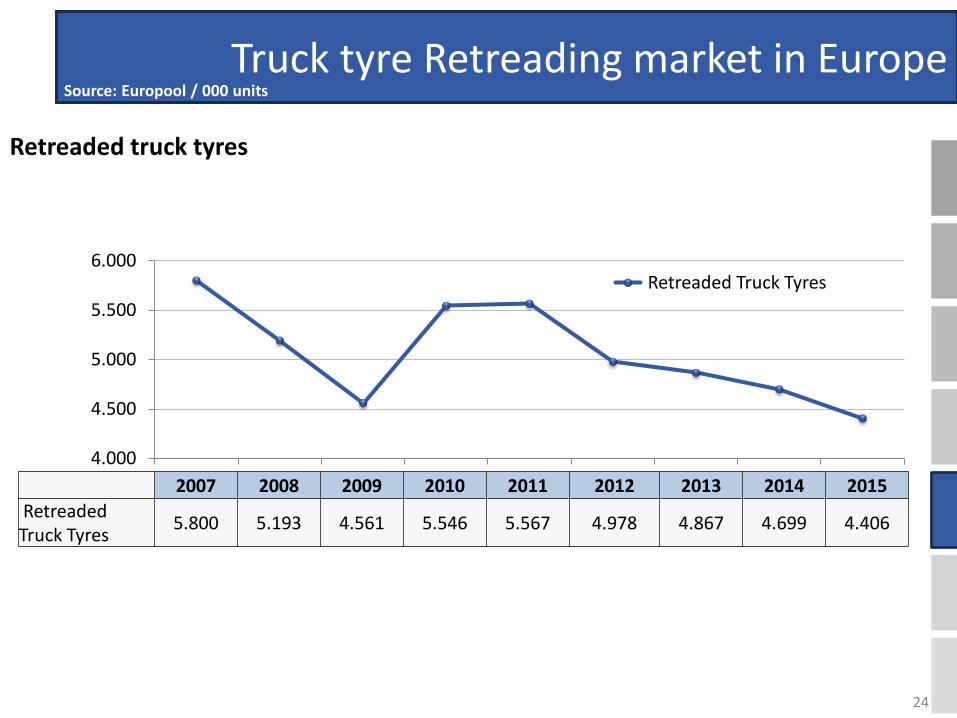
Retreaded truck tyres
Truck tyre Retreading market in Europe Source: Europool / 000 units
24
4.000
4.500
5.000
5.500
6.000
2007 2008 2009 2010 2011 2012 2013 2014 2015
Retreaded Truck Tyres
2007 2008 2009 2010 2011 2012 2013 2014 2015 Retreaded Truck Tyres 5.800 5.193 4.561 5.546 5.567 4.978 4.867 4.699 4.406
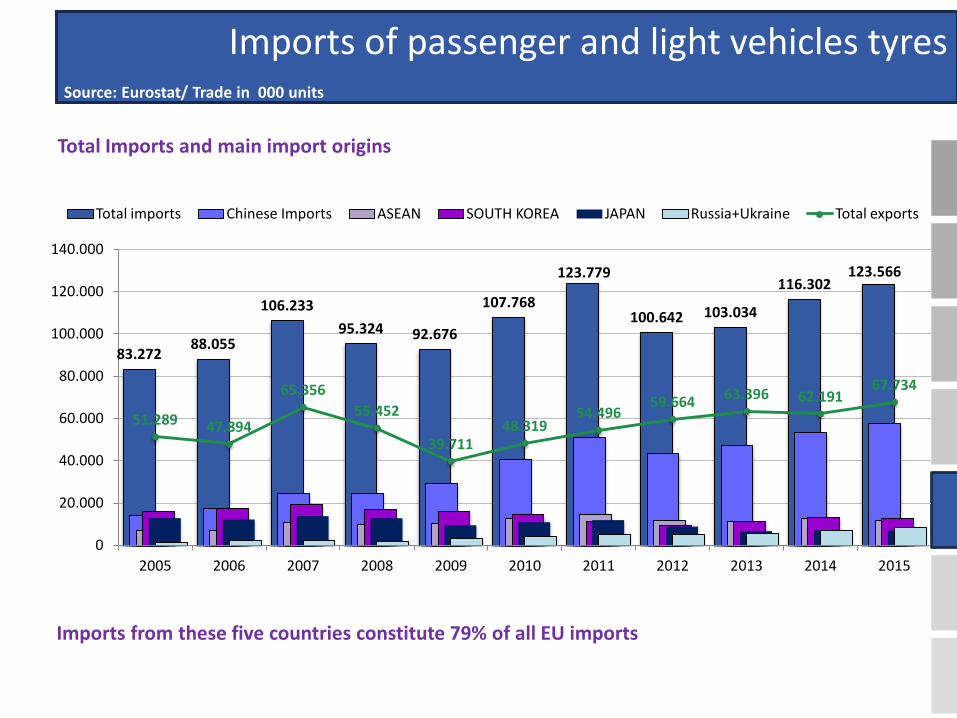
Imports of passenger and light vehicles tyres Source: Eurostat/ Trade in 000 units
Total Imports and main import origins
83.272 88.055
106.233 95.324 92.676
107.768
123.779
100.642 103.034
116.302 123.566
51.289 47.894
65.356 55.452
39.711 48.319
54.496 59.664 63.396 62.191
67.734
0
20.000
40.000
60.000
80.000
100.000
120.000
140.000
2005 2006 2007 2008 2009 2010 2011 2012 2013 2014 2015
Total imports Chinese Imports ASEAN SOUTH KOREA JAPAN Russia+Ukraine Total exports
Imports from these five countries constitute 79% of all EU imports

Exports of passenger and light vehicles tyres Source: Eurostat/ Trade in 000 units
Total Exports and main export destinations
51.289 47.894
65.356
55.452
39.711
48.319 54.496
59.664 63.396 62.191
67.734
0
10.000
20.000
30.000
40.000
50.000
60.000
70.000
80.000
2005 2006 2007 2008 2009 2010 2011 2012 2013 2014 2015
Total exports NAFTA Non-EU Europe Russia+Ukraine Africa Latin America Middle East

Imports of truck and bus tyres Source: Eurostat/ Trade in 000 units
Total Imports and main import origin
Imports from these five countries constitute 83% of all EU imports
3.358 3.714
6.132
5.340
3.374 3.817
4.610
3.602 4.033
5.651
6.213
5.566
6.303
5.048 5.110
4.269
5.887 6.350
5.875 6.004 5.883 5.804
0
1.000
2.000
3.000
4.000
5.000
6.000
7.000
2005 2006 2007 2008 2009 2010 2011 2012 2013 2014 2015
Total imports CHINA Japan SOUTH KOREA ASEAN Russia+Ukraine Total exports

Exports of truck and bus tyres Source: Eurostat/ Trade in 000 units
Total Exports and main export destinations
5.566
6.303
5.048 5.110
4.269
5.887 6.350
5.875 6.004 5.883 5.804
0
1.000
2.000
3.000
4.000
5.000
6.000
7.000
2005 2006 2007 2008 2009 2010 2011 2012 2013 2014 2015
Total exports NAFTA Russia+Ukraine Africa Non-EU Europe Latin America Middle East India
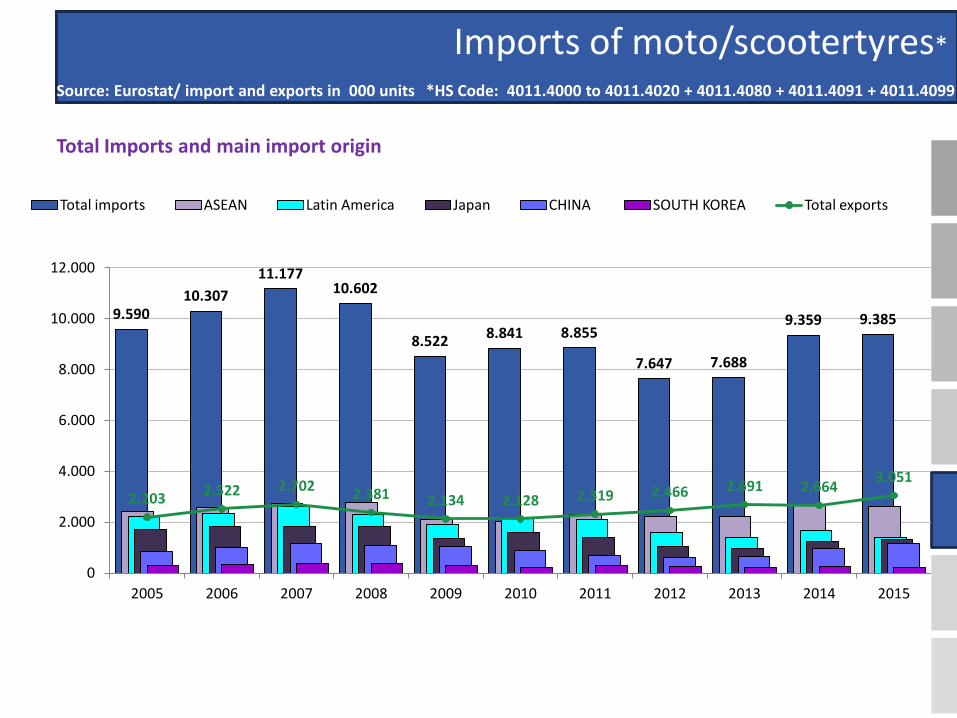
Imports of moto/scootertyres* Source: Eurostat/ import and exports in 000 units *HS Code: 4011.4000 to 4011.4020 + 4011.4080 + 4011.4091 + 4011.4099
Total Imports and main import origin
9.590 10.307
11.177 10.602
8.522 8.841 8.855
7.647 7.688
9.359 9.385
2.203 2.522 2.702 2.381 2.134 2.128 2.319 2.466 2.691 2.664 3.051
0
2.000
4.000
6.000
8.000
10.000
12.000
2005 2006 2007 2008 2009 2010 2011 2012 2013 2014 2015
Total imports ASEAN Latin America Japan CHINA SOUTH KOREA Total exports

Exports of moto/scootertyres* Source: Eurostat/ import and exports in 000 units *HS Code: 4011.4000 to 4011.4020 + 4011.4080 + 4011.4091 + 4011.4099
Total Exports and main export destination
2.203
2.522 2.702
2.381 2.134 2.128
2.319 2.466
2.691 2.664
3.052
0
500
1.000
1.500
2.000
2.500
3.000
3.500
2005 2006 2007 2008 2009 2010 2011 2012 2013 2014 2015
Total Exports NAFTA Non-EU Europe ASEAN Latin America Japan Africa

Imports of agricultural tyres* Source: Eurostat/ import and exports in 000 units *HS Code: 4011.6100 and 4011.9200
Total Imports and main import origins
4.554
7.559
5.727
8.550
5.469 5.038
5.642 5.593 5.487
6.291
5.114
544 465 482 475 394 468 549 630 641 560 499
0
1.000
2.000
3.000
4.000
5.000
6.000
7.000
8.000
9.000
2005 2006 2007 2008 2009 2010 2011 2012 2013 2014 2015
Total imports India CHINA ASEAN Non-EU Europe Total exports

Exports of agricultural tyres* Source: Eurostat/ import and exports in 000 units *HS Code: 4011.6100 and 4011.9200
Total Exports and main export destinations
544
465 482 475
394
468
549
630 641
560
499
0
100
200
300
400
500
600
700
2005 2006 2007 2008 2009 2010 2011 2012 2013 2014 2015
Total Exports Non-EU Europe NAFTA Africa Russia+Ukraine Latin America Japan

Trade Balance – all tyre types Source: Eurostat/ trade balance in EUR Million
Evolution Trade Balance /tyre type
-377 -367 -575
-437 -573
-816
-1163 -1047
-1169 -1308
-1750
-594 -342
-765
-485
301 274 204 309 312 271 9 91
213 387 459
611 440
119 8
-45 -42 -46 -97 -169 -250 -268 -187 -219 -264 -239 -245
-290 -291
-52 -55 -75 -68 -69 -75 -96 -102 -90 -95 -94 -69 -67 -109 -105
-2000
-1500
-1000
-500
0
500
1000 2001 2002 2003 2004 2005 2006 2007 2008 2009 2010 2011 2012 2013 2014 2015
Consumer Tyres Truck&Bus Tyres Agricultural Tyres Moto Tyres

Trade Balance – all tyre types Source: Eurostat/ trade balance in EUR Million
Trade Balance 2015/tyre type and commercial partner
“Rest of Europe” includes the following countries: Albania, Bosnia, Switzerland, Croatia, Iceland, Moldova, Montenegro, Norway, Kosovo, Serbia, Armenia, Azerbaijan, Belarus, Georgia, Kazakhstan, Liechtenstein.
-1386
5
-376
64
-289
444
-186
1130
-547
5
-72
49
-33
119 68 306
-34
1 -4 -21
-41 -12
4 31
-48 -261
-1
13
-9 -3
6 84
-1600 -1400 -1200 -1000
-800 -600 -400 -200
0 200 400 600 800
1000 1200 1400
China India Republic of Korea
Latin America
ASEAN Rest of Europe
Russia and Ukraine
NAFTA
Consumer tyres T&B tyres Moto tyres Agri Tyres
0
1.000
2.000
3.000
4.000
5.000
2007 2008 2009 2010 2011 2012 2013 2014 2015
Truck and bus tyres
0
10.000
20.000
30.000
40.000
50.000
60.000
70.000
2007 2008 2009 2010 2011 2012 2013 2014 2015
EU Imports EU Exports
Cars and light truck tyres
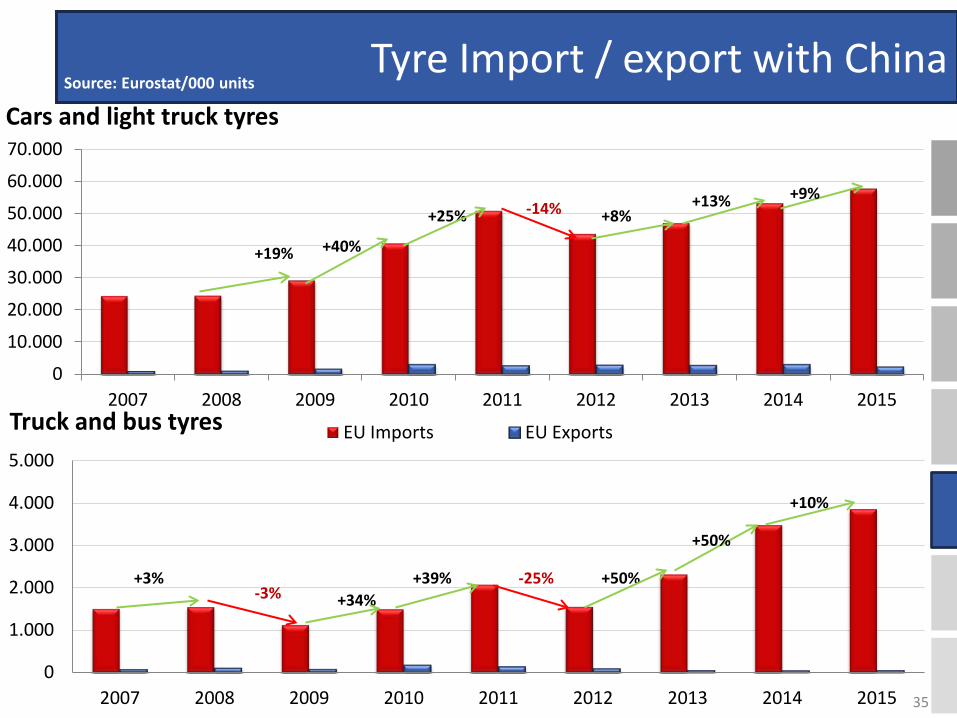
Tyre Import / export with China Source: Eurostat/000 units
+19% +40%
+25%
+3% +34%
+39%
35
-14%
-25% -3%
+8%
+50%
+13%
+50%
+9%
+10%
0 50
100 150 200 250 300 350
2007 2008 2009 2010 2011 2012 2013 2014 2015
0
200
400
600
800
1000
2007 2008 2009 2010 2011 2012 2013 2014 2015
EU Imports EU Exports
Cars and light truck tyres
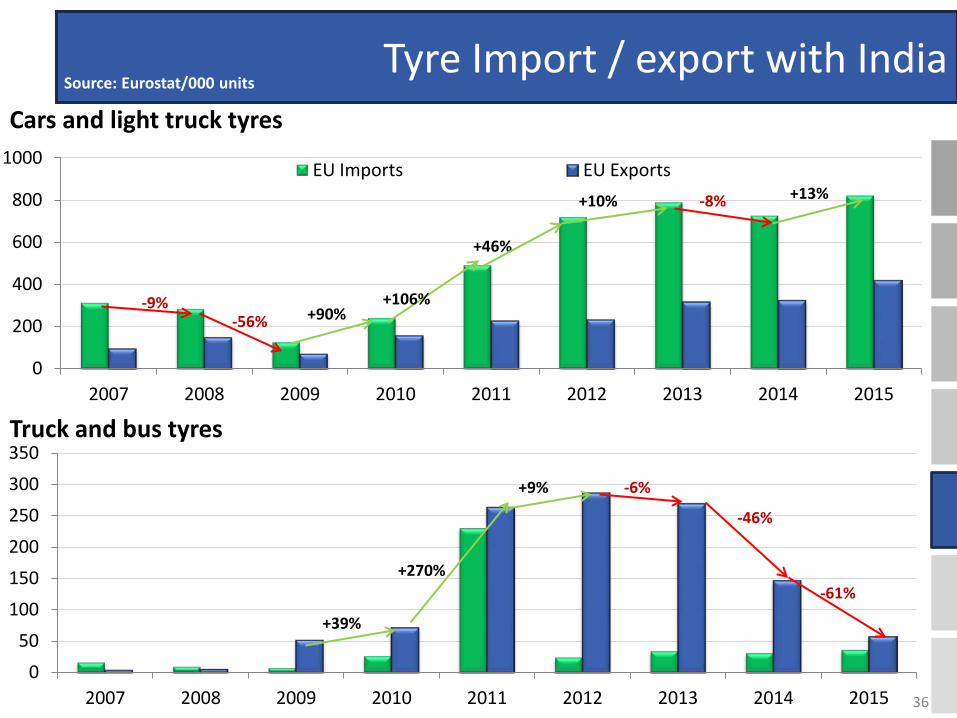
Tyre Import / export with India
Truck and bus tyres
Source: Eurostat/000 units
-6%
-56% +90%
+39%
+270%
36
+46%
+9%
+10%
-9%
-8%
-46%
+106%
+13%
-61%
0
200
400
600
800
1000
1200
1400
2007 2008 2009 2010 2011 2012 2013 2014 2015
EU Imports EU Exports
0 2000 4000 6000 8000
10000 12000 14000 16000
2007 2008 2009 2010 2011 2012 2013 2014 2015 Truck and bus tyres
Cars and light truck tyres
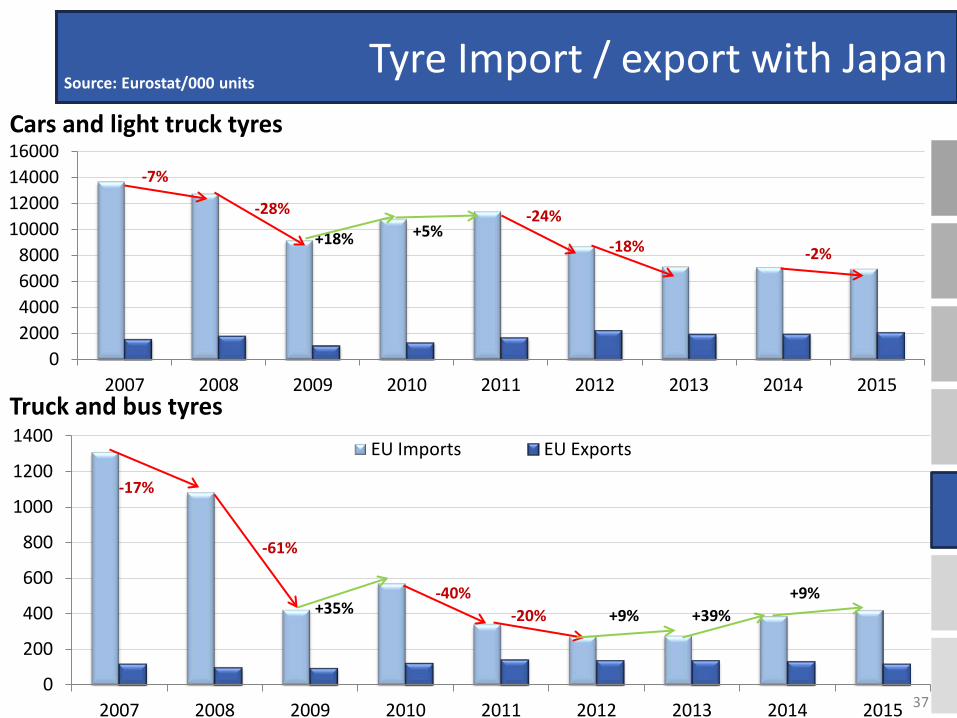
Tyre Import / export with Japan Source: Eurostat/000 units
-7%
-28%
+18% +5%
-17%
-61%
+35% -40%
37
-20%
-24%
-18%
+9% +39%
-2%
+9%
0
100
200
300
400
500
2007 2008 2009 2010 2011 2012 2013 2014 2015
0
5.000
10.000
15.000
20.000
25.000
2007 2008 2009 2010 2011 2012 2013 2014 2015
EU Imports EU Exports
Cars and light truck tyres
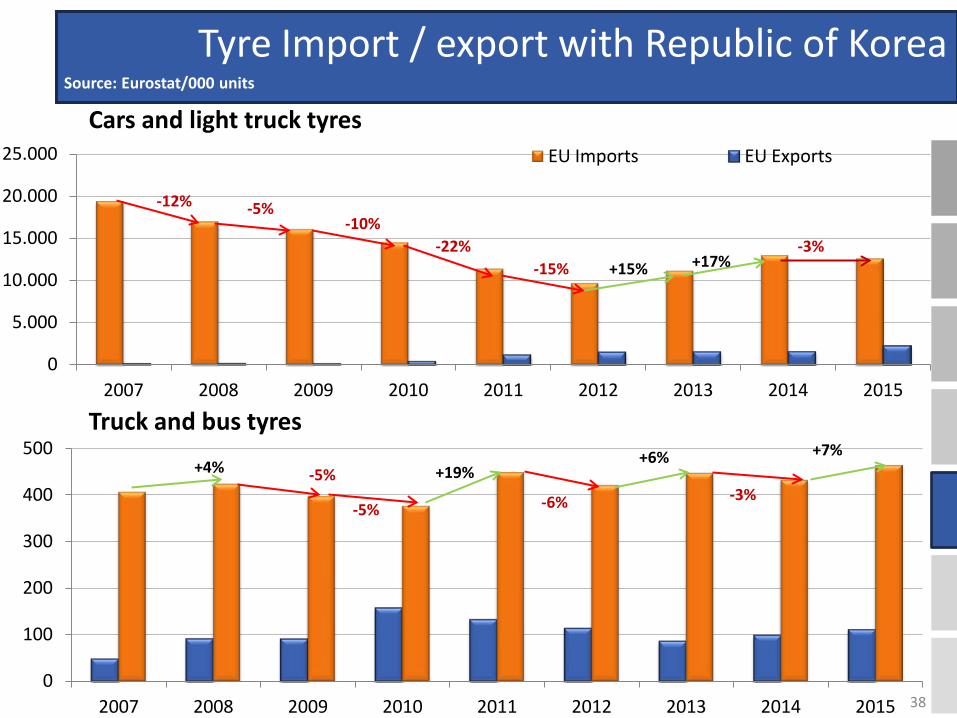
Tyre Import / export with Republic of Korea
Truck and bus tyres
Source: Eurostat/000 units
-12% -5%
-5% +19%
-5%
+4%
-10% -22%
38
-15%
-6%
+6%
+15% +17%
-3%
-3%
+7%
Cars and light truck tyres
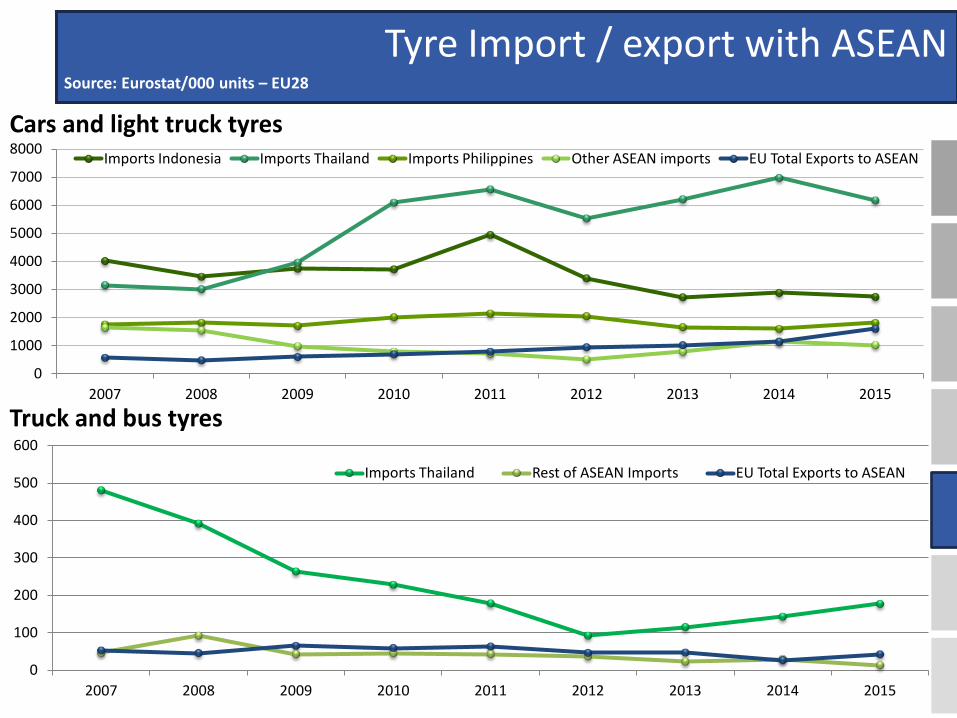
Tyre Import / export with ASEAN
Truck and bus tyres
Source: Eurostat/000 units – EU28
0
1000
2000
3000
4000
5000
6000
7000
8000
2007 2008 2009 2010 2011 2012 2013 2014 2015
Imports Indonesia Imports Thailand Imports Philippines Other ASEAN imports EU Total Exports to ASEAN
0
100
200
300
400
500
600
2007 2008 2009 2010 2011 2012 2013 2014 2015
Imports Thailand Rest of ASEAN Imports EU Total Exports to ASEAN
0
100
200
300
400
500
600
2007 2008 2009 2010 2011 2012 2013 2014 2015
EU Import EU Export
0
500
1000
1500
2000
2500
3000
2007 2008 2009 2010 2011 2012 2013 2014 2015
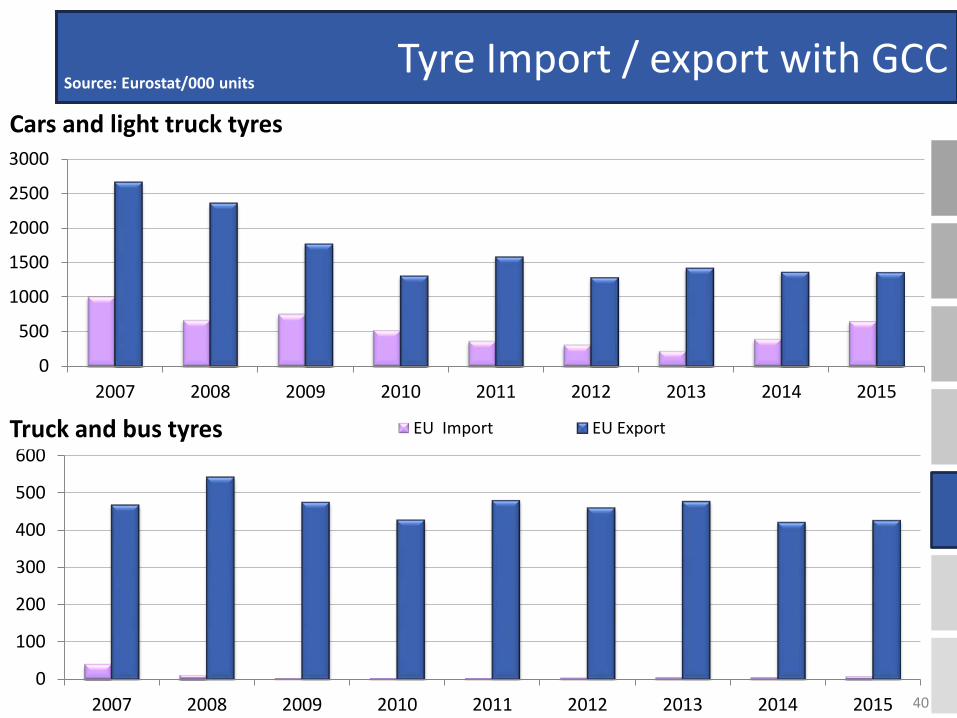
Truck and bus tyres
Cars and light truck tyres
Tyre Import / export with GCC Source: Eurostat/000 units
40

Cars and light truck tyres
Tyre Import / export with Mercosur
Truck and bus tyres
Source: Eurostat/000 units
41
0
500
1000
1500
2000
2500
3000
2007 2008 2009 2010 2011 2012 2013 2014 2015
0
100
200
300
400
500
600
2007 2008 2009 2010 2011 2012 2013 2014 2015

0 1000 2000 3000 4000 5000 6000 7000 8000 9000
2007 2008 2009 2010 2011 2012 2013 2014 2015 EU Imports EU Exports Truck and bus tyres
Cars and light truck tyres
Tyre Import / export with Russia Source: Eurostat/000 units
42
0
200
400
600
800
1000
2007 2008 2009 2010 2011 2012 2013 2014 2015
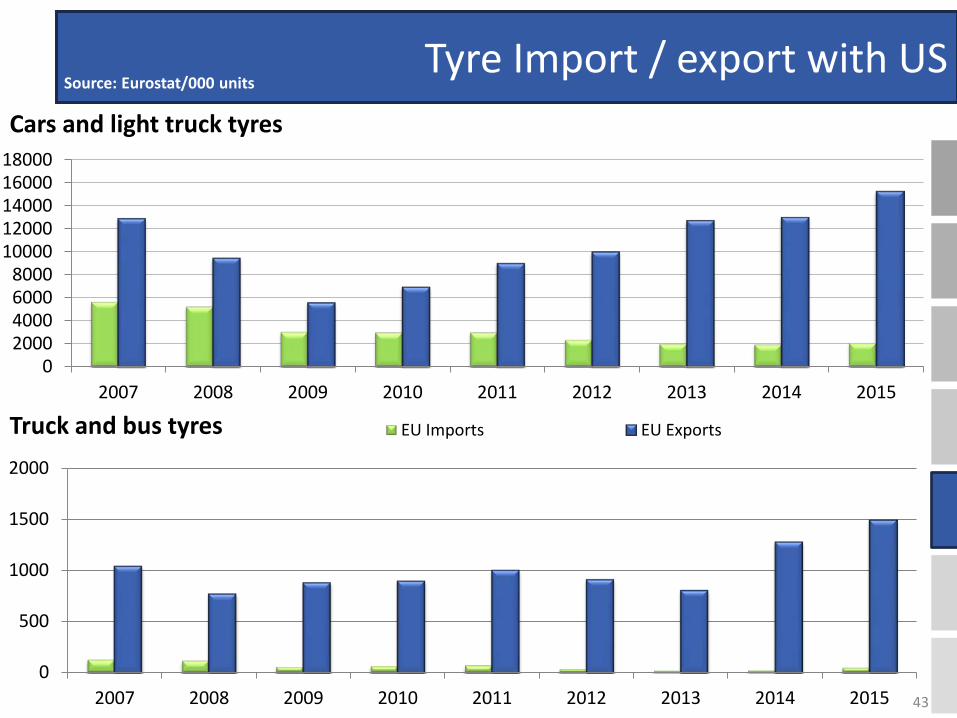
Cars and light truck tyres
Tyre Import / export with US
Truck and bus tyres
Source: Eurostat/000 units
43
0 2000 4000 6000 8000
10000 12000 14000 16000 18000
2007 2008 2009 2010 2011 2012 2013 2014 2015
EU Imports EU Exports
0
500
1000
1500
2000
2007 2008 2009 2010 2011 2012 2013 2014 2015

RUBBER
ETRMA
2014/2015 Key Figures
VEHICLE DATA from 2008 to 2015 and beyond
GENERAL RUBBER GOODS Production and Trade
TYRES: Production, New and Retread Sales, Trade and End of Life
RUBBER
Appendix: Export and Import Tariffs
0
200
400
600
800
1.000
1.200
1.400
2008 2009 2010 2011 2012 2013 2014 2015
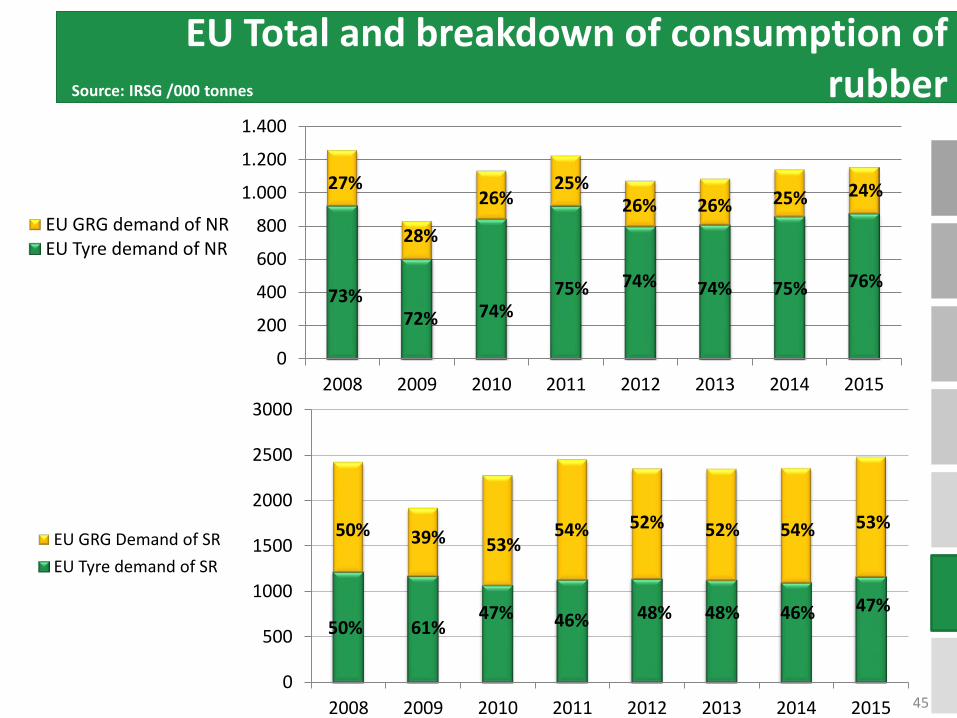
EU GRG demand of NR EU Tyre demand of NR
0
500
1000
1500
2000
2500
3000
2008 2009 2010 2011 2012 2013 2014 2015
EU GRG Demand of SR EU Tyre demand of SR
EU Total and breakdown of consumption of rubber Source: IRSG /000 tonnes
27%
28%
25%
74% 73%
72% 75%
26%
50%
50%
54%
46%
39%
61%
53%
47%
52%
48%
45
26%
74%
52%
48%
26%
74%
54%
46%
25%
75%
53%
47%
24%
76%
0
200
400
600
800
1.000
1.200
1.400
1.600
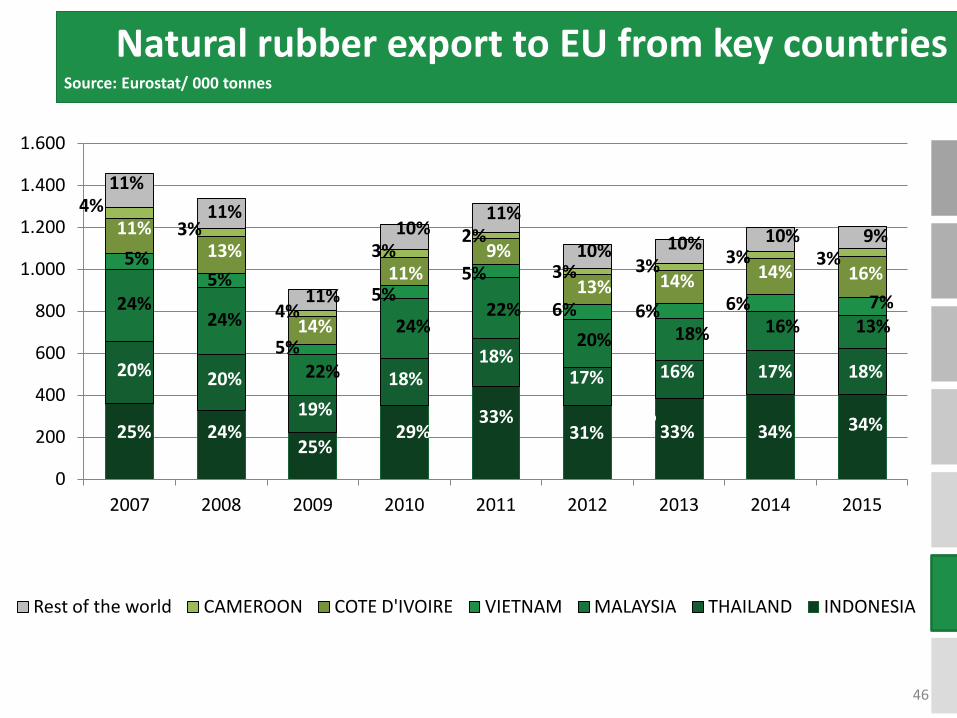
2007 2008 2009 2010 2011 2012 2013 2014 2015
Rest of the world CAMEROON COTE D'IVOIRE VIETNAM MALAYSIA THAILAND INDONESIA
Natural rubber export to EU from key countries Source: Eurostat/ 000 tonnes
46
7%
11% 14%
24%
11% 5%
4%
20%
11%
25%
24%
13% 5%
3%
20%
11%
24%
11% 4%
14% 5%
22%
19%
25%
10% 3%
11% 5%
24%
18%
29%
11% 2%
9% 5%
22%
18%
33% 31%
17%
20% 6%
13% 3%
10%
33%
16%
18% 6%
14% 3%
10%
34%
17%
16% 6%
14% 3%
10%
34%
18%
13% 7%
16% 3%
9%

0
2000
4000
6000
8000
10000
12000
14000
2004 2005 2006 2007 2008 2009 2010 2011 2012 2013 2014 2015
Rest of the world USA Japan India China EU 28
Natural rubber consumption in key countries Source: IRSG/000 tonnes
47
39%
6% 8%
8%
9%
30%
37%
6% 9%
8%
9%
31%
35%
6% 9%
9%
10%
31%
33%
7% 9%
9%
11%
31%
34%
7% 9%
9%
10%
31%
36%
7% 10%
7%
9%
31%
29%
9% 9%
10%
12%
31%
28%
9% 8%
10%
14%
31%
29%
9% 8%
10%
14%
30%
25%
9% 8%
13%
15%
30%
23%
9% 9%
13%
15%
31%
9%
38%
8% 6% 8%
31%

0
2000
4000
6000
8000
10000
12000
14000
16000
2004 2005 2006 2007 2008 2009 2010 2011 2012 2013 2014 2015
Rest of the world USA Japan India China EU 28
Synthetic rubber consumption in key countries Source: IRSG/000 tonnes
48
21%
10%
16%
22%
29%
2% 29%
7% 3%
13%
17%
31%
26%
7% 3%
13%
18%
33%
27%
8% 3%
13%
17%
32%
22%
10% 2%
17%
21%
28%
24%
9% 2%
16%
20%
29%
27%
9% 2%
14%
19%
29%
27%
9% 2%
13%
19%
30%
34%
7% 2%
12%
16%
28%
30%
7% 3%
12%
16%
32%
30%
7% 4%
13%
16%
30% 31%
14% 6%
4%
28%
17%

Appendix: Export and Import Tariffs
ETRMA
2014/2015 Key Figures
VEHICLE DATA from 2008 to 2015 and beyond
GENERAL RUBBER GOODS Production and Trade
TYRES: Production, New and Retread Sales, Trade and End of Life
RUBBER
Appendix: Export and Import Tariffs

Export and import tariffs for tyres
Code Products Argentina Brazil Canada China Colombia India Indonesia Japan Korea Malaysia Paraguay Peru Russia Singapore Thailand Ukraine Uruguay USA Vietnam
4011.10 Car Tyres 35% 16% 7%1 10% 10% 10% 15% 0% 0% 40% 5% 0% 14%2 0% 10% 0-10% 16% 3.4-4%.1 25%
4011.20 MHV Tyres 16-35% 16% 7%1 8-10% 10% 10% 15% 0% 0% 40% 10% 0% 10% 0% 10% 7% 16% 3.4-4%1 25%
4011.40 Moto Tyres 35% 16% 0% 15% 0% 10% 15% 0% 0% 30% 16% 0% 5% 0% 10% 10% 16% 0% 35%
4011.61/92 Agro Tyres 16% 16% 0-6.5% 6-25% 10-0% 10% 15% 0% 0% 30% 16% 0% 5% 0% 10% 10% 16% 0% 15-20%
When exporting from the EU to the trading partner country
1 Of Free-on-Board (FOB) value 2 But not less than €4.34/unit
When importing from the trading partner country to the EU Code Products Argentina Brazil Canada China Colombia India1 Indonesia1 Japan Korea Malaysia Paraguay2 Peru Russia Singapore Thailand Ukraine1 Uruguay USA Vietnam1
4011.10 Car Tyres 4.5% 4.5% 4.5% 4.5% 0% 0% 0% 4.5% 0% 4.5% 0% 0% 4.5% 4.5% 4.5% 0% 4.5% 4.5% 0%
4011.20 MHV Tyres 4.5% 4.5% 4.5% 4.5% 0% 0% 0% 4.5% 0% 4.5% 0% 0% 4.5% 4.5% 4.5% 0% 4.5% 4.5% 0%
4011.40 Moto Tyres 4.5% 4.5% 4.5% 4.5% 0% 0% 0% 4.5% 0% 4.5% 0% 0% 4.5% 4.5% 4.5% 0% 4.5% 4.5% 0%
4011.61/92
Agro Tyres 4% 4% 4% 4% 0% 0% 0% 4% 0% 4% 0% 0% 4% 4% 4% 0% 4% 4% 0%
1 GSP Beneficiary 2 GSP+
Source: export duties, www.madb.europa.eu; import tariffs, TARIC database
50

Export and import tariffs for GRG
Code Products Argentina Brazil Canada China Colombia India Indonesia Japan Korea Malaysia Paraguay Peru Russia Singapore Thailand Ukraine Uruguay USA1 Vietnam
4008 Plates, sheets,
strips, rods, profile shapes
14% 14% 0,0 8% 0-10% 10% 5% 0% 0-1.3% 5-30% 11-14% 0% 5% 0% 5-30% 0-5% 14% 0-
3,3% 3%
4009 Tubes , pipes hoses 14% 14% 0,0 10-
10,5% 0-5% 10% 5% 2,3-2,5%
0-1.3% 30% 10% 0% 0-3% 0% 5-10% 0-10% 14% 2,5% 3%
4010 Conveyor and transmission belts 14% 14% 0% 8-10% 0% 10% 5% 1,9% 0-
1.3% 30% 10-14% 0% 5% 0% 10% 0-10% 14% 1,9-8%
7.5-22.5%
4015 Gloves 16% 16% 10-15,5%1 8-18% 0-14.5% 10% 10% 0% 0% 0-15% 16% 0-6% 10% 0% 10% 5-10% 16% 0-4% 5-20%
When exporting from the EU to the trading partner country
1 Of Free-on-Board (FOB) value
Code Products Argentina Brazil1 Canada China Colombia India1 Indonesia1 Japan Korea Malaysia Paraguay2 Peru Russia Singapore Thailand Ukraine1 Uruguay USA Vietnam1
4008 Plates, sheets,
strips, rods, profile shapes
2,9-3% 0% 2,9-3% 2,9-3% 0% 0% 0% 2,9-
3% 0% 2,9-3% 0% 0% 2,9-3% 2,9-3% 2,9-3% 0% 2,9-3% 2,9-3% 0%
4009 Tubes , pipes hoses 3% 0% 3% 3% 0% 0% 0% 3% 0% 3% 0% 0% 3% 3% 3% 0% 3% 3% 0%
4010 Conveyor and transmission
belts 6,5% 0% 6,5% 6,5% 0% 0% 0% 6,5% 0% 6,5% 0% 0% 6,5% 6,5% 6,5% 0% 6,5% 6,5
% 0%
4015 Gloves 2,0-5% 0% 2,0-5% 2-5% 0% 0% 0% 2,0-5% 0% 2,0-5% 0% 0% 2,0-5% 2,0-5% 2,0-5% 0% 2,0-5% 2,0-
5% 0%
When importing from the trading partner country to the EU
1 GSP Beneficiary 2 GSP+
Source: export duties, www.madb.europa.eu; import tariffs, TARIC database
51
52