15A3HP623DDINESHREDDY-FINALPROJECT REPORT--1-
34
1 INTERIM PROJECT REPORT RESEARCH ON STEEL INDUSTRY Submitted By:- D DINESH KUMAR REDDY (15A3HP623) Faculty Guide:- Dr. K Sriharsha Reddy Industry Guide:- Anil Kumar Upadhyay (Corporate Finance Head)
-
Upload
d-dinesh-kumar-reddy -
Category
Documents
-
view
134 -
download
0
Transcript of 15A3HP623DDINESHREDDY-FINALPROJECT REPORT--1-
1
INTERIM PROJECT REPORT
RESEARCH ON STEEL INDUSTRY
Submitted By:-
D DINESH KUMAR REDDY
(15A3HP623)
Faculty Guide:-
Dr. K Sriharsha Reddy
Industry Guide:-
Anil Kumar Upadhyay
(Corporate Finance Head)
2
A REPORT
ON
RESEARCH ON STEEL INDUSTRY
PREPARED FOR
RAIN INDUSTRIES LIMITED
APPROVED BY:
ANIL KUMAR UPADHYAY
(Corporate Finance Head)
BY
D DINESH KUMAR REDDY
PGDM
INSTITUTE OF MANAGEMENT TECHNOLOGY
HYDERABAD
JUNE 2016

3
4
Copy right © 2016 by D Dinesh Kumar Reddy
This is a work of generating report on Research on Steel Industry
All rights reserved.
No part of this report may be reproduced, transmitted, or stored in a retrieval system, in any
form or by any means, electronic, mechanical, photocopying, recording or otherwise, without
the prior permission of the author.
5
Forwarding Letter
To
The Corporate Finance Head
Rain Industries Limited
Hyderabad
From
D Dinesh Kumar Reddy
PGDM
Institute Of Management Technology
Hyderabad
Subject: Submission of an Internship Project Report for Evaluation
Dear Sir,
I am enclosing herewith an internship project report entitled “Research On Steel Industry”
For Evaluation.
With the submission of this internship project report I would like to undertake that the above
mentioned report has not been published elsewhere, accepted for publication elsewhere.
The research project was my
PGDM Summer Internship program
This research project was conducted from 07 March 2016 to 10 June 2016
Yours Sincerely
D Dinesh Kumar Reddy
(IMT Hyderabad)
6
PREFACE
The PGDM is a well structured and integrated course of business studies.
The main objective of internship is to develop skills in students by supplement to the
theoretical study of business management in general. Internship helps to gain real life
knowledge about the industrial environment and business practices.
The PGDM program provides student with a fundamental knowledge of business and
organizational functions and activities, as well as an exposure to strategic thinking of
management.
In every professional course, training is an important factor.
Professors give us theoretical knowledge of various subjects in the college but we are
practically exposed to such subjects when we get the internship in the organization. It is only
the training through which I came to know that what an industry is and how it works. I can
learn about various departmental operations being performed in the industry, which would, in
return, help me in the future when I will enter the practical field.
Training is an integral part of PGDM and each and every student has to undergo the
internship for 14 weeks in a company and then prepare a project report on the same after the
completion of training.
During this whole training I got a lot of experience and came to know about the management
practices in real and how it differs from the theoretical knowledge.
In today's globalize world, where cutthroat competition is prevailing in the market,
theoretical knowledge is not sufficient. Besides this, one needs to have practical knowledge,
which would help an individual in his/her carrier activities and it is true that “Experience is
the best teacher”
7
ACKNOWLEDGEMENT
All praise to almighty God whose mercifulness benevolence, gifted me the
ever-caring parents whose praise and selfless gesture made this work to reach its fruitful
destination.
At the onset, I would like to express my heartiest thanks to Dr. K. Sriharsha
Reddy (Chairperson – Internship Program) who gave me an opportunity to undertake a
project at Rain Industries Limited.
I express my sincere regard to my company guide Mr. Anil Kumar
Upadhyay (Corporate Finance Head) for his excellent command over the information
regarding Retail outlets and sharing the same with me has come a long way to help me
complete this project. Moreover, I am also thankful to all other employees of the Rain
Industries Limited who have been very supportive throughout the project period.
Lastly I want to pay my hearted thanks to my friends and people who gave to
me their valuable suggestion and guidance in completing my project.
D Dinesh Kumar Reddy
(IMT Hyderabad)
8
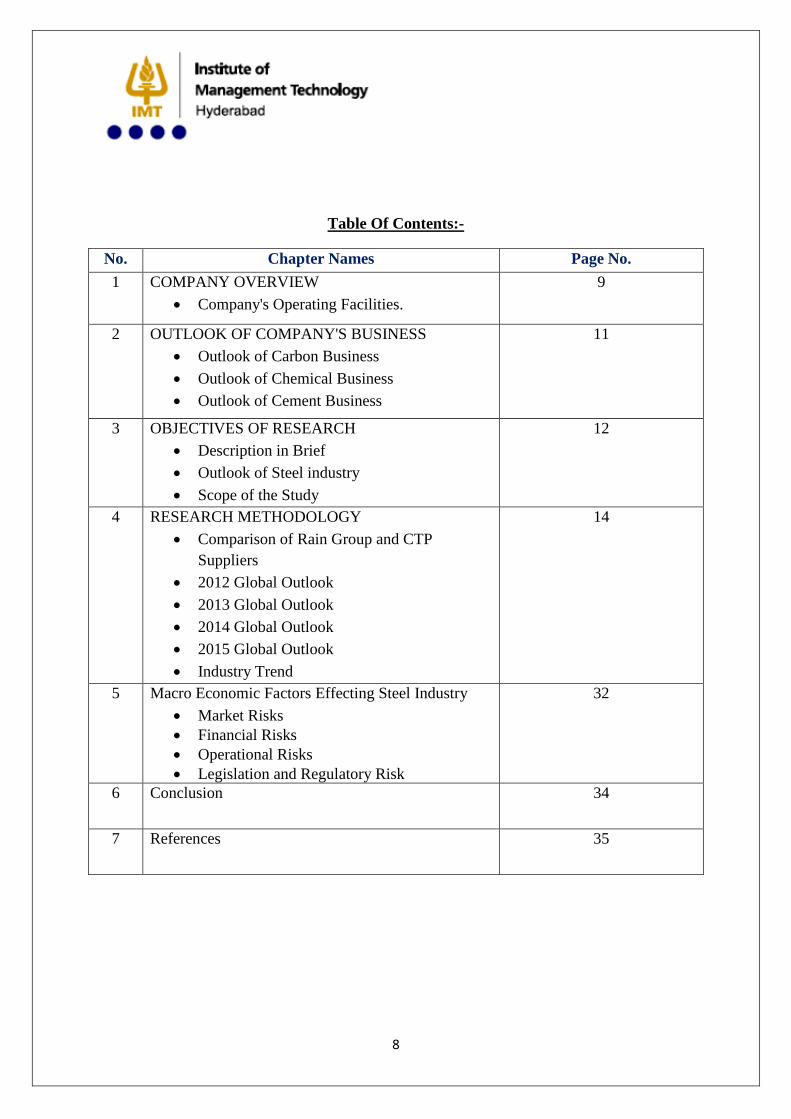
Table Of Contents:-
No. Chapter Names Page No.
1
COMPANY OVERVIEW
Company's Operating Facilities.
9
2 OUTLOOK OF COMPANY'S BUSINESS
Outlook of Carbon Business
Outlook of Chemical Business
Outlook of Cement Business
11
3 OBJECTIVES OF RESEARCH
Description in Brief
Outlook of Steel industry
Scope of the Study
12
4 RESEARCH METHODOLOGY
Comparison of Rain Group and CTP
Suppliers
2012 Global Outlook
2013 Global Outlook
2014 Global Outlook
2015 Global Outlook
Industry Trend
14
5 Macro Economic Factors Effecting Steel Industry
Market Risks
Financial Risks
Operational Risks
Legislation and Regulatory Risk
32
6 Conclusion 34
7 References 35
9
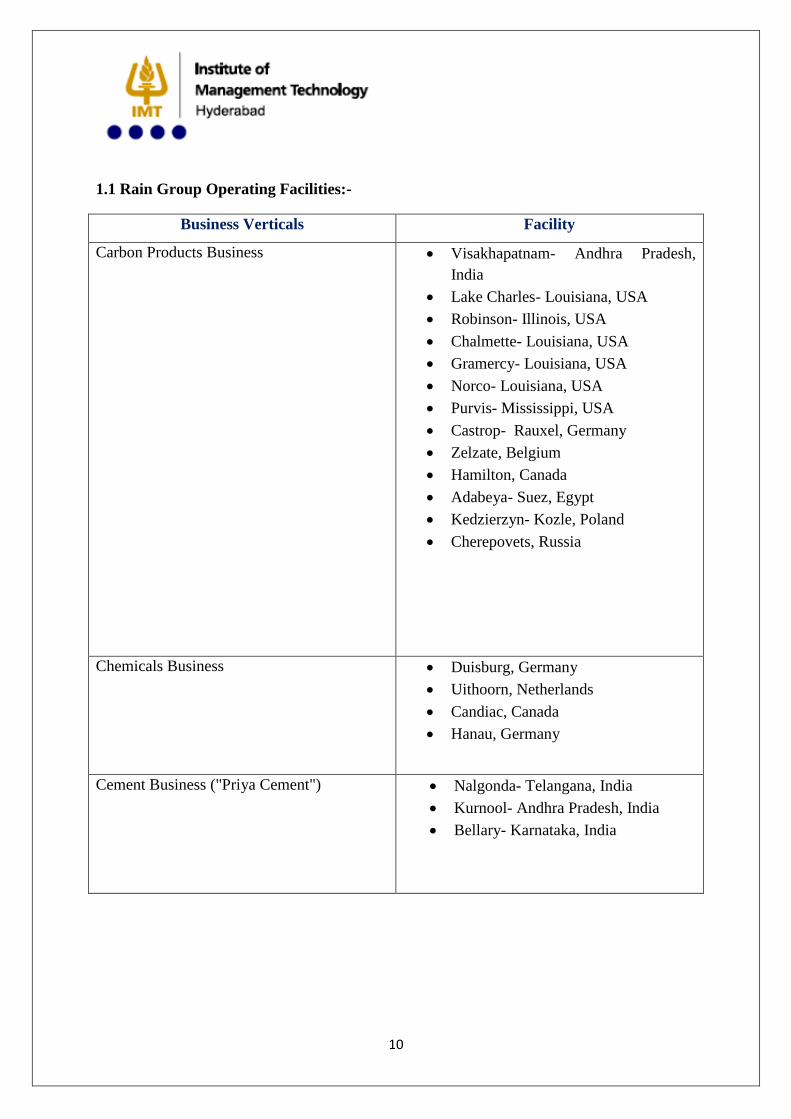
1. Company Overview:-
Rain Industries Limited(formerly Rain Commodities Limited) ("Rain Group") is one of the
world's leading producer of Carbon and Chemical Products and is one of the leading
producers of Cement in South India.
Business Verticals Description of Business
Carbon Products
Business
Carbon Products comprise Calcined Petroleum Coke
("CPC"), Green Petroleum Coke ("GPC"), Coal Tar Pitch
("CTP"), Co-generated Energy and other derivatives of Coal
Tar Distillation.
Activities across the World with operating facilities spread
across Africa, Belgium, Canada, Germany, India, Poland
and United States of America. The Russian JV facility is
under construction and expected to commence operation
from Second half of CY 2015.
C0-generation facilities located in USA and India.
Chemicals Business Chemicals include the downstream operation of Coal Tar
distillation and comprise Resins, Modifiers, Super
Plasticizers and other specialty products.
Activities across the world with facilities in Germany,
Canada and Netherlands.
Cement Business Production and sale of Cement.
Activities predominantly in South India.
Entering new market regions viz. Maharashtra, Orissa and
Kerala.
Marketed under the brand name "Priya Cement".
10
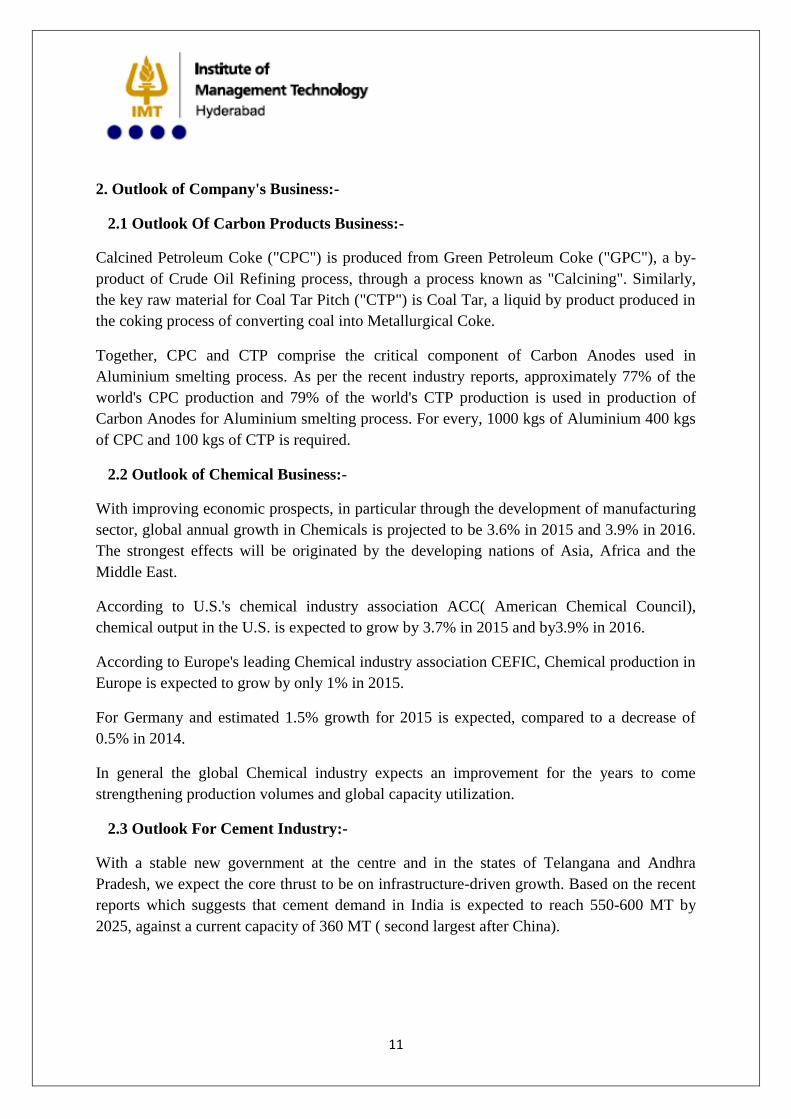
1.1 Rain Group Operating Facilities:-
Business Verticals Facility
Carbon Products Business Visakhapatnam- Andhra Pradesh,
India
Lake Charles- Louisiana, USA
Robinson- Illinois, USA
Chalmette- Louisiana, USA
Gramercy- Louisiana, USA
Norco- Louisiana, USA
Purvis- Mississippi, USA
Castrop- Rauxel, Germany
Zelzate, Belgium
Hamilton, Canada
Adabeya- Suez, Egypt
Kedzierzyn- Kozle, Poland
Cherepovets, Russia
Chemicals Business Duisburg, Germany
Uithoorn, Netherlands
Candiac, Canada
Hanau, Germany
Cement Business ("Priya Cement") Nalgonda- Telangana, India
Kurnool- Andhra Pradesh, India
Bellary- Karnataka, India
11
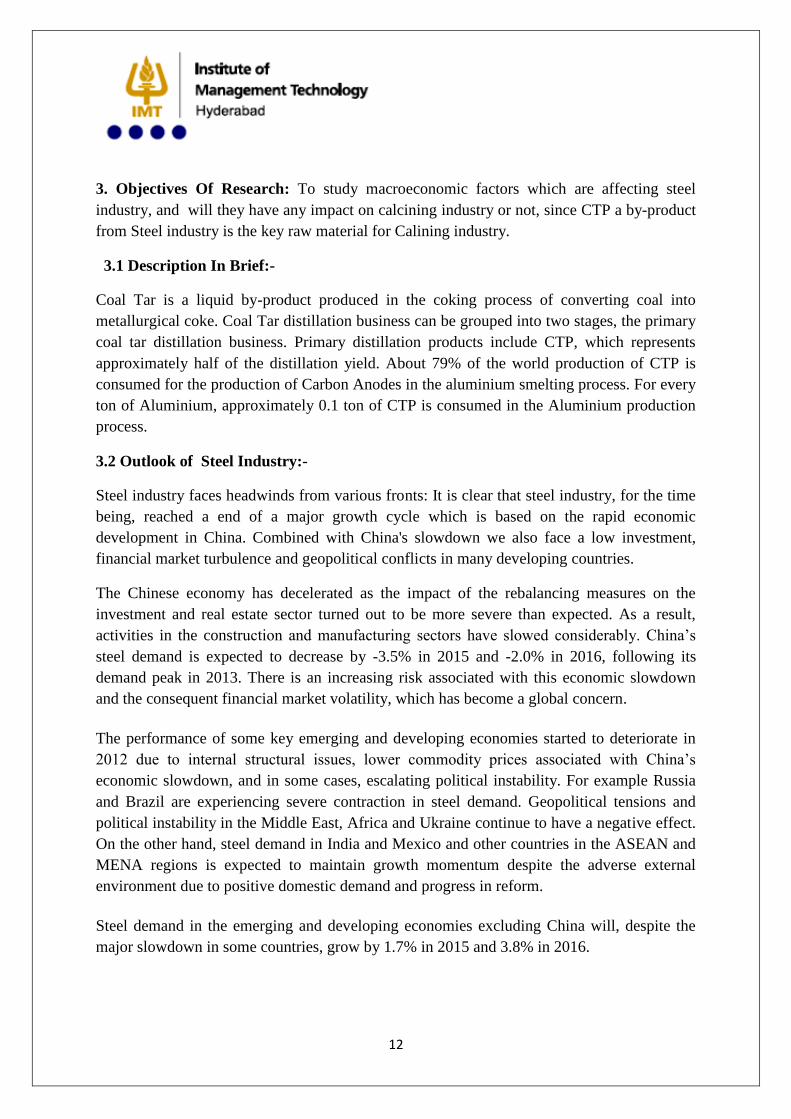
2. Outlook of Company's Business:-
2.1 Outlook Of Carbon Products Business:-
Calcined Petroleum Coke ("CPC") is produced from Green Petroleum Coke ("GPC"), a by-
product of Crude Oil Refining process, through a process known as "Calcining". Similarly,
the key raw material for Coal Tar Pitch ("CTP") is Coal Tar, a liquid by product produced in
the coking process of converting coal into Metallurgical Coke.
Together, CPC and CTP comprise the critical component of Carbon Anodes used in
Aluminium smelting process. As per the recent industry reports, approximately 77% of the
world's CPC production and 79% of the world's CTP production is used in production of
Carbon Anodes for Aluminium smelting process. For every, 1000 kgs of Aluminium 400 kgs
of CPC and 100 kgs of CTP is required.
2.2 Outlook of Chemical Business:-
With improving economic prospects, in particular through the development of manufacturing
sector, global annual growth in Chemicals is projected to be 3.6% in 2015 and 3.9% in 2016.
The strongest effects will be originated by the developing nations of Asia, Africa and the
Middle East.
According to U.S.'s chemical industry association ACC( American Chemical Council),
chemical output in the U.S. is expected to grow by 3.7% in 2015 and by3.9% in 2016.
According to Europe's leading Chemical industry association CEFIC, Chemical production in
Europe is expected to grow by only 1% in 2015.
For Germany and estimated 1.5% growth for 2015 is expected, compared to a decrease of
0.5% in 2014.
In general the global Chemical industry expects an improvement for the years to come
strengthening production volumes and global capacity utilization.
2.3 Outlook For Cement Industry:-
With a stable new government at the centre and in the states of Telangana and Andhra
Pradesh, we expect the core thrust to be on infrastructure-driven growth. Based on the recent
reports which suggests that cement demand in India is expected to reach 550-600 MT by
2025, against a current capacity of 360 MT ( second largest after China).
12
3. Objectives Of Research: To study macroeconomic factors which are affecting steel
industry, and will they have any impact on calcining industry or not, since CTP a by-product
from Steel industry is the key raw material for Calining industry.
3.1 Description In Brief:-
Coal Tar is a liquid by-product produced in the coking process of converting coal into
metallurgical coke. Coal Tar distillation business can be grouped into two stages, the primary
coal tar distillation business. Primary distillation products include CTP, which represents
approximately half of the distillation yield. About 79% of the world production of CTP is
consumed for the production of Carbon Anodes in the aluminium smelting process. For every
ton of Aluminium, approximately 0.1 ton of CTP is consumed in the Aluminium production
process.
3.2 Outlook of Steel Industry:-
Steel industry faces headwinds from various fronts: It is clear that steel industry, for the time
being, reached a end of a major growth cycle which is based on the rapid economic
development in China. Combined with China's slowdown we also face a low investment,
financial market turbulence and geopolitical conflicts in many developing countries.
The Chinese economy has decelerated as the impact of the rebalancing measures on the
investment and real estate sector turned out to be more severe than expected. As a result,
activities in the construction and manufacturing sectors have slowed considerably. China’s
steel demand is expected to decrease by -3.5% in 2015 and -2.0% in 2016, following its
demand peak in 2013. There is an increasing risk associated with this economic slowdown
and the consequent financial market volatility, which has become a global concern.
The performance of some key emerging and developing economies started to deteriorate in
2012 due to internal structural issues, lower commodity prices associated with China’s
economic slowdown, and in some cases, escalating political instability. For example Russia
and Brazil are experiencing severe contraction in steel demand. Geopolitical tensions and
political instability in the Middle East, Africa and Ukraine continue to have a negative effect.
On the other hand, steel demand in India and Mexico and other countries in the ASEAN and
MENA regions is expected to maintain growth momentum despite the adverse external
environment due to positive domestic demand and progress in reform.
Steel demand in the emerging and developing economies excluding China will, despite the
major slowdown in some countries, grow by 1.7% in 2015 and 3.8% in 2016.
13
3.3 Scope of the Study:-
To show that "Rain Group" whose one of the key raw material Coal Tar (CTP) is a by-
product of Steel industry, is not affected by the macroeconomic changes in the Steel industry.
14
4. Research Methodology:-
Research is done through comparing various "performance indicators" of the Steel industry
and Calcining industry from its annual reports.
Major Performance Indicators are Revenues, EBITDA, PAT, Capacity utilization etc.
Research done until now:-
Firstly, Research is done by comparing the Revenues, Operating Profit, Operating
Profit/Revenues of Rain Group and different CTP suppliers for Rain Group.
CTP suppliers( Steel Manufacturing companies) for Rain Group are:-
1. Tata Steel
2. ArcelorMittal
3. Severstal
4. ThyssenKrupp
5. Exxon Mobil
6. Philip 66
7. BASF
8. Evonik
9. DBK GmbH
10. SALZGITT
11. ERAG
12. U S Steel
13. SSAB
14. ESSAR Steel Algoma.
and many other steel manufacturing companies.
We are comparing only Revenues, Operating Profit and Operating Profit/Revenues for Rain
Group and its CTP suppliers, because CTP and Steel are different industries, different
companies have different capital structure.
15
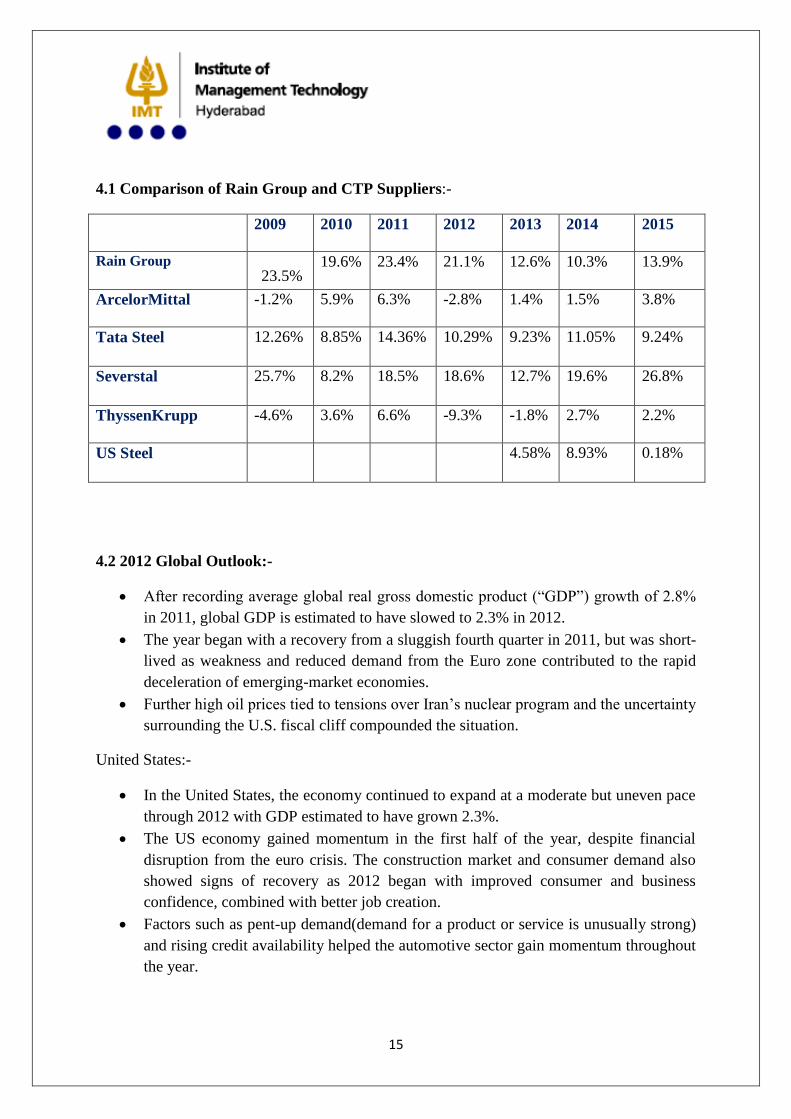
4.1 Comparison of Rain Group and CTP Suppliers:-
2009 2010 2011 2012 2013 2014 2015
Rain Group 23.5%
19.6% 23.4% 21.1% 12.6% 10.3% 13.9%
ArcelorMittal -1.2% 5.9% 6.3% -2.8% 1.4% 1.5% 3.8%
Tata Steel 12.26% 8.85% 14.36% 10.29% 9.23% 11.05% 9.24%
Severstal 25.7% 8.2% 18.5% 18.6% 12.7% 19.6% 26.8%
ThyssenKrupp -4.6% 3.6% 6.6% -9.3% -1.8% 2.7% 2.2%
US Steel 4.58% 8.93% 0.18%
4.2 2012 Global Outlook:-
After recording average global real gross domestic product (“GDP”) growth of 2.8%
in 2011, global GDP is estimated to have slowed to 2.3% in 2012.
The year began with a recovery from a sluggish fourth quarter in 2011, but was short-
lived as weakness and reduced demand from the Euro zone contributed to the rapid
deceleration of emerging-market economies.
Further high oil prices tied to tensions over Iran’s nuclear program and the uncertainty
surrounding the U.S. fiscal cliff compounded the situation.
United States:-
In the United States, the economy continued to expand at a moderate but uneven pace
through 2012 with GDP estimated to have grown 2.3%.
The US economy gained momentum in the first half of the year, despite financial
disruption from the euro crisis. The construction market and consumer demand also
showed signs of recovery as 2012 began with improved consumer and business
confidence, combined with better job creation.
Factors such as pent-up demand(demand for a product or service is unusually strong)
and rising credit availability helped the automotive sector gain momentum throughout
the year.
16
However, threat of the “fiscal cliff”, the impact of Hurricane Sandy and the increasing
tensions over Iran’s nuclear program contributed to sharp increases in oil prices,
bringing the United States down from its high at the start of the year. This also
affected spending on equipment as firms became more cautious with respect to capital
investment plans.
Euro Zone:-
The economy of the European Union countries (EU27) contracted almost every
quarter from the third quarter of 2011, with real GDP contracting by 0.2% in 2012,
compared to growth of 1.6% in 2011.
A record high Eurozone unemployment rate of 11.8% in November 2012 indicates
the toll on labor markets of continued weak economic activity and low business
confidence.
The situation varies from country to country, with the North (particularly Austria,
Benelux, Germany and Scandinavia) faring better than the South (where a tighter
fiscal policy and limited consumer spending have hampered domestic demand).
The Euro area crisis is the outcome of several underlying forces. These factors include
mispriced risk, prolonged liquidity fed macroeconomic policies over many years and
weak prudential banking norms.
China:-
Chinese GDP grew by 7.7% in 2012, which is the weakest level of growth in the past
13 years.
China’s slowdown further impacted other emerging market countries prompting their
central banks to reverse the monetary tightening cycle of 2011 and lower interest rates
in mid-2012.
However, despite experiencing persistently weak exports throughout 2012, in the
fourth quarter of 2012, growth improved and the economy showed signs of recovery
as infrastructure, retail sales and industrial production growth all picked up.
India:-
In India, inflation remains uncomfortably high, limiting the ability to reduce interest
rates any further to promote growth. India has struggled with widening current and
trade account deficits due to the combination of weaker capital inflows, high imports
and slower export growth.
17
Steel Prices:-
Steel prices increased during the first quarter of 2012 reaching peak levels of €555 per
tonne for spot hot rolled coil (“HRC”) in Europe in March, and about $800 per tonne
in the United States in February, from €495 and $750, respectively, at year-end 2011.
This sharp increase in prices was mainly driven by customer restocking. In the case of
Europe, it was also supported by a weak euro which reduced import attractiveness,
while in United States, the steel price increase also automotive, energy and machinery
sectors.
During the second quarter of 2012, market sentiment weakened due to renewed
destocking efforts by customers combined with oversupply and poor demand. In the
United States, the automotive industry held firm, but overall economic activity slowed
down, providing less room for optimism going forward. In Europe, automotive and
manufacturing declined as austerity coupled with fears of a Euro-zone breakup took
their toll on confidence and output. By the end of the second quarter, HRC prices had
lost about $100- 130 per tonne from their first quarter peak. Exports from Asian
suppliers in China, South Korea and Japan competing with CIS producers for scarce
international demand also put pressure on international reference prices. Similarly, the
slab market experienced a slump in demand, and prices fell to $550 CFR5 in South
East Asia at the end of the second quarter of 2012 from levels close to $610 in March
2012.
In the second half of 2012, HRC prices then lost up to $150 per tonne in the United
States and about €100 per tonne in Europe from their first-half peak, with HRC prices
reaching lows of €460 in Europe and $650 in the United States at the start of the
fourth quarter of 2012. This sharp fall was due to generally weak buyer sentiment and
uncertain financial markets, with destocking continuing through the third quarter.
International export prices remained very weak throughout the second half.
Only in the last weeks of 2012 was an upward correction visible, on the back of the
upward trend in raw material prices, which had been initiated in China driven by
strong restocking.
Iron Ore Prices:-
In the first quarter of 2012, spot iron ore prices were stable at $143 per tonne, whereas in the
second quarter of 2012, there was higher volatility with prices reaching $150 per tonne in
April, declining to $132 per tonne in mid-May and then hovering around $135 to $138 per
tonne in June. This price drop and volatility in the second quarter of 2012 reflected the
slowing Chinese economy and economic difficulties in Europe, which drove further decline
of end user demand for steel and iron ore. Some temporary support of moderately high prices
18
in the first half of 2012 was provided by the export ban put in place by the Indian
government, which limited seaborne supply of Indian iron ore.
However, at the beginning of the third quarter of 2012. In the second half of 2012, spot prices
per tonne ranged from $135.25 in beginning of July to $106.5 in end of September and
$144.5 at the end of December, with particularly high volatility in December, due to
restocking activities in China. This volatility reflects economic uncertainties in Europe as
well as in China.
Coking Coal:-
As supply was progressively restored in Australia following the rain event and demand
decreased due to ongoing economic uncertainty, prices began to decrease further, with the
benchmark price settlement for the first quarter of 2012 at $235 per tonne. The downward
trend continued in the second quarter of 2012, with the benchmark price settled at $210 per
tonne. The degree of price decline in premium coals in the second quarter of 2012 was
lessened by strikes at BHP Billiton
Mitsubishi Alliance (“BMA”) mines. $170 per tonne for the third and fourth quarters of 2012.
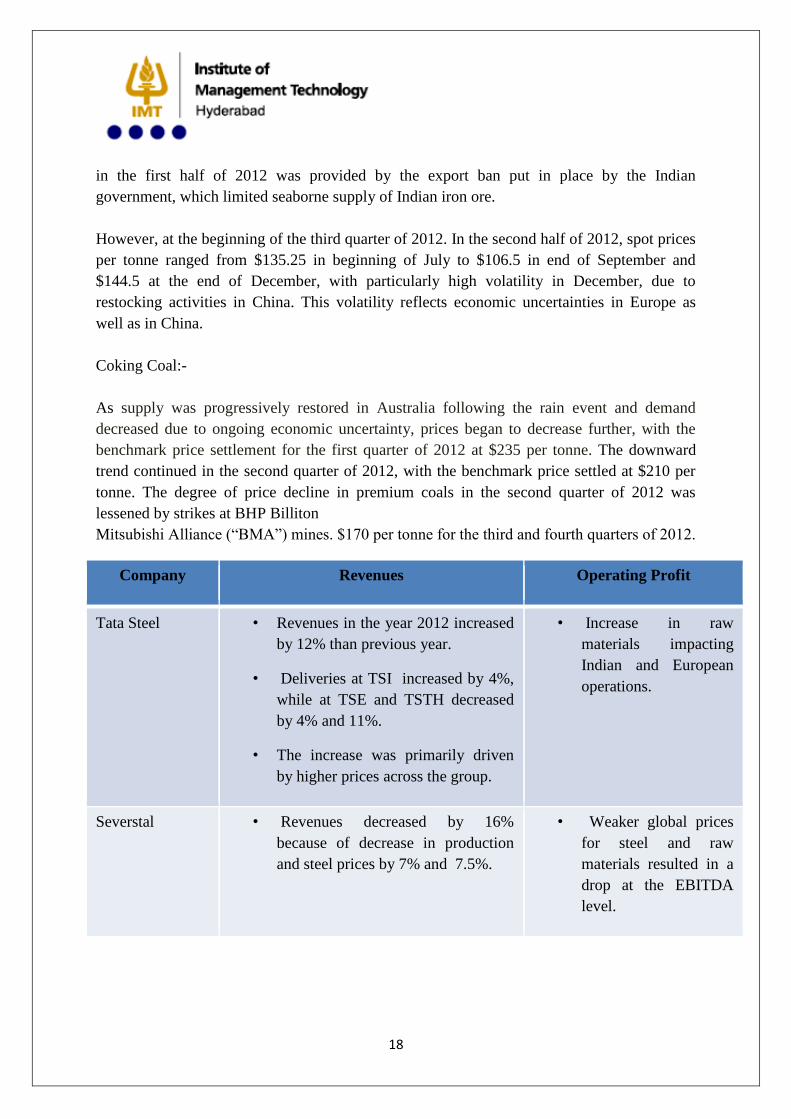
Company Revenues Operating Profit
Tata Steel • Revenues in the year 2012 increased
by 12% than previous year.
• Deliveries at TSI increased by 4%,
while at TSE and TSTH decreased
by 4% and 11%.
• The increase was primarily driven
by higher prices across the group.
• Increase in raw
materials impacting
Indian and European
operations.
Severstal • Revenues decreased by 16%
because of decrease in production
and steel prices by 7% and 7.5%.
• Weaker global prices
for steel and raw
materials resulted in a
drop at the EBITDA
level.
19
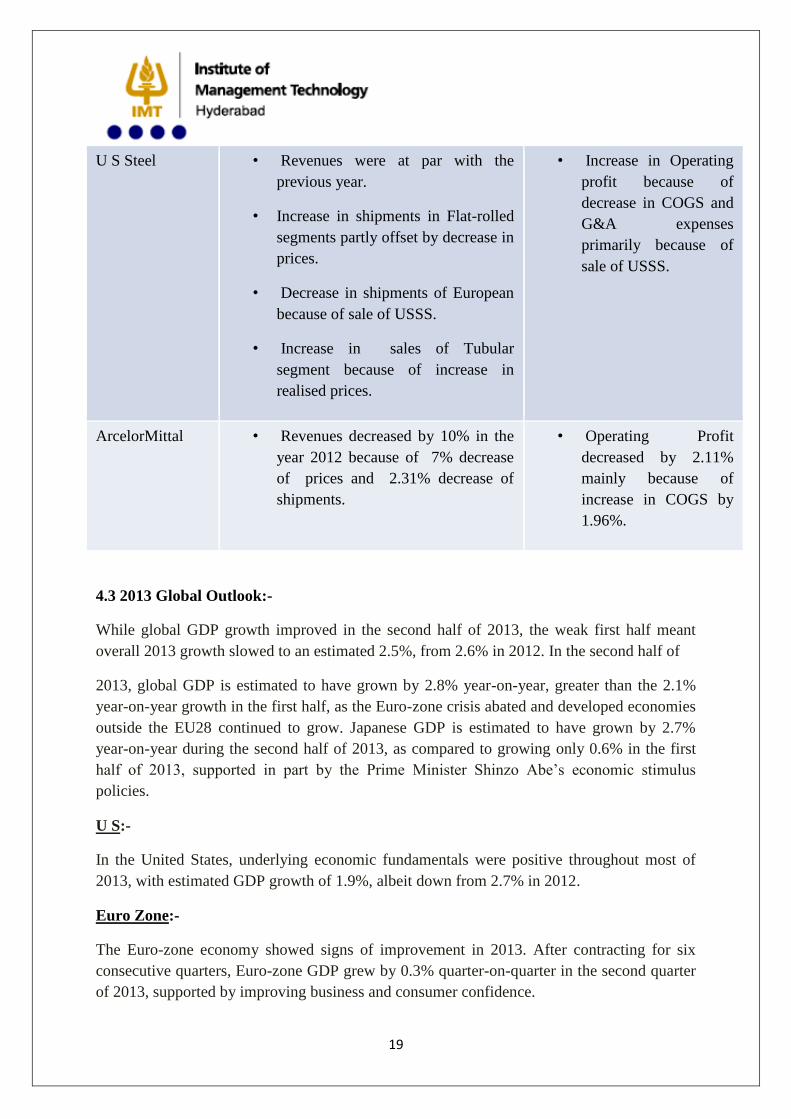
U S Steel • Revenues were at par with the
previous year.
• Increase in shipments in Flat-rolled
segments partly offset by decrease in
prices.
• Decrease in shipments of European
because of sale of USSS.
• Increase in sales of Tubular
segment because of increase in
realised prices.
• Increase in Operating
profit because of
decrease in COGS and
G&A expenses
primarily because of
sale of USSS.
ArcelorMittal • Revenues decreased by 10% in the
year 2012 because of 7% decrease
of prices and 2.31% decrease of
shipments.
• Operating Profit
decreased by 2.11%
mainly because of
increase in COGS by
1.96%.
4.3 2013 Global Outlook:-
While global GDP growth improved in the second half of 2013, the weak first half meant
overall 2013 growth slowed to an estimated 2.5%, from 2.6% in 2012. In the second half of
2013, global GDP is estimated to have grown by 2.8% year-on-year, greater than the 2.1%
year-on-year growth in the first half, as the Euro-zone crisis abated and developed economies
outside the EU28 continued to grow. Japanese GDP is estimated to have grown by 2.7%
year-on-year during the second half of 2013, as compared to growing only 0.6% in the first
half of 2013, supported in part by the Prime Minister Shinzo Abe’s economic stimulus
policies.
U S:-
In the United States, underlying economic fundamentals were positive throughout most of
2013, with estimated GDP growth of 1.9%, albeit down from 2.7% in 2012.
Euro Zone:-
The Euro-zone economy showed signs of improvement in 2013. After contracting for six
consecutive quarters, Euro-zone GDP grew by 0.3% quarter-on-quarter in the second quarter
of 2013, supported by improving business and consumer confidence.
20
China:-
Despite strong steel production growth in China, lower real demand for steel elsewhere
reduced demand for raw materials, pushing prices for iron ore and coal down in the second
quarter of 2013.
India:-
The Indian Steel industry witnessed an increase in crude steel production of 5.4% year-on-
year, whereas the
real consumption increased only by 3.3% with imports registering a sharp increase on
account of lower import
duties applicable to ASEAN countries. The slowdown in fixed asset investment and
lacklustre automotive demand impacted margins of steelmakers adversely.
Steel Prices:-
Steel prices in Europe, previously flat, steadily improved during the first quarter of 2013,
with spot hot rolled coil (“HRC”) reaching €490-510 per tonne, up from the €480-495 per
tonne in December 2012. In the United States, the steel market experienced a seasonal
slowdown in activity at the end of 2012, resulting in prices declining to $680 per tonne in
January 2013, from a peak of $715 per tonne in November 2012. Domestic steel producers
made several attempts to restore prices to $715 per tonne for HRC, with very limited success
during the first quarter of 2013.
During the second quarter of 2013, demand remained weak in Europe, and prices softened
across the region. Spot HRC reached €430-450 per tonne.
In the second half of 2013, Europe HRC prices remained generally low due to weak buyer
sentiment, strong domestic competition and low import offer prices. The highest price level
was achieved in September 2013 at €455-465 per tonne. Various attempts to increase prices
were made by European domestic steel producers during the fourth quarter of 2013 with little
success. In December 2013 HRC was at €445-455 per tonne and, despite a strong euro/U.S.
dollar exchange rate.
Iron Ore Prices:-
In the first quarter of 2013, iron ore prices increased dramatically as a result of restocking in
China before the New Year holiday and a seasonally weaker supply due to weather-related
disruptions in production in Brazil and Australia.
In the second quarter of 2013, iron ore prices declined significantly as a result of stock cuts
stemming from uncertainties about the Chinese market outlook, reaching a low of $110 per
tonne in May and averaging $126 per tonne for the quarter.
21
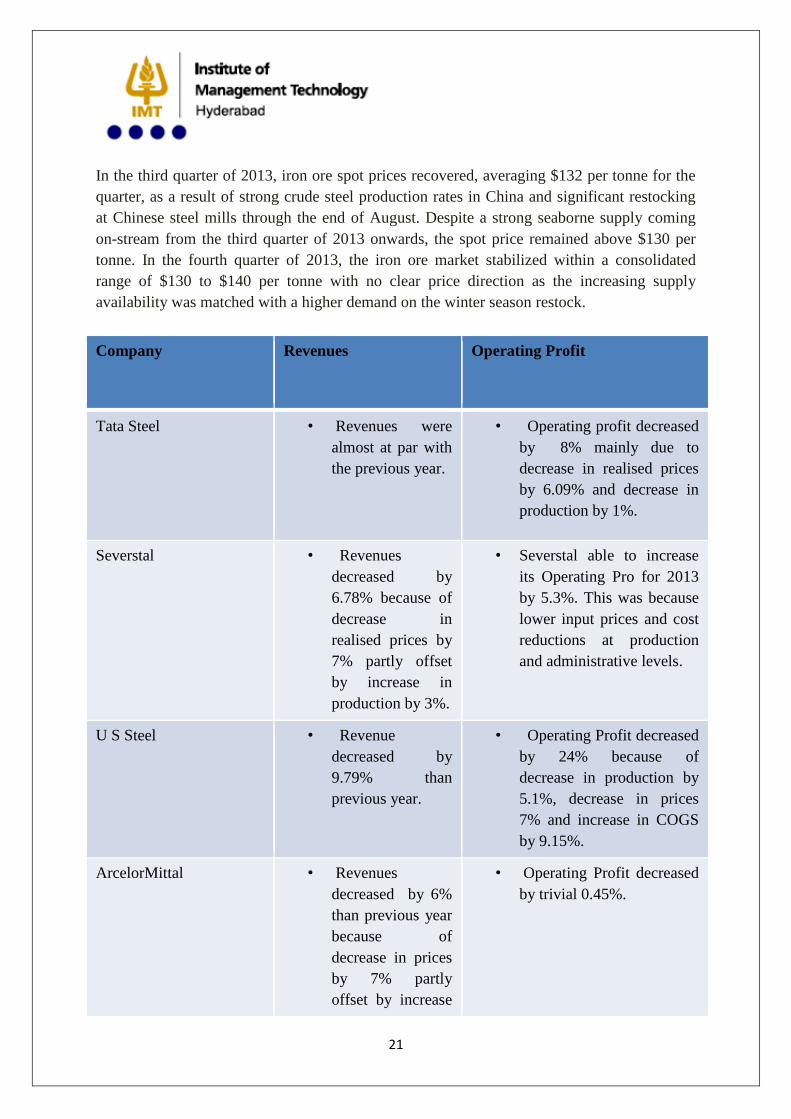
In the third quarter of 2013, iron ore spot prices recovered, averaging $132 per tonne for the
quarter, as a result of strong crude steel production rates in China and significant restocking
at Chinese steel mills through the end of August. Despite a strong seaborne supply coming
on-stream from the third quarter of 2013 onwards, the spot price remained above $130 per
tonne. In the fourth quarter of 2013, the iron ore market stabilized within a consolidated
range of $130 to $140 per tonne with no clear price direction as the increasing supply
availability was matched with a higher demand on the winter season restock.
Company Revenues Operating Profit
Tata Steel • Revenues were
almost at par with
the previous year.
• Operating profit decreased
by 8% mainly due to
decrease in realised prices
by 6.09% and decrease in
production by 1%.
Severstal • Revenues
decreased by
6.78% because of
decrease in
realised prices by
7% partly offset
by increase in
production by 3%.
• Severstal able to increase
its Operating Pro for 2013
by 5.3%. This was because
lower input prices and cost
reductions at production
and administrative levels.
U S Steel • Revenue
decreased by
9.79% than
previous year.
• Operating Profit decreased
by 24% because of
decrease in production by
5.1%, decrease in prices
7% and increase in COGS
by 9.15%.
ArcelorMittal • Revenues
decreased by 6%
than previous year
because of
decrease in prices
by 7% partly
offset by increase
• Operating Profit decreased
by trivial 0.45%.
22
in shipments by
0.6%.
4.4 2014 Global Outlook:-
More than five years after the 2008/2009 global recession ended, the global recovery is far
from robust. Global GDP growth picked up only marginally in 2014, to 2.6% year-on-year,
from 2.5% in 2013 and 2.6% in 2012. In particular, global GDP growth in 2014 was lower
than initially expected, continuing a pattern of disappointing outturns over the past several
years. While activity in the United States and the United Kingdom has gained momentum as
labor markets heal and monetary policy remains extremely accommodative, the recovery in
the eurozone slowed due to concerns about long-term prospects, deflation risks and the
unresolved sovereign debt crises.
U S:-
In the United States, apart from a temporary contraction at the beginning of 2014, GDP
growth has been strong and in the third quarter of 2014 reached its fastest pace since 2003 at
5% annualized.
The recovery has been supported by the highly accommodative monetary policy although the
Federal Reserve gradually reduced the monthly volume of asset purchases and ceased them
completely in October 2014. Improving labor markets have been marked by robust job
creation (averaging 246,000 jobs per month in 2014) and gradually increasing, although
relatively modest wage growth. In 2014, construction spending increased by 6.1% year-on-
year as rising incomes and improving confidence supported a pick-up in non-residential
construction in particular (growing by 6.9% year-on-year).
Eurozone:-
Driven by a strong recovery in the United Kingdom, EU GDP increased approximately 1.3%
in 2014, after stagnating in 2013 (+0.1%) and falling by 0.4% in 2012. Eurozone activity has
been weak, especially in France and Italy, but the overall eurozone GDP growth increased
only around 0.9% in 2014 from a contraction of -0.4% in 2013. Concerns about long-term
prospects, deflation and the legacies of the economic and sovereign debt crises (especially
impaired balance sheets and high unemployment) have weighed on a gradual recovery.
23
China:-
In China, the impact of policy measures to contain financial vulnerabilities was mitigated by
offsetting policy measures to avoid a sharper slowdown. As a result, GDP growth has slowed
to around 7.4% in 2014 from 7.7% in 2013, as actions to rein in credit growth slowed the real
estate market and investment. These measures were complemented by efforts to curb activity
in sectors with overcapacity or that are environmentally polluting.
India:-
India’s GDP growth has slowed down to 5% in 2013 on account of rising inflation and tight
monetary controls. This has led to weak domestic steel demand, which grew by 3.3% in 2013
in spite of rise in demand in the last quarter. This has resulted in India becoming the net
exporter of steel in Financial Year 2013-14 after a gap of six years. Total steel exports by
India during the Financial Year stood at 5.59 million tonnes, as against imports of 5.44
million tonnes.
Steel Prices:-
Q1:- Steel prices in Northern Europe remained steady during the first quarter of 2014, spot
hot rolled coil (“HRC”) prices around €445-455 ($610-620) per tonne (“/t”). In Southern
Europe, prices were also stable quarter on quarter, with spot HRC prices around €425-440
($585-610)/t.
Q2:- But the price trend reversed by the end of the first quarter as lower raw material costs
were incorporated into prices by foreign and domestic competitors. Growth in economic
activity and overall steel demand continued in Europe during the second quarter of 2014;
while prices stabilized despite continued downward pressure of declining iron ore prices.
Spot HRC prices stabilized at a lower level of €420-430 ($575-595)/t in Northern Europe and
€410-420 ($565-575)/t in Southern Europe, keeping imports relatively unattractive, despite
continuously falling raw material costs.
Q3:- Geo-political instability in Ukraine and Euro depreciation eased pressure from imports,
which helped domestic prices pick up during August/September versus a weak July. Third
quarter spot HRC in Northern Europe averaged €415-425 ($550-560)/t, while at €410-420
($545-555)/t in Southern Europe prices were unchanged from the second quarter in Euro
terms.
Q4:- Despite good sentiment, buyers stayed cautious during the fourth quarter, as downward
raw material price pressure increased. Spot HRC prices in Northern Europe declined to €410-
415 ($510-520)/t, while in Southern Europe they declined to €400-410 ($500-515)/t. The
weaker Euro helped keep imports unattractive.
24
Iron Ore Prices:-
In the first half of 2014, iron ore spot prices declined by 31% from $134.50 per tonne on
January 1, 2014 to $93.25 per tonne on June 30, 2014. This downward price trend was due to
increasing supply in the seaborne market and financial weakness in the Chinese steel sector.
Credit market tightness combined with stretched cash flows at Chinese mills resulted in a
strong destocking trend at Chinese mills from the beginning of the year through the end of the
second quarter. Rising iron ore import inventory at Chinese ports was reflective of stronger
seaborne supply while real iron ore demand in the Chinese off-shore market remained
relatively stable.
The downward trend continued and reached the lowest level at $66-69 per tonne in late
December 2014 on continued structural iron ore oversupply and persistent strains in the credit
market in China. The average spot price for the fourth quarter was $74 per tonne, or 18%
lower than previous quarter at $90 per tonne. As of end of January 2015, iron ore spot prices
were trading in the range of $62-69 per tonne.
Coal Prices:-
Due to the combined effects of strong Australian coking coal production performance and
weaker seaborne demand in key importing regions, the coking coal spot market has been on a
downward trend since the beginning of 2014. The spot price of a premium hard coking coal
from Australia declined from $132-133 per tonne FOB Australia in January 2014 to $110-
111 per tonne by the end of June 2014 and then stabilized in the range of $108-112 per tonne
during the second half.
The third quarter contract settlement of 2014 was a rollover of the second quarter prices of
2014, at $120 per tonne FOB Australia, and was supported by continued strong seaborne
supply, mainly from Australia, and lower seaborne imports from China.
The coking coal market fundamentals remained stable in the fourth quarter with stable supply
and demand conditions. The reference for the fourth quarter of 2014 was settled at $119 per
tonne.
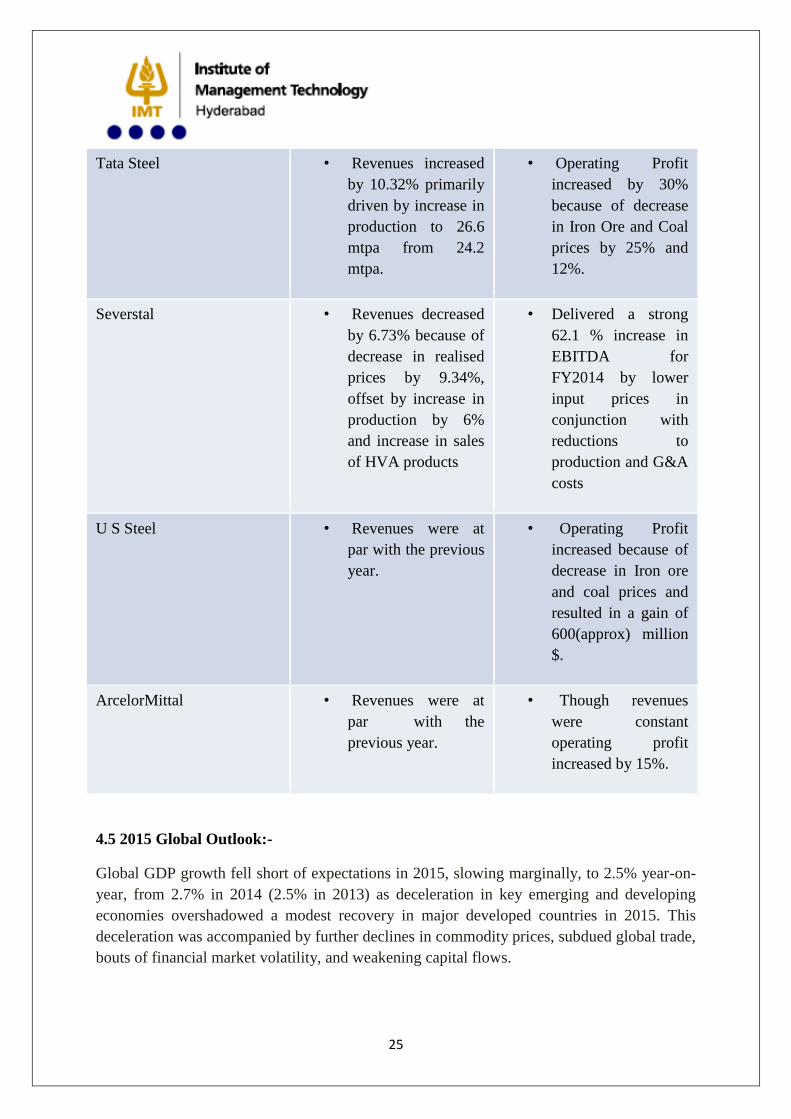
Company Revenues Operating Profit
25
Tata Steel • Revenues increased
by 10.32% primarily
driven by increase in
production to 26.6
mtpa from 24.2
mtpa.
• Operating Profit
increased by 30%
because of decrease
in Iron Ore and Coal
prices by 25% and
12%.
Severstal • Revenues decreased
by 6.73% because of
decrease in realised
prices by 9.34%,
offset by increase in
production by 6%
and increase in sales
of HVA products
• Delivered a strong
62.1 % increase in
EBITDA for
FY2014 by lower
input prices in
conjunction with
reductions to
production and G&A
costs
U S Steel • Revenues were at
par with the previous
year.
• Operating Profit
increased because of
decrease in Iron ore
and coal prices and
resulted in a gain of
600(approx) million
$.
ArcelorMittal • Revenues were at
par with the
previous year.
• Though revenues
were constant
operating profit
increased by 15%.
4.5 2015 Global Outlook:-
Global GDP growth fell short of expectations in 2015, slowing marginally, to 2.5% year-on-
year, from 2.7% in 2014 (2.5% in 2013) as deceleration in key emerging and developing
economies overshadowed a modest recovery in major developed countries in 2015. This
deceleration was accompanied by further declines in commodity prices, subdued global trade,
bouts of financial market volatility, and weakening capital flows.
26
U S:-
Domestic demand in the United States was supported by robust consumption and investment,
with the exception of the oil sector. U.S. GDP growth in 2015 is estimated at 2.5%, the
highest annual rate in the post-2008 crisis period. Solid labor market conditions and low oil
prices continue to support a consumption-led recovery, with automotive sales growing by
over 5% year-on-year in 2015 to a record of 17.4 million. Nominal construction spending
increased by around 10% year-on-year in 2015, with strong growth in both residential and
non-residential construction. The weakness in net exports is the result of the strong dollar and
softness in external demand, particularly from large emerging markets.
The demand has been negatively impacted by inventory movements, particularly during 2014
when inventories rose significantly on the back of a rapid increase in imports and were up
almost 40% over 2013. This led to stockists purchasing over six million fewer tonnes in
2015, as compared to 2014, as they sought to reduce inventory levels as steel prices declined.
Eurozone:-
European Union (EU) GDP growth picked up in 2015 to around 1.8%, as domestic demand
strengthened and Eurozone exports were supported by euro depreciation. Low oil prices and
improving financing conditions are supporting consumer spending and investment. Indeed,
EU automotive sales grew by 9% year-on-year in 2015 to 13.7 million their highest level
since 2009.
China:-
China became more pronounced in 2015 with GDP growth slowing in 2015 to an estimated
6.9%, down from 7.3% in 2014. In line with rebalancing efforts, the deceleration in activity
during 2015 has been most visible in heavy industry and real estate sectors with considerable
overcapacity and, in the case of heavy industry, a high presence of state-owned enterprises.
Weaker manufacturing growth and declining construction activity has significantly impacted
import demand, which contracted in the first half of 2015.
Brazil and Russia:-
Brazil and Russia have taken a turn for the worse as a result of global and domestic
headwinds, and the weakness in oil and other commodity prices, with both countries
experiencing deepening contractions, above-target inflation, and deteriorating public
finances. In contrast to other major developing countries, growth in India remained robust,
buoyed by strong investor sentiment and the positive effect on real incomes of the recent fall
in oil prices.
27
India:-
Financial Year 2014-15 saw India emerge as a bright spark even as advanced and emerging
economies grappled with uncertainty and slower growth Indian rupee was one of the best
performers in the world, registering a 4% decline in value as against the US$ compared to the
rest of the world grappling with devaluation of their currencies. However, domestic steel
producers witnessed subdued sales as increased imports from China and Russia resulted in
sharp cut to steel prices in India over the past six months.
Steel Prices:-
Q1:- A balanced market, low interest rates and steady demand for durables, coupled with the
weak euro, helped improve the steel market in the first quarter of 2015. In Northern Europe
the price for hot rolled coil (“HRC”) improved slightly from January to March, to an average
of €405-413 ($458-467) per tonne (/t) for the first quarter of 2015. Prices saw a similar trend
in Southern Europe, with spot HRC improving to €395-404 ($446-456)/ t, while a weaker
euro impacted the realization of this improvement in USD terms both in Northern and
Southern Europe by roughly -$50 quarter on quarter.
The steel market was nevertheless challenging, due to high inventories and buyer caution in
placing orders. A strong USD continued to encourage imports during the first quarter of
2015, with South Korea, Japan, Germany and Australia quickly taking over volumes upon the
termination of an export suspension agreement with Russia in December 2014. Domestic
prices declined, especially during February and March, following declines in Scrap #1
Busheling, which fell from $369 per gross tonne (“/GT”) in January to $255/GT in March.
Spot HRC prices during the first quarter of 2015 dropped from a $631/t average in January to
$531/t in March, for a quarterly average of $578/t.
Q2:- Economic conditions remained good in Europe during the second quarter of 2015, with
strong bookings in industry and auto. Despite this, steel prices saw consistent weakening on a
monthly basis from April to June, due mainly to pressure from imports. Spot HRC averaged
at €398-405 ($440- 448)/t in Northern Europe and at €385-393 ($425-435)/t in Southern
Europe.
Q3:- Aggressive domestic offers at the beginning of the third quarter, coupled with low-
priced imports from Turkey, Russia and China, kept prices in Europe under pressure, and
HRC spot saw a drop of approximately €27/$27 quarter on quarter, in Northern Europe, to
€372-378 ($414-420)/t and €37/$38/t, in Southern Europe, to €348-357 ($387-397)/t.

28
Q4:- Eurozone consumer confidence dropped to a nine-month low in October, while the gap
in the offer price for steel in northern vs. southern Europe continued to feed expectations for
price declines. HRC spot further weakened during the fourth quarter to €325-335 ($357-
368)/t in Northern Europe and to €293-304 ($322-333)/t in Southern Europe.
Demand for both scrap and finished steel during the fourth quarter remained weak due to
destocking and Scrap #1 Busheling fell to $167-180/GT, pushing HRC spot price down
approximately $70 quarter on quarter, to an average of 421-438/t.
Iron Ore Prices:-
The downward trend of iron ore prices persisted through 2015, with quarterly averages spot
prices of $62.40 per tonne in the first quarter of 2015, $58.45 per tonne in the second quarter,
$54.90 per tonne in the third quarter and $46.65 per tonne in the fourth quarter (CFR China,
Platts index, 62% Fe). This downward trend has been supported by continued structural
oversupply, resilience of high cost mines (in China and seaborne), lower mining costs at
major supply regions (supported by currency depreciation, e. g. in Australia and Brazil),
lower fuel and freight costs as well as bearish sentiment about Chinese steel demand.
Coal Prices:-
Due to the combined effects of strong Australian coking coal production performance, the
mild wet season in Australia and weaker seaborne demand from China, the coking coal spot
market and quarterly contracts settlements have been on a downward trend in 2014 and 2015.
Moreover, in the same period there was an increase of seaborne supply from new regions,
notably Russia and Mozambique, as well as productivity improvement and cost reductions at
major producers also supported by depreciated local currencies and lower diesel prices. This
downward trend prevailed despite some supply closures, e.g. major seaborne suppliers of
coking coal from Australia, the United States, and Canada announced the closure of their
least cost efficient mines in order to adjust to weaker seaborne demand and to remain cost
competitive.
Quarterly contract references settled at $117 per tonne (FOB Australia) and $109.50 per
tonne for the first and second quarters of 2015, respectively. In the third quarter of 2015,
premium coking coal spot prices reached a low of $79 per tonne (FOB Australia). Contract
settlement further reduced in the fourth quarter of 2015, where contract prices settled at $89
per tonne.
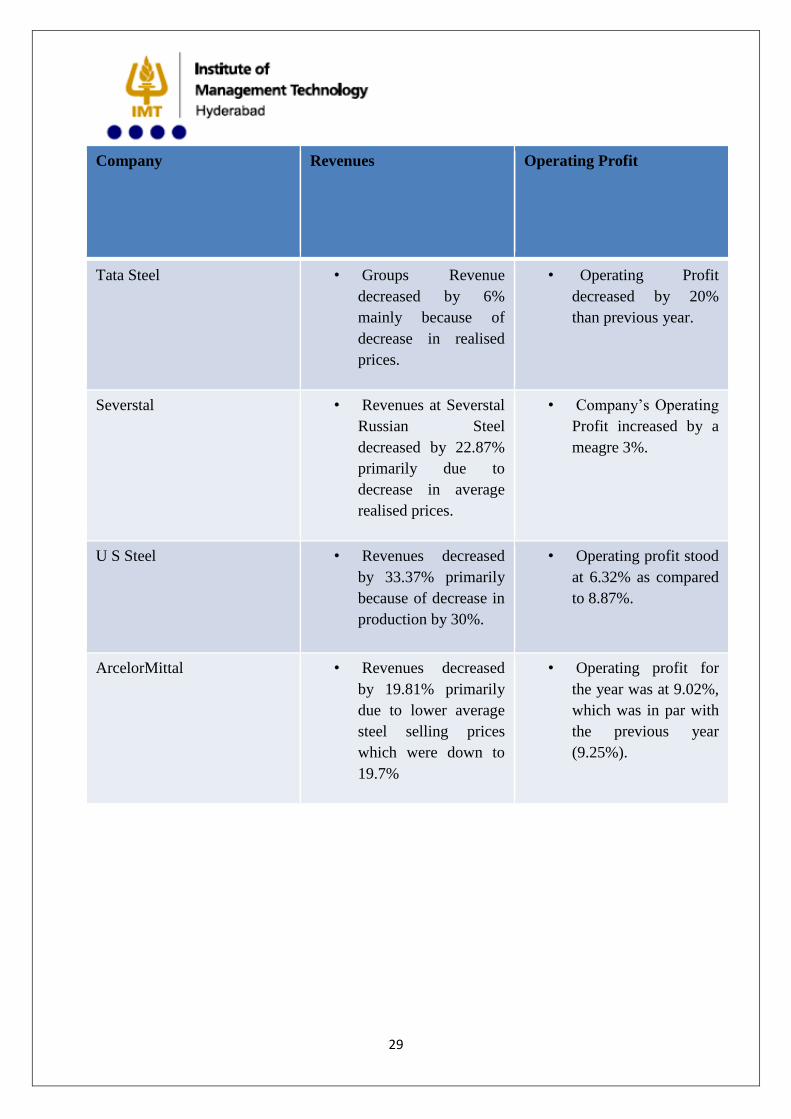
29
Company Revenues Operating Profit
Tata Steel • Groups Revenue
decreased by 6%
mainly because of
decrease in realised
prices.
• Operating Profit
decreased by 20%
than previous year.
Severstal • Revenues at Severstal
Russian Steel
decreased by 22.87%
primarily due to
decrease in average
realised prices.
• Company’s Operating
Profit increased by a
meagre 3%.
U S Steel • Revenues decreased
by 33.37% primarily
because of decrease in
production by 30%.
• Operating profit stood
at 6.32% as compared
to 8.87%.
ArcelorMittal • Revenues decreased
by 19.81% primarily
due to lower average
steel selling prices
which were down to
19.7%
• Operating profit for
the year was at 9.02%,
which was in par with
the previous year
(9.25%).
30
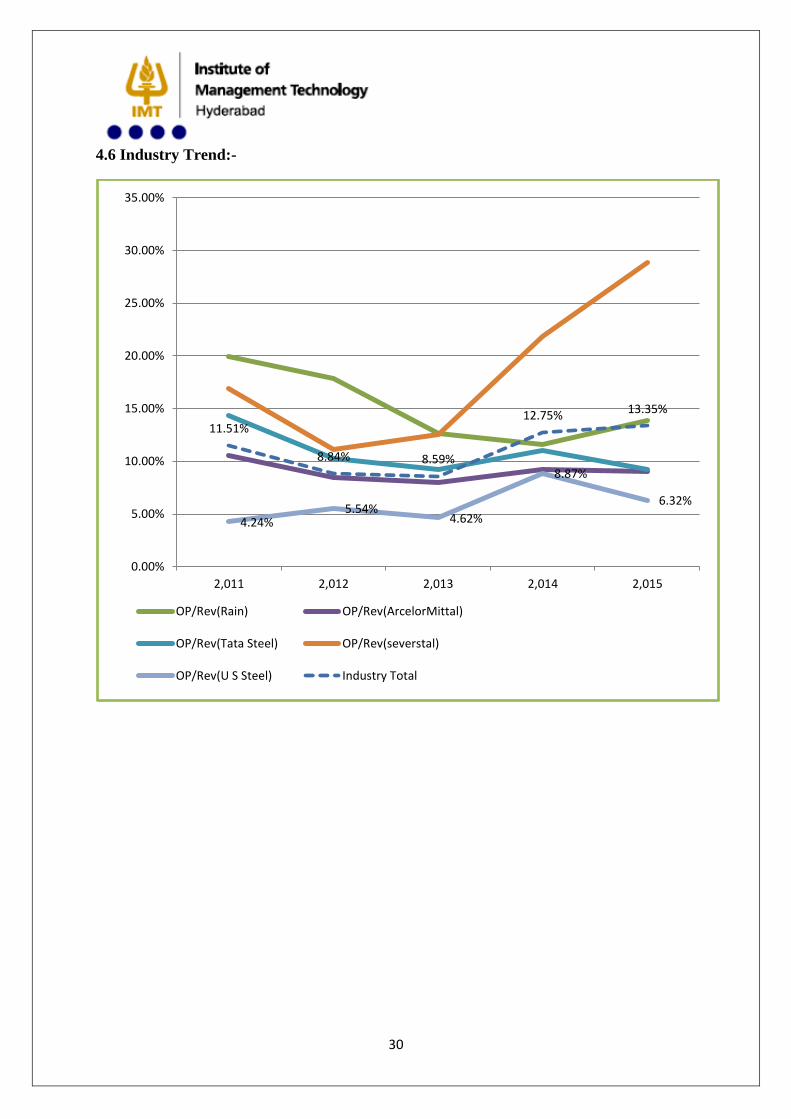
4.6 Industry Trend:-
4.24%5.54%
4.62%
8.87%
6.32%
11.51%
8.84% 8.59%
12.75% 13.35%
0.00%
5.00%
10.00%
15.00%
20.00%
25.00%
30.00%
35.00%
2,011 2,012 2,013 2,014 2,015
OP/Rev(Rain) OP/Rev(ArcelorMittal)
OP/Rev(Tata Steel) OP/Rev(severstal)
OP/Rev(U S Steel) Industry Total
31
5 Macroeconomic Factors Effecting Steel Industry:-
5.1 Market Risk:-
Changes in Demand:- Demand for steel products depends on the economic
growth in different regions of the world and demand in metal-intensive
industries. Steel business is especially sensitive to changes of demand in the
machinery, construction and oil and gas industries. Unlike past years, demand
for steel in the world market will be growing minimally or may even decrease
in absolute figures compared to 2008.
Fluctuation in the Prices of Raw Materials, Energy and Services:- Steel
Industry consumes significant volumes of raw materials such as coking coal,
iron ore, ferroalloys and base metals, as well as electricity, natural gas and
industrial gasses. Since the fourth quarter of 2008, prices of raw materials for
steel production are decreasing due to the world financial crisis, deteriorating
demand and market pressure from the steel industry. Timing and volumes of
raw material deliveries can be significant factors which can easily run out of
control for Steel Industry, in particular the rapid suspension of production due
to lack of steel demand along with slow changes of the prices and tariffs for
raw materials and energy resources, and tariffs remaining high for land
transport services. Steel Industry also depends on relationships and contracts
with the major suppliers of raw materials, energy resources and services
worldwide.
Changes in Selling Prices:- One of the specific features of steel and mining
industries is their liability to cyclical changes of steel prices. Positive price
conditions that had existed before the fourth quarter of 2008 were replaced by
the sharp fall of prices.
Competition:- The current economic situation may cause serious change in
peer competition in the industry. There is a threat of competition from
alternative materials which due to their features can replace steel in auto
making, construction, pipe production, production of packing materials.
5.2 Financial Risks:-
Credit Risks
Financial Institution
Interest Rate Risks:- The financial crisis resulted in increased volatility and increased
risk premiums in the debt financing. These factors may limit Steel companies access
to financial markets. Increased cost of financing may negatively affect the financial
32
results and lead to lower return on investments. Fluctuations of interest rates may
affect future cash flows. Interest rates are either fixed or floating and normally linked
to LIBOR or EURIBOR.
Exchange Rate Fluctuations:- Steel manufacturers may be affected by exchange rate
risks if they acquire assets or liabilities nominated in currencies other than their
functional currency.
5.3 Operational Risks:-
Investment Effectiveness
Equipment technical conditions Risk:- Production activities may be affected by risks
in the technical condition of equipment. Incidents may lead to stoppage in production,
idle time, decreasing production volumes and breach of quality standards.
Loss of key competencies, skills and knowledge due to reduction of employees during
the slowdown:- Deteriorating demand for steel caused by the economic downturn
demands less workforce. However, the uncertainty of the situation and necessity for
further staff reduction leads to an increasing risk of losing valuable industry expertise,
knowledge and skills, both technical and managerial.
Health, safety and environment risks:- The mining and steel industries present
potential hazards to the environment and to people because the production process
includes high temperatures and aggressive chemicals, and creates both solid and
liquid industrial waste. This results in strict requirements being applied to mining and
steel companies regarding occupational health and safety, fire protection and
environmental safety.
5.4 Legislation and Regulatory Risk:-
Taxes legislation changes
Licensing legislation changes
Legislation and regulation risks management policies.
5.5 Data Collected:-Secondary data given by the company.
5.6 Statistical Tool:- Excel, Power Point.
5.7 Limitations of the Study:-Due to limited time duration of the research an exhaustive
study on the research could not be performed.
5.8 Project Start Date:- 8th March 2016.
5.9 Project End Date:- 10th June 2016.
5.10 Project Duration:- 14 weeks.
33
6. Conclusion:-
• From the above Industry Trend graph, Rain Industry Performance is not completely
dependent on Steel Industry.
34
7. References:-
http://www.tatasteel.com/investors/performance/annual-report.asp.
http://www.rain-industries.com/Investors.html.
https://www.severstal.com/eng/ir/results_and_reports/annual_reports/index.phtml.
http://corporate.arcelormittal.com/investors/financial-reports/annual-reports.
https://www.ussteel.com/uss/portal/home/investors/annualreports.
https://www.thyssenkrupp.com/en/publikationen/geschaeftsberichte.html.
From the above references we can get the annual reports of the companies, which were used
in the research.