1584 IEEE TRANSACTIONS ON IMAGE PROCESSING, VOL. 16, …
12
1584 IEEE TRANSACTIONS ON IMAGE PROCESSING, VOL. 16, NO. 6, JUNE 2007 Detecting Wide Lines Using Isotropic Nonlinear Filtering Laura Liu, David Zhang, Senior Member, IEEE, and Jane You, Member, IEEE Abstract—Lines provide important information in images, and line detection is crucial in many applications. However, most of the existing algorithms focus only on the extraction of line posi- tions, ignoring line thickness. This paper presents a novel wide line detector using an isotropic nonlinear filter. Unlike most existing edge and line detectors which use directional derivatives, our pro- posed wide line detector applies a nonlinear filter to extract a line completely without any derivative. The detector is based on the isotropic responses via circular masks. A general scheme for the analysis of the robustness of the proposed wide line detector is in- troduced and the dynamic selection of parameters is developed. In addition, this paper investigates the relationship between the size of circular masks and the width of detected lines. A sequence of tests has been conducted on a variety of image samples and our ex- perimental results demonstrate the feasibility and effectiveness of the proposed method. Index Terms—Curvilinear structures, feature extraction, isotropic nonlinear filter, line detection, wide line detector. I. INTRODUCTION T HE analysis of images in the fields of pattern recognition and computer vision generally requires the detection of lines, also called curvilinear structures, from grayscale images. Line detection plays an important role for the success of higher level processing such as matching and recognition [1]–[6]. So far, many algorithms for line detection have been developed for different applications. The Hough transform [7]–[9], which is a widely used line detection method, was initially proposed to find analytically defined curvilinear structures (e.g., straight lines, circles, ellipses, etc.). Although the generalized Hough trans- form [10] can be used to detect arbitrary curvilinear structures in theory, it requires the complete specification of the exact shape of the curvilinear structure which is very difficult and even un- feasible for complex curvilinear structures in practice. One pow- erful approach is based on edge extraction and treats lines as objects with parallel edges [11]–[16]. An edge extraction algo- rithm [17] is first used to find all the edges in the image. The edge Manuscript received January 18, 2006; revised January 29, 2007. This work was supported in part by the UGC/CRC fund from the HKSAR Government, in part by the central fund from the Hong Kong Polytechnic University, and in part by the National Science Foundation of China under Contract 60332010. The associate editor coordinating the review of this manuscript and approving it for publication was Dr. Giovanni Ramponi. The authors are with Biometric Research Centre, Department of Com- puting, The Hong Kong Polytechnic University, Kowloon, Hong Kong (e-mail: [email protected]; [email protected]; [email protected]). Color versions of one or more of the figures in this paper are available online at http://ieeexplore.ieee.org. Digital Object Identifier 10.1109/TIP.2007.894288 image is then analyzed to find the particular lines. However, the success of this approach depends on the accuracy of edges and the line thickness was not considered. Another popular ap- proach is to use differential geometric properties to extract lines as ridges and valleys in the image [18]–[23]. A popular ridge detector [24] is based on the eigenvectors of the Hessian matrix which is given by the local second order derivatives. This de- tector extracts the ridges as points for which the intensities are maxima or minima in the main principal curvature direction, i.e., the direction of the maximum eigenvalue of the Hessian matrix. Nevertheless, this approach is sensitive to noise due to the use of second order of derivatives. Although the line position detection is important, it would be useful if all the line’s pixels (i.e., the pixels that comprise the full cross-sectional width) were also extracted. Koller et al. [25] presented an edge-based line finder for extracting line structures and their widths. This line finder employs the first derivative of Gaussian edge detectors and combines their outputs nonlinearly. This approach can detect lines of arbitrary widths by iterating in scale space and selecting as the line width the scale that yields the maximum of a scale-normalized response. However, due to the quantization of the scale space, this approach is computa- tionally expensive and gives only a coarse estimate of the line width. Steger [26] proposed a ridge-based line detector which uses a line model with an asymmetrical profile to remove the bias of the line position as well as to extract the line width. This line detector overcomes the problem that the ridge-based line detection approach will return inaccurate line locations when the contrast on one side of the line is different from the contrast on the other side of the line. Moreover, since Gaussian masks are used to estimate the derivatives of the image, the line detector can scale to lines of arbitrary widths. Although this approach is useful for line width information detection, it has its limitations. Since this approach extracts lines as the maxima of the mag- nitude of the second directional derivatives, it can detect only salient lines. Also, once the selected becomes so large that neighboring lines start to influence each other, the line model will fail and the results will deteriorate. The two line detection approaches, however, do not detect the whole of the line. A line, mathematically, is a 1-D figure without thickness, but an image line generally appears as a line of one or several pixels wide, i.e., as a thin/narrow or thick/wide line, having linear or curvilinear structures. In image processing and pattern recognition applications, line thickness or a line’s full cross section is important in, for example, segmenting multiple orientation lines [27], in recognizing roads, railroads, or rivers from satellite or aerial imagery [11], [21], in extracting anatom- ical features in medical imaging for diagnoses [24], [28], [29], 1057-7149/$25.00 © 2007 IEEE
Transcript of 1584 IEEE TRANSACTIONS ON IMAGE PROCESSING, VOL. 16, …
1584 IEEE TRANSACTIONS ON IMAGE PROCESSING, VOL. 16, NO. 6, JUNE 2007
Detecting Wide Lines UsingIsotropic Nonlinear Filtering
Laura Liu, David Zhang, Senior Member, IEEE, and Jane You, Member, IEEE
Abstract—Lines provide important information in images, andline detection is crucial in many applications. However, most ofthe existing algorithms focus only on the extraction of line posi-tions, ignoring line thickness. This paper presents a novel wide linedetector using an isotropic nonlinear filter. Unlike most existingedge and line detectors which use directional derivatives, our pro-posed wide line detector applies a nonlinear filter to extract a linecompletely without any derivative. The detector is based on theisotropic responses via circular masks. A general scheme for theanalysis of the robustness of the proposed wide line detector is in-troduced and the dynamic selection of parameters is developed. Inaddition, this paper investigates the relationship between the sizeof circular masks and the width of detected lines. A sequence oftests has been conducted on a variety of image samples and our ex-perimental results demonstrate the feasibility and effectiveness ofthe proposed method.
Index Terms—Curvilinear structures, feature extraction,isotropic nonlinear filter, line detection, wide line detector.
I. INTRODUCTION
THE analysis of images in the fields of pattern recognitionand computer vision generally requires the detection of
lines, also called curvilinear structures, from grayscale images.Line detection plays an important role for the success of higherlevel processing such as matching and recognition [1]–[6]. Sofar, many algorithms for line detection have been developed fordifferent applications. The Hough transform [7]–[9], which is awidely used line detection method, was initially proposed to findanalytically defined curvilinear structures (e.g., straight lines,circles, ellipses, etc.). Although the generalized Hough trans-form [10] can be used to detect arbitrary curvilinear structures intheory, it requires the complete specification of the exact shapeof the curvilinear structure which is very difficult and even un-feasible for complex curvilinear structures in practice. One pow-erful approach is based on edge extraction and treats lines asobjects with parallel edges [11]–[16]. An edge extraction algo-rithm [17] is first used to find all the edges in the image. The edge
Manuscript received January 18, 2006; revised January 29, 2007. This workwas supported in part by the UGC/CRC fund from the HKSAR Government, inpart by the central fund from the Hong Kong Polytechnic University, and in partby the National Science Foundation of China under Contract 60332010. Theassociate editor coordinating the review of this manuscript and approving it forpublication was Dr. Giovanni Ramponi.
The authors are with Biometric Research Centre, Department of Com-puting, The Hong Kong Polytechnic University, Kowloon, Hong Kong(e-mail: [email protected]; [email protected];[email protected]).
Color versions of one or more of the figures in this paper are available onlineat http://ieeexplore.ieee.org.
Digital Object Identifier 10.1109/TIP.2007.894288
image is then analyzed to find the particular lines. However,the success of this approach depends on the accuracy of edgesand the line thickness was not considered. Another popular ap-proach is to use differential geometric properties to extract linesas ridges and valleys in the image [18]–[23]. A popular ridgedetector [24] is based on the eigenvectors of the Hessian matrixwhich is given by the local second order derivatives. This de-tector extracts the ridges as points for which the intensities aremaxima or minima in the main principal curvature direction, i.e.,the direction of the maximum eigenvalue of the Hessian matrix.Nevertheless, this approach is sensitive to noise due to the useof second order of derivatives.
Although the line position detection is important, it would beuseful if all the line’s pixels (i.e., the pixels that comprise thefull cross-sectional width) were also extracted. Koller et al. [25]presented an edge-based line finder for extracting line structuresand their widths. This line finder employs the first derivative ofGaussian edge detectors and combines their outputs nonlinearly.This approach can detect lines of arbitrary widths by iterating inscale space and selecting as the line width the scale that yieldsthe maximum of a scale-normalized response. However, due tothe quantization of the scale space, this approach is computa-tionally expensive and gives only a coarse estimate of the linewidth. Steger [26] proposed a ridge-based line detector whichuses a line model with an asymmetrical profile to remove thebias of the line position as well as to extract the line width. Thisline detector overcomes the problem that the ridge-based linedetection approach will return inaccurate line locations whenthe contrast on one side of the line is different from the contraston the other side of the line. Moreover, since Gaussian masks areused to estimate the derivatives of the image, the line detectorcan scale to lines of arbitrary widths. Although this approach isuseful for line width information detection, it has its limitations.Since this approach extracts lines as the maxima of the mag-nitude of the second directional derivatives, it can detect onlysalient lines. Also, once the selected becomes so large thatneighboring lines start to influence each other, the line modelwill fail and the results will deteriorate.
The two line detection approaches, however, do not detect thewhole of the line. A line, mathematically, is a 1-D figure withoutthickness, but an image line generally appears as a line of oneor several pixels wide, i.e., as a thin/narrow or thick/wide line,having linear or curvilinear structures. In image processing andpattern recognition applications, line thickness or a line’s fullcross section is important in, for example, segmenting multipleorientation lines [27], in recognizing roads, railroads, or riversfrom satellite or aerial imagery [11], [21], in extracting anatom-ical features in medical imaging for diagnoses [24], [28], [29],
1057-7149/$25.00 © 2007 IEEE

LIU et al.: DETECTING WIDE LINES USING ISOTROPIC NONLINEAR FILTERING 1585
and in detecting biometric traits for personal authentication [30].It is, thus, important to detect not simply the line edges but ratherthe whole of the line.
In this paper, which has partly appeared in a preliminary formin [31], we present a robust method to detect the whole of theline, which we call the wide line detector. This wide line de-tector is implemented by employing a nonlinear filter withoutthe use of any derivative. Isotropic responses are obtained byusing circular masks which contain either a normalized constantweighting or a Gaussian profile. We restrict the sizes of circularmasks so as to ensure that lines of different widths can be ex-tracted in their entirety. We also design a line model which cananalyze the robustness of the proposed wide line detector andwhich allows the automatic selection of parameters.
The paper is organized as follows. Section II introduces theline model and the relevant design issues. Section III presentsthe isotropic nonlinear filter based line detection method. InSection IV, we analyze the robustness of the proposed methodand show how to automatically select parameters. Section Vdescribes the results of our experiments. Section VI offers ourconclusion.
II. MODEL DESIGN
In this section, we first introduce the models for line profilesin 1-D and then describe the design issues for the proposed linedetection method with particular reference to 2-D line detection.
A. One-Dimensional Line Profile Model
Many line detection approaches model lines in 1-D as bar-shaped [25], i.e., the ideal line of width and height isassumed to have a profile given by [26]
(1)
However, the flatness of this profile is rarely found in real im-ages. Generally speaking, in terms of different gray levels, thereare three regions in a line image: the line part having a gray level
, the edge region having a gray level , and the back-ground having a gray level . As an example, consider abright line on a dark background, then we get
. In this paper, therefore, a model for the common line pro-file in 1-D, the edge-based bar-shaped line, is defined as
(2)
where and and is a scale or a vector,which represents height in the 1-D case and intensity in the 2-Dcase. For a bright line, also called a positive line, . For adark line, also called a negative line, .
B. Two-Dimensional Line Detection
We now address the design issues for the proposed line detec-tion method. Fig. 1 shows a dark line in 2-D based onthe 1-D ideal line model as in (1). A circular mask is shown atfour image positions in Fig. 1. The detector groups pixels whosebrightness is similar to the brightness at the center of the mask
Fig. 1. Four circular masks at different positions on a line image based on the1-D ideal line model IL as in (1).
into a weighted mask having similar brightness (WMSB). Thissimilarity can be measured by
ifif
(3)
where is the coordinate of the center, is the coor-dinate of any other pixel within the mask, is the bright-ness of the pixel , and is the brightness contrast threshold.The summation of the outputs within the circular mask givesthe mass of WMSB. According to (3), when the center of themask moves to a line on the image, the WMSB reaches theglobal maximum as the mask lies in a flat region of the image(as the mask shown) and decreases when the center of themask is very near a straight edge (as shown in the mask ) anddecreases even further when very near the straight edge whileremaining nonetheless in the line region (as shown in the mask
). Therefore, the smaller the WMSB mass, the larger the fea-ture response. This is similar to the idea used for edge extractionand corner detection in [32]. Hence, to detect a line completely,the WMSB mass of any pixel on the line should be less than thatof any background pixel.
Now let us consider a general situation: a line with an edge re-gion in 2-D based on the common 1-D line profile as in (2).Fig. 2 provides an illustration in which a dark line is boundedby a gray band against a white background. In proximity to thelines are five circular masks. According to (3), in order to com-pletely detect the line it is necessary that . It isobvious that no matter what value and take in (2), the threedifferent gray level regions (Fig. 3) have only four relations
(4)
Now the question is how the edge region affects the WMSBmass of the line and the background pixels and thereby in-fluences line detection. These matters will be considered inSection IV-B.
III. LINE DETECTION METHOD
The wide line detector is implemented to give isotropic lineresponses by applying a set of rules in a circular mask. Using

1586 IEEE TRANSACTIONS ON IMAGE PROCESSING, VOL. 16, NO. 6, JUNE 2007
Fig. 2. Five circular masks at different positions of a line image based on the1-D common line profile GL as in (2).
Fig. 3. Illustration of gray-level relations between three regions. Gr , Gr ,and Gr are gray levels of the line part, the edge region, and the background,respectively. The difference of the gray levels between the line (Gr ) and thebackground (Gr ) is larger than the brightness contrast threshold t (a) with or(b) without larger than 2 � t; (i)–(iv) show the corresponding relations in (4),respectively.
a square kernel, the circular mask is digitally approximated toeither with a constant weighting
ifotherwise
(5)or with a Gaussian profile
(6)
where is the radius of the circular mask. The normalization ofthe circular mask is obtained by the rule
(7)
As is usual when locally processing an image, the mask iscentered on each pixel in the image and the brightness of anyother pixel within the mask is compared with that of the centerpixel. The comparison is determined by the rule defined in (3)along with a weighting function
(8)
TABLE IDEVIATION OF FUNCTION sech((I(x; y)� I(x ; y ))=t) FROM (3). HERE, cIS THE SUBTRACTION OF (11) FROM (3), AND jcj IS THE ABSOLUTE VALUE OF c
where is the output of the weighting comparison. This compar-ison is done for each pixel within the mask. The WMSB massof the center is given by
(9)
The initial line response is the inverse WMSB mass obtainedby
if,otherwise
(10)
Here, is the geometric threshold and , whereis the maximum value which can take (usually
). The fixed threshold for (10) is the theoreticaloptimum which is shown in the later analyses.
According to (3), the comparison varies dramatically whena slight change of the brightness difference occurs very near thebrightness contrast threshold . In order to produce a smoothprofile near the brightness contrast threshold, a hyperbolic se-cant function was used to give a much more stable and sensibleversion of (3) and is defined as
(11)
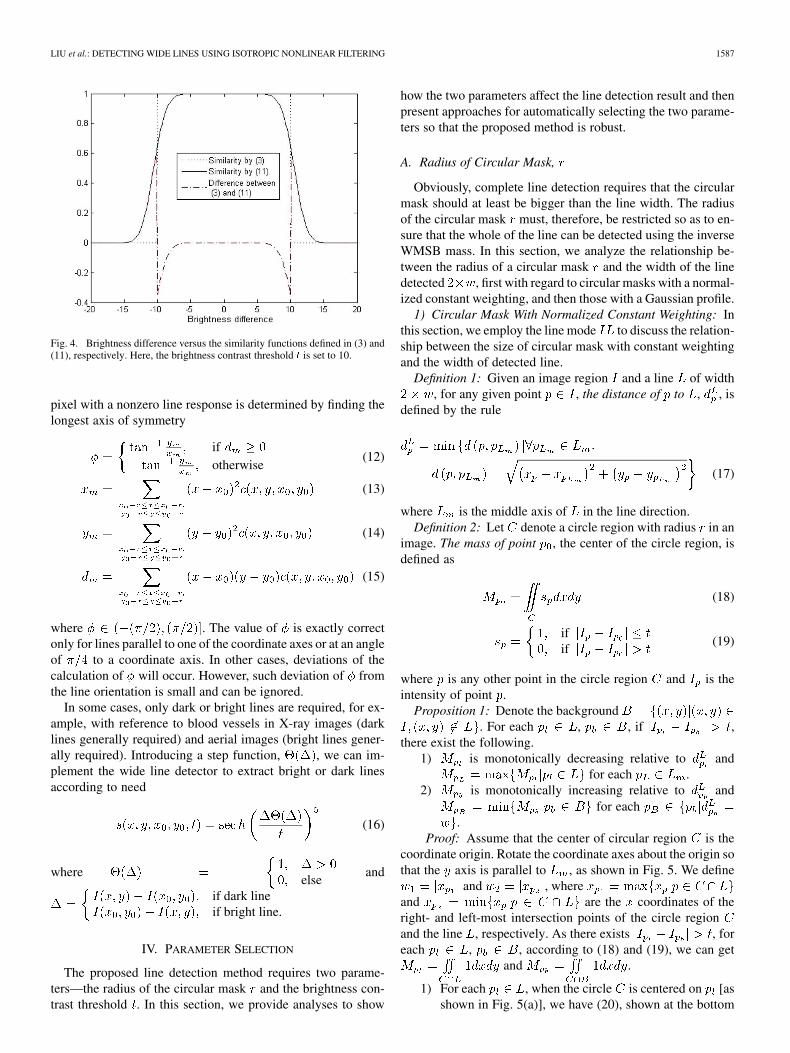
where . The use of the fifth power in-troduces the minimum difference from (3), as shown in Table I.This equation is plotted along with (3) in Fig. 4, where is setto 10. It can be seen that, compared with (3), (11) producesa smoother profile and does not have too large an effect onas a pixel’s brightness changes slightly. This equation makes atradeoff between stability about the threshold and the originalrequirement of the function, which is to take pixels having in-tensities similar to that of the center together into the mass ofthe circular mask.
Although the wide line detector is isotropic and can detectthe whole of a line without the need to find the direction of linepixels, line direction is still necessary either for postprocessingor for application requirements. From (10), the direction of a
LIU et al.: DETECTING WIDE LINES USING ISOTROPIC NONLINEAR FILTERING 1587
Fig. 4. Brightness difference versus the similarity functions defined in (3) and(11), respectively. Here, the brightness contrast threshold t is set to 10.
pixel with a nonzero line response is determined by finding thelongest axis of symmetry
ifotherwise
(12)
(13)
(14)
(15)
where . The value of is exactly correctonly for lines parallel to one of the coordinate axes or at an angleof to a coordinate axis. In other cases, deviations of thecalculation of will occur. However, such deviation of fromthe line orientation is small and can be ignored.
In some cases, only dark or bright lines are required, for ex-ample, with reference to blood vessels in X-ray images (darklines generally required) and aerial images (bright lines gener-ally required). Introducing a step function, , we can im-plement the wide line detector to extract bright or dark linesaccording to need
(16)
whereelse
and
if dark lineif bright line.
IV. PARAMETER SELECTION
The proposed line detection method requires two parame-ters—the radius of the circular mask and the brightness con-trast threshold . In this section, we provide analyses to show
how the two parameters affect the line detection result and thenpresent approaches for automatically selecting the two parame-ters so that the proposed method is robust.
A. Radius of Circular Mask,
Obviously, complete line detection requires that the circularmask should at least be bigger than the line width. The radiusof the circular mask must, therefore, be restricted so as to en-sure that the whole of the line can be detected using the inverseWMSB mass. In this section, we analyze the relationship be-tween the radius of a circular mask and the width of the linedetected , first with regard to circular masks with a normal-ized constant weighting, and then those with a Gaussian profile.
1) Circular Mask With Normalized Constant Weighting: Inthis section, we employ the line mode to discuss the relation-ship between the size of circular mask with constant weightingand the width of detected line.
Definition 1: Given an image region and a line of width, for any given point , the distance of to , , is
defined by the rule
(17)
where is the middle axis of in the line direction.Definition 2: Let denote a circle region with radius in an
image. The mass of point , the center of the circle region, isdefined as
(18)
ifif
(19)
where is any other point in the circle region and is theintensity of point .
Proposition 1: Denote the background. For each , , if ,
there exist the following.1) is monotonically decreasing relative to and
for each .2) is monotonically increasing relative to and
for each.
Proof: Assume that the center of circular region is thecoordinate origin. Rotate the coordinate axes about the origin sothat the axis is parallel to , as shown in Fig. 5. We define
and , whereand are the coordinates of theright- and left-most intersection points of the circle regionand the line , respectively. As there exists , foreach , , according to (18) and (19), we can get
and .
1) For each , when the circle is centered on [asshown in Fig. 5(a)], we have (20), shown at the bottom

1588 IEEE TRANSACTIONS ON IMAGE PROCESSING, VOL. 16, NO. 6, JUNE 2007
Fig. 5. Illustration of Proposition 1 and its proof.
of the page, where . For convenience,denote
(21)
where . Then, the (20) can be rewritten as
where . It is obvious that the derivative. Therefore, is monotonically decreasing relative
to . Hence, when , and takesthe maximum value
(22)
2) For each , when the circle is centered on[as shown in Fig. 5(b)], we have
and
where . It is obvious that . Therefore,is monotonically increasing relative to . Hence,
for each , reaches the minimumvalue , and takes the minimum value
(23)
The meaning of Proposition 1 is that, no matter what size ofthe circular mask, the smaller the distance of the pixel to ,the larger the WMSB mass if the pixel is on the line, while thesmaller the WMSB mass if the pixel on the background. Conse-quently, pixels on the middle axis of a line take the local max-imum value of the WMSB mass, whereas pixels on the back-ground very near the edges of the line take the local minimumWMSB mass. As mentioned in Section II-B, in order to detect aline completely, the maximum of the WMSB mass that the linepixel can take should be less than the minimum that the back-ground pixel can take. Therefore, according to Proposition 1 andits proof, from (22) and (23), we get
(24)
where .Fig. 6 illustrates the inequality relations defined by (24). We
can see that only meets the inequality. Given the linewidth, the smaller the value, the larger the mask size . Thereis a tradeoff to be made here as a smaller ratio means a slowerdetection yet the use of a larger ratio, and, therefore, a smallermask will undermine line detection. Hence, we set byexperience. The relationship between the width of detected line,
, and the radius of a constant weighting circular mask, ,is
(25)
According to (22), the maximum of WMSB mass which linepixels can take is . Therefore, the geometricthreshold used in (10) is equal to
.
(20)
LIU et al.: DETECTING WIDE LINES USING ISOTROPIC NONLINEAR FILTERING 1589
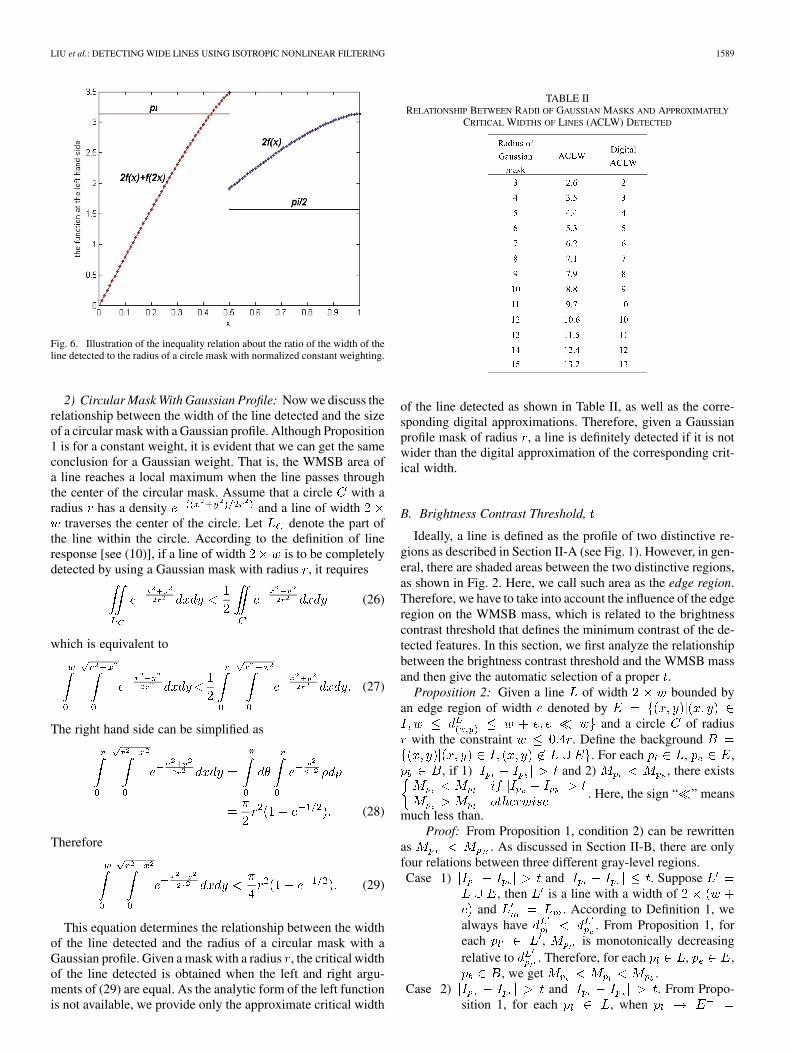
Fig. 6. Illustration of the inequality relation about the ratio of the width of theline detected to the radius of a circle mask with normalized constant weighting.
2) Circular Mask With Gaussian Profile: Now we discuss therelationship between the width of the line detected and the sizeof a circular mask with a Gaussian profile. Although Proposition1 is for a constant weight, it is evident that we can get the sameconclusion for a Gaussian weight. That is, the WMSB area ofa line reaches a local maximum when the line passes throughthe center of the circular mask. Assume that a circle with aradius has a density and a line of width
traverses the center of the circle. Let denote the part ofthe line within the circle. According to the definition of lineresponse [see (10)], if a line of width is to be completelydetected by using a Gaussian mask with radius , it requires
(26)
which is equivalent to
(27)
The right hand side can be simplified as
(28)
Therefore
(29)
This equation determines the relationship between the widthof the line detected and the radius of a circular mask with aGaussian profile. Given a mask with a radius , the critical widthof the line detected is obtained when the left and right argu-ments of (29) are equal. As the analytic form of the left functionis not available, we provide only the approximate critical width
TABLE IIRELATIONSHIP BETWEEN RADII OF GAUSSIAN MASKS AND APPROXIMATELY
CRITICAL WIDTHS OF LINES (ACLW) DETECTED
of the line detected as shown in Table II, as well as the corre-sponding digital approximations. Therefore, given a Gaussianprofile mask of radius , a line is definitely detected if it is notwider than the digital approximation of the corresponding crit-ical width.
B. Brightness Contrast Threshold,
Ideally, a line is defined as the profile of two distinctive re-gions as described in Section II-A (see Fig. 1). However, in gen-eral, there are shaded areas between the two distinctive regions,as shown in Fig. 2. Here, we call such area as the edge region.Therefore, we have to take into account the influence of the edgeregion on the WMSB mass, which is related to the brightnesscontrast threshold that defines the minimum contrast of the de-tected features. In this section, we first analyze the relationshipbetween the brightness contrast threshold and the WMSB massand then give the automatic selection of a proper .
Proposition 2: Given a line of width bounded byan edge region of width denoted by
and a circle of radiuswith the constraint . Define the background
. For each , ,, if 1) and 2) , there exists
. Here, the sign “ ” means
much less than.Proof: From Proposition 1, condition 2) can be rewritten
as . As discussed in Section II-B, there are onlyfour relations between three different gray-level regions.Case 1) and . Suppose
, then is a line with a width ofand . According to Definition 1, we
always have . From Proposition 1, foreach , is monotonically decreasingrelative to . Therefore, for each , ,
, we get .Case 2) and . From Propo-
sition 1, for each , when

1590 IEEE TRANSACTIONS ON IMAGE PROCESSING, VOL. 16, NO. 6, JUNE 2007
Fig. 7. (a) Segmented palmprint image. Palm-line response images obtained using brightness contrast thresholds t of (b) 6, (c) 7, (d) 8, (e) 9, (f) 10, (g) 11, (h) 15,(i) 20, and (j) 25.
, approaches the maximumvalue , and reaches the minimum value
. From , we alwaysget . There-fore, for each , , , we have
.Case 3) and . According to
(18) and (19), we have .
Obviously, for each , , , wealways have .
Case 4) and . Based on Proposi-tion 1, when , takes the maximum value
. Suppose , then foreach , when
, reaches the minimum , takes theminimum value . Owingto , from Fig. 6, we can get .Therefore, for each , , , wehave .
Hence, from Cases 1) and 2), if , we have; from Cases 3) and 4), if , we have.
From Proposition 2 and its proof, we conclude that for a givenimage, if the contrast between the edge region and the back-ground is less than the threshold , the edge region can be re-garded as one part of the line; otherwise, the edge region mustbe regarded as one part of the line. That is, for a given image, alarge brightness contrast threshold may result in a “narrow” linebeing detected, while a small brightness contrast threshold mustresult in a “broad” line being detected. Therefore, the brightnesscontrast threshold qualitatively determines the width of linesdetected.
Fig. 7 gives an example of line response images with different. Here, dark line pixels are extracted directly from the input
segmented palmprint image [see Fig. 7(a)] by using a constantweighting mask with a radius of 8 pixels. It can be seen that asthe brightness contrast threshold increases, the number of falseresponse pixels and true response pixels are both decrease. It is,
thus, necessary to select a proper to guarantee the detection ofthe whole line. By experience, we defined as
(30)
where is the standard deviation function, means thenearest integer, and is the input image. According to (30), thebrightness contrast threshold used in Fig. 7(a) is 9.
V. EXPERIMENTAL RESULTS
Our line detection method is implemented for the synthesizedimage and real images in several different applications to com-pletely detect lines of different widths. For the purpose of es-tablishing the effectiveness and robustness of our line detectionmethod, the output images of our wide line detector are com-pared with those of line detection approaches based on edge ex-traction [25] and ridge detection [26], which are designed to ex-tract the line width along with the line position. For speed, the
to the fifth power formula in (11) is implemented using alook up table.
A. Synthesized Image
We synthesized an image including straight lines and curves(curvilinear structures) with different widths and differentintensities. Fig. 8(a) shows the synthesized image. Applyingthe proposed wide line detector we obtain the result shown inFig. 8(d). Here, we employed the core function defined in (11).The brightness contrast threshold used is 11 according to (30).The maximum width in Fig. 8(a) is 5, and, thus, the operatingradius of circular mask is 7 according to (25). Fig. 8(b) and(c) shows the line detection results by the edge-based linefinder [25] and the ridge-based line detector [26], respectively.Since our method detects lines based on extracting the wholeline while the other two approaches detect lines based ondetecting the corresponding edges of each line pixel, we showthe line detection result in the corresponding way, as shownin Fig. 8(b)–(d). It can be seen that the line detection results

LIU et al.: DETECTING WIDE LINES USING ISOTROPIC NONLINEAR FILTERING 1591
Fig. 8. (a) Test image including straight lines and curves of different widths. The line detection results obtained using (b) the edge-based line finder, (c) theridge-based line detector, and (d) the proposed wide line detector.
by using our method is more accurate than that obtained byusing either the edge-based line finder or the ridge-based linedetector.
B. Real Images
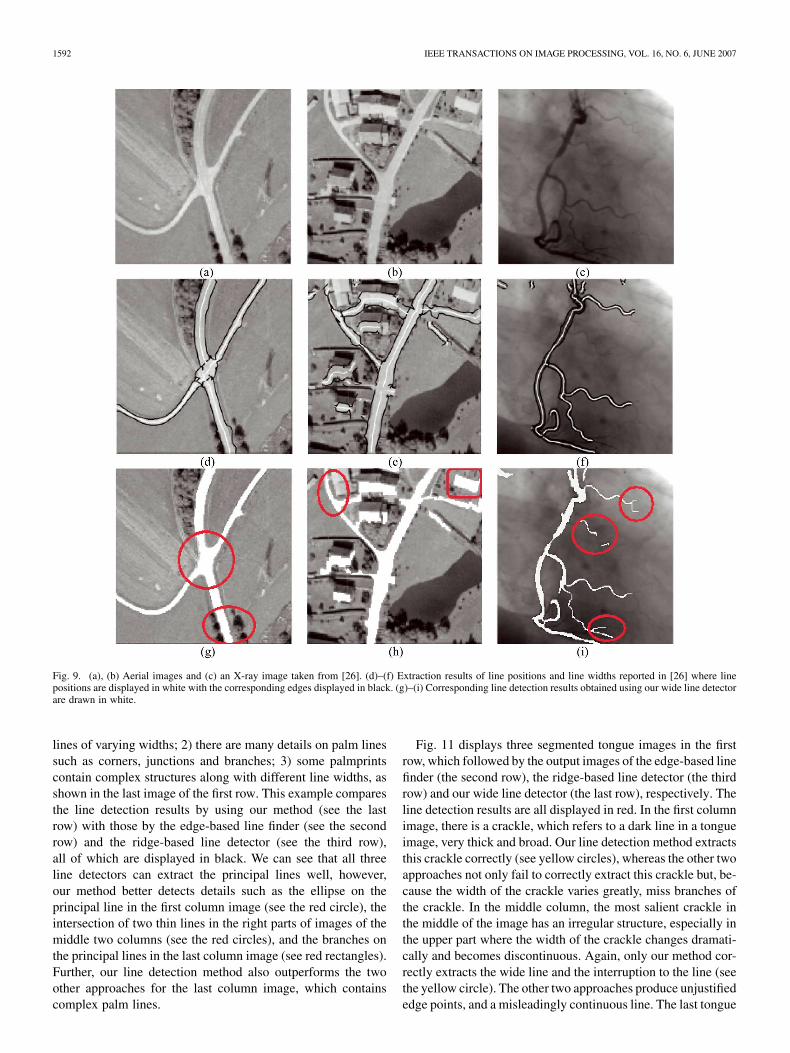
Fig. 9(a)–(c) is taken from [26] including two aerial imagesand one X-ray image. Fig. 9(g)–(i) shows the line detectionresults obtained using our wide line detector. The brightnesscontrast threshold for each input image is calculated by (30). Acircular mask with a normalized constant weighting is used foreach input image to detect lines and the corresponding radiusof the circular mask is determined according to (25) basedon the width of the widest line expected to be detected. Inpostprocessing, we discarded very short linear structures ( 10pixels) and very “rounded” line structures (the eccentricity
0.75). Fig. 9(d)–(f) displays the corresponding line extractionresults reported in [26].
Fig. 9(d) shows the line detection result obtained by using theridge-based line detector. We can see that the unjustified edgepoints are reported in the junction area because the line widthhere exceeds the range of widths that can be detected and, fur-ther, that the estimation of the line width of the road object in thebottom of the image is too large due to the effect of the nearbyvegetation. Fig. 9(g) shows the corresponding line detection re-sult obtained by using our wide line detector. It can be seen thatthe method is able to correctly detect the wide lines (i.e., essen-tially all the pixels that comprise line cross-sectional extents),even at the junction area in the middle of the image and the
road close to vegetation in the bottom part of the image (seered circles).
The aerial image at Fig. 9(b) is more of a challenge. It con-tains a large area where the model of the line does not hold, butas can be seen in Fig. 9(h), our wide line detector nonethelessworks well. Because bright lines are needed here, we employedthe (16) as the core function of the wide line detector to sup-press the dark-line response. Comparing the line detection re-sults obtained by the ridge-based line detection approach [seeFig. 9(e)] and our method, we can see that the narrow line inthe left upper part, which has a width close to two, is extractedcorrectly by using our method, while the corresponding line de-tected in Fig. 9(e) is not fully extracted as its cross-sectional ex-tent is too narrow at some positions. Further, the wide line in theright upper part of the image is detected completely in Fig. 9(h),while it is missed in Fig. 9(e).
Fig. 9(c) is a low contrast X-ray image. Fig. 9(f) and (i) showsthe line detection results by using the ridge-based line detectorand our method, respectively. It can be seen that our methodcertainly performs as well as the ridge-based line detector indelineating the vascular stenosis in the central part, and is alsoable to detect some very narrow and thin arteries (see red circles)which do not appear in Fig. 9(f).
The next example, Fig. 10, which shows four segmented128 128 palmprint images (the first row), is from the domainof biometrics. There are a number of reasons for employingpalmprint images to test our line detection method: 1) palmlines, referring to principal lines and wrinkles [30], are negative
1592 IEEE TRANSACTIONS ON IMAGE PROCESSING, VOL. 16, NO. 6, JUNE 2007
Fig. 9. (a), (b) Aerial images and (c) an X-ray image taken from [26]. (d)–(f) Extraction results of line positions and line widths reported in [26] where linepositions are displayed in white with the corresponding edges displayed in black. (g)–(i) Corresponding line detection results obtained using our wide line detectorare drawn in white.
lines of varying widths; 2) there are many details on palm linessuch as corners, junctions and branches; 3) some palmprintscontain complex structures along with different line widths, asshown in the last image of the first row. This example comparesthe line detection results by using our method (see the lastrow) with those by the edge-based line finder (see the secondrow) and the ridge-based line detector (see the third row),all of which are displayed in black. We can see that all threeline detectors can extract the principal lines well, however,our method better detects details such as the ellipse on theprincipal line in the first column image (see the red circle), theintersection of two thin lines in the right parts of images of themiddle two columns (see the red circles), and the branches onthe principal lines in the last column image (see red rectangles).Further, our line detection method also outperforms the twoother approaches for the last column image, which containscomplex palm lines.
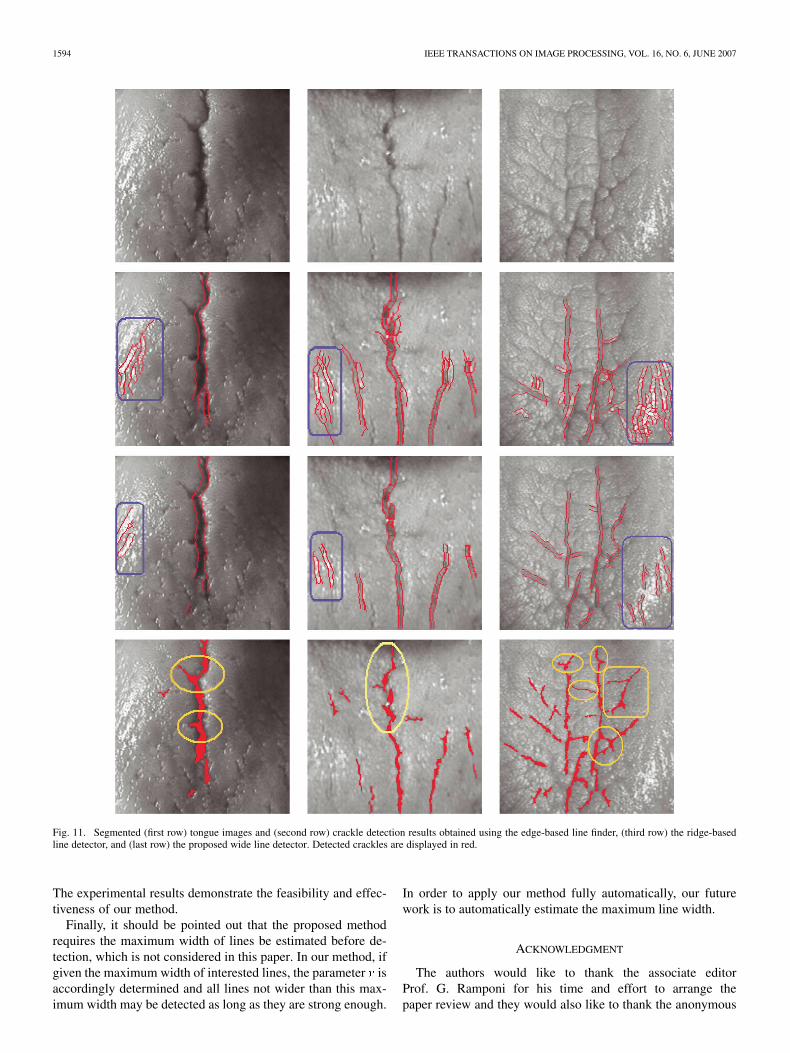
Fig. 11 displays three segmented tongue images in the firstrow, which followed by the output images of the edge-based linefinder (the second row), the ridge-based line detector (the thirdrow) and our wide line detector (the last row), respectively. Theline detection results are all displayed in red. In the first columnimage, there is a crackle, which refers to a dark line in a tongueimage, very thick and broad. Our line detection method extractsthis crackle correctly (see yellow circles), whereas the other twoapproaches not only fail to correctly extract this crackle but, be-cause the width of the crackle varies greatly, miss branches ofthe crackle. In the middle column, the most salient crackle inthe middle of the image has an irregular structure, especially inthe upper part where the width of the crackle changes dramati-cally and becomes discontinuous. Again, only our method cor-rectly extracts the wide line and the interruption to the line (seethe yellow circle). The other two approaches produce unjustifiededge points, and a misleadingly continuous line. The last tongue

LIU et al.: DETECTING WIDE LINES USING ISOTROPIC NONLINEAR FILTERING 1593
Fig. 10. Segmented (first row) palmprint images and (second row) the palm-line detection results obtained using the edge-based line finder, (third row) the ridge-based line detector, and (last row) our wide line detector. Detected lines are displayed in black.
image is the most difficult because it is low contrast and containsmany line segments of different thicknesses and widths. Com-paring the corresponding three output images, it can be seen thatour method outperforms the other two approaches both in theextraction of the wide line and in the detection of the line struc-tures (see the yellow circles and rectangle). In addition, becauseour method uses no derivative and the implementation of thecircular mask decreases the influence of the directional noise,our wide line detector gives strong noise rejection, that is, pro-duces false crackles caused by reflecting points much less thanthe other two approaches (see all blue rectangles).
VI. CONCLUSION AND DISCUSSION
This paper presents a novel wide line detector for extracting awhole line by using an isotropic nonlinear filter. Unlike existingapproaches, our method employs a hyperbolic secant formulabased nonlinear filter to detect the whole of the line. Isotropic
responses are obtained by using a circular mask either with anormalized constant weighting or with a Gaussian profile. Themethod is robust because of the automatic selection of two pa-rameters—the size of the circular mask and the brightness con-trast threshold. The line detection method works very well for arange of images containing lines of different widths, especiallyfor those where the width of lines varies greatly. Because thewide line detector is not dependent on the Gaussian kernel todetect lines, even narrow lines can be extracted well as long asthe intensity difference between the narrow lines and the back-ground is larger than the brightness contrast threshold.
Although the proposed line detection method focuses on ex-tracting a whole line, the line position, however, can be easilyobtained through a thinning process. Furthermore, the localiza-tion of lines via the detection is independent of mask sizes. Inaddition, the wide line detector is robust against noise becausethe detection is not based on derivatives of images. Hence, it iseffective for practical applications in which noise is inevitable.
1594 IEEE TRANSACTIONS ON IMAGE PROCESSING, VOL. 16, NO. 6, JUNE 2007
Fig. 11. Segmented (first row) tongue images and (second row) crackle detection results obtained using the edge-based line finder, (third row) the ridge-basedline detector, and (last row) the proposed wide line detector. Detected crackles are displayed in red.
The experimental results demonstrate the feasibility and effec-tiveness of our method.
Finally, it should be pointed out that the proposed methodrequires the maximum width of lines be estimated before de-tection, which is not considered in this paper. In our method, ifgiven the maximum width of interested lines, the parameter isaccordingly determined and all lines not wider than this max-imum width may be detected as long as they are strong enough.
In order to apply our method fully automatically, our futurework is to automatically estimate the maximum line width.
ACKNOWLEDGMENT
The authors would like to thank the associate editorProf. G. Ramponi for his time and effort to arrange thepaper review and they would also like to thank the anonymous
LIU et al.: DETECTING WIDE LINES USING ISOTROPIC NONLINEAR FILTERING 1595
reviewers for their constructive advice and for the revision ofthe paper.
REFERENCES
[1] D. Behar, J. Cheung, and L. Kurz, “Contrast techniques for line detec-tion in a correlated noise environment,” IEEE Trans. Image Process.,vol. 6, no. 5, pp. 625–641, Jun. 1997.
[2] G. J. Genello, J. F. Y. Cheung, S. H. Billis, and Y. Saito, “Graeco-Latinsquares design for line detection in the presence of correlated noise,”IEEE Trans. Image Process., vol. 9, no. 4, pp. 609–622, Apr. 2000.
[3] G. M. Schuster and A. K. Katsaggelos, “Robust line detection using aweighted MSE estimator,” in Proc. Int. Conf. Image Processing, 2003,vol. 1, pp. 293–296.
[4] H. Li, W. Hsu, M. L. Lee, and H. Wang, “A piecewise Gaussian modelfor profiling and differentiating retinal vessels,” in Proc. Int. Conf.Image Processing, 2003, vol. 1, pp. 1069–1072.
[5] E. R. Davies, M. Bateman, D. R. Mason, J. Chambers, and C. Ridgway,“Design of efficient line segment detectors for cereal grain inspection,”Pattern Recognit. Lett., vol. 24, pp. 413–428, 2003.
[6] Z. Y. Liu, K. C. Chiu, and L. Xu, “Strip line detection and thinning byRPCL-based local PCA,” Pattern Recognit. Lett., vol. 24, no. 14, pp.2335–2344, 2003.
[7] R. O. Duda and P. E. Hart, “Use of the Hough transformation to detectlines and curves in pictures,” Comm. ACM, vol. 15, no. 1, pp. 11–15,1972.
[8] J. Illingworth and J. Kittler, “A survey of the Hough transform,”Comput. Vis., Graph., Image Process., vol. 44, pp. 87–116, 1988.
[9] V. F. Leavers, “Which Hough transform?,” CVGIP Image Understand.,vol. 58, no. 2, pp. 250–264, 1993.
[10] D. H. Ballard, “Generalizing the Hough transform to detect arbitraryshapes,” Pattern Recognit., vol. 13, no. 2, pp. 111–122, 1981.
[11] D. Geman and B. Jedynak, “An active testing model for tracking roadsin satellite images,” IEEE Trans. Pattern Anal. Mach. Intell., vol. 18,no. 1, pp. 1–14, Jan. 1996.
[12] N. Merlet and J. Zerubia, “New prospects in line detection by dynamicprogramming,” IEEE Trans. Pattern Anal. Mach. Intell., vol. 18, no. 4,pp. 426–431, Apr. 1996.
[13] J. H. Jang and K. S. Hong, “Detection of curvilinear structures using theEuclidean distance transform,” in Proc. IAPR Workshop on MachineVision Applications, 1998, pp. 102–105.
[14] A. W. K. Loh, M. C. Robey, and G. A. W. West, “Analysis of the in-teraction between edge and line finding techniques,” Pattern Recognit.,vol. 34, pp. 1127–1146, 2001.
[15] J. H. Jang and K. S. Hong, “Linear band detection based on the Eu-clidean distance transform and a new line segment extraction method,”Pattern Recognit., vol. 34, pp. 1751–1764, 2001.
[16] D. S. Guru, B. H. Shekar, and P. Nagabhushan, “A simple and robustline detection algorithm based on small eigenvalue analysis,” PatternRecognit. Lett., vol. 25, pp. 1–13, 2004.
[17] J. Canny, “A computational approach to edge detection,” IEEE Trans.Pattern Anal. Mach. Intell., vol. 8, no. 6, pp. 679–698, Jun. 1986.
[18] R. M. Haralick, “Ridges and valleys on digital images,” Comput. Vis.,Graph., Image Process., vol. 22, pp. 28–38, 1983.
[19] J. B. Subirana-Vilanova and K. K. Sung, “Ridge-detection for the per-ceptual organization without edges,” in Proc. 4th Int. Conf. ComputerVision, Berlin, Germany, 1993, pp. 57–64.
[20] L. A. Iverson and S. W. Zucker, “Logical/linear operators for imagecurves,” IEEE. Trans. Pattern Anal. Mach. Intell., vol. 17, no. 10, pp.982–996, Oct. 1995.
[21] A. Busch, “Revision of built-up areas in a GIS using satellite imageryand GIS data,” in Proc. IAPRS, 1998, vol. 32, pp. 91–98, part 4.
[22] T. Lindeberg, “Edge detection and ridge detection with automatic scaleselection,” Int. J. Comput. Vis., vol. 30, no. 2, pp. 117–154, 1998.
[23] M. Jacob and M. Unser, “Design of steerable filters for feature detec-tion using canny-like criteria,” IEEE Trans. Pattern Anal. Mach. Intell.,vol. 26, no. 8, pp. 1007–1019, Aug. 2004.
[24] D. Eberly, R. Gardner, B. Morse, S. Pizer, and D. Scharlah, “Ridgesfor image analysis,” J. Math. Imag. Vis., vol. 4, pp. 353–373, 1994.
[25] T. M. Koller, G. Gerig, G. Szekely, and D. Dettwiler, “Multiscale de-tection of curvilinear structures in 2-D and 3-D image data,” in Proc.5th Int. Conf. Computer Vision, Boston, MA, 1995, pp. 864–869.
[26] C. Steger, “An unbiased detector of curvilinear structures,” IEEE Trans.Pattern Anal. Mach. Intell., vol. 20, no. 2, pp. 113–125, Feb. 1998.
[27] J. Chen, Y. Sato, and S. Tamura, “Orientation space filtering for mul-tiple orientation line segmentation,” IEEE Trans. Pattern Anal. Mach.Intell., vol. 22, no. 5, pp. 417–429, May 2000.
[28] B. Pang and D. Zhang, “Computerized tongue diagnosis based onBayesian networks,” IEEE Trans. Biomed. Eng., vol. 51, no. 10, pp.1803–1810, Oct. 2004.
[29] R. Zwiggelaar, S. M. Astley, C. R. M. Boggis, and C. J. Taylor, “Linearstructures in mammographic images: Detection and classification,”IEEE Trans. Med. Imag., vol. 23, no. 9, pp. 1077–1086, Sep. 2004.
[30] L. Zhang and D. Zhang, “Characterization of palmprints by waveletsignatures via directional context modeling,” IEEE Trans. Syst., Man,Cybern. B, Cybern., vol. 34, no. 3, pp. 1335–1347, Jun. 2004.
[31] L. Liu and D. Zhang, “A novel palm-line detector,” in Proc. 5th Int.Conf. Audio- and Video-Based Biometric Person Authentication, Rye,NY, Jul. 20–22, 2005, vol. 3546, Lecture Notes Comput. Sci., pp.563–571.
[32] S. M. Smith and J. M. Brady, “SUSAN—A new approach to low levelimage processing,” Int. J. Comput. Vis., vol. 23, no. 1, pp. 45–78, 1997.
Laura Liu received the B.Sc. and M.S. degreesin computer science from the Harbin Institute ofTechnology, Harbin, China, in 2000 and 2002,respectively. She is currently pursuing the Ph.D.degree in the Department of Computing, The HongKong Polytechnic University, Kowloon.
Her research interests include image processing,pattern recognition, and biometrics.
David Zhang (SM’95) graduated in computer sci-ence from Peking University, China. He received theM.Sc. degree in computer science and the Ph.D. de-gree from the Harbin Institute of Technology (HIT),Harbin, China, in 1982 and 1985, respectively, and asecond Ph.D. degree in electrical and computer en-gineering from the University of Waterloo, Waterloo,ON, Canada, in 1994.
From 1986 to 1988, he was a Postdoctoral Fellowat Tsinghua University, China, and then an AssociateProfessor at the Academia Sinica, Beijing, China.
Currently, he is a Chair Professor at the Hong Kong Polytechnic University,Kowloon, where he is the Founding Director of the Biometrics TechnologyCentre (UGC/CRC) supported by the Hong Kong SAR Government. Healso serves as Adjunct Professor at Tsinghua University, Shanghai Jiao TongUniversity, Beihang University, HIT, and the University of Waterloo. He is theauthor of more than ten books and 160 journal papers.
Prof. Zhang is a Croucher Senior Research Fellow, Distinguished Speakerof the IEEE Computer Society, and a Fellow of the International Associationof Pattern Recognition (IAPR). He is the Founder and Editor-in-Chief of theInternational Journal of Image and Graphics (IJIG); an editor of a book in theSpringer International Series on Biometrics (KISB); an organizer of the Inter-national Conference on Biometrics Authentication (ICBA); an Associate Editorof more than ten international journals, including the IEEE TRANSACTIONS
ON SYSTEMS, MAN, AND CYBERNETICS—PART A: SYSTEMS AND HUMANS,the IEEE TRANSACTIONS ON SYSTEMS, MAN, AND CYBERNETICS—PART
C: APPLICATIONS AND REVIEWS, and Pattern Recognition; and TechnicalCommittee Chair of IEEE CIS.
Jane You (M’95) received the B.Eng. degree in elec-tronic engineering from Xi’an Jiaotong University,Xi’an, China, in 1986, and the Ph.D. degree in com-puter science from La Trobe University, Melbourne,Australia, in 1992.
From 1993 to 1995, she was a Lecturer with theSchool of Computing and Information Science, Uni-versity of South Australia. From 1996 to 2001, shewas with the School of Computing and InformationTechnology, Griffith University, Brisbane, Australia,where she held the positions of Lecturer and Senior
Lecturer. She joined the Department of Computing, Hong Kong PolytechnicUniversity, Kowloon, in 1999, where she is currently an Associate Professor.Her research interests include visual information retrieval, image processing,pattern recognition, multimedia systems, biometrics computing, and datamining.
Dr. You was awarded a French Foreign Ministry International Fellowship in1993.