15 N gas flux method and its correction by gas diffusi on ... · 3 measurements of N 2 and N 2O...
22
1 Underestimation of denitrification rates from field application of the 15 N gas flux method and its correction by gas diffusion modelling Reinhard Well 1 , Martin Maier 2 , Dominika Lewicka-Szczebak 1 , Jan-Reent Köster 1 ; and Nicolas Ruoss 1 1 Thünen Institute, Climate-Smart Agriculture, Braunschweig, Germany 2 Forest Research Institute Baden-Württemberg, Dep. Soil and Environment, Freiburg, Germany 5 Correspondence to: Reinhard Well ([email protected]) Abstract. Common methods for measuring soil denitrification in situ include monitoring the accumulation of 15 N-labelled N2 and N2O evolved from 15 N-labelled soil nitrate pool in closed chambers that are placed on the soil surface. Gas diffusion is considered to be the main transport process in the soil. Because accumulation of gases within the chamber decreases concentration gradients between soil and chamber over time, the surface efflux of gases decreases as well and gas production 10 rates are underestimated if calculated from chamber concentrations without consideration of this mechanism. Moreover, concentration gradients to the non-labelled subsoil exist, inevitably causing downward diffusion of 15 N labelled denitrification products. A numerical 3-D model for simulating gas diffusion in soil was used in order to determine the significance of this source of error. Results show that subsoil diffusion of 15 N-labelled N2 and N2O - and thus potential underestimation of denitrification derived from chamber fluxes - increases with chamber deployment time as well as with increasing soil gas 15 diffusivity. Simulations based on the range of typical soil gas diffusivities of unsaturated soils showed that the fraction of N2 and N2O evolved from 15 N-labelled NO3 that is not emitted at the soil surface during one hour chamber closing is always significant with values up to >50 % of total production due to accumulation in the pore space of the 15 N-labelled soil and diffusive flux to the unlabelled subsoil. Empirical coefficients to calculate denitrification from surface fluxes were derived by modelling multiple scenarios with varying soil water content. 20 Field experiments with arable silt loam soil for measuring denitrification with the 15 N gas flux method were conducted to obtain direct evidence for the incomplete surface emission of gaseous denitrification products. We compared surface fluxes of 15 N2 and 15 N2O from 15 N–labelled micro-plots confined by cylinders using the closed chamber method with cylinders open or closed at the bottom, finding 37% higher surface fluxes with bottom closed. Modeling fluxes of this experiment confirmed this effect, however with a higher increase in surface flux of 89%. 25 From our model and experimental results we conclude that field surface fluxes of 15 N-labelled N2 and N2O severely underestimate denitrification rates if calculated from chamber accumulation only. The extent of this underestimation increases with closure time. Underestimation also occurs during laboratory incubations in closed systems due to pore space accumulation of 15 N-labelled N2 and N2O. Due to this bias in past denitrification measurements, denitrification in soils might be more relevant than assumed to date. 30 Biogeosciences Discuss., https://doi.org/10.5194/bg-2018-495 Manuscript under review for journal Biogeosciences Discussion started: 13 December 2018 c Author(s) 2018. CC BY 4.0 License.
Transcript of 15 N gas flux method and its correction by gas diffusi on ... · 3 measurements of N 2 and N 2O...

1
Underestimation of denitrification rates from field application of the 15N gas flux method and its correction by gas diffusion modelling
Reinhard Well1, Martin Maier2, Dominika Lewicka-Szczebak1, Jan-Reent Köster1; and Nicolas Ruoss1
1Thünen Institute, Climate-Smart Agriculture, Braunschweig, Germany 2Forest Research Institute Baden-Württemberg, Dep. Soil and Environment, Freiburg, Germany 5
Correspondence to: Reinhard Well ([email protected])
Abstract. Common methods for measuring soil denitrification in situ include monitoring the accumulation of 15N-labelled N2
and N2O evolved from 15N-labelled soil nitrate pool in closed chambers that are placed on the soil surface. Gas diffusion is
considered to be the main transport process in the soil. Because accumulation of gases within the chamber decreases
concentration gradients between soil and chamber over time, the surface efflux of gases decreases as well and gas production 10
rates are underestimated if calculated from chamber concentrations without consideration of this mechanism. Moreover,
concentration gradients to the non-labelled subsoil exist, inevitably causing downward diffusion of 15N labelled denitrification
products. A numerical 3-D model for simulating gas diffusion in soil was used in order to determine the significance of this
source of error. Results show that subsoil diffusion of 15N-labelled N2 and N2O - and thus potential underestimation of
denitrification derived from chamber fluxes - increases with chamber deployment time as well as with increasing soil gas 15
diffusivity. Simulations based on the range of typical soil gas diffusivities of unsaturated soils showed that the fraction of N2
and N2O evolved from 15N-labelled NO3 that is not emitted at the soil surface during one hour chamber closing is always
significant with values up to >50 % of total production due to accumulation in the pore space of the 15N-labelled soil and
diffusive flux to the unlabelled subsoil. Empirical coefficients to calculate denitrification from surface fluxes were derived by
modelling multiple scenarios with varying soil water content. 20
Field experiments with arable silt loam soil for measuring denitrification with the 15N gas flux method were conducted to
obtain direct evidence for the incomplete surface emission of gaseous denitrification products. We compared surface fluxes of
15N2 and 15N2O from 15N–labelled micro-plots confined by cylinders using the closed chamber method with cylinders open or
closed at the bottom, finding 37% higher surface fluxes with bottom closed. Modeling fluxes of this experiment confirmed
this effect, however with a higher increase in surface flux of 89%. 25
From our model and experimental results we conclude that field surface fluxes of 15N-labelled N2 and N2O severely
underestimate denitrification rates if calculated from chamber accumulation only. The extent of this underestimation increases
with closure time. Underestimation also occurs during laboratory incubations in closed systems due to pore space accumulation
of 15N-labelled N2 and N2O. Due to this bias in past denitrification measurements, denitrification in soils might be more relevant
than assumed to date. 30
Biogeosciences Discuss., https://doi.org/10.5194/bg-2018-495Manuscript under review for journal BiogeosciencesDiscussion started: 13 December 2018c© Author(s) 2018. CC BY 4.0 License.

2
Corrected denitrification rates can be obtained by estimating subsurface flux and storage with our model. The observed
deviation between experimental and modeled subsurface flux revealed the need for refined model evaluation which must
include assessment of the spatial variability in diffusivity and production and the spatial dimension of the chamber.
.
1 Introduction 5
N2O reduction to N2 is the last step of microbial denitrification, i.e. anoxic reduction of nitrate (NO3-) to N2 with the
intermediates NO2-,NO and N2O (Mueller and Clough, 2014). Commonly applied analytical techniques enable us to
quantitatively analyse only the intermediate product of this process, N2O, but not the final product, N2. The challenge to
quantify denitrification rates is largely due to the difficulty to measure N2 production due to its spatial and temporal
heterogeneity and the high N2-background of the atmosphere (Groffman et al., 2006). There are three principles to overcome 10
the latter problem: (i) adding NO3- highly enriched in 15N and monitoring 15N labelled denitrification products (15N gas flux
method) (e.g. Siegel et al., 1982) ; (ii) adding acetylene to block N2O reductase quantitatively and estimating total
denitrification from N2O production (acetylene inhibition technique, e.g. Felber et al., 2012) ; (iii) measuring denitrification
gases during incubation of soils in absence of atmospheric N2 using gastight containers and artificial Helium/oxygen
atmosphere (HeO2 method; Scholefield et al., 1997; Butterbach-Bahl et al., 2002). Each of these methods to quantify 15
denitrification rates in soils has various limitations with respect to potential analytical bias, applicability at different
experimental scales and the necessity of expensive instrumentation that is not available for routine studies. Today the acetylene
inhibition technique is considered unsuitable to quantify N2 fluxes under natural atmosphere, since its main limitation (among
several others, e.g. Saggar et al. (2013) is the catalytic decomposition of NO in presence of O2 (Bollmann and Conrad, 1997a,
b), resulting in unpredictable underestimation of gross N2O production (Nadeem et al., 2013). The 15N gas flux method requires 20
homogenous 15N-labelling of the soil (Mulvaney and Vandenheuvel, 1988) and under natural atmosphere it is not sensitive
enough to detect small N2 fluxes (Lewicka-Szczebak et al., 2013). Direct measurement of N2 fluxes using the HeO2 method is
not subject to the problems associated with 15N-based methods (Butterbach-Bahl et al., 2013), but the need for sophisticated
gastight incubation systems limits its use to laboratory incubations only. Consequently, the 15N gas flux method is the only
method potentially applicable in field conditions. 25
When chamber methods are used to determine soil gas fluxes to the atmosphere, a certain fraction of the produced gas is not
emitted at the surface but remains in the soil (Parkin et al, 2011). This is because the accumulation of gases in the closed
chamber decreases concentration gradients between soil and chamber atmosphere causing lowering of surface fluxes with
increasing chamber deployment time (Healy et al., 1996). This effect has been addressed in numerous studies, its bias was 30
assessed (Venterea et al., 2009) and various empirical (Hutchinson & Mosier) or numerical (Healy et al. 1996, Sahoo et al.,
2010) correction approaches have been developed and compared (Parkin et al., 2011). Denitrification estimates based on
Biogeosciences Discuss., https://doi.org/10.5194/bg-2018-495Manuscript under review for journal BiogeosciencesDiscussion started: 13 December 2018c© Author(s) 2018. CC BY 4.0 License.

3
measurements of N2 and N2O surface fluxes could also be biased by this effect. This had been suggested for the acetylene
inhibition technique in the field (Mahmood et al., 1997) and also for the 15N gas flux method (Sgouridis et al., 2016). However,
to our knowledge the magnitude in possible underestimation of denitrification rates has not been investigated until now. While
the production of CO2 and trace gases in soil is ubiquitous, formation of 15N-labelled denitrification products is limited to the
soil volume amended with 15N-labelled NO3-. Consequently, it can be expected that diffusive loss of 15N-labelled gases to the 5
subsoil is even more relevant than the respective loss of non-labelled soil gases. When applying 15N tracer to the subsoil to
estimate subsoil denitrification, diffusion modelling was used to determine denitrification rates within the labelled volume by
fitting measured and modelled steady state concentration of 15N2 + 15N2O (Well and Myrold, 2002). Modelling diffusion of
15N2 + 15N2O produced in 15N-lableled surface soil could be used to estimate its accumulation in pore space and diffusive loss
to the subsoil and thus to quantify denitrification from the sum of surface flux, subsoil flux and storage within the 15N-labelled 10
soil volume.
Our objectives were thus to determine the significance of the fraction of 15N-labelled denitrification products produced in 15N-
labelled soil in the field that is not emitted at the soil surface. This was done experimentally and by diffusion modelling.
Moreover, we aimed to develop a procedure to determine denitrification rates from surface flux data. We hypothesized that (i) 15
a significant fraction of 15N-labelled denitrification products is not emitted at the soil surface, (ii) this fraction depends on
diffusivity, chamber deployment time and depth of 15N–labelling, and (iii.) diffusive loss of 15N-labelled gases to the subsoil
is more relevant than accumulation in the pore space of the 15N-labelled soil.
2 Materials and Methods 20
2.1 Principles of the 15N gas flux method and gas flux dynamics following 15N tracer application
The 15N gas flux method consists of quantifying N2 and / or N2O emitted from 15N-labelled nitrate applied to soil in order to
quantify fluxes from microbial denitrification (Mulvaney, 1988; Stevens et al., 1993) where N2 and N2O are formed from the
combination of two NO precursor molecules. To quantify denitrification, experimental soil is typically confined by cylinders
installed to a certain depth. These micro-plots are amended with 15N-labelled nitrate either by surface application of the 25
fertilizer (Sgouridis et al., 2016) or by injecting fertilizer solution using needles to achieve homogenous labelling (Buchen et
al., 2016). Emitted 15N-labelled gases are collected in chambers fitted gastight on top of the cylinders, typically for periods of
one hour or longer. Soil-derived gases mix with background air inside the closed chambers. N2 and N2O fluxes from the
labelled NO3- are calculated from the abundance of N2 and N2O isotopologues (i.e. molecular species that differ in the number
of isotopic substitutions (Coplen, 2011)) in the gas accumulating in the chamber. 30
To measure denitrification in arable soil, depth of confinement, and also of labelling, typically includes the ap horizon of the
soil, i.e. usually depth of tillage. In this horizon, most of denitrification activity is assumed due to its content in soil organic
Biogeosciences Discuss., https://doi.org/10.5194/bg-2018-495Manuscript under review for journal BiogeosciencesDiscussion started: 13 December 2018c© Author(s) 2018. CC BY 4.0 License.

4
matter, undecomposed plant litter , organic root exsudates, root respiration as well as fertilizer application to the surface
(Groffman et al., 2009).
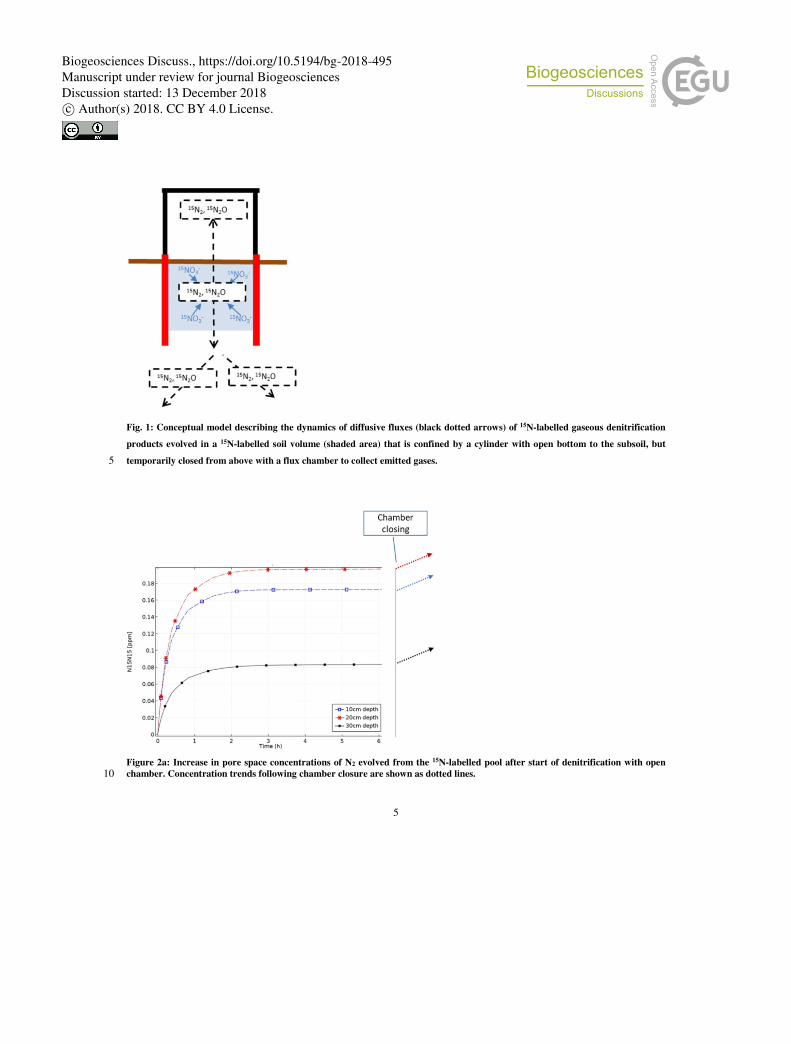
The bias in determining denitrification rates from the accumulation of 15N2 and 15N2O is illustrated by a conceptual model
(Figs. 1 and 2 a,b). After closing a chamber on top of the 15N-labelled soil, the timing and magnitude of 15(N2+N2O) fluxes
depend on the chamber volume, denitrification rates of the 15N-labelled soil and on gas diffusivity within and around this soil 5
(Fig. 1).
We define the fluxes of 15N- labelled gases as relative fluxes in relation to the production of these gases as follows:
• The surface flux is the flux of 15N-labelled gases to the atmosphere at the soil surface, either into the free
atmosphere or into a closed flux chamber. Relative surface flux is the ratio between surface flux rate and production
rate. 10
• Relative subsoil flux is the flux rate of 15N-labelled gases at the lower boundary of the 15N-labelled soil in relation to
the production rate. Subsoil flux occurs always in downward direction and is thus expressed as negative flux.
• Accumulation of 15N-labelled gases within the 15N-labelled soil is referred to as storage flux which is the increase in
the amount of accumulated 15N-labelled gases. Relative storage flux is thus storage flux rate in relation to the
production rate. 15
Assuming constancy of denitrification rates and gas diffusivity, the following dynamics in concentration and gaseous fluxes
would establish:
Following 15N-labelling, production of 15N–labelled N2 and N2O would start at constant rates. Before closing the chamber, the
upper soil boundary is the free atmosphere where gas exchange is fast enough to preclude 15N accumulation above the soil
surface. Production leads to accumulation of 15N-labelled gases and thus to build-up of concentration gradients to the surface 20
and to the subsoil (Fig. 2a), which causes increasing surface and subsoil fluxes while the storage flux decreases (Fig. 2b). After
a certain time, steady state is reached, where all fluxes reach constancy.
Closing the chamber changes the upper boundary since chamber concentration increases due to surface flux (Fig. 2a).
Consequently, subsoil and storage flux are rising again, whereas surface flux is decreasing. If diffusivity and volume of 15N-
lablled soil is known and constancy of parameters is long enough to achieve steady state before closing the chamber, then the 25
relative surface flux can be determined by modelling production and diffusion with open chamber until steady state and during
the subsequent phase of chamber closing. Production can thus be calculated from modelled relative surface flux and measured
surface flux rate.
Biogeosciences Discuss., https://doi.org/10.5194/bg-2018-495Manuscript under review for journal BiogeosciencesDiscussion started: 13 December 2018c© Author(s) 2018. CC BY 4.0 License.
5
Fig. 1: Conceptual model describing the dynamics of diffusive fluxes (black dotted arrows) of 15N-labelled gaseous denitrification
products evolved in a 15N-labelled soil volume (shaded area) that is confined by a cylinder with open bottom to the subsoil, but
temporarily closed from above with a flux chamber to collect emitted gases. 5
Figure 2a: Increase in pore space concentrations of N2 evolved from the 15N-labelled pool after start of denitrification with open
chamber. Concentration trends following chamber closure are shown as dotted lines. 10
Biogeosciences Discuss., https://doi.org/10.5194/bg-2018-495Manuscript under review for journal BiogeosciencesDiscussion started: 13 December 2018c© Author(s) 2018. CC BY 4.0 License.

6
Figure 2b: Time course of relative fluxes of N2 and N2O evolved from the 15N-labelled pool after start of denitrification with open
chamber. Trends of fluxes following chamber closure are shown as dotted lines.
5
2.2 Numerical Finite Element Modeling
2.2.1 Conceptual model of the experimental set-up
Numerical finite element modelling (FEM) was used for simulating gas transport during the chamber measurements
(COMSOL Multiphysics, Version 5.2 COMSOL Inc., Burlington, Massachusetts, US) to estimate surface and subsurface
fluxes of 15N–labelled N2 and N2O. A conceptual 3D model was built based on geometry and properties of the experimental 10
set-up, this means soil and the cylinder containing the labelled NO3-, the atmosphere and the chamber. We assumed a soil pore
matrix consisting of 2 soil layers with homogenous properties each (total pore volume, soil water content and soil gas
diffusivity) into which a gas impermeable cylinder of 15 cm diameter and 35 cm length was vertically installed to a depth of
30 cm. The soil NO3- within the cylinder was assumed to be homogenously distributed and labelled with 50 atom % 15N to
produce homogeneously the isotopologues of N2 and N2O (14N14N, 15N14N, 15N15N, 14N14NO, 15N14NO, 15N15NO), while the 15
surrounding soil was not producing any of these gas species. The latter assumption is a simplification to reduce modelling
effort, since all of the isotopologues are produced to some extent also from non-labelled N sources outside the 15N-labelled
soil volume. However, due to the high 15N-enrichment in the labelled soil, the abundance of 15N14N is 69 times higher in the
15N pool derived fluxes and the abundance of 15N15N is even 18,600 times higher, compared to natural abundance of 15N.
Biogeosciences Discuss., https://doi.org/10.5194/bg-2018-495Manuscript under review for journal BiogeosciencesDiscussion started: 13 December 2018c© Author(s) 2018. CC BY 4.0 License.

7
Hence, fluxes from non-labelled N pools would not significantly affect the model result. A cylinder shaped gas impermeable
cover chamber of totally 20 cm height was used to close temporarily the base cylinder to measure soil gas fluxes.
2.2.2 Gas transport modelling
Molecular gas diffusion was assumed to be the only transport mechanism in the soil. The left and right side and the bottom of 5
the modelled domain were defined as impermeable (Neumann boundary condition). The upper boundary of the atmospheric
layer was set to atmospheric gas concentrations as Dirichlet boundary condition, and acts therefore as sink for the gases
produced. To increase computational efficiency, a 2D axisymmetric modelling approach was chosen since the cylinder and
the chamber were round objects. The modelled volume was set to sufficiently large volume with a soil depth of 1.0 m and a
diameter of 1.0 m to ensure that the dimension of the modelled area does not affect the modelling outcome within the cylinder 10
and chamber area.
Gas transport was modelled for all isotopologues of N2 and N2O. Diffusivity in free air (D0) was set to 0.193 cm² s-1 for 14N14N
and 0.137 cm² s-1 for 14N14NO according to (Marrero, 1972). Diffusivity in free air of 15N14N (0.1913 cm² s-1), 15N15N (0.1896
cm² s-1), 15N14NO (0.1364 cm²/s) and 15N15NO (0.1358 cm²/s) were derived based on their mass following (Jost, 1960). The
relative diffusion coefficient in soil DS/D0 accounts for the reduced diffusivity in a porous system. DS/D0 was calculated using 15
the diffusion model of (Millington and Quirk, 1961) (DS/D0 =E^(4/3)*D0) from the air-filled pore volume E which was
calculated as the difference of the total pore volume of the soil and the volumetric soil water content. The free atmosphere was
assumed to be well mixed and the effective diffusivity was set to 40× D0, so that the concentration in the atmosphere was kept
stable.
2.2.3 Time until steady state after labelling 20
Time dependent modelling of the open chamber set-up was performed to assess the time that is needed after the initiation of
the system, that means after adding labelled NO3- until the production and transport of the N2O and N2 isotopologues reach a
steady state concentration distribution within the soil cylinder and the surrounding soil (Fig. 2a). This represents the minimum
time to be waited after the label application before the first chamber measurement.
2.2.4 Modelling chamber measurements 25
To model chamber fluxes, two modelling steps were run. In a first modelling step, steady state concentration distributions were
modelled for the open chamber (Figures 2 a and b). The resulting concentration distributions were then used in a second
modelling step as input for time step 0 for the time dependent modelling of the closed chamber.
Two different experimental set-ups were modelled and used in the field. The first experimental set-up is represented by the
conceptual model described above, and includes an open bottom cylinder containing the labelled NO3-. In the second set-up, 30
the lower end of the cylinder was sealed, which was represented by an additional impermeable thin layer (Table 1).
Biogeosciences Discuss., https://doi.org/10.5194/bg-2018-495Manuscript under review for journal BiogeosciencesDiscussion started: 13 December 2018c© Author(s) 2018. CC BY 4.0 License.

8
Four additional theoretical experimental set-ups were modelled to assess the effect of the soil cylinder length and the length
of the labelled zone within the cylinder. For theses set-ups the soil was assumed to consist of one homogenous layer instead
of two layers.
Table 1 Modelled scenarios; *indicates the set-ups where additional parameter sweeps of soil moisture and production rates of the 5 gas species were run.
Set up Bottom Cylinder length Labeled zone
1_bottom_open* Bottom open 30 cm 0- 30 cm
1_bottom_closed* Bottom closed 30 cm 0- 30 cm
2_bottom_open Bottom open 45 cm 0- 30 cm
3_bottom_open Bottom open 45 cm 0- 45 cm
4_bottom_open Bottom open 60 cm 0- 45 cm
Parameter sweeps were conducted for the set-ups used in the field (1_bottom-open and 1_bottom closed) to assess the
theoretical effect of soil moisture, pore volumes and production rates to be able to account for these transport related effects 10
in the calculation of the flux measurements. This means, for all parameter combinations a new model was calculated.
Total pore volume was set to 0.51 m³ m-³ for the parameter sweep which corresponds a bulk soil density of 1.30g cm-³. The
soil water contents used for the parameter sweep were 0.2, 0.3, 0.35 and 0.4 m³ m-³ and corresponded to a range of DS/D0 of
0.053-0.210. The production rates of the gas species used for the parameter sweep were chosen (Table 2) so that the outcome
of the parameter sweep models covered the range of the observed concentration of the respective species. 15
Table 2 Range of parameter values used to assess effect of soil gas transport and production rates.
Parameter Parameter range
NN Production 3.0-60 nmol/m²s
15NN Production 0.3-6.0 nmol/m²s
15N15N Production 0.03-6.0 nmol/m²s
N2O Production 0.3-6.0 nmol/m²s
15NNO Production 0.03-1.5 nmol/m²s
15N15NO Production 0.03-1.5 nmol/m²s
Soil water Content 0.2- 0.4 m³/m³
Biogeosciences Discuss., https://doi.org/10.5194/bg-2018-495Manuscript under review for journal BiogeosciencesDiscussion started: 13 December 2018c© Author(s) 2018. CC BY 4.0 License.

9
The output of the parameter sweeps of scenario 1_bottom-open and scenario 1_bottom closed included combinations of soil
water content, production rates of the soil core, chamber concentrations, and fluxes into the chamber and into the subsoil of
the respective gas species. This dataset allowed for linking the gas concentration in the chamber after 2 hours at a given soil
moisture with the respective production rate. Non-linear functions were fitted to the dataset (PROC NLIN, SAS 9.2, SAS
Institute Inc., Cary) so that the original production of a gas species could be directly calculated from the concentration after 2 5
hours of the respective gas, the total pore volume and the soil moisture. Instead of soil water content, the soil gas diffusion
coefficient DS was used as factor, which allowed to derive a single functional relationship for all gas species for each scenario.
This procedure was chosen as an efficient alternative to inverse modelling of individual datasets as described in (Laemmel et
al., 2018).
10
2.3 Field measurements
Experiments were part of a field campaign to measure N2O fluxes and denitrification in an arable soil cropped with maize. The
soil was a Haplic Luvisol developed in loess (silt loamy loam with 83±3% % silt, 15±3% clay, 2±0.5 % sand) with a pH of
6.7±0.1 (in CaCl2), a total organic carbon content of 1.24 ± 0.18 % (TOC) and a total nitrogen content of 0.16±0.02 % N in
the 0-30 cm topsoil layer. Experiments were conducted between May 30 and June 4 2016. 15
Four aluminium cylinders of 35 cm length and tapered at the lower end were driven into the soil to 30 cm depth, thus leaving
the upper end 5 cm above the soil surface. 15N-labelling was conducted May 30 as described previously (Buchen et al., 2016).
Soil columns were fertilized with 15N-labelled KNO3 (70 atom % 15N) at 10 mg N kg-1, resulting in a fertilizer
equivalent of 45 kg N per ha. The tracer was dissolved in distilled water and then applied by injections via 12
equidistant steel capillaries. Defined volumes were injected at 2.5, 7.5, 12.5, 17.5, 22.5 and 27.5 cm depth using a 20
peristaltic pump (Ismatec BVP, Wertheim, Germany) to achieve homogenous labelling at 0 to 30 cm depth. Fluxes
of N2O were determined using the closed chamber method (Hutchinson and Mosier, 1981) with opaque PVC
chambers with a volume of 4.42 dm³ (diameter 1.5 dm, height 2 dm). At each sampling date, chambers were closed
and sealed air tight with rubber bands for 120 minutes. Headspace sampling for GC analysis was performed in
evacuated screw-cap exetainers (12 mL) in a sampling interval of 0, 20, 40, 60 minutes using a 30 ml syringe. 120 25
minutes after closing, duplicate headspace samples were taken for GC and IRMS analysis. Flux measurements
were conducted daily, but only the final date of this measurement campaign (June 4) was used to evaluate the extent
of diffusive loss of 15N-labelled N2 and N2O to the subsoil. This was done by comparing conventional flux
measurements with cylinders open to the subsoil or with cylinders closed at the bottom. For the latter, cylinders
were carefully removed from the surrounding soil. Soil material extending below the lower end of the cylinders 30
was cut off with a knife. Bottom ends were sealed with plastic foil that was fixed at the outer cylinder wall with
adhesive tape. Finally, sealed cylinders were put back to their original position in the surrounding soil in order to
Biogeosciences Discuss., https://doi.org/10.5194/bg-2018-495Manuscript under review for journal BiogeosciencesDiscussion started: 13 December 2018c© Author(s) 2018. CC BY 4.0 License.

10
keep temperature within the cylinders identical to the surrounding soil. Chambers were fitted on the cylinders again
for 120 minutes. Samples were collected from the chambers as in the conventional flux measurement. Between
measurements with open and closed bottom, cylinders remained open at the top for 120 minutes to allow
equilibration of soil air with the free atmosphere and thus to release accumulated 15N2 and 15N2O.
5
2.4 Analysis
2.4.1 Soil analyses
Soil water content was determined by weight loss after 24h drying at 110ºC. Soil NO3- and NH4
+ were extracted in 0.01 M
CaCl2 solution (1:10 ratio) by shaking at room temperature for one hour and NO3- and NH4
+ concentrations were determined
colorimetrically with an automated analyser (Skalar Analytical B.V., Breda, The Netherlands). 10
2.4.2 Isotopic analysis of NO3
15N abundances of NO3- (aNO3) was measured according to the procedure described in (Eschenbach et al., 2017). NO3
- was
reduced to NO by Vanadium –III- chloride (VCl3). 15N measurement of produced NO was done with a quadrupole mass
spectrometer (GAM 200, InProcess, Bremen, Germany).
2.4.3 Total N2O 15
Samples were analysed using an Agilent 7890A gas chromatograph (Agilent Technologies, Santa Clara, CA, USA) equipped
with a pulsed discharge detector (VICI, V-D-3-I-7890-220). Precision, as given by the standard deviation (1� of four standard
gas mixtures) was typically 1.5%.
2.4.4.2 Isotopic analysis of N2 and N2O
Gas samples were analysed for m/z 28 (14N14N), 29 (14N15N) and 30 (15N15N) of N2 using a modified GasBench II preparation 20
system coupled to an IRMS (MAT 253, Thermo Fisher Scientific, Bremen, Germany) according to Lewicka-Szczebak et
al..(Lewicka-Szczebak et al., 2013) This system allows a simultaneous determination of mass ratios 29R (29/28) and 30R (30/28)
of three separated gas species (N2, N2+N2O and N2O), all measured as N2 gas after N2O reduction in a Cu oven. For each of
the analysed gas species, the fraction originating from the 15N-labelled pool with respect to total N in the gas sample (fp) as
well as the 15N enrichment of the 15N-labelled N pool (ap) producing N2O (ap_N2O) or N2+N2O (ap_N2+N2O) were calculated after 25
Spott et al. (2006) as described in Lewicka-Szczebak et al. (2017). The residual fraction of N2O remaining after N2O reduction
to N2 (rN2O) is given by the ratio fp_N2O / fp_N2+N2O. Typical repeatability of 29R and 30R (1 � of 3 replicate measurements) was
5×10⁻⁷ for both values.
Biogeosciences Discuss., https://doi.org/10.5194/bg-2018-495Manuscript under review for journal BiogeosciencesDiscussion started: 13 December 2018c© Author(s) 2018. CC BY 4.0 License.

11
2.5 Statistics
Results of flux measurements with bottom open or bottom closed were compared by a paired t-test. Fluxes were log-
transformed which is a common prerequisite for analysing denitrification data due to its skewed distribution (Folorunso and
Rolston, 1984). The measured additional N2+N2O flux was compared with the modelled value with a one-sample t-test.
Multiple regression analysis was conducted to derive a model of N2+N2O production. T-tests and regression analysis were 5
conducted with WinSTAT and SAS, respectively.
.
3 Results
3.1 Modeling
3.1.1 Surface and subsurface fluxes before and after chamber closure 10
The 3D spatial distribution of gas concentrations and the resulting diffusive fluxes shows highest concentrations in the centre
of the 15N-labelled soil volume with open chamber at steady state (Fig. 3a, Fig. S1). Time until steady state after the onset of
15(N2+N2O) production increased with decreasing gas diffusivity and increasing soil moisture. For soil water content (SWC)
of 0.34 g/g, it was approximately 3 hours (Fig. 2a). Soil air concentration of 15(N2+N2O)) at steady state also increased with 15
SWC (data not shown).
Chamber closing leads to an increase of maximum concentrations (Fig. S1) and also to lowering of surface fluxes (Figs. 3b
and 4).
After chamber closing, surface flux decreases continuously while subsurface flux increases and the storage flux initially
increases before gradually decreasing. This shows that the lowering of surface flux with increasing time of chamber closing 20
results from increasing subsoil flux but also from further accumulation of denitrification products in pore space. While surface
flux is largest among all fluxes at chamber closing, it is exceeded by subsoil flux after about one hour. With increasing SWC,
and thus decreasing diffusivity, the change in fluxes with time is lowering (Fig. 4). Highest relative subsoil fluxes are thus
obtained at lowest SWC. For N2O, the decrease in surface flux is slightly lower compared to N2 (Fig. 4). The change in relative
fluxes is identical for the different isotopologues of N2 and N2O (only shown for N2 in Fig. S3). 25
With decreasing depth of 15N-labelling, surface flux during the first hours after chamber closing increases, since less
denitrification products accumulate or are lost to the subsoil. This is evident by comparing fluxes obtained with 30 cm and 40
cm depth of confined 15N-labelled soil (Fig. 5). Increasing cylinder length below the depth of labelled soil, e.g., if the length
of the cylinder extends 15 cm below the 30 cm or 45 cm deep labelled soil, yields an increase in surface flux and slight decrease
in subsoil flux due to more accumulation of 15N-labelled gases below the 15N-labelled soil and thus smaller concentration 30
Biogeosciences Discuss., https://doi.org/10.5194/bg-2018-495Manuscript under review for journal BiogeosciencesDiscussion started: 13 December 2018c© Author(s) 2018. CC BY 4.0 License.

12
gradients to the subsoil. Hence, underestimation of production based on surface flux is more severe with deeper labelling, but
is lowering if the depth of confinement is increased.
If diffusion to the subsoil was omitted, e.g. by closing the bottom of cylinders in the field, or during laboratory incubations,
soil air concentrations and surface fluxes increase (Fig. 6). When comparing values with and without omitted subsoil diffusion, 5
relative surface flux two hours after closure was 0.75 and 0.35, respectively. But surface flux was still significantly lower than
production due to continuing pore space accumulation (relative storage flux of 0.25 after 2 hours).
10
Figure 3a: Increase in pore space and chamber concentrations of 15N15N after chamber closing.
15
Biogeosciences Discuss., https://doi.org/10.5194/bg-2018-495Manuscript under review for journal BiogeosciencesDiscussion started: 13 December 2018c© Author(s) 2018. CC BY 4.0 License.

13
Figure 3b: Relative fluxes of 15N15N after chamber closing
Figure 4: Relative fluxes following chamber closing with different water contents (surface flux, storage flux and subsoil flux starting
positive, at zero and negative, respectively). 5
Biogeosciences Discuss., https://doi.org/10.5194/bg-2018-495Manuscript under review for journal BiogeosciencesDiscussion started: 13 December 2018c© Author(s) 2018. CC BY 4.0 License.

14
Figure 5: Impact of the depth of the active core (representing depth of 15N labelling) and/or length of cylinder on relative surface
and subsurface fluxes 5
Fig. 6: Simulated time course of surface and subsurface fluxes with bottom open or closed bottom. 10
Biogeosciences Discuss., https://doi.org/10.5194/bg-2018-495Manuscript under review for journal BiogeosciencesDiscussion started: 13 December 2018c© Author(s) 2018. CC BY 4.0 License.

15
3.1.2 Determination of denitrification rates based on chamber concentration
We conducted several scenario runs with the model, obtaining the following equation to calculate the production of each gas
species of interest (x = 14N14N, 14N15N, 15N15N, 14N14NO, 14N15NO or 15N15NO) based on chamber concentration after a certain
time of closure: 5
Px = Cx × �+ � × Cx × Ds (1)
where Px is the production for the respective gas species (L ha-1 d-1), Cx is concentration in ppm, Ds the apparent gas
diffusion coefficient (cm2 s-1) and � and � are fitting parameters. 10
Table 3: Coefficients for the calculation of denitrification rates using Eq. 1 based on chamber concentrations for two hour chamber
closing time, 30 cm depth of 15N labelling, chamber height of 15 cm and 15 cm diameter and assuming subsoil diffusivity identical
to diffusivity of the 15N-labelled soil. Coefficients � and � were derived by regression analysis of modelled concentration (R2 > 0.999).
� �
Production, Bottom open 34.6310 ± 0.01 410.1 ± 0.434
Production, Bottom closed 18.7160 ± 0.0115 182.6 ± 0.4902
Subsoil flux, bottom open -15.5614 ± 0.0115 -249.7±0.4979
Surface flux, bottom open 16.5368 ± 0.00467 -11.5651 ±0.2021
Surface flux, bottom closed 16.8835 ± 0.00102 -0.0918 ±0.0436
15
3.2 Field measurement
3.2.1 Soil moisture, mineral N and bulk density
Average NO3--N was 16 mg N kg-1 without significant trends with depth and no significant differences between cylinders
(Table S1). NH4+-N was highest in 0 to 10 cm depth (1.8 mg N kg-1) and < 1 mg N kg-1 below 10 cm depth. Average 15N atom 20
fraction of extracted NO3- (15a) was 0.15, but values increased with depth in all cylinders, where 20-30 cm averages (0.2) were
more than twice compared to 0-10 cm depth (0.09). Bulk density ranged between 1.48 and 1.52 with highest values at 10 to
20 cm depth. WFPS was higher at 0 to 10 cm depth (72%) than at 10 to 30 cm depth (60 to 62 %) with similar depth trends in
all cylinders.
25
Biogeosciences Discuss., https://doi.org/10.5194/bg-2018-495Manuscript under review for journal BiogeosciencesDiscussion started: 13 December 2018c© Author(s) 2018. CC BY 4.0 License.

16
Table 4: N2+N2O fluxes of field experiments with 2 hours chamber closing with and without closed bottom in comparison with
modelled data.
# Type and determination of data Result
1 Measured N2 + N2O surface flux, bottom open (g N ha-1 d-1) 589 ± 284
2 Measured N2 + N2O surface flux, bottom closed (g N ha-1 d-1) 805 ± 369
3 % additional measured surface flux with bottom closed [100×(#2-
#1)/#2]
36.7
4 Modelled relative surface flux, bottom open 0.473
5 Modelled relative surface flux, bottom closed 0.895
6 % additional modelled surface flux with bottom closed [100×(#5-
#4)/#4]
89.3
7 Modelled N2 + N2O production (g N ha-1 d-1) 1055
8 Modelled relative subsoil flux, bottom open 0.451
9 Modelled relative storage flux, bottom open 0.076
10 modelled relative storage flux, bottom closed 0.105
3.2.2 Field fluxes 5
The comparison between surface flux with or without closing the cylinder bottom was conducted on June 4, 2016 with chamber
closing at 10:40 AM (bottom open) and 2:40 PM (bottom closed). Mean surface flux of N2+N2O with bottom open was 589 g
N ha-1 d-1 (Table 4) and thus in between the fluxes observed during preceding two days (460 ± 161 g N ha-1 d-1 on June 2, 6:50
PM; 657 ± 206 g N ha-1 d-1 on June 3 at 11 AM). This shows that denitrification rates were quite stable over several days and
that denitrification was a significant N loss, probably due to the coincidence of high soil moisture and NO3- content (Table 10
S1). The residual fraction of N2O remaining after N2O reduction to N2 (rN2O) was 0.15 on average (Table S2), showing that N2
dominated N2+N2O fluxes. Mean 15a values for each cylinder were somewhat variable (0.09 to 0.18). Means of 15a (Table S1)
and of the 15N enrichment of the labelled N pool producing N2O (ap_N2O, Table S2) were in close agreement (0.15 and 0.16,
respectively).
15
Biogeosciences Discuss., https://doi.org/10.5194/bg-2018-495Manuscript under review for journal BiogeosciencesDiscussion started: 13 December 2018c© Author(s) 2018. CC BY 4.0 License.

17
Comparing N2+N2O surface fluxes when the cylinders were open or closed at the bottom resulted in significantly (P < 0.05)
higher surface fluxes when closed (Table 4) which was evident for each of the replicate micro-plots (Table S2). Because
bottom-closed measurement was conducted as soon as possible immediately after the bottom-open measurement, i.e. after
venting of the cylinders with chambers open for two hours and thus four hours after bottom open measurements, we assumed
that denitrification rates had not changed significantly and the increase in surface fluxes was due to bottom closing. 5
The ap_N2O values of bottom-open and bottom-closed measurements exactly coincided. Conversely, the N2O residual fraction
(rN2O) of individual cylinders differed inconsistently since rN2O of bottom-closed measurements were higher in replicates 1 and
4, but were lower in replicates 2 and 3.
10
3.3 Comparison of modelled and measured surface flux
The ability of the model to predict the time pattern of gas accumulation was evaluated by comparing measured and simulated
values. Model runs using the Ds values calculated from measured moisture and bulk density data of the field experiment 15
assuming open or closed bottom yielded relative surface fluxes of 0.47 and 0.9, respectively (Table 4). The additional surface
flux with bottom closed was thus quite relevant according to both, model and measurement. However, the magnitude of the
modelled additional flux (89%) was more than twice, and thus significantly higher (P < 0.001) compared to the measured
value. Using Eq. 1 and N2+N2O concentration in the chamber measured in the field with open cylinder bottom and using
respective coefficients of Table 1 resulted in N2+N2O production of 1055 g N ha-1 d-1. The modelled subsurface flux with 20
bottom open was almost half of the N2+N2O production. Modelled accumulation of N2+N2O in the pore space of the 15N-
labelled soil was higher with bottom closed (relative storage flux of 0.11) compared to bottom open (relative storage flux of
0.08). Evaluation of N2 and N2O fluxes individually yielded results similar to N2+N2O fluxes (data not shown).
4 Discussion
25
4.1 Field study
Our comparison between 15(N2+N2O) fluxes from 15N-labelled micro-plots with and without closing the bottom of the cylinders
supplied for the first time direct evidence for the underestimation of 15(N2+N2O) production due to diffusive loss to the subsoil
as suggested earlier (Mahmood et al., 1998; Sgouridis et al., 2016). In view of the poor sensitivity of the 15N gas flux method
in the field under ambient atmosphere (Well et al., 2018), a prerequisite for this proof was the occurrence of sufficiently high 30
and relatively stable denitrification rates. These conditions were given in our experiment due to the coincidence of high soil
moisture and NO3--N during the experimental period. Considering the relatively low variation of denitrification rates during
Biogeosciences Discuss., https://doi.org/10.5194/bg-2018-495Manuscript under review for journal BiogeosciencesDiscussion started: 13 December 2018c© Author(s) 2018. CC BY 4.0 License.

18
two days preceding the comparison, we conclude that the increase in surface fluxes after closing of the cylinder bottom was
mainly due to the exclusion of diffusive loss to the subsoil.
While the increase in 15(N2+N2O) surface flux after bottom closing was comparable among the four replicates, this was not the
case for the N2O flux and rN2O, which both exhibited considerable variabilities. rN2O showed larger deviation probably because 5
the N2O reduction to N2 is not only sensitive to N2O concentration in pore space, but also to changes in control factors like
temperature, O2, NO3- and labile C (Mueller and Clough, 2014). We suspect that the latter factors were somewhat variable
within the replicates and that their interaction with N2O concentration lead to the observed variability in rN2O. The apparent
sensitivity of rN2O to bottom closing shows that care should be taken when interpreting N2O reduction to N2 from rN2O
determined in closed laboratory systems. Apart from our observations, an effect of bottom closure on N2O reduction is to be 10
expected since the resulting increased pore space N2O concentration would favour N2O reduction. This effect would thus lead
to overestimation of N2O reduction when extrapolating results to the field.
4.2 Estimating production of N2 and N2O based on surface fluxes and diffusion modelling 15
Modelling diffusive fluxes of N2 and N2O evolved from 15N-labelled soil showed that denitrification rates are underestimated
by more than 50% when only surface fluxes are taken into account, which has been general practice in the past (Sgouridis et
al., 2016) and references therein). Modelling also confirmed that in contrast to our hypothesis, not only subsoil flux is a relevant
fraction of 15(N2+N2O) production, but also the increasing accumulation during chamber closing. Several authors increased 20
the chamber deployment time of 40 to 60 minutes as common for N2O flux measurement (Parkin et al., 2012), e.g., to 2 hours
((Tauchnitz et al., 2015), (Buchen et al., 2016)) or even 24 hours (Sgouridis et al., 2016). This was done to increase 15N2+N2O
concentration in the chamber and thus to improve the detection limit for denitrification at a given IRMS precision. Because
surface fluxes are lowering with deployment time, it is clear that the underestimation of surface flux based denitrification rates
is also increasing. 25
For laboratory studies with the 15N gas flux method using closed incubation systems, our findings on 15N2 and 15N2O
accumulation in pore space is quite relevant. Closing incubation vessels for a limited time and estimating denitrification from
headspace concentration (e.g Meyer et al., 2010; Siegel et al., 1982) inevitably leads to underestimation of denitrification rates.
Experimental evidence for this underestimation was obtained by destroying pore structure at final sampling to homogenize
headspace and pore space (Harter et al., 2016). Because the fraction of denitrification products accumulated in pore space 30
increases with decreasing diffusivity, the problem is most severe for water-saturated soils. While this had also previously been
solved by homogenizing headspace and pore space before sampling (Well and Myrold, 1999), other studies with water –
saturated substrates did not take accumulated gases into account (e.g. Nielsen, 1992). Our model approach would be suitable
Biogeosciences Discuss., https://doi.org/10.5194/bg-2018-495Manuscript under review for journal BiogeosciencesDiscussion started: 13 December 2018c© Author(s) 2018. CC BY 4.0 License.

19
to estimate pore space accumulation of denitrification products in closed laboratory incubations and could also be used to
correct previously published data.
Our results show that extending chamber deployment time is not a good strategy to improve the detection limit for
denitrification, because the fraction of gaseous denitrification products that is not emitted at the soil surface is increasing with
time. Although we can now estimate this fraction with our model, uncertainties of the modelled data lead to increasing 5
uncertainty in denitrification estimates with deployment time. Another way to improve detection is to lower the N2 background
concentration in the field by flushing chambers with an N2-depleted gas matrix (Well et al., 2018). Due to the good sensitivity
of this method, chamber deployment could be kept at one hour. Principally, our modeling approach could also determine the
subsurface flux and pore space accumulation for that method, but will have to be adapted to take diffusion dynamics in the N2-
depleted gas matrix into account. 10
Because the flux dynamics of gaseous denitrification products in the soil had not been taken into account in past field flux and
certain laboratory studies, we assume that numerous studies underestimated denitrification significantly. It can thus be
concluded that soil denitrification is probably even more relevant than assumed today.
Using our 3 D model it is possible to determine denitrification rates from surface fluxes and diffusivity, since this allows to
take subsoil diffusion and pore space accumulation into account. For experiments with the same dimensions and bulk density 15
as assumed in our regression model it is also possible to calculate production from surface flux using the parameters of Table
3. Principally, the regression approach offers an easy way to derive production without the need to run the 3D model. But to
obtain a general solution that would fit any experimental conditions in terms of bulk density, depth of labelling, chamber
design and deployment time, it will be necessary to conduct multiple model runs, which was beyond the scope of this paper.
The general agreement between measured and modelled increase in surface flux after closing the cylinder bottom is a first 20
proof of our concept to quantify denitrification rates using surface fluxes and modelling. Reasons for the observed deviations
between experimental and model results can be manifold, e.g., imperfect estimate of Ds by the empirical model (Millington &
Quirk), spatial variability of diffusivity (Kuhne et al., 2012; Lange et al., 2009; Maier et al., 2017; Maier and Schack-Kirchner,
2014; Marrero, 1972) within the 10 cm layers for which Ds was determined, spatial variability of denitrification rates
(Groffman et al., 2009), production of 15N2 and 15N2O from possibly leached 15NO3- below the confined soil cores, and a 25
possible shift in denitrification rates during the 6 hours between the two experiments with bottom open and bottom closed. A
quantitative evaluation of the model by 15N gas flux experiments would be quite challenging since it would mean to assess all
aforementioned uncertain factors and to include heterogeneity in the modelling. Future attempts are therefore necessary to
improve model evaluation and check how our approach will perform under heterogenic conditions. But despite these
uncertainties, the general agreement of model and measurements shows that our approach leads to improved denitrification 30
estimates.
Biogeosciences Discuss., https://doi.org/10.5194/bg-2018-495Manuscript under review for journal BiogeosciencesDiscussion started: 13 December 2018c© Author(s) 2018. CC BY 4.0 License.

20
5 Conclusions
Measurements and production-diffusion modelling showed that field surface fluxes of 15N-labelled N2 and N2O emitted from
15N-labelled soil NO3- severely underestimate denitrification due to subsoil flux and accumulation in pore space. The extent of
underestimation increases with chamber deployment time. Soil denitrification has thus been underestimated in many previous
studies using the 15N gas flux method without taking subsoil flux and accumulation in pore space into account. While 5
production-diffusion modelling is a promising tool to estimate subsoil flux and storage flux, the observed deviations between
experimental and modelled subsoil flux reveal the need for refined model evaluation.
Acknowledgements:
This study was funded by the Deutsche Forschungsgemeinschaft through the project LE 3367/1-1 and the research unit 2337: 10
“Denitrification in Agricultural Soils: Integrated Control and Modeling at Various Scales (DASIM)”. We thank Frank
Hegewald for technical support in experiments, Martina Heuer and Jennifer Ehe for stable isotope analysis, Kerstin Gilke and
Andrea Oehns-Rittgerod for analysis by GC, and Roland Fuß for support in statistical analyses. We further thank for supply
of an experimental field site by the Faculty of Agriculture, University of Applied Sciences Southern Westphalia.
15
References
Bollmann, A., and Conrad, R.: Enhancement by acetylene of the decomposition of nitric oxide in soil, Soil Biology &
Biochemistry, 29, 1057-1066, 10.1016/s0038-0717(97)00006-0, 1997a.
Bollmann, A., and Conrad, R.: Acetylene blockage technique leads to underestimation of denitrification rates in oxic soils 20
due to scavenging of intermediate nitric oxide, Soil Biology & Biochemistry, 29, 1067-1077, 10.1016/s0038-
0717(97)00007-2, 1997b.
Buchen, C., Lewicka-Szczebak, D., Fuss, R., Helfrich, M., Flessa, H., and Well, R.: Fluxes of N2 and N2O and contributing
processes in summer after grassland renewal and grassland conversion to maize cropping on a Plaggic Anthrosol and a
Histic Gleysol, Soil Biology & Biochemistry, 101, 6-19, 10.1016/j.soilbio.2016.06.028, 2016. 25
Butterbach-Bahl, K., Willibald, G., and Papen, H.: Soil core method for direct simultaneous determination of N-2 and N2O
emissions from forest soils, Plant and Soil, 240, 105-116, 10.1023/a:1015870518723, 2002.
Butterbach-Bahl, K., Baggs, E. M., Dannenmann, M., Kiese, R., and Zechmeister-Boltenstern, S.: Nitrous oxide emissions
from soils: how well do we understand the processes and their controls?, Philos T R Soc B, 368,
10.1098/rstb.2013.0122, 2013. 30
Coplen, T. B.: Guidelines and recommended terms for expression of stable-isotope-ratio and gas-ratio measurement results,
Rapid Communications in Mass Spectrometry, 25, 2538-2560, 10.1002/rcm.5129, 2011.
Eschenbach, W., Lewicka-Szczebak, D., Stange, C. F., Dyckmans, J., and Well, R.: Measuring N-15 Abundance and
Concentration of Aqueous Nitrate, Nitrite, and Ammonium by Membrane Inlet Quadrupole Mass Spectrometry,
Analytical Chemistry, 89, 6077-6082, 10.1021/acs.analchem.7b00724, 2017. 35
Felber, R., Conen, F., Flechard, C. R., and Neftel, A.: Theoretical and practical limitations of the acetylene inhibition
technique to determine total denitrification losses, Biogeosciences, 9, 4125-4138, 10.5194/bg-9-4125-2012, 2012.
Biogeosciences Discuss., https://doi.org/10.5194/bg-2018-495Manuscript under review for journal BiogeosciencesDiscussion started: 13 December 2018c© Author(s) 2018. CC BY 4.0 License.

21
Folorunso, O., and Rolston, D.: Spatial variability of field-measured denitrification gas fluxes. Soil Sci. Soc. Am. J. 48,
1214�1219, 1984.
Groffman, P., Butterbach-Bahl, K., Fulweiler, R. W., Gold, A. J., Morse, J. L., Stander, E. K., Tague, C., Tonitto, C., and
Vidon, P.: Challenges to incorporating spatially and temporally explicit phenomena (hotspots and hot moments) in
denitriWcation models, Biogeochemistry, 93, 49-77, 2009. 5
Groffman, P. M., Altabet, M. A., Böhlke, J. K., Butterbach-Bahl, K., David, M. B., Firestone, M. K., Giblin, A. E., Kana, T.
M., Nielsen, L. P., and Voytek, M. A.: Methods for measuring denitrification diverse approaches to a difficult problem,
Ecol. Appl., 16, 2091-2122, 2006.
Harter, J., Guzman-Bustamante, I., Kuehfuss, S., Ruser, R., Well, R., Spott, O., Kappler, A., and Behrens, S.: Gas
entrapment and microbial N2O reduction reduce N2O emissions from a biochar-amended sandy clay loam soil, 10
Scientific Reports, 6, 10.1038/srep39574, 2016.
Hutchinson, G., and Mosier, A.: Improved soil cover method for field measurement of nitrous oxide fluxes, Soil Science
Society of America Journal, 45, 311-316, 1981.
Jost, W.: Diffusion in Solids, Liquids and Gases, Academic, San Diego, Calif., 558 pp., 1960.
Kuhne, A., Schack-Kirchner, H., and Hildebrand, E. E.: Gas diffusivity in soils compared to ideal isotropic porous media, J 15
Plant Nutr Soil Sc, 175, 34-45, 10.1002/jpln.201000438, 2012.
Laemmel, T., Mohr, M., Longdoz, B., Schack-Kirchner, H., Lang, F., Schindler, D., and Maier, M.: From above the forest
into the soil - how wind affects soil gas transport through air pressure fluctuations. , Agricultural and Forest
Meteorology, accepted, 2018.
Lange, S. F., Allaire, S. E., and Rolston, D. E.: Soil-gas diffusivity in large soil monoliths, European Journal of Soil Science, 20
60, 1065-1077, 10.1111/j.1365-2389.2009.01172.x, 2009.
Lewicka-Szczebak, D., Well, R., Giesemann, A., Rohe, L., and Wolf, U.: An enhanced technique for automated
determination of N-15 signatures of N2, (N2+N2O) and N2O in gas samples, Rapid Communications in Mass
Spectrometry, 27, 1548-1558, Doi 10.1002/Rcm.6605, 2013.
Lewicka-Szczebak, D., Augustin, J., Giesemann, A., and Well, R.: Quantifying N2O reduction to N2 based on N2O 25
isotopocules – validation with independent methods (helium incubation and 15N gas flux method), Biogeosciences, 14,
711-732, 10.5194/bg-14-711-2017, 2017.
Mahmood, T., Malik, K. A., Shamsi, S. R. A., and Sajjad, M. I.: Denitrification and total N losses from an irrigated sandy-
clay loam under maize-wheat cropping system, Plant and Soil, 199, 239-250, 10.1023/a:1004335132617, 1998.
Maier, M., and Schack-Kirchner, H.: Using the gradient method to determine soil gas flux: A review, Agricultural and Forest 30
Meteorology, 192, 78-95, 10.1016/j.agrformet.2014.03.006, 2014.
Maier, M., Paulus, S., Nicolai, C., Stutz, K. P., and Nauer, P. A.: Drivers of Plot-Scale Variability of CH4 Consumption in a
Well-Aerated Pine Forest Soil, Forests, 8, 10.3390/f8060193, 2017.
Marrero, T. R., Mason, E.A.: Gaseous Diffusion Coefficients., J. Phys. Chem. Ref. Data 1, 1972.
Meyer, A., Bergmann, J., Butterbach-Bahl, K., and Bruggemann, N.: A new 15N tracer method to determine N turnover and 35
denitrification of Pseudomonas stutzeri, Isotopes in Environmental and Health Studies, 46, 409-421,
10.1080/10256016.2010.528840, 2010.
Millington, R., and Quirk, J. P.: Permeability of porous solids, Transactions of the Faraday Society, 57, 1200-&,
10.1039/tf9615701200, 1961.
Mueller, C., and Clough, T. J.: Advances in understanding nitrogen flows and transformations: gaps and research pathways, 40
Journal of Agricultural Science, 152, S34-S44, 10.1017/s0021859613000610, 2014.
Biogeosciences Discuss., https://doi.org/10.5194/bg-2018-495Manuscript under review for journal BiogeosciencesDiscussion started: 13 December 2018c© Author(s) 2018. CC BY 4.0 License.

22
Mulvaney, R. L.: Evaluation of N-15 tracer techniques for direct measurement of denitrification in soil. 3. Laboratory
studies., Soil Science Society of America Journal, 52, 1327-1332, 10.2136/sssaj1988.03615995005200050022x, 1988.
Mulvaney, R. L., and Vandenheuvel, R. M.: Evaluation of N-15 tracer techniques for direct measurement of denitrification
in soil. 4. Field studies., Soil Science Society of America Journal, 52, 1332-1337,
10.2136/sssaj1988.03615995005200050023x, 1988. 5
Nadeem, S., Dorsch, P., and Bakken, L. R.: Autoxidation and acetylene-accelerated oxidation of NO in a 2-phase system:
Implications for the expression of denitrification in ex situ experiments, Soil Biology & Biochemistry, 57, 606-614,
DOI 10.1016/j.soilbio.2012.10.007, 2013.
Nielsen, L. P.: Denitrification in sediment determined from nitrogen isotope pairing, Fems Microbiol Ecol, 86, 357-362,
10.1111/j.1574-6968.1992.tb04828.x, 1992. 10
Parkin, T. B., Venterea, R. T., and Hargreaves, S. K.: Calculating the Detection Limits of Chamber-based Soil Greenhouse
Gas Flux Measurements, Journal of Environmental Quality, 41, 705-715, 10.2134/jeq2011.0394, 2012.
Saggar, S., Jha, N., Deslippe, J., Bolan, N. S., Luo, J., Giltrap, D. L., Kim, D. G., Zaman, M., and Tillman, R. W.:
Denitrification and N2O:N2 production in temperate grasslands: Processes, measurements, modelling and mitigating
negative impacts, Science of the Total Environment, 465, 173-195, 10.1016/j.scitotenv.2012.11.050, 2013. 15
Scholefield, D., Hawkins, J. M. B., and Jackson, S. M.: Use of a flowing helium atmosphere incubation technique to measure
the effects of denitrification controls applied to intact cores of a clay soil, Soil Biology & Biochemistry, 29, 1337-1344,
10.1016/s0038-0717(97)00059-x, 1997.
Sgouridis, F., Stott, A., and Ullah, S.: Application of the N-15 gas-flux method for measuring in situ N2 and N2O fluxes due
to denitrification in natural and semi-natural terrestrial ecosystems and comparison with the acetylene inhibition 20
technique, Biogeosciences, 13, 1821-1835, 10.5194/bg-13-1821-2016, 2016.
Siegel, R. S., Hauck, R. D., and Kurtz, L. T.: Determination of 30N2 and application to measurement of N2 evolution during
denitrification, Soil Science Society of America Journal, 46, 68-74, 1982.
Spott, O., Russow, R., Apelt, B., and Stange, C. F.: A N-15-aided artificial atmosphere gas flow technique for online
determination of soil N-2 release using the zeolite Kostrolith SX6 (R), Rapid Communications in Mass Spectrometry, 25
20, 3267-3274, 10.1002/rcm.2722, 2006.
Stevens, R. J., Laughlin, R. J., Atkins, G. J., and Prosser, S. J.: Automated determination of nitrogen-15-labeled dinitrogen
and nitrous –oxide by mass-spectrometry, Soil Science Society of America Journal, 57, 981-988,
10.2136/sssaj1993.03615995005700040017x, 1993.
Tauchnitz, N., Spott, O., Russow, R., Bernsdorf, S., Glaser, B., and Meissner, R.: Release of nitrous oxide and dinitrogen 30
from a transition bog under drained and rewetted conditions due to denitrification: results from a N-15 nitrate-bromide
double-tracer study, Isotopes in Environmental and Health Studies, 51, 300-321, 10.1080/10256016.2015.1011634,
2015.
Well, R., and Myrold, D. D.: Laboratory evaluation of a new method for in situ measurement of denitrification in water-
saturated soils, Soil Biology & Biochemistry, 31, 1109-1119, 1999. 35
Well, R., and Myrold, D. D.: A proposed method for measuring subsoil denitrification in situ, Soil Science Society of
America Journal, 66, 507-518, 2002.
Well, R., Burkart, S., Giesemann, A., Grosz, B., Köster, J. R., and Lewicka-Szczebak, D.: Improvement of the 15N gas flux
method for in situ measurement of soil denitrification and its product stoichiometry, Rapid Communications in Mass
Spectrometry, doi:10.1002/rcm.8363, 2018. 40
Biogeosciences Discuss., https://doi.org/10.5194/bg-2018-495Manuscript under review for journal BiogeosciencesDiscussion started: 13 December 2018c© Author(s) 2018. CC BY 4.0 License.