15-1 Copyright 2010 McGraw-Hill Australia Pty Ltd PowerPoint slides to accompany Croucher,...
22
15-1 Copyright 2010 McGraw-Hill Australia Pty Ltd PowerPoint slides to accompany Croucher, Introductory Mathematics and Statistics, 5e Chapter 15 Elementary Probability Introductory Mathematics & Statistics
-
Upload
toby-johnson -
Category
Documents
-
view
216 -
download
1
Transcript of 15-1 Copyright 2010 McGraw-Hill Australia Pty Ltd PowerPoint slides to accompany Croucher,...
15-1Copyright 2010 McGraw-Hill Australia Pty Ltd PowerPoint slides to accompany Croucher, Introductory Mathematics and Statistics, 5e
Chapter 15
Elementary Probability
Introductory Mathematics & Statistics

15-2Copyright 2010 McGraw-Hill Australia Pty Ltd PowerPoint slides to accompany Croucher, Introductory Mathematics and Statistics, 5e
Learning Objectives
• Understand elementary probability concepts
• Calculate the probability of events
• Distinguish between mutually exclusive, dependent and independent events
• Calculate conditional probabilities
• Understand and use the general addition law for probabilities
• Understand and apply Venn diagrams
• Understand and apply probability tree diagrams

15-3Copyright 2010 McGraw-Hill Australia Pty Ltd PowerPoint slides to accompany Croucher, Introductory Mathematics and Statistics, 5e
15.1 Introduction
• In everyday language we often refer to the probability that certain events will happen
• We also use the word ‘chance’ as a substitute for probability on some occasions
• While we all use the word ‘probability’ in our language, there would be few people who could provide a formal definition of its meaning
Examples– There is a 10% chance that it will rain – There is a 30% chance that Essendon will win the AFL
premiership in the year 2010– There is a 25% chance that a certain investment will yield a profit
in the coming year– There is a 50–50 chance that I will get a tax refund next year– The probability that a 767 jet plane will crash into the Sydney
Harbour Bridge before the year 2030 is 1 in 100 million
15-4Copyright 2010 McGraw-Hill Australia Pty Ltd PowerPoint slides to accompany Croucher, Introductory Mathematics and Statistics, 5e
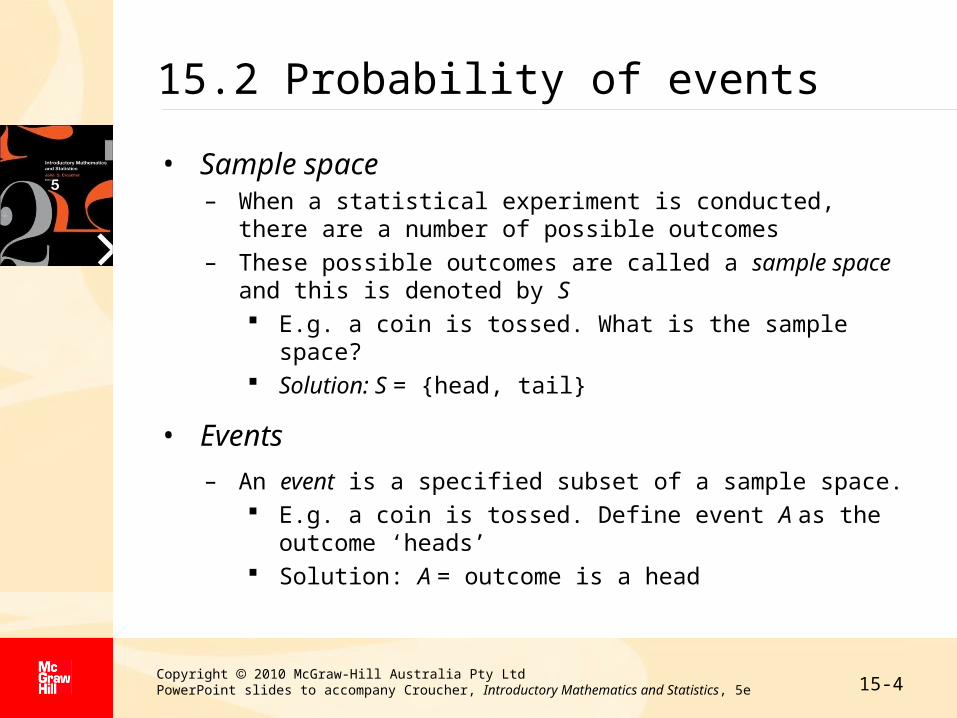
15.2 Probability of events
• Sample space– When a statistical experiment is conducted, there are a
number of possible outcomes– These possible outcomes are called a sample space and
this is denoted by S E.g. a coin is tossed. What is the sample space? Solution: S = {head, tail}
• Events
– An event is a specified subset of a sample space. E.g. a coin is tossed. Define event A as the outcome
‘heads’ Solution: A = outcome is a head

15-5Copyright 2010 McGraw-Hill Australia Pty Ltd PowerPoint slides to accompany Croucher, Introductory Mathematics and Statistics, 5e
15.2 Probability of events (cont…)• Events (cont…)
– More than one event can be defined from a sample space. E.g. suppose a card is drawn at random from a pack of 52
playing cards. Define events A, B and C as drawing an ace, red card and face card, respectively
Solution: A = card drawn is an ace, B = card drawn is red, C = card drawn is a face card
– The impossible event (or empty set) is one that contains no outcomes. It is often denoted by the Greek letter (phi) E.g. a hand of 5 cards is dealt from a deck z. Let A be the
event that the hand contains 5 aces. Is this possible? Solution : Since there are only 4 aces in the deck, event A
cannot occur. Hence A is an impossible event.
15-6Copyright 2010 McGraw-Hill Australia Pty Ltd PowerPoint slides to accompany Croucher, Introductory Mathematics and Statistics, 5e
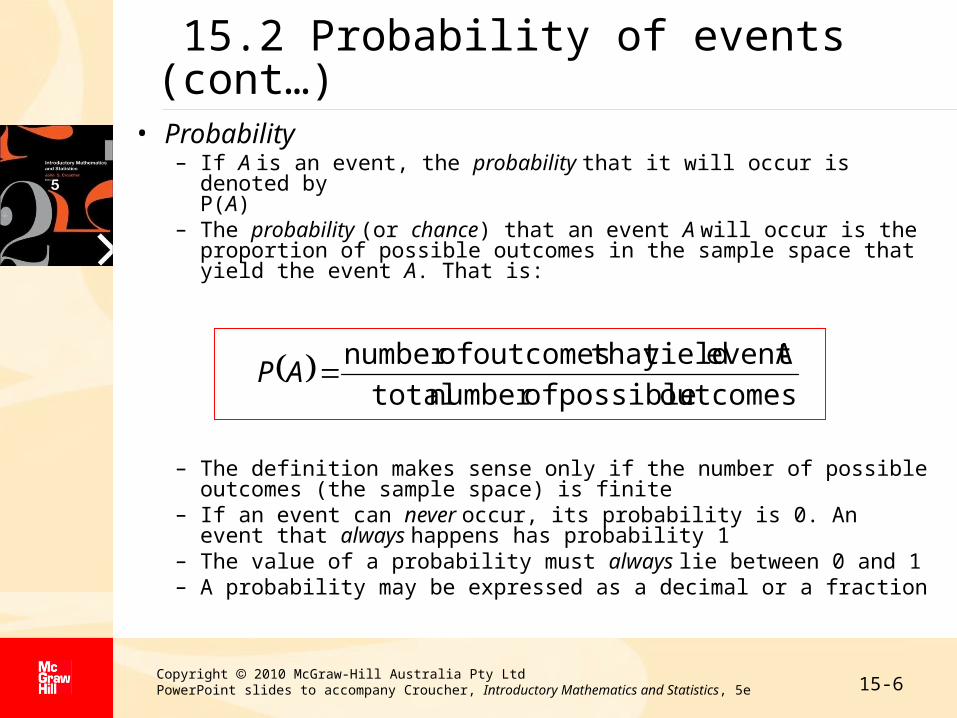
15.2 Probability of events (cont…)• Probability
– If A is an event, the probability that it will occur is denoted by P(A)
– The probability (or chance) that an event A will occur is the proportion of possible outcomes in the sample space that yield the event A. That is:
– The definition makes sense only if the number of possible outcomes (the sample space) is finite
– If an event can never occur, its probability is 0. An event that always happens has probability 1
– The value of a probability must always lie between 0 and 1– A probability may be expressed as a decimal or a fraction
outcomespossibleofnumbertotal
AeventyieldthatoutcomesofnumberAP

15-7Copyright 2010 McGraw-Hill Australia Pty Ltd PowerPoint slides to accompany Croucher, Introductory Mathematics and Statistics, 5e
15.2 Probability of events (cont…)
• Mutually exclusive events– Two events A and B are said to be mutually exclusive if they
cannot occur simultaneously– If two events A and B are mutually exclusive, the following
relationship holds:
– Suppose that are mutually exclusive events. Then:
BPAPBorAP
n321 A,A,A,A
n321
n321
APAPAPAP
AAorAorAP
15-8Copyright 2010 McGraw-Hill Australia Pty Ltd PowerPoint slides to accompany Croucher, Introductory Mathematics and Statistics, 5e
15.2 Probability of events (cont…)
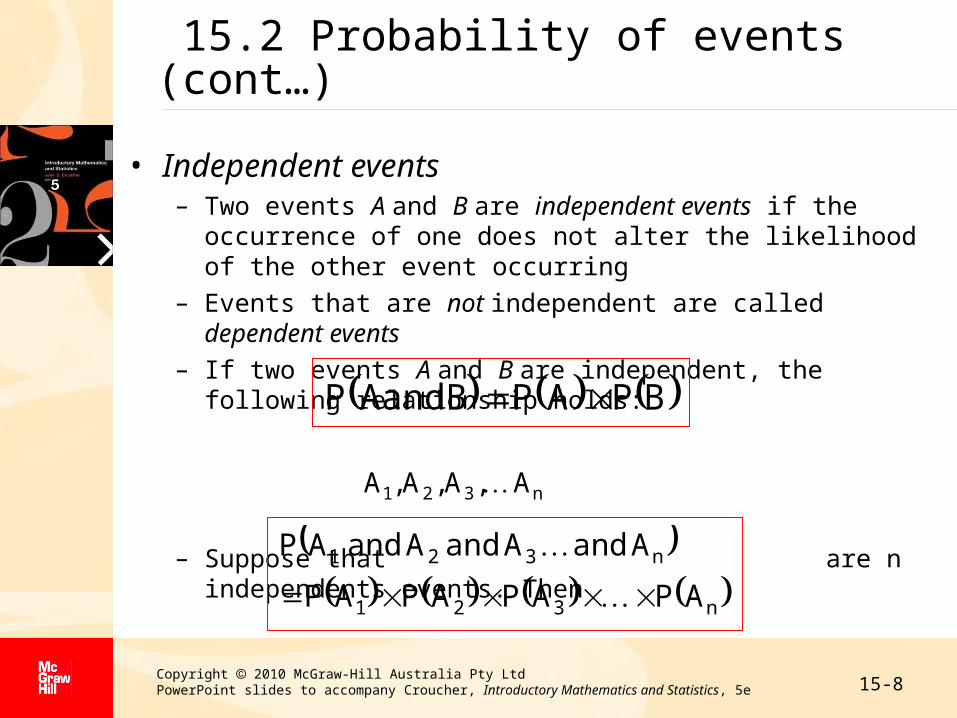
• Independent events– Two events A and B are independent events if the occurrence of
one does not alter the likelihood of the other event occurring– Events that are not independent are called dependent events– If two events A and B are independent, the following relationship
holds:
– Suppose that are n independents events. Then
n321
n321
APAPAPAP
AandAandAandAP
BPAPAandBP
n321 A,A,A,A

15-9Copyright 2010 McGraw-Hill Australia Pty Ltd PowerPoint slides to accompany Croucher, Introductory Mathematics and Statistics, 5e
15.2 Probability of events (cont…)
• Complementary events– The complement of an event is the set of outcomes of a
sample space for which the event does not occur – Two events that are complements of each other are said to
be complementary events(Note: complementary events are mutually
exclusive)– Suppose we define the events:
A = no one has the characteristicB = at least 1 person has the characteristic
Then A and B are complementary events
P (at least 1 person has the characteristic) = 1 – P (no person has the characteristic)
15-10Copyright 2010 McGraw-Hill Australia Pty Ltd PowerPoint slides to accompany Croucher, Introductory Mathematics and Statistics, 5e
15.2 Probability of events (cont…)
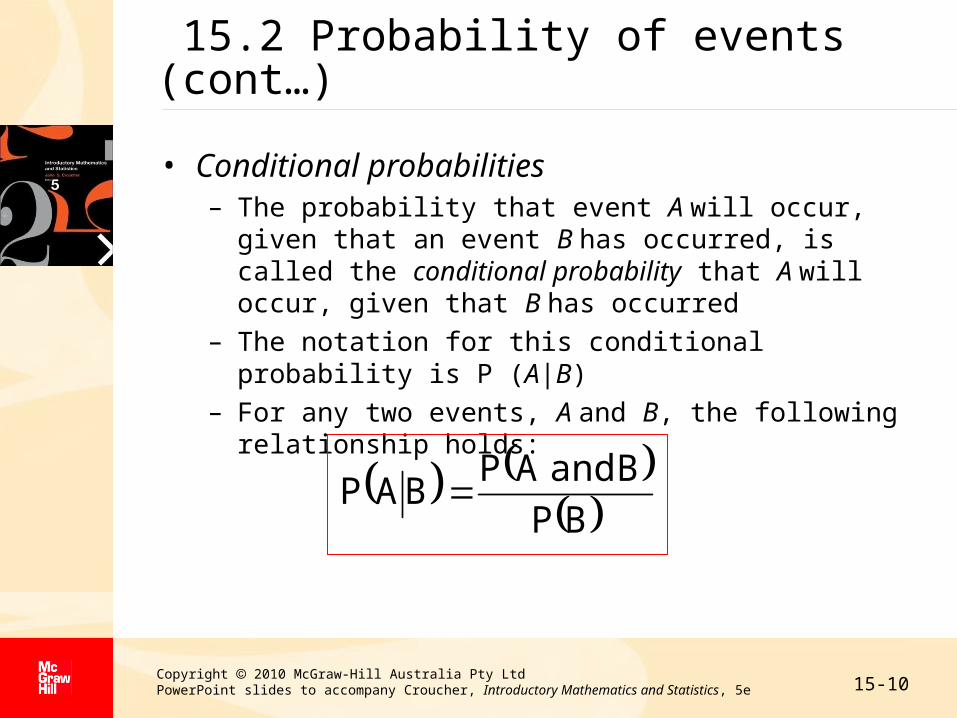
• Conditional probabilities– The probability that event A will occur, given that an event
B has occurred, is called the conditional probability that A will occur, given that B has occurred
– The notation for this conditional probability is P (A|B)– For any two events, A and B, the following relationship
holds:
BP
BandAPBAP

15-11Copyright 2010 McGraw-Hill Australia Pty Ltd PowerPoint slides to accompany Croucher, Introductory Mathematics and Statistics, 5e
15.2 Probability of events (cont…)• Conditional probabilities (cont…)Conditional probabilities (cont…)
– If two events A and B are independent
– Substituting this result
– That is, for independent events A and B the conditional probability that event A will occur, given that event B had occurred, is simply the probability that event A will occur
BPAPBAP
AP
BP
BPAPBAP
15-12Copyright 2010 McGraw-Hill Australia Pty Ltd PowerPoint slides to accompany Croucher, Introductory Mathematics and Statistics, 5e
15.2 Probability of events (cont…)
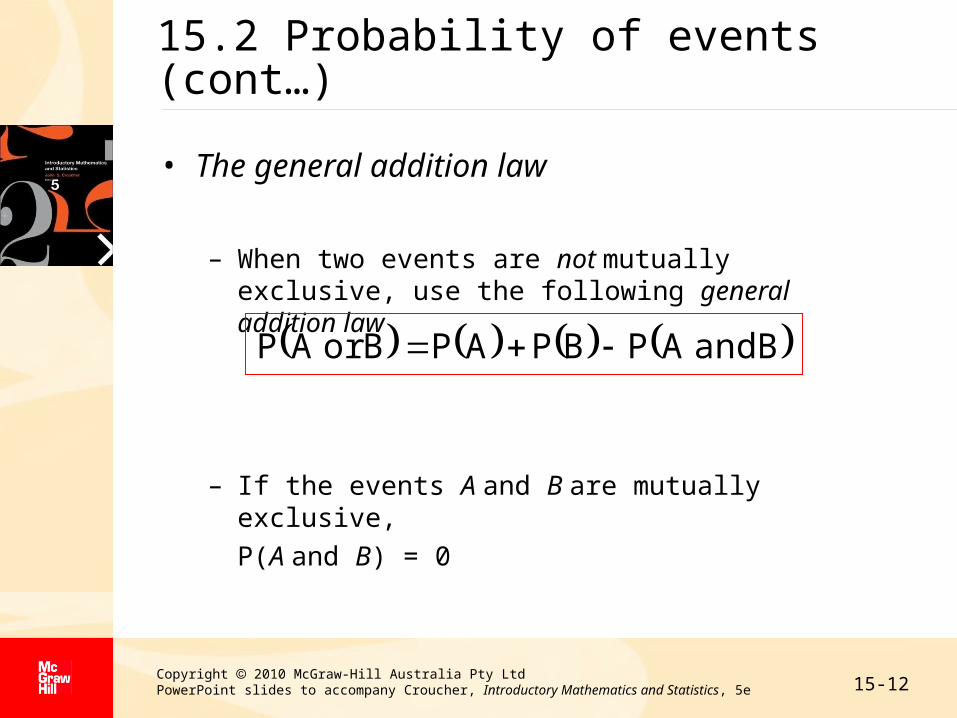
• The general addition law
– When two events are not mutually exclusive, use the following general addition law
– If the events A and B are mutually exclusive,
P(A and B) = 0
BandAPBPAPBorAP
15-13Copyright 2010 McGraw-Hill Australia Pty Ltd PowerPoint slides to accompany Croucher, Introductory Mathematics and Statistics, 5e
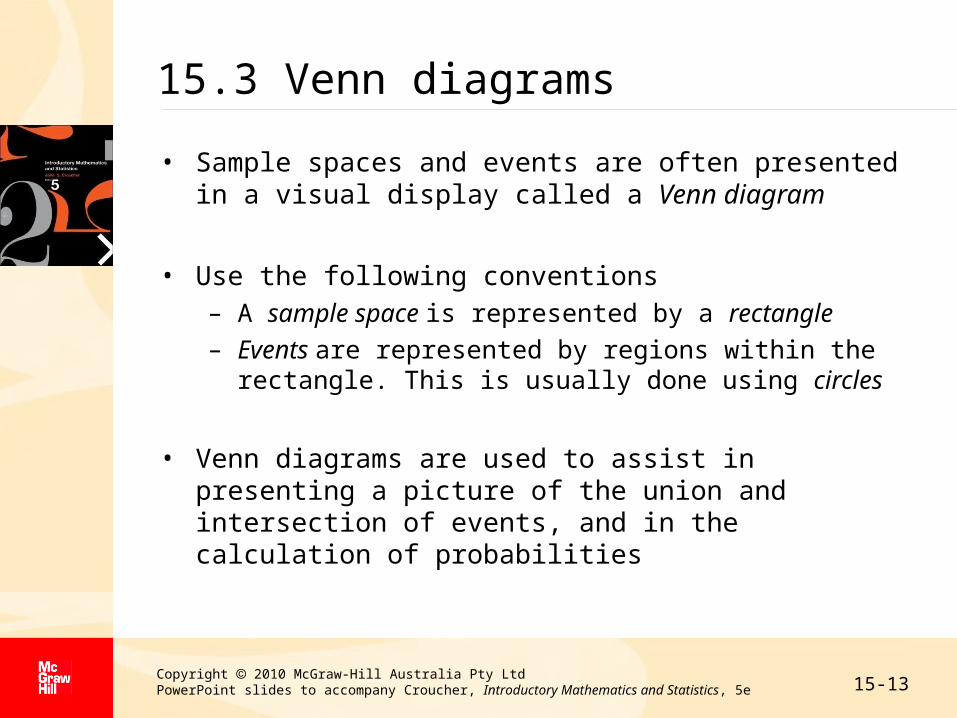
15.3 Venn diagrams
• Sample spaces and events are often presented in a visual display called a Venn diagram
• Use the following conventions– A sample space is represented by a rectangle– Events are represented by regions within the rectangle. This
is usually done using circles
• Venn diagrams are used to assist in presenting a picture of the union and intersection of events, and in the calculation of probabilities

15-14Copyright 2010 McGraw-Hill Australia Pty Ltd PowerPoint slides to accompany Croucher, Introductory Mathematics and Statistics, 5e
15.3 Venn diagrams (cont…)• Definitions
– The union of two events A and B is the set of all outcomes that are in event A or event B. The notation is:
Union of event A and event B = A ∪ B
Hence, we could write, for example, P (A ∪ B) instead of P(A or B)
– The intersection of two events A and B is the set of all outcomes that are in both event A and event B. The notation is:
Intersection of event A and event B = A ∩ B
Hence, we could write, for example, P (A ∩ B) instead of P(AandB)

15-15Copyright 2010 McGraw-Hill Australia Pty Ltd PowerPoint slides to accompany Croucher, Introductory Mathematics and Statistics, 5e
15.3 Venn diagrams (cont…)
The shaded area is event A

15-16Copyright 2010 McGraw-Hill Australia Pty Ltd PowerPoint slides to accompany Croucher, Introductory Mathematics and Statistics, 5e
15.3 Venn diagrams (cont…)
• The union of two events A and B is the set of all outcomes that are in event A or event B
BABA eventandeventofUnion

15-17Copyright 2010 McGraw-Hill Australia Pty Ltd PowerPoint slides to accompany Croucher, Introductory Mathematics and Statistics, 5e
15.3 Venn diagrams (cont…)
• The intersection of two events A and B is the set of all outcomes that are in both event A and event B.
BABA eventandeventofonIntersecti

15-18Copyright 2010 McGraw-Hill Australia Pty Ltd PowerPoint slides to accompany Croucher, Introductory Mathematics and Statistics, 5e
15.3 Venn diagrams (cont…)
• The intersection of events A, B and C is the set of all outcomes that is in events A, B and C
CBACandBandAeventsofonIntersecti
A B
C

15-19Copyright 2010 McGraw-Hill Australia Pty Ltd PowerPoint slides to accompany Croucher, Introductory Mathematics and Statistics, 5e
15.4 Probability tree diagrams
• Probability tree diagrams can be a useful visual display of probabilities
• The diagrams are especially useful for determining probabilities involving events that are not independent
• The joint probabilities for combinations of these events are found by multiplying the probabilities along the branches from the beginning of the tree
• If the events are not independent, the probabilities on the second tier of branches will be conditional probabilities, since their values will depend on what happened in the first event
15-20Copyright 2010 McGraw-Hill Australia Pty Ltd PowerPoint slides to accompany Croucher, Introductory Mathematics and Statistics, 5e
15.4 Probability tree diagrams (cont..)
• Example– A clothing store has just imported a new range of suede
jackets that it has advertised at a bargain price on a rack inside the store. The probability that a customer will try on a jacket is 0.40. If a customer tries on a jacket, the probability that he or she will buy it is 0.70. If a customer does not try on a jacket, the probability that he or she will buy it is 0.15.
– Calculate the probability that:
(a) a customer will try on a jacket and will buy it
(b) a customer will try on a jacket and will not buy it
(c) a customer will not try on a jacket and will buy it
(d) a customer will not try on a jacket and will not buy it

15-21Copyright 2010 McGraw-Hill Australia Pty Ltd PowerPoint slides to accompany Croucher, Introductory Mathematics and Statistics, 5e
15.4 Probability tree diagrams (cont..)
Solution

15-22Copyright 2010 McGraw-Hill Australia Pty Ltd PowerPoint slides to accompany Croucher, Introductory Mathematics and Statistics, 5e
Summary
• We have looked at understanding elementary probability concepts
• We calculated the probability of events
• We distinguished between mutually exclusive, dependent and independent events
• We also looked at calculating conditional probabilities
• We understood and used the general addition law for probabilities
• We understood and applied Venn diagrams
• We understood and applied probability tree diagrams