14tl0684 on line appendix 20150123 9: Table A-1. Proportions of patients ideal for treatments by...
26
Supplementary appendix This appendix formed part of the original submission and has been peer reviewed. We post it as supplied by the authors. Supplement to: Li J, Li X, Wang Q, et al, or the China PEACE Collaborative Group. ST-segment elevation myocardial infarction in China from 2001 to 2011 (the China PEACE-Retrospective Acute Myocardial Infarction Study): a retrospective analysis of hospital data. Lancet 2015; 385: 441–51.
Transcript of 14tl0684 on line appendix 20150123 9: Table A-1. Proportions of patients ideal for treatments by...

Supplementary appendixThis appendix formed part of the original submission and has been peer reviewed. We post it as supplied by the authors.
Supplement to: Li J, Li X, Wang Q, et al, or the China PEACE Collaborative Group. ST-segment elevation myocardial infarction in China from 2001 to 2011 (the China PEACE-Retrospective Acute Myocardial Infarction Study): a retrospective analysis of hospital data. Lancet 2015; 385: 441–51.

1
ST-segment elevation myocardial infarction in China from 2001 to 2011 (the China PEACE-Retrospective Acute Myocardial Infarction Study): a retrospective analysis of hospital data
APPENDIX TABLE OF CONTENTS Pages 2-3: China PEACE-Retrospective AMI Study site investigators by hospital Page 4: China PEACE-Retrospective AMI Study consultants Page 5: Validation of acute myocardial infarction (AMI) type Page 6: Ideal candidates for the treatments Page 7: The seven categories of traditional Chinese medicines commonly used in China among patients with acute myocardial infarction Page 8: Definition of in-hospital complications Page 9: Table A-1. Proportions of patients ideal for treatments by year Page 10: Table A-2. Multilevel logistic regression model for in-hospital death Page 12: Table A-3. Multilevel logistic regression model for in-hospital death or treatment withdrawal Page 14: Table A-4. Multilevel logistic regression model for in-hospital composite complications Page 16: Table A-5. Multilevel logistic regression model for 7-day death Page 18: Table A-6. Multilevel logistic regression model for 7-day death or treatment withdrawal Page 20: Figure A-1. Adjusted in-hospital outcomes for patients with STEMI (entire study sample) Page 21: Figure A-2. Adjusted in-hospital outcomes for patients with STEMI (adjusted without transforming continuous variables) Page 22: Figure A-3. Adjusted in-hospital outcomes for patients with STEMI (adjusted for mini-GRACE risk score without imputation) Page 23: Figure A-4. Adjusted 7-day outcomes for patients with STEMI (adjusted for mini-GRACE risk score without imputation) Page 24: Figure A-5. Adjusted in-hospital outcomes for patients with STEMI (adjusted for mini-GRACE risk score with imputation) Page 25: Figure A-6. Adjusted 7-day outcomes for patients with STEMI (adjusted for mini-GRACE risk score with imputation)
2
China PEACE-Retrospective AMI Study site investigators by hospital Aba Tibetan and Qiang Autonomous Prefecture People's Hospital, Shiping Weng, Shuying Xie; Affiliated Hospital of Guiyang Medical College, Lirong Wu, Jiulin Chen; Affiliated Hospital of Hainan Medical College, Tianfa Li, Jun Wang; Affiliated Zhongshan Hospital of Dalian University, Qin Yu, Xiaofei Li; Alxa League Central Hospital, Zhong Li, Shiguo Hao, Yuzhen Zhang, Xuemei Wu; Baiquan County People's Hospital, Yachen Zhang, Zhifeng Liu; Biyang People's Hospital, Zhongxin Wang, Hao Jia; Bortala Mongol Autonomous Prefecture People's Hospital, Bayin Bate, Badeng Qiqige; Changda Hospital Of Anshan, Xiang Jin, Ting Cai; Chengwu County People's Hospital, Fengqin Liu, Dayong Xu; Chenxi County People's Hospital, Xuejin He, Shui Yang; Chongren County People's Hospital, Chun Yuan, Jiping Wang; County People's Hospital of Jinning, Lihua Gu, Lin Li, Shijiao Chen; Dalian Municipal Central Hospital, Yongchao Zhi, Lili Sun; Dao County People's Hospital, Shengcheng Zhou, Lingjiao Jin; Daofu County People's Hospital, Yong Leng, Liangchuan Zhang, Tianyun Deng; Dingyuan County People's Hospital of Anhui Province, Yuanjin Wang, Wenhua Zhang, Xinmin Ma; Dongyang People's Hospital, Weimin Li, Liang Lu, Xuan Ge; Dulong and Nu Autonomous County People's Hospital of Gongshan, Xiaoping Wu, Yanming He; Dunhua City Hospital of Jilin Province, Fanju Meng, Jia Li; Fenghuang County People's Hospital, Dexi Liao, Guangyong Liu; Fengshan County People’s Hospital, Wen Long, Xiangwen Chen; Fourth Hospital of Baotou City, Baohong Zhang, Yonghou Yin, Bin Tian; Fourth People's Hospital of Zigong City, Yong Yi, Chaoyong Wu; Fugu County People's Hospital of Shaanxi Province, Baoqi Liu, Zhihui Zhao, Haiming Li; Fujian Provincial Hospital, Yansong Guo, Xinjing Chen; Fuling Center Hospital of Chongqing City, Liquan Xiang, Lin Ning; Gannan County People's Hospital, Mei Chen, Xin Jin, Guiling Li; General Hospital of the Yangtze River Shipping, Xiuqi Li, Xing’an Wu; Gongcheng Yao Autonomous County People's Hospital, Congjun Tan, Mingfang Feng, Meili Wang; Guangchang County People's Hospital, Liangfa Wen, Xiang Fu, Qunxing Xie; Guilin People's Hospital, Wei Zhang, Yanni Zhuang, Hua Lu;Guiping People's Hospital, Jiaqian Lu, Yu Huang; Haerbin 242 Hospital, Yin Zhou, Qiuling Hu; Haiyan People's Hospital, Chunhui Xiao, Xiaoli Hu; Heling Ge Er County People's Hospital, Yongshuan Wu, Qiuli Wang; Helong Municipal People's Hospital, Youlin Xu, Xuefei Yu; Henan Provincial People's Hospital, Chuanyu Gao, Jianhong Zhang, You Zhang; Heze Municipal Hospital, Wentang Niu, Xiaolei Ma, Yong Wang; HGKY Group Company General Hospital, Xiaowen Pan, Yanlong Liu; Hua Xin HospitalFirst Hospital of Tsinghua University, Lifu Miao, Yanping Yin, Zhiying Zhang; Huairen People's Hospital, Shutang Feng; Huayin People's Hospital, Aiping Wang, Jiangli Zhang, Feipeng Li; Huaying People's Hospital , Hong Wang; Hunchun Hospital, Lijun Yu, Xinxin Zhao; Huizhou Municipal Central Hospital, Yuansheng Shen, Zhiming Li, Lizhen He; Hunan Province Mawangdui Hospital, Zhiyi Rong, Wei Luo; Ji'an Municipal Central People's hospital, Xueqiao Wang; Jianghua Yao Autonomous County People's Hospital, Rongjun Wan, Jianglin Tang, Guanghan Wu; Jiangsu Haimen People's Hospital, Jie Wu, Bin Xu; Jiangxi Provincial People's Hospital, Qing Huang, Xiaohe Wu; Jiangzi County People's Hospital, Sang Ge, Pian Pu, Pingcuo Duoji; Jilin Province People's Hospital, Hui Dai, Yuming Du, Wei Guo; Jilin Integrated Traditional Chinese & Western Medicine Hospital, Jilin Province, Jianping Shi; Jinghai County Hospital, Peihua Zhao, Jingsheng Sun; Jingxi County People's Hospital, Hongxiang Li, Wen Liang, Wen Qin; Jingxing County Hospital, Zhiwen Dong, Zhenhai Zhao; Jingzhou Central Hospital, Xin Li, Qin Xu; Jiuquan City People’s Hospital, Yaofeng Yuan, Zhirong Li; Jixi People's Hospital of The Jixi Municipal People's Hospital Medical Group, Jinbo Gao; Jize County Hospital, Qiu’e Guo; Kangbao County People's Hospital, Ruiqing Zhao, Guangjun Song; Keshiketengqi Hospital of Chifeng City, Lize Wang, Haiyun Song; Lanping Bai and Pumi Autonomous County People's Hospital, Jinwen He, Jinming He; Laoting County Hospital, Keyong Shang, Changjiang Liu, Kuituan Xi; Liaoyang Central Hospital, Rihui Liu, Peng Guo; Liaoyuan Central Hospital, Chaoyang Guo, Xiangjun Liu, Rujun Zhao, Zeyong Yu; Lindian County Hospital, Wenzhou Li, Xudong Jing, Huanling Wang; Linxiang People's Hospital, Xiyuan Zhao, Chao Zhang, Long Chen; Liujiang County People's Hospital, Meifa Wei, Yan Liu, Shengde Chen; Longyan First Hospital, Kaihong Chen, Yong Fang, Ying Liao; Luancheng County Hospital, Junli Wang, Tianyu Liu, Suzhe Cheng; Lucheng People's Hospital, Yunke Zhou, Xiaoxia Niu, Huifang Cao; Luchuan County People's Hospital, Zebin Feng, Min Feng; Luxi County People's Hospital, Feilong Duan, Haiming Yi; Luyi County People's Hospital, Yuanxun Xu, Anran Guo; Macheng People's Hospital, Xianshun Zhou, Hongzhuan Cai, Peng Zheng; Mengcheng First People's Hospital, Gaofeng Guo; Menglian Lahu dai wa autonomous counties People's Hospital, Xiang Li; Min County People's Hospital, Minwu Bao, Yuhong Liu; Nanjing First Hospital, Shaoliang Chen, Haibo Jia, Hongjuan Peng; Nan’an Hospital, Duanping Dai, Shaoxiong Hong; Nantong Third People's Hospital, Song Chen, Dongya Zhang, Ying Wang; Nanyang Central Hospital, Yudong Li, Jianbu Gao, Shouzhong Yang; Ningwu County People's Hospital, Junhu An; Peking University People's Hospital, Chenyang Shen, Yunfeng Liu; Peking University Shenzhen Hospital, Chun Wu, Huan Qu, Saiyong Chen; People's Hospital of Jingyu, Yuhui Lin, Dehai Jiao; People's Hospital of Yueqing City, Manhong Wang, Qiu Wang; Pianguan County People's Hospital, Yingliang Xue, Ruijun Zhang; Puding County People's Hospital, Cheng Yuan, Lei Wu; Qinghai Red Cross Hospital, Jianqing Zhang, Chunmei Wei, Yanmei Shen; Qinshui County People's Hospital, Hehua Zhang, Hongmei Pan, Yong Gao; Qinyang People's Hospital,

3
Xiaowen Ma, Yanli Liang, Tianbiao Wang; Queshan County People's Hospital, Daguo Zhao; Quzhou People's Hospital, Xiaoming Tu, Zhenyan Gao; Rongjiang County People's Hospital, Fangning Wang, Qiang Yang; Rudong County People's Hospital, Xiaoping Kang, Jianbin Fang, Dongmei Liu; Ruyang County People's Hospital, Chengning Shen, Mengfei Li; Shangluo Central Hospital, Yingmin Guan, Wenfeng Wang, Ting Xiao; Shangqiu Changzheng People's Hospital, Qian Wang; Shaoyang County People's Hospital, Fengyun Jiang, Kaiyou Wu; Shengsi People's Hospital, Songguo Wang; Shenyang Weikang Hospital, Xujie Fu, Shu Zhang,Lifang Gao; Shougang Shuicheng Iron & Steel (Group) Co., Ltd. General Hospital, Min Zhang, Kai Fu, Xiaojing Duan; Shuangshan Hospital Of Anshan, Rui Xiao, Ruixia Wu, Bin Li; Siziwang County People's Hospital, Hongtu Zhang, Yuerong Ma, Zhonghui Cao; Sunan Yugur Autonomous County People's Hospital, Zhansheng Ba, Wanhai Fu; Taizhou Hospital of Zhejiang Province, Jianjun Jiang, Yafei Mi, Weiwei Zhou; The Affiliated Hospital of Beihua University, Feng Sun, Qi Zhang, Shiyu Zheng; The Fifth People's Hospital of Dalian, Jing Zhang, Yang Zhong; The First Affiliated Hospital of Hebei North University, Fangjiang Li, Xiaoyuan Wang; The First Affiliated Hospital of Henan University of Science & Technology, Pingshuan Dong, Laijing Du, Wei Liu; The First Affiliated Hospital Of Jia Mu Si University, Zhaofa He, Meihua Jin; The First Hospital of Fuzhou City, Ting Jiang, Zhuoyan Chen; The First Hospital of Xi’an, Manli Cheng, Yuqiang Ji; The First People's Hospital of Danzhou, Youhua Zhou, Jvyuan Li; The First People's Hospital of Guangzhou, Yizhi Pan, Jian Liu; The First People's Hospital of Guangyuan, Tianxun Wang, Ping Yang; The Fourth People's Hospital of Shangqiu Shi, Guiyu Huang, Jianjun Pan,Qingliang Cai,Qianying Wang; The General Hospital of Yongzhou, Hunan Province, Mingli Lv; The people's hospital of Wuchuan, Yuanming Yi, Xuelian Deng; The People's Hospital of Yuanling, Wenhua Chen, Rong Cai; The People's Hospital of Zhijiang City, Bing Zhang; The Second Affiliated Hospital of Harbin Medical University, Bo Yu, Yousheng Xu, Zhengqiu Wang; The Second Affiliated Hospital of Kunming Medical University, Jun Shu, Ge Zhang, Kai Li; The Second Central Hospital of Baoding City, Guang Ma, Puxia Suo; The Second People's Hospital of Liaoyuan City, Aimin Zhang, Yongfen Kang; Tianjin Medical University General Hospital, Zheng Wan,Yuemin Sun, Bo Bian; Tibet Autonomous Region People's Hospital, Xuejun Hu, Dawa Ciren; Tongchuan Mining Bureau Central Hospital, Guojiong Jia, Jieli Pan; Tongliang County People's Hospital, Guofu Li, Hongliang Zhang, Longliang Zhan; Tongliao City Horqin District First People's Hospital, Junping Fang, Xinli Yu; Ulanqab Central Hospital, Dacheng Wang, Dajun Liu, Xinhong Cao; Wencheng County People's Hospital, Yi Tian, Haisheng Zhu,Wanchuan Liu; Wuhai People's Hospital, Zhaohai Zhou, Lei Shi; Wuhu Second People's Hospital, Wuwang Fang, Manxin Chen; Wulate County People's Hospital, ,Fuqin Han,Jianye Fu,Yunmei Wang; Wuqiang County People's Hospital, Binglu Liu, Yanliang Zhang,Xiupin Yuan; Wuyishan Municipal Hospital, Qingfei Lin, Yun Chen; Xiangtan County People's Hospital, Yuliang Zhu, Zhiqiang Cai; Xing County People's Hospital, Xingping Li, Lirong Ao; Xingshan County People's Hospital, Shubing Wu, Hui Zhang; Xinmi First People's Hospital, Fusheng Zhao, Guangming Yang; Xinshao County People's Hospital, Renfei Liu, Wenwei Ai; Xiuwu County People's Hospital, Jianbao Chang,Haijie Zhao; Xuanhan County People's Hospital, Qijun Ran, Xuan Ma; Xupu County People's Hospital, Shijun Jiang, Xiaochun Shu; Yanggao County People's Hospital, Zhiru Peng, Yan Han; Yanqing County Hospital, Jianbin Wang, Li Yang; Ying County People's Hospital, Yu Shen, Xingcun Shang; Yitong Manchu Autonomous County First People's Hospital, Haifeng Wang; Yongxing County People's Hospital, Hongyan Li, Zhisong Liao, Yang Cao; Yuanzhou District People's Hospital of Guyuan City, Xiaoping Gao, Meiying Cai, Lining You; Yuncheng Central Hospital, Xuexin Li, Shuqin Li, Yingjia Li; Yunlong County People's Hospital, Jianxun Yang, Song Ai, Jianfei Ma; Yuyao People's Hospital, Lailin Deng; Zhangjiachuan Hui Autonomous County First People's Hospital, Keyu Wang, Shitang Gao, Jian Guan; Zhouning County Hospital, Banghua He, Youyi Lu; Zhuoni County People's Hospital, Weirong Yang, Hong Li; Zhuozi County People's Hospital, Zhizhong Zhang, Xiaohong Chi; Zuoyun County People's Hospital, Ru Duan, Guangli Wang.

4
China PEACE-Retrospective AMI Study consultants
Study Consultants: Paul S. Chan, MD, MSc, Jersey Chen, MD, MPH, David J. Cohen, MD, MSc, Nihar R. Desai, MD, MPH, Kumar Dharmarajan MD, MBA, Mikhail N. Kosiborod, MD, Jing Li, MD, PhD, Xi Li, MD, PhD, Zhenqiu Lin, PhD, Frederick A. Masoudi, MD, MSPH, Jennifer Mattera, DrPH, MPH, Brahmajee K. Nallamothu, MD, MPH, Khurram Nasir, MD, MPH, Sharon-Lise T. Normand, PhD, Joseph S. Ross, MD MHS, John A. Spertus, MD, MPH, Henry H. Ting, MD, Xiao Xu, PhD
St. Luke’s Mid America Heart Institute/University of Missouri Kansas City (PSC, DJC, MNK, JAS), Kansas City, Missouri, United States; Kaiser Permanente (JC), Mid-Atlantic Permanente Research Institute, Rockville, Maryland, United States; Center for Outcomes Research and Evaluation (NRD, KD, ZL, JM, JSR, XX), Yale-New Haven Hospital, New Haven, Connecticut, United States; Division of Cardiology (KD), Department of Internal Medicine, Columbia University Medical Center, New York, New York, United States; State Key Laboratory of Cardiovascular Disease (JL, XL), China Oxford Centre for International Health Research, Fuwai Hospital, National Center for Cardiovascular Diseases, Chinese Academy of Medical Sciences and Peking Union Medical College, Beijing, People's Republic of China; Division of Cardiology (FAM), University of Colorado Anschutz Medical Campus, Aurora, Colorado, United States; Veterans Affairs Health Services Research and Development Center of Excellence (BKN), Veterans Affairs Ann Arbor Healthcare System, Ann Arbor, Michigan, United States; Department of Internal Medicine (BKN) and Center for Healthcare Outcomes and Policy (BKN), University of Michigan, Ann Arbor, Michigan, United States; Research Director, Center for Prevention and Wellness (KN), Baptist Health South Florida, Miami, Florida, United States; Department of Biostatistics (S-LTN), Harvard School of Public Health, Boston, Massachusetts, United States; Department of Health Care Policy (S-LTN), Harvard Medical School, Boston, Massachusetts, United States; Section of General Internal Medicine and the Robert Wood Johnson Clinical Scholars Program (JSR), Department of Internal Medicine, Yale University School of Medicine, Connecticut, United States; Division of Cardiovascular Diseases (HHT) and Knowledge and Evaluation Research Unit (HHT), Mayo Clinic College of Medicine, Rochester, Minnesota. United States; Department of Obstetrics, Gynecology, and Reproductive Sciences (XX), Yale School of Medicine, New Haven, Connecticut, United States

5
Validation of acute myocardial infarction (AMI) type (ST-segment elevation myocardial infarction or non ST-segment elevation myocardial infarction)
A total of 300 medical records were randomly selected and examined by a senior cardiologist from the Yale Center for Outcomes Research and Evaluation. The review aimed at determining the concordance between the abstracted results of AMI types and the first available electrocardiogram (ECG) or ECG description in medical records. For the ECG review, we considered left bundle branch block (LBBB) as a STEMI equivalent. Our review showed that there was a 94·7% concordance in the selected cases. Details of the results are shown in the following table.
Review Results of AMI Types N (%) Consistent 284 (94·7%)
Consistent with ECG graph 246 (82·0%) Consistent with ECG description in records 38 (12·7%)
Inconsistent 12 (4·0%) Unavailable (either ECG graph or ECG description in medical records) 4 (1·3 %)

6
Ideal candidates for the treatments
Patients who were transferred in or whose lengths of hospital stay did not exceed 24 hours were excluded for all the following treatments.
For the reperfusion therapy, we included patients who were admitted within 12 hours of symptom onset and did not receive reperfusion therapy before hospital presentation. Then we excluded patients with any contraindications (history of hemorrhagic stroke, active bleeding at presentation, or any other physician documented contraindications for fibrinolytic therapy if the patient was treated in non-percutaneous coronary intervention (PCI) capable hospital; allergy to contrast agents or any other documented contraindication to PCI if the patient was treated in PCI-capable hospital).
For aspirin, we excluded patients with any contraindications for aspirin (allergy to aspirin, active bleeding on admission, history of hemorrhagic stroke, or other documented contraindications).
For clopidogrel, we excluded patients who participated in the ClOpidogrel and Metoprolol in Myocardial Infarction Trial (COMMIT) or patients with any contraindications for clopidogrel (allergy to clopidogrel, active bleeding on admission, history of hemorrhagic stroke, or other documented contraindications).
For beta-blockers, we excluded patients who participated in the ClOpidogrel and Metoprolol in Myocardial Infarction Trial (COMMIT) or patients with any contraindications for beta-blockers (allergy to beta-blockers, cardiogenic shock on admission, heart failure on admission, second or third degree atrioventricular block with no pacemaker implanted, systolic blood pressure <100mmHg on admission, bradycardia [heart rate <60 beats/min] on admission without taking a beta-blocker, or other documented contraindications).
For angiotensin converting enzyme (ACE) inhibitors or angiotensin receptor blockers (ARB), we excluded patients with any contraindications for ACE inhibitors (allergy to ACE inhibitors, hyperkalemia (serum potassium >5·5 mmol/L during hospitalization), creatinine >265 umol/L during hospitalization, pregnancy or breast feeding, or other documented contraindications).
For statins, we excluded patients who were allergy to statins.

7
The seven categories of traditional Chinese medicines commonly used in China among patients with acute myocardial infarction (1) Salvia miltiorrhiza/Red Ginseng/Ginseng (e.g. Danshen dripping pill, Tanshinone)* (2) Gingko (e.g. Ginkgo biloba, Ginkgo biloba extract)* (3) Panax notoginseng (e.g. Panax notoginseng saponins, Xueshuantong injection)* (4) Hirudo (e.g. Lepirudin, Shuxuetong injection)* (5) Erigeron Breviscapus (e.g. Erigeron breviscapus injection, Breviscapinun)* (6) Lipid lowing agents (e.g. Xuezhikang, Taizhian) (7) Other (e.g. Puerarin, Suxiao jiuxin pills, Kyushin pills)
* based on the main functional ingredient.

8
Definition of in-hospital complications 1) Re-infarction Indicate if there is physician documentation of recurrent myocardial infarction during hospitalization. 2) Cardiogenic shock Indicate if there is physician documentation of cardiogenic shock during hospitalization. 3) Ischemic stroke Indicate if there are physician documentations of new-onset ischemia stroke and stroke-related symptoms during hospitalization. The stroke-related symptoms include: trouble walking/loss of balance/incoordination, one-sided numbness or hemi-anesthesia, one-sided facial numbness or hemi-anesthesia, mouth askew and drooling, dysarthria or slurred speech, loss of vision or blurred version in one or both eyes, dizziness with vomiting, severe headache and vomiting, unconsciousness, and hyperspasmia. 4) Congestive heart failure Indicate if there is physician documentation of heart failure during hospital stay. This include those without a history of heart failure but develop heart failure during hospitalization, and those with a history of heart failure as a chronic comorbidity and develop worsening heart failure during hospitalization.

9
Table A-1. Proportions of patients ideal for treatments by year
Treatment 2001
n=1995 2006
n=3626 2011
n=6643 p for trend
Aspirin within 24 h, % 1953 (97·8) 3545 (97·7) 6490 (97·6) 0·63 Clopidogrel within 24 h, % 1832 (91·6) 3551 (97·9) 6498 (97·7) <0·0001 beta-blockers within 24 h, % 840 (42·3) 1624 (44·0) 3106 (46·9) <0·0001 Statins during hospitalization, % 1995 (100·0) 3626 (100·0) 6642 (100·0) 0·38 ACE inhibitors/ARB, % 1932 (96·9) 3513 (96·8) 6440 (96·8) 0·69 Reperfusion therapies, % 917 (45·9) 1689 (46·4) 3278 (48·4) 0·02
ACE: angiotensin converting enzyme, ARB: angiotensin receptor blockers.

10
Tab
le A
-2. M
ult
ileve
l log
isti
c re
gres
sion
mod
el f
or in
-hos
pit
al d
eath
Pre
dic
tors
U
nw
eigh
ted
nu
mb
er
Wei
ghte
d n
um
ber
β
S·E
· O
R
95%
CI
p v
alu
e T
otal
O
utc
ome
(%)
Tot
al
Ou
tcom
e (%
) L
ower
U
pp
er
Yea
r
2001
19
33
165
(9%
) 19
37
169(
9%)
0 -
1 -
- -
2006
35
81
351
(10%
) 35
58
342(
10%
) 0·
0513
0·
1296
1·
0526
0·
8165
1·
3571
0·
69
2011
64
72
496
(8%
) 64
61
461(
7%)
-0·1
953
0·14
69
0·82
26
0·61
69
1·09
7 0·
18
Age
<
55
2626
94
(4%
) 26
73
88(3
%)
0 -
1 -
- -
55-6
4 28
24
155
(5%
) 28
55
149(
5%)
0·35
54
0·15
12
1·42
68
1·06
1 1·
9188
0·
019
65-7
4 36
57
357
(10%
) 36
39
343(
9%)
0·82
62
0·13
1 2·
2846
1·
7673
2·
9534
<
0·00
01
≥75
2879
40
6 (1
4%)
2789
39
2(14
%)
1·22
61
0·14
18
3·40
79
2·58
08
4·5
<0·
0001
S
ex
Mal
e 84
12
567
(7%
) 83
60
538(
6%)
0 -
1 -
- -
Fem
ale
3574
44
5 (1
2%)
3596
43
4(12
%)
0·33
47
0·08
28
1·39
75
1·18
82
1·64
37
<·0
001
Hyp
erte
nsio
n
N
o 61
41
544
(9%
) 59
58
509(
9%)
0 -
1 -
- -
Yes
58
45
468
(8%
) 59
98
464(
8%)
-0·0
541
0·09
05
0·94
74
0·79
34
1·13
12
0·55
D
iabe
tes
No
9701
76
2 (8
%)
9560
72
3(8%
) 0
- 1
- -
- Y
es
2285
25
0 (1
1%)
2396
25
0(10
%)
0.25
63
0·09
68
1·29
21
1·06
89
1·56
19
0·00
8 C
urre
nt s
mok
er
No
7882
81
7 (1
0%)
7626
77
1(10
%)
0 -
1 -
- -
Yes
41
04
195
(5%
) 43
30
201(
5%)
-0·3
177
0.10
23
0·72
78
0·59
56
0·88
94
0.00
2 P
rior
myo
card
ial i
nfar
ctio
n
N
o 10
748
903
(8%
) 10
655
864(
8%)
0 -
1 -
- -
Yes
12
38
109
(9%
) 13
01
108(
8%)
-0·3
449
0·18
82
0·70
83
0·48
98
1·02
42
0.07
P
rior
cor
onar
y he
art d
isea
se
No
9460
75
1 (8
%)
9390
72
2(8%
) 0
- 1
- -
- Y
es
2526
26
1 (1
0%)
2566
25
1(10
%)
0·29
95
0·10
58
1·34
92
1·09
64
1·66
02
0.00
5 P
rior
str
oke
No
1062
7 84
3 (8
%)
1054
3 79
8(8%
) 0
- 1
- -
- Y
es
1359
16
9 (1
2%)
1413
17
5(12
%)
0·40
2 0·
0976
1·
4947
1·
2344
1·
8099
<
0·00
01
Che
st d
isco
mfo
rt
Yes
11
055
865
(8%
) 11
090
832(
8%)
0 -
1 -
- -
No
670
106
(16%
) 63
1 10
1(16
%)
0·36
51
0·14
04
1·44
06
1·09
4 1·
8971
0·
009
Unr
ecor
ded
261
41 (
16%
) 23
6 40
(17%
) 0·
1982
0·
2077
1·
2192
0·
8115
1·
8319
0·
34
Car
diac
arr
est a
t adm
issi
on
No
1183
8 98
0 (8
%)
1180
1 94
3(8%
) 0
- 1
- -
- Y
es
148
32 (
22%
) 15
5 29
(19%
) 0·
7058
0·
2912
2·
0255
1·
1447
3·
5839
0·
015
Acu
te s
trok
e at
adm
issi
on
No
1183
9 98
3 (8
%)
1181
8 94
3(8%
) 0
- 1
- -
- Y
es
147
29 (
20%
) 13
8 30
(21%
) 0·
6839
0·
3035
1·
9816
1·
0932
3·
5919
0·
024

11
Hea
rt r
ate
at a
dmis
sion
≤5
0 75
1 90
(12
%)
734
85(1
2%)
0 -
1 -
- -
51-7
0 36
02
212
(6%
) 36
46
198(
5%)
-0·2
873
0·16
06
0·75
03
0·54
77
1·02
77
0·07
71
-90
4938
34
0 (7
%)
4916
32
1(7%
) -0
·051
8 0·
1586
0·
9495
0·
6959
1·
2957
0·
74
91-1
10
1997
22
8 (1
1%)
1983
22
6(11
%)
0·36
34
0·16
42
1·43
82
1·04
25
1·98
42
0·02
7 >
110
698
142
(20%
) 67
8 14
3(21
%)
0·84
44
0·20
8 2·
3266
1·
5476
3·
4976
<
0·00
01
Sys
toli
c bl
ood
pres
sure
at a
dmis
sion
<
80
388
139
(36%
) 34
6 12
5(36
%)
0 -
1 -
- -
80-9
9 10
70
166
(16%
) 10
31
165(
16%
) -0
·894
1 0·
1848
0·
409
0·28
47
0·58
74
<0·
0001
10
0-11
9 28
02
246
(9%
) 27
97
242(
9%)
-1·5
461
0·14
42
0·21
31
0·16
06
0·28
27
<0·
0001
12
0-13
9 36
27
235
(6%
) 36
62
221(
6%)
-1·9
579
0·15
67
0·14
12
0·10
38
0·19
19
<0·
0001
14
0-15
9 23
66
126
(5%
) 23
97
118(
5%)
-2·2
659
0·20
45
0·10
37
0·06
95
0·15
49
<0·
0001
16
0-17
9 11
73
58 (
5%)
1178
58
(5%
) -2
·315
3 0·
2134
0·
0987
0·
065
0·15
<
0·00
01
≥180
56
0 42
(8%
) 54
4 43
(8%
) -2
·024
4 0·
2491
0·
1321
0·
0811
0·
2152
<
0·00
01
Sym
ptom
ons
et to
adm
issi
on ti
me
<3
2331
22
7 (1
0%)
2201
20
3(9%
) 0
- 1
- -
- 3~
20
13
156
(8%
) 20
00
145(
7%)
-0·3
57
0·13
87
0·69
98
0·53
32
0·91
84
0·01
0 6~
14
22
132
(9%
) 14
43
129(
9%)
-0·0
926
0·13
72
0·91
16
0·69
67
1·19
28
0·50
12
~ 64
3 64
(10
%)
623
60(1
0%)
-0·0
863
0·17
65
0·91
74
0·64
91
1·29
64
0·63
18
~ 27
3 22
(8%
) 27
6 20
(7%
) -0
·327
6 0·
275
0·72
07
0·42
04
1·23
54
0·23
≥2
4 53
04
411
(8%
) 54
13
416(
8%)
-0·2
841
0·10
29
0·75
26
0·61
52
0·92
08
0·00
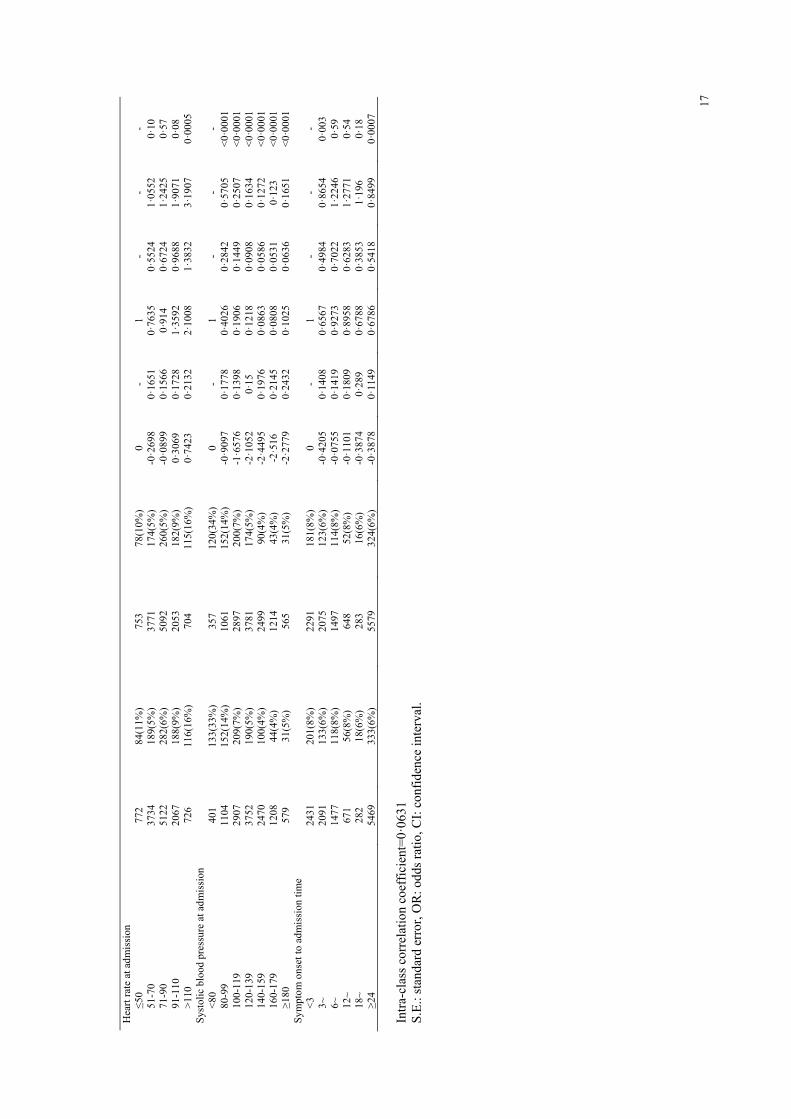
6
Intr
a-cl
ass
corr
elat
ion
coef
fici
ent=
0·06
89
S.E
.: st
anda
rd e
rror
, OR
: odd
s ra
tio, C
I: c
onfi
denc
e in
terv
al.

12
Tab
le A
-3. M
ult
ilev
el lo
gist
ic r
egre
ssio
n m
odel
for
in-h
osp
ital
dea
th o
r tr
eatm
ent
wit
hd
raw
al
Pre
dic
tors
U
nw
eigh
ted
nu
mb
er
Wei
ghte
d n
um
ber
β
S·E·
OR
95
% C
I p
val
ue
Tot
al
Ou
tcom
e (%
) T
otal
O
utc
ome
(%)
low
er
up
per
Y
ear
20
01
1933
20
0 (1
0%)
1937
20
4(11
%)
0 -
1 -
- -
2006
35
81
463
(13%
) 35
58
446(
13%
) 0·
155
0·11
13
1·16
77
0·93
88
1·45
24
0·16
20
11
6472
72
0 (1
1%)
6461
65
8(10
%)
0·03
39
0·12
77
1·03
45
0·80
54
1·32
87
0·79
A
ge
<55
26
26
118
(4%
) 26
73
113(
4%)
0 -
1 -
- -
55-6
4 28
24
206
(7%
) 28
55
198(
7%)
0·41
25
0·13
79
1·51
06
1·15
28
1·97
95
0·00
3 65
-74
3657
49
2 (1
3%)
3639
46
9(13
%)
0·95
3 0·
1312
2·
5935
2·
0055
3·
354
<0·
0001
≥7
5 28
79
567
(20%
) 27
89
528(
19%
) 1·
3339
0·
1327
3·
7958
2·
9264
4·
9235
<
0·00
01
Sex
M
ale
8412
76
7 (9
%)
8360
72
3(9%
) 0
- 1
- -
- F
emal
e 35
74
616
(17%
) 35
96
585(
16%
) 0·
3379
0·
0703
1·
402
1·22
15
1·60
92
<0·
0001
H
yper
tens
ion
No
6141
74
1 (1
2%)
5958
67
7(11
%)
0 -
1 -
- -
Yes
58
45
642
(11%
) 59
98
630(
11%
) 0·
0107
0·
0774
1·
0108
0·
8686
1·
1762
0·
89
Dia
bete
s
N
o 97
01
1062
(11
%)
9560
98
8(10
%)
0 -
1 -
- -
Yes
22
85
321
(14%
) 23
96
320(
13%
) 0·
1474
0·
0932
1·
1588
0·
9652
1·
3911
0·
11
Cur
rent
sm
oker
N
o 78
82
1132
(14
%)
7626
10
49(1
4%)
0 -
1 -
- -
Yes
41
04
251
(6%
) 43
30
259(
6%)
-0·4
163
0·08
05
0·65
95
0·56
32
0·77
23
<0·
0001
P
rior
myo
card
ial i
nfar
ctio
n
N
o 10
748
1251
(12
%)
1065
5 11
75(1
1%)
0 -
1 -
- -
Yes
12
38
132
(11%
) 13
01
132(
10%
) -0
·430
5 0·
1624
0·
6502
0·
4729
0·
8938
0·
008
Pri
or c
oron
ary
hear
t dis
ease
N
o 94
60
1060
(11
%)
9390
99
7(11
%)
0 -
1 -
- -
Yes
25
26
323
(13%
) 25
66
311(
12%
) 0·
2081
0·
103
1·23
13
1·00
63
1·50
67
0·04
3 P
rior
str
oke
No
1062
7 11
63 (
11%
) 10
543
1086
(10%
) 0
- 1
- -
- Y
es
1359
22
0 (1
6%)
1413
22
1(16
%)
0·30
44
0·09
02
1·35
58
1·13
6 1·
6181
0·
0007
C
hest
dis
com
fort
Y
es
1105
5 11
78 (
11%
) 11
090
1114
(10%
) 0
- 1
- -
- N
o 67
0 14
0 (2
1%)
631
130(
21%
) 0·
2815
0·
1284
1·
3251
1·
0302
1·
7043
0·
028
Unr
ecor
ded
261
65 (
25%
) 23
6 64
(27%
) 0·
4577
0·
2255
1·
5804
1·
0159
2·
4588
0·
042
Car
diac
arr
est a
t adm
issi
on
No
1183
8 13
40 (
11%
) 11
801
1267
(11%
) 0
- 1
- -
- Y
es
148
43 (
29%
) 15
5 41
(26%
) 0·
7985
0·
2714
2·
2223
1·
3055
3·
7829
0·
003
Acu
te s
trok
e at
adm
issi
on
No
1183
9 13
29 (
11%
) 11
818
1255
(11%
) 0
- 1
- -
- Y
es
147
54 (
37%
) 13
8 53
(38%
) 1·
2504
0·
2127
3·
4916
2·
3013
5·
2977
<
0·00
01

13
Hea
rt r
ate
at a
dmis
sion
≤5
0 75
1 13
1 (1
7%)
734
121(
16%
) 0
- 1
- -
- 51
-70
3602
26
2 (7
%)
3646
25
1(7%
) -0
·449
6 0·
1426
0·
6379
0·
4823
0·
8436
0·
002
71-9
0 49
38
457
(9%
) 49
16
420(
9%)
-0·1
458
0·13
79
0·86
43
0·65
96
1·13
25
0·29
91
-110
19
97
327
(16%
) 19
83
316(
16%
) 0·
3872
0·
1433
1·
4729
1·
1121
1·
9507
0·
007
>11
0 69
8 20
6 (3
0%)
678
201(
30%
) 0·
9736
0·
1733
2·
6475
1·
8852
3·
7181
<
0·00
01
Sys
toli
c bl
ood
pres
sure
at a
dmis
sion
<
80
388
187
(48%
) 34
6 16
4(47
%)
0 -
1 -
- -
80-9
9 10
70
244
(23%
) 10
31
232(
23%
) -0
·961
9 0·
1695
0·
3822
0·
2742
0·
5327
<
0·00
01
100-
119
2802
34
0 (1
2%)
2797
33
3(12
%)
-1·7
103
0·13
58
0·18
08
0·13
86
0·23
59
<0·
0001
12
0-13
9 36
27
321
(9%
) 36
62
299(
8%)
-2·1
662
0·14
7 0·
1146
0·
0859
0·
1529
<
0·00
01
140-
159
2366
16
5 (7
%)
2397
15
3(6%
) -2
·546
5 0·
1845
0·
0784
0·
0546
0·
1125
<
0·00
01
160-
179
1173
77
(7%
) 11
78
77(6
%)
-2·5
88
0·19
53
0·07
52
0·05
13
0·11
02
<0·
0001
≥1
80
560
49 (
9%)
544
50(9
%)
-2·4
398
0·22
85
0·08
72
0·05
57
0·13
64
<0·
0001
S
ympt
om o
nset
to a
dmis
sion
tim
e
<
3 23
31
276
(12%
) 22
01
243(
11%
) 0
- 1
- -
- 3~
20
13
211
(10%
) 20
00
191(
10%
) -0
·267
2 0·
1239
0·
7656
0·
6005
0·
9759
0·
031
6~
1422
18
2 (1
3%)
1443
17
4(12
%)
0·03
82
0·12
13
1·03
89
0·81
91
1·31
77
0·75
12
~ 64
3 97
(15
%)
623
91(1
5%)
0·20
73
0·13
32
1·23
04
0·94
77
1·59
75
0·12
18
~ 27
3 29
(11
%)
276
28(1
0%)
-0·1
508
0·24
56
0·86
01
0·53
15
1·39
18
0·54
≥2
4 53
04
588
(11%
) 54
13
581(
11%
) -0
·114
0·
0954
0·
8922
0·
74
1·07
57
0·23
Intr
a-cl
ass
corr
elat
ion
coef
fici
ent=
0·03
96
S.E
.: st
anda
rd e
rror
, OR
: odd
s ra
tio, C
I: c
onfi
denc
e in
terv
al.

14
Tab
le A
-4. M
ult
ileve
l log
isti
c re
gres
sion
mod
el f
or in
-hos
pit
al c
omp
osit
e co
mp
licat
ion
s
Pre
dic
tors
U
nw
eigh
ted
nu
mb
er
Wei
ghte
d n
um
ber
β
S·E·
OR
95
% C
I P
val
ue
Tot
al
Ou
tcom
e (%
) T
otal
O
utc
ome
(%)
low
er
up
per
Y
ear
20
01
1933
34
1 (1
8%)
1937
34
9(18
%)
0 -
1 -
- -
2006
35
81
771
(22%
) 35
58
752(
21%
) 0·
1842
0·
1037
1·
2022
0·
9811
1·
4733
0·
08
2011
64
72
1271
(20
%)
6461
11
95(1
8%)
0·07
61
0·11
31
1·07
91
0·86
45
1·34
7 0·
50
Age
<
55
2626
31
9 (1
2%)
2673
31
4(12
%)
0 -
1 -
- -
55-6
4 28
24
460
(16%
) 28
55
460(
16%
) 0·
3058
0·
0876
1·
3577
1·
1434
1·
6121
0·
0005
65
-74
3657
79
1 (2
2%)
3639
76
2(21
%)
0·51
56
0·10
39
1·67
46
1·36
62
2·05
26
<0·
0001
≥7
5 28
79
813
(28%
) 27
89
760(
27%
) 0·
7959
0·
1124
2·
2163
1·
7783
2·
7623
<
0·00
01
Sex
M
ale
8412
14
50 (
17%
) 83
60
1392
(17%
) 0
- 1
- -
- F
emal
e 35
74
933
(26%
) 35
96
904(
25%
) 0·
2942
0·
0567
1·
3421
1·
201
1·49
98
<0·
0001
H
yper
tens
ion
No
6141
12
42 (
20%
) 59
58
1158
(19%
) 0
- 1
- -
- Y
es
5845
11
41 (
20%
) 59
98
1138
(19%
) 0·
026
0·06
47
1·02
64
0·90
41
1·16
52
0·69
D
iabe
tes
No
9701
18
58 (
19%
) 95
60
1774
(19%
) 0
- 1
- -
- Y
es
2285
52
5 (2
3%)
2396
52
2(22
%)
0·09
11
0·07
79
1·09
53
0·94
03
1·27
6 0·
24
Cur
rent
sm
oker
N
o 78
82
1761
(22
%)
7626
16
59(2
2%)
0 -
1 -
- -
Yes
41
04
622
(15%
) 43
30
637(
15%
) -0
·118
1 0·
0536
0·
8886
0·
8 0·
9869
0·
027
Pri
or m
yoca
rdia
l inf
arct
ion
No
1074
8 21
51 (
20%
) 10
655
2056
(19%
) 0
- 1
- -
- Y
es
1238
23
2 (1
9%)
1301
24
0(18
%)
-0·3
047
0·13
51
0·73
73
0·56
58
0·96
09
0·02
4 P
rior
cor
onar
y he
art d
isea
se
No
9460
18
51 (
20%
) 93
90
1763
(19%
) 0
- 1
- -
- Y
es
2526
53
2 (2
1%)
2566
53
3(21
%)
0·17
54
0·09
61
1·19
17
0·98
71
1·43
88
0·07
P
rior
str
oke
No
1062
7 20
42 (
19%
) 10
543
1948
(18%
) 0
- 1
- -
- Y
es
1359
34
1 (2
5%)
1413
34
8(25
%)
0·22
38
0·06
96
1·25
09
1·09
13
1·43
38
0·00
13
Che
st d
isco
mfo
rt
Yes
11
055
2092
(19
%)
1109
0 20
24(1
8%)
0 -
1 -
- -
No
670
202
(30%
) 63
1 18
6(30
%)
0·25
97
0·09
94
1·29
65
1·06
7 1·
5755
0·
009
Unr
ecor
ded
261
89 (
34%
) 23
6 85
(36%
) 0·
4524
0·
1905
1·
5721
1·
0823
2·
2836
0·
0175
C
ardi
ac a
rres
t at a
dmis
sion
N
o 11
838
2328
(20
%)
1180
1 22
42(1
9%)
0 -
1 -
- -
Yes
14
8 55
(37
%)
155
54(3
5%)
0·55
27
0·19
51
1·73
79
1·18
57
2·54
75
0·00
5 A
cute
str
oke
at a
dmis
sion
N
o 11
839
2322
(20
%)
1181
8 22
36(1
9%)
0 -
1 -
- -
Yes
14
7 61
(41
%)
138
60(4
4%)
0·81
76
0·17
37
2·26
51
1·61
15
3·18
38
<0·
0001
15
Hea
rt r
ate
at a
dmis
sion
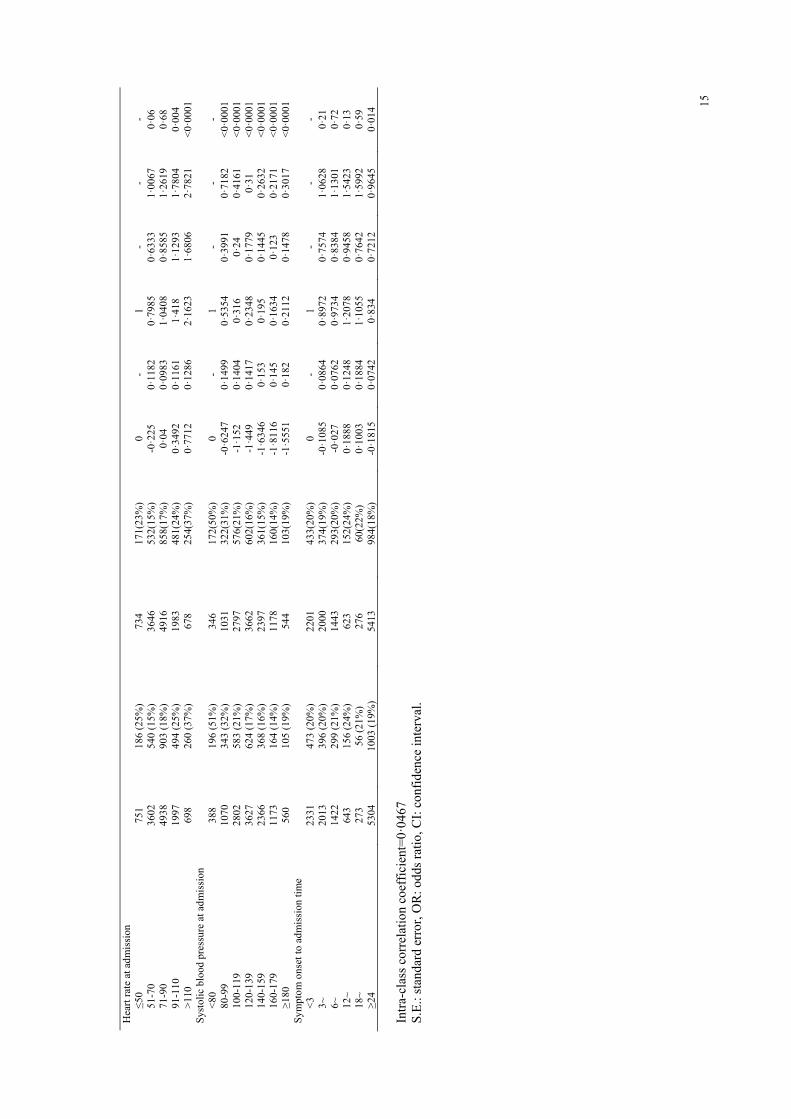
≤5
0 75
1 18
6 (2
5%)
734
171(
23%
) 0
- 1
- -
- 51
-70
3602
54
0 (1
5%)
3646
53
2(15
%)
-0·2
25
0·11
82
0·79
85
0·63
33
1·00
67
0·06
71
-90
4938
90
3 (1
8%)
4916
85
8(17
%)
0·04
0·
0983
1·
0408
0·
8585
1·
2619
0·
68
91-1
10
1997
49
4 (2
5%)
1983
48
1(24
%)
0·34
92
0·11
61
1·41
8 1·
1293
1·
7804
0·
004
>11
0 69
8 26
0 (3
7%)
678
254(
37%
) 0·
7712
0·
1286
2·
1623
1·
6806
2·
7821
<
0·00
01
Sys
toli
c bl
ood
pres
sure
at a
dmis
sion
<
80
388
196
(51%
) 34
6 17
2(50
%)
0 -
1 -
- -
80-9
9 10
70
343
(32%
) 10
31
322(
31%
) -0
·624
7 0·
1499
0·
5354
0·
3991
0·
7182
<
0·00
01
100-
119
2802
58
3 (2
1%)
2797
57
6(21
%)
-1·1
52
0·14
04
0·31
6 0·
24
0·41
61
<0·
0001
12
0-13
9 36
27
624
(17%
) 36
62
602(
16%
) -1
·449
0·
1417
0·
2348
0·
1779
0·
31
<0·
0001
14
0-15
9 23
66
368
(16%
) 23
97
361(
15%
) -1
·634
6 0·
153
0·19
5 0·
1445
0·
2632
<
0·00
01
160-
179
1173
16
4 (1
4%)
1178
16
0(14
%)
-1·8
116
0·14
5 0·
1634
0·
123
0·21
71
<0·
0001
≥1
80
560
105
(19%
) 54
4 10
3(19
%)
-1·5
551
0·18
2 0·
2112
0·
1478
0·
3017
<
0·00
01
Sym
ptom
ons
et to
adm
issi
on ti
me
<3
2331
47
3 (2
0%)
2201
43
3(20
%)
0 -
1 -
- -
3~
2013
39
6 (2
0%)
2000
37
4(19
%)
-0·1
085
0·08
64
0·89
72
0·75
74
1·06
28
0·21
6~
14
22
299
(21%
) 14
43
293(
20%
) -0
·027
0·
0762
0·
9734
0·
8384
1·
1301
0·
72
12~
643
156
(24%
) 62
3 15
2(24
%)
0·18
88
0·12
48
1·20
78
0·94
58
1·54
23
0·13
18
~ 27
3 56
(21
%)
276
60(2
2%)
0·10
03
0·18
84
1·10
55
0·76
42
1·59
92
0·59
≥2
4 53
04
1003
(19
%)
5413
98
4(18
%)
-0·1
815
0·07
42
0·83
4 0·
7212
0·
9645
0·
014
Intr
a-cl
ass
corr
elat
ion
coef
fici
ent=
0·04
67
S.E
.: st
anda
rd e
rror
, OR
: odd
s ra
tio, C
I: c
onfi
denc
e in
terv
al.

16
Tab
le A
-5. M
ult
ileve
l log
isti
c re
gres
sion
mod
el f
or 7
-day
dea
th
Pre
dic
tors
U
nw
eigh
ted
nu
mb
er
Wei
ghte
d n
um
ber
β
S·E·
OR
95
% C
I P
val
ue
Tot
al
Ou
tcom
e (%
) T
otal
O
utc
ome
(%)
low
er
up
per
Y
ear
20
01
2010
13
5(7%
) 20
12
138(
7%)
0 -
1 -
- -
2006
36
96
298(
8%)
3681
28
3(8%
) 0·
096
0·15
01
1·10
08
0·82
03
1·47
72
0·52
20
11
6715
42
6(6%
) 66
80
389(
6%)
-0·1
128
0·15
06
0·89
34
0·66
5 1·
2001
0·
45
Age
<
55
2762
82
(3%
) 28
01
76(3
%)
0 -
1 -
- -
55-6
4 29
37
138(
5%)
2963
12
7(4%
) 0·
3779
0·
1658
1·
4593
1·
0545
2·
0196
0·
023
65-7
4 37
69
306(
8%)
3752
28
9(8%
) 0·
8424
0·
1365
2·
3219
1·
7768
3·
0343
<
0·00
01
≥75
2953
33
3(11
%)
2856
31
8(11
%)
1·18
87
0·15
68
3·28
28
2·41
42
4·46
39
<0·
0001
S
ex
Mal
e 87
37
468(
5%)
8672
43
3(5%
) 0
- 1
- -
- F
emal
e 36
84
391(
11%
) 37
01
377(
10%
) 0·
4569
0·
0831
1·
5792
1·
342
1·85
84
<0·
0001
H
yper
tens
ion
No
6373
47
7(7%
) 61
73
441(
7%)
0 -
1 -
- -
Yes
60
48
382(
6%)
6200
36
9(6%
) -0
·065
9 0·
1006
0·
9362
0·
7688
1·
1402
0·
51
Dia
bete
s
N
o 10
048
662(
7%)
9884
61
9(6%
) 0
- 1
- -
- Y
es
2373
19
7(8%
) 24
89
191(
8%)
0·13
47
0·10
18
1·14
42
0·93
71
1·39
69
0·19
C
urre
nt s
mok
er
No
8132
69
4(9%
) 78
57
640(
8%)
0 -
1 -
- -
Yes
42
89
165(
4%)
4516
17
0(4%
) -0
·303
8 0·
1236
0·
738
0·57
93
0·94
03
0·01
4 P
rior
myo
card
ial i
nfar
ctio
n
N
o 11
150
778(
7%)
1103
7 72
9(7%
) 0
- 1
- -
- Y
es
1271
81
(6%
) 13
36
81(6
%)
-0·4
175
0·19
63
0·65
87
0·44
83
0·96
77
0·03
3 P
rior
cor
onar
y he
art d
isea
se
No
9813
65
1(7%
) 97
25
613(
6%)
0 -
1 -
- -
Yes
26
08
208(
8%)
2648
19
7(7%
) 0·
2658
0·
1192
1·
3045
1·
0328
1·
6476
0·
026
Pri
or s
trok
e
N
o 11
018
731(
7%)
1090
9 68
1(6%
) 0
- 1
- -
- Y
es
1403
12
8(9%
) 14
64
129(
9%)
0·26
72
0·10
12
1·30
62
1·07
13
1·59
27
0·00
8 C
hest
dis
com
fort
Y
es
1145
8 74
3(6%
) 11
475
703(
6%)
0 -
1 -
- -
No
697
77(1
1%)
658
71(1
1%)
0·15
86
0·14
6 1·
1719
0·
8802
1·
5603
0·
28
Unr
ecor
ded
266
39(1
5%)
241
36(1
5%)
0·36
07
0·23
65
1·43
43
0·90
23
2·28
0·
13
Car
diac
arr
est a
t adm
issi
on
No
1226
9 82
8(7%
) 12
214
781(
6%)
0 -
1 -
- -
Yes
15
2 31
(20%
) 15
9 29
(18%
) 0·
8276
0·
2992
2·
288
1·27
28
4·11
3 0·
006
Acu
te s
trok
e at
adm
issi
on
No
1226
8 84
0(7%
) 12
229
792(
6%)
0 -
1 -
- -
Yes
15
3 19
(12%
) 14
4 18
(12%
) 0·
292
0·32
02
1·33
91
0·71
49
2·50
82
0·36
17
Hea
rt r
ate
at a
dmis
sion
≤5
0 77
2 84
(11%
) 75
3 78
(10%
) 0
- 1
- -
- 51
-70
3734
18
9(5%
) 37
71
174(
5%)
-0·2
698
0·16
51
0·76
35
0·55
24
1·05
52
0·10
71
-90
5122
28
2(6%
) 50
92
260(
5%)
-0·0
899
0·15
66
0·91
4 0·
6724
1·
2425
0·
57
91-1
10
2067
18
8(9%
) 20
53
182(
9%)
0·30
69
0·17
28
1·35
92
0·96
88
1·90
71
0·08
>
110
726
116(
16%
) 70
4 11
5(16
%)
0·74
23
0·21
32
2·10
08
1·38
32
3·19
07
0·00
05
Sys
toli
c bl
ood
pres
sure
at a
dmis
sion
<
80
401
133(
33%
) 35
7 12
0(34
%)
0 -
1 -
- -
80-9
9 11
04
152(
14%
) 10
61
152(
14%
) -0
·909
7 0·
1778
0·
4026
0·
2842
0·
5705
<
0·00
01
100-
119
2907
20
9(7%
) 28
97
200(
7%)
-1·6
576
0·13
98
0·19
06
0·14
49
0·25
07
<0·
0001
12
0-13
9 37
52
190(
5%)
3781
17
4(5%
) -2
·105
2 0·
15
0·12
18
0·09
08
0·16
34
<0·
0001
14
0-15
9 24
70
100(
4%)
2499
90
(4%
) -2
·449
5 0·
1976
0·
0863
0·
0586
0·
1272
<
0·00
01
160-
179
1208
44
(4%
) 12
14
43(4
%)
-2·5
16
0·21
45
0·08
08
0·05
31
0·12
3 <
0·00
01
≥180
57
9 31
(5%
) 56
5 31
(5%
) -2
·277
9 0·
2432
0·
1025
0·
0636
0·
1651
<
0·00
01
Sym
ptom
ons
et to
adm
issi
on ti
me
<3
2431
20
1(8%
) 22
91
181(
8%)
0 -
1 -
- -
3~
2091
13
3(6%
) 20
75
123(
6%)
-0·4
205
0·14
08
0·65
67
0·49
84
0·86
54
0·00
3 6~
14
77
118(
8%)
1497
11
4(8%
) -0
·075
5 0·
1419
0·
9273
0·
7022
1·
2246
0·
59
12~
671
56(8
%)
648
52(8
%)
-0·1
101
0·18
09
0·89
58
0·62
83
1·27
71
0·54
18
~ 28
2 18
(6%
) 28
3 16
(6%
) -0
·387
4 0·
289
0·67
88
0·38
53
1·19
6 0·
18
≥24
5469
33
3(6%
) 55
79
324(
6%)
-0·3
878
0·11
49
0·67
86
0·54
18
0·84
99
0·00
07
Intr
a-cl
ass
corr
elat
ion
coef
fici
ent=
0·06
31
S.E
.: st
anda
rd e
rror
, OR
: odd
s ra
tio, C
I: c
onfi
denc
e in
terv
al.

18
Tab
le A
-6. M
ult
ileve
l log
isti
c re
gres
sion
mod
el f
or 7
-day
dea
th o
r tr
eatm
ent
wit
hdr
awal
Pre
dic
tors
U
nw
eigh
ted
nu
mb
er
Wei
ghte
d n
um
ber
β
S·E·
OR
95
% C
I P
val
ue
Tot
al
Ou
tcom
e (%
) T
otal
O
utc
ome
(%)
low
er
up
per
Y
ear
20
01
2010
16
3(8%
) 20
12
165(
8%)
0 -
1 -
- -
2006
36
96
396(
11%
) 36
81
374(
10%
) 0·
2304
0·
1299
1·
2592
0·
9761
1·
6243
0·
08
2011
67
15
630(
9%)
6680
56
5(8%
) 0·
1527
0·
132
1·16
49
0·89
94
1·50
89
0·24
A
ge
<55
27
62
103(
4%)
2801
95
(3%
) 0
- 1
- -
- 55
-64
2937
18
2(6%
) 29
63
168(
6%)
0·44
19
0·15
02
1·55
56
1·15
89
2·08
82
0·00
3 65
-74
3769
42
5(11
%)
3752
39
8(11
%)
0·97
79
0·13
01
2·65
88
2·06
04
3·43
11
<0·
0001
≥7
5 29
53
479(
16%
) 28
56
443(
16%
) 1·
3241
0·
1412
3·
7588
2·
8501
4·
9571
<
0·00
01
Sex
M
ale
8737
64
6(7%
) 86
72
593(
7%)
0 -
1 -
- -
Fem
ale
3684
54
3(15
%)
3701
51
1(14
%)
0·42
76
0·07
55
1·53
35
1·32
26
1·77
8 <
0·00
01
Hyp
erte
nsio
n
N
o 63
73
657(
10%
) 61
73
593(
10%
) 0
- 1
- -
- Y
es
6048
53
2(9%
) 62
00
511(
8%)
-0·0
053
0·08
61
0·99
48
0·84
03
1·17
76
0·95
D
iabe
tes
No
1004
8 93
1(9%
) 98
84
853(
9%)
0 -
1 -
- -
Yes
23
73
258(
11%
) 24
89
251(
10%
) 0.
0269
0·
0948
1·
0273
0·
8531
1·
2371
0·
78
Cur
rent
sm
oker
N
o 81
32
976(
12%
) 78
57
888(
11%
) 0
- 1
- -
- Y
es
4289
21
3(5%
) 45
16
216(
5%)
-0·4
37
0·09
91
0·64
6 0·
532
0·78
44
<0·
0001
P
rior
myo
card
ial i
nfar
ctio
n
N
o 11
150
1092
(10%
) 11
037
1007
(9%
) 0
- 1
- -
- Y
es
1271
97
(8%
) 13
36
97(7
%)
-0·5
619
0·15
98
0·57
01
0·41
68
0·77
98
0·00
04
Pri
or c
oron
ary
hear
t dis
ease
N
o 98
13
929(
9%)
9725
85
7(9%
) 0
- 1
- -
- Y
es
2608
26
0(10
%)
2648
24
7(9%
) 0·
1971
0·
1115
1·
2179
0·
9789
1·
5153
0·
08
Pri
or s
trok
e
N
o 11
018
1016
(9%
) 10
909
932(
9%)
0 -
1 -
- -
Yes
14
03
173(
12%
) 14
64
172(
12%
) 0·
1999
0·
0908
1·
2212
1·
0222
1·
4591
0·
028
Che
st d
isco
mfo
rt
Yes
11
458
1022
(9%
) 11
475
948(
8%)
0 -
1 -
- -
No
697
105(
15%
) 65
8 96
(15%
) 0·
0713
0·
1303
1·
0739
0·
8319
1·
3864
0·
58
Unr
ecor
ded
266
62(2
3%)
241
60(2
5%)
0·62
52
0·24
45
1·86
86
1·15
71
3·01
77
0·01
1 C
ardi
ac a
rres
t at a
dmis
sion
N
o 12
269
1149
(9%
) 12
214
1067
(9%
) 0
- 1
- -
- Y
es
152
40(2
6%)
159
37(2
3%)
0·80
06
0·27
46
2·22
7 1·
3001
3·
8148
0·
004
Acu
te s
trok
e at
adm
issi
on
No
1226
8 11
47(9
%)
1222
9 10
65(9
%)
0 -
1 -
- -
Yes
15
3 42
(27%
) 14
4 39
(27%
) 0·
9992
0·
2166
2·
7161
1·
7766
4·
1525
<
0·00
01

19
Hea
rt r
ate
at a
dmis
sion
≤5
0 77
2 12
4(16
%)
753
112(
15%
) 0
- 1
- -
- 51
-70
3734
23
4(6%
) 37
71
221(
6%)
-0·4
573
0·13
73
0·63
3 0·
4836
0·
8285
0·
0009
71
-90
5122
38
3(7%
) 50
92
343(
7%)
-0·2
141
0·13
59
0·80
73
0·61
85
1·05
37
0·11
91
-110
20
67
271(
13%
) 20
53
258(
13%
) 0·
296
0·14
68
1·34
44
1·00
84
1·79
25
0·04
4 >
110
726
177(
24%
) 70
4 17
0(24
%)
0·88
77
0·17
19
2·42
95
1·73
45
3·40
29
<0·
0001
S
ysto
lic
bloo
d pr
essu
re a
t adm
issi
on
<80
40
1 18
0(45
%)
357
159(
44%
) 0
- 1
- -
- 80
-99
1104
22
6(20
%)
1061
21
6(20
%)
-0·9
538
0·17
02
0·38
53
0·27
6 0·
5378
<
0·00
01
100-
119
2907
29
2(10
%)
2897
28
0(10
%)
-1·8
068
0·14
08
0·16
42
0·12
46
0·21
64
<0·
0001
12
0-13
9 37
52
264(
7%)
3781
24
2(6%
) -2
·274
0·
1426
0·
1029
0·
0778
0·
1361
<
0·00
01
140-
159
2470
13
3(5%
) 24
99
118(
5%)
-2·6
997
0·17
42
0·06
72
0·04
78
0·09
46
<0·
0001
16
0-17
9 12
08
58(5
%)
1214
54
(4%
) -2
·834
3 0·
1957
0·
0588
0·
04
0·08
62
<0·
0001
≥1
80
579
36(6
%)
565
36(6
%)
-2·6
868
0·22
22
0·06
81
0·04
41
0·10
53
<0·
0001
S
ympt
om o
nset
to a
dmis
sion
tim
e
<
3 24
31
245(
10%
) 22
91
216(
9%)
0 -
1 -
- -
3~
2091
18
4(9%
) 20
75
165(
8%)
-0·3
013
0·12
13
0·73
99
0·58
33
0·93
85
0·01
3 6~
14
77
165(
11%
) 14
97
154(
10%
) 0·
0635
0·
1326
1·
0656
0·
8217
1·
3819
0·
63
12~
671
86(1
3%)
648
80(1
2%)
0·20
43
0·14
04
1·22
67
0·93
16
1·61
54
0·15
18
~ 28
2 22
(8%
) 28
3 21
(7%
) -0
·313
4 0·
2572
0·
7309
0·
4415
1·
21
0·22
≥2
4 54
69
487(
9%)
5579
46
8(8%
) -0
·185
6 0·
1049
0·
8306
0·
6763
1·
0201
0·
08
Intr
a-cl
ass
corr
elat
ion
coef
fici
ent=
0·03
78
S.E
.: st
anda
rd e
rror
, OR
: odd
s ra
tio, C
I: c
onfi
denc
e in
terv
al.

20
Figure A-1. Adjusted in-hospital outcomes for patients with STEMI (entire study sample). Adjusted odds ratio (OR) of patient outcomes are shown along the horizontal axis with the vertical line demarking an odds ratio of 1 (i.e., no difference from year 2001); estimates to the right (i.e., >1) are associated with higher risk of the outcome, while those to the left (i.e., <1) indicate lower risk of the outcome. Each square represents the point estimate of the adjusted OR of the outcome in a study year, while the line shows the 95% confidence interval (CI).
Outcomes UnadjustedRate (%)
AdjustedOR (95% CI)
Death2001 8·0 1 [reference]
2006 8·9 1·09 (0·85- 1·39)
2011 6·2 0·78 (0·59- 1·04)Death or treatment withdrawal
2001 9·6 1 [reference]
2006 11·6 1·22 (0·99- 1·49)
2011 8·9 0·99 (0·78- 1·27)
Composite complications
2001 17·6 1 [reference]
2006 20·1 1·17 (0·97- 1·41)
2011 17·2 1·01 (0·82- 1·24)
0·5 1 2 2·5
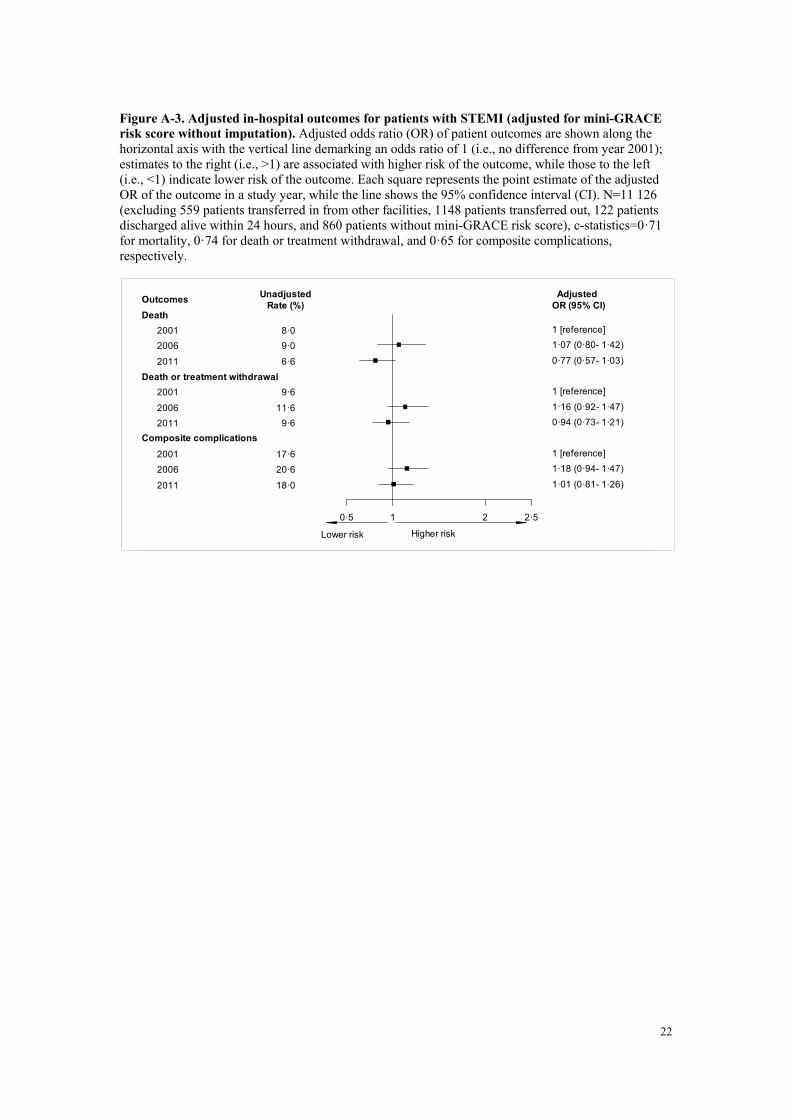
Lower risk Higher risk

21
Figure A-2. Adjusted in-hospital outcomes for patients with STEMI (adjusted without transforming continuous variables). Adjusted odds ratio (OR) of patient outcomes are shown along the horizontal axis with the vertical line demarking an odds ratio of 1 (i.e., no difference from year 2001); estimates to the right (i.e., >1) are associated with higher risk of the outcome, while those to the left (i.e., <1) indicate lower risk of the outcome. Each square represents the point estimate of the adjusted OR of the outcome in a study year, while the line shows the 95% confidence interval (CI).
Outcomes UnadjustedRate (%)
AdjustedOR (95% CI)
Death2001 8·7 1 [reference]
2006 9·6 1·06 (0·82- 1·36)
2011 7·1 0·81 (0·61- 1·07)Death or treatment withdrawal
2001 10·5 1 [reference]
2006 12·5 1·17 (0·94- 1·46)
2011 10·2 1·00 (0·78- 1·28)
Composite complications2001 18·0 1 [reference]
2006 21·1 1·19 (0·98- 1·45)
2011 18·5 1·06 (0·86- 1·31)
0·5 1 2 2·5
Lower risk Higher risk
22
Figure A-3. Adjusted in-hospital outcomes for patients with STEMI (adjusted for mini-GRACE risk score without imputation). Adjusted odds ratio (OR) of patient outcomes are shown along the horizontal axis with the vertical line demarking an odds ratio of 1 (i.e., no difference from year 2001); estimates to the right (i.e., >1) are associated with higher risk of the outcome, while those to the left (i.e., <1) indicate lower risk of the outcome. Each square represents the point estimate of the adjusted OR of the outcome in a study year, while the line shows the 95% confidence interval (CI). N=11 126 (excluding 559 patients transferred in from other facilities, 1148 patients transferred out, 122 patients discharged alive within 24 hours, and 860 patients without mini-GRACE risk score), c-statistics=0·71 for mortality, 0·74 for death or treatment withdrawal, and 0·65 for composite complications, respectively.
Outcomes UnadjustedRate (%)
AdjustedOR (95% CI)
Death2001 8·0 1 [reference]
2006 9·0 1·07 (0·80- 1·42)
2011 6·6 0·77 (0·57- 1·03)
Death or treatment withdrawal 2001 9·6 1 [reference]
2006 11·6 1·16 (0·92- 1·47)
2011 9·6 0·94 (0·73- 1·21)
Composite complications2001 17·6 1 [reference]
2006 20·6 1·18 (0·94- 1·47)
2011 18·0 1·01 (0·81- 1·26)
0·5 1 2 2·5
Lower risk Higher risk

23
Figure A-4. Adjusted 7-day outcomes for patients with STEMI (adjusted by mini-GRACE risk score without imputation). Adjusted odds ratio (OR) of patient outcomes are shown along the horizontal axis with the vertical line demarking an odds ratio of 1 (i.e., no difference from year 2001); estimates to the right (i.e., >1) are associated with higher risk of the outcome, while those to the left (i.e., <1) indicate lower risk of the outcome. Each square represents the point estimate of the adjusted OR of the outcome in a study year, while the line shows the 95% confidence interval (CI). N=11 546 (excluding 559 patients transferred in from other facilities, 713 patients transferred out within 7 days, 122 patients discharged alive within 24 hours, and 875 patients without mini-GRACE risk score), c-statistics=0·71 for mortality and 0·74 for death or treatment withdrawal, respectively.
Outcomes UnadjustedRate (%)
AdjustedOR (95% CI)
Death
2001 5·9 1 [reference]
2006 7·0 1·12 (0·81- 1·56)
2011 5·3 0·83 (0·62- 1·12)Death or treatment withdrawal
2001 7·1 1 [reference]
2006 9·1 1·25 (0·95- 1·64)
2011 7·8 1·06 (0·82- 1·36)
0·5 1 2
Lower risk Higher risk

24
Figure A-5. Adjusted in-hospital outcomes for patients with STEMI (adjusted for mini-GRACE risk score with imputation). Adjusted odds ratio (OR) of patient outcomes are shown along the horizontal axis with the vertical line demarking an odds ratio of 1 (i.e., no difference from year 2001); estimates to the right (i.e., >1) are associated with higher risk of the outcome, while those to the left (i.e., <1) indicate lower risk of the outcome. Each square represents the point estimate of the adjusted OR of the outcome in a study year, while the line shows the 95% confidence interval (CI). N=11 986 (excluding 559 patients transferred in from other facilities, 1148 patients transferred out, and 122 patients discharged alive within 24 hours), c-statistics=0·71 for mortality, 0·73 for death or treatment withdrawal, and 0·66 for composite complications, respectively.
Outcomes UnadjustedRate (%)
AdjustedOR (95% CI)
Death2001 8·7 1 [reference]
2006 9·6 1·03 (0·79- 1·32)
2011 7·1 0·75 (0·57- 0.98)Death or treatment withdrawal
2001 10·5 1 [reference]
2006 12·5 1·12 (0·91- 1·39)
2011 10·2 0·89 (0·71- 1·13)
Composite complications2001 18·0 1 [reference]
2006 21·1 1·16 (0·96- 1·42)
2011 18·5 1·00 (0·82- 1·23)
0·5 1 2 2·5
Lower risk Higher risk

25
Figure A-6. Adjusted 7-day outcomes for patients with STEMI (adjusted for mini-GRACE risk score with imputation). Adjusted odds ratio (OR) of patient outcomes are shown along the horizontal axis with the vertical line demarking an odds ratio of 1 (i.e., no difference from year 2001); estimates to the right (i.e., >1) are associated with higher risk of the outcome, while those to the left (i.e., <1) indicate lower risk of the outcome. Each square represents the point estimate of the adjusted OR of the outcome in a study year, while the line shows the 95% confidence interval (CI). N=12 421 (excluding 559 patients transferred in from other facilities, 713 patients transferred out within 7 days, and 122 patients discharged alive within 24 hours), c-statistics=0·71 for mortality and 0·74 for death or treatment withdrawal, respectively.
Outcomes UnadjustedRate (%)
AdjustedOR (95% CI)
Death
2001 6·9 1 [reference]
2006 7·7 1·04 (0·78- 1·39)
2011 5·8 0·78 (0·60- 1·02)Death or treatment withdrawal
2001 8·2 1 [reference]
2006 10·2 1·18 (0·92- 1·50)
2011 8·5 0·97 (0·76- 1·22)
0·5 1 2
Lower risk Higher risk