14.P7777 GT EQ Trader Installation/Plateform Manual/User...
32
EQ TRADER User Manual Cape Town Office: T +27 (0) 87 940 6110 F +27 (0) 21 425 9237 W gt247.com First World Trader (Pty) Ltd t/a GT247.com is an authorised Financial Services Provider. FSB License No. 22588. KZN Office: T +27 (0) 87 940 6090 F +27 (0) 31 576 5088 W gt247.com Johannesburg Office: T +27 (0) 87 940 6000 F +27 (0) 11 214 8028 W gt247.com Directors: Mark Barnes/Chairman Charles Savage/CEO Gary van Dyk/CFOO 1
Transcript of 14.P7777 GT EQ Trader Installation/Plateform Manual/User...

EQ TradErUser Manual
Cape Town Office:
T +27 (0) 87 940 6110 F +27 (0) 21 425 9237 W gt247.com
First World Trader (Pty) Ltd t/a GT247.com is an authorised Financial Services Provider.FSB License No. 22588.
KZN Office:
T +27 (0) 87 940 6090 F +27 (0) 31 576 5088 W gt247.com
Johannesburg Office:
T +27 (0) 87 940 6000 F +27 (0) 11 214 8028 W gt247.com
Directors:
Mark Barnes/ChairmanCharles Savage/CEOGary van Dyk/CFOO
1

2
EQ TradErUser Manual
Contents
A. Introduction to GT247.com ....................................................................................................3B. Contract for Difference .........................................................................................................6
2. Advantages of CFD Trading ...............................................................................................73. Terms You Need to Know ...................................................................................................8
C. The CFD Trading Platform1. Getting Started .................................................................................................................102. Product Navigator ........................................................................................................... 113. Watchlists ........................................................................................................................134. Information Window .........................................................................................................155. Favourites Ticker .............................................................................................................166. Opening a Position ...........................................................................................................177. Open Transaction Window ...............................................................................................198. Placing an Order .............................................................................................................20
8.1 How to Place an Order 8.1.1 Trailing Stops Order ...............................................................................................218.1.2 Break Order ............................................................................................................218.1.3 Normal Order ..........................................................................................................21
9. Account Balance ...............................................................................................................2210. Trading Currency ...........................................................................................................2311. Login and Logout ............................................................................................................2412. Desktop ...........................................................................................................................2513. Report .............................................................................................................................2614. Status Bar .......................................................................................................................27
15. Trading Examples15.1 Simple Example: Buying Anglo American ..............................................................2815.2 Advanced Example: Buying Anglo American .........................................................2915.3 Advanced Example: Shorting Anglo American.......................................................31

3
EQ TradErUser Manual
Introduction To GT247.comGT247.com is a pioneering full service broker operating in South Africa. Recognised as the market leader in Contracts for Difference (CFDs) and Spread Trading, GT247.com has extended its market coverage to include more traditional broking products delivered in a new world way.
Our new world of tradingGT247.com drives financial market innovation through the establishment of new markets, products, platforms and services that deliver boutique full service broking including prime services.
We deliver products and services that are relevant, considerate of the market conditions and enable you to start your journey towards simplified risk managed success.
GT247.com is proud to be the first online trading broker in South Africa to introduce trading on international financial markets in ZAR. This is in addition to our string of ‘Firsts’ in the industry.
1st in South Africa• 1st Broker in South Africa to offer spread trading - 2000.• 1st Spread trading platform in the world to provide straight through processing of trades
without any dealer intervention.• 1st Broker to offer full white label software solution of GT247.com products and platforms
- 2003.• 1st Broker in South Africa to offer CFD trading - 2005.• 1st Broker to offer online CFD trading - 2005.• 1st FSA regulated CFD provider operating in emerging markets.• 1st Broker in South Africa to offer Binary Options trading - 2008.• 1st Broker in South Africa to offer Mini CFDs - 2009.• 1st Broker in South Africa to deploy financial services windows “Gadget” 2009 (coming
soon).• 1st Broker in South Africa to offer community services, “facebook for financial markets” –
2009 (coming soon).
We offer …
• Product and service innovation.• Trading in the most liquid international markets in the currency of your choice (coming
soon).• Unparalleled online user experience.• Full service support.• Institutional grade education courses.• Simplified risk management advisory services.• Extraordinary sales trading and client support services.• Award-winning technical research reports.• Fast, reliable, world class trading systems.• Regional walk in centres.• Free nationwide educational seminars.• Exceptional on-the-ground client service.
4
EQ TradErUser Manual
GT247.com is wholly owned by JSE listed South African financial services group, Purple Capital (JSE:PPE) (see www.purplecapital.co.za for more information on Purple Capital) and is run by a group of market professionals who share a common goal to redefine trading. Applying their extensive financial backgrounds with leading global investment banks and software houses, the business blends institutional grade products and sophisticated risk management with strong retail experience to provide the perfect destination for high-end private client business.
GT247.com is an authorised Financial Services Provider by the Financial Services Board of South Africa, FSB No 22588 and is a derivative member of the Johannesburg Stock Exchange. GT247.com also enables financial institutions the opportunity to offer CFDs and Spreads to their own clients either through their well established affiliate programme or their sophisticated white label solu-tions.
A new national campaign has been launched by GT247.com entitled: What’s Stopping you? (WSY) The purpose of the campaign is to encourage individuals to place less reliance on their financial broker and take more control as well as educate themselves about self-directed investing.
WSY removes the guess work of self-directed investing by reducing the barriers to entry which in turn allows more South Africans to participate and ultimately take more control of their investing and financial futures. Learn more about yourself by completing a self-evaluation which measures you across the following dimensions for trading:
1. Knowledge of investment instruments.
2. Experience/suitability of trading online.
3. Risk Appetite.
4. Trader Personality (Cognitive vs. Intuitive).
After all, successful investing is a journey...so this evaluation allows our dedicated, national Sales Team to put a placeholder of where you are in this journey by evaluating you across all these different dimensions. We can then provide you with detailed, beneficial information telling you about where you are in your financial journey and Thereafter what we give you are the road signs for you to advance yourself towards the next stage of that journey… What’s stopping you?
Visit www.wsy.co.za
Risk Warning and Disclaimer
Risk Warning - Spread Trading and Contracts for Differences (CFDs) carry a high level of risk to your capital. Only speculate with money you can afford to lose as you may lose more than your original deposit. Spread trading and CFDs can be very volatile and prices may move rapidly against you. Resulting losses may require further payments to be made. Spread Trading and CFDs may not be suitable for all customers, so ensure you fully understand the risks involved and seek independent advice if necessary.
5
EQ TradErUser Manual
CFDs as defined by Wikipedia:
A contract for difference (or CFD) is a contract between two parties, typically described as "buyer" and "seller", stipulating that the seller will pay to the buyer the difference between the current value of an asset and its value at contract time (if the difference is negative, then the buyer pays instead to the seller). For example, when applied to equities, such a contract is an equity derivative that allows investors to speculate on share price movements, without the need for ownership of the underlying shares. CFDs allow investors to take both long or short positions. Unlike futures contracts, CFDs have no fixed expiry date, standardised contract or contract size. Trades are conducted on a leveraged basis with margins typically ranging from 1% to 30% of the notional value for CFDs on leading equities. CFDs are currently available either unlisted or listed [i.e. mini-warrants and ASX CFDs listed on the Australian Securities Exchange] and/or over the counter (OTC) markets in the United Kingdom, The Netherlands, Germany, Switzerland, Italy, Singapore, South Africa, Australia, Canada, New Zealand, Sweden, France, Ireland, Japan and Spain. Some other securities markets, such as Hong Kong, have plans to issue CFDs in the near future. CFDs are not permitted in the United States, due to restrictions by the US Securities and Exchange Commission on OTC financial instruments.
CFDs are a derivative productCFDs were originally created to imitate traditional share trading, but they differ because you don't actually own the underlying asset, in most cases equity shares. A CFD has no underlying rights on the asset and is simply an agreement between two parties to settle (generally in cash) the difference between the buying and selling price. This means that you can trade on the price movements on an asset without having to physically own it. For example, you can enter into a contract where you buy a CFD on 200 shares of IBM, thereby delivering the same economic outcome instead of having to buy the actual 200 shares on an exchange.
CFDs are a leveraged productThis means that you do not need to fund the entire position, but simply put up a percentage (margin) which is determined by the CFD broker. Leverage enables you to profit significantly if the market moves in the direction that you expect, but at the same time you risk significant losses if the market moves against you.
6
EQ TradErUser Manual
Simply speaking…A CFD is similar to something we understand explicitly, that is the purchase of a home using a mortgage. In this transaction you swap asset ownership for finance: the bank provides the finance in the form of your mortgage and in return they take ownership of your home.
Your obligations under the mortgage contract are to meet the monthly instalments which include a capital and finance portion. As long as you continue to perform your obligations under the mortgage contract, you will continue to enjoy the full benefits of home ownership including a roof over your head, rental income, price ,appreciation, etc. If you fail to meet your obligations, the bank will take away your ownership benefits and place the home up for sale. The proceeds from the sale will be offset against the remaining value of the mortgage and the balance will be for the mortgage holder to settle.
CFDs are very similar…In a CFD transaction, through the finance agreement, in this case a CFD contract, you essentially swap share ownership for finance. Your broker provides the finance in the form of a leveraged CFD position and in return you enjoy the economic benefits of share ownership.
Your obligations under the CFD contract are to meet the capital requirements (margin) and financing costs. The key difference is that, unlike a home mortgage agreement where the periods are monthly, as home prices are far less volatile than share prices, the period and subsequent cash flows are settled daily. As long as you meet these obligations you will receive the full economic benefits of share ownership: that is price appreciation, dividend yield and other corporate action effects. The only exception is that you are not entitled to voting rights associated with share ownership.
However, should you fail to meet your obligation, like the bank, the broker will exercise the right under the CFD contract and place the position up for sale. The proceeds from the sale will be offset against your capital requirements and the balance will be for you to settle.
Contract for Difference
7
EQ TradErUser Manual
Advantages of CFD Trading• CFDs are relatively inexpensive to trade, with competitive commission and
financing rates.• CFDs are very simple to trade and more transparent than other trading
alternatives.• CFDs suit most trading strategies, and can complement your existing
investing methods.• Low capital requirements: CFDs are a leveraged product, which means that
you can seek to profit from price fluctuations without putting down large amounts of capital. Enjoy leveraged trading up to 100:15 with GT247.com.
• CFDs enable you to profit from both rising and falling markets. You can go both long and short on shares without holding the underlying asset.
• Anonymity: your identity is not disclosed in a CFD transaction; only the CFD writer is disclosed to the share transaction.
• No exchange fees (STRATE, Insider Trading Levy and Securities Tax) because you are not making a physical purchase.
• No delivery or trading expiration period for equity CFDs.• Dividends are settled in cash, adding to the transparency of the product.
Best used for …• Hassle-free access to short selling.• Hedging Cash Equity Portfolio.• Cost reduction.• Capital effectiveness.• Cash flow management.• Execution of the following popular trading strategies:
• Arbitrage.• Scalping.• Pairs trading.• Hedging.• Momentum trading.• Technical trading.• Long and short speculation.
8
EQ TradErUser Manual
Master the market terminology
Bid Price
This is the price at which you will sell (go short) a CFD.
Break OrdersAn order to buy the market higher than its current value based on technical levels (resistance) with the view that, should resistance be broken, the market will rally. The inverse applies for support levels or downside breaks on a short position.
ChartingTracking price movements on graphs or charts so that you can see at a glance how the markets are moving. Coupled with various studies technical analysis can be conducted in an attempt to anticipate market direction.
Closed positionA long or short position that has been liquidated – i.e. the margin returned +/- the Profit or Loss.
EquityAnother name for stocks or shares.
GearingGearing is also referred to as leverage. It is the practice of entering into a transaction using funds that are borrowed from your broker. For instance, if you were to buy CFDs to the value of R100,000, GT247.com could ask for a deposit of R10,000 and lend you the balance of R90,000. This means that you do not need to fund the entire position, but simply put up a percentage (margin) which is determined by your broker. Gearing enables you to profit significantly if the market moves in your favour (i.e. the direction that you expect) but at the same time you risk significant losses if the market moves against you.
HedgingThe practice of undertaking one investment activity in order to protect against loss in another, e.g. selling short to nullify a previous purchase, or buying long to offset a previous short sale. While hedges reduce potential losses, they also tend to reduce potential profits.
IlliquidA market that doesn’t have much volume. It can be moved disproportionately by a small amount of business and often results in wide bid/offer spreads.
LongOpening a purchase (buy) position because you expect the underlying market to rise. If you go long, you will buy at the opening price and expect to sell at a profit when the price rises.
MarginA margin is the cash deposit you are required to make when you enter into a geared (leveraged) transaction. The margin provides collateral to cover any losses that may result from your trade.
Margin callIn the event that you suffer losses on your trade upon Mark to Market, those losses will be debited from your margin account. If the losses exceed the free cash amount in your trust account, your broker will request that you deposit more funds to return your account to a positive balance. The margin call is the phone call from your broker to tell you how much is due.
Offer PriceThis is the price at which you will buy (go long) a CFD.
Terms
9
EQ TradErUser Manual
Open Order
This is an automated instruction that you can implement on your platform, to execute your order when the market price reaches the amount at which you are willing to buy/sell. It ensures that your orders will be placed as desired, without you having to watch your platform at all times.
Partial Closing of a PositionThe closing of an open position will be partial if you execute an opposite trade of a lesser amount than the previous open position.
SENSSecurities Exchange News Service.
ShortOpening a sell position because you expect the underlying market to fall. When you go short, you will sell at the opening price and expect to buy back when the price drops, retaining the difference as your profit.
Stop Loss OrderAn action executed to limit one’s downside/loss should the market move unfavourably against the trader/ investor. A trailing stop enables one to automatically move their Stop Loss with the market should the position be running favourably for the trader/ investor.
Take Profit OrderAn action executed to sell/liquidate a long (buy) position above current market levels or buy back a short position (sell) below current market levels hence automatically locking in a profit.
VolatilityWhen price movements rise and fall rapidly and react strongly to influences in the market, the market is said to be volatile. Volatility is the statistical measure of price movements over time, calculated by using standard deviation. Volatile markets or financial instruments are associated with a high degree of risk.
Master the market terminology

10
EQ TradErUser Manual
1. Price Improvement – Ultra-fast pricing provided by Reuters.
2. Faster Connectivity – Our systems are locally hosted on the first virtual account in South Africa, helping you benefit from the fastest connection speeds.
3. Watchlists – Customisable watchlists to store your favourite instruments.
4. Pervasive Trade Ticket – Place quicker trades at the price you want.
5. Favourites Ticker – A customisable scrolling display of your favourite instrument.
6. Product Navigator – See the instrument offering of GT247.com, the 10 most popular traded instruments and what’s new in the world of our offering.
7. Information – Messages from GT247.com, SENS, Trade Confirmations and Error Logging in an easy-to-access inbox.
8. Real-time portfolio valuations – Always know your profit and losses.
9. Reports – Easy-to-access reports are available directly from the platform.
10. Indicators – Bull Bear Indicator, Volatility Indicator and ratings for popular traded products.
Getting Started
11
EQ TradErUser Manual
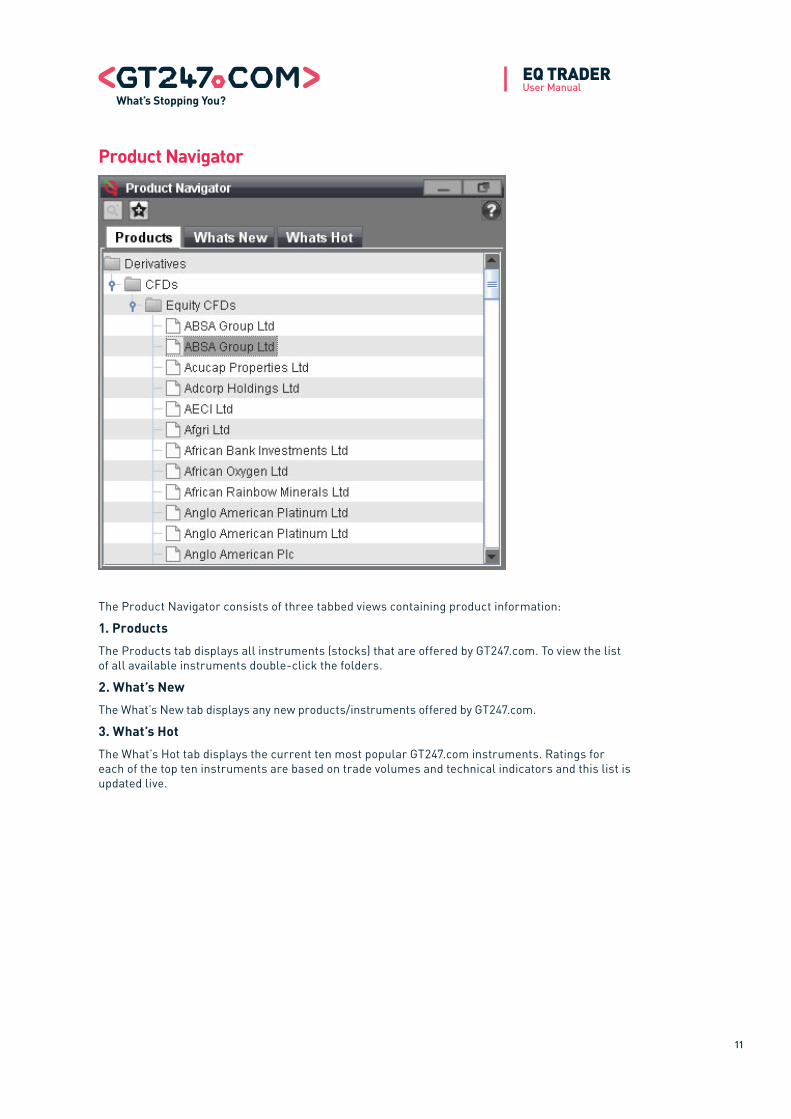
The Product Navigator consists of three tabbed views containing product information:
1. Products
The Products tab displays all instruments (stocks) that are offered by GT247.com. To view the list of all available instruments double-click the folders.
2. What’s New
The What’s New tab displays any new products/instruments offered by GT247.com.
3. What’s Hot
The What’s Hot tab displays the current ten most popular GT247.com instruments. Ratings for each of the top ten instruments are based on trade volumes and technical indicators and this list is updated live.
Product Navigator
12
EQ TradErUser Manual
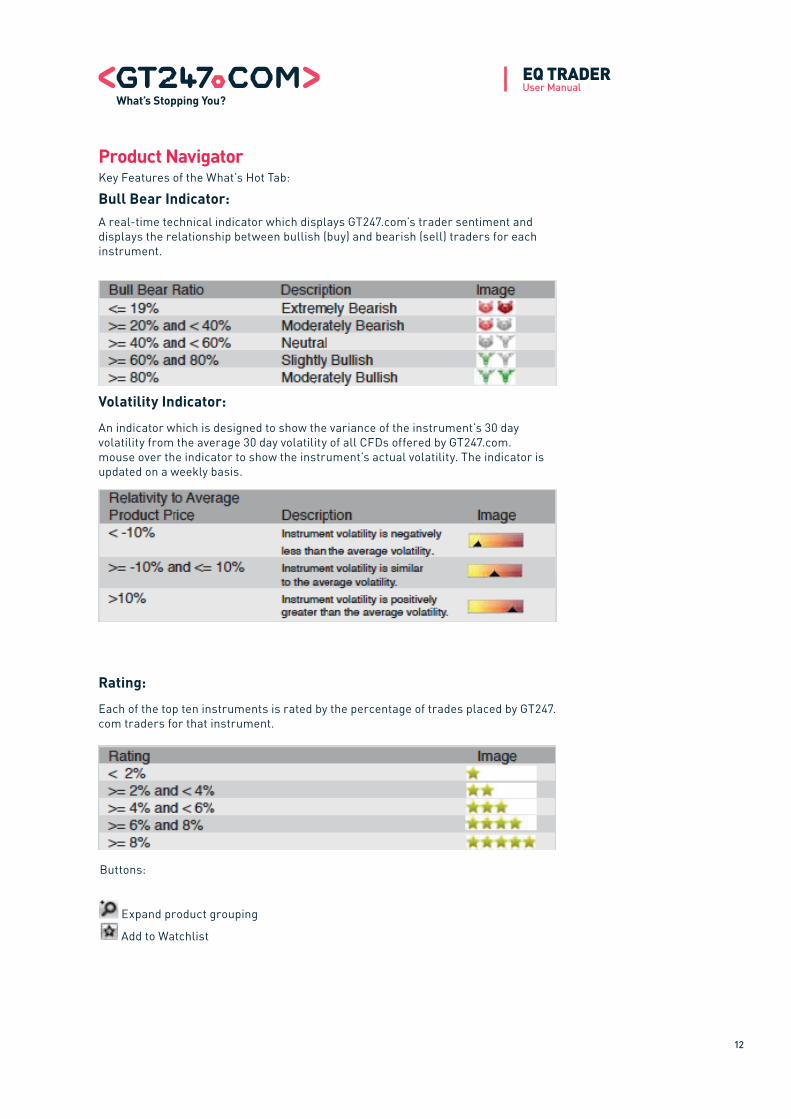
Key Features of the What’s Hot Tab:
Bull Bear Indicator: A real-time technical indicator which displays GT247.com’s trader sentiment and displays the relationship between bullish (buy) and bearish (sell) traders for each instrument.
Volatility Indicator:
An indicator which is designed to show the variance of the instrument’s 30 day volatility from the average 30 day volatility of all CFDs offered by GT247.com. mouse over the indicator to show the instrument’s actual volatility. The indicator is updated on a weekly basis.
Rating:
Each of the top ten instruments is rated by the percentage of trades placed by GT247.com traders for that instrument.
Buttons:
Expand product grouping
Add to Watchlist
Product Navigator

13
EQ TradErUser Manual
Watchlists
The Watchlists are where you store your favourite or frequently traded instruments; you have the option to create up to four Watchlists. Comprehensive real–time price & market data is provided for each instrument.
Note: All trades are initiated from the watchlists window.
Buttons:
Place Trade Place Order Remove Product
Key Features:
Bull Bear Indicator: A real-time technical indicator which displays GT247.com’s trader sentiment and displays the relationship between bullish (buy) and bearish (sell) traders for each instrument.
Volatility Indicator : An indicator which is designed to show the variance of the instrument’s 30 day volatility from the average 30 day volatility of all CFDs offered by GT247.com. Move the mouse over the indicator to show the instrument’s actual volatility. The indicator is updated on a weekly basis.
Volatility Indicator : An indicator which is designed to show the variance of the instrument’s 30 day volatility
from the average 30 day volatility of all CFDs offered by GT247.com. Mouse over the indicator to show the
instrument’s actual volatility. The indicator is updated on a weekly basis.
Market Status: Shows the current market state of the instrument.

14
EQ TradErUser Manual
WatchlistsCreating watchlists:
To add an instrument to a watchlist:
Select the instrument from the Product Navigator by any of the following means:
1. Double-click the instrument
Note: Ensure you have selected the correct watchlist before double-clicking.
2. Click the Add to watchlist button.
3. Drag & drop the instrument from the Product Navigator into the watchlist.
The instrument will now appear in the selected watchlist window.
Note: You will only be able to add an instrument to a single watchlist. It is not possible to add the same instrument to more than one watchlist.
Maintaining Watchlists:
To remove an instrument from a watchlist:
Select the instrument from the intended watchlist by any of the following means:
• Click the ‘Remove from watchlist’ button on the watchlists window.• Right-clicking the instrument and selecting the Remove from Watchlist option.
The instrument will now be removed from the selected watchlist window.
Sorting Data:Certain watchlist columns can be sorted. To sort data in a column, simply click the Sort indicator on the column heading.
15
EQ TradErUser Manual
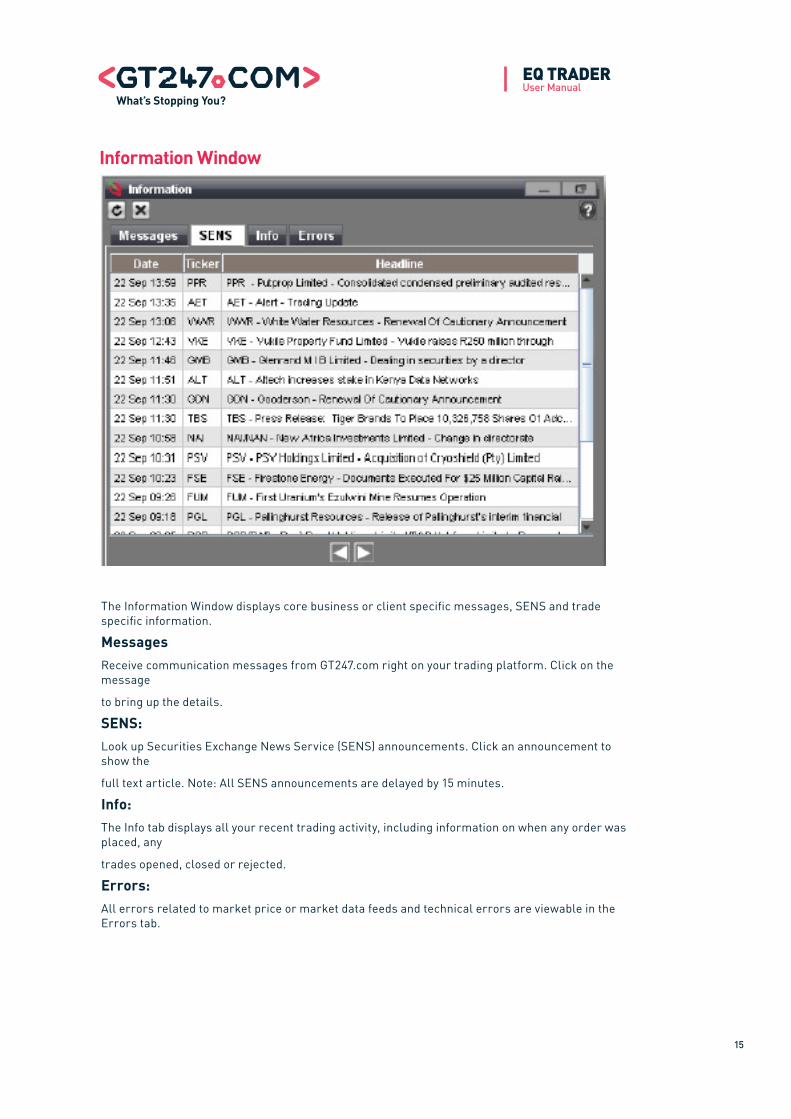
The Information Window displays core business or client specific messages, SENS and trade specific information.
MessagesReceive communication messages from GT247.com right on your trading platform. Click on the message
to bring up the details.
SENS:Look up Securities Exchange News Service (SENS) announcements. Click an announcement to show the
full text article. Note: All SENS announcements are delayed by 15 minutes.
Info:The Info tab displays all your recent trading activity, including information on when any order was placed, any
trades opened, closed or rejected.
Errors:All errors related to market price or market data feeds and technical errors are viewable in the Errors tab.
Information Window

16
EQ TradErUser Manual
The Favourites Ticker is a scrolling display of all the instruments stored in your watchlists.
Click on the Change View drop down to select your favourite display of your chosen instruments, namely:
• Images – Displays instrument images• High/Low – Combines instruments that are trading down/up at that given time.
Vary the scrolling of the ticker by using the up and down Speed arrows.
Favourites Ticker

17
EQ TradErUser Manual
You have two options for placing trades:
1. Pervasive trade window
1. Select the instrument you want to trade on from the watchlist to automatically populate the quick trade ticket.
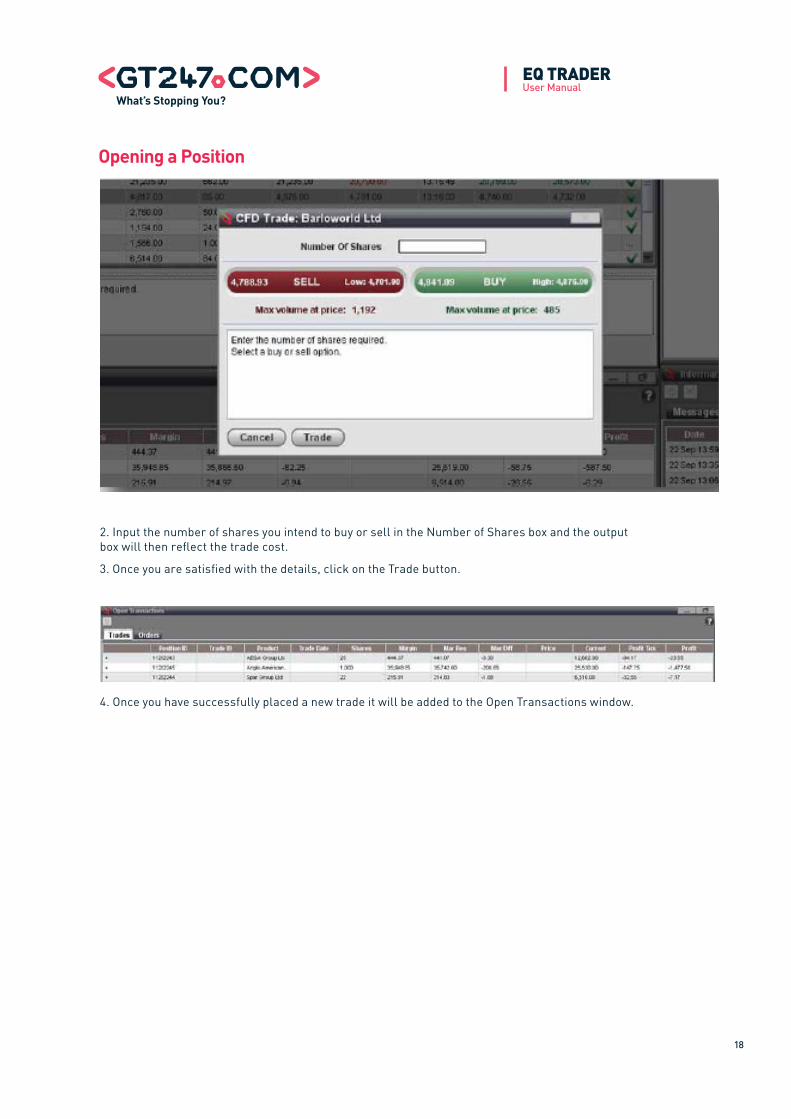
2. Input the number of shares you intend to buy or sell in the Number of Shares box and the output box will then reflect the trade cost.
3. Once you are satisfied with the details, click on the Trade button.
NOTE: You will not be presented with a trade confirmation window; any information relating to the success of a trade will be displayed in the Info tab of the Information Window. It is essential to understand the formalities and intricacies of placing a correctly structured trade in order to prevent avoidable losses to your trading account.
Use the up and down arrows located in the top left corner to hide and unhide the Pervasive Trade Ticket.
2. Select your chosen instrument and right-click
1. Select your chosen instrument from the watchlist window and right-click. Select the option Place a Trade now.
Opening a Position
18
EQ TradErUser Manual
2. Input the number of shares you intend to buy or sell in the Number of Shares box and the output box will then reflect the trade cost.
3. Once you are satisfied with the details, click on the Trade button.
4. Once you have successfully placed a new trade it will be added to the Open Transactions window.
Opening a Position
19
EQ TradErUser Manual
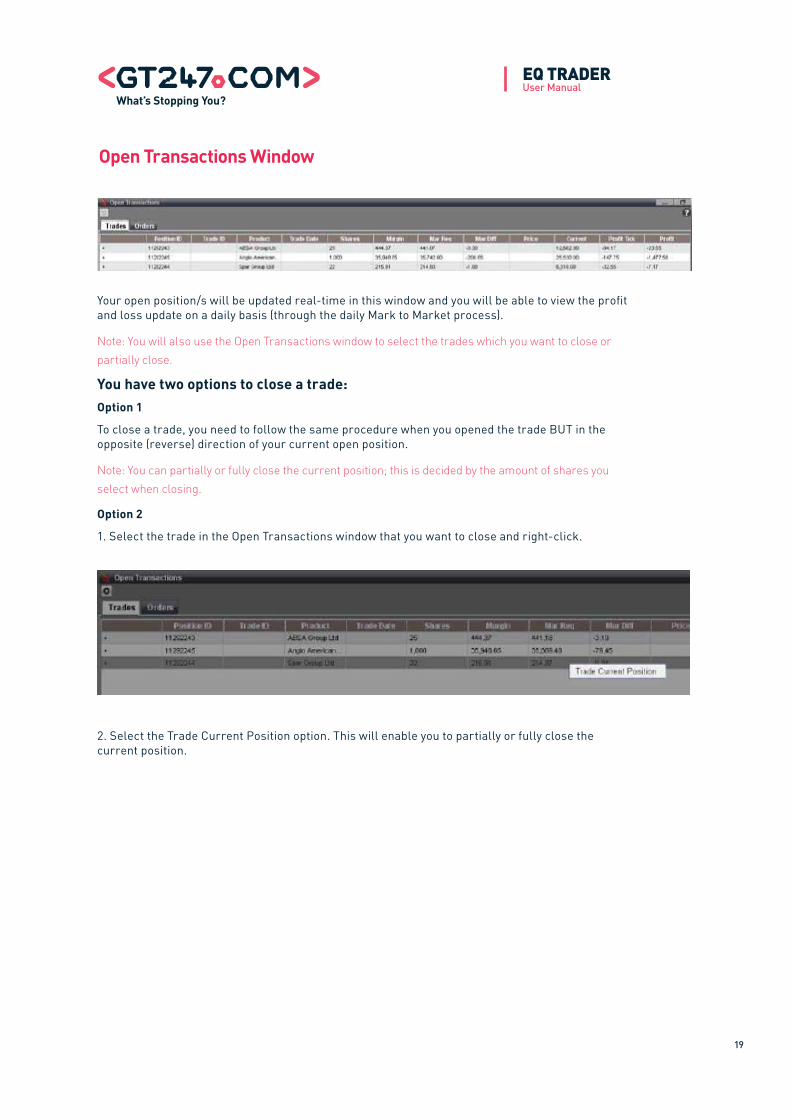
Your open position/s will be updated real-time in this window and you will be able to view the profit and loss update on a daily basis (through the daily Mark to Market process).
Note: You will also use the Open Transactions window to select the trades which you want to close or partially close.
You have two options to close a trade:Option 1
To close a trade, you need to follow the same procedure when you opened the trade BUT in the opposite (reverse) direction of your current open position.
Note: You can partially or fully close the current position; this is decided by the amount of shares you select when closing.
Option 2
1. Select the trade in the Open Transactions window that you want to close and right-click.
2. Select the Trade Current Position option. This will enable you to partially or fully close the current position.
Open Transactions Window

20
EQ TradErUser Manual
1. Highlight the instrument to be traded in your Watchlist window and right-click.
2. Select the option Place an Order.
3. The following Order screen will appear to take your order.
NOTE: It is essential to understand the formalities and intricacies of placing a correctly structured order so as to prevent avoidable losses to your trading account.
Placing an Order

21
EQ TradErUser Manual
1. Trailing Stop Orders
A sell trailing stop order sets the stop price at a fixed amount below the market price with an attached "trailing" amount. As the market price rises, the stop price rises by the trail amount, but if the stock price falls, the Stop Loss price doesn't change, and a market order is submitted when the stop price is hit. This technique is designed to allow an investor to specify a limit on the maximum possible loss, without setting a limit on the maximum possible gain. "Buy" trailing stop orders are the mirror image of sell trailing stop orders, and are most appropriate for use in falling markets.
For instruments with active trailing order functionalities, the trailing order flag and the trailing increment value will be displayed on the Open Order window. If you would like your Order Price to trail the Last Traded Price, you must select the Trailing Order box and specify the Trailing Value. The Order Price will then trail the last price with the specified incremental value.
1. The Order will execute using the current criteria for order conversion.
2. The Trailing Order value will be used to measure change in the order price, e.g. if the last price moves in a positive direction (i.e. increase for a sell break order, decrease for a buy break order) by 10 points, the order price will move in a positive direction by 10 points.
3. The Trailing Order will be specified in the Info window with three new fields:
• Trailing Order with a 'Yes' or 'No' value. • Trailing value with the incremental trailing value.• Last Trailing price showing the value of the last price, which triggered the order price to
trail.4. If the instrument’s flag for the trailing order is set to false while the system has current open trailing orders, the current open trailing orders will remain as they are - trailing the last price. However, the trailing value cannot be changed and the order will remain a trailing order. You will still be able to cancel the order.
2. Break OrderYou hold 500 Anglo American Plc shares, have entered the trade at 34100 and would like to limit the losses should the share price fall. You then decide to place a stop loss at 33500.
NOTE: This order can be partially closed by stating a smaller number of shares.
3. Normal Order
The current buyers' price for Anglo American Plc is 34100 and you would like to leave an order to buy at 33900. The example below details how you would complete the order ticket and place an order to buy.
NOTE: This is a standard example and there are various other ways to complete this order. Your completed order will appear in the Open Transactions window in the Orders tab.
Placing an Order

22
EQ TradErUser Manual
The state of your account balance and finances is always displayed across the top of the application.
Key Information:Nett Account Value: The Nett Asset value of your trading account (Free Cash + Retained Margin +
Profit/Loss on Open Positions).
Profit/ Loss on Current Positions: Profit and Loss on open positions.
Free Cash: The funds available minus the equity allocated to your open positions.
Retained Margin: Total amount of equity currently allocated as Margin.
Variation Margin: The difference between your held margin (as of Mark to Market for the previous day) and your retained margin.
Currency: The current currency you are trading in.
Account Balance

23
EQ TradErUser Manual
All trading currencies assigned to your account will be listed in this drop down box.
Note: Please ensure you select the correct trading currency you want to trade on.
Trading Currency

24
EQ TradErUser Manual
Login
You will be required to enter your Username and Password in order to access your trading platform.
LogoutFor security concerns when leaving your computer, you can logout and log back in on your return, instead of exiting the platform and then having to reload it.
Login and Logout

25
EQ TradErUser Manual
This menu allows you to organise the windows to your preference.
Save Settings
To save your desired outlay, click on the Save Settings option.
Reset Settings
The Reset Settings will change your outlay back to the default setting.
Back to Saved Settings
Click on Back to Saved Settings to undo any new settings that are undesired.
Cascade
This option enables you to arrange the windows one behind the other.
Desktop

26
EQ TradErUser Manual
This menu gives you access to your Trade History Report and the Mark to Market Report. These reports act as your statements and you will be able to view your records as far back as you require.
Mark to Market ReportMark to Market is run at the end of each trading day. Each counterparty exchanges the change in the market value of their positions in cash. Mark to Market is a process wherein positions held overnight (O/N) realise Profits and Losses (P&L) from that particular trading day. Long funding is debited from your trading account and short funding is paid to your trading account.
Trade History ReportUpon opening the Trade History Report, you will need to select a start date and end date before transactions can be retrieved.
NOTE: To change the dates, click on the From or To field and a calendar window will pop up. You can navigate by using the relevant arrows to select both dates then click on Search to retrieve your statement.
This report is straightforward and starts by naming each entry according to the transaction number, making it easy to refer to a specific trade in the event that you have a query or need to contact us. It lists all transactions performed during the specified period and details all the transaction settings you selected when placing the trades.
NOTE: To get more detailed information about a specific trade, simply double-click on the entry of interest and a transaction view window will pop up displaying more details.
Report

27
EQ TradErUser Manual
Price Updates
The time of the last price update is easily obtained by moving the mouse over the Reuters symbol on the status bar of the application. The shading of the Reuters symbol is an indicator of when last the price update was received.
Connection Speeds
Monitor your connection speed by using the Connection Speed indicator in the right hand corner of the application’s status bar. For optimal trading capability ensure your connection speed remains between 0.000 and 1.000 seconds.
Status Bar
28
EQ TradErUser Manual
Simple Example: Buying Anglo AmericanTrade at the market price on the platform with your commission built into the price. You pay a margin on the trade which is a percentage of the notional value of the trade.
Opening the positionOn the morning of 6 August 2009 you decide that Anglo American looks like a good buy and you decide to open a position. The current spread on the GT platform is 26966.49/27257.61. This price includes the commission on the trade in this example of 50bps. You decide to buy 1000 shares at the offer price of 27257.61.
As CFDs are leveraged products you are not required to put up the full notional value of the trade but only a portion, in this case 14%. The initial margin on the position which is taken from your trust account is going to be R38,160.66 (1000 shares x R272.5761share x 14%).
Closing the positionIt is near the end of the day and Anglo American has risen sharply to where the bid and offer are now at 28407.25/28722.90. You decide you want to take profit on the position and close out the trade at the bid price of 28407.25.
The profit on your trade is calculated as follows:
Profit on tradeClosing level: R284.0725
Opening level: R272.5761
Difference: R11.4964
Profit on trade: R11.4964 x 1,000 = R11,496.40
As the commission is already built into the price you trade at there are no more costs involved on intra-day trades.
Of course, had the market moved in the opposite direction, you would have made a loss that may have exceeded your initial deposit.
Trading Examples

29
EQ TradErUser Manual
Advanced Example: Buying Anglo AmericanOpening the position
On 6 August 2009 you decide that Anglo American is looking discounted and that you want to take a position to buy (go long) a position on Anglo American. The current spread on the GT platform is 26966.49/27257.61. This price includes the commission on the trade in this example of 50bps. You decide to buy 1000 shares at the offer price of 27257.61
As CFDs are leveraged products you are not required to put up the full notional value of the trade but only a portion, in this case 14%. The initial margin on the position, which is taken from your trust account, is going to be R38,160.66 (1000 shares x R272.5761share x 14%). The market price rises throughout the day, and you believe it will continue tomorrow. You decide to hold your position overnight.
Interest adjustmentsInterest adjustments are calculated daily by applying the applicable interest rate to the daily closing value of the position. The annual interest adjustment for a Rand denominated share such as Anglo American is found by adding the latest overnight SAFEY rate (South African Rand Overnight Deposit Rate) to the financing fee.
On 6 August 2009, SAFEY is at 7.1700%, so the annual applicable interest rate on your Anglo American position, assuming a financing fee of 2.5%, would be 9.67%:
SAFEY: 7.17%
Fee: + 2.5%
Total: 9.67%
The closing price on 6 August 2009 is R270.50, which gives you a closing value of R270.500. The annual interest on R270,500 would be R26,157.35, which creates a daily interest debit of R71.66 (R270,500 x9.67% / 365).
Closing Price: R270,500
Total Interest Adjustment: x 9.67%
Annual Interest: /365
Daily Interest: R71.66
Dividend adjustmentsWhen you hold a long position and the share goes ex-dividend, you are eligible to receive the dividend on pay date. The pay date is generally 2 weeks after ex-date but this does vary from company to company. If there was a dividend to be paid on Anglo American where the share goes ex on the 6 August and you are holding the shares overnight, then you are due the dividend on pay date. If the dividend was R10, the amount of the net dividend due would be R10,000 (1,000 shares x R10 = R10,000).
Current contract size: 1,000 shares
Dividend Adjustment: X R10
Net Dividend Due: R10,000
Trading Examples
30
EQ TradErUser Manual
Mark to Market Process
On a daily basis profit and loss is realised on your account through Mark to Market. On the close of business on 6 August, Anglo American closes at R270.50. The Mark to Market takes into account the loss made on the position for the day along with the interest on the position for carrying it overnight.
M2M lossClosing Level: R270.50
Opening Level: R272.5761
Difference: R2.0761
Loss on Trade: R2,076.10
Interest Adjustment:R71.66
Overall Loss: - R2,147.76
Closing the positionThe following day, Anglo American rises to 28407.25/28722.90 and you decide to take profit on the trade at the bid price of 28407.25. As the previous day’s losses have already been reflected in your trust account, the trade is then mark to market at the close of business, reflecting the profit for the day: 124.55/124.65. You decide to close your position and reduce your losses before the market falls any further.
Your profit for the trade on the day is calculated as follows:
Profit on trade
Closing level: R284.0725
Opening level: R270.50
Difference: R13.5725
Loss on trade: R13.5725 x 1,000 = R13,572.50
Note: As the position has not been held overnight for the second day, there is no funding adjustment needed.
Calculating the overall resultThe overall loss on the trade is the total costs, profits and losses on the account, based on the mark to market process.
Trading Examples
31
EQ TradErUser Manual
Advanced Example: Shorting Anglo AmericanOpening the position
It is 6 August 2009 and you decide that Anglo American is looking expensive and that you want to take a position to sell. The current spread on the GT platform is 26966.49/27257.61. This price includes the commission on the trade in this example of 50bps. You decide to sell 1000 shares at the bid price of 26966.49.
As CFDs are leveraged products you are not required to put up the full notional value of the trade but only a portion, in this case 14%. The initial margin on the position which is taken from your trust account is going to be R37,753.09 (1000 shares x R269.6649share x 14%). The market price falls throughout the day, and you believe it will continue tomorrow. You decide to hold your position overnight.
Interest adjustmentsInterest adjustments are calculated daily, by applying the applicable interest rate to the daily closing value of the position. The annual interest adjustment for a Rand denominated share such as Anglo American is found by adding the latest overnight SAFEY rate (South African Rand Overnight Deposit Rate) to the financing fee.
On 6 August 2009, SAFEY is at 7.1700%, so the annual applicable interest rate on your Anglo American position, assuming a financing fee of -2.5%, would be 4.67%:
SAFEY: 7.17%
Fee: - 2.5%
Total: 4.67%
The closing price on 6 August 2009 is R265.50, which gives you a closing value of R265,500. The annual interest on R265,500 would be R12,398.85, which creates a daily interest credit of R33.97 (265,500 x 4.67% / 365).
Closing Price: R265,500
Total Interest Adjustment: x 4.67%
Annual Interest: /365
Daily Interest: R33.97
Dividend adjustmentsWhen you hold a short position and the share goes ex-dividend, you are obliged to pay the dividend on pay date. The pay date is generally 2 weeks after ex-date but this does vary from company to company. If there was a dividend to be paid on Anglo American where the share goes ex on 6 August and you are holding the shares overnight, then you must pay the dividend on pay date. If the dividend was R10 the amount of the net dividend to be paid would be R10,000 (1,000 shares x R10 = R10,000).
Current contract size: 1,000 shares
Dividend Adjustment: X R10 Net Dividend Due: R10,000
Trading Examples

32
EQ TradErUser Manual
Mark to Market ProcessOn a daily basis profit and loss is realised on your account through mark to market. On the close of business on 6 August, Anglo American closes at R265.5. The mark to market takes into account the profit made on the position for the day along with the interest on the position for carrying it overnight.
M2M lossClosing Level: R265.5
Opening Level: R269.6649
Difference: R4.1649
Profit on Trade: R4,164.90
Interest Credit: R33.97
Overall Profit: R4,198.87
Closing the positionThe following day Anglo American rises to 27407.25/27722.90 and you decide that it looks as if it wants to continue to rise and so realise a loss. You trade at the offer price of 27722.90. As the previous days profits have already been reflected in your trust account the trade is then mark to market at the close of business, reflecting the profit for the day.
Your loss for the trade on the day is calculated as follows:
Profit on tradeClosing Level: R277.2290
Opening Level: R265.50
Difference: R11.7290
Loss on Trade: R11.729 x 1,000 = - R11,729
Note: As the position has not been held overnight for the second day there is no funding adjustment needed.
Calculating the overall result
The overall loss on the trade is the total costs, profits and losses on the account based on the mark to market process.
Trading Examples


![[DevFest SBA2016] Road to Microservices with Google Cloud Plateform](https://static.fdocuments.in/doc/165x107/589a2a791a28ab051f8b53fd/devfest-sba2016-road-to-microservices-with-google-cloud-plateform.jpg)