14_GCL Poly Energy - Weakening Long-term Outlook
14
Rating Remains Reduce Target price Remains HKD 1.60 Closing price 26 March 2014 HKD 2.63 Potential downside -39.2% Anchor themes While GCL turns profitable on cost reductions, valuations are running ahead of fundamentals. Nomura vs consensus Our 2015F net profit of HKD2,343mn is 24.5% below consensus. Research analysts Asia Solar Nitin Kumar - NSL [email protected] +65 6433 6967 Key company data: See page 2 for company data and detailed price/index chart GCL Poly Energy 3800.HK 3800 HK EQUITY: SOLAR Weakening long-term outlook Weaker ASP environment, rising competition and recovery in alternative technologies Action: Reiterate Reduce on declining ASPs and rising competition While we think GCL is likely to see meaningful improvement in 2014F earnings vs. 2013 on the back higher utilisation and lower costs, we reiterate our Reduce rating, given: 1) polysilicon ASPs are expected to fall more than 10~15% from current levels over the next few months on weaker-than- expected demand in 1H14F; 2) new supply additions in 2H14-15F to likely constrain ASP upside, and; 3) accelerating polysilicon capacity additions, diamond wire adoption and renewed threats from thin-film and CSP technologies worsening the long-term outlook. With GCL currently trading at 2014F P/BV of 2.3x (BVPS: HKD1.14), P/E of 22.8x (EPS: HKD0.116), we believe current valuations price in ASPs sustained above USD22~23/Kg which we view as peak pricing and probable cost reductions. Catalysts: Continued ASP declines in the near-term Key negative catalysts come from: 1) likely sustained polysilicon ASP declines on the back of weak 1H14F demand; 2) potential US-China trade resolution which could enable the restart of poly exports from the US to China, and; 3) possible delays in the ramp-up of FBR capacity given its complexity. There will likely be positive newsflow from management on the start of its power plant to lower electricity costs in April and 1Q14F ASPs in May; albeit we note these are well-known and already priced in. Valuations: Positives well-known and priced in; Reaffirm Reduce We largely maintain our 2014F net profit outlook, but cut our 2015F earnings by 3% on the back of our lower ASP expectations partially offset by further cost reductions at GCL. GCL currently trades at 2014F P/E of 22.8x, P/BV of 2.3x with ROE at 10.6% and net/debt-to-equity at 227%. We maintain our TP of HKD1.6 based on FY14F P/BV of 1.5x (unchanged). We believe our P/BV target of 1.5x is apt for a company with 10.6-12.5% ROE despite its low cost advantage. Maintain Reduce. 31 Dec FY12 FY13 FY14F FY15F Currency (HKD) Actual Actual Old New Old New Revenue (mn) 22,348 25,120 25,530 28,297 32,375 31,815 36,800 Reported net profit (mn) -3,516 -1,037 -664 1,794 1,789 2,416 2,343 Normalised net profit (mn) -3,516 -1,037 -664 1,794 1,789 2,416 2,343 FD normalised EPS -22.71c -6.70c -4.29c 11.59c 11.56c 15.60c 15.14c FD norm. EPS growth (%) -182.3 na na na na 34.6 31.0 FD normalised P/E (x) na N/A na N/A 22.8 N/A 17.4 EV/EBITDA (x) 71.3 N/A 24.3 N/A 12.6 N/A 11.5 Price/book (x) 2.5 N/A 2.5 N/A 2.3 N/A 2.1 Dividend yield (%) na N/A na N/A na N/A na ROE (%) -19.1 -6.6 -4.1 11.3 10.6 13.6 12.5 Net debt/equity (%) 191.8 213.7 201.6 190.7 227.0 166.5 210.8 Source: Company data, Nomura estimates Global Markets Research 27 March 2014 See Appendix A-1 for analyst certification, important disclosures and the status of non-US analysts.
-
Upload
girish-raj-sankunny -
Category
Documents
-
view
108 -
download
0
description
Weakening long-term outlook
Transcript of 14_GCL Poly Energy - Weakening Long-term Outlook
Rating Remains ReduceTarget price Remains HKD 1.60
Closing price 26 March 2014 HKD 2.63
Potential downside -39.2%
Anchor themesWhile GCL turns profitable on cost reductions, valuations are running ahead of fundamentals.
Nomura vs consensusOur 2015F net profit of HKD2,343mn is 24.5% below consensus.
Research analysts
Asia Solar
Nitin Kumar - NSL [email protected] +65 6433 6967
Key company data: See page 2 for company data and detailed price/index chart
GCL Poly Energy 3800.HK 3800 HK
EQUITY: SOLAR
Weakening long-term outlook
Weaker ASP environment, rising competition and recovery in alternative technologies Action: Reiterate Reduce on declining ASPs and rising competition While we think GCL is likely to see meaningful improvement in 2014F earnings vs. 2013 on the back higher utilisation and lower costs, we reiterate our Reduce rating, given: 1) polysilicon ASPs are expected to fall more than 10~15% from current levels over the next few months on weaker-than-expected demand in 1H14F; 2) new supply additions in 2H14-15F to likely constrain ASP upside, and; 3) accelerating polysilicon capacity additions, diamond wire adoption and renewed threats from thin-film and CSP technologies worsening the long-term outlook. With GCL currently trading at 2014F P/BV of 2.3x (BVPS: HKD1.14), P/E of 22.8x (EPS: HKD0.116), we believe current valuations price in ASPs sustained above USD22~23/Kg which we view as peak pricing and probable cost reductions.
Catalysts: Continued ASP declines in the near-term Key negative catalysts come from: 1) likely sustained polysilicon ASP declines on the back of weak 1H14F demand; 2) potential US-China trade resolution which could enable the restart of poly exports from the US to China, and; 3) possible delays in the ramp-up of FBR capacity given its complexity. There will likely be positive newsflow from management on the start of its power plant to lower electricity costs in April and 1Q14F ASPs in May; albeit we note these are well-known and already priced in.
Valuations: Positives well-known and priced in; Reaffirm Reduce We largely maintain our 2014F net profit outlook, but cut our 2015F earnings by 3% on the back of our lower ASP expectations partially offset by further cost reductions at GCL. GCL currently trades at 2014F P/E of 22.8x, P/BV of 2.3x with ROE at 10.6% and net/debt-to-equity at 227%. We maintain our TP of HKD1.6 based on FY14F P/BV of 1.5x (unchanged). We believe our P/BV target of 1.5x is apt for a company with 10.6-12.5% ROE despite its low cost advantage. Maintain Reduce.
31 Dec FY12 FY13 FY14F FY15F
Currency (HKD) Actual Actual Old New Old New
Revenue (mn) 22,348 25,120 25,530 28,297 32,375 31,815 36,800
Reported net profit (mn) -3,516 -1,037 -664 1,794 1,789 2,416 2,343
Normalised net profit (mn) -3,516 -1,037 -664 1,794 1,789 2,416 2,343
FD normalised EPS -22.71c -6.70c -4.29c 11.59c 11.56c 15.60c 15.14c
FD norm. EPS growth (%) -182.3 na na na na 34.6 31.0
FD normalised P/E (x) na N/A na N/A 22.8 N/A 17.4
EV/EBITDA (x) 71.3 N/A 24.3 N/A 12.6 N/A 11.5
Price/book (x) 2.5 N/A 2.5 N/A 2.3 N/A 2.1
Dividend yield (%) na N/A na N/A na N/A na
ROE (%) -19.1 -6.6 -4.1 11.3 10.6 13.6 12.5
Net debt/equity (%) 191.8 213.7 201.6 190.7 227.0 166.5 210.8
Source: Company data, Nomura estimates
Global Markets Research 27 March 2014
See Appendix A-1 for analyst certification, important disclosures and the status of non-US analysts.

Nomura | GCL Poly Energy 27 March 2014
2
Key data on GCL Poly Energy Income statement (HKDmn) Year-end 31 Dec FY11 FY12 FY13 FY14F FY15F
Revenue 25,506 22,348 25,530 32,375 36,800Cost of goods sold -17,039 -20,599 -22,490 -25,721 -29,212
Gross profit 8,466 1,749 3,040 6,654 7,588SG&A -2,077 -3,481 -2,285 -2,493 -2,833
Employee share expense 0 0 0 0 0
Operating profit 6,389 -1,732 754 4,162 4,755
EBITDA 8,285 1,026 3,082 6,584 7,409
Depreciation -1,856 -2,745 -2,306 -2,342 -2,606Amortisation -40 -14 -22 -80 -48
EBIT 6,389 -1,732 754 4,162 4,755Net interest expense -1,166 -2,309 -2,416 -2,753 -2,988
Associates & JCEs 15 3 16 0 0
Other income 601 777 1,390 1,163 1,562Earnings before tax 5,839 -3,261 -256 2,572 3,328
Income tax -1,269 -124 -190 -514 -666
Net profit after tax 4,570 -3,385 -446 2,057 2,663Minority interests -295 -130 -218 -268 -320
Other items 0 0 0 0 0Preferred dividends 0 0 0 0 0
Normalised NPAT 4,275 -3,516 -664 1,789 2,343
Extraordinary items 0 0 0 0 0Reported NPAT 4,275 -3,516 -664 1,789 2,343
Dividends -851 0 0 0 0
Transfer to reserves 3,424 -3,516 -664 1,789 2,343
Valuation and ratio analysis
Reported P/E (x) 9.5 na na 22.8 17.4
Normalised P/E (x) 9.5 -11.6 -61.3 22.8 17.4
FD normalised P/E (x) 9.5 na na 22.8 17.4FD normalised P/E at price target (x) 5.4 na na 13.0 9.9
Dividend yield (%) 2.1 na na na na
Price/cashflow (x) 15.0 17.5 5.1 18.7 5.9Price/book (x) 2.0 2.5 2.5 2.3 2.1
EV/EBITDA (x) 8.0 71.3 24.3 12.6 11.5EV/EBIT (x) 10.4 na 97.5 20.0 17.9
Gross margin (%) 33.2 7.8 11.9 20.6 20.6
EBITDA margin (%) 32.5 4.6 12.1 20.3 20.1EBIT margin (%) 25.0 -7.8 3.0 12.9 12.9
Net margin (%) 16.8 -15.7 -2.6 5.5 6.4
Effective tax rate (%) 21.7 na na 20.0 20.0Dividend payout (%) 19.9 na na 0.0 0.0
Capex to sales (%) 58.1 16.6 15.8 17.5 14.4Capex to depreciation (x) 8.0 1.3 1.8 2.4 2.0
ROE (%) 23.3 -19.1 -4.1 10.6 12.5
ROA (pretax %) 13.6 -2.8 1.2 5.6 5.9
Growth (%)
Revenue 38.1 -12.4 14.2 26.8 13.7EBITDA 19.9 -87.6 200.3 113.6 12.5
EBIT 14.5 -127.1 na 451.8 14.3Normalised EPS 6.2 -182.2 na na 31.0
Normalised FDEPS 6.2 -182.3 na na 31.0
Per share
Reported EPS (HKD) 27.62c -22.71c -4.29c 11.56c 15.14c
Norm EPS (HKD) 27.62c -22.71c -4.29c 11.56c 15.14cFully diluted norm EPS (HKD) 27.58c -22.71c -4.29c 11.56c 15.14c
Book value per share (HKD) 1.33 1.05 1.04 1.14 1.28DPS (HKD) 0.06 0.00 0.00 0.00 0.00
Source: Company data, Nomura estimates
Relative performance chart (one year)
Source: ThomsonReuters, Nomura research
(%) 1M 3M 12M
Absolute (HKD) -3.3 12.9 64.4
Absolute (USD) -3.3 12.8 64.4
Relative to MSCI China -0.3 20.9 68.7
Market cap (USDmn) 5,249.3
Estimated free float (%) 47.5
52-week range (HKD) 3.17/1.37
3-mth avg daily turnover (USDmn)
55.97
Major shareholders (%)
Asia Pacific Energy Fund 32.4
FMR 5.3
Source: Thomson Reuters, Nomura research
Notes

Nomura | GCL Poly Energy 27 March 2014
3
Cashflow (HKDmn) Year-end 31 Dec FY11 FY12 FY13 FY14F FY15FEBITDA 8,285 1,026 3,082 6,584 7,409
Change in working capital -5,115 -1,676 1,419 -4,343 -638
Other operating cashflow -454 2,976 3,517 -59 94Cashflow from operations 2,716 2,326 8,018 2,182 6,866
Capital expenditure -14,819 -3,700 -4,035 -5,665 -5,316Free cashflow -12,102 -1,374 3,983 -3,483 1,550
Reduction in investments 0 0 0 0 0
Net acquisitions 152 423 146 -1,151 256Reduction in other LT assets -123 -104 1,065 0 0
Addition in other LT liabilities 0 0 0 0 0
Adjustments -3,408 -1,930 -3,947 1 1Cashflow after investing acts -15,482 -2,984 1,247 -4,634 1,807
Cash dividends 0 0 0 0 0Equity issue 0 0 1 0 0
Debt issue 23,248 20,773 -1,117 4,217 -3,308
Convertible debt issue 0 0 1,542 0 0Others -7,389 -20,176 0 0 0
Cashflow from financial acts 15,859 597 426 4,217 -3,308
Net cashflow 378 -2,387 1,673 -416 -1,500Beginning cash 6,505 6,883 4,496 6,169 5,753
Ending cash 6,883 4,496 6,169 5,753 4,252Ending net debt 24,235 31,086 32,552 40,207 41,707
Source: Company data, Nomura estimates
Balance sheet (HKDmn) As at 31 Dec FY11 FY12 FY13 FY14F FY15F
Cash & equivalents 6,883 4,496 6,169 5,753 4,252
Marketable securities 0 0 0 0 0Accounts receivable 7,065 8,681 11,057 14,022 15,939
Inventories 2,473 2,248 1,657 1,895 2,152Other current assets 5,595 6,744 9,174 9,174 9,174
Total current assets 22,015 22,169 28,057 30,844 31,517
LT investments 388 451 828 2,268 2,268Fixed assets 41,181 42,233 43,995 47,285 49,994
Goodwill 995 676 652 652 652
Other intangible assets 66 223 201 120 72Other LT assets 2,842 2,067 2,909 2,909 2,909
Total assets 67,488 67,818 76,643 84,078 87,413Short-term debt 11,582 19,705 25,677 30,916 30,916
Accounts payable 8,207 9,128 13,737 13,075 14,849
Other current liabilities 1,663 1,607 2,631 2,153 1,914Total current liabilities 21,452 30,439 42,045 46,143 47,679
Long-term debt 19,535 15,876 11,502 13,502 13,502
Convertible debt 0 0 1,542 1,542 1,542Other LT liabilities 4,367 3,733 3,549 3,049 2,455
Total liabilities 45,354 50,048 58,638 64,236 65,178Minority interest 1,567 1,560 1,859 2,127 2,447
Preferred stock 0 0 0 0 0
Common stock 1,547 1,548 1,548 1,548 1,548Retained earnings 19,020 14,662 14,598 16,167 18,240
Proposed dividends 0 0 0 0 0
Other equity and reserves 0 0 0 0 0Total shareholders' equity 20,567 16,210 16,146 17,715 19,788
Total equity & liabilities 67,488 67,818 76,643 84,078 87,413
Liquidity (x)
Current ratio 1.03 0.73 0.67 0.67 0.66Interest cover 5.5 -0.8 0.3 1.5 1.6
Leverage
Net debt/EBITDA (x) 2.92 30.29 10.56 6.11 5.63
Net debt/equity (%) 117.8 191.8 201.6 227.0 210.8
Activity (days)
Days receivable 67.5 128.9 141.1 141.4 148.6Days inventory 44.1 41.9 31.7 25.2 25.3
Days payable 132.8 154.0 185.5 190.2 174.5
Cash cycle -21.2 16.9 -12.8 -23.7 -0.6Source: Company data, Nomura estimates
Notes
Notes
Nomura | GCL Poly Energy 27 March 2014
4
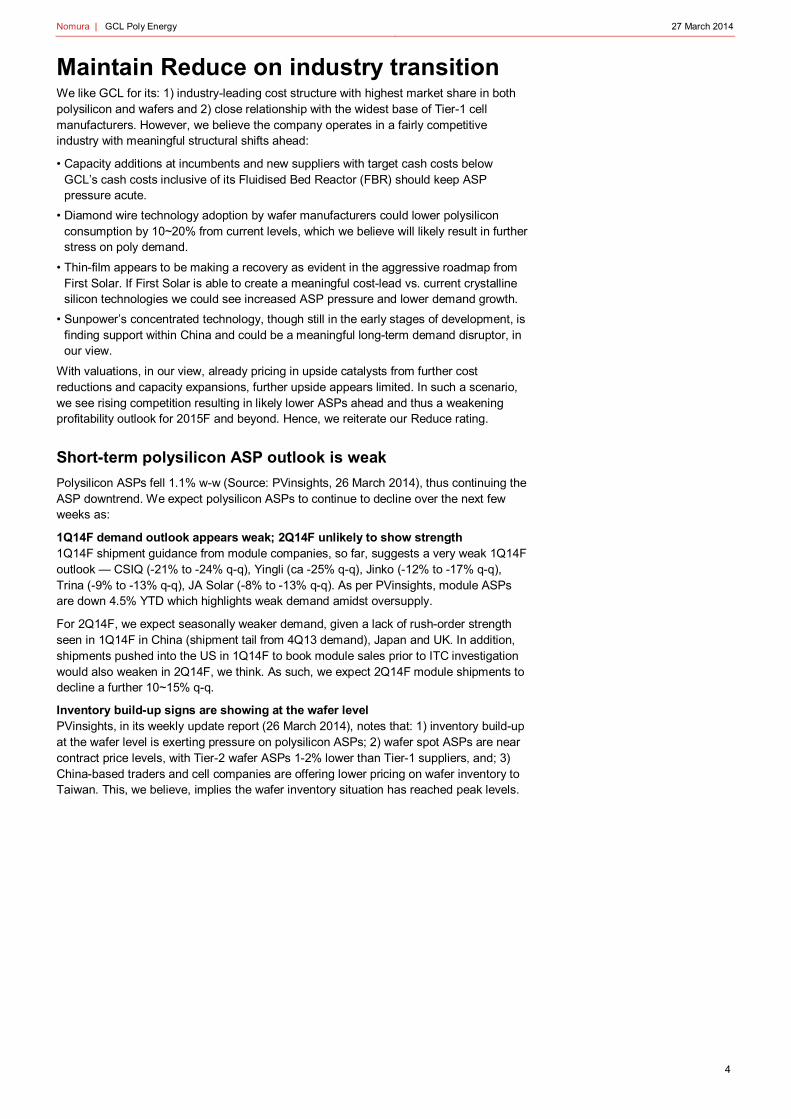
Maintain Reduce on industry transition We like GCL for its: 1) industry-leading cost structure with highest market share in both polysilicon and wafers and 2) close relationship with the widest base of Tier-1 cell manufacturers. However, we believe the company operates in a fairly competitive industry with meaningful structural shifts ahead:
• Capacity additions at incumbents and new suppliers with target cash costs below GCL’s cash costs inclusive of its Fluidised Bed Reactor (FBR) should keep ASP pressure acute.
• Diamond wire technology adoption by wafer manufacturers could lower polysilicon consumption by 10~20% from current levels, which we believe will likely result in further stress on poly demand.
• Thin-film appears to be making a recovery as evident in the aggressive roadmap from First Solar. If First Solar is able to create a meaningful cost-lead vs. current crystalline silicon technologies we could see increased ASP pressure and lower demand growth.
• Sunpower’s concentrated technology, though still in the early stages of development, is finding support within China and could be a meaningful long-term demand disruptor, in our view.
With valuations, in our view, already pricing in upside catalysts from further cost reductions and capacity expansions, further upside appears limited. In such a scenario, we see rising competition resulting in likely lower ASPs ahead and thus a weakening profitability outlook for 2015F and beyond. Hence, we reiterate our Reduce rating.
Short-term polysilicon ASP outlook is weak
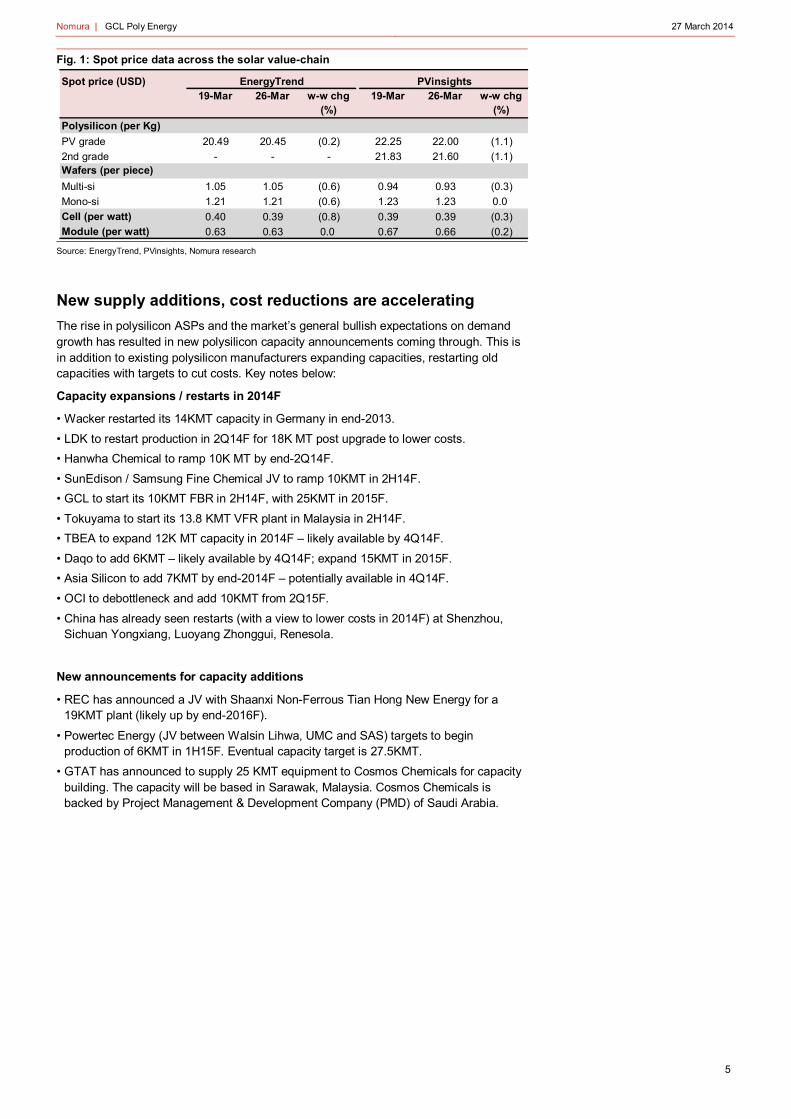
Polysilicon ASPs fell 1.1% w-w (Source: PVinsights, 26 March 2014), thus continuing the ASP downtrend. We expect polysilicon ASPs to continue to decline over the next few weeks as:
1Q14F demand outlook appears weak; 2Q14F unlikely to show strength 1Q14F shipment guidance from module companies, so far, suggests a very weak 1Q14F outlook — CSIQ (-21% to -24% q-q), Yingli (ca -25% q-q), Jinko (-12% to -17% q-q), Trina (-9% to -13% q-q), JA Solar (-8% to -13% q-q). As per PVinsights, module ASPs are down 4.5% YTD which highlights weak demand amidst oversupply.
For 2Q14F, we expect seasonally weaker demand, given a lack of rush-order strength seen in 1Q14F in China (shipment tail from 4Q13 demand), Japan and UK. In addition, shipments pushed into the US in 1Q14F to book module sales prior to ITC investigation would also weaken in 2Q14F, we think. As such, we expect 2Q14F module shipments to decline a further 10~15% q-q.
Inventory build-up signs are showing at the wafer level PVinsights, in its weekly update report (26 March 2014), notes that: 1) inventory build-up at the wafer level is exerting pressure on polysilicon ASPs; 2) wafer spot ASPs are near contract price levels, with Tier-2 wafer ASPs 1-2% lower than Tier-1 suppliers, and; 3) China-based traders and cell companies are offering lower pricing on wafer inventory to Taiwan. This, we believe, implies the wafer inventory situation has reached peak levels.
Nomura | GCL Poly Energy 27 March 2014
5
Fig. 1: Spot price data across the solar value-chain
Source: EnergyTrend, PVinsights, Nomura research
New supply additions, cost reductions are accelerating
The rise in polysilicon ASPs and the market’s general bullish expectations on demand growth has resulted in new polysilicon capacity announcements coming through. This is in addition to existing polysilicon manufacturers expanding capacities, restarting old capacities with targets to cut costs. Key notes below:
Capacity expansions / restarts in 2014F
• Wacker restarted its 14KMT capacity in Germany in end-2013.
• LDK to restart production in 2Q14F for 18K MT post upgrade to lower costs.
• Hanwha Chemical to ramp 10K MT by end-2Q14F.
• SunEdison / Samsung Fine Chemical JV to ramp 10KMT in 2H14F.
• GCL to start its 10KMT FBR in 2H14F, with 25KMT in 2015F.
• Tokuyama to start its 13.8 KMT VFR plant in Malaysia in 2H14F.
• TBEA to expand 12K MT capacity in 2014F – likely available by 4Q14F.
• Daqo to add 6KMT – likely available by 4Q14F; expand 15KMT in 2015F.
• Asia Silicon to add 7KMT by end-2014F – potentially available in 4Q14F.
• OCI to debottleneck and add 10KMT from 2Q15F.
• China has already seen restarts (with a view to lower costs in 2014F) at Shenzhou, Sichuan Yongxiang, Luoyang Zhonggui, Renesola.
New announcements for capacity additions
• REC has announced a JV with Shaanxi Non-Ferrous Tian Hong New Energy for a 19KMT plant (likely up by end-2016F).
• Powertec Energy (JV between Walsin Lihwa, UMC and SAS) targets to begin production of 6KMT in 1H15F. Eventual capacity target is 27.5KMT.
• GTAT has announced to supply 25 KMT equipment to Cosmos Chemicals for capacity building. The capacity will be based in Sarawak, Malaysia. Cosmos Chemicals is backed by Project Management & Development Company (PMD) of Saudi Arabia.
Spot price (USD)19-Mar 26-Mar w-w chg
(%)19-Mar 26-Mar w-w chg
(%)
PV grade 20.49 20.45 (0.2) 22.25 22.00 (1.1)
2nd grade - - - 21.83 21.60 (1.1)
Multi-si 1.05 1.05 (0.6) 0.94 0.93 (0.3)
Mono-si 1.21 1.21 (0.6) 1.23 1.23 0.0
Cell (per watt) 0.40 0.39 (0.8) 0.39 0.39 (0.3)
Module (per watt) 0.63 0.63 0.0 0.67 0.66 (0.2)
EnergyTrend PVinsights
Polysilicon (per Kg)
Wafers (per piece)

Nomura | GCL Poly Energy 27 March 2014
6
Fig. 2: Demand-supply balance at USD15-16/kg through 2014-16F
Source: Nomura estimates
Fig. 3: Polysilicon supply model – meaningful capacity growth over 2014-15F
Note: Denotes year-end capacities
Source: Company data, Nomura estimates
37129
194 19450
44
44 71
116
144
166 148
46
39
49 49
111
94
94 9418.4
16.9
16.015.9
14
15
16
17
18
19
0
100
200
300
400
500
600
2013 2014F 2015F 2016F
(US$/Kg)('000 MT)
US$10-12/Kg US$13-14/Kg US$15-16/Kg
US$17-18/Kg Above US$18/Kg Demand estimate
Avg Cash Cost (RHS)
39GW 45GW 54GW 66GW
FY11 FY12 FY13 FY14F FY15F FY16FTier 1 223,500 229,700 237,400 275,200 320,200 320,200
GCL 65,000 65,000 60,000 70,000 85,000 85,000Wacker 38,000 38,000 38,000 52,000 72,000 72,000OCI 35,000 42,000 42,000 42,000 52,000 52,000Hemlock 36,000 36,000 46,000 46,000 46,000 46,000REC 19,000 21,500 18,000 18,000 18,000 18,000Tokuyama 9,200 9,200 15,400 29,200 29,200 29,200SunEdison 13,100 14,100 14,100 14,100 14,100 14,100Osaka Titanium 3,900 3,900 3,900 3,900 3,900 3,900
Tier 2 / New entrants 63,800 68,300 76,000 128,000 179,500 189,500Hanwha Chemical 0 0 0 10,000 10,000 10,000Samsung Fine Chemical 0 0 0 10,000 13,000 13,000Woongjin Polysilicon 5,000 5,000 5,000 5,000 5,000 5,000
Powertec Energy Corp 0 0 0 6,000 17,500 27,500Taiwan Polysilicon 5,000 5,000 5,000 5,000 5,000 5,000
LDK Solar 17,000 17,000 17,000 18,000 18,000 18,000Daqo Group 4,300 4,300 6,000 12,000 27,000 27,000ReneSola 4,000 10,000 6,000 6,000 16,000 16,000TBEA 0 5,000 12,000 24,000 36,000 36,000Asia Silicon (Qinghai) 5,000 5,000 5,000 12,000 12,000 12,000Sichuan Yongxiang Polysilicon 1,000 1,000 4,000 4,000 4,000 4,000Shenzhou Silicon 3,000 3,000 3,000 3,000 3,000 3,000
AUO / M Setek 7,000 7,000 7,000 7,000 7,000 7,000SolarWorld & subsidiaries/JV 3,200 3,200 3,200 3,200 3,200 3,200Crystalox 1,800 1,800 1,800 1,800 1,800 1,800Sharp 1,000 1,000 1,000 1,000 1,000 1,000
Tier 3 (Unproven players) 67,260 47,300 47,300 47,300 47,300 47,300
Virgin polysilicon capacity year-end (MT)All Available (Tier 1 + Tier 2 + Tier 3) 354,560 345,300 360,700 450,500 547,000 557,000Sustainable Supply (Tier 1 + Tier 2) 287,300 298,000 313,400 403,200 499,700 509,700
y-y chg (%)All Available (Tier 1 + Tier 2 + Tier 3) 49 (3) 4 25 21 2Sustainable Supply (Tier 1 + Tier 2) 46 4 5 29 24 2

Nomura | GCL Poly Energy 27 March 2014
7
Diamond wire adoption to increase over the next few years
In addition to strong capacity growth over 2014-15F and new announcements still rolling in for capacity additions beyond 2016F, we see another potential risk from the rising usage of diamond wire (DW) for cutting wafers. As shown below (Fig. 4), PMSI Consulting expects DW penetration to rise from 7% in 2013 to 20% in 2015F and 69% by 2020F. IHS Technology expects installed diamond wire wafer capacity to grow from the current 5.5GW (~9.6% penetration) to 27.2GW (43%) by 2017F and 43.1GW (69%) by 2020F. This is being driven by rising pressure to lower costs-per-watt with faster penetration from 2014F. Note: DW penetration is multi c-Si wafering, and is primarily limited to mono-like multi-crystalline ingots.
So why is DW a threat to the polysilicon industry? DW to enable 4g/W silicon use The key advantages for DW come from: 1) lower kerf loss, i.e., wastage per wafer slicing is reduced given the usage of thinner diamond wires vs. steel + slurry; and 2) the possibility for thinner wafers. Both these advantages translate into reduced polysilicon consumption per wafer.
For instance, the thickness of a typical wafer is 180µ, with 175µ lost as waste (i.e. kerf loss) using a 140µ steel wire. However, with a shift to DW with a thickness of 135µ, kerf loss is reduced to 135µ, i.e., polysilicon consumption is only (180+135)/(180+175) = 88.7% of the original, which implies 11.3% lower polysilicon consumption. If wafer thickness is reduced to 145µ, polysilicon consumption per wafer is reduced by 21.1%. Fig. 4: DW market share is poised to grow rapidly
Source: PMSI Consulting
Fig. 5: DW-enabled capacity share to expand
Note: SW – Steel wire; DW – Diamond wire
Source: IHS Consulting (Mar-2014)
First Solar rethreatens thin-film as a viable alternative
In our note, FSLR to herald return of thin-film solar?, 20 March 2014, we had highlighted the key takeaways from First Solar’s analyst day, where we noted FSLR potentially increasing market share backed by better efficiencies and lower costs. Key points to note:
FSLR to reach and likely cross multi-crystalline module efficiencies FSLR expects to improve its average module efficiency from 13.4% in 4Q13 to 14.9% in 4Q14F, 16.5% in 4Q15F and 18% in 4Q16F as shown in Fig 7. In contrast, typical multi-crystalline products from China have 15.5-16% module efficiency (module efficiencies are lower than cell efficiencies). The key implication here is that FSLR’s ASP discount to crystalline would vanish or could even translate into a premium, thus putting significant margin pressure on the crystalline chain, in our view.
1015
2230
4349
5461
57.5 60.4 62.7 63 63.368.5 69.8
0
10
20
30
40
50
60
70
0
10
20
30
40
50
60
70
2013 2014F 2015F 2016 2017 2018F 2019F 2020F
(%)Capacity (GW)
SW (multi c-Si) DW (multi c-Si)SW (mono c-Si) DW (mono c-Si)Other DW Penetration (%) (LHS)Total

Nomura | GCL Poly Energy 27 March 2014
8
Fig. 6: FSLR: Efficiency roadmap
Note: The second row is the updated guidance for target efficiencies
Source: First Solar
Fig. 7: FSLR: Efficiency advantage vs. crystalline
Note: Temp Co, Spectral, No Backtracking are thin-film advantages over c-Si
Source: First Solar
First Solar cost reduction roadmap suggests potential cost advantage FSLR’s module cost at its best line for a like-to-like comparison with crystalline silicon was at USD0.47/W. This compares to USD0.49/W at JinkoSolar. FSLR expects to cut total system cost from USD1.59/W in FY13 to USD0.99/W by FY17F as shown in Fig 7. In contrast, for crystalline solar, we expect system costs in China/India (best cost structures currently) from USD1.2~1.3/W to ~USD1/W in the same timeframe, thus suggesting cost parity even in the lowest system cost markets.
Module production capacity to grow from 1.9GW in 2014 to 4.2~4.3GW in 2018F First Solar’s capacities have remained stagnant at 1.9GW over the past few years, as it struggled to bring its costs lower resulting in declining market share. First Solar now expects to add new capacities to reach 3.5~4.2GW by 2018F. If FSLR has a clear cost advantage, we believe thin-film could take meaningful share from crystalline which will be negative for the polysilicon industry. Fig. 8: FSLR: Target module cost reduction
Source: First Solar
Fig. 9: FSLR: Target system cost
Source: First Solar
CSP technology – Sunpower wins projects/partners in China
Another wildcard technology finding favour is concentrated solar photovoltaic technology by Sunpower, dubbed C7 Tracker. Sunpower on 25 March 2014 announced a sale of 70MW cell packages to Huaxia Concentrated PV Power Co Ltd in Inner Mongolia China. These packages will be used for two projects – 20MW in Saihan and 100MW in Wuchan with completion expected by 2015. The JV includes SunPower, Tianjin Zhonghuan Semiconductor Co Ltd, Inner Mongolia Power (Group) Co Ltd and Hohhot Jinqiao City Development Company Ltd. To date, a 300-MW C7 receiver manufacturing facility has been set up in Jinqiao Development Zone, Hohhot, Inner Mongolia, and a 50-MW production line is now in operation.
Sunpower notes that a 400-MW C7 power plant requires less than 70 MW of SunPower cells. It further added that through significant localisation of C7 manufacturing and supply chain, and deployment of the C7 for large-scale power plant projects, it expects this

Nomura | GCL Poly Energy 27 March 2014
9
venture will facilitate the development of a low-cost, high-volume supply chain and accelerate the cost reduction roadmap of this product. Fig. 10: Sunpower: C7 technology could enable meaningful cost reductions
Source: Sunpower analyst day 2013
TP maintained at HKD1.6; 2015F earnings cut by 3%
We largely maintain our 2014F net profit, but cut our 2015F net profit by 3% to reflect our expectation of a weaker ASP environment owing to new capacity additions / restarts with lower cash costs.
We raise our sales assumption from the solar segment by 23.6%/26.9% in 2014F/15F to reflect the higher shipments of polysilicon to external customers. However, this has no impact on our earnings line as the same volumes and sales contribution will need to be added in the COGS line to reflect external polysilicon purchases for wafer manufacturing by GCL, albeit our gross margin for 2014F/15F is lowered given our higher sales assumption.
We lower our revenue contribution from project sales to reflect the lower ASP environment for projects in China which we believe is likely to be the main region of sales for GCL Poly. Fig. 11: GCL Poly: Forecast revisions
Source: Company data and Nomura estimates
(HKD mn) Earlier Actual Change (%) Earlier Actual Change (%) Earlier Actual Change (%)Revenues 25,120 25,530 1.6 28,297 32,375 14.4 31,815 36,800 15.7— Power 6,807 6,709 (1.4) 7,183 7,183 0.0 7,309 7,309 (0.0)— Solar 16,298 18,121 11.2 18,004 22,245 23.6 20,158 25,588 26.9— Projects 2,016 700 (65.3) 3,110 2,946 (5.3) 4,349 3,903 (10.2)
Net Profit (1,037) (664) (35.9) 1,794 1,789 (0.3) 2,416 2,343 (3.0)Gross Margin (%) 10.4 11.9 1.5 21.3 20.6 (0.7) 21.4 20.6 (0.8)Net Margin (%) (4.1) (2.6) 1.5 6.3 5.5 (0.8) 7.6 6.4 (1.2)
FY13 FY14F FY15F

Nomura | GCL Poly Energy 27 March 2014
10
Fig. 12: GCL: Operational assumptions
Source: Company data and Nomura estimates
Fig. 13: GCL: Rolling PBV band chart
Source: Bloomberg, Company data, Nomura estimates
Fig. 14: GCL: Rolling EV/EBITDA band chart
Source: Bloomberg, Company data, Nomura estimates
1Q13 2Q13 3Q13 4Q13 1Q14F 2Q14F 3Q14F 4Q14F 2013 2014F 2015FPolysiliconCapacity (MT) 60,000 60,000 60,000 60,000 60,000 60,000 70,000 70,000 60,000 70,000 85,000Utilizations (%) 55% 89% 90% 99% 95% 100% 100% 100% 81% 97% 100%
Production (MT) 8,653 13,327 13,550 14,910 14,250 15,000 16,250 17,500 50,440 63,000 77,500External Sales (MT) 3,702 4,770 4,018 3,839 3,385 4,135 3,287 2,685 16,329 13,492 12,312
ASP (US$/Kg) 16.6 17.2 17.0 18.4 20.2 19.2 18.3 19.2 17.4 19.2 16.9Cost (US$/Kg) 19.7 16.7 16.3 16.0 16.1 13.5 12.3 12.2 16.9 13.4 11.6Gross Margin (%) (18.3) 3.0 4.0 13.0 20.3 29.9 32.5 36.2 2.9 30.0 31.1
WafersCapacity (MW) 8,000 8,000 9,000 10,000 10,000 10,000 15,000 15,000 10,000 15,000 15,000Utilizations (%) 62% 111% 120% 111% 110% 110% 105% 100% 102% 100% 110%
Production (MW) 1,231 2,221 2,546 2,636 2,750 2,750 3,281 3,750 8,634 12,531 16,500External Sales (MW) 1,482 2,376 2,505 2,933 2,750 2,750 3,281 3,750 9,296 12,531 16,500
ASP (US$/W) 0.21 0.20 0.21 0.22 0.22 0.21 0.20 0.20 0.21 0.21 0.19Cost (US$/W) 0.20 0.19 0.17 0.18 0.19 0.18 0.17 0.17 0.18 0.18 0.16Gross Margin (%) 4.4 7.1 17.3 18.9 16.5 15.5 14.2 14.2 13.6 15.0 14.7
1
2
3
4
5
6
Aug
-09
Feb
-10
Aug
-10
Feb
-11
Aug
-11
Feb
-12
Aug
-12
Feb
-13
Aug
-13
Feb
-14
Price(THB)
2.0x
1.5x
1.8x
2.3x
2.6x
0
1
2
3
4
5
6
7
8
9
Aug
-09
Feb
-10
Aug
-10
Feb
-11
Aug
-11
Feb
-12
Aug
-12
Feb
-13
Aug
-13
Feb
-14
Price(THB)
12x
8x
10x
14x
16x

Nomura | GCL Poly Energy 27 March 2014
11
Appendix A-1
Analyst Certification
I, Nitin Kumar, hereby certify (1) that the views expressed in this Research report accurately reflect my personal views about any or all of the subject securities or issuers referred to in this Research report, (2) no part of my compensation was, is or will be directly or indirectly related to the specific recommendations or views expressed in this Research report and (3) no part of my compensation is tied to any specific investment banking transactions performed by Nomura Securities International, Inc., Nomura International plc or any other Nomura Group company.
Issuer Specific Regulatory Disclosures The term "Nomura Group" used herein refers to Nomura Holdings, Inc. or any of its affiliates or subsidiaries, and may refer to one or more Nomura Group companies.
Materially mentioned issuers Issuer Ticker Price Price date Stock rating Sector rating Disclosures GCL Poly Energy 3800 HK HKD 2.63 26-Mar-2014 Reduce N/A
GCL Poly Energy (3800 HK) HKD 2.63 (26-Mar-2014) Rating and target price chart (three year history)
Reduce (Sector rating: N/A)
Date Rating Target price Closing price 18-Jun-13 Reduce 1.84 18-Jun-13 1.60 1.84 17-Jan-13 2.00 2.05 25-Aug-12 1.30 1.19 29-Mar-12 2.30 2.11 25-Oct-11 Neutral 2.23 25-Oct-11 2.50 2.23 12-May-11 7.00 5.32
For explanation of ratings refer to the stock rating keys located after chart(s)
Valuation Methodology We use the peer average FY14F P/BV to value GCL. Based on our estimates, we arrive at a target price of HKD1.60 on a current target FY14F P/BV of 1.50x and a FY14F BVPS of HKD1.14.The benchmark index for this stock is MSCI China. Risks that may impede the achievement of the target price Upside risks to our target price include 1) stability in macro conditions with improvements in available financing; 2) faster capacity closure of higher-cost peers helping improve the supply-demand balance; 3) new project-financing models finding success; and 4) ground-breaking cost reductions helping GCL push its profitability curve further.
Important Disclosures Online availability of research and conflict-of-interest disclosures Nomura research is available on www.nomuranow.com/research, Bloomberg, Capital IQ, Factset, MarkitHub, Reuters and ThomsonOne. Important disclosures may be read at http://go.nomuranow.com/research/globalresearchportal/pages/disclosures/disclosures.aspx or requested from Nomura Securities International, Inc., on 1-877-865-5752. If you have any difficulties with the website, please email [email protected] for help. The analysts responsible for preparing this report have received compensation based upon various factors including the firm's total revenues, a portion of which is generated by Investment Banking activities. Unless otherwise noted, the non-US analysts listed at the front of this report are

Nomura | GCL Poly Energy 27 March 2014
12
not registered/qualified as research analysts under FINRA/NYSE rules, may not be associated persons of NSI, and may not be subject to FINRA Rule 2711 and NYSE Rule 472 restrictions on communications with covered companies, public appearances, and trading securities held by a research analyst account. Nomura Global Financial Products Inc. (“NGFP”) Nomura Derivative Products Inc. (“NDPI”) and Nomura International plc. (“NIplc”) are registered with the Commodities Futures Trading Commission and the National Futures Association (NFA) as swap dealers. NGFP, NDPI, and NIplc are generally engaged in the trading of swaps and other derivative products, any of which may be the subject of this report. Any authors named in this report are research analysts unless otherwise indicated. Industry Specialists identified in some Nomura International plc research reports are employees within the Firm who are responsible for the sales and trading effort in the sector for which they have coverage. Industry Specialists do not contribute in any manner to the content of research reports in which their names appear. Distribution of ratings (Global) The distribution of all ratings published by Nomura Global Equity Research is as follows: 42% have been assigned a Buy rating which, for purposes of mandatory disclosures, are classified as a Buy rating; 43% of companies with this rating are investment banking clients of the Nomura Group*. 47% have been assigned a Neutral rating which, for purposes of mandatory disclosures, is classified as a Hold rating; 55% of companies with this rating are investment banking clients of the Nomura Group*. 11% have been assigned a Reduce rating which, for purposes of mandatory disclosures, are classified as a Sell rating; 26% of companies with this rating are investment banking clients of the Nomura Group*. As at 31 December 2013. *The Nomura Group as defined in the Disclaimer section at the end of this report. Explanation of Nomura's equity research rating system in Europe, Middle East and Africa, US and Latin America, and Japan and Asia ex-Japan from 21 October 2013 The rating system is a relative system, indicating expected performance against a specific benchmark identified for each individual stock, subject to limited management discretion. An analyst’s target price is an assessment of the current intrinsic fair value of the stock based on an appropriate valuation methodology determined by the analyst. Valuation methodologies include, but are not limited to, discounted cash flow analysis, expected return on equity and multiple analysis. Analysts may also indicate expected absolute upside/downside relative to the stated target price, defined as (target price - current price)/current price. STOCKS A rating of 'Buy', indicates that the analyst expects the stock to outperform the Benchmark over the next 12 months. A rating of 'Neutral', indicates that the analyst expects the stock to perform in line with the Benchmark over the next 12 months. A rating of 'Reduce', indicates that the analyst expects the stock to underperform the Benchmark over the next 12 months. A rating of 'Suspended', indicates that the rating, target price and estimates have been suspended temporarily to comply with applicable regulations and/or firm policies. Securities and/or companies that are labelled as 'Not rated' or shown as 'No rating' are not in regular research coverage. Investors should not expect continuing or additional information from Nomura relating to such securities and/or companies. Benchmarks are as follows: United States/Europe/Asia ex-Japan: please see valuation methodologies for explanations of relevant benchmarks for stocks, which can be accessed at: http://go.nomuranow.com/research/globalresearchportal/pages/disclosures/disclosures.aspx; Global Emerging Markets (ex-Asia): MSCI Emerging Markets ex-Asia, unless otherwise stated in the valuation methodology; Japan: Russell/Nomura Large Cap. SECTORS A 'Bullish' stance, indicates that the analyst expects the sector to outperform the Benchmark during the next 12 months. A 'Neutral' stance, indicates that the analyst expects the sector to perform in line with the Benchmark during the next 12 months. A 'Bearish' stance, indicates that the analyst expects the sector to underperform the Benchmark during the next 12 months. Sectors that are labelled as 'Not rated' or shown as 'N/A' are not assigned ratings. Benchmarks are as follows: United States: S&P 500; Europe: Dow Jones STOXX 600; Global Emerging Markets (ex-Asia): MSCI Emerging Markets ex-Asia. Japan/Asia ex-Japan: Sector ratings are not assigned. Explanation of Nomura's equity research rating system in Japan and Asia ex-Japan prior to 21 October 2013 STOCKS Stock recommendations are based on absolute valuation upside (downside), which is defined as (Target Price - Current Price) / Current Price, subject to limited management discretion. In most cases, the Target Price will equal the analyst's 12-month intrinsic valuation of the stock, based on an appropriate valuation methodology such as discounted cash flow, multiple analysis, etc. A 'Buy' recommendation indicates that potential upside is 15% or more. A 'Neutral' recommendation indicates that potential upside is less than 15% or downside is less than 5%. A 'Reduce' recommendation indicates that potential downside is 5% or more. A rating of 'Suspended' indicates that the rating and target price have been suspended temporarily to comply with applicable regulations and/or firm policies in certain circumstances including when Nomura is acting in an advisory capacity in a merger or strategic transaction involving the subject company. Securities and/or companies that are labelled as 'Not rated' or shown as 'No rating' are not in regular research coverage of the Nomura entity identified in the top banner. Investors should not expect continuing or additional information from Nomura relating to such securities and/or companies. SECTORS A 'Bullish' rating means most stocks in the sector have (or the weighted average recommendation of the stocks under coverage is) a positive absolute recommendation. A 'Neutral' rating means most stocks in the sector have (or the weighted average recommendation of the stocks under coverage is) a neutral absolute recommendation. A 'Bearish' rating means most stocks in the sector have (or the weighted average recommendation of the stocks under coverage is) a negative absolute recommendation. Target Price A Target Price, if discussed, reflects in part the analyst's estimates for the company's earnings. The achievement of any target price may be impeded by general market and macroeconomic trends, and by other risks related to the company or the market, and may not occur if the company's earnings differ from estimates. Disclaimers

Nomura | GCL Poly Energy 27 March 2014
13
This document contains material that has been prepared by the Nomura entity identified at the top or bottom of page 1 herein, if any, and/or, with the sole or joint contributions of one or more Nomura entities whose employees and their respective affiliations are specified on page 1 herein or identified elsewhere in the document. The term "Nomura Group" used herein refers to Nomura Holdings, Inc. or any of its affiliates or subsidiaries and may refer to one or more Nomura Group companies including: Nomura Securities Co., Ltd. ('NSC') Tokyo, Japan; Nomura International plc ('NIplc'), UK; Nomura Securities International, Inc. ('NSI'), New York, US; Nomura International (Hong Kong) Ltd. (‘NIHK’), Hong Kong; Nomura Financial Investment (Korea) Co., Ltd. (‘NFIK’), Korea (Information on Nomura analysts registered with the Korea Financial Investment Association ('KOFIA') can be found on the KOFIA Intranet at http://dis.kofia.or.kr); Nomura Singapore Ltd. (‘NSL’), Singapore (Registration number 197201440E, regulated by the Monetary Authority of Singapore); Nomura Australia Ltd. (‘NAL’), Australia (ABN 48 003 032 513), regulated by the Australian Securities and Investment Commission ('ASIC') and holder of an Australian financial services licence number 246412; P.T. Nomura Indonesia (‘PTNI’), Indonesia; Nomura Securities Malaysia Sdn. Bhd. (‘NSM’), Malaysia; NIHK, Taipei Branch (‘NITB’), Taiwan; Nomura Financial Advisory and Securities (India) Private Limited (‘NFASL’), Mumbai, India (Registered Address: Ceejay House, Level 11, Plot F, Shivsagar Estate, Dr. Annie Besant Road, Worli, Mumbai- 400 018, India; Tel: +91 22 4037 4037, Fax: +91 22 4037 4111; SEBI Registration No: BSE INB011299030, NSE INB231299034, INF231299034, INE 231299034, MCX: INE261299034) and NIplc, Madrid Branch (‘NIplc, Madrid’). ‘CNS Thailand’ next to an analyst’s name on the front page of a research report indicates that the analyst is employed by Capital Nomura Securities Public Company Limited (‘CNS’) to provide research assistance services to NSL under a Research Assistance Agreement. CNS is not a Nomura entity. THIS MATERIAL IS: (I) FOR YOUR PRIVATE INFORMATION, AND WE ARE NOT SOLICITING ANY ACTION BASED UPON IT; (II) NOT TO BE CONSTRUED AS AN OFFER TO SELL OR A SOLICITATION OF AN OFFER TO BUY ANY SECURITY IN ANY JURISDICTION WHERE SUCH OFFER OR SOLICITATION WOULD BE ILLEGAL; AND (III) BASED UPON INFORMATION FROM SOURCES THAT WE CONSIDER RELIABLE, BUT HAS NOT BEEN INDEPENDENTLY VERIFIED BY NOMURA GROUP. Nomura Group does not warrant or represent that the document is accurate, complete, reliable, fit for any particular purpose or merchantable and does not accept liability for any act (or decision not to act) resulting from use of this document and related data. To the maximum extent permissible all warranties and other assurances by Nomura group are hereby excluded and Nomura Group shall have no liability for the use, misuse, or distribution of this information. Opinions or estimates expressed are current opinions as of the original publication date appearing on this material and the information, including the opinions and estimates contained herein, are subject to change without notice. Nomura Group is under no duty to update this document. Any comments or statements made herein are those of the author(s) and may differ from views held by other parties within Nomura Group. Clients should consider whether any advice or recommendation in this report is suitable for their particular circumstances and, if appropriate, seek professional advice, including tax advice. Nomura Group does not provide tax advice. Nomura Group, and/or its officers, directors and employees, may, to the extent permitted by applicable law and/or regulation, deal as principal, agent, or otherwise, or have long or short positions in, or buy or sell, the securities, commodities or instruments, or options or other derivative instruments based thereon, of issuers or securities mentioned herein. Nomura Group companies may also act as market maker or liquidity provider (within the meaning of applicable regulations in the UK) in the financial instruments of the issuer. Where the activity of market maker is carried out in accordance with the definition given to it by specific laws and regulations of the US or other jurisdictions, this will be separately disclosed within the specific issuer disclosures. This document may contain information obtained from third parties, including ratings from credit ratings agencies such as Standard & Poor’s. Reproduction and distribution of third party content in any form is prohibited except with the prior written permission of the related third party. Third party content providers do not guarantee the accuracy, completeness, timeliness or availability of any information, including ratings, and are not responsible for any errors or omissions (negligent or otherwise), regardless of the cause, or for the results obtained from the use of such content. Third party content providers give no express or implied warranties, including, but not limited to, any warranties of merchantability or fitness for a particular purpose or use. Third party content providers shall not be liable for any direct, indirect, incidental, exemplary, compensatory, punitive, special or consequential damages, costs, expenses, legal fees, or losses (including lost income or profits and opportunity costs) in connection with any use of their content, including ratings. Credit ratings are statements of opinions and are not statements of fact or recommendations to purchase hold or sell securities. They do not address the suitability of securities or the suitability of securities for investment purposes, and should not be relied on as investment advice. Any MSCI sourced information in this document is the exclusive property of MSCI Inc. (‘MSCI’). Without prior written permission of MSCI, this information and any other MSCI intellectual property may not be reproduced, re-disseminated or used to create any financial products, including any indices. This information is provided on an "as is" basis. The user assumes the entire risk of any use made of this information. MSCI, its affiliates and any third party involved in, or related to, computing or compiling the information hereby expressly disclaim all warranties of originality, accuracy, completeness, merchantability or fitness for a particular purpose with respect to any of this information. Without limiting any of the foregoing, in no event shall MSCI, any of its affiliates or any third party involved in, or related to, computing or compiling the information have any liability for any damages of any kind. MSCI and the MSCI indexes are services marks of MSCI and its affiliates. Investors should consider this document as only a single factor in making their investment decision and, as such, the report should not be viewed as identifying or suggesting all risks, direct or indirect, that may be associated with any investment decision. Nomura Group produces a number of different types of research product including, among others, fundamental analysis, quantitative analysis and short term trading ideas; recommendations contained in one type of research product may differ from recommendations contained in other types of research product, whether as a result of differing time horizons, methodologies or otherwise. Nomura Group publishes research product in a number of different ways including the posting of product on Nomura Group portals and/or distribution directly to clients. Different groups of clients may receive different products and services from the research department depending on their individual requirements. Clients outside of the US may access the Nomura Research Trading Ideas platform (Retina) at http://go.nomuranow.com/equities/tradingideas/retina/ Figures presented herein may refer to past performance or simulations based on past performance which are not reliable indicators of future performance. Where the information contains an indication of future performance, such forecasts may not be a reliable indicator of future performance. Moreover, simulations are based on models and simplifying assumptions which may oversimplify and not reflect the future distribution of returns. Certain securities are subject to fluctuations in exchange rates that could have an adverse effect on the value or price of, or income derived from, the investment. The securities described herein may not have been registered under the US Securities Act of 1933 (the ‘1933 Act’), and, in such case, may not be offered or sold in the US or to US persons unless they have been registered under the 1933 Act, or except in compliance with an exemption from the registration requirements of the 1933 Act. Unless governing law permits otherwise, any transaction should be executed via a Nomura entity in your home jurisdiction. This document has been approved for distribution in the UK and European Economic Area as investment research by NIplc. NIplc is authorised by the Prudential Regulation Authority and regulated by the Financial Conduct Authority and the Prudential Regulation Authority. NIplc is a member of the London Stock Exchange. This document does not constitute a personal recommendation within the meaning of applicable regulations in the UK, or take into account the particular investment objectives, financial situations, or needs of individual investors. This document is intended only for investors who are 'eligible counterparties' or 'professional clients' for the purposes of applicable regulations in the UK, and may not, therefore, be redistributed to persons who are 'retail clients' for such purposes. This document has been approved by NIHK, which is regulated by the Hong Kong Securities and Futures Commission, for distribution in Hong Kong by NIHK. This document has been

Nomura | GCL Poly Energy 27 March 2014
14
approved for distribution in Australia by NAL, which is authorized and regulated in Australia by the ASIC. This document has also been approved for distribution in Malaysia by NSM. In Singapore, this document has been distributed by NSL. NSL accepts legal responsibility for the content of this document, where it concerns securities, futures and foreign exchange, issued by their foreign affiliates in respect of recipients who are not accredited, expert or institutional investors as defined by the Securities and Futures Act (Chapter 289). Recipients of this document in Singapore should contact NSL in respect of matters arising from, or in connection with, this document. Unless prohibited by the provisions of Regulation S of the 1933 Act, this material is distributed in the US, by NSI, a US-registered broker-dealer, which accepts responsibility for its contents in accordance with the provisions of Rule 15a-6, under the US Securities Exchange Act of 1934. The entity that prepared this document permits its separately operated affiliates within the Nomura Group to make copies of such documents available to their clients. This document has not been approved for distribution to persons other than ‘Authorised Persons’, ‘Exempt Persons’ or ‘Institutions’ (as defined by the Capital Markets Authority) in the Kingdom of Saudi Arabia (‘Saudi Arabia’) or 'professional clients' (as defined by the Dubai Financial Services Authority) in the United Arab Emirates (‘UAE’) or a ‘Market Counterparty’ or ‘Business Customers’ (as defined by the Qatar Financial Centre Regulatory Authority) in the State of Qatar (‘Qatar’) by Nomura Saudi Arabia, NIplc or any other member of Nomura Group, as the case may be. Neither this document nor any copy thereof may be taken or transmitted or distributed, directly or indirectly, by any person other than those authorised to do so into Saudi Arabia or in the UAE or in Qatar or to any person other than ‘Authorised Persons’, ‘Exempt Persons’ or ‘Institutions’ located in Saudi Arabia or 'professional clients' in the UAE or a ‘Market Counterparty’ or ‘Business Customers’ in Qatar . By accepting to receive this document, you represent that you are not located in Saudi Arabia or that you are an ‘Authorised Person’, an ‘Exempt Person’ or an ‘Institution’ in Saudi Arabia or that you are a 'professional client' in the UAE or a ‘Market Counterparty’ or ‘Business Customers’ in Qatar and agree to comply with these restrictions. Any failure to comply with these restrictions may constitute a violation of the laws of the UAE or Saudi Arabia or Qatar. NO PART OF THIS MATERIAL MAY BE (I) COPIED, PHOTOCOPIED, OR DUPLICATED IN ANY FORM, BY ANY MEANS; OR (II) REDISTRIBUTED WITHOUT THE PRIOR WRITTEN CONSENT OF A MEMBER OF NOMURA GROUP. If this document has been distributed by electronic transmission, such as e-mail, then such transmission cannot be guaranteed to be secure or error-free as information could be intercepted, corrupted, lost, destroyed, arrive late or incomplete, or contain viruses. The sender therefore does not accept liability for any errors or omissions in the contents of this document, which may arise as a result of electronic transmission. If verification is required, please request a hard-copy version. Nomura Group manages conflicts with respect to the production of research through its compliance policies and procedures (including, but not limited to, Conflicts of Interest, Chinese Wall and Confidentiality policies) as well as through the maintenance of Chinese walls and employee training. Additional information is available upon request and disclosure information is available at the Nomura Disclosure web page: http://go.nomuranow.com/research/globalresearchportal/pages/disclosures/disclosures.aspx Copyright © 2014 Nomura International (Hong Kong) Ltd.. All rights reserved.