14643-TIP HB3b Umschlag Aussen E -...
22
Chapter 6 Building Management, Comfort and HVAC 6.1 Building Automation with Desigo 118 6.2 Heating, Ventilation, Air Conditioning (HVAC) 120 6.3 Planning Notes for GAMMA instabus (KNX / EIB) 123 6.4 Power Management 125 6.5 SICAM Power I&C System 134
Transcript of 14643-TIP HB3b Umschlag Aussen E -...
Chapter 6Building Management, Comfort and HVAC
6.1 Building Automation with Desigo 118
6.2 Heating, Ventilation, Air Conditioning (HVAC) 120
6.3 Planning Notes for GAMMA instabus (KNX / EIB) 123
6.4 Power Management 125
6.5 SICAM Power I&C System 134

118 Totally Integrated Power – Building Management, Comfort and HVAC
66.1 Building Automation with Desigo
Building automation and security management are part of the technical building management.
The main task of the technical building management is the management of the subsystems. This comprises in particu-lar the central monitoring and operation of the subsystems but also the option of visualization, archiving, logging, and evaluation.
The pyramid shown in Fig. 61/1 reflects the data concen-tration which arises from one level to the next: The field level acquires a great deal of information of which, how-ever, only the relevant part is passed on to the next level. A typical example for that are intelligent fire detectors which continuously record the smoke density and temperature, for example, but only periodically signal a degree of dan-ger to the control center, and only in the case of an alarm immediately report the event to the control center.
Main requirements for a building management system
Scalable system structure
When selecting a building management system (BMS), it must be made sure that it provides sufficient support for future alterations and extensions. The stepwise expand-ability of a system and the correspondingly simple and efficient system expansion form a central quality charac-teristic.
To allow for a better structuring of the diversity of techni-cal systems, it is worth taking a closer look at the various building management tasks. Usually, the following three task areas are distinguished:
Commercial management is performed by specialized systems which support the company's business processes and comprises various subareas from purchasing to logistics to sales and maintenance. These systems are more or less integrated, depending on the solution, and can be combined under the name ERP (Enterprise Resource Planning). Among the most well known companies in this field are SAP and Oracle, for example.
6 Building Management, Comfort and HVAC
Infrastructural building management comprises, among other things, systems for the maintenance of the building, e.g. the facility management systems (FMS) which manage the maintenance of the technical facilities.
Technical building management comprises the building automation and security management. While the building automation deals with, for example, heating, ventilation, air conditioning (HVAC), light and lifts, the security management deals with fire detection, burglar alarm, access control, video surveillance, and other security topics.
Openness by standards
To support open communication, standard interfaces and protocols such as BACnet, KNX / EIB Profinet and others are provided for a direct integration of subsystems into the management station.
Economic efficiency
Functionality and user-friendliness are supposed to reduce operating expense and training time and increase the productivity at a simultaneously high operational safety.
Fig. 61/1: Structure of the technical building management
Planning of the company resources (ERP)
Fieldlevel
Automationlevel
Technical building management
Total Building Solutions
119Totally Integrated Power – Building Management, Comfort and HVAC
6
The operating behavior of the systems can be optimized in a simple manner via the management station and provides for an energy-efficient operation of the entire building installations.
Main functions of the building management system
Operator control and monitoring Fast and selective monitoring and operation of the system with practical plant and room diagrams.
Time programs Central programming of all time-controlled building functions.
Alarm handling Detailed overview of the alarms for a fast localization and elimination of faults. Central elements of the alarm handling are therefore the danger identification, danger alarm and an adequate intervention. This is supported by the flexible transmission of alarms to mobile devices, e.g. printers or pagers.
Event control System-wide monitoring of systems and processes with regard to the occurrence of certain criteria for the triggering of certain predefined actions. Reporting Modern management stations today work with integrated database applications. This allows for the storage of an almost unlimited number of past events and their recorded handling. With these plant-specific records and the corresponding query options, the following questions can be answered, for example:
What has happened in the past 24 hours? – How many interferences occurred within a certain –period? Who has done what and when following yesterday's –burglar alarm?
To provide this main function, a whole range of additional functions is required, which so to speak forms the infra-structure of the building management system. The most important of these additional functions are, for example: access rights concept, user administration, password administration, object management in tree and graphic structures, and graphic level management.
6.1.2 Planning of a Building Management System
Within the scope of BMS projects, there are individual project phases comprising different contents and responsibilities. The first project phases are described in the following.
Definition of objectives
The customer / user must define objectives, this serves as a basis for the preparation of a requirements specification. The definition of objectives comprises the following ele-ments:
Scope of the building automation and security management subsystems to be integrated.
Definition of the integration: Combining all subsystems of building installations (fire alarm, gas warning, burglar alarm, access control or video surveillance, HVAC systems, lighting, and further external systems) by integrating them into a building management system brings the following advantages:
Improved overview and thus increased safety. – Lower costs in comparison to several independent –control centers with regard to acquisition, configuration, and maintenance. Consistent operational concept and thus less training –time and effort, and no danger of confusion in an emergency. Only one system has to be integrated into the in- –house IT infrastructure. Interactions between the subsystems are possible in a –much easier way. Alarm escalation and alarm transmission is done in a –more uniform way. Integrated video systems allow for a direct view of the –fault cause.
The objective is therefore to integrate all subsystems as completely as possible into the building management system.
Expected improvements compared to a single-system solution.
Demands on the failure safety (redundancy solutions).
Demands on the power supply (e.g. UPS).
Description of the workplaces and tasks of the employees at the workplaces.
From the definition of objectives, a requirements specifica-tion has to be prepared with the collaboration of the user and planner.
120 Totally Integrated Power – Building Management, Comfort and HVAC
6
Requirements specification
Within the scope of the requirements specification, the completeness and clarity of the definition of objectives is verified. The following details need to be substantiated:
Which installations / systems do already exist and have to be integrated into the overall system (specifying the software version)?
Which installations / systems have to be acquired newly, makes or description of the systems and the expected interface for the integration?
Amount of data points
Functional description (alarm plans, automation demands, action plans, graphics, operational concepts, etc.)
Definition of the expected performance features
Definition of the technical framework conditions for the integration: Part of that is the description of the expected physical and logical interfaces to include them in the defined integration for a holistic management system.
Description of the mode of operation of subsystems
Definition of time synchronizations, ramp-up behavior and synchronization, system monitoring and safety-related requirements
Definition of the regulatory framework conditions: Part of this are topics like: licensing rights, disclosure of interfaces, support in the new development or adaptation as well as the commissioning of the interfaces.
Conceptual solution (block diagram) with regard to the networking of the subsystems and management system to be connected
Specification of the graphical user interface with the objective to obtain a uniform picture for the entire building and all installations, with the same detail sharpness and the same information content as well as the same viewing angles and brightness.
Framework conditions
In the framework conditions, all other conditions referring to the project have to be specified. The requirements specification and the framework conditions serve as a basis for invitations to tender, selection and project monitoring.
6.2 Heating, Ventilation, Air Conditioning (HVAC)A reduction of the energy consumption as it is requested by standards and regulations in various European countries can be achieved by applying tight windows and corre-spondingly insulated brickwork. Nevertheless, if the neces-sary air exchange is not ensured, there is a danger of bad air quality in rooms due to humidity, radon, organic mat-ters, formaldehyde and other effluviums from building materials, fitments, etc. The inhabitants' well-being is not only impaired by this, but there is also the danger of struc-tural damage, primarily caused by the growth of mold.
In a highly isolated building, window ventilation is not only insufficient but also renders void all efforts to save energy. Therefore, the installation of a ventilation system should be considered in any case.
Ventilation and air conditioning systems which are able to keep a specified air state with regard to temperature and humidity throughout the year are called air-conditioning systems. These systems are equipped with all necessary components which allow for heating, cooling, humidifying or dehumidifying the air as required.
The necessity for the use of an air-conditioning system has to be considered in each case. The following specifications might necessitate air conditioning:
Heat, oppressiveness
Architectural specifications such as large banks of windows, open-plan offices, lack of shading, etc.
Stringent demands on temperature and humidity
Interior rooms, assembly rooms
High thermal loads
EDP, machine rooms
Tasks of the HVAC systems
Depending on the purpose, the tasks of the HVAC systems can be subdivided in two subareas:
Comfort systems: The term 'comfort systems' combines all systems creating and automatically maintaining a comfortable room climate which supports people's health and performance in our residential buildings, offices, schools, hospitals, restaurants, cinemas, theaters, department stores, etc.
Industrial systems: The term 'industrial systems' combines all systems creating and maintaining a room climate or room state in order to ensure certain production processes, storage or ripening processes.

121Totally Integrated Power – Building Management, Comfort and HVAC
6
Energy costs
The control strategy of modern HVAC systems has a signifi-cant positive influence on the energy costs. For an energy-optimized operation, the exchange of information be-tween the primary and secondary system is important so that only that amount of energy is provided which is requested by the loads in the secondary circuit.
The well-being in buildings with ventilation and air-condi-tioning systems does not have to be bought dearly nowa-days. Heat recovery systems, facade cooling, concrete core cooling, shading, solar energy are virtually part of the standard equipment in building installations.
6.2.1 Planning of Heating, Ventilation or Air-Conditioning Systems
When planning an HVAC system, the climatic conditions at the building location have to be taken into account.
The heat increase inside the building due to internal heat sources such as lamps, computers, copying machines is often so high owing to the good isolation of buildings and a tight building envelope that cooling is required even in winter. This arising heat is called internal gain of heat.
In winter, the internal gain of heat can be recovered as heat contribution and thus the energy consumption be reduced. Whereas in summer, considerable amounts of energy have to be employed for cooling.
Another important aspect in the calculation of the internal gain of heat is the amount of heat released by the persons inside the building. In that, the total amount of released heat first of all depends on the activity of the persons (Fig. 62/1).
These amounts of heat are interesting for the planning of heating, ventilation and air-conditioning system mainly if the rooms are often occupied by many persons (e.g. de-partment stores, office buildings, schools, cinemas, or restaurants). In a medium-size cinema, for example, 300 persons produce about 30 kW after all, in a three-hour screening this is a heat output of about 100 kWh!
An overview of the various demands on the room climate in different buildings is given in Table 62 / 1.
The air change rates (air rate, m3 / h) are defined in DIN 1946-2. In accordance with DIN 1946, the rate of fresh air supply in rooms for the sheltering of persons is to be dimensioned according to the number of persons present at the same time and the room use. For rooms with addi-tional, unpleasant odor sources (e.g. tobacco smoke), the minimum rate of fresh air supply is to be increased by 20 m3 / h per person.
80 Watt 100 Watt 110 Watt 120 Watt 170 Watt 300 Watt 700 Watt
Fig. 62/1: Activity-related heat release of an adult person in watts

122 Totally Integrated Power – Building Management, Comfort and HVAC
6
Table 62 / 1: Building types, use and conditions
Building type Use RequirementCondition
Temperature [°C] Humidity [%] Air rate [h–1]
Low buildings
Steel / metal construction tolerable working temperature 18–26 30–60
5–15-fold
Paper machines tolerable working temperature 22–30 40–50
Paper storage constant humidity 20–24
Print shop constant humidity 20–26 45–60
Textile
Cotton, linen
Spinning mill constant humidity 22–25 up to 50
Weaving mill constant humidity 22–25 70–80
Wool spinning mill constant humidity 27–29 50–60
Wool weaving mill constant humidity 27–29 60–70
Multi-story buildings
Electrical industry
5–15-fold
General dust-free 21–24 50–55
Relays small tolerance 22 40–45
Insulations damp up to 24 65–70
Pharmaceutical production sterile, dry, clean rooms 21–27 30–30
Photographic industry dust-free 20–24 40–65
Production, development, storage of films
dust-free 18–22 40–60
Tobacco
Storage damp 21–23 60–65
Preparation damp 22–26 75–85
Production damp 21–24 55–65
Confectionery
Candy production dry 24–27 35–45
Chocolate production cool 18–25 50–60
Low buildings
Museum / paintings constant humidity 18–24 40–55 20-fold
Indoor swimming pool comfortableness 26–30 60–70 3–4-fold
Gymnasium and festival hall comfortableness 22–24 45 20-fold
Restaurant comfortableness 22–26 40–60 5–40-fold
Multi-story buildings
High-precision assembly small tolerance 21 40
Sewing works comfortableness 22–26 50
Department stores 20–26 45–60 4–6-fold
Laboratory / chemistry 22–24 50 8–15-fold
Laboratory / physics 22–24 (20 const.) 45
Special laboratory 10–40 15–95
Schools comfortable 22–24 40–60
Auditoriums comfortable 22–24 40–60 8–10-fold
Office buildings comfortable 40–60 3–6-fold
Hospitals
Bedrooms sterile, low-noise 22–24 40–60
Operating rooms sterile, low-noise 20–25 40–65
Hotel lobby comfortable 22–26 40–55 5-fold
Hotel room comfortable 22–24 approx. 40 30-fold

123Totally Integrated Power – Building Management, Comfort and HVAC
6
6.3 Planning Notes for GAMMA instabus (KNX / EIB)In conventional building engineering, individual installa-tions (lighting, heating, alarm system, etc.) are planned separately and implemented using different systems. Increasing functionality and comfort make conventional building engineering more complex, less transparent and more expensive. Combining individual installations is only feasible at a great technical expense.
In the planning and implementation of functional and industrial buildings, future fault-free, cross-function-net-worked and demand-oriented operation as well as the careful use of energy are considered important criteria for the economic efficiency of the real estate investment.
Conventional electric installations alone can only meet such requirements to a limited extent and at the expense of increased labor and material cost. For this reason, planning engineers and investors increasingly opt for building management technology in the global KNX / EIB standard, which complies with EN 50090.
The use of GAMMA instabus offers the following:
High degree of flexibility for planning and installation thanks to a modular system design.
Integration of different installations and OEM products thanks to the global KNX / EIB standard based on EN 50090.
Short installation times due to straightforward wiring and cable routing.
Reduced fire loads due to fewer power lines.
Easy handling thanks to user-friendly configuring, commissioning and diagnostic tools.
Compared to solutions with conventional technology, the use of GAMMA instabus quickly becomes far more eco-nomical in operation as well as in the investment phase (Fig. 63/1). Moreover, the solution with GAMMA instabus offers more functionality at higher comfort, whereby the clarity of the system is maintained.
Coordinated room management based on GAMMA instabus
Conventional solutions for the control of lighting, shading and heating / ventilation / air-conditioning are restricted to one installation each so that interdependencies between the different installations are not taken into account. Only the use of the building management technology allows for a stronger integration of the control of different installa-tions in the room at justifiable costs.
With a coordinated room management based on the building management technology KNX / EIB (Fig. 63/2), the use of energy for lighting and room temperature control over the entire operating time can be reduced by half compared to conventional systems and that at the same or higher comfort!
Therefore, for the cost-optimized operation of energy-effi-cient buildings as requested by foresightful investors with regard to the increase of the property value, a coordinated room management based on GAMMA instabus is the only possible solution.
Sensors(command
transmitters)
Actuators(command
receivers)
Doorcontact
Lumi-naire
Electricdrive
Blinds Fan Lumi-naire
Heater Warninglight
Motiondetector
Airspeedwatch-dog
Clocktimer
Bright-nesssensor
Maxi-mum-demandmonitor
Thermo-stat Switch
Masterlock atalarm& alertcenter
IRremotecontrol
Brokenglassdetector
KNX /EIB
230 / 400 V / AC
Fig. 63/2: Actuators and sensors in the KNX / EIB system
Cost perfunction
Number offunctions
Conventional design
Design usingKNX/EIB
0 2 4 6 8 10 12 14
Fig. 63/1: Cost gradients of conventional and KNX / EIB installations when comfort and functionality are increased
124
Checklist
Totally Integrated Power – Building Management, Comfort and HVAC
6
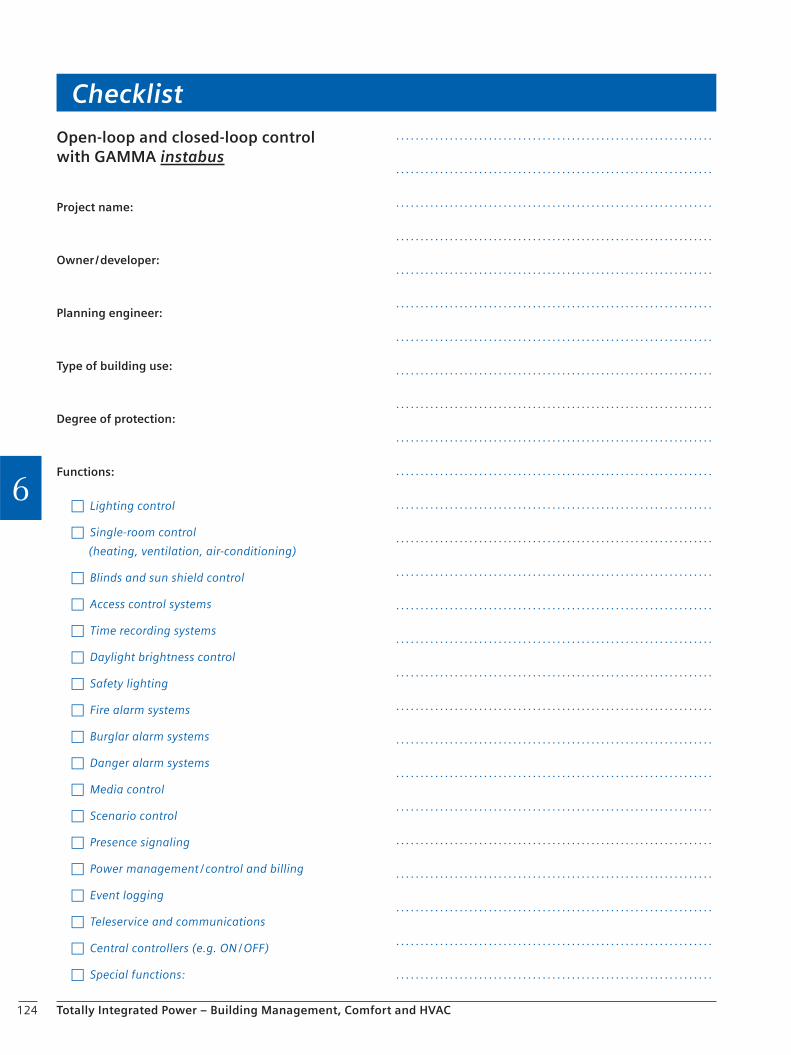
Open-loop and closed-loop control with GAMMA instabus
Project name:
Owner / developer:
Planning engineer:
Type of building use:
Degree of protection:
Functions:
c Lighting control
c Single-room control
(heating, ventilation, air-conditioning)
c Blinds and sun shield control
c Access control systems
c Time recording systems
c Daylight brightness control
c Safety lighting
c Fire alarm systems
c Burglar alarm systems
c Danger alarm systems
c Media control
c Scenario control
c Presence signaling
c Power management / control and billing
c Event logging
c Teleservice and communications
c Central controllers (e.g. ON / OFF)
c Special functions:
. . . . . . . . . . . . . . . . . . . . . . . . . . . . . . . . . . . . . . . . . . . . . . . . . . . . . . . . . . . . . . . . .
. . . . . . . . . . . . . . . . . . . . . . . . . . . . . . . . . . . . . . . . . . . . . . . . . . . . . . . . . . . . . . . . .
. . . . . . . . . . . . . . . . . . . . . . . . . . . . . . . . . . . . . . . . . . . . . . . . . . . . . . . . . . . . . . . . .
. . . . . . . . . . . . . . . . . . . . . . . . . . . . . . . . . . . . . . . . . . . . . . . . . . . . . . . . . . . . . . . . .
. . . . . . . . . . . . . . . . . . . . . . . . . . . . . . . . . . . . . . . . . . . . . . . . . . . . . . . . . . . . . . . . .
. . . . . . . . . . . . . . . . . . . . . . . . . . . . . . . . . . . . . . . . . . . . . . . . . . . . . . . . . . . . . . . . .
. . . . . . . . . . . . . . . . . . . . . . . . . . . . . . . . . . . . . . . . . . . . . . . . . . . . . . . . . . . . . . . . .
. . . . . . . . . . . . . . . . . . . . . . . . . . . . . . . . . . . . . . . . . . . . . . . . . . . . . . . . . . . . . . . . .
. . . . . . . . . . . . . . . . . . . . . . . . . . . . . . . . . . . . . . . . . . . . . . . . . . . . . . . . . . . . . . . . .
. . . . . . . . . . . . . . . . . . . . . . . . . . . . . . . . . . . . . . . . . . . . . . . . . . . . . . . . . . . . . . . . .
. . . . . . . . . . . . . . . . . . . . . . . . . . . . . . . . . . . . . . . . . . . . . . . . . . . . . . . . . . . . . . . . .
. . . . . . . . . . . . . . . . . . . . . . . . . . . . . . . . . . . . . . . . . . . . . . . . . . . . . . . . . . . . . . . . .
. . . . . . . . . . . . . . . . . . . . . . . . . . . . . . . . . . . . . . . . . . . . . . . . . . . . . . . . . . . . . . . . .
. . . . . . . . . . . . . . . . . . . . . . . . . . . . . . . . . . . . . . . . . . . . . . . . . . . . . . . . . . . . . . . . .
. . . . . . . . . . . . . . . . . . . . . . . . . . . . . . . . . . . . . . . . . . . . . . . . . . . . . . . . . . . . . . . . .
. . . . . . . . . . . . . . . . . . . . . . . . . . . . . . . . . . . . . . . . . . . . . . . . . . . . . . . . . . . . . . . . .
. . . . . . . . . . . . . . . . . . . . . . . . . . . . . . . . . . . . . . . . . . . . . . . . . . . . . . . . . . . . . . . . .
. . . . . . . . . . . . . . . . . . . . . . . . . . . . . . . . . . . . . . . . . . . . . . . . . . . . . . . . . . . . . . . . .
. . . . . . . . . . . . . . . . . . . . . . . . . . . . . . . . . . . . . . . . . . . . . . . . . . . . . . . . . . . . . . . . .
. . . . . . . . . . . . . . . . . . . . . . . . . . . . . . . . . . . . . . . . . . . . . . . . . . . . . . . . . . . . . . . . .
. . . . . . . . . . . . . . . . . . . . . . . . . . . . . . . . . . . . . . . . . . . . . . . . . . . . . . . . . . . . . . . . .
. . . . . . . . . . . . . . . . . . . . . . . . . . . . . . . . . . . . . . . . . . . . . . . . . . . . . . . . . . . . . . . . .
. . . . . . . . . . . . . . . . . . . . . . . . . . . . . . . . . . . . . . . . . . . . . . . . . . . . . . . . . . . . . . . . .
. . . . . . . . . . . . . . . . . . . . . . . . . . . . . . . . . . . . . . . . . . . . . . . . . . . . . . . . . . . . . . . . .
. . . . . . . . . . . . . . . . . . . . . . . . . . . . . . . . . . . . . . . . . . . . . . . . . . . . . . . . . . . . . . . . .
. . . . . . . . . . . . . . . . . . . . . . . . . . . . . . . . . . . . . . . . . . . . . . . . . . . . . . . . . . . . . . . . .
125Totally Integrated Power – Building Management, Comfort and HVAC
6
6.4 Power Management
Due to the increasing energy costs, saving energy becomes more and more important on every sector. At the same time, ecological goals are to be attained, e.g. the specifica-tions with regard to the reduction of emissions and green-house gases. This results first of all in the selection of energy-efficient components, but it also necessitates an ecological and economic power management.
Planning & operation
In the planning phase, the property costs are to be kept as low as possible while the operator is interested in minimiz-ing the operating costs. When planning the electrical power distribution, the basics for the power management should be established. The following aspects are to be taken into account:
Provide the required components with interfaces for measurements and sensors.
Use standardized bus systems and communication-capable devices.
Ensure expandability (e.g. expandable cable laying and installation of transformers in cabinets) to keep interruptions during operation at a minimum.
Power management system
The focus of a power management system is on the re-quest for improved transparency of energy consumption and energy quality as well as on ensuring the availability of power distribution. An all-round transparency is the basis for an optimization of energy costs and consumption. The obtained information provides a realistic basis for a cost center allocation as well as for measures to improve the energy performance. Moreover, savings are documented.
Functions of the power management system
Analysis of the energy data / energy flows with specific load curve diagrams
Visualization of the interdependencies
Detection of savings potentials, assessed minimum and maximum values
Energy measurements for accounting purposes (internal cost center allocation, external billing)
Benchmarking, internal (product line / building part) or external (property / installations with comparable use based on obtained measured values)
Visualization of the power supply with switching states and energy flows
Preparation of decisions, for example for power supply extensions
Verifiable efficiency improvements
Targeted troubleshooting via fast and detailed
information on events and faults that occur in the power distribution within the installations / building
Logging of fault and event messages (e.g. switching sequences) with a date and time stamp so that downtimes can be documented and fault processes can be traced and analyzed later using the data recorded
Compliance with purchasing contracts via the selective control of consuming devices
Automatic notification of the service personnel
Levels of the power management system
Power management is the special energy point of view of an industrial plant, a functional building, or other piece of property. The view begins with the energy import, expands to its distribution and ends at the supply to the consuming devices themselves. It comprises the following levels:
Acquisition for status and measurements
Processing
Operator control and monitoring with visualization, archiving, reports, import optimization and control of switchgear
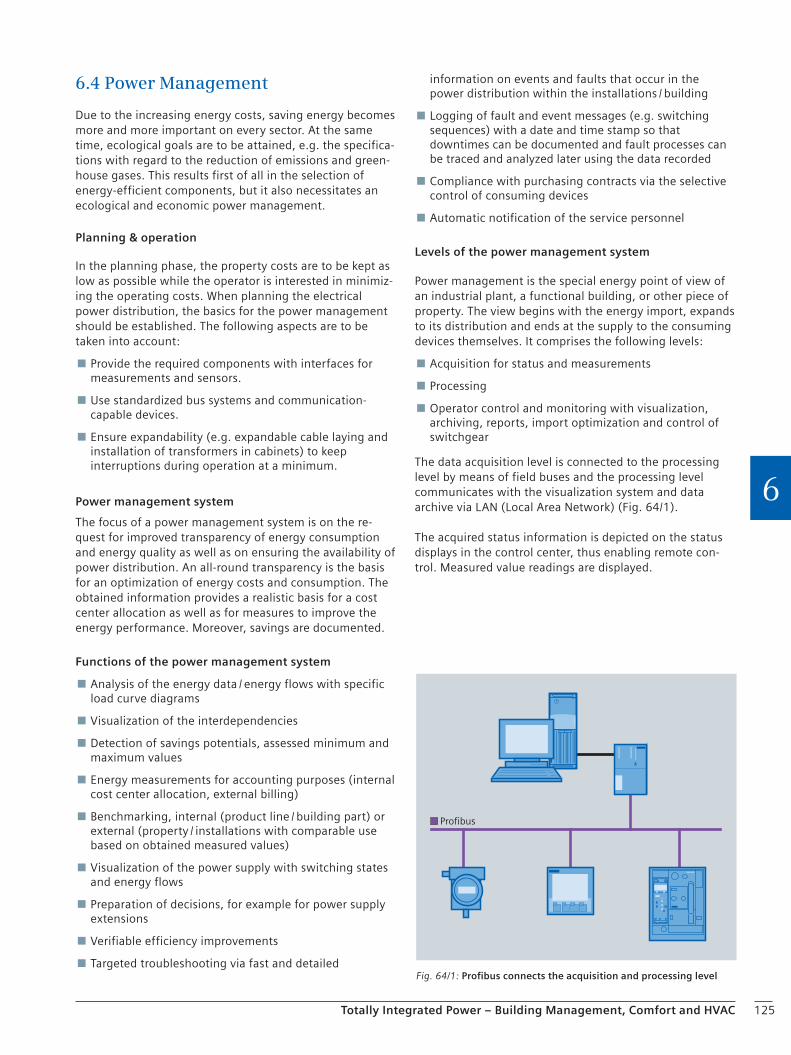
The data acquisition level is connected to the processing level by means of field buses and the processing level communicates with the visualization system and data archive via LAN (Local Area Network) (Fig. 64/1).
The acquired status information is depicted on the status displays in the control center, thus enabling remote con-trol. Measured value readings are displayed.
Profibus
Fig. 64/1: Profibus connects the acquisition and processing level

126 Totally Integrated Power – Building Management, Comfort and HVAC
6
6.4.1 Functional Description
Functional overview of the power management system
Switching status acquisition and measurements in the power distribution
Switchgear and communications
Measurements and measuring instruments
Power management module
Data acquisition and processing
Operator control and monitoring
Graphical representation
Operation and configuration
Energy import monitoring
Load management system
Data analyses
Consumption / cost allocation according to the user pays principle
Logs
Data export
Energy procurement
Electricity purchasing contracts
Gas purchasing contracts
Switching status acquisition and measurements in the power distribution
In order to command of optimum purchase / consumption quantity records during the utilization phase, the required measuring points and the power distribution components to be monitored must be planned and configured at an early stage.
Important information for that:
Types of energy
Components of the power supply (e.g. also UPS, emergency generators, etc.)
Division of the power demand according to the planned scenarios of use
For the various levels and components of power distribu-tion (Fig. 64/2), it has to be taken into account which measurements and messages are required during opera-tion as well as the various requirements for:
Critical areas / consuming devices (availability)
Billing values (plausibility, contract monitoring, cost center management)
Transparency for operation (measured values, status)
Utilization (expansions, energy import monitoring)
Fig. 64/2: Levels and components of power distribution
Plant diagram Status Messages Measured values
TransformerTapping (primary)
Supply
Feeders
Cables
Supply
Feeders
Consumingdevices
– Ove
rload
– Ove
rtem
pera
ture
– O
N / O
F
– O
N / O
FF
– Tr
ippe
d / 'F
use
tripp
ed' s
igna
l
– co
s φ–
Pow
er
– Cu
rrent
har
mon
ics
– Neu
tral c
ondu
ctor
/ gro
und
– Cu
rrent
– Vo
ltage
– Tr
ippe
d / 'F
use
tripp
ed' s
igna
l
– Ope
ratin
g cy
cle li
st
M
127
Checklist
Totally Integrated Power – Building Management, Comfort and HVAC
6
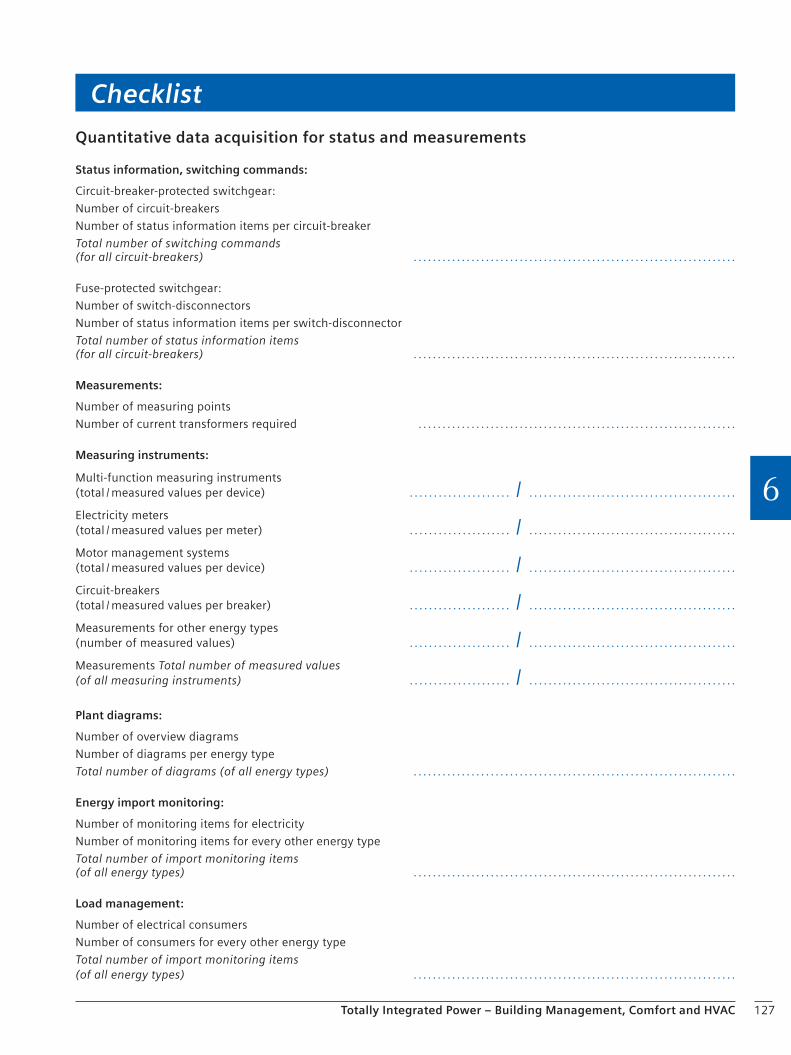
Quantitative data acquisition for status and measurements
Status information, switching commands:
Circuit-breaker-protected switchgear:
Number of circuit-breakers
Number of status information items per circuit-breaker
Total number of switching commands (for all circuit-breakers) . . . . . . . . . . . . . . . . . . . . . . . . . . . . . . . . . . . . . . . . . . . . . . . . . . . . . . . . . . . . . . . . . . .
Fuse-protected switchgear:
Number of switch-disconnectors
Number of status information items per switch-disconnector
Total number of status information items (for all circuit-breakers) . . . . . . . . . . . . . . . . . . . . . . . . . . . . . . . . . . . . . . . . . . . . . . . . . . . . . . . . . . . . . . . . . . .
Measurements:
Number of measuring points
Number of current transformers required . . . . . . . . . . . . . . . . . . . . . . . . . . . . . . . . . . . . . . . . . . . . . . . . . . . . . . . . . . . . . . . . . .
Measuring instruments:
Multi-function measuring instruments (total / measured values per device) . . . . . . . . . . . . . . . . . . . . . / . . . . . . . . . . . . . . . . . . . . . . . . . . . . . . . . . . . . . . . . . . .
Electricity meters (total / measured values per meter) . . . . . . . . . . . . . . . . . . . . . / . . . . . . . . . . . . . . . . . . . . . . . . . . . . . . . . . . . . . . . . . . .
Motor management systems (total / measured values per device) . . . . . . . . . . . . . . . . . . . . . / . . . . . . . . . . . . . . . . . . . . . . . . . . . . . . . . . . . . . . . . . . .
Circuit-breakers (total / measured values per breaker) . . . . . . . . . . . . . . . . . . . . . / . . . . . . . . . . . . . . . . . . . . . . . . . . . . . . . . . . . . . . . . . . .
Measurements for other energy types (number of measured values) . . . . . . . . . . . . . . . . . . . . . / . . . . . . . . . . . . . . . . . . . . . . . . . . . . . . . . . . . . . . . . . . .
Measurements Total number of measured values (of all measuring instruments) . . . . . . . . . . . . . . . . . . . . . / . . . . . . . . . . . . . . . . . . . . . . . . . . . . . . . . . . . . . . . . . . .
Plant diagrams:
Number of overview diagrams
Number of diagrams per energy type
Total number of diagrams (of all energy types) . . . . . . . . . . . . . . . . . . . . . . . . . . . . . . . . . . . . . . . . . . . . . . . . . . . . . . . . . . . . . . . . . . .
Energy import monitoring:
Number of monitoring items for electricity
Number of monitoring items for every other energy type
Total number of import monitoring items (of all energy types) . . . . . . . . . . . . . . . . . . . . . . . . . . . . . . . . . . . . . . . . . . . . . . . . . . . . . . . . . . . . . . . . . . .
Load management:
Number of electrical consumers
Number of consumers for every other energy type
Total number of import monitoring items (of all energy types) . . . . . . . . . . . . . . . . . . . . . . . . . . . . . . . . . . . . . . . . . . . . . . . . . . . . . . . . . . . . . . . . . . .
128 Totally Integrated Power – Building Management, Comfort and HVAC
6
6.4.2 Switchgear and Communications
The basis of each power management system are the measured values and data from the field level in which the energy in consumed. A large number of devices can already be evaluated via bus systems such as Profibus by a power management system with regard to some specific data.
Circuit-breaker-protected switchgear: circuit-breakers
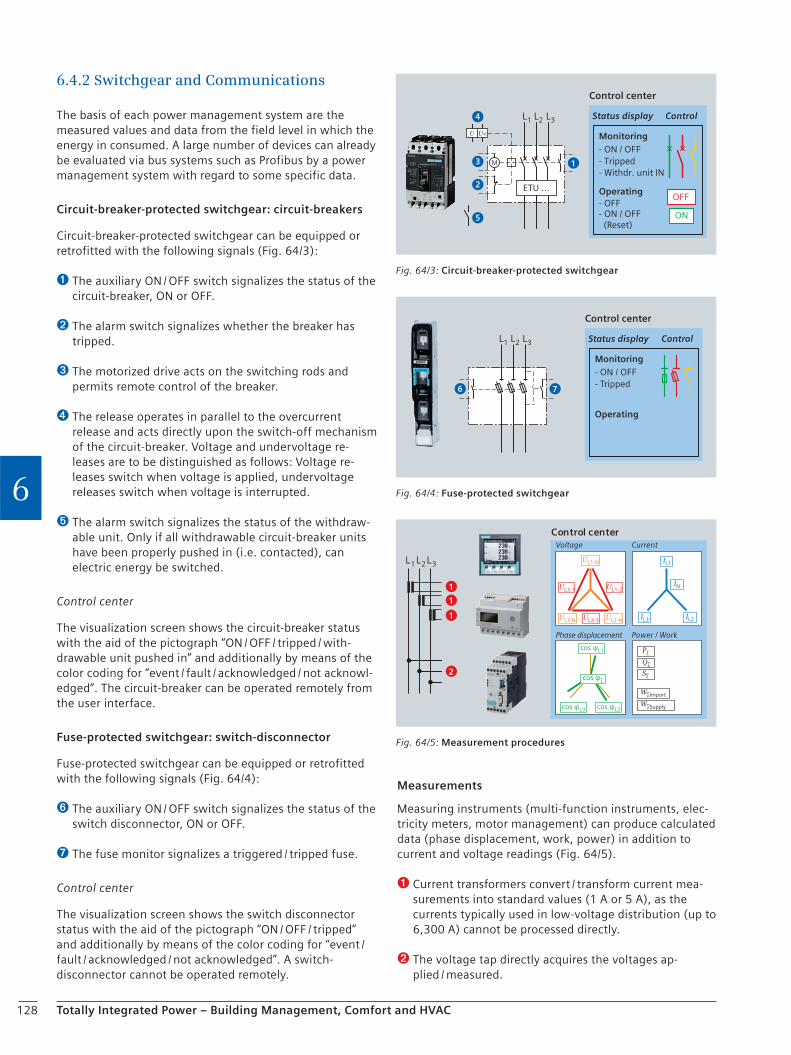
Circuit-breaker-protected switchgear can be equipped or retrofitted with the following signals (Fig. 64/3):
➊ The auxiliary ON / OFF switch signalizes the status of the circuit-breaker, ON or OFF.
➋ The alarm switch signalizes whether the breaker has tripped.
➌ The motorized drive acts on the switching rods and permits remote control of the breaker.
➍ The release operates in parallel to the overcurrent release and acts directly upon the switch-off mechanism of the circuit-breaker. Voltage and undervoltage re-leases are to be distinguished as follows: Voltage re-leases switch when voltage is applied, undervoltage releases switch when voltage is interrupted.
➎ The alarm switch signalizes the status of the withdraw-able unit. Only if all withdrawable circuit-breaker units have been properly pushed in (i.e. contacted), can electric energy be switched.
Control center
The visualization screen shows the circuit-breaker status with the aid of the pictograph “ON / OFF / tripped / with-drawable unit pushed in” and additionally by means of the color coding for “event / fault / acknowledged / not acknowl-edged”. The circuit-breaker can be operated remotely from the user interface.
Fuse-protected switchgear: switch-disconnector
Fuse-protected switchgear can be equipped or retrofitted with the following signals (Fig. 64/4):
➏ The auxiliary ON / OFF switch signalizes the status of the switch disconnector, ON or OFF.
➐ The fuse monitor signalizes a triggered / tripped fuse.
Control center
The visualization screen shows the switch disconnector status with the aid of the pictograph “ON / OFF / tripped” and additionally by means of the color coding for “event / fault / acknowledged / not acknowledged”. A switch-disconnector cannot be operated remotely.
Measurements
Measuring instruments (multi-function instruments, elec-tricity meters, motor management) can produce calculated data (phase displacement, work, power) in addition to current and voltage readings (Fig. 64/5).
➊ Current transformers convert / transform current mea-surements into standard values (1 A or 5 A), as the currents typically used in low-voltage distribution (up to 6,300 A) cannot be processed directly.
➋ The voltage tap directly acquires the voltages ap-plied / measured.
Status display Control
Monitoring
Operating
Control center
- Tripped- ON / OFF
- ON / OFF (Reset)
- OFF
- Withdr. unit IN
L1 L2 L3
OFF
ON
U U<
M 1
2
3
4
5
ETU …
Fig. 64/3: Circuit-breaker-protected switchgear
76
Status display Control
Monitoring
Operating
Control center
- Tripped- ON / OFF
L1 L2 L3
Fig. 64/4: Fuse-protected switchgear
W∑Import
W∑Supply
Control centerVoltage Current
Phase displacement Power / Work
L1 L2 L3UL1-N
UL1-2
UL3-N UL2-NUL2-3
UL3-1
IL1
IN
IL2IL3
cos φL1
cos φ∑
cos φL3 cos φL2
S∑
Q∑
P∑
1
1
1
2
Fig. 64/5: Measurement procedures
129Totally Integrated Power – Building Management, Comfort and HVAC
6
Control center
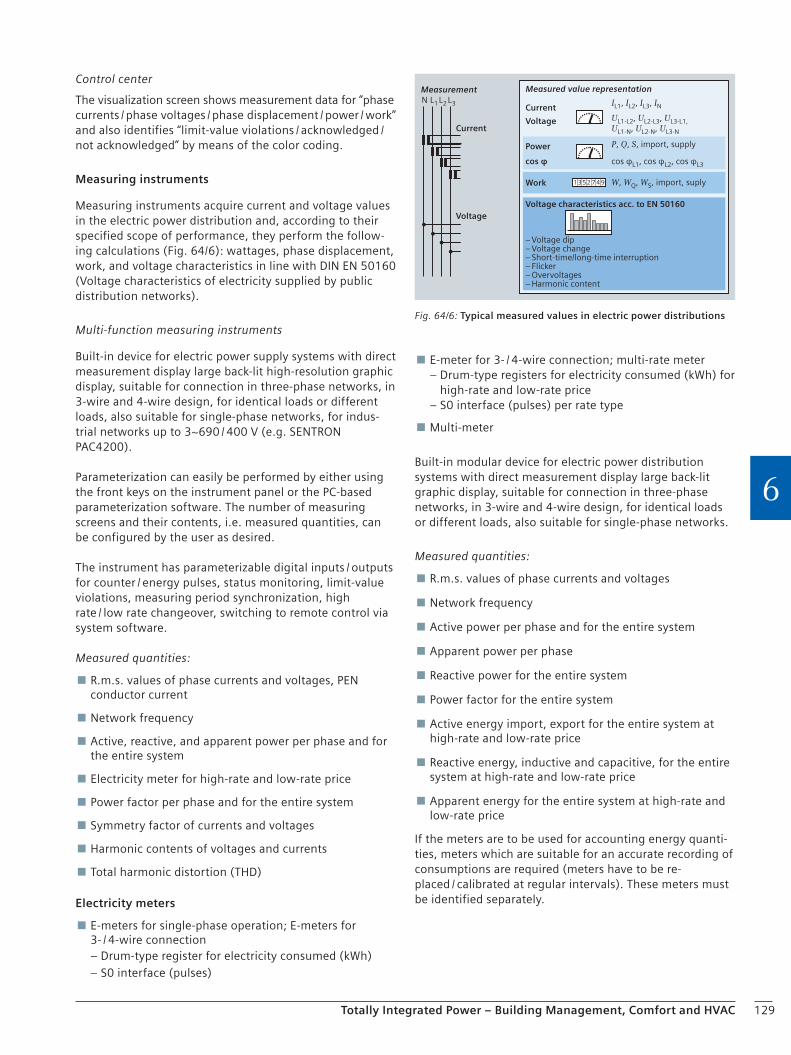
The visualization screen shows measurement data for “phase currents / phase voltages / phase displacement / power / work” and also identifies “limit-value violations / acknowledged / not acknowledged” by means of the color coding.
Measuring instruments
Measuring instruments acquire current and voltage values in the electric power distribution and, according to their specified scope of performance, they perform the follow-ing calculations (Fig. 64/6): wattages, phase displacement, work, and voltage characteristics in line with DIN EN 50160 (Voltage characteristics of electricity supplied by public distribution networks).
Multi-function measuring instruments
Built-in device for electric power supply systems with direct measurement display large back-lit high-resolution graphic display, suitable for connection in three-phase networks, in 3-wire and 4-wire design, for identical loads or different loads, also suitable for single-phase networks, for indus-trial networks up to 3~690 / 400 V (e.g. SENTRON PAC4200).
Parameterization can easily be performed by either using the front keys on the instrument panel or the PC-based parameterization software. The number of measuring screens and their contents, i.e. measured quantities, can be configured by the user as desired.
The instrument has parameterizable digital inputs / outputs for counter / energy pulses, status monitoring, limit-value violations, measuring period synchronization, high rate / low rate changeover, switching to remote control via system software.
Measured quantities:
R.m.s. values of phase currents and voltages, PEN conductor current
Network frequency
Active, reactive, and apparent power per phase and for the entire system
Electricity meter for high-rate and low-rate price
Power factor per phase and for the entire system
Symmetry factor of currents and voltages
Harmonic contents of voltages and currents
Total harmonic distortion (THD)
Electricity meters
E-meters for single-phase operation; E-meters for 3- / 4-wire connection
– Drum-type register for electricity consumed (kWh) – S0 interface (pulses)
E-meter for 3- / 4-wire connection; multi-rate meter – Drum-type registers for electricity consumed (kWh) for
high-rate and low-rate price – S0 interface (pulses) per rate type
Multi-meter
Built-in modular device for electric power distribution systems with direct measurement display large back-lit graphic display, suitable for connection in three-phase networks, in 3-wire and 4-wire design, for identical loads or different loads, also suitable for single-phase networks.
Measured quantities:
R.m.s. values of phase currents and voltages
Network frequency
Active power per phase and for the entire system
Apparent power per phase
Reactive power for the entire system
Power factor for the entire system
Active energy import, export for the entire system at high-rate and low-rate price
Reactive energy, inductive and capacitive, for the entire system at high-rate and low-rate price
Apparent energy for the entire system at high-rate and low-rate price
If the meters are to be used for accounting energy quanti-ties, meters which are suitable for an accurate recording of consumptions are required (meters have to be re-placed / calibrated at regular intervals). These meters must be identified separately.
Measured value representation
Power
cos φ
Work
Measurement
Voltage
Current
Current
Voltage
Voltage characteristics acc. to EN 50160
cos φL1, cos φL2, cos φL3
P, Q, S, import, supply
W, WQ, WS, import, suply
– Voltage dip– Voltage change– Short-time/long-time interruption– Flicker– Overvoltages– Harmonic content
IL1, IL2, IL3, IN
UL1-L2, UL2-L3, UL3-L1,UL1-N, UL2-N, UL3-N
L1 L2 L3N
1352 7 49
Fig. 64/6: Typical measured values in electric power distributions
130 Totally Integrated Power – Building Management, Comfort and HVAC
6
SIMOCODE pro motor management system
Motor management systems carry out all motor protection and control functions, collect operational, diagnostic and statistic data, and handle the communication between the automation system and the motor feeder. They are param-eterized using PC-based parameterization software.
Measured quantities:
R.m.s and maximum values of phase currents
R.m.s values of phase voltages
Active and apparent power for the entire system
Power factor for the entire system
Phase asymmetry
Circuit-breakers
The circuit-breaker (ACB) has a back-lit graphic display for direct value displaying. This display is located at the re-lease, integrated in the circuit-breaker. It can be easily parameterized using a PC-based parameterization soft-ware. The number of measuring screens and their con-tents, i.e. measured quantities, can be configured by the user as desired.
Measured quantities:
R.m.s. values of phase currents, phase voltages, and
PEN conductor current
Ground-fault current
Network frequency
Active, reactive, and apparent power per phase and for
the entire system
Power factor per phase and for the entire system
Symmetry factor of currents and voltages
Harmonic contents of voltages and currents up to the
29th order
Total harmonic distortion (THD)
Active, reactive, and apparent work for the entire
system and their direction
Measurements for other energy types
Other types of energy can be measured additionally using standard interfaces. The following standard interfaces are customary:
Analog values 0–20 mA
Analog values 4–20 mA
Analog values ±10 V
Analog values PT100 for temperatures
Pulses for energy quantities
Measured values via bus interfaces
Device drivers for multi-function measuring instruments
A device-specific block library for WinCC / PCS 7 allows for a direct view of the multi-function measuring instruments of the SENTRON family and the device status with a simple integration via Profibus communication.
Blocks are available for:
Faceplates (view) as a user interface for operator control and monitoring allow for different views to display measured values and to reset limit values for warnings and alarms.
Driver block interface to the faceplates
Diagnostic blocks
Further device drivers are available as add-ons for control systems, e.g. for SIMOCODE for motor control.
6.4.3 Power Management Module
A power management module, as add-on for control systems, provides blocks for the acquisition, preparation and representation of energy data and offers special functions up to energy-specific reports. The use of certified blocks and standard interfaces as well as means of the con-trol system provides an integrated application requiring low maintenance effort that is suited for long-term use.
Data acquisition and processing
Complete recording and standardization of energy data from different media as pulses, metered values (work values) or power values
Time synchronization or with ripple control signal
Buffering of the mean energy and power values
Calculation and archiving of the mean power and work values based on a freely definable period in the archive of the control system
Determination of the consumption trend for a period based on the current value
Open interfaces for customer-specific calculation functions (e.g. amount of heat)
Block for batch-related energy detection
131Totally Integrated Power – Building Management, Comfort and HVAC
6
6.4.4 Operator Control and Monitoring
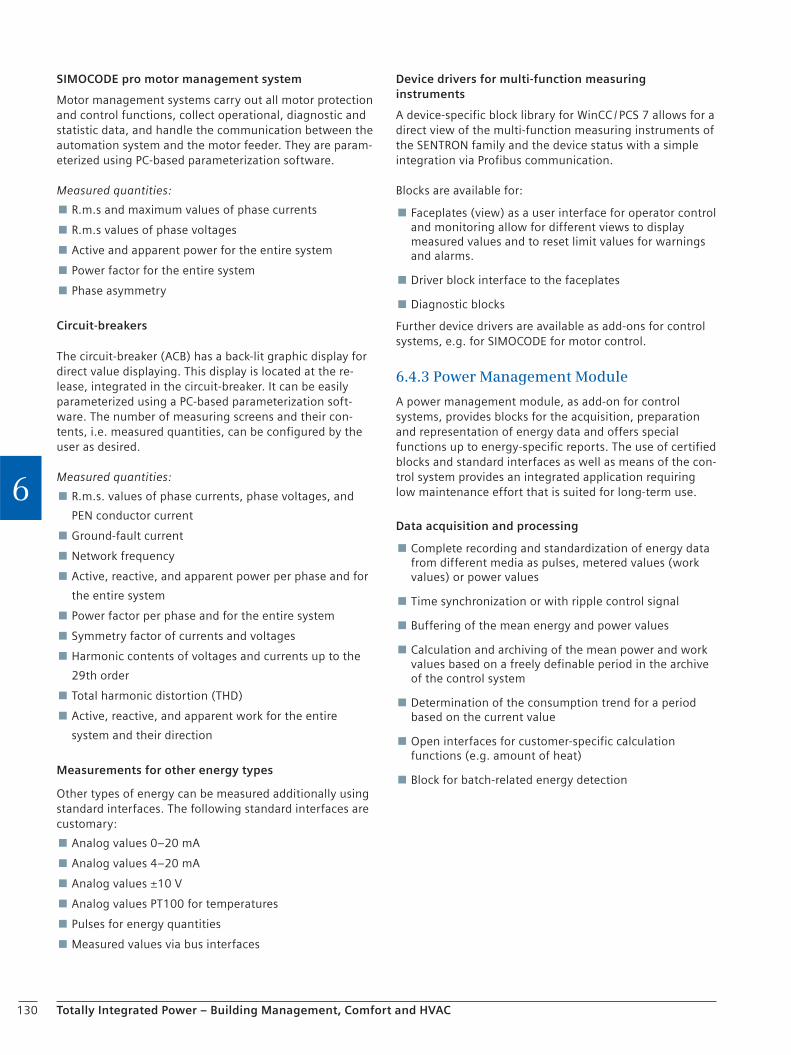
Graphic representation of plant diagrams
System information for different types of energy is visual-ized in graphics as overview or plant diagram (e.g. single-line diagram). Additional predefined, special views for devices and functions are available for that (Fig. 64/7).
Power management faceplates
A power management module provides predefined, uni-form views (faceplates) for displaying energy values, work / power values and trends for these values:
Trend view or tables for displaying the archived data
For displaying the load management data
Displaying of measured values of multi-function measuring instruments (e.g. PAC3200) or other components via device drivers
Presentation of different, general switch types via pictographs (e.g. in the single-line diagram)
Additional, predefined graphical objects which can be used in individually created graphics allow for a quick creation of views.
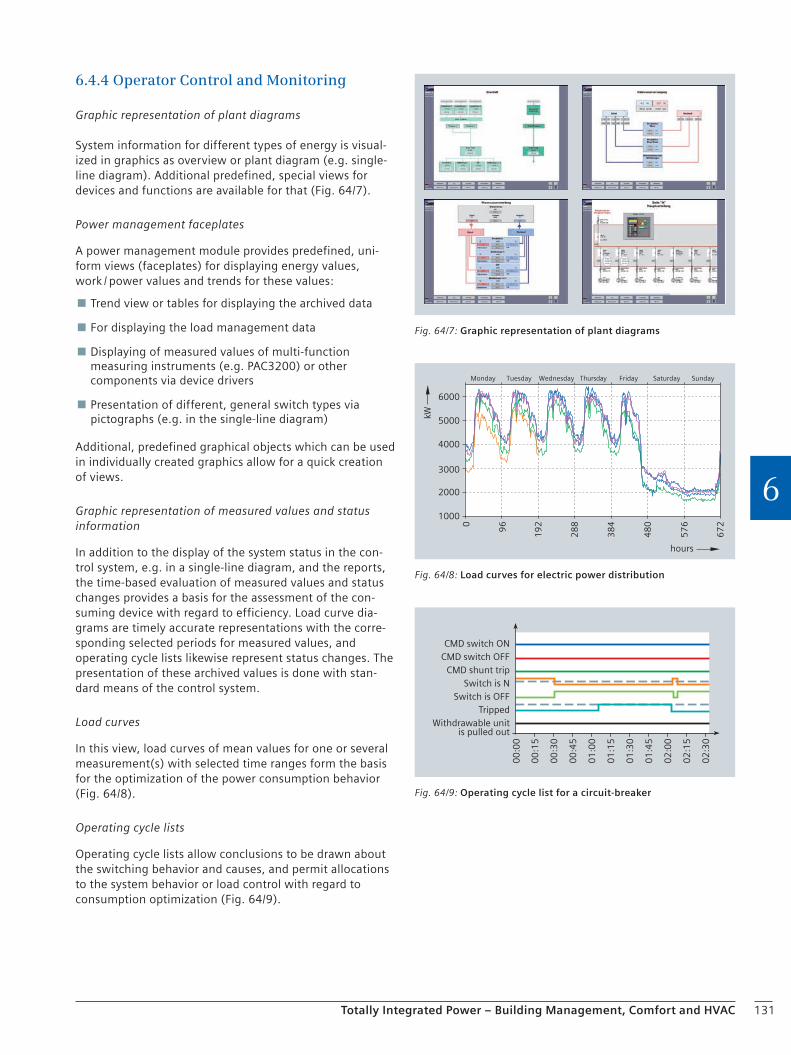
Graphic representation of measured values and status information
In addition to the display of the system status in the con-trol system, e.g. in a single-line diagram, and the reports, the time-based evaluation of measured values and status changes provides a basis for the assessment of the con-suming device with regard to efficiency. Load curve dia-grams are timely accurate representations with the corre-sponding selected periods for measured values, and operating cycle lists likewise represent status changes. The presentation of these archived values is done with stan-dard means of the control system.
Load curves
In this view, load curves of mean values for one or several measurement(s) with selected time ranges form the basis for the optimization of the power consumption behavior (Fig. 64/8).
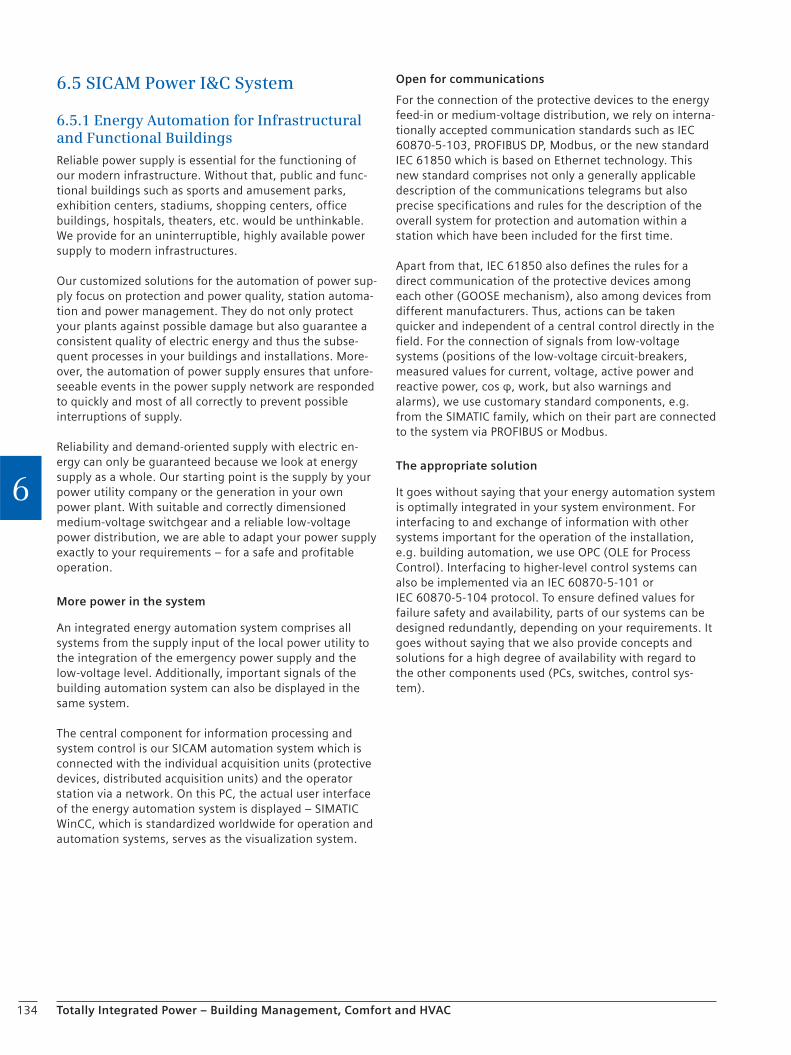
Operating cycle lists
Operating cycle lists allow conclusions to be drawn about the switching behavior and causes, and permit allocations to the system behavior or load control with regard to consumption optimization (Fig. 64/9).
Monday Tuesday Wednesday FridayThursday
hours
Saturday Sunday
1000
2000
3000
4000
5000
6000
0
96
19
2
28
8
38
4
48
0
57
6
67
2
kW
Fig. 64/8: Load curves for electric power distribution
CMD switch ONCMD switch OFF
CMD shunt tripSwitch is N
Switch is OFFTripped
Withdrawable unitis pulled out
00
:15
00
:30
00
:45
01
:00
01
:15
01
:30
01
:45
02
:00
02
:15
02
:30
00
:00
Fig. 64/9: Operating cycle list for a circuit-breaker
Fig. 64/7: Graphic representation of plant diagrams

132 Totally Integrated Power – Building Management, Comfort and HVAC
6
Event log
Status changes, operator actions, limit-value violations of measurements, system events are acquired in a central standard archive and can be displayed in the respective views, filtered selectively (Fig. 64/10).
The storage in a standard archive allows for access to this data also from a control system.
Operation and configuration
For an extended ease of use, the faceplates comprise functions for
the entry of manually detected measured values,
the correction of work values in the database, and
a user-friendly configuration of the load management parameters.
Switching
As an active component to the functions for status moni-toring, general switches are provided with operating functions for switching in addition to the switching status (status, switching command, reset).
Control system
The presentation of further measurements and status information beyond the power management module can be implemented in the control system (Fig. 64/11). Access to information from the power management module is possible by using standard archives and interfaces of the control system.
Energy import monitoring
Load management systems monitor the power limits agreed within the scope of the purchasing contract and help avoid load peaks via an automatic load management in order to prevent any resulting extra costs. Costs can additionally be saved by avoiding and shifting load peaks from high-load to low-load times, i.e. by achieving evenly loaded load profiles.
The basic functionality of a load management system is automatic trend calculation based on the current consump-tion and the continuous comparison with a specified power limit (Fig. 64/12). Dependent on this result, pre-defined consuming devices are either blocked or released according to their priority, i.e. disconnected or connected, in order to keep the power limit (mean value of the power over a contractually defined period, typically 15 min for current) agreed with the power utility.
Fig. 64/10: Event log from the central standard archive
Monitoring status– ON / OFF– tripped
Operating switching– OFF– ON / OFF / Reset
Monitoring measured value– Actual-value display– Limit value display
Monitoring status– ON / OFF– Fuse tripped
OFF
ON
110 A
Power distribution Operating cycles list
Load curves
Operating cycles list
Event log
Date ident. Time ident. Site ident. Plant ident. Device ident. Function ident. Event text2000.01.14 22:59:03 Hall B Infeed Q1.0 local OFF Infeed switch switched off locally
Infeed switch switched off locally2000.01.14 23:16:24 Hall B Infeed Q1.0 local ON2000.01.20 01:12:45 Hall B Outgoing circuit T7.3 UG2 Current > 20 A 2000.01.20 01:17:13 Hall B Outgoing circuit T7.3 UG1 Current > 50 A 2000.01.15 20:59:33 Hall F Outgoing circuit Q12.1 local OFF Switch disconnector switched off locally
centralON / OFF
localON / OFF
tripped
localON / OFF
tripped
T7.3
Q12.4
Q1.0P [kW]
t
t
t
G
OFF
ON
110 A
Fig. 64/11: Operator control and monitoring in an electric power distribution system
Site x Priorities list e Consumptioncontrol
1 Consumer a
2 Consumer b
3 Consumer c
n Consumer x
rele
ase
bloc
k ON OFF
ReleaseBlocking
Feed-back
ForcedON
t150
P
M
Fig. 64/12: Energy import monitoring – priority list control

133Totally Integrated Power – Building Management, Comfort and HVAC
6
The characteristics for a load management system are the following:
Automatic and manual mode
Consumption rates management
Switching and / or signaling according to priority list for consuming devices
Rolling switching of consuming devices
Configuration to adapt to the given process conditions
Characteristic data for system or consumption behavior (e.g. hysteresis, delay, off-time, ON / OFF switching times)
Clear display and user-friendly configuration of the load management parameters directly in the faceplate
Configurable warnings / alarm messages (switching recommendation, critical states)
Analyses
A power management module provides various preconfig-ured functions for the analysis of energy data.
Exports
For the creation of predefined standard reports and the export of data, e.g. to process them in higher-level sys-tems, the data export into an Excel format is available:
Predefined macros for the export of data to Excel
Export of archived consumption data
Predefined Excel reports (in form of a table and as a bar diagram) for the evaluation of consumption data, consumption / cost allocation according to the user pays principle (rates, cost centers)
Linking of measured values via formulas
Reports
Predefined reports allow for a quick presentation of the evaluated energy data.
Evaluation of the consumption data based on specified cost center / rate reports which state where and for which product or for which cost center the respective energy consumption has accrued and which allow for benchmarking, for example.
Determination of the load duration curve based on the acquired mean power value reports which show the continuity of the use of energy and thus potential for optimizations.
Reports can be configured as:
Ad hoc protocols
Cyclic protocols for the creation of daily, weekly and monthly reports
In addition to this, reports on energy data can be gener-ated with standard means on the control system via open interfaces.
These can then also be combined to comprehensive re-ports with the other acquired data of the system (status, measurements) (Fig. 64/13).
6.4.5 Energy Procurement
Electricity purchasing contracts
Two types of purchasing contracts are currently typical for the procurement of electricity:
96-hour power metering for an annual consumption > 10,000 kWh / a and a connected load < 30 kW
¼-hour power metering > 30 kW
In quarter-hourly power metering contracts, kilowatt-per-hour rates and demand charges are agreed on and may be further subdivided (e.g. into high-rate and low-rate prices).
Gas purchasing contracts
Gas purchasing contracts are hour-based contracts, includ-ing a standing charge (€ / a) and a kilowatt-per-hour rate (€ / kWh) for energy quantities supplied.
SIEMENS
SIEMENS
SIEMENS
powerrate Reporting
Time setting
Consumption data
Start Time:End Time:Time Aggregation:Time Zone:
Cost center 1Cost center 1Cost center 11Cost center 21Cost center 30Cost center 32
Total
Consumption [kWh] Costs [€]
NoneLocal time
powerrate Reporting
Time setting
Start Time:End Time:Time Aggregation:Time Zone:
NoneLocal time
Reports
Con
sum
ptio
n [
kWh
]
powerrate Reporting
Time setting
Consumption data
Start Time:End Time:Time Aggregation:Time Zone:
NoneLocal time
Cost center 1 Cost center 11 Cost center 21
Cost center
Consumption [kWh] Costs [€]
Cost center 30 Cost center 32
020
60
120140
20 40 60 80 100 120 140 160 180
0 000,00
0 100,00
0 200,00
0 300,00
0 400,00
0 500,00
0 600,00
11,18 15,32 14,11 8,95 18,93
40
10080
05.10.2007
11:14:00 04:11:200613:16:00 04:11:2006
0.319,320.437,660,403,100.255,720.540,99
1.160,07
11,1815,3214,11 8,9518,93
40,60
11:16:00 08:11:200613:16:00 08:11:2006
19.07.2007
11:16:00 08:11:200613:16:00 08:11:2006
0
Fig. 64/13: Example of a report of status indications and measured values
134 Totally Integrated Power – Building Management, Comfort and HVAC
6
6.5 SICAM Power I&C System
6.5.1 Energy Automation for Infrastructural and Functional Buildings
Reliable power supply is essential for the functioning of our modern infrastructure. Without that, public and func-tional buildings such as sports and amusement parks, exhibition centers, stadiums, shopping centers, office buildings, hospitals, theaters, etc. would be unthinkable. We provide for an uninterruptible, highly available power supply to modern infrastructures.
Our customized solutions for the automation of power sup-ply focus on protection and power quality, station automa-tion and power management. They do not only protect your plants against possible damage but also guarantee a consistent quality of electric energy and thus the subse-quent processes in your buildings and installations. More-over, the automation of power supply ensures that unfore-seeable events in the power supply network are responded to quickly and most of all correctly to prevent possible interruptions of supply.
Reliability and demand-oriented supply with electric en-ergy can only be guaranteed because we look at energy supply as a whole. Our starting point is the supply by your power utility company or the generation in your own power plant. With suitable and correctly dimensioned medium-voltage switchgear and a reliable low-voltage power distribution, we are able to adapt your power supply exactly to your requirements – for a safe and profitable operation.
More power in the system
An integrated energy automation system comprises all systems from the supply input of the local power utility to the integration of the emergency power supply and the low-voltage level. Additionally, important signals of the building automation system can also be displayed in the same system.
The central component for information processing and system control is our SICAM automation system which is connected with the individual acquisition units (protective devices, distributed acquisition units) and the operator station via a network. On this PC, the actual user interface of the energy automation system is displayed – SIMATIC WinCC, which is standardized worldwide for operation and automation systems, serves as the visualization system.
Open for communications
For the connection of the protective devices to the energy feed-in or medium-voltage distribution, we rely on interna-tionally accepted communication standards such as IEC 60870-5-103, PROFIBUS DP, Modbus, or the new standard IEC 61850 which is based on Ethernet technology. This new standard comprises not only a generally applicable description of the communications telegrams but also precise specifications and rules for the description of the overall system for protection and automation within a station which have been included for the first time.
Apart from that, IEC 61850 also defines the rules for a direct communication of the protective devices among each other (GOOSE mechanism), also among devices from different manufacturers. Thus, actions can be taken quicker and independent of a central control directly in the field. For the connection of signals from low-voltage systems (positions of the low-voltage circuit-breakers, measured values for current, voltage, active power and reactive power, cos φ, work, but also warnings and alarms), we use customary standard components, e.g. from the SIMATIC family, which on their part are connected to the system via PROFIBUS or Modbus.
The appropriate solution
It goes without saying that your energy automation system is optimally integrated in your system environment. For interfacing to and exchange of information with other systems important for the operation of the installation, e.g. building automation, we use OPC (OLE for Process Control). Interfacing to higher-level control systems can also be implemented via an IEC 60870-5-101 or IEC 60870-5-104 protocol. To ensure defined values for failure safety and availability, parts of our systems can be designed redundantly, depending on your requirements. It goes without saying that we also provide concepts and solutions for a high degree of availability with regard to the other components used (PCs, switches, control sys-tem).

135Totally Integrated Power – Building Management, Comfort and HVAC
6
6.5.2 Energy Automation made by Siemens – Custom-made Power
Our energy automation systems are always designed and optimized for the respective requirements of our custom-ers. Since substantial parts of the system are based on standard components, we are able to scale the system in every respect. Thus, we provide a comprehensive solution spectrum – from the pure visualization of the power supply to the professional power management system with spe-cific control functions and algorithms for the energy flows. All functions pursue a common goal: They are supposed to prevent unintentional interruptions of the power supply and thus possible hazards for persons and machines. The cost-optimal control of energy across the entire installation is another main task of the system.
Our energy automation systems provide the following function blocks:
Protection and automation of the power supply
Acquisition and storage of parameters of the power supply system
Monitoring and control of the entire power supply system (SCADA)
Alarm management and logging function
Comprehensive analyses
Load management including power generation control
Load shedding in the case of overload and crises
Automatic load restoration
Power quality monitoring
Power management
Operator station
Remote access
Corporatenetwork
Printer
Medium-voltageswitchgear 1
Low-voltage main distribution
Buildingautomationsystem
Medium-voltageswitchgear 2
Medium-voltageswitchgear 3
Low-voltage main distribution Low-voltage main distribution
FirewallGPS Router
Fig. 65/1: Our solutions integrate all voltage levels and all the information required from the environment of the power supply in a system

136 Totally Integrated Power – Building Management, Comfort and HVAC
6
6.5.3 One System – Many Advantages
System integration
One look at the overall system quickly shows the fault – and how it can be cleared as quickly as possible. With our energy automation, you control and monitor your low-volt-age and medium-voltage switchgear in one system, on one screen – it could not be any clearer.
Central operator control and monitoring
Work comfortably from one operator station. And in the case of an emergency, inform all relevant stations fully automatically, quickly and specifically, via SMS or by e-mail. Thus, an occurring fault can be detected at an early stage and a possible failure of the power supply be pre-vented by a quick and correct intervention.
Short response times
Since all information of the entire network is available at one central point, a quick response is possible if faults occur. Moreover, there are no long distances which have to be covered in order to isolate installation components and make switchovers.
High reliability of supply
Reduce the risk of supply interruption by specifically dis-connecting less important installation components. Built-in load shedding functions support you in the case of insta-bilities of the power supply (e.g. unbalanced loads or overloads).
Optimal use of electric energy
Specific load management functions ensure that exactly that amount of energy is available which is just required. Discover unnecessary energy consumption and avoid it with appropriate measures.
High degree of availability and safety
The use of specifically tested components and standards not only ensures a high degree of availability and opera-tional safety of the power supply but also of the individual areas within your scope of responsibility. The degree of automation is optimally adapted to your processes because the partial or complete automation of certain procedures guarantees a high degree of availability and safety in operation, which has a direct influence on the overall avail-ability of your installations.
Partnership with power
We are represented in almost all countries in the world and on all continents. With this global network, we are able to support you in the implementation of a customized energy automation virtually all over the world.
Fig. 65/2: The energy automation portfolio pyramid – an integrated product range which allows for holistic, scalable customer solutions

137
Checklist
Totally Integrated Power – Building Management, Comfort and HVAC
6
Energy automation system
Project data:
c Name
c End customer
c Planning engineer / EPC / consultant
c Installation type
c City / Country
c New project
c Expansion
Existing documentation:
c Specification / concept
c Network study
c Single-line
c Topology plan
Systems to be connected or possibly already existing (manufacturer):
c Protection
c Substation automation
c Power quality
c Control center
c Process automation
c Other
Existing customer generation (type and power):
Topology:
c Number of substations
c Number of voltage levels
c Number of transformers (feed-in / distribution transformers)
c Number of supply panels
c Number of feeder panels
c Number of coupling panels
c Number of signals / IOs (digital / analog)
c . . . . . . . . . . . . . . . . . . . . . . . . . . . . . . . . . . . . . . . .
Required control system functions:
c Alarm management
c Archiving
c Monitoring and control (SCADA)
c Power management
c Cost center allocation
c Load shedding
c Load management
c Switching sequences
c Fault record processing
c Synchronization
c Transformer tap control
c Switch interlockings
c . . . . . . . . . . . . . . . . . . . . . . . . . . . . . . . . . . . . . . . .
Preferred system:
c Software solution (PC-based)
c Hardware solution (subrack-based)
c . . . . . . . . . . . . . . . . . . . . . . . . . . . . . . . . . . . . . . . .
Required communication protocols:
c IEC 61850 Client
c IEC 60870 101 (Master / Slave)
c IEC 60870 103 Master
c IEC 60870 104 (Master / Slave)
c DNP 3.0 (Master / Slave) (over IP)
c Modbus
c OPC (Server / Client)
c PROFIBUS DP
c SNMP
c . . . . . . . . . . . . . . . . . . . . . . . . . . . . . . . . . . . . . . . .
Required interfaces / data transmission rates (number and type):
c Distance bay devices – control system . . . . . . . . . . . m
c Electrical / optical waveguide

138
Checklist
Totally Integrated Power – Building Management, Comfort and HVAC
6
c Ethernet
c Radio
c Serial
c . . . . . . . . . . . . . . . . . . . . . . . . . . . . . . . . . . . . . . . .
Visualization system – Human Machine Interface (HMI):
c Number of control centers
c Number of local workplaces
c Option for laptop connection
c Number of monitors per workplace
c . . . . . . . . . . . . . . . . . . . . . . . . . . . . . . . . . . . . . . . .
Other requirements:
c Redundancy
c Firewall
c Security
c Explosion-proof area
c Special environmental conditions (e.g. temperature / humidity)
c . . . . . . . . . . . . . . . . . . . . . . . . . . . . . . . . . . . . . . . .
Schedule / dates:
c Invitation to tender / concept
c Submission of quotation
c Commissioning
c Start of production / use
c . . . . . . . . . . . . . . . . . . . . . . . . . . . . . . . . . . . . . . . .
Contact person:
c Name
c Company / department
c Address
c Telephone
c Mobile
c E-mail
c . . . . . . . . . . . . . . . . . . . . . . . . . . . . . . . . . . . . . . . .
. . . . . . . . . . . . . . . . . . . . . . . . . . . . . . . . . . . . . . . . . . . . . . . . . . . . . . . . . . . . . . . . .
. . . . . . . . . . . . . . . . . . . . . . . . . . . . . . . . . . . . . . . . . . . . . . . . . . . . . . . . . . . . . . . . .
. . . . . . . . . . . . . . . . . . . . . . . . . . . . . . . . . . . . . . . . . . . . . . . . . . . . . . . . . . . . . . . . .
. . . . . . . . . . . . . . . . . . . . . . . . . . . . . . . . . . . . . . . . . . . . . . . . . . . . . . . . . . . . . . . . .
. . . . . . . . . . . . . . . . . . . . . . . . . . . . . . . . . . . . . . . . . . . . . . . . . . . . . . . . . . . . . . . . .
. . . . . . . . . . . . . . . . . . . . . . . . . . . . . . . . . . . . . . . . . . . . . . . . . . . . . . . . . . . . . . . . .
. . . . . . . . . . . . . . . . . . . . . . . . . . . . . . . . . . . . . . . . . . . . . . . . . . . . . . . . . . . . . . . . .
. . . . . . . . . . . . . . . . . . . . . . . . . . . . . . . . . . . . . . . . . . . . . . . . . . . . . . . . . . . . . . . . .
. . . . . . . . . . . . . . . . . . . . . . . . . . . . . . . . . . . . . . . . . . . . . . . . . . . . . . . . . . . . . . . . .
. . . . . . . . . . . . . . . . . . . . . . . . . . . . . . . . . . . . . . . . . . . . . . . . . . . . . . . . . . . . . . . . .
. . . . . . . . . . . . . . . . . . . . . . . . . . . . . . . . . . . . . . . . . . . . . . . . . . . . . . . . . . . . . . . . .
. . . . . . . . . . . . . . . . . . . . . . . . . . . . . . . . . . . . . . . . . . . . . . . . . . . . . . . . . . . . . . . . .
. . . . . . . . . . . . . . . . . . . . . . . . . . . . . . . . . . . . . . . . . . . . . . . . . . . . . . . . . . . . . . . . .
. . . . . . . . . . . . . . . . . . . . . . . . . . . . . . . . . . . . . . . . . . . . . . . . . . . . . . . . . . . . . . . . .
. . . . . . . . . . . . . . . . . . . . . . . . . . . . . . . . . . . . . . . . . . . . . . . . . . . . . . . . . . . . . . . . .
. . . . . . . . . . . . . . . . . . . . . . . . . . . . . . . . . . . . . . . . . . . . . . . . . . . . . . . . . . . . . . . . .
. . . . . . . . . . . . . . . . . . . . . . . . . . . . . . . . . . . . . . . . . . . . . . . . . . . . . . . . . . . . . . . . .
. . . . . . . . . . . . . . . . . . . . . . . . . . . . . . . . . . . . . . . . . . . . . . . . . . . . . . . . . . . . . . . . .
. . . . . . . . . . . . . . . . . . . . . . . . . . . . . . . . . . . . . . . . . . . . . . . . . . . . . . . . . . . . . . . . .
. . . . . . . . . . . . . . . . . . . . . . . . . . . . . . . . . . . . . . . . . . . . . . . . . . . . . . . . . . . . . . . . .
. . . . . . . . . . . . . . . . . . . . . . . . . . . . . . . . . . . . . . . . . . . . . . . . . . . . . . . . . . . . . . . . .
. . . . . . . . . . . . . . . . . . . . . . . . . . . . . . . . . . . . . . . . . . . . . . . . . . . . . . . . . . . . . . . . .
. . . . . . . . . . . . . . . . . . . . . . . . . . . . . . . . . . . . . . . . . . . . . . . . . . . . . . . . . . . . . . . . .
. . . . . . . . . . . . . . . . . . . . . . . . . . . . . . . . . . . . . . . . . . . . . . . . . . . . . . . . . . . . . . . . .
. . . . . . . . . . . . . . . . . . . . . . . . . . . . . . . . . . . . . . . . . . . . . . . . . . . . . . . . . . . . . . . . .
. . . . . . . . . . . . . . . . . . . . . . . . . . . . . . . . . . . . . . . . . . . . . . . . . . . . . . . . . . . . . . . . .
. . . . . . . . . . . . . . . . . . . . . . . . . . . . . . . . . . . . . . . . . . . . . . . . . . . . . . . . . . . . . . . . .
. . . . . . . . . . . . . . . . . . . . . . . . . . . . . . . . . . . . . . . . . . . . . . . . . . . . . . . . . . . . . . . . .