
1441 - DIW Berlin: Startseite · PDF fileDiscussion Papers Financing LNG Projects and the Role...
20
Discussion Papers Financing LNG Projects and the Role of Long-Term Sales-and-Purchase Agreements Sophia Ruester 1441 Deutsches Institut für Wirtschaftsforschung 2015
-
Upload
truongcong -
Category
Documents
-
view
215 -
download
0
Transcript of 1441 - DIW Berlin: Startseite · PDF fileDiscussion Papers Financing LNG Projects and the Role...
Discussion Papers
Financing LNG Projects and the Role of Long-Term Sales-and-Purchase Agreements
Sophia Ruester
1441
Deutsches Institut für Wirtschaftsforschung 2015

Opinions expressed in this paper are those of the author(s) and do not necessarily reflect views of the institute. IMPRESSUM © DIW Berlin, 2015 DIW Berlin German Institute for Economic Research Mohrenstr. 58 10117 Berlin Tel. +49 (30) 897 89-0 Fax +49 (30) 897 89-200 http://www.diw.de ISSN electronic edition 1619-4535 Papers can be downloaded free of charge from the DIW Berlin website: http://www.diw.de/discussionpapers Discussion Papers of DIW Berlin are indexed in RePEc and SSRN: http://ideas.repec.org/s/diw/diwwpp.html http://www.ssrn.com/link/DIW-Berlin-German-Inst-Econ-Res.html
Financing LNG Projects and the Role of Long-Term Sales-and-Purchase Agreements
Sophia Ruester1
Last update: January 2015
ABSTRACT
The financing of infrastructures is a major topic in recent energy policy debates. Project finance, as a specialized form of debt finance, thereby has become a well-established financing tool. This paper contributes a qualitative and quantitative analysis of the determinants of the debt ratio in project finance, using data on 26 liquefied natural gas (LNG) export and import projects. We argue that lenders will make their decision on how much to lend dependent on the risk profile of the project. In this vein, a project’s off-take agreements serve as a security for financial contracts. We empirically show that the debt ratio of an LNG project decreases with increasing risks associated to future cash flows. Estimation results confirm that leverage increases with higher shares of a project’s capacity sold under long-term sales-and-purchase agreements, with a lower capital outlay of the project, and with a lower risk index of the country where the project is located.
KEYWORDS
Project finance, debt ratio, long-term contracts, liquefied natural gas
JEL CLASSIFICATION
C21, G32, L22, L95
1 German Institute for Economic Research (DIW Berlin), Mohrenstrasse 58, 10117 Berlin, Germany. Contact: [email protected].
Acknowledgements: The author thanks Aleksandar Zaklan, Sebastian Schwenen, Seabron Adamson, Anne Neumann, Christian von Hirschhausen and participants of a Brown Bag Seminar at DIW Berlin for helpful comments and suggestions. Special thanks also go to Anne Neumann for providing a substantial part of the database on long-term sales and purchase agreements in the LNG industry. The usual disclaimer applies.

1
1. Introduction
The financing of infrastructure projects is a major topic in recent energy policy debates as the transition towards a decarbonized economy requires substantial investments, including investments into low-carbon technologies and renewable projects, but also investments into related infrastructures such as electricity grid expansions or natural gas supply assets. During the 1990s, project finance, as a specialized form of debt finance which involves the creation of a legally independent project company by one or more sponsoring firms, and where debt is secured by the project’s cash flows, has seen a rise in applications (see e.g. Brealey et al., 1996). It has become a well-established financing tool – especially for capital-intensive assets with a particular purpose such as power plants, oil and gas exploration & production sites, or pipelines. At the same time also the sources of project finance broadened to include the capital markets (Davis, 2003).
This development initiated considerable research effort encompassing the many interdisciplinary aspects related to this financing tool – from firms’ capital structure decisions and debt financing, over project management and organizational behavior, to contractual arrangements surrounding a company and firm governance. See Gatti (2013) for a comprehensive overview on project finance in theory and practice. Kayser (2013) summarizes methodological aspects of the instrument and implementation challenges for specific applications.
At first glance, the observed use of project finance seems to be incompatible with the classical theorem of Modigliani and Miller (1958), who argue that corporate financing decisions should not affect firm value.2 In reality, however, firms actively choose among on-balance-sheet corporate finance and off-balance-sheet project finance, and show widely varying levels of debt. High leverage actually is interesting as interest rates are tax deductible, while dividends are not, lowering the total cost of financing. Moreover, as introduced by Jensen and Meckling (1976) and intensively discussed in the 1980s, the presence of risky debt in a firm’s capital base is known to lead to ex-post conflicts of interest between equity and debt holders. Project finance is one effective tool to reduce such agency costs (see e.g. Sha and Thakor, 1987; Berkovitch and Kim, 1990; Esty, 2003). Likewise, financing risky assets via a separate legal entity with non-recourse debt reduces the risk of underinvestment due to managerial risk aversion; it “allows firms to truncate large left-hand tail outcomes” (Esty, 2004).
Project finance moreover is interesting from the sponsors’ perspective, as first, the project is financed with limited recourse back to the sponsors, insulating corporate assets from project risk; and second, a large amount of debt can be generated for the project company while at the same time preserving the parent company’s debt-to-equity ratio and thus protecting corporate borrowing capacity. A typical project company has a debt-to-total-capitalization ratio of about 70%, as compared to 35% for conventional corporate financing (Esty, 2004). Moreover, it allows the realization of projects being too big for one sponsor. On the other hand, project finance is interesting from the lenders’ perspective whenever future cash flows are well-predictable. Project credit risk can be considerably lower than a sponsor’s individual credit risk.
Literature related to the energy sector is quite limited. Pollio (1998) investigates the motivations of different types of sponsors to finance energy projects via project finance. He identifies risk
2 Underlying assumptions include a perfect capital market in equilibrium, a random walk market price process, as well as the absence of taxes, asymmetric information and agency costs.
2
management as well as higher fund-raising enabled through high leverage as key reasons to favor project- over corporate finance. Mills and Taylor (1994) and Lüdeke-Freund and Loock (2011) analyze renewable energy projects with a particular focus on risk factors relevant for lenders. Looking at renewable projects, too, Kann (2009) categorizes possible barriers to project finance, including regulatory risks and limited capital availability resulting from the recent global credit crisis. Davis (2003) adds to the literature a comprehensive qualitative discussion of case studies from various sectors, among them pipelines and refineries. Dailami and Hauswald (2000) analyze risk shifting as a consequence of contractual incompleteness and relate its sources to the price of risky debt in the context of project finance. Scannella (2012) examines the development of new financing models for large European energy infrastructure projects. He concludes that project bonds can be a useful long-term financial instrument to mobilize the necessary funding to meet the EU’s strategic energy infrastructure needs.
Empirical studies on project finance are rather scarce, last but not least due to the difficulty of data collection (Kayser, 2013). Our contribution to the literature is therefore a both qualitative and quantitative analysis of the determinants of the debt ratio in project-financed liquefied natural gas (LNG) projects. We build on Pierru et al. (2013) who examine the impact of country risk and selected project characteristics on ownership structure and debt ratio of gas pipeline as well as LNG projects. We develop their reasoning further, arguing that (i) lenders will make their decision on how much to lend dependent on the risk profile of the project, and (ii) in this vein, the firm should be understood as a ‘nexus of contracts’3. Off-take contracts of a project, for instance, determine future cash flows and thus effectively serve as a security for financial contracts. In fact, the independent project companies are an attractive object of analysis for studying a particular financial structure because they provide a relatively clear picture on structural details and management decisions on various contractual arrangements.
The paper is organized as follows. Section 2 gives an overview on project finance in the LNG industry. We discuss the determinants of the debt ratio in LNG project finance by identifying major risk factors which impact a project’s future cash flow stream and derive testable propositions. Section 3 introduces the dataset and methodology. We present and interpret estimation results in Section 4 before concluding in Section 5.
2. Project finance in the LNG industry
2.1. Industry context and the role of project finance
Converting natural gas to LNG for transportation by tanker has been utilized for 50 years now. Since the 1990s, investments in LNG infrastructure grew rapidly as worldwide natural gas demand increased, leading to the realization of substantial economies of scale throughout the value chain. The industry achieved a remarkable level of global trade in the 2000s (see e.g. Ruester, 2013). Today, the Middle East accounts for more than 40% of worldwide proven natural gas reserves and has become the largest exporter of LNG (IEA, 2014). It is currently evolving to a swing producer; deliveries to European and Asian markets and even to North America are feasible.
3 The understanding of a firm as a ‘nexus of contracts’ goes back to Ronald Coase’s seminal article on The Nature of the Firm (Coase, 1937), and has since then been developed continuously in economic literature.
3
Project finance is a common way to realize LNG projects – both upstream liquefaction (export) as well as downstream regasification (import) assets. During the first decade of the 2000s alone, about 100 mtpa of new LNG capacity4 – out of about 240 mtpa of added capacity in total – have been developed based on such arrangements (Ledesma et al., 2013).
Project finance is an attractive financing tool for LNG projects for a number of reasons. First, LNG projects involve very capital-intensive upfront investments. These are in the range of 250mn to 1bn USD for import projects, and of 1bn up to even more than 20bn USD for export projects. Second, LNG projects have one, or a consortium of few, project sponsors. These involve mainly companies with commercial ties to the project, such as oil and gas majors, natural gas import and supply companies as well as some power utilities integrating upstream in order to secure fuel imports. Third, the technologies of natural gas liquefaction and regasification are well-known and established since decades, reducing technological risk substantially.5 Fourth, cash flow generation relies on one major revenue stream, i.e. the natural gas throughput.6 And finally, especially for national oil and gas companies, the use of project finance may lower the cost of debt as the resulting project credit risk in some cases is evaluated lower than the sponsor’s own credit risk.
Debt is provided by a syndicate of lenders (such as commercial banks, pension funds, investors in the public bond market, export credit agencies and government-backed lending institutions), who differ in terms of the amounts they lend, lending conditions as well as the ranking in the order of repayment. For institutional investors, project finance offers a way to diversify and earn acceptable (and uncorrelated) returns for the amount of risk taken.
Long-term sales-and-purchase agreements among LNG exporters and importers, linked to specific export and import infrastructures and determining respective capacity use, are usually signed ahead of financial contracts. They cover contract periods of about 15 to 25 years (Neumann et al., 2015), thus exceeding the typical loan duration which is in the range of seven to 15 years (de Saint Gerand, 2013). Prior to the completion of construction, shareholders in general have to provide financial guarantees to the lending institutions. Once the project enters successfully its operation phase, recourse back to sponsors ceases to apply.
2.2. Risk factors from the lenders’ perspective
In order to attract the high level of funding required to realize an LNG project, a thorough understanding of the project itself as well as of possible project risks is essential. Lenders will make their decision on how much to lend dependent on the risk profile of the project. In this vein, and as has already been mentioned above, the firm has to be understood as a comprehensive set of interrelated contractual arrangements. Various contracts define business relationships among project sponsors and stakeholders, allocate risks – ideally to those best able to bear them, and thus determine a project’s value and associated risks:
4 Million tons per year. A typical LNG export project has a capacity of 5 to 10 mtpa. 5 Project finance has proven to be less appropriate for projects that involve immature technologies, as evidenced e.g. by the failure of the UK government to secure project funding for R&D projects (see Brealey et al., 1996). 6 For liquefaction projects there might be some additional (though minor) revenues from the production of liquid petroleum gases.

4
- Construction contracts govern engineering, procurement, and construction. So called “turnkey contracts” with construction guarantees and penalties for delays ensure that all risks related to the construction process are born by contracting partners and equipment manufacturers.
- Operating contracts manage day-to-day operation and govern operating risks. The project operator typically is also one of the major sponsoring entities.
- For a liquefaction project, in addition, natural gas supply contracts ensure commodity supply. When there is only one major supplier to the project, which is the typical case for an LNG liquefaction project, this contract safeguards the project from an abuse of monopoly power by the upstream partner. Prices are typically indexed and compensation rules apply in case of non-delivery. In some cases, project sponsors even integrate upstream holding equity shares in the gas fields, too.
- For a regasification project, marketing happens through bilateral supply contracts with downstream buyers, or alternatively via spot markets or where available liquid trading hubs.
- Liquefaction and regasification projects to a certain extent are linked via long-term sales-and-purchase agreements which in turn guarantee a project’s capacity usage. The role of short-term trade in this industry is still limited, as it would require free capacities along the whole value chain (including liquefaction, shipping and regasification) – with assets, however, being characterized by a certain degree of idiosyncrasy, and open downstream markets with access to transmission grids – not existing to a sufficient level in all importing countries.
- Finally, financial contracts to raise debt are not independent arrangements for the particular financing transaction, but lenders in contrast make their decision on how much to lend dependent on the risk profile of the project. Any risks related to the construction phase, to day-to-day operation, to commodity supply for the liquefaction project as well as to marketing for the regasification project thereby should be managed via the respective contracts. Risks related to the sufficiency of upstream resource availability over the lifetime of a liquefaction project should be eliminated ex-ante via detailed geological assessments. Off-take agreements in turn directly serve as an important security for financial contracts.
As project finance means that all debt is solely repaid via the project cash flows during the operation phase, without any recourse to the sponsors’ asset base, lending institutions base their evaluation of a project on those risk factors which have a direct impact on expected future cash flows. Any material change affecting a project’s cash flow should be reflected in fund raising conditions, i.e. the amount of debt that can be raised, as well as the price of debt and equity.7
For a simplified illustration of the nexus of contracts related to LNG projects see Figure 1.
7 This logic is also confirmed by Dailami and Hauswald (2000), who investigate the Ras Gas liquefaction project in Qatar. This project has one single buyer (Korea Gas Corporation) which in turn sells the full volume directly to a utility (Kepco) where the commodity is used to generate electricity in a specific power plant. The most important explanatory variable for both levels and changes in credit spreads of Ras Gas is the Kepco credit spread. The authors, thus, conclude that investors rationally anticipate on the incidence of the off-taker’s financial and economic condition on the riskiness of their bond.

5
Figure 1: Simplified illustration of the nexus of contracts related to LNG projects
Source: Own depiction
During the 1970s and 1980s, some broad categories of the determinants of a company’s financial structure have been proposed in order to explain the variation of debt-to-total-capitalization ratios across firms (see e.g. Stonehill et al., 1975; Titman and Wessels, 1988; Wijst and Thurik, 1993). Theory suggests that firms select an optimal capital structure depending on attributes which determine leverage-related costs and benefits – only in the absence of such costs and benefits the market value of the firm would be independent of its capital structure.
First an incentive to use more debt originates from the favorable fiscal treatment of debt as compared to equity. Empirical studies therefore typically test for the effect of non-debt tax shields; any tax deductions for depreciation or investment tax credits should be substitutes for the tax benefits of debt financing. Second, an opposite effect originates from bankruptcy costs related to high leverage. Third, agency problems and possibly resulting sub-optimal under-investment of equity-controlled firms are predicted to rise with the industry growth rate. Fourth, various factors increasing the risk for lenders have been identified. Amongst others, theory predicts a positive relation between the debt ratio and the capacity of firms to collateralize their debt; the volatility of earnings reflects the concern about the inability of firms to generate enough funds internally to finance potential growth; and diversified firms are supposed to be less prone to bankruptcy. And finally, the availability of loans from public institutions at favorable terms can increase leverage.
In what follows, we analyze the debt ratio of specific liquefied natural gas projects at the moment of financial closure.8 Looking at a single sector and project-financed assets, with project companies being special purpose entities with a particular lifetime, size and scope of activities, we thereby can ignore the effect of industry growth. Having, moreover, no detailed enough and quantifiable
8 After financial closure, though, a project’s financing parameters can still be subject to modifications (e.g. due to unexpected cost increases extra subordinated debt may be issued during the construction phase).
6
information on tax advantages of debt and bankruptcy costs for the individual projects, we focus in our empirical study on those risk factors which are relevant from the lenders’ perspective.
An LNG project’s assets as such will hardly be accepted as collateral for loans as these are sunk – and to a high degree idiosyncratic – investments. For these “durable investments that are undertaken in support of particular transactions, the opportunity cost […] is much lower in best alternative uses or by alternative users should the original transaction be prematurely terminated” (Williamson, 1985, p. 55). Thus, lenders will critically evaluate a project’s future cash flows. Of particular importance from a lender’s perspective are therefore the prospects for a liquefaction project to export, and for a regasification project to import LNG. In an industry where short-term and spot trading only accounts for about 25% of total market volume (Hartley, 2014), longer-term offtake contracts serve as security for financial contracts, also reducing cash flow variability, and with the typically quite small number of off-takers an explicit link between the capital structure of an LNG project and its off-take agreements does exist. We thus derive our first proposition:
Proposition 1: The debt ratio should increase with the proportion of a project’s capacity sold under long-term sales-and-purchase agreements.9
Moreover, there might be other risk factors relevant for lenders, related to the LNG projects themselves and influencing income streams. First, a project might be very (too?) ambitious, with stable cash flows on the revenue side, but very high upfront investment costs, e.g. due to difficult geological conditions, on the expenditure side. Lenders might evaluate future net benefits less optimistic than project sponsors in such situations. This leads us to our second proposition:
Proposition 2: The debt ratio should decrease with an increase in the capital outlay in terms of upfront investment costs of the project.
Second, and as confirmed in previous studies (see e.g. Stonehill et al., 1975), institutional differences among countries can have an impact on optimal capital structures, too. For instance, unforeseen events might disrupt operation. Political instability is one factor, here. In addition, risks of investing in a country are associated with changes in the business environment that may adversely affect profits or the value of assets, as for instance, financial factors like currency controls, stability factors such as civil war or mass riots, or the unpredictability of regulatory interventions and adaptations in regulatory regimes. This leads us to our third proposition:
Proposition 3: The debt ratio should decrease with an increase the country risk of the country where a project is located.
Technological risks are low as the technical processes of natural gas liquefaction and regasification are well known and have been commercially deployed since decades. This might change in the future with the introduction of a new innovating technology – ‘floating LNG’ (see e.g. Uwaifo, 2011). The concept involves a mobile production unit offshore which allows accessing stranded gas reserves in remote areas and the use of liquefaction assets in different locations, which in turn – besides the higher technological risk – will decrease asset specificity. Effects on optimal capital structure might
9 One could also argue that a higher security for lenders, e.g. due to high volumes sold under long-term offtake agreements, might reflect in favorable lending conditions (interest rates, etc.). Unfortunately, we however cannot account for such parameters in our empirical study due to a lack of data availability.

7
thus be ambiguous. This technology, however, is still in the first-of-a-kind pre-deployment phase, and thus not relevant for the following analysis.
3. Data and Methodology
Using data on 26 natural gas liquefaction (export) and regasification (import) projects, we develop an empirical model that allows us to test for the determinants of the debt ratio of project-financed assets. We thereby aim to test for the significance of different risk factors relevant from the lenders’ perspective as derived in the above three propositions.
3.1. Dataset
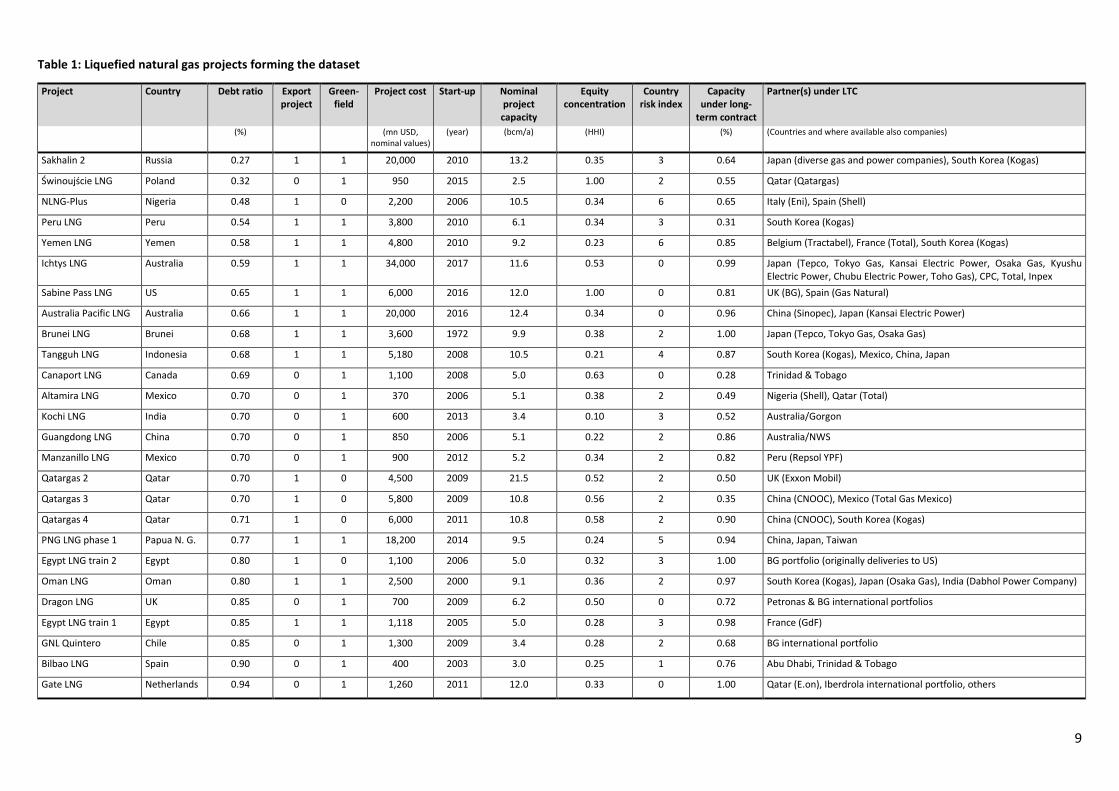
While most empirical work investigating project finance in the energy sector is based on qualitative discussions of selected case studies, we compiled a cross-sectional dataset covering 16 liquefaction and 10 regasification projects, which start(ed) operation between 1972 and 2017.10 A liquefaction project includes liquefaction trains, all related process equipment and storage tanks. It may further include pipelines to upstream natural gas sources. A regasification project includes regasification equipment and storage tanks.
Data on LNG project characteristics have been collected from various publicly available sources such as project websites, periodical reports, newsletters and industry journals. We have information on the type of financing, start-up dates, investment volumes, nominal project capacities, the shareholder structure, gas supply sources and contracting partners.
Data on the debt ratio of individual projects have been collected from Pierru et al. (2013), from different project and industry websites, as well as from the Infrastructure Journal and Project Finance Magazine11.
Finally, data on long-term sales-and-purchase agreements come from a global dataset covering long-term contracts from the beginning of the industry in the 1960s until today (see also Neumann et al., 2015). It includes, amongst others, contracting parties, annual and total contracted volumes, the year of contract signature, the start date of deliveries and contract duration. Both, contracts currently in place or agreed for with the start of delivery during the coming years and contracts that already have been terminated are incorporated.
Table 1 gives an overview on the 26 LNG projects forming the dataset. Figure 2 plots the debt ratio (our dependent variable) for the different LNG export and import projects and respective project capacity shares sold under long-term contracts.
10 These 26 projects are all projects for which we could obtain the relevant data, i.e. financing model being project finance, debt ratio of the respective project, detailed project characteristics, shareholder structure, etc. 11 http://www.ijonline.com

8
Figure 2: Debt ratio for the 26 projects included in the dataset
9
Table 1: Liquefied natural gas projects forming the dataset
Project Country Debt ratio
Export project
Green-field
Project cost
Start-up
Nominal project capacity
Equity concentration
Country risk index
Capacity under long-
term contract
Partner(s) under LTC
(%) (mn USD, nominal values)
(year) (bcm/a) (HHI) (%) (Countries and where available also companies)
Sakhalin 2 Russia 0.27 1 1 20,000 2010 13.2 0.35 3 0.64 Japan (diverse gas and power companies), South Korea (Kogas)
Świnoujście LNG Poland 0.32 0 1 950 2015 2.5 1.00 2 0.55 Qatar (Qatargas)
NLNG-Plus Nigeria 0.48 1 0 2,200 2006 10.5 0.34 6 0.65 Italy (Eni), Spain (Shell)
Peru LNG Peru 0.54 1 1 3,800 2010 6.1 0.34 3 0.31 South Korea (Kogas)
Yemen LNG Yemen 0.58 1 1 4,800 2010 9.2 0.23 6 0.85 Belgium (Tractabel), France (Total), South Korea (Kogas)
Ichtys LNG Australia 0.59 1 1 34,000 2017 11.6 0.53 0 0.99 Japan (Tepco, Tokyo Gas, Kansai Electric Power, Osaka Gas, Kyushu Electric Power, Chubu Electric Power, Toho Gas), CPC, Total, Inpex
Sabine Pass LNG US 0.65 1 1 6,000 2016 12.0 1.00 0 0.81 UK (BG), Spain (Gas Natural)
Australia Pacific LNG Australia 0.66 1 1 20,000 2016 12.4 0.34 0 0.96 China (Sinopec), Japan (Kansai Electric Power)
Brunei LNG Brunei 0.68 1 1 3,600 1972 9.9 0.38 2 1.00 Japan (Tepco, Tokyo Gas, Osaka Gas)
Tangguh LNG Indonesia 0.68 1 1 5,180 2008 10.5 0.21 4 0.87 South Korea (Kogas), Mexico, China, Japan
Canaport LNG Canada 0.69 0 1 1,100 2008 5.0 0.63 0 0.28 Trinidad & Tobago
Altamira LNG Mexico 0.70 0 1 370 2006 5.1 0.38 2 0.49 Nigeria (Shell), Qatar (Total)
Kochi LNG India 0.70 0 1 600 2013 3.4 0.10 3 0.52 Australia/Gorgon
Guangdong LNG China 0.70 0 1 850 2006 5.1 0.22 2 0.86 Australia/NWS
Manzanillo LNG Mexico 0.70 0 1 900 2012 5.2 0.34 2 0.82 Peru (Repsol YPF)
Qatargas 2 Qatar 0.70 1 0 4,500 2009 21.5 0.52 2 0.50 UK (Exxon Mobil)
Qatargas 3 Qatar 0.70 1 0 5,800 2009 10.8 0.56 2 0.35 China (CNOOC), Mexico (Total Gas Mexico)
Qatargas 4 Qatar 0.71 1 0 6,000 2011 10.8 0.58 2 0.90 China (CNOOC), South Korea (Kogas)
PNG LNG phase 1 Papua N. G. 0.77 1 1 18,200 2014 9.5 0.24 5 0.94 China, Japan, Taiwan
Egypt LNG train 2 Egypt 0.80 1 0 1,100 2006 5.0 0.32 3 1.00 BG portfolio (originally deliveries to US)
Oman LNG Oman 0.80 1 1 2,500 2000 9.1 0.36 2 0.97 South Korea (Kogas), Japan (Osaka Gas), India (Dabhol Power Company)
Dragon LNG UK 0.85 0 1 700 2009 6.2 0.50 0 0.72 Petronas & BG international portfolios
Egypt LNG train 1 Egypt 0.85 1 1 1,118 2005 5.0 0.28 3 0.98 France (GdF)
GNL Quintero Chile 0.85 0 1 1,300 2009 3.4 0.28 2 0.68 BG international portfolio
Bilbao LNG Spain 0.90 0 1 400 2003 3.0 0.25 1 0.76 Abu Dhabi, Trinidad & Tobago
Gate LNG Netherlands 0.94 0 1 1,260 2011 12.0 0.33 0 1.00 Qatar (E.on), Iberdrola international portfolio, others
10
3.2. Explanatory variables and empirical model
Explanatory variables: In order to test for Proposition 1, we measure the importance of long-term sales-and-purchase agreements for an individual project (LTC) by dividing the aggregated volumes sold under long-term contracts by the project’s nominal capacity – both in billion cubic meters per year. A long-term contract thereby is a contractual arrangement that connects a particular export- with a particular import project, that has been signed before the financial contracts, and that covers a supply period of at least 15 years, i.e. having a longer term than typical project loans. To test for Proposition 2, we include the capital outlay of a project (COST) as a size variable in the explanation of the debt ratio, being reflected by the total upfront investment costs in million USD (in 2000 values). Finally, to test for Proposition 3, we employ a country risk index (RISK) with tiers from zero (very low risk) to nine (very high risk).12 This index refers to possible changes in the business environment that may have a negative impact on operating profits or the value of assets, including financial, regulatory and political aspects.
Other control variables: As Pierru et al. (2013) find a negative correlation between the debt ratio and ownership concentration of natural gas infrastructure projects, we control for this project characteristic, too. We apply the Herfindahl-Hirschman Index (HHI), a commonly accepted concentration measure calculated as the sum of the squares of each sponsor’s equity share in the project. A small HHI indicates lower concentration (approaching zero), a large HHI indicates higher concentration with the index equaling one for one sponsor holding 100%. We also include a dummy variable being one if a project is controlled by the host government or government-controlled companies to a substantial share, i.e. at least 20% (GVT). Moreover, we control with a dummy variable for the project’s position along the value chain, distinguishing among liquefaction (EXPORT) and regasification projects. A liquefaction project may face additional risks to operation in case of technical problems at the natural gas production site, or due to disruptions in transportation from the fields to the liquefaction units. We also control for the project type, distinguishing among new-built, i.e. so called greenfield (GREEN) projects, and expansion projects. Finally, we include a dummy variable equaling one for a financial close date from 2008 on13 (POST2008), i.e. accounting for uncertainties triggered by the recent financial and economic crises.
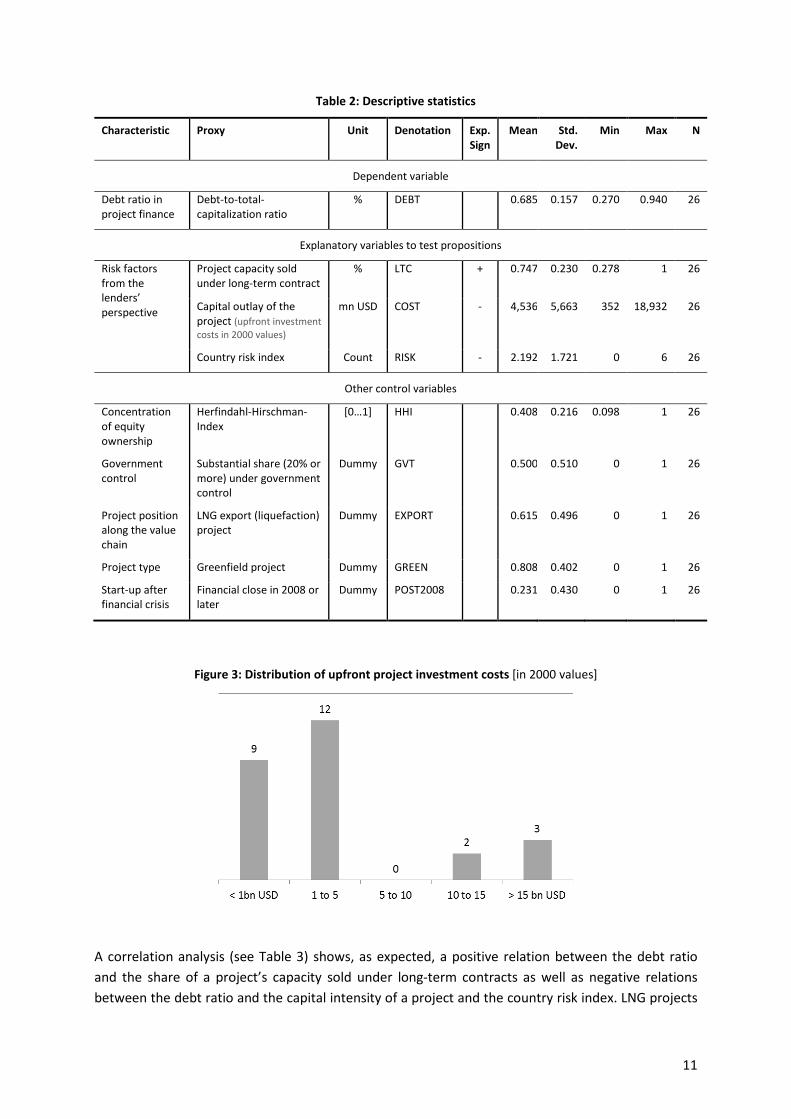
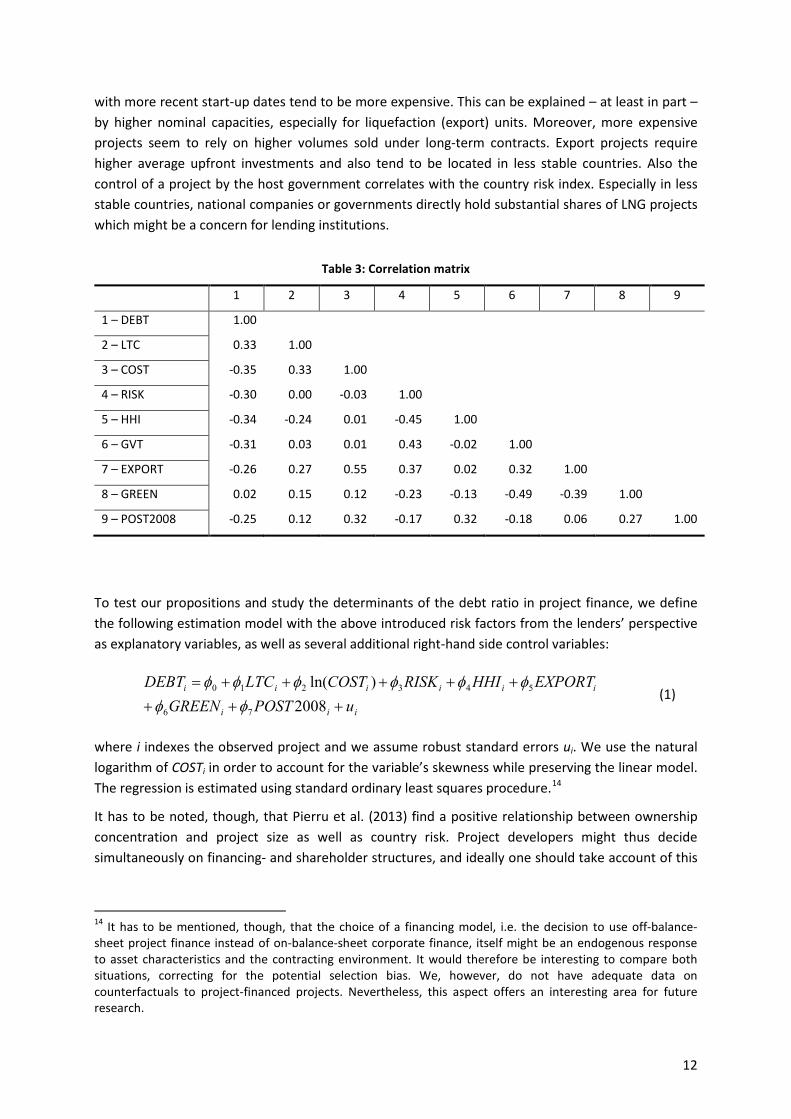
For a survey of all variables as well as their descriptive statistics see Table 2. The observed debt-to-total-capitalization ratio lies between 27 and 94%, what is within the typical range for projects financed in the energy industry (see Scanella, 2012). Long-term sales-and-purchase agreements account for 28% (Canaport LNG, Canada) up to 100% (e.g. Oman LNG) of a project’s nominal capacity. Investment costs differ widely (see also Figure 3), they are typically higher for liquefaction- (1 to 18 bn USD in our dataset) than for regasification projects (350mn to 1bn USD). The country risk index ranges between zero and six with a mean of 2.2. Ownership concentration can be very high (e.g. Świnoujście LNG in Poland with one sponsoring firm), but also quite low (e.g. Kochi LNG in India with six main sponsors). Our sample includes 16 export and 10 import projects. The majority of the observations are greenfield investments. For six of the projects the date of financial closure was later than 2007.
12 Euromoney (2014): http://www.euromoney.com/Article/2851638/Countries-included-in-the-Euromoney-Country-Risk-Results.html 13 Assuming that construction of an LNG project takes about four to five years, we calculate the year of financial closure as year of project start-up minus five.
11
Table 2: Descriptive statistics
Characteristic Proxy Unit Denotation Exp. Sign
Mean Std. Dev.
Min Max N
Dependent variable
Debt ratio in project finance
Debt-to-total-capitalization ratio
% DEBT 0.685 0.157 0.270 0.940 26
Explanatory variables to test propositions
Risk factors from the lenders’ perspective
Project capacity sold under long-term contract
% LTC + 0.747 0.230 0.278 1 26
Capital outlay of the project (upfront investment costs in 2000 values)
mn USD COST - 4,536 5,663 352 18,932 26
Country risk index Count RISK - 2.192 1.721 0 6 26
Other control variables
Concentration of equity ownership
Herfindahl-Hirschman-Index
[0…1] HHI 0.408 0.216 0.098 1 26
Government control
Substantial share (20% or more) under government control
Dummy GVT 0.500 0.510 0 1 26
Project position along the value chain
LNG export (liquefaction) project
Dummy EXPORT 0.615 0.496 0 1 26
Project type Greenfield project Dummy GREEN 0.808 0.402 0 1 26
Start-up after financial crisis
Financial close in 2008 or later
Dummy POST2008 0.231 0.430 0 1 26
Figure 3: Distribution of upfront project investment costs [in 2000 values]
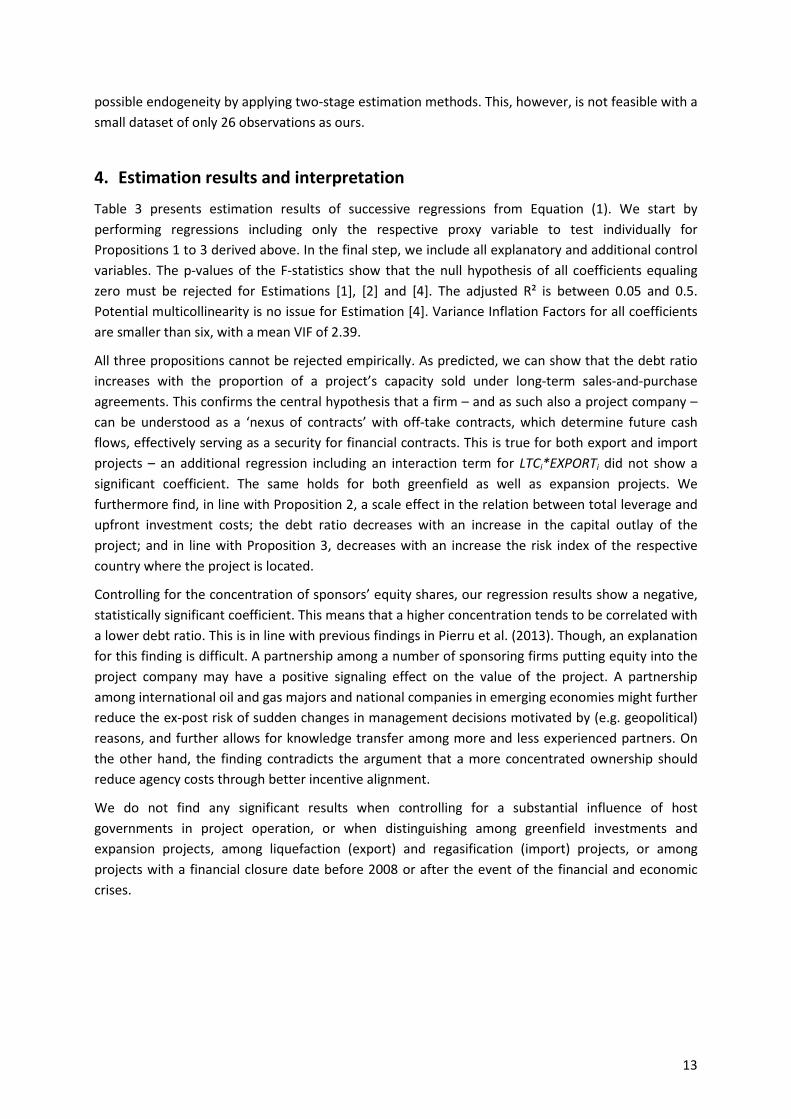
A correlation analysis (see Table 3) shows, as expected, a positive relation between the debt ratio and the share of a project’s capacity sold under long-term contracts as well as negative relations between the debt ratio and the capital intensity of a project and the country risk index. LNG projects
12
with more recent start-up dates tend to be more expensive. This can be explained – at least in part – by higher nominal capacities, especially for liquefaction (export) units. Moreover, more expensive projects seem to rely on higher volumes sold under long-term contracts. Export projects require higher average upfront investments and also tend to be located in less stable countries. Also the control of a project by the host government correlates with the country risk index. Especially in less stable countries, national companies or governments directly hold substantial shares of LNG projects which might be a concern for lending institutions.
Table 3: Correlation matrix
1 2 3 4 5 6 7 8 9
1 – DEBT 1.00
2 – LTC 0.33 1.00
3 – COST -0.35 0.33 1.00
4 – RISK -0.30 0.00 -0.03 1.00
5 – HHI -0.34 -0.24 0.01 -0.45 1.00
6 – GVT -0.31 0.03 0.01 0.43 -0.02 1.00
7 – EXPORT -0.26 0.27 0.55 0.37 0.02 0.32 1.00
8 – GREEN 0.02 0.15 0.12 -0.23 -0.13 -0.49 -0.39 1.00
9 – POST2008 -0.25 0.12 0.32 -0.17 0.32 -0.18 0.06 0.27 1.00
To test our propositions and study the determinants of the debt ratio in project finance, we define the following estimation model with the above introduced risk factors from the lenders’ perspective as explanatory variables, as well as several additional right-hand side control variables:
iii
iiiiii
uPOSTGREENEXPORTHHIRISKCOSTLTCDEBT
++++++++=
2008)ln(
76
543210
φφφφφφφφ
(1)
where i indexes the observed project and we assume robust standard errors ui. We use the natural logarithm of COSTi in order to account for the variable’s skewness while preserving the linear model. The regression is estimated using standard ordinary least squares procedure.14
It has to be noted, though, that Pierru et al. (2013) find a positive relationship between ownership concentration and project size as well as country risk. Project developers might thus decide simultaneously on financing- and shareholder structures, and ideally one should take account of this
14 It has to be mentioned, though, that the choice of a financing model, i.e. the decision to use off-balance-sheet project finance instead of on-balance-sheet corporate finance, itself might be an endogenous response to asset characteristics and the contracting environment. It would therefore be interesting to compare both situations, correcting for the potential selection bias. We, however, do not have adequate data on counterfactuals to project-financed projects. Nevertheless, this aspect offers an interesting area for future research.
13
possible endogeneity by applying two-stage estimation methods. This, however, is not feasible with a small dataset of only 26 observations as ours.
4. Estimation results and interpretation
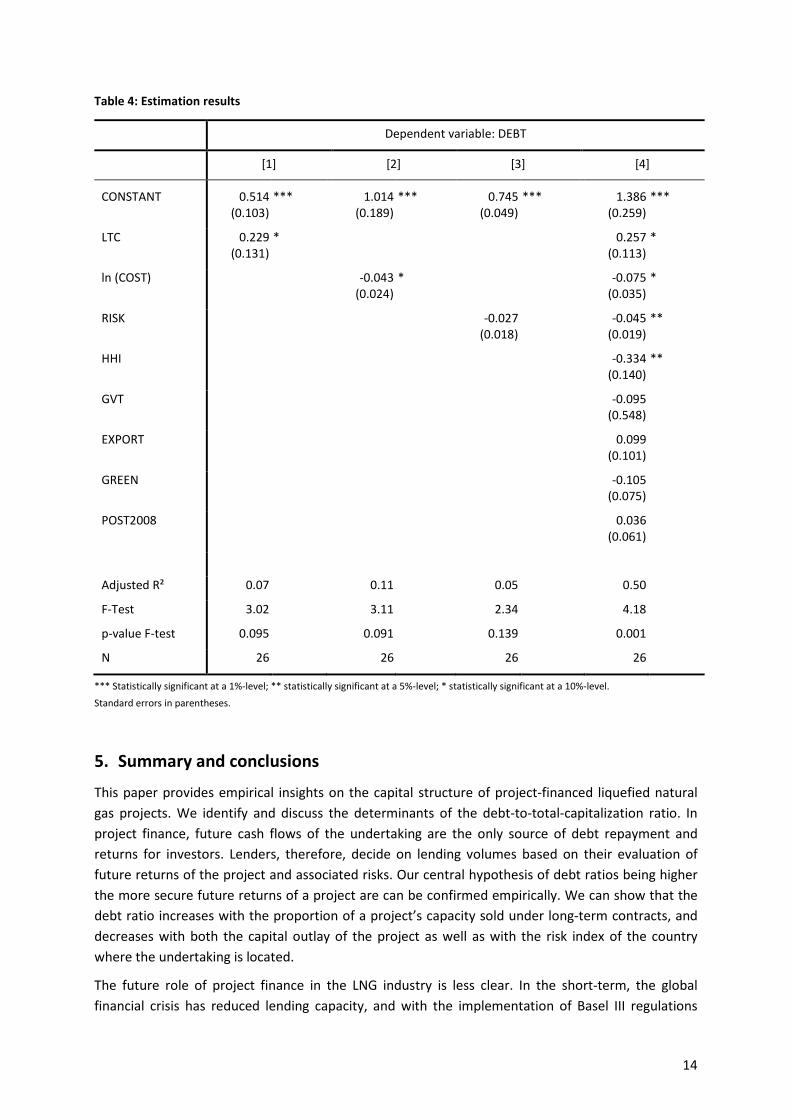
Table 3 presents estimation results of successive regressions from Equation (1). We start by performing regressions including only the respective proxy variable to test individually for Propositions 1 to 3 derived above. In the final step, we include all explanatory and additional control variables. The p-values of the F-statistics show that the null hypothesis of all coefficients equaling zero must be rejected for Estimations [1], [2] and [4]. The adjusted R² is between 0.05 and 0.5. Potential multicollinearity is no issue for Estimation [4]. Variance Inflation Factors for all coefficients are smaller than six, with a mean VIF of 2.39.
All three propositions cannot be rejected empirically. As predicted, we can show that the debt ratio increases with the proportion of a project’s capacity sold under long-term sales-and-purchase agreements. This confirms the central hypothesis that a firm – and as such also a project company – can be understood as a ‘nexus of contracts’ with off-take contracts, which determine future cash flows, effectively serving as a security for financial contracts. This is true for both export and import projects – an additional regression including an interaction term for LTCi*EXPORTi did not show a significant coefficient. The same holds for both greenfield as well as expansion projects. We furthermore find, in line with Proposition 2, a scale effect in the relation between total leverage and upfront investment costs; the debt ratio decreases with an increase in the capital outlay of the project; and in line with Proposition 3, decreases with an increase the risk index of the respective country where the project is located.
Controlling for the concentration of sponsors’ equity shares, our regression results show a negative, statistically significant coefficient. This means that a higher concentration tends to be correlated with a lower debt ratio. This is in line with previous findings in Pierru et al. (2013). Though, an explanation for this finding is difficult. A partnership among a number of sponsoring firms putting equity into the project company may have a positive signaling effect on the value of the project. A partnership among international oil and gas majors and national companies in emerging economies might further reduce the ex-post risk of sudden changes in management decisions motivated by (e.g. geopolitical) reasons, and further allows for knowledge transfer among more and less experienced partners. On the other hand, the finding contradicts the argument that a more concentrated ownership should reduce agency costs through better incentive alignment.
We do not find any significant results when controlling for a substantial influence of host governments in project operation, or when distinguishing among greenfield investments and expansion projects, among liquefaction (export) and regasification (import) projects, or among projects with a financial closure date before 2008 or after the event of the financial and economic crises.
14
Table 4: Estimation results
Dependent variable: DEBT
[1] [2] [3] [4]
CONSTANT 0.514 (0.103)
*** 1.014 (0.189)
*** 0.745 (0.049)
*** 1.386 (0.259)
***
LTC 0.229 (0.131)
* 0.257 (0.113)
*
ln (COST) -0.043 (0.024)
* -0.075 (0.035)
*
RISK -0.027 (0.018)
-0.045 (0.019)
**
HHI -0.334 (0.140)
**
GVT -0.095 (0.548)
EXPORT 0.099 (0.101)
GREEN -0.105 (0.075)
POST2008 0.036 (0.061)
Adjusted R² 0.07 0.11 0.05 0.50
F-Test 3.02 3.11 2.34 4.18
p-value F-test 0.095 0.091 0.139 0.001
N 26 26 26 26
*** Statistically significant at a 1%-level; ** statistically significant at a 5%-level; * statistically significant at a 10%-level.
Standard errors in parentheses.
5. Summary and conclusions
This paper provides empirical insights on the capital structure of project-financed liquefied natural gas projects. We identify and discuss the determinants of the debt-to-total-capitalization ratio. In project finance, future cash flows of the undertaking are the only source of debt repayment and returns for investors. Lenders, therefore, decide on lending volumes based on their evaluation of future returns of the project and associated risks. Our central hypothesis of debt ratios being higher the more secure future returns of a project are can be confirmed empirically. We can show that the debt ratio increases with the proportion of a project’s capacity sold under long-term contracts, and decreases with both the capital outlay of the project as well as with the risk index of the country where the undertaking is located.
The future role of project finance in the LNG industry is less clear. In the short-term, the global financial crisis has reduced lending capacity, and with the implementation of Basel III regulations

15
there are some concerns about the availability of sufficient long-term debt to support the development of new capacities (see also Ledesma et al., 2013). Moreover, with the introduction of new technologies (offshore floating LNG) technological risks could shy away lenders, who naturally have little appetite for new project risks. In the longer-term, the changing nature of sales-and-purchase agreements in the global LNG market – with increasing contractual flexibility concerning e.g. minimum off-take volumes, renegotiation clauses, the progressive elimination of destination clauses and decreasing contract duration (see e.g. Ruester, 2009; Franza, 2014) – may lead to doubts about the ability of such contracts to serve as a security for financial contracts. At the same time, however, increased LNG market liquidity is likely to encourage much greater volume and destination flexibility in contracts and increased reliance on short-term and spot market trades (see also Hartley, 2015), making rigid supply structures obsolete.
As empirical studies on project finance are rather scarce, future research could still substantially contribute to the existing body of literature. Using more comprehensive datasets would allow for more sophisticated empirical analyses, investigating for instance managers’ motivation to prefer project finance over other financing models and the value creation dependent on such managerial decisions. Such studies could improve the understanding of interactions among asset characteristics, business relationships and the web of contractual arrangements surrounding a firm.
References
Berkovitch, E. and E. Han Kim (1990): Financial contracting and leverage induced over- and under-investment incentives. The Journal of Finance, 45(3): 765-794.
Brealey, R.A., I.A. Cooper, and M.A. Habib (1996): Using project finance to fund infrastructure investments. Journal of Applied Corporate Finance, 9(3): 25-38.
Coase, R.H. (1937): The Nature of the Firm. Economica, 4(16): 386-405.
Dailami, M. and R. Hauswald (2000): Risk shifting and long-term contracts: Evidence from the Ras Gas Project. Policy Research Working Paper #2469, World Bank.
Davis, H.A. (2003): Project finance: Practical case studies. Euromoney Books, London, UK.
de Saint Gerand (2013): Financing LNG next frontiers: The floating LNG breakthrough. Presentation at the 17th International Conference & Exhibition on LNG.
Esty, B.C. (2003): The economic motivation for using project finance. Harvard Business School Working Paper, mimeo.
Esty, B.C. (2004): Why study large projects? An introduction to research on project finance. European Financial Management, 10(2): 213-224.
Franza, L. (2014): Long-term gas import contracts in Europe. CIEP Working Paper 2014/08, Clingendael International Energy Programme.
Gatti, S. (2013): Project finance in theory and practice. Academic Press, San Diego.
Hartley, P.R. (2014): Recent developments in LNG markets. Working Paper, James A. Baker III Institute for Public Policy, Rice University.
Hartley, P.R. (2015): The future of long-term LNG contracts. The Energy Journal, forthcoming.
16
International Energy Agency, IEA (2014): Natural gas information 2014. OECD/IEA, Paris.
Jensen, M.C. and W.H. Meckling (1976): Theory of the firm: Managerial behavior, agency costs and ownership structure. Journal of Financial Economics, 3(4): 305-360.
Kayser, D. (2013): Recent research in project finance – a commented bibliography. Procedia Computer Science, 17: 729-736.
Kann, S. (2009): Overcoming barriers to wind project finance in Australia. Energy Policy, 37: 3139-3148.
Ledesma, D., E. Notides Young and C. Holmes (2013): The commercial and financing challenges of an increasingly complex LNG chain. CERA working paper.
Lüdeke-Freund, F. and M. Loock (2011): Debt for brands: tracking down a bias in financing photovoltaic projects in Germany. Journal of Cleaner Production, 19(12): 1356-1364.
Mills, S.J. and M. Taylor (1994): Project finance for renewable energy. Renewable Energy, 5: 700-708.
Modigliani, F. and M.H. Miller (1958): The cost of capital, corporation finance and the theory of investment. American Economic Review, 48(3): 261-297.
Neumann, A., S. Ruester, and C. von Hirschhausen (2015): Long-Term Contracts in the Natural Gas Industry – Data Documentation and Some Empirical Applications. Berlin, DIW Berlin Data Documentation 77.
Pierru, A., S. Roussanaly and J. Sabathier (2013): Capital structure in LNG infrastructure and gas pipeline projects: Empirical evidences and methodological issues. Energy Policy, 61: 285-291.
Pollio, G. (1998): Project finance and international energy development. Energy Policy, 26: 687-697.
Ruester, S. (2009): Changing contract structures in the international LNG market: A first empirical analysis. Revue d’Économie Industrielle, 127(3): 89-112.
Ruester, S. (2013): Gas Supply: The Role of Liquefied Natural Gas. In: Glachant, J.-M. et al. (eds.): Building competitive gas markets in the EU. Edward Elgar Publishing.
Scannella, E. (2012): Project finance in the energy industry: New debt-based financing models. International Business Research, 5(2): 83-93.
Sha, S. and A.V. Thakor (1987): Optimal capital structure and project financing. Journal of Economic Theory, 42(2): 209-243.
Stonehill, A., T. Beekhuisen, R. Wright, L. Remmers, N. Toy, A. Pares, A. Shapiro, D. Egan, and T. Bates (1975): Financial goals and debt ratio determinants: A survey of practice in five countries. Financial Management, 4(3): 27-41.
Uwaifo, I. (2011): LNG financing: Is the floating LNG concept a more bankable option than traditional onshore LNG projects? Working Paper, University of Dundee.
Wijst, N.v.d. and R. Thurik (1993): Determinants of small firm debt ratios: An analysis of retail panel data. Small Business Economics, 5: 55-65.
Williamson, Oliver E. (1985): The Economic Institutions of Capitalism – Firms, Market, Relational Contracting. The Free Press, New York.