143Nd/144Nd and Sm/Nd stratigraphy of Upper Ordovician...
15
PII S0016-7037(00)00773-6 143 Nd/ 144 Nd and Sm/Nd stratigraphy of Upper Ordovician epeiric sea carbonates K. C. FANTON, 1, * C. HOLMDEN, 1 G. S. NOWLAN, 2 and F. M. HAIDL 3 1 Department of Geological Sciences, University of Saskatchewan, 114 Science Place, Saskatoon, Saskatchewan S7N 5E2, Canada 2 Geological Survey of Canada, 3303-33rd Street NW, Calgary, Alberta T2L 2A7, Canada 3 Saskatchewan Energy and Mines, Subsurface Geological Laboratory, 201 Dewdney Avenue E, Regina, Saskatchewan S4N 4G3, Canada (Received January 19, 2001; accepted in revised form July 16, 2001) Abstract—Stratigraphic changes in the Nd of epeiric sea carbonates from central North America track the submergence history of the interior craton during the Late Ordovician. Fluctuations in sea level changed the Nd isotope balance of the epeiric sea by modifying the flux of Nd weathered from the highlands of the Taconic Orogen ( Nd 6 to 9) and from the low relief Precambrian basement ( Nd 22 to 15) of the Transcontinental Arch and Canadian Shield. Transgressions over the Arch and Shield, which diminished the weathering flux of Nd from the Precambrian basement, are recorded as positive shifts in the Nd profiles of carbonates. Negative Nd shifts reflect regression and reexposure of the Precambrian basement to erosion. Correlation of Upper Ordovician carbonates by use of the Nd profiles demonstrates the potential for Nd isotope stratigraphy. Comparison of stratigraphic variations in carbonate Sm/Nd ratios with sea level curves, conodont paleoecology, and the Nd profiles suggest that our observed variations in Sm/Nd ratios are related to changes in depth. Increasing Sm/Nd ratios correlate with increasing depth, whereas decreasing Sm/Nd ratios correlate with decreasing depth. This relationship between Sm/Nd ratios and depth suggests Sm/Nd profiles have potentially wide applications in understanding the paleoceanography of ancient epeiric seas. Copyright © 2002 Elsevier Science Ltd 1. INTRODUCTION The discovery that Nd values of modern seawater differ between oceans led to the idea that variations in Nd of past seawater, recorded in marine sediments, can be used to track changes in the configuration of ocean basins and in ocean circulation (Piepgras et al., 1979; Keto and Jacobsen, 1987, 1988; Stille et al., 1996; Vance and Burton, 1999). Neodymium can be used in this way because it has a residence time shorter than the interocean mixing time and because its isotopic com- position in seawater is controlled by the weathering flux of Nd from surrounding continental crust and delivered to oceans in the dissolved load of rivers. Because Nd of the continental crust is age dependent, differences in the mean age of crust comprising the watershed to each basin ensures that the Nd of seawater differs between ocean basins (Piepgras et al., 1979; Piepgras and Wasserburg, 1980; Goldstein and Jacobsen, 1987). Widespread application of Nd isotopes to the study of Pa- leozoic oceans has been hampered by a marine sediment record dominated by epeiric sea deposits. Holmden et al. (1998) questioned whether Nd values preserved in epeiric sea sedi- ments could be used to represent Nd values of adjacent pale- oceans, showing that seawater Nd values recorded in Upper Ordovician conodonts across the Mohawkian Sea ( Nd 6 to 19) are markedly different from those of the adjacent Iapetus Ocean ( Nd 0.6 to 5). Additionally, Whittaker and Kyser (1993) reported statigraphic variations in the Nd values of molluscs from the Cretaceous Western Interior Seaway that are larger than expected for mixing of seawater onlapping the craton from the Pacific Ocean and Gulf of Mexico. Grandjean et al. (1988) showed that Nd values in the shallow Cretaceous sea of the West African Platform were variable and were offset from those of the adjoining Atlantic Ocean. Although these studies question the reliability of epeiric sea sediments as a record of Nd for bordering paleoceans, the utility of Nd iso- topes as a paleogeographic tool can be realized if the scale of inquiry is limited to the epicontinental environment, where Nd isotopes can be used to study the dynamics of epeiric seawater across individual continents. In this article, we focus the scale of our investigation to the interior epeirc seas of North America in the Middle and Late Ordovician (Fig. 1). Specifically, we show that strati- graphic changes in the Nd of Middle and Upper Ordovician carbonates bordering the Transcontinental Arch and Cana- dian Shield record the submergence history of the North American craton. The premise is that the Nd isotope balance in epeiric seawater across North America was primarily controlled by the relative contributions of Nd weathered from the Taconic Orogen ( Nd 6 to 9) and the low relief Precambrian basement of the Transcontinental Arch and Canadian Shield ( Nd 22 to 15) (Fig. 1). During sea level rise, progressive submergence of the Arch and Shield reduced the weathering flux of Precambrian-sourced Nd to surrounding epeiric seas of the Williston Basin in Saskatchewan and the central Midcontinent in Iowa (Fig. 1). Therefore, positive stratigraphic shifts in Nd of these epeiric sea carbonates record progressive inundation of the Arch and Shield and an adjustment in the Nd isotope balance of seawater toward greater contributions of Nd from the Tac- onic Orogen. Negative shifts in Nd indicate increased emer- gence of the Arch and Shield from relative sea level fall. Because sea level changes and the Nd profile are linked, it is possible to correlate Upper Ordovician marine sediments between intracratonic basins of North America, demonstrat- * Author to whom correspondence should be addressed ([email protected]). Pergamon Geochimica et Cosmochimica Acta, Vol. 66, No. 2, pp. 241–255, 2002 Copyright © 2002 Elsevier Science Ltd Printed in the USA. All rights reserved 0016-7037/02 $22.00 .00 241
Transcript of 143Nd/144Nd and Sm/Nd stratigraphy of Upper Ordovician...
PII S0016-7037(00)00773-6
143Nd/144Nd and Sm/Nd stratigraphy of Upper Ordovician epeiric sea carbonates
K. C. FANTON,1,* C. HOLMDEN,1 G. S. NOWLAN,2 and F. M. HAIDL31Department of Geological Sciences, University of Saskatchewan, 114 Science Place, Saskatoon, Saskatchewan S7N 5E2, Canada
2Geological Survey of Canada, 3303-33rd Street NW, Calgary, Alberta T2L 2A7, Canada3Saskatchewan Energy and Mines, Subsurface Geological Laboratory, 201 Dewdney Avenue E, Regina, Saskatchewan S4N 4G3, Canada
(Received January 19, 2001; accepted in revised form July 16, 2001)
Abstract—Stratigraphic changes in the !Nd of epeiric sea carbonates from central North America track thesubmergence history of the interior craton during the Late Ordovician. Fluctuations in sea level changed theNd isotope balance of the epeiric sea by modifying the flux of Nd weathered from the highlands of the TaconicOrogen (!Nd ! "6 to "9) and from the low relief Precambrian basement (!Nd ! "22 to "15) of theTranscontinental Arch and Canadian Shield. Transgressions over the Arch and Shield, which diminished theweathering flux of Nd from the Precambrian basement, are recorded as positive shifts in the !Nd profiles ofcarbonates. Negative !Nd shifts reflect regression and reexposure of the Precambrian basement to erosion.Correlation of Upper Ordovician carbonates by use of the !Nd profiles demonstrates the potential for Ndisotope stratigraphy. Comparison of stratigraphic variations in carbonate Sm/Nd ratios with sea level curves,conodont paleoecology, and the !Nd profiles suggest that our observed variations in Sm/Nd ratios are relatedto changes in depth. Increasing Sm/Nd ratios correlate with increasing depth, whereas decreasing Sm/Nd ratioscorrelate with decreasing depth. This relationship between Sm/Nd ratios and depth suggests Sm/Nd profileshave potentially wide applications in understanding the paleoceanography of ancient epeiric seas. Copyright© 2002 Elsevier Science Ltd
1. INTRODUCTION
The discovery that !Nd values of modern seawater differbetween oceans led to the idea that variations in !Nd of pastseawater, recorded in marine sediments, can be used to trackchanges in the configuration of ocean basins and in oceancirculation (Piepgras et al., 1979; Keto and Jacobsen, 1987,1988; Stille et al., 1996; Vance and Burton, 1999). Neodymiumcan be used in this way because it has a residence time shorterthan the interocean mixing time and because its isotopic com-position in seawater is controlled by the weathering flux of Ndfrom surrounding continental crust and delivered to oceans inthe dissolved load of rivers. Because !Nd of the continentalcrust is age dependent, differences in the mean age of crustcomprising the watershed to each basin ensures that the !Nd ofseawater differs between ocean basins (Piepgras et al., 1979;Piepgras and Wasserburg, 1980; Goldstein and Jacobsen,1987).Widespread application of Nd isotopes to the study of Pa-
leozoic oceans has been hampered by a marine sediment recorddominated by epeiric sea deposits. Holmden et al. (1998)questioned whether !Nd values preserved in epeiric sea sedi-ments could be used to represent !Nd values of adjacent pale-oceans, showing that seawater !Nd values recorded in UpperOrdovician conodonts across the Mohawkian Sea (!Nd ! "6 to"19) are markedly different from those of the adjacent IapetusOcean (!Nd ! 0.6 to "5). Additionally, Whittaker and Kyser(1993) reported statigraphic variations in the !Nd values ofmolluscs from the Cretaceous Western Interior Seaway that arelarger than expected for mixing of seawater onlapping thecraton from the Pacific Ocean and Gulf of Mexico. Grandjean
et al. (1988) showed that !Nd values in the shallow Cretaceoussea of the West African Platform were variable and were offsetfrom those of the adjoining Atlantic Ocean. Although thesestudies question the reliability of epeiric sea sediments as arecord of !Nd for bordering paleoceans, the utility of Nd iso-topes as a paleogeographic tool can be realized if the scale ofinquiry is limited to the epicontinental environment, where Ndisotopes can be used to study the dynamics of epeiric seawateracross individual continents.In this article, we focus the scale of our investigation to
the interior epeirc seas of North America in the Middle andLate Ordovician (Fig. 1). Specifically, we show that strati-graphic changes in the !Nd of Middle and Upper Ordoviciancarbonates bordering the Transcontinental Arch and Cana-dian Shield record the submergence history of the NorthAmerican craton. The premise is that the Nd isotope balancein epeiric seawater across North America was primarilycontrolled by the relative contributions of Nd weatheredfrom the Taconic Orogen (!Nd ! "6 to "9) and the lowrelief Precambrian basement of the Transcontinental Archand Canadian Shield (!Nd ! "22 to "15) (Fig. 1). Duringsea level rise, progressive submergence of the Arch andShield reduced the weathering flux of Precambrian-sourcedNd to surrounding epeiric seas of the Williston Basin inSaskatchewan and the central Midcontinent in Iowa (Fig. 1).Therefore, positive stratigraphic shifts in !Nd of these epeiricsea carbonates record progressive inundation of the Archand Shield and an adjustment in the Nd isotope balance ofseawater toward greater contributions of Nd from the Tac-onic Orogen. Negative shifts in !Nd indicate increased emer-gence of the Arch and Shield from relative sea level fall.Because sea level changes and the !Nd profile are linked, itis possible to correlate Upper Ordovician marine sedimentsbetween intracratonic basins of North America, demonstrat-
* Author to whom correspondence should be addressed([email protected]).
PergamonGeochimica et Cosmochimica Acta, Vol. 66, No. 2, pp. 241–255, 2002
Copyright © 2002 Elsevier Science LtdPrinted in the USA. All rights reserved
0016-7037/02 $22.00 # .00
241
ing the potential for Nd isotope stratigraphy. We also showthat stratigraphic variations in Sm/Nd ratios of carbonateshold potential as a proxy for changing depth in epeiric seaenvironments.In this article, we additionally evaluate the potential for
whole-rock carbonate to preserve the !Nd values of ancientepeiric seawater. Traditionally, biogenic apatites, such as con-odonts, have been relied upon to record the isotopic composi-tion of Nd in ancient seawater (Wright et al., 1984; Shaw andWasserburg, 1985; Keto and Jacobsen, 1987, 1988; Grandjeanet al., 1988; Holmden et al., 1998; Martin and Haley, 2000).Biogenic apatite sequesters Nd from seawater postmortem atthe seawater–sediment interface and is relatively unaffected bydiagenesis (Bernat, 1975; Wright et al., 1984; Shaw and Was-serburg, 1985; Grandjean et al., 1987; Grandjean and Albarede,1989; Holmden et al., 1996). Conodonts, however, are ex-tremely small fossils ($100 "g per element), and even thoughNd concentrations may range between 50 and 2100 ppm, lowfossil yields from marine carbonates may provide insufficientNd for routine mass spectrometric analysis of Nd# ions. Thisdependence on conodont yields can limit the construction ofdetailed Nd isotopic profiles in marine sediments. By contrast,marine carbonate rocks have high enough Nd concentrationsthat, at most, only a few grams are necessary for analysis andcan, within a carbonate sequence, offer another medium for Ndisotope stratigraphy.
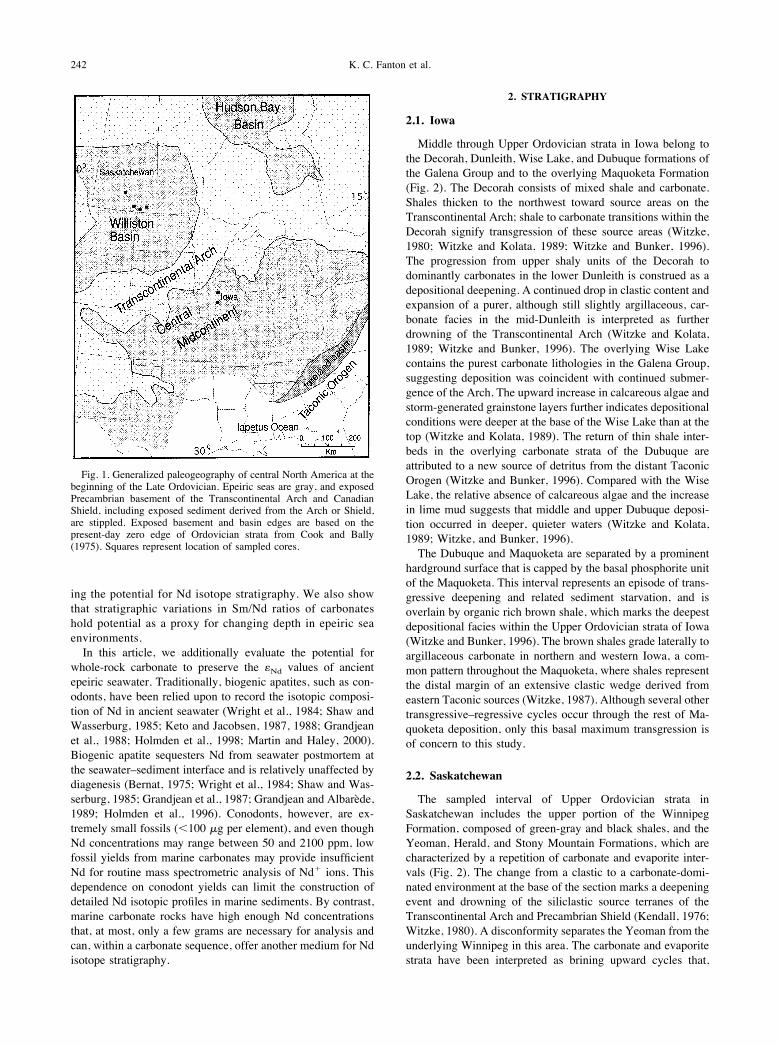
2. STRATIGRAPHY
2.1. Iowa
Middle through Upper Ordovician strata in Iowa belong tothe Decorah, Dunleith, Wise Lake, and Dubuque formations ofthe Galena Group and to the overlying Maquoketa Formation(Fig. 2). The Decorah consists of mixed shale and carbonate.Shales thicken to the northwest toward source areas on theTranscontinental Arch; shale to carbonate transitions within theDecorah signify transgression of these source areas (Witzke,1980; Witzke and Kolata, 1989; Witzke and Bunker, 1996).The progression from upper shaly units of the Decorah todominantly carbonates in the lower Dunleith is construed as adepositional deepening. A continued drop in clastic content andexpansion of a purer, although still slightly argillaceous, car-bonate facies in the mid-Dunleith is interpreted as furtherdrowning of the Transcontinental Arch (Witzke and Kolata,1989; Witzke and Bunker, 1996). The overlying Wise Lakecontains the purest carbonate lithologies in the Galena Group,suggesting deposition was coincident with continued submer-gence of the Arch. The upward increase in calcareous algae andstorm-generated grainstone layers further indicates depositionalconditions were deeper at the base of the Wise Lake than at thetop (Witzke and Kolata, 1989). The return of thin shale inter-beds in the overlying carbonate strata of the Dubuque areattributed to a new source of detritus from the distant TaconicOrogen (Witzke and Bunker, 1996). Compared with the WiseLake, the relative absence of calcareous algae and the increasein lime mud suggests that middle and upper Dubuque deposi-tion occurred in deeper, quieter waters (Witzke and Kolata,1989; Witzke, and Bunker, 1996).The Dubuque and Maquoketa are separated by a prominent
hardground surface that is capped by the basal phosphorite unitof the Maquoketa. This interval represents an episode of trans-gressive deepening and related sediment starvation, and isoverlain by organic rich brown shale, which marks the deepestdepositional facies within the Upper Ordovician strata of Iowa(Witzke and Bunker, 1996). The brown shales grade laterally toargillaceous carbonate in northern and western Iowa, a com-mon pattern throughout the Maquoketa, where shales representthe distal margin of an extensive clastic wedge derived fromeastern Taconic sources (Witzke, 1987). Although several othertransgressive–regressive cycles occur through the rest of Ma-quoketa deposition, only this basal maximum transgression isof concern to this study.
2.2. Saskatchewan
The sampled interval of Upper Ordovician strata inSaskatchewan includes the upper portion of the WinnipegFormation, composed of green-gray and black shales, and theYeoman, Herald, and Stony Mountain Formations, which arecharacterized by a repetition of carbonate and evaporite inter-vals (Fig. 2). The change from a clastic to a carbonate-domi-nated environment at the base of the section marks a deepeningevent and drowning of the siliclastic source terranes of theTranscontinental Arch and Precambrian Shield (Kendall, 1976;Witzke, 1980). A disconformity separates the Yeoman from theunderlying Winnipeg in this area. The carbonate and evaporitestrata have been interpreted as brining upward cycles that,
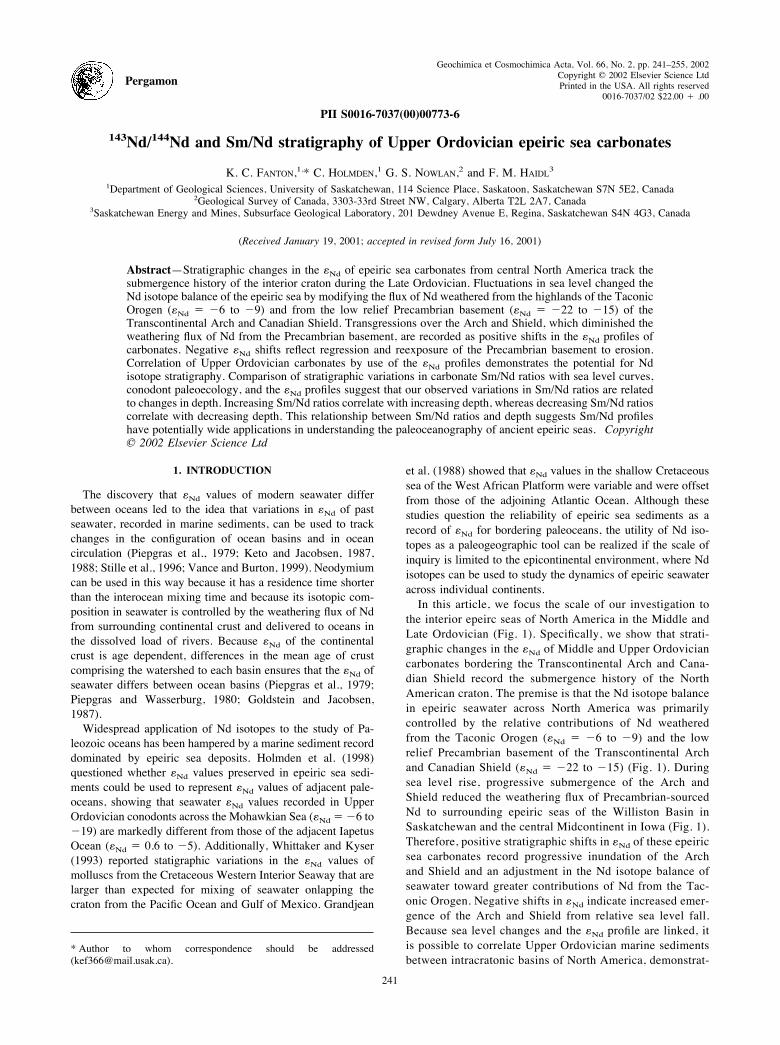
Fig. 1. Generalized paleogeography of central North America at thebeginning of the Late Ordovician. Epeiric seas are gray, and exposedPrecambrian basement of the Transcontinental Arch and CanadianShield, including exposed sediment derived from the Arch or Shield,are stippled. Exposed basement and basin edges are based on thepresent-day zero edge of Ordovician strata from Cook and Bally(1975). Squares represent location of sampled cores.
242 K. C. Fanton et al.

where complete, are composed of lower burrow-mottled car-bonate, a middle laminated carbonate, and an upper subaqueousevaporite unit (Kendall, 1976; Longman et al., 1983).Recent work, utilizing new core data from the upper Yeoman
and lower Herald, documents a shallowing-upward sequence(Pratt et al., 1996; Haidl et al., 1997; Canter, 1998; Kreis andKent, 2000). Fossiliferous rudstones, boundstones, and coatedgrain facies above burrow mottled carbonates, together withevidence for localized subaerial exposure in the lower portionof the laminated unit, suggest that a sequence boundary ispresent between the lower laminated unit and the overlying
laterally extensive laminated carbonates and basin-centeredsubaqueously deposited anydrites. Further work is required toestablish the detailed sequence stratigraphic framework ofthese and overlying carbonate and evaporite strata in the Heraldand Stony Mountain formations.In southeastern Saskatchewan, the basal unit of the Stony
Mountain consists of fossiliferous, argillaceous to slightlyargillaceous carbonates, which indicate a return to open marineconditions (Kendall, 1976). Overlying carbonates have a highercontent of terrigenous clay and silt (Fuller, 1961; Kendall,1976). The source of clastic detritus is to the southeast, either
Fig. 2. !Nd profiles of Ordovician strata from Saskatchewan and Iowa. The shaded boxes indicate correlation of theYeoman Formation of the Williston Basin and the Wise Lake Formation of the central Midcontinent, across theTranscontinental Arch. Solid squares are data from the acid-soluble fraction of carbonates, and open squares are data fromshale or sandstone. Rock types are generalized. Placement of Iowa stage boundaries are from Witzke and Bunker (1996).Saskatchewan stage boundaries are based on conodonts from this study and Norford et al. (1994). Core identifications andthe extent of stratigraphic overlap between cores is shown next to the stratigraphic sections. Actual sampled core intervalsare shown next to the !Nd profiles. Lettering along both sections designates conodonts recovered from that interval. Pr. g.! Periodon grandis; C.p. ! Columbodina penna; Ps. v. ! Pseudobelodina vulgaris vulgaris; Pl. ! Platteville Formationand Kirk-Rock, the undifferentiated Kirkfieldian through Rocklandian stages.
243143Nd/144Nd and Sm/Nd stratigraphy of Ordovician carbonates

from the Transcontinental Arch and Shield (Witzke, 1980) orthe Taconic Orogen (Osadetz and Haidl, 1989). The remainderof the Stony Mountain is composed of nodular, slightly argil-laceous carbonates overlain by laminated dolostones capped bya thin anhydrite bed (Kendall, 1976).
3. CONODONT BIOFACIES
Nd isotopic profiles have been compared with biofaciesrepresented by conodonts in core samples. The relative abun-dance of conodont genera believed to have lived at or near thesediment–water interface (benthic or nektobenthic life habitat)has been computed for each sample and compared with thepatterns in Nd isotopes and Sm/Nd ratios.Seddon and Sweet (1971) first recognized that the distribu-
tion of Ordovician conodont genera and species are affected byfacies; they attributed this to a pelagic habitat for conodonts.Instead, Barnes and Fåhraeus (1975) suggested that most Or-dovician conodont genera were benthic or nektobenthic. Astudy specific to Upper Ordovician biofacies by Sweet andBergstrom (1984) recognized six conodont biofacies for theEdenian–Maysvillian of North America.The biofacies recognized by Sweet and Bergstrom (1984) are
modified herein to reflect local faunas and comparative work byNowlan and Barnes (1981). The biofacies for the Late Ordo-vician in order from shallowest to deepest are based on con-odont genera believed to be of benthic or nektobenthic habit:(1) Rhipidognathus biofacies; (2) Oulodus–Aphelognathus bio-facies; (3) Plectodina biofacies; (4) Phragmodus biofacies; and(5) Amorphognathus biofacies. The genera Panderodus andDrepanoistodus and many of the other simple cone genera,such as Belodina and Pseudobelodina, are believed to be pe-lagic conodonts.
4. SAMPLING
Four cores from southern and central Saskatchewan, sepa-rated by up to 100 km, and two cores from central Iowa weresampled to construct continuous, or nearly continuous, Middleand Late Ordovician !Nd profiles on either side of the Trans-continental Arch (Fig. 2). Lithologic descriptions and forma-tion boundary picks on cores from Saskatchewan are by Ken-dall (1976) and by F.H. and G.N. (this study). For the Iowacores (Peterson 1 T90N R27W Sec. 10 NE NE NE NW andNelson 3 T79N R29W Sec. 12 SE NW SE) lithofacies andformation boundaries are by B. J. Witzke (unpublished data).Three of the four Saskatchewan cores overlap stratigraphically(Fig. 2) and are correlated by using formation boundaries as thedatum. However, the Imperial Pangman 3-14-8-20 and Cal-Stan Holdfast 14-12-23-26 cores, which comprise the upperWinnipeg and basal Yeoman formations, do not overlap, leav-ing what is considered to be a small gap in the sampled section(Fig. 2). Although the Iowa cores are believed to overlapstratigraphically, the exact correlation is uncertain. Because the!Nd profiles of the cores do not overlap, we chose to place theNelson 3 !Nd profile stratigraphically above that of the Peterson1 core (Fig. 2).Subsurface depths varied widely between overlapping cores
(Tables 1 and 2). Therefore, to simplify presentation of the !Nddata, overlapping cores were combined and depicted as a singlemeasured stratigraphic section. The 0-m mark is placed arbi-
trarily at the base of the sampled section, regardless of thesubsurface depth, and stratigraphic position between subse-quent younger samples is displayed in meters, rather than indeclining depth from the surface (Fig. 2).In total, 41 carbonate samples from Iowa and 26 carbonate
samples from Saskatchewan were collected for Sm-Nd isotopicanalysis. In addition, two shale samples were analyzed from theDecorah Formation, and two sandstone samples were analyzedfrom the Winnipeg Formation. Twenty-eight samples in Iowaand 26 samples in Saskatchewan were processed for conodonts.
5. ANALYTICAL TECHNIQUES
A homogeneous powder was created for each carbonate handsample from 100 g of rock. Two grams of powder wereweighed into a 50-mL centrifuge tube. The carbonate was thendissolved by adding 0.5-mL increments of 6.0 N HCl dropwise,waiting until each increment had completely reacted beforeadding the next. When dissolution was completed, the solutionwas centrifuged to separate the acid-soluble (AS) fraction fromthe acid insoluble fraction. The supernate was passed through asyringe filter with a 0.2-"m Teflon PTFE membrane to ensureremoval of any fine HCl-insoluble particles. The resulting clearsolution was then spiked with a 149Sm-150Nd tracer, gentlyagitated, and left overnight to ensure sample-spike equilibra-tion.The rare earth elements (REEs) were stripped from this high
Ca#2 and Mg#2 solution with a Fe-hydroxide coprecipitationtechnique. Nine milligrams of Fe #3, as FeCl3 in HCl, wereadded to the solution. Dropwise addition of concentrated am-monium hydroxide caused the iron to flocculate and the solu-tion to turn from yellow to clear. The Fe-hydroxide flocculesand the adsorbed REEs were centrifuged; the supernate wasdiscarded and the precipitate rinsed three times in ultrapurewater. Nd yields from the Fe-coprecipitation technique were100%.Eleven samples of the HCl-insoluble residues (IR) were
further treated by soaking them in 1 to 2 mL of 6.0 N HCl for2 h to ensure complete removal of any remaining biogenicapatite. The residues were then rinsed with ultrapure water,dried, and weighed; 30 to 90 mg were removed, spiked with the149Sm-150Nd tracer, and dissolved in an HF-HNO3 solution.Conodonts were separated from 200 to 650 g of carbonate
with 10% acetic acid, then concentrated by sieving and heavyliquid separation and brushed in ultrapure water to removeadhering material. Conodonts were weighed, spiked with a149Sm-150Nd tracer solution, and dissolved in 2.0 N HNO3.Sm and Nd were separated with standard chromatography
methods with HDEHP-coated Teflon powder. Purified Sm andNd were loaded onto side Re filaments of a double-filamentassembly and analyzed on a Finnigan MAT 261 instrument asSm# and Nd# ions with a static multicollection routine. Totallyspiked isotope abundance measurements were unmixed fortracer isotopes and corrected for instrumental mass fraction-ation by an iterative procedure described by Eugster et al.(1969). 143Nd/144Nd ratios were normalized to 146Nd/144Nd of0.7219, and Sm isotope ratios were normalized to 148Sm/154Smof 0.494190. External reproducibility of 143Nd/144Nd is%0.000017 (2#), established on the basis of replicate analyses
244 K. C. Fanton et al.

of our internal Nd Ames standard. Over the course of this work,the La Jolla standard yielded 143Nd/144Nd ! 0.511841.Values of !Nd presented in the text are back-corrected by the
measured 147Sm/144Nd ratios to the time of deposition at 450Ma. Although the stratigraphic age of the sampled sectionspans approximately 13 Ma, the maximum error introduced byusing a single age for all samples is less than 0.2 epsilon units.
6. CARBONATES AS A MEDIUM FOR Nd ISOTOPESTRATIGRAPHY
The molar Nd/Ca ratio of modern seawater is &2 ' 10"9
(Shaw and Wasserburg, 1985). Assuming there is no fraction-ation of Nd from Ca during calcification by marine organisms,biogenic carbonates should contain approximately 3 ppb of Nd,but such low concentrations are observed only in the detritus-free carbonate of some living organisms (Shaw and Wasser-burg, 1985). Recently deposited, detritus-free limestones anddolostones have concentrations that are higher by several or-
ders of magnitude, indicating that lattice-bound Nd accountsfor only a small portion of the bulk Nd in carbonate material(Shaw and Wasserburg, 1985). Consequently, it has been sug-gested that the majority of Nd in recent marine carbonates isacquired by incorporation of a REE-rich Fe-Mn phase ongrowing crystal surfaces (Turekian et al., 1973) or as a REE-rich Fe-Mn surficial coating acquired after death of the organ-ism (Palmer, 1985; Shaw and Wasserburg, 1985). BecauseFe-Mn floccules scavenge REEs from seawater, metalliferouscoatings have !Nd values identical to seawater (Palmer, 1985;Palmer and Elderfield, 1985).Ancient epeiric sea carbonates have widely varying Nd con-
centrations (0.1 to 20 ppm) (Banner et al., 1988; Bellanca et al.,1997). Differences in depositional settings between modernoceans and ancient epeiric seas, such as depth, salinity, andparticulate flux, may account for some of the increase in con-centration. However, a potentially important source of Nd inepeiric sea carbonates is the noncarbonate fraction composed of
Table 1. Sm and Nd isotope and concentration data from Saskatchewan core samples.
Subsurfacedepth (m)
Compiledsection (m) Fm.a
Nd(ppm)
Sm(ppm)
Sm/Nd(atom) 147Sm/144Nd 143Nd/144Nd !Nd(450)b
Acid-soluble fraction of carbonates and whole-rock sandstonec samplesHartaven 2-11-10-9W22254.9 92.4 St 0.43 0.077 0.173 0.1095 0.511980 "7.82259.5 88.5 St 0.58 0.10 0.168 0.1068 0.511933 "8.62264.8 83.2 St 2.62 0.51 0.185 0.1171 0.511967 "8.52270.0 78.0 St 5.30 1.05 0.188 0.1195 0.511997 "8.12274.5 73.5 St 4.24 0.88 0.196 0.1246 0.512004 "8.22279.3 68.7 St 3.09 0.67 0.206 0.1308 0.512026 "8.22283.4 64.8 St 0.43 0.089 0.198 0.1257 0.511991 "8.5
Oungre 15-9-2-14W23024.8 64.5 H 0.68 0.13 0.178 0.1127 0.511954 "8.53029.7 60.9 H 1.36 0.29 0.202 0.1282 0.511956 "9.43036.1 53.4 H 0.25 0.057 0.217 0.1378 0.512009 "8.93042.2 48.4 H 0.52 0.098 0.178 0.1130 0.511952 "8.63048.2 42.4 H 1.00 0.20 0.188 0.1194 0.511970 "8.63051.9 38.8 H 0.34 0.071 0.201 0.1277 0.512020 "8.13055.6 35.0 H 0.33 0.067 0.194 0.1228 0.511970 "8.8
Holdfast 14-12-23-26W21739.5 30.8 Y 0.59 0.15 0.236 0.1494 0.512063 "8.51743.7 26.6 Y 0.30 0.062 0.199 0.1261 0.511999 "8.41750.7 19.8 Y 0.45 0.11 0.226 0.1432 0.512017 "9.11753.5 16.8 Y 0.54 0.13 0.229 0.1450 0.511949 "10.51756.8 13.7 Y 0.48 0.11 0.211 0.1342 0.511921 "10.41760.4 10.1 Y 0.38 0.084 0.211 0.1341 0.511947 "9.91764.2 6.1 Y 0.56 0.13 0.221 0.1400 0.511860 "11.91767.3 3.0 Y 0.50 0.11 0.214 0.1358 0.511878 "11.31770.2 0.3 Y 0.50 0.11 0.206 0.1308 0.511811 "12.4
Pangman 3-14-8-20W22576.6 18.8 Y 2.25 0.38 0.161 0.1024 0.511643 "14.02579.6 15.9 Y 7.40 1.17 0.151 0.0957 0.511466 "17.12582.9 12.5 Y 31.0 6.72 0.206 0.1310 0.511363 "21.12587.7c 7.9 W 130 24.6 0.180 0.1142 0.511348 "20.42595.4c 0 W 40.5 8.28 0.195 0.1238 0.511294 "22.0
Conodont DataHartaven 2-11-10-9W22265.1 83.5 St 189 34.5 0.174 0.1105 0.511930 "8.92273.3 72.3 St 115 23.2 0.192 0.1216 0.511954 "9.02282.6 64.0 St 100 19.9 0.189 0.1201 0.512021 "7.6
a Name of the formation samples were collected from: St ! Stony Mountain; H ! Herald; Y ! Yeoman; W ! Winnipeg.b !Nd values calculated at 450 Ma. !Nd(450) ! {((143Nd/144Ndsample(0) " (147Sm/144Ndsample(o) (e$(450Ma) " 1)))/ (143Nd/144NdCHUR(0) "
(147Sm/144NdCHUR(0) (e$(450Ma) " 1))))"1} ' 104 present day ! (0).c Denotes whole-rock sandstone samples.
245143Nd/144Nd and Sm/Nd stratigraphy of Ordovician carbonates

Table 2. Sm and Nd isotope and concentration data for lowa core samples.
Subsurfacedepth (m)
compiledsection (m) Fm.a
Nd(ppm)
Sm(ppm) Sm/Nd 147Sm/144Nd 143Nd/144Nd !Nd(450)b
Acid-soluble fraction of carbonates and whole rock shalec samplesNelson 3
428.5 154.0 Mq 4.44 0.98 0.211 0.1337 0.512007 "8.7436.5 146.1 Mq 5.32 1.17 0.210 0.1332 0.511995 "8.9446.5 136.0 Mq 5.97 1.30 0.207 0.1311 0.511999 "8.8454.2 128.4 Mq 4.16 0.92 0.212 0.1344 0.511982 "9.2462.7 119.9 Mq 4.19 0.83 0.188 0.1194 0.512011 "7.8470.9 111.6 Mq 3.57 0.71 0.189 0.1200 0.512017 "7.7480.1 102.5 Mq 4.38 0.83 0.181 0.1151 0.512015 "7.5
Peterson 1265.8 101.8 Mq 1.51 0.33 0.206 0.1308 0.511991 "8.8271.8 96.0 Mq 4.89 1.25 0.245 0.1552 0.512100 "8.1275.6 92.0 Mq 6.22 1.59 0.244 0.1549 0.512050 "9.1280.6 87.2 Db 6.88 2.00 0.277 0.1755 0.512054 "10.2285.0 82.6 Db 6.67 1.73 0.248 0.1572 0.512033 "9.5286.9 80.8 Db 6.77 1.62 0.228 0.1450 0.512122 "7.1288.3 79.2 Db 7.08 1.63 0.220 0.1395 0.512120 "6.8291.7 75.9 WL 5.53 1.02 0.177 0.1121 0.512070 "6.2293.0 74.7 WL 9.72 1.87 0.183 0.1163 0.512010 "7.6296.8 71.0 WL 3.11 0.63 0.193 0.1222 0.511959 "9.0301.9 65.8 WL 1.55 0.33 0.204 0.1294 0.511930 "10.0304.3 63.4 WL 6.52 1.37 0.200 0.1268 0.511810 "12.2306.9 60.7 WL 1.91 0.42 0.210 0.1333 0.511716 "14.3308.0 59.7 WL 2.55 0.57 0.213 0.1354 0.511690 "15.0311.0 56.7 WL 3.41 0.76 0.213 0.1354 0.511691 "15.0314.4 53.3 Dl 2.41 0.55 0.218 0.1381 0.511675 "15.4317.6 50.0 Dl 4.72 1.11 0.224 0.1422 0.511653 "16.1320.0 47.5 Dl 5.13 1.14 0.212 0.1348 0.511596 "16.8322.8 44.8 Dl 2.12 0.50 0.226 0.1436 0.511672 "15.8326.4 41.1 Dl 3.76 0.87 0.222 0.1405 0.511766 "13.8329.6 37.9 Dl 2.42 0.49 0.192 0.1218 0.511725 "13.5332.2 35.4 Dl 10.4 2.29 0.211 0.1337 0.511570 "17.2334.3 32.3 Dl 7.78 1.55 0.190 0.1205 0.511466 "18.5335.7 31.9 Dl 6.04 1.15 0.181 0.1149 0.511510 "17.3337.3 30.5 Dl 13.8 3.03 0.210 0.1331 0.511476 "19.0338.4 29.2 Dl 22.8 4.61 0.193 0.1222 0.511549 "17.0339.9 27.7 Dl 15.6 3.00 0.184 0.1167 0.511484 "17.9342.6 25.0 Dl 9.87 2.05 0.198 0.1256 0.511446 "19.2345.2 22.4 Dl 2.77 0.51 0.174 0.1104 0.511493 "17.4347.7 20.1 Dl 1.03 0.18 0.168 0.1065 0.511501 "17.0352.2 15.4 Dl 20.4 3.98 0.186 0.1180 0.511544 "16.8353.7c 14.0 Dc 14.6 2.10 0.140 0.0886 0.511320 "19.5356.1 11.6 Dc 5.04 0.89 0.169 0.1073 0.511740 "12.4356.8 11.0 Dc 2.68 0.49 0.174 0.1106 0.511694 "13.5358.3 9.4 Dc 4.90 0.95 0.183 0.1160 0.511688 "13.9360.6c 7.0 Dc 47.0 8.10 0.165 0.1046 0.511330 "20.2
Insoluble residue of carbonatesPeterson 1
271.8 96.0 Mq 26.4 3.13 0.113 0.0716 0.511837 "8.5285.0 82.6 Db 23.2 2.75 0.113 0.0717 0.511825 "8.7288.3 79.2 Db 23.2 2.82 0.116 0.0733 0.511903 "7.2293.0 74.7 WL 14.2 1.98 0.133 0.0841 0.511788 "10.1304.3 63.4 WL 4.67 0.67 0.137 0.0870 0.511754 "10.9311.0 56.7 WL 10.9 1.18 0.102 0.0649 0.511689 "10.9320.0 47.5 Dl 6.26 0.78 0.119 0.0754 0.511618 "12.9332.2 35.4 Dl 6.59 1.02 0.147 0.0931 0.511597 "14.4342.6 25.0 Dl 8.59 1.27 0.141 0.0893 0.511379 "18.4356.1 11.6 Dc 7.40 1.11 0.143 0.0905 0.511410 "17.9356.8 11.0 Dc 11.7 1.71 0.140 0.0887 0.511367 "18.6
Calculated carbonate whole-rock datadPeterson 1
271.8 96.0 Mq 7.91 1.51 0.183 0.1164 0.511977 "8.3285.0 82.6 Db 9.52 1.90 0.192 0.1218 0.512059 "9.2288.3 79.2 Db 8.79 1.75 0.191 0.1215 0.511946 "7.0293.0 74.7 WL 10.3 1.88 0.175 0.1111 0.511969 "8.2
(continued)
246 K. C. Fanton et al.

detrital and authigenic silicates, oxides, and biogenic apatitegrains. Dissolution of a whole rock carbonate results in twofractions, an AS fraction encompassing all carbonate and non-carbonate components that are HCl soluble, and the remainingHCl IR.Whole-rock carbonates in this study show a positive covaria-
tion between the Nd concentration in the AS fraction andweight percent IR (Fig. 3a). This correlation suggests Nd andSm are being leached from the noncarbonate component,thereby influencing the Nd concentration of the AS fraction, butit does not clarify what fraction of the noncarbonate componentwas mobilized. Igneous silicate and oxide minerals will berelatively unaffected by the HCl digestion and can be ruled outas significant sources of REE to the AS fraction. Cation ex-change sites in clay minerals may contribute some REE, butAwwiller (1994) found that Eocene shales from south centralTexas contained only 30 ppb of Nd in exchangeable sites. Thisis expected given the low concentrations of trivalent REEs inaqueous fluids relative to the more concentrated monovalentand divalent ions, such as Ca#2 and Na#1, which compete withthe REEs for positions in exchangeable sites. Accordingly,exchangeable Nd in clays cannot account for the 1 to 10 ppmof HCl-soluble Nd leached from Eocene shales (Awwiller,1994).Assuming that the HCl digestion does not further disturb the
clay mineral lattice, the mobile Nd in the noncarbonate fractionlikely originates from soluble REE-rich accessory phases, suchas apatite, or Fe-Mn coatings on detrital grains. Fragments ofbiogenic apatite have been observed in the$0.2-"m fraction ofshales (Ohr et al., 1991) and are likely a ubiquitous REE-richphase in many marine sediments. Even marine carbonates withlow yields of phosphatic fossils may contain finely dispersedapatite mineral debris. The concentration of Nd in biogenicapatite (100 to 2000 ppm) and Fe-Mn coatings (150 to 600ppm) are very high (Wright et al., 1984; Palmer, 1985; Palmerand Elderfield, 1985, 1986; Shaw and Wasserburg, 1985; Stau-digel et al., 1985) and can account for the majority of mobileNd in our noncarbonate fraction. In fact biogenic apatite and
Fe-Mn coatings have also been found to contribute the majorityof Nd to the leachate of shales (Awwiller, 1994; Schaltegger etal., 1994).Regardless of the source, the similarity in !Nd values be-
tween the apatite of six conodont samples and the AS fraction
Table 2. (Continued)
Subsurfacedepth (m)
compiledsection (m) Fm.a
Nd(ppm)
Sm(ppm) Sm/Nd 147Sm/144Nd 143Nd/144Nd !Nd(450)b
304.3 63.4 WL 6.42 1.33 0.199 0.1263 0.511808 "12.1311.0 56.7 WL 3.89 0.78 0.194 0.1230 0.511691 "14.3320.0 47.5 Dl 5.35 1.07 0.192 0.1215 0.511601 "15.9332.2 35.4 Dl 9.06 1.85 0.196 0.1242 0.511577 "16.5342.6 25.0 Dl 9.50 1.82 0.184 0.1168 0.511428 "19.0356.1 11.6 Dc 5.20 0.91 0.167 0.1058 0.511707 "12.9356.8 11.0 Dc 3.13 0.55 0.169 0.1071 0.511633 "14.5
Conodont dataPeterson 1291.7 75.9 WL 294 56.7 0.184 0.1164 0.512027 "7.3299.5 68.1 WL 267 54.4 0.194 0.1230 0.511872 "10.7317.6 50.0 Dl 173 44.5 0.244 0.1551 0.511600 "16.7
a Name of the formation samples were collected from: Mq ! Maquoketa; Db ! Dubuque; WL ! Wise Lake; Dl ! Dunleith; Dc ! Decorah.b !Nd values calculated at 450Ma. !Nd(450) ! {((143Nd/144Ndsample(0) " (147Sm/144Ndsample(0) (e$(450Ma) " 1)))/(143Nd/144NdCHUR(0) " (147Sm/
144NdCHUR(0) (e$(450Ma) " 1)))) " 1} ' 104. Present day ! (0).c Denotes whole-rock shale samples.d Whole-rock carbonate values are based on material balance calculations that use measured values from the insoluble-residue and acid-soluble
fractions.
Fig. 3. The weight percent insoluble residue vs. (a) the Nd concen-tration and (b) the Sm/Nd ratios of the acid soluble fraction of Iowa andSaskatchewan carbonates.
247143Nd/144Nd and Sm/Nd stratigraphy of Ordovician carbonates

of their enclosing whole-rock carbonate (Table 2) indicates thatthe bulk of the Nd in the AS fraction is derived from seawateroverlying the depositional site or from early diagenetic porewaters. There is also a close correspondence between Sm/Ndratios of the AS fractions of carbonates and coexisting con-odonts (mostly within 0.01 U; Table 2), indicating that theSm/Nd ratios of the AS fractions are not changed by carbonatedissolution in the laboratory. Sm/Nd ratios of the AS fractionsare also comparable to those determined by Holmden et al.(1998) for late Middle Ordovician biogenic apatite sampledacross a single K-bentonite defined time slice extending be-tween the Transcontinental Arch and Taconic Orogen.Even though the Sm/Nd ratios of the AS fraction appear to
remain unchanged during acid digestion, this observation mustbe reconciled with the low Sm/Nd ratios (0.10 to 0.14) of the IR(Table 2). Similarly low Sm/Nd ratios have also been docu-mented for the residues resulting from acid leaching of shales,and of marlstone (Awwiller, 1994; Ohr et al., 1994; Bellanca etal., 1997). One explanation for our low Sm/Nd ratios is that thenoncarbonate fraction consists of a mixture of HCl-insolublephases with relatively low Sm/Nd ratios (the IR), and ASphases, such as biogenic apatite and Fe-Mn coatings on detritalgrains, with relatively high Sm/Nd ratios. HCl dissolutionpreferentially removes the apatite and coatings, leaving lowSm/Nd ratios in the remaining IR. Alternatively, we cannot ruleout the possibility that the Sm/Nd ratios of the IR are altered asa direct consequence of acid digestion in the laboratory, but theclose correspondence between Sm/Nd ratios of conodonts andthe AS fractions would suggest that this is not the case.Because almost all samples have experienced some degree of
dolomitization, we briefly consider the effect of diagenesis onthe !Nd values and Sm/Nd ratios of the carbonates. Banner et al.(1988) found that the !Nd values of marine limestones remainedunchanged during two major episodes of extensive dolomitiza-tion. Marine and nonmarine diagenetic fluids have such low Ndconcentrations that fluid:rock ratios on the order of 103 orhigher are necessary to alter the !Nd values of the originallimestone (Banner et al., 1988), including the Fe-Mn coatingsand biogenic apatite (Palmer and Elderfield, 1986; Grandjeanand Albarede, 1989; Holmden et al., 1996). Even thoughFe-Mn coatings and floccules may be susceptible to dissolutionand reprecipitation during diagenesis in response to changingoxidation states in pore waters, the Nd isotopic compositionshould remain unaffected because the main source of Nd topore waters is most likely from the dissolution of the flocculesor coatings (Palmer and Elderfield, 1985).Although REE profiles, and therefore Sm/Nd ratios, are more
susceptible to diagenetic effects than !Nd, Palmer and Elder-field (1986) showed that REE profiles of Atlantic foraminiferaof Recent and Cenozoic age had Sm/Nd ratios that differed byonly 0.02 U. Such a small change in Sm/Nd would have littleeffect on the overall shape of our !Nd profile, where variationsare on the order of 3 to 10 epsilon units.We conclude that the AS fraction appears to record the !Nd
of seawater. Dissolvable phases in the noncarbonate componentwill elevate Nd concentrations in the AS fraction but themajority of this excess Nd is likely provided by biogenic apatiteand Fe-Mn coatings. These two phases scavenge Nd fromseawater, and therefore contribute Nd with an isotopic compo-sition equivalent to that preserved within the carbonate lattice.
Finally, even if clay interlayer sights are disturbed duringcarbonate dissolution, this may not effect preservation of sea-water !Nd values because pelagic clays and overlying oceanwater can have similar Nd isotopic compositions (Goldsteinand O’Nions, 1981) as can the dissolved and detrital fractionsof rivers (Goldstein and Jacobsen, 1987).
7. Nd ISOTOPIC PROFILE—IOWA
Nd from the AS fraction in Iowa carbonates exhibits fourmajor oscillations in !Nd (Fig. 2) that are interpreted to reflectfluctuations in sea level. The excursions in the mid-Decorah(I-1), basal Dunleith (I-2), and mid-Dunleith (I-3) display apattern of initially increasing, then decreasing !Nd values (Fig.2, Table 2). Increasing !Nd values of the I-1, I-2, and I-3excursions are interpreted as mixtures of Precambrian andTaconic-derived Nd that resulted from sea level rise, partialsubmergence of the Transcontinental Arch and CanadianShield, and westward expansion of water masses carrying Tac-onic-derived Nd (Fig. 2, Table 2). Decreasing !Nd values reflectsea level fall and reestablishment of the Precambrian Arch andShield signatures. In comparison to I-1 and I-3, the smallermagnitude I-2 excursion from !Nd ! "19 to "17 suggests asmaller contribution of Taconic-derived Nd. Alternatively, theI-2 excursion could reflect local changes in the weighted,average flux of Nd from basement terranes of the Arch andShield.The fourth excursion (I-4) is characterized by a steady in-
crease in !Nd through the Wise Lake, from "15 to "6.2, withno corresponding return to preshift values (Fig. 2, Table 2). TheI-4 shift reflects complete submergence of the Arch and Shield,leaving the Taconic Orogen as the sole provider of dissolvedNd to the central Midcontinent epeiric sea. Epsilon Nd valuesindicative of Taconic-derived Nd persist for the remainder ofthe sampled section.Important similarities and differences are evident between
the !Nd record of Late Ordovician sea level change and con-ventional sea level curves for the Iowa area (Fig. 4; Witzke andKolata, 1989; Witzke and Bunker, 1996). The I-1, I-2, and I-3isotopic excursions all mirror predicted transgressive–regres-sive events (T-R cycles; 4B, 5A, and 5B, respectively) (Fig. 4),and small !Nd excursions between I-2 and I-3 correspond toT-R subcycles within the 5A T-R event. As expected, thepositive isotopic shifts denote transgressions marked by de-creases in clastic content, expansion of carbonate facies, anddrowning of siliclastic source terranes. The negative isotopicshifts signify regressions marked by shale progradation orgeneral increase in the clastic content of the carbonates. Atransgressive event should ostensibly correspond with the I-4!Nd shift, but an upward increase in calcareous algae andstorm-generated grainstone layers through this interval (T-Rcycle 5C) indicates a regressive event, culminating in maxi-mum regression at the top of the Wise Lake (Fig. 4; Witzke andKolata, 1989; Witzke and Bunker, 1996).The I-4 isotopic excursion highlights an important distinc-
tion between sea level curves and the Nd isotope profile. The!Nd profile preserves sea level changes relative to the height ofthe Arch and Shield, much like preserving a watermark on theside of the emergent Precambrian basement. Therefore, the !Ndprofile cannot distinguish between eustatic sea level change and
248 K. C. Fanton et al.

relative sea level change resulting from uplift or subsidence ofthe Arch and Shield. The sea level curve of Witzke and Bunker(1996) is instead a reflection of changing depth. Therefore wesuggest that during the I-4 interval, sea level rose relative to theArch while water depth shallowed due to a carbonate produc-tion rate that exceeded the rate of sea level rise.The sea level interpretation of the Nd isotopic profile is also
compatible with paleoecologic interpretations based on con-odonts collected from the cored section. Although sparse, spec-imens of Phragmodus undatus recovered from samples at thepeak of the positive excursions of I-1 and I-2 are consistentwith a relatively deeper water facies (Fig. 4). Specimens ofPlectodina, a genus indicating intermediate depth, appear in theconodont assemblages between the I-2 and I-3 transgressions,coinciding with the return of more negative !Nd values (!Nd !"19) (Fig. 4). Species of Amorphognathus and Periodon ap-pear throughout the I-4 interval (Fig. 4). These genera areimmigrants from the cold-water Atlantic faunal region on thecontinental margin and are generally deeper, cooler water
forms. However, they also occur with significant quantities ofthe intermediate depth Plectodina from the Midcontinent fau-nal region. Although a mixed conodont fauna through the I-4interval is ambiguous regarding depth, the presence of theimmigrant eastern fauna coincides with the increasing contri-bution of dissolved Nd from the Taconic Orogen, as recordedin Iowa carbonates.The persistence of purely Taconic-derived Nd from the top
of the Wise Lake into the lower Maquoketa (Fig. 4, Table 2)indicates that the Precambrian basement remained covered byseawater, or carbonate sediment after the I-4 shift. In eithercase, the flux of Nd weathered from the Precambrian basementof the Arch and Shield is shut off, and until the Precambrianbasement is reexposed, !Nd values of neighboring carbonatescan no longer resolve changes in sea level. For example, the!Nd profile cannot resolve the large transgression at the base ofthe Maquoketa (Fig. 4).An interesting question concerns the timing of the reexpo-
sure of Precambrian basement and reestablishment of Precam-
Fig. 4. Comparison of the !Nd curve from Iowa, the sea level curve of Witzke and Bunker (1996), and conodontpaleoecology from this study, which is denoted by lettering next to the Iowa section. Conodont abbreviations are listed bydecreasing depth: A. ! Amophognathus; Ph. ! Phragmodus; Pr. ! Periodon; Pl. ! Plectodina. Other abbreviations areas in Figure 2.
249143Nd/144Nd and Sm/Nd stratigraphy of Ordovician carbonates

brian derived Nd in Iowa carbonates. Thus far, !Nd data forPhanerozoic clastic successions of the southeastern UnitedStates and the Arctic show that after the Late Ordovician thePrecambrian source signature is not observed again in thePaleozoic (Gleason et al., 1995; Patchett et al., 1999a). Patchettet al. (1999a) propose that cannibalistic recycling of the largevolume of sediment derived from the Taconic and the Cale-donian Orogenies dominated the sedimentary budget until therise of the Cordillera began to shed new sediment. The !Ndvalues of carbonates in the continental interior may be moresensitive to changes in the age make-up of surrounding exposedcrust and reexposure of Precambrian basement.Correlated changes in !Nd, sea level, and conodont paleo-
ecology provide strong evidence linking submergence of theArch and Shield with changes in the Nd isotope balance inneighboring epeiric seas. However, the net flux of Nd intoMidcontinent seas is also influenced by changes in source areaweathering rates. For example, uplift of the Taconic Orogenmay accelerate weathering, delivering more Nd to Midconti-nent seas and shifting the isotope balance toward the Taconicsignature. Likewise, temporal variations in climate (aridity/humidity) over the Arch and Shield may also influence weath-ering rates, shifting the isotope balance toward the Precambrianbasement signature. Although changes in weathering ratesshould influence the Nd isotope balance in epeiric seas, it isdifficult to isolate this control from changes in the total area ofexposed crust. For example, Taconic uplift has been associatedwith subsidence and sea level rise as a result of flexural warp-ing of the eastern margin of North America (Holland andPatzkowsky, 1996). Therefore uplift and increased weatheringof the Taconic Orogen will be associated with a relative sealevel rise, and submergence of the Arch and Shield. Our inter-pretation that the !Nd profile predominantly records the LateOrdovician submergence history of the Arch and Shield is thesimplest explanation of a potentially complex system.The question of whether !Nd values of carbonates could be
affected by windborn detritus or volcanic ash must be ad-dressed. Nd is particle reactive and is likely to remain seques-tered to particles during sedimentation. Jones et al. (1994)showed that modern ash from Pacific rim volcanic arcs con-tributed minimal REE to North Pacific deep water. Holmden etal. (1996) showed that conodonts from within 10 cm of theMillbrig K-bentonite had !Nd values that appeared to be unaf-fected by Nd derived from the altered volcanic ash. Ash fallsmay influence the !Nd values of epeiric seawater during ashfall, but the duration of such an event is short in comparison toour !Nd excursions, which likely span hundreds of thousands ofyears.
8. Nd ISOTOPE STRATIGRAPHY
In Saskatchewan, Upper Ordovician carbonates of the Yeo-man exhibit a single, large positive isotope shift (!Nd ! "21 to"9) that can be correlated with the I-4 shift in Iowa (Fig. 2).Assuming that these isotope excursions are synchronous, thelower part of the Yeoman is correlated with the entire WiseLake of Iowa. Both !Nd shifts display similar magnitudes andare followed by an uninterrupted succession of carbonates with!Nd values of approximately "6 to "9 (Fig. 2), providingevidence that the I-4 and Yeoman excursions are recording the
same sea level rise. This conclusion is supported by the con-odont faunas and graphic correlation (Sweet, 1982). Althoughthe magnitudes of the I-4 and Yeoman isotopic shifts areapproximately 10 epsilon units, the Yeoman isotope excursionis offset toward more negative values (Fig. 2, Tables 1 and 2),suggesting that the Williston Basin may have continued toreceive minor amounts of Nd from small islands of exposedCanadian Shield to the north or east. An extension of the !Ndprofile into strata older than the Yeoman is prevented by theunderlying clastics of the Winnipeg.It is possible that there is an additional northern source of Nd
to the Williston Basin that has been linked by Patchett et al.(1999b) to the early phase of the Caledonian Orogen. An !Ndshift in clastics of the Arctic Islands occurs between 460 to 440Ma, and falls within the time frame of our stratigraphic sections(Patchett et al., 1999b). However, because the !Nd signature ofthis northern source is indistinguishable from that of the Tac-onic, the impact of this northern source on the Nd isotopebalance of the Williston Basin, or other Midcontinent epeiricseas, will be similar to that described for the Taconic.The Nd isotope stratigraphy can refine previous correlations
between Upper Ordovician marine carbonates across the Trans-continental Arch. In general, recognition of the time equiva-lency of Galena Group through lower Maquoketa strata withthat of the Yeoman and Herald has long been accepted (Sweetand Bergstrom, 1976; Sweet, 1979; Witzke, 1980). Biostrati-graphic and lithostratigraphic refinement of this generalizationhas placed the base of the Yeoman equivalent to either the base(Sweet, 1979; Witzke, 1980) or middle (Sloan, 1987) of theDunleith. By use of Nd isotope stratigraphy, we instead corre-late the base of the Yeoman with the base of the Wise Lake.The Edenian to Maysvillian age assigned to the Yeoman byNorford et al. (1994) and the conodont faunas recovered fromthis study, which include Culombodina penna, support thisconclusion because the Dunleith is generally considered to beShermanian in age, whereas the Wise Lake is considered to beEdenian to Maysvillian in age (Fig. 2; Witzke, 1980; Sloan,1987).However, placement of the Edenian–Shermanian boundary
in Iowa is uncertain and has only been provisionally placed atthe base of the Wise Lake (Fig. 2; Witzke, 1987; Witzke andBunker, 1996). The occurrence of Periodon grandis, 5 m abovethe base of the Wise Lake in the Peterson 1 core (Fig. 2),constrains the basal portion of the Wise Lake to be no youngerthan Edenian to earliest Maysvillian. In the Saskatchewansection, the presence of Pseudobelodina vulgaris vulgaris at thebase of the Yeoman (Fig. 2) in the Pangman well indicates anage no older than mid-Edenian. In addition, the presence ofspecimens of C. penna within the Yeoman in the Holdfast core(Fig. 2) indicates a mid-Edenian to mid-Maysvillian age. Be-cause the isotope stratigraphy indicates that the base of theYeoman is equivalent to the base of the Wise Lake, we cancombine the biostratigraphic data from Iowa and Saskatchewanto conclude that in our cores the base of the Yeoman and WiseLake must be mid-Edenian to earliest Maysvillian in age.One further paleogeographic clarification within the Willis-
ton Basin can be made by using the !Nd value of the clasticsthat comprise the argillaceous interval of the Stony Mountain.These argillaceous carbonates and shale interbeds thicken to-ward the eastern margins of the basin, which are delineated by
250 K. C. Fanton et al.
the Arch and Shield. Witzke (1980) suggested these shaleswere derived from the Arch. Osadetz and Haidl (1989) arguedfor a source of clastics beyond the Arch and Shield from theTaconic Orogen. The !Nd value for the clastics in this intervalyielded "8, a clear Taconic source signature. Knowing thatclastics in Saskatchewan have a Taconic source indicates thatthe Arch was once again submerged and that a seaway con-nected the central Midcontinent and the Williston Basin.
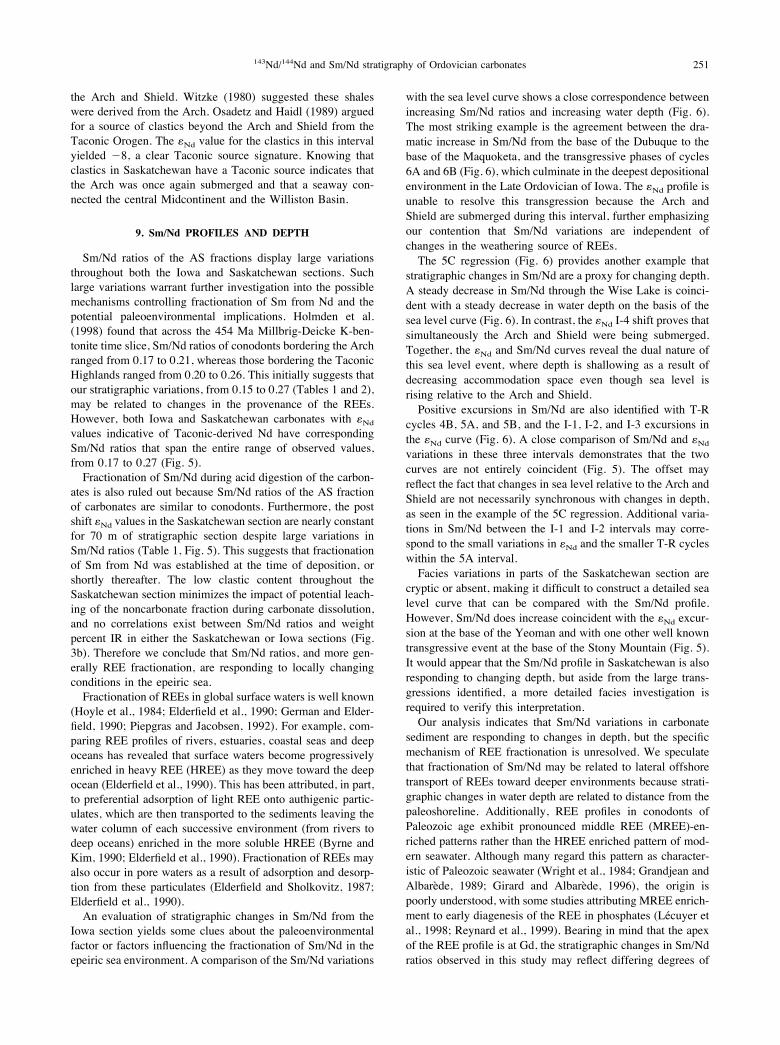
9. Sm/Nd PROFILES AND DEPTH
Sm/Nd ratios of the AS fractions display large variationsthroughout both the Iowa and Saskatchewan sections. Suchlarge variations warrant further investigation into the possiblemechanisms controlling fractionation of Sm from Nd and thepotential paleoenvironmental implications. Holmden et al.(1998) found that across the 454 Ma Millbrig-Deicke K-ben-tonite time slice, Sm/Nd ratios of conodonts bordering the Archranged from 0.17 to 0.21, whereas those bordering the TaconicHighlands ranged from 0.20 to 0.26. This initially suggests thatour stratigraphic variations, from 0.15 to 0.27 (Tables 1 and 2),may be related to changes in the provenance of the REEs.However, both Iowa and Saskatchewan carbonates with !Ndvalues indicative of Taconic-derived Nd have correspondingSm/Nd ratios that span the entire range of observed values,from 0.17 to 0.27 (Fig. 5).Fractionation of Sm/Nd during acid digestion of the carbon-
ates is also ruled out because Sm/Nd ratios of the AS fractionof carbonates are similar to conodonts. Furthermore, the postshift !Nd values in the Saskatchewan section are nearly constantfor 70 m of stratigraphic section despite large variations inSm/Nd ratios (Table 1, Fig. 5). This suggests that fractionationof Sm from Nd was established at the time of deposition, orshortly thereafter. The low clastic content throughout theSaskatchewan section minimizes the impact of potential leach-ing of the noncarbonate fraction during carbonate dissolution,and no correlations exist between Sm/Nd ratios and weightpercent IR in either the Saskatchewan or Iowa sections (Fig.3b). Therefore we conclude that Sm/Nd ratios, and more gen-erally REE fractionation, are responding to locally changingconditions in the epeiric sea.Fractionation of REEs in global surface waters is well known
(Hoyle et al., 1984; Elderfield et al., 1990; German and Elder-field, 1990; Piepgras and Jacobsen, 1992). For example, com-paring REE profiles of rivers, estuaries, coastal seas and deepoceans has revealed that surface waters become progressivelyenriched in heavy REE (HREE) as they move toward the deepocean (Elderfield et al., 1990). This has been attributed, in part,to preferential adsorption of light REE onto authigenic partic-ulates, which are then transported to the sediments leaving thewater column of each successive environment (from rivers todeep oceans) enriched in the more soluble HREE (Byrne andKim, 1990; Elderfield et al., 1990). Fractionation of REEs mayalso occur in pore waters as a result of adsorption and desorp-tion from these particulates (Elderfield and Sholkovitz, 1987;Elderfield et al., 1990).An evaluation of stratigraphic changes in Sm/Nd from the
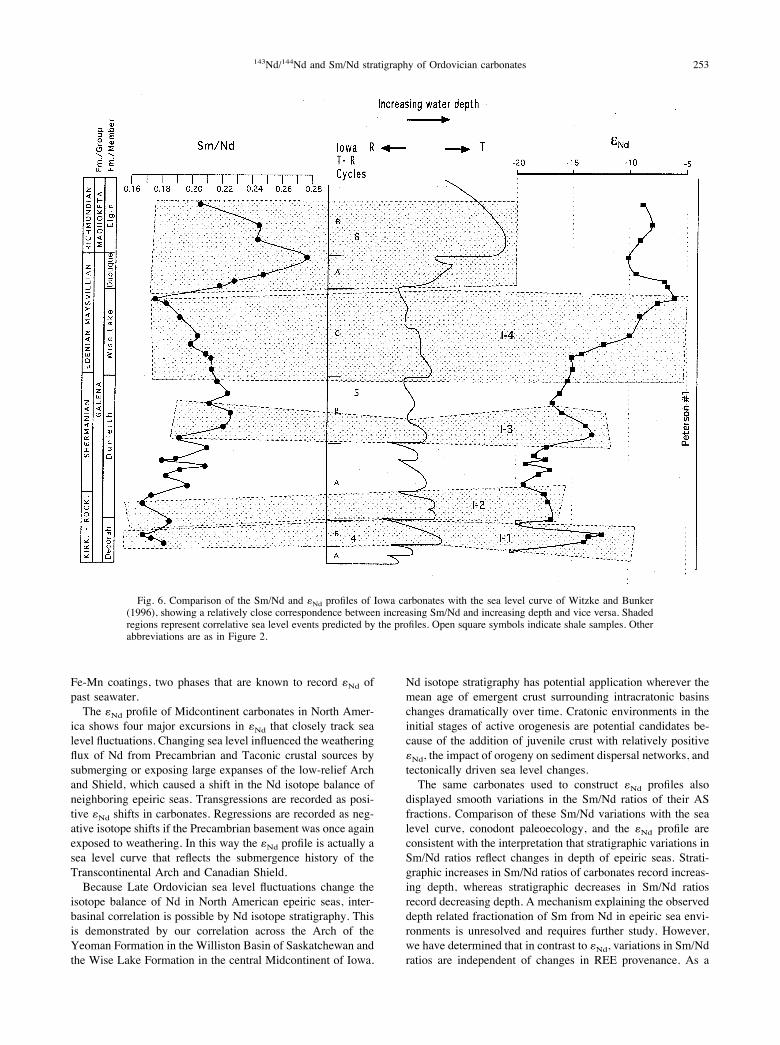
Iowa section yields some clues about the paleoenvironmentalfactor or factors influencing the fractionation of Sm/Nd in theepeiric sea environment. A comparison of the Sm/Nd variations
with the sea level curve shows a close correspondence betweenincreasing Sm/Nd ratios and increasing water depth (Fig. 6).The most striking example is the agreement between the dra-matic increase in Sm/Nd from the base of the Dubuque to thebase of the Maquoketa, and the transgressive phases of cycles6A and 6B (Fig. 6), which culminate in the deepest depositionalenvironment in the Late Ordovician of Iowa. The !Nd profile isunable to resolve this transgression because the Arch andShield are submerged during this interval, further emphasizingour contention that Sm/Nd variations are independent ofchanges in the weathering source of REEs.The 5C regression (Fig. 6) provides another example that
stratigraphic changes in Sm/Nd are a proxy for changing depth.A steady decrease in Sm/Nd through the Wise Lake is coinci-dent with a steady decrease in water depth on the basis of thesea level curve (Fig. 6). In contrast, the !Nd I-4 shift proves thatsimultaneously the Arch and Shield were being submerged.Together, the !Nd and Sm/Nd curves reveal the dual nature ofthis sea level event, where depth is shallowing as a result ofdecreasing accommodation space even though sea level isrising relative to the Arch and Shield.Positive excursions in Sm/Nd are also identified with T-R
cycles 4B, 5A, and 5B, and the I-1, I-2, and I-3 excursions inthe !Nd curve (Fig. 6). A close comparison of Sm/Nd and !Ndvariations in these three intervals demonstrates that the twocurves are not entirely coincident (Fig. 5). The offset mayreflect the fact that changes in sea level relative to the Arch andShield are not necessarily synchronous with changes in depth,as seen in the example of the 5C regression. Additional varia-tions in Sm/Nd between the I-1 and I-2 intervals may corre-spond to the small variations in !Nd and the smaller T-R cycleswithin the 5A interval.Facies variations in parts of the Saskatchewan section are
cryptic or absent, making it difficult to construct a detailed sealevel curve that can be compared with the Sm/Nd profile.However, Sm/Nd does increase coincident with the !Nd excur-sion at the base of the Yeoman and with one other well knowntransgressive event at the base of the Stony Mountain (Fig. 5).It would appear that the Sm/Nd profile in Saskatchewan is alsoresponding to changing depth, but aside from the large trans-gressions identified, a more detailed facies investigation isrequired to verify this interpretation.Our analysis indicates that Sm/Nd variations in carbonate
sediment are responding to changes in depth, but the specificmechanism of REE fractionation is unresolved. We speculatethat fractionation of Sm/Nd may be related to lateral offshoretransport of REEs toward deeper environments because strati-graphic changes in water depth are related to distance from thepaleoshoreline. Additionally, REE profiles in conodonts ofPaleozoic age exhibit pronounced middle REE (MREE)-en-riched patterns rather than the HREE enriched pattern of mod-ern seawater. Although many regard this pattern as character-istic of Paleozoic seawater (Wright et al., 1984; Grandjean andAlbarede, 1989; Girard and Albarede, 1996), the origin ispoorly understood, with some studies attributing MREE enrich-ment to early diagenesis of the REE in phosphates (Lecuyer etal., 1998; Reynard et al., 1999). Bearing in mind that the apexof the REE profile is at Gd, the stratigraphic changes in Sm/Ndratios observed in this study may reflect differing degrees of
251143Nd/144Nd and Sm/Nd stratigraphy of Ordovician carbonates

MREE enrichment, rather than the HREE enrichment seen inmodern environments.
10. CONCLUSIONS
Late Ordovician epeiric seas of North America had Ndisotopic compositions established by the relative contributions
of Nd derived from weathering of the Precambrian basement ofthe Transcontinental Arch and Canadian Shield and relativelyyounger crust of the Taconic Orogen. Seawater !Nd values arepreserved in the AS fraction of carbonates and are similar to the!Nd values of coexisting conodonts. This implies that Nd in theAS fraction is primarily derived from biogenic apatite and
Fig. 5. Statigraphic variations in Sm/Nd ratios of the acid-soluble fraction of carbonates from Iowa and Saskatchewan areshown in black circles and compared with the complimentary !Nd curve shown in grey squares. An X denotes transgressiveevents in Saskatchewan based on the sedimentology. Open squares indicate data from shale or sandstone.
252 K. C. Fanton et al.
Fe-Mn coatings, two phases that are known to record !Nd ofpast seawater.The !Nd profile of Midcontinent carbonates in North Amer-
ica shows four major excursions in !Nd that closely track sealevel fluctuations. Changing sea level influenced the weatheringflux of Nd from Precambrian and Taconic crustal sources bysubmerging or exposing large expanses of the low-relief Archand Shield, which caused a shift in the Nd isotope balance ofneighboring epeiric seas. Transgressions are recorded as posi-tive !Nd shifts in carbonates. Regressions are recorded as neg-ative isotope shifts if the Precambrian basement was once againexposed to weathering. In this way the !Nd profile is actually asea level curve that reflects the submergence history of theTranscontinental Arch and Canadian Shield.Because Late Ordovician sea level fluctuations change the
isotope balance of Nd in North American epeiric seas, inter-basinal correlation is possible by Nd isotope stratigraphy. Thisis demonstrated by our correlation across the Arch of theYeoman Formation in the Williston Basin of Saskatchewan andthe Wise Lake Formation in the central Midcontinent of Iowa.
Nd isotope stratigraphy has potential application wherever themean age of emergent crust surrounding intracratonic basinschanges dramatically over time. Cratonic environments in theinitial stages of active orogenesis are potential candidates be-cause of the addition of juvenile crust with relatively positive!Nd, the impact of orogeny on sediment dispersal networks, andtectonically driven sea level changes.The same carbonates used to construct !Nd profiles also
displayed smooth variations in the Sm/Nd ratios of their ASfractions. Comparison of these Sm/Nd variations with the sealevel curve, conodont paleoecology, and the !Nd profile areconsistent with the interpretation that stratigraphic variations inSm/Nd ratios reflect changes in depth of epeiric seas. Strati-graphic increases in Sm/Nd ratios of carbonates record increas-ing depth, whereas stratigraphic decreases in Sm/Nd ratiosrecord decreasing depth. A mechanism explaining the observeddepth related fractionation of Sm from Nd in epeiric sea envi-ronments is unresolved and requires further study. However,we have determined that in contrast to !Nd, variations in Sm/Ndratios are independent of changes in REE provenance. As a
Fig. 6. Comparison of the Sm/Nd and !Nd profiles of Iowa carbonates with the sea level curve of Witzke and Bunker(1996), showing a relatively close correspondence between increasing Sm/Nd and increasing depth and vice versa. Shadedregions represent correlative sea level events predicted by the profiles. Open square symbols indicate shale samples. Otherabbreviations are as in Figure 2.
253143Nd/144Nd and Sm/Nd stratigraphy of Ordovician carbonates

depth recorder, stratigraphic variations in Sm/Nd ratios have apotentially wide range of applications in studies relating to thepaleoceanography of ancient epeiric seas.
Acknowledgments—We thank Brian Witzke for his input on the sedi-mentology and depositional environment of Iowa strata. K.F. acknowl-edges D. Fox for laboratory advice and B. R. Pratt, A. Peterhansel, R.Hines, K. Panchuk, and M. Mathe for informative discussions. Wethank C. Barnes, G. Ross, and an anonymous reviewer for their in-sightful comments. This research was supported by an NSERC Indi-vidual Research Grant to C.H.
Associate editor: K. Kyser
REFERENCES
Awwiller D. N. (1994) Geochronology and mass transfer in gulf coastmudrocks (south central Texas, USA): Rb-Sr, Sm-Nd and REEsystematics. Chem. Geol. 116, 61–84.
Banner J. L., Hanson G. N., and Meyers W. J. (1988) Rare earthelement and Nd isotopic variations in regionally extensive dolomitesfrom the Burlington-Keokuk Formation (Mississippian): Implica-tions for REE mobility during carbonate diagenesis. J. Sed. Petrol.58, 415–432.
Barnes C. R. and Fåhraeus L. E. (1975) Provinces, communities and theproposed nektobenthic habit of Ordovician conodontophorids.Lethia 8, 133–149.
Bellanca A., Masetti D., and Neri R. (1997) Rare earth elements inlimestone/marlstone couplets from the Albian-Cenomanian Cismonsection (Venetian region, northern Italy): Assessing REE sensitivityto environmental changes. Chem. Geol. 141, 141–152.
Bernat M. (1975) Les isotopes de l’uranium et du thorium et les terresrares dans l’environment marine. Cah. ORSTROM Ser. Geol. 7,65–83.
Byrne R. H. and Kim K. (1990) Rare earth element scavenging inseawater. Geochim. Cosmochim. Acta 54, 2645–2656.
Canter L. K. (1998) Facies, cyclostratigraphy and secondary diageneticcontrols on reservoir distribution, Ordovician Red River Formation,Midale Field, southern Saskatchewan. In 8thInternational WillistonBasin Symposium Core Workshop Volume,pp. 41–65. SaskatchewanGeological Survey.
Cook T. D. and Bally A. W. (1975) Stratigraphic Atlas of North andCentral America. Princeton University Press.
Elderfield H. and Sholkovitz E. R. (1987) Rare earth elements in thepore waters of reducing nearshore sediments. Earth Planet. Sci. Lett.82, 280–288.
Elderfield H., Upstill-Goddard R., and Sholkovitz E. R. (1990) The rareearth elements in rivers, estuaries, and coastal seas and their signif-icance to the composition of ocean waters. Geochim. Cosmochim.Acta 54, 971–991.
Eugster O., Tera F., and Wasserburg G. J. (1969) Isotopic analyses ofbarium in meteorites and in terrestrial samples. J. Geophys. Res. 74,3897–3908.
Fuller J. G. C. M. (1961) Ordovician and contiguous formations inNorth Dakota, South Dakota, Montana and adjoining areas of Can-ada and the United States. AAPG Bull. 45, 1334–1363.
German R. C. and Elderfield H. (1990) Rare earth elements in the NWIndian Ocean. Geochim. Cosmochim. Acta 54, 1929–1940.
Girard C. and Albarede F. (1996) Trace elements in conodont phos-phates from the Frasnian/Famenian boundary. Palaeogeogr. Palaeo-climatol. Palaeoecol. 126, 195–209.
Gleason J. D., Patchett P. J., Dickinson W. R., and Ruiz J. (1995) Ndisotopic constraints on sediment sources of the Ouachita–Marathonfold belt. Geol. Soc. Am. Bull. 107, 1192–1210.
Goldstein S. L. and O’Nions R. K. (1981) Nd and Sr isotopic relation-ships in pelagic clays and ferromanganese deposits. Nature 292,324–327.
Goldstein S. J. and Jacobsen S. B. (1987) The Nd and Sr isotopicsystematics of river-water dissolved material: Implications for thesources of Nd and Sr in seawater. Chem. Geol. 66, 245–272.
Grandjean P., Cappetta H., Michard A., and Albarede F. (1987) The
assessment of REE patterns and 143Nd/144Nd ratios in fish remains.Earth Planet. Sci. Lett. 84, 181–196.
Grandjean P., Cappetta H., and Albarede F. (1988) The REE and !Ndof 40–70 Ma old fish debris from the west-African platform. Geo-phys. Res. Lett. 15, 389–392.
Grandjean P. and Albarede F. (1989) Ion probe measurement of rareearth elements in biogenic phosphates. Geochim. Cosmochim. Acta53, 3179–3183.
Haidl F. M., Longman M. W., Pratt B. R., and Bernstein, L. M. (1997)Variations in lithofacies in Upper Ordovician Herald and Yeomanformations (Red River), North Dakota and southeastern Saskatche-wan. In CSPG-SEPM 1997 Core Conference Volume, Calgary (eds.J. Wood and B. Martindale), pp. 5–39. Canadian Society of Petro-leum Geologists.
Holland S. M. and Patzkowsky M. E. (1996) Sequence stratigraphy andlong-term paleoceanographic change in the Middle and Upper Or-dovician of the eastern United States. In Paleozoic Sequence Stra-tigraphy: Views from the North American Craton(eds. B. J. Witzke,G. A. Ludvigson, and J. Day), pp. 307–330. Special Paper 306.Geological Society of America.
Holmden C., Creaser R. A., Muehlenbachs K., Bergstrom S. M., andLeslie S. A. (1996) Isotopic and elemental systematics of Sr and Ndin 454. Ma biogenic apatites: Implications for paleoseawater studies.Earth Planet. Sci. Lett. 142, 425–437.
Holmden C., Creaser R. A., Muehlenbachs K., Leslie S. A., andBergstrom S. M. (1998) Isotopic evidence for geochemical decou-pling between ancient epeiric seas and bordering oceans: Implica-tions for secular curves. Geology 26, 567–570.
Hoyle J., Elderfield H., Gledhill A., and Greaves M. (1984) Thebehavior of rare earth elements during mixing of river and seawaters. Geochim. Cosmochim. Acta 48, 143–149.
Jones C. E., Halliday A. N., Rea D. K., and Owen R. M. (1994)Neodymium isotopic variations in North Pacific modern silicatesediment and the insignificance of detrital REE contributions toseawater. Earth Planet. Sci. Lett. 127, 55–66.
Kendall A. C. (1976) The Ordovician Carbonate Succession (BighornGroup) of Southeastern Saskatchewan.Saskatchewan GeologicalSurvey Report 180. Department of Mineral Resources.
Keto L. S. and Jacobsen S. B. (1987) Nd and Sr isotopic variations ofEarly Paleozoic oceans. Earth Planet. Sci. Lett. 84, 27–41.
Keto L. S. and Jacobsen S. B. (1988) Nd isotopic variations of Pha-nerozoic paleoceans. Earth Planet. Sci. Lett. 90, 395–410.
Kreis L. K. and Kent D. M. (2000) Basement controls on Red Riversedimentation and hydrocarbon production in southeasternSaskatchewan. In Summary of Investigations, 2000,Vol. 1,Saskatchewan Energy and Mines Miscellaneous Report 2000-4.1,pp. 21–42.
Lecuyer C., Grandjean P., Barrat J., Nolvak J., Emig C., Paris F., andRobardet M. (1998) %18O and REE contents of phosphatic brachio-pods: A comparison between modern and lower Paleozoic popula-tions. Geochim. Cosmochim. Acta 62, 2429–2436.
Longman M. W., Fertal T. G., and Glennie, J. S. (1983) Origin andgeometry of Red River dolomite reservoirs, western Williston Basin.AAPG Bull. 67, 744–771.
Martin E. E. and Haley B. A. (2000) Fossil fish teeth as proxies forseawater Sr and Nd isotopes. Geochim. Cosmochim. Acta 64, 835–847.
Norford B. S., Haidl F. M., Bezys R. K., Cecile M. P., McCabe H. R.,and Paterson D. F. (1994) Middle Ordovician to Lower Devonianstrata of the Western Canada Sedimentary Basin. In Geological Atlasof the Western Canada Sedimentary Basin(eds. G. Mossop and I.Shetson), pp. 109–127. Canadian Society of Petroleum Geologistsand Alberta Research Council.
Nowlan G. S. and Barnes C. R. (1981) Late Ordovician conodonts fromthe Vaureal Formation, Anticosti Island, Quebec. Geol. Survey Can.Bull. 329, 1–49.
Ohr M., Halliday A. N., and Peacor D. R. (1991) Sr and Nd isotopicevidence for punctuated clay diagenesis, Texas Gulf Coast. EarthPlanet. Sci. Lett. 105, 110–126.
Ohr M., Alexander N. H., and Peacor D. R. (1994) Mobility andfractionation of rare earth elements in argillaceous sediments: Im-plications for dating diagenesis and low-grade metamorphism.Geochim. Cosmochim. Acta 58, 289–312.
254 K. C. Fanton et al.

Osadetz K. G. and Haidl F. M. (1989) Tippecanoe Sequence: MiddleOrdovician to Lowest Devonian—Vestiges of a great epeiric sea. InWestern Canada Sedimentary Basin: A Case History (ed. B. D.Ricketts), pp. 121–137. Canadian Society of Petroleum Geologists.
Palmer M. R. (1985) Rare earth elements in foraminifera tests. EarthPlanet. Sci. Lett. 73, 285.
Palmer M. R. and Elderfield H. (1985) Variations in the Nd isotopiccomposition of foraminifera from Atlantic Ocean sediments. EarthPlanet. Sci. Lett. 73, 299–305.
Palmer M. R. and Elderfield H. (1986) Rare earth elements and neody-mium isotopes in ferromanganese oxide coatings of Cenozoic fora-minifera from the Atlantic Ocean. Geochim. Cosmochim. Acta 50,409–417.
Patchett P. J., Ross G. M., and Gleason J. D. (1999a) Continentaldrainage in North America during the Phanerozoic from Nd isotopes.Science 283, 671–673.
Patchett P. J., Roth M. A., Canale B. S., de Freitas T. A., Harrison J. C.,Embry A. F., and Ross G. M. (1999b) Nd isotopes, geochemistry,and constraints on sources of sediments in the Franklinian mobilebelt, Arctic Canada. Geol. Soc. Am. Bull. 111, 578–589.
Piepgras D. J., Wasserburg G. J., and Dasch E. J. (1979) The isotopiccomposition of Nd in different ocean masses. Earth Planet. Sci. Lett.45, 223–236.
Piepgras D. J. and Wasserburg G. J. (1980) Neodymium isotopicvariations in seawater. Earth Planet. Sci. Lett. 50, 128–138.
Piepgras D. J. and Jacobsen S. B. (1992) The behavior of rare earthelements in seawater: Precise determination of variations in theNorth Pacific water column. Geochim. Cosmochim. Acta 56, 1851–1862.
Pratt B. R., Bernstein L. M., Kendall A. C., and Haidl F. M. (1996)Occurrence of reefal facies in Red River strata (Upper Ordovician),subsurface of Saskatchewan. In Summary of Investigations, 1996,pp.147–152. Miscellaneous Report 96-4. Saskatchewan Energy andMines.
Reynard B., Lecuyer C., and Grandjean P. (1999) Crystal-chemicalcontrols on rare-earth element concentrations in fossil biogenic apa-tites and implications for paleoenvironmental reconstructions. Chem.Geol. 155, 233–241.
Schaltegger U., Stille P., Rais N., Pique A., and Clauer N. (1994)Neodymium and strontium isotopic dating of diagenesis and low-grade metamorphism of argillaceous sediments. Geochim. Cosmo-chim. Acta 58, 1471–1481.
Seddon G. and Sweet W. C. (1971) An ecologic model for conodonts.J. Paleontol. 45, 869.
Shaw H. F. and Wasserburg G. J. (1985) Sm-Nd in marine carbonatesand phosphates: Implications for Nd isotopes in seawater and crustalages. Geochim. Cosmochim. Acta 49, 503–518.
Sloan R. E. (1987) Tectonics, biostratigraphy and lithostratigraphy ofthe Middle and ©Late. Ordovician of the Upper Mississippi Valley.In Middle and Upper Ordovician Lithostratigrahy and Biostratigra-phy of the Upper Mississippi Valley (ed. R. E. Sloan), pp. 7–20.Report of Investigations 35. Minnesota Geological Survery.
Staudigel H., Doyle, P., and Zindler, A. (1985) Sr and Nd isotopesystematics in fish teeth. Earth Planet. Sci. Lett. 76, 45–56.
Stille P., Steinmann M., and Riggs S. R. (1996) Nd isotope evidence for
the evolution of the paleocurrents in the Atlantic and Tethys Oceansduring the past 180 Ma. Earth Planet. Sci. Lett. 144, 9–19.
Sweet W. C. (1979) Late Ordovician conodonts of the western mid-continent province. Brigham Young Univ. Geol. Stud. 26, 45–85.
Sweet W. C. (1982) Graphic correlation of upper Middle and UpperOrdovician rocks, North American Midcontinent Province, USA. InAspects of the Ordovician System (ed. D. L. Burton), pp. 23–35.Palaeontological Contribution 295. University of Oslo.
Sweet W. C. and Bergstrom S. M. (1976) Conodont biostratigraphy ofthe Middle and Upper. Ordovician of the United States Midconti-nent. In The Ordovician System: Proceedings of a PaleontologicalAssociation Symposium (ed. M. G. Bassett), pp. 121–151. Universityof Wales Press and National Museum of Wales.
Sweet W. C. and Bergstrom S. M. (1984) Conodont provinces andbiofacies of the Late Ordovician. In Conodont Biofacies and Pro-vincialism(ed. D. L. Clark), pp. 69–87. Special Paper 196. Geolog-ical Society of America.
Turekian K. K., Katz A., and Chan L. (1973) Trace element trapping inpteropod tests. Limnol. Oceanogr. 18, 240–249.
Vance D. and Burton K. (1999) Neodymium isotopes in planktonicforaminifera: A record of the response of continental weathering andocean circulation rates to climate change. Earth Planet. Sci. Lett.173, 365–379.
Whittaker S. G. and Kyser T. K. (1993) Variations in the neodymiumand strontium isotopic composition and REE content of molluscanshells from the Cretaceous Western Interior seaway. Geochim. Cos-mochim. Acta 57, 4003–4014.
Witzke B. J. (1980) Middle and Upper Ordovician paleogeography ofthe region bordering the Transcontinental Arch. In Rocky MountainPaleogeography Symposium 1: Paleozoic Paleogeography of theWest Central United States (eds. T. D. Fouch and E. R. Magathan),pp. 1–18. Rocky Mountain Section SEPM.
Witzke B. J. (1987) Middle and Upper Ordovician stratigraphy in theIowa subsurface. In Middle and Late Ordovician Lithostratigraphyand Biostratigraphy of the Upper Mississippi Valley(ed. R. E.Sloan), pp. 40–43. Report of Investigations 35. Minnesota Geolog-ical Survey.
Witzke B. J. and Kolata D. R. (1989) Changing structural and depo-sitional patterns, Ordovician Champlanian and. Cincinnatian seriesof Iowa-Illinois. In New Perspectives On the Paleozoic History of theUpper Mississippi Valley; An Examination of the Plum River FaultZone (eds. G. A. Ludvigson and B. J. Bunker). Iowa Department ofNatural Resources, Iowa City. pp. 55–77.
Witzke B. J. and Bunker B. J. (1996) Relative sea-level changes duringMiddle Ordovician through. Mississippian deposition in the Iowaarea, North American craton. In Paleozoic Sequence Stratigraphy:Views from the North American Craton (eds. B. J. Witzke, G. A.Ludvigson, and J. Day), pp. 307–330. Special Paper 306. GeologicalSociety of America.
Wright J., Seymour R. S., and Shaw H. F. (1984) REE and Nd isotopesin conodont apatite: Variations with geological age and depositionalenvironment. In Conodont Biofacies and Provincialism (ed. D. L.Clark), pp. 325–340. Special Paper 196. Geological Society ofAmerica.
255143Nd/144Nd and Sm/Nd stratigraphy of Ordovician carbonates