14.10.2010 Mongolia horizons growth potential and attracting the development dollar, Rob Edwards
11
MONGOLIAN INVESTMENT INSIGHT Growth Potential and Attracting the Investment Dollar HONG KONG October 2010 Rob Edwards +44207 367 7781 +44795 125 3000 [email protected] Mongolia
-
Upload
the-business-council-of-mongolia -
Category
Business
-
view
328 -
download
1
Transcript of 14.10.2010 Mongolia horizons growth potential and attracting the development dollar, Rob Edwards

MONGOLIAN INVESTMENT INSIGHT
Growth Potential and Attracting the Investment Doll ar
HONG KONG
October 2010
Rob Edwards+44207 367 7781+44795 125 [email protected]
Mongolia

Page 2
Disclaimer
This presentation has been prepared for information al purposes only by members of the research divisio n of a subsidiary of Renaissance Capital Holdings Limited which toget her with other subsidiaries operates under the bran d name of Renaissance Capital, for contact details see Bloomb erg page RENA. This presentation has not been prepa red in accordance with legal requirements designed to prom ote the independence of investment research, and is not subject to any prohibition on dealing ahead of the disseminati on of investment research. It has been prepared onl y to assist recipients to make their own evaluation of issues, transactions and companies referred to herein and m ay contain information included in a previously published Rena issance Capital research report.
As a matter of general policy, Renaissance Capital will generally publish research on issuers where th e firm has a lead role in the issuer’s offering of securities; howeve r, the interests of investor clients remain paramou nt and Renaissance Capital will not offer favourable research coverage , specific investment conclusions or recommendation s, or a guarantee of continued coverage as consideration or inducemen t for the receipt of any business or compensation f rom any source.
Renaissance Capital and its affiliates have establi shed and maintain information barriers, such as ‘Ch inese Walls’, to control the flow of information contained in one or more areas within the Renaissance Group of compani es to which Renaissance Capital belongs, into other areas, unit s, groups or affiliates of the Renaissance Group. Renaissance Group maintains a conflicts of interest policy designed t o prevent exploitation for either corporate or pers onal benefit, and ensure that the different business activities of Re naissance Group do not constitute or give rise to m aterial damage to client interests.
The information herein is provided as at the date o f this presentation and is subject to change withou t notice. No representation, warranty or undertaking, express or implied, is made as to, and no reliance should be placed on, the fairness, accuracy, completeness or correctness of the information or the opinions contained herein. This presentation may include forward-looking statements based on num erous assumptions regarding present and future busi ness strategies and the environment operating in the fut ure. No part of this presentation, nor the fact of its distribution, should form the basis of, or be relied on in connection wi th, any contract or commitment or investment decisi on whatsoever. This presentation does not form a fiduciary relatio nship or constitute advice and is not and should no t be construed as a commitment to proceed with any transaction or servi ces. This presentation is not an advertisement of securities, or an offer or a solicitation of an offer to sell, exchan ge or otherwise transfer securities and is not inte nded to facilitate any sale, exchange or transfer of securities to any person or entity. For further important notices please view the Non-Investment Research disclaimer at: http://www.rencap.com/eng/legal_notice.asp#disclaim er.
© 2010 Renaissance Securities (Cyprus) Limited. All rights reserved. Regulated by the Cyprus Securities and Exchange Commission (Licence No: KEPEY 053/04).

LARGEST INDEPENDENT INVESTMENT BANK DEDICATED TO HIGH OPPORTUNITY EMERGING MARKETS
LondonMoscow
New York
Kiev
Cyprus
Almaty
Geneva
Lagos
Nairobi
Harare
Luanda
Accra
Johannesburg
Lusaka
Distribution hub
Investment Banking
JV with Macquarie Bank
JV
JV with Kotak Group
Planned 2010
Hong Kong
JV with MICC/MonetJV with Citadel
Page 3
JV with Waterous

Growth rates for selected countries, 2011-2015. 201 0 = 100
Page 4
120
140
160
180
200
220
2010 2011 2012 2013 2014 2015
80
100
Mongolia China Turkmenistan Ghana India UK USA France

Implications of fast growth?

Coal Deposits
Uranium Deposits
Iron Ore Deposits
Oil Deposits
6
1) The minerals study prepared by Mr. Odkhuu, D., a Member of Parliament, lead group of geologists from Geosan LLC, Mongolia.
Mineral potential clearly abundant..... of fast growth?
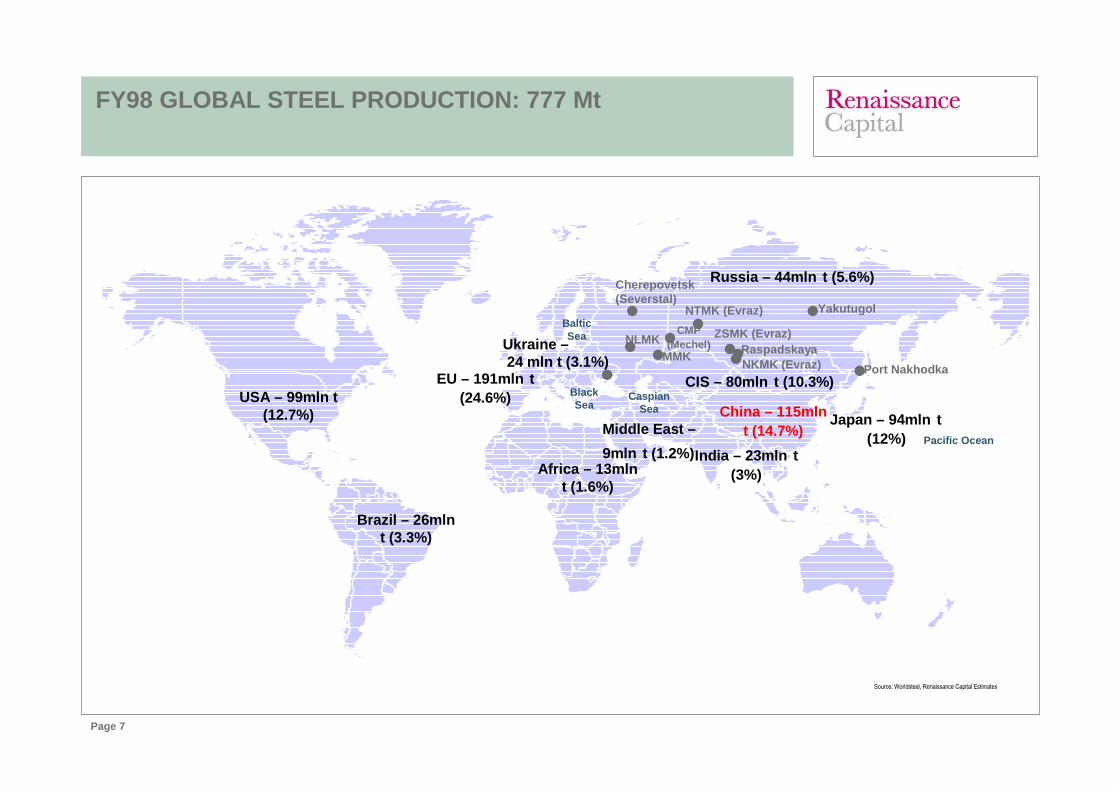
FY98 GLOBAL STEEL PRODUCTION: 777 Mt
Page 7
USA – 99mln t (12.7%)
Brazil – 26mln t (3.3%)
Russia – 44mln t (5.6%)
EU – 191mln t (24.6%)
Middle East –
9mln t (1.2%)
China – 115mlnt (14.7%)
India – 23mln t (3%)
Japan – 94mln t (12%)
Baltic Sea
Black Sea
Caspian Sea
Pacific Ocean
Africa – 13mln t (1.6%)
Ukraine –24 mln t (3.1%)
CIS – 80mln t (10.3%)
Yakutugol
●●NLMK
●NTMK (Evraz)
●NKMK (Evraz)
ZSMK (Evraz)
●Port Nakhodka ●
●MMK
●
●Raspadskaya
●
Cherepovetsk(Severstal)
●CMP
(Mechel )
Source: Worldsteel, Renaissance Capital Estimates

FY10E GLOBAL STEEL PRODUCTION: 1,403.7 Mt (1H10 annualized)
Page 8
USA – 81,9 Mt (5.8%)
Brazil – 33.3 Mt (2.4%)
Russia – 65.9 Mt(4.7%)
EU27 – 173.5 Mt (12.4%)
Middle East - 18.7 Mt (1.3%)
China – 640.7 Mt (45.6%)
India – 65.9 Mt (4.7%)
Japan – 109.2 Mt (7.8%)
Baltic Sea
Black Sea Caspian
Sea
Pacific Ocean
Africa – 16.4 Mt (1.2%)
Ukraine – 31.8 Mt (2.3%)
CIS – 105.9 Mt (7.5%) Port Posiet (Mechel) ●
Elga Deposit (Mechel)
Yakutugol (Mechel)
●
●●NLMK
●NTMK (Evraz)
●NKMK (Evraz)
ZSMK (Evraz)
●Port Nakhodka (Evraz)●Poltava (Ferrexpo)
●MMK
●
●Raspadskaya
●
Cherepovetsk (Severstal)
● CMP(Mechel)
Source: Worldsteel, Renaissance Capital Estimates

Page 9
GROWING STEEL OUTPUT REMAINS AT RECORD LEVELS
Global steel output (August 2010) – Worldsteel
Global steel capacity utilization ratio (%) Apparent Steel Use (ASU) for years 2005 - 2010
Source: Worldsteel, Renaissance Capital Estimates
Source: Worldsteel, Renaissance Capital EstimatesSource: Worldsteel, Renaissance Capital Estimates
2007 2008 YoY 2009 YoY Jun-10 Jul-10 Aug-10 YoY MoM
China 489.0 502.0 2.7% 567.8 13.1% 53.7 51.7 51.6 -1.1% -0.2%
Japan 120.2 118.7 -1.2% 87.5 -26.3% 9.4 9.2 8.3 7.1% -9.9%
United States 97.2 91.5 -5.9% 58.1 -36.4% 7.2 6.7 6.9 23.7% 2.4%
Russia 72.2 68.5 -5.1% 59.9 -12.5% 5.4 5.6 5.6 -6.0% 0.1%
Brazil 33.8 33.7 -0.3% 26.5 -21.4% 2.9 3.0 2.9 7.8% -2.2%
India 53.1 55.1 3.7% 56.6 2.8% 5.4 5.8 5.7 6.4% -0.9%
Ukraine 42.8 37.1 -13.3% 29.8 -19.8% 2.5 2.4 2.4 -10.0% -0.2%
South Korea 51.4 53.5 4.1% 48.6 -9.1% 4.8 4.8 4.5 6.4% -5.1%
Germany 48.5 45.8 -5.5% 32.7 -28.7% 3.9 3.5 3.5 17.1% -1.1%
Italy 32 30.5 -4.8% 19.7 -35.2% 2.3 2.2 1.1 45.4% -50.5%
World 1,343.5 1329.7 -1.0% 1220.0 -8.3% 118.8 114.8 112.9 4.2% -1.7%
Ex China 854.5 827.7 -3.1% 652.2 -21.2% 65.1 63.1 61.2 13.0% -2.9%

Mongolian raw coking coal exports to China...starti ng to impact
Page 11
DEFINING THE INVETSMENT DOLLAR
•INVESTMENT DOLLARS GO (AND STAY) WHERE THEY ARE BES T TREATED
•WHERE RETURNS CAN BE ATTRACTIVE ON A RISK ADJUSTED BASIS
•IT IS ALWAYS DISCRETIONARY BUT PLENTIFUL ON THE RIG HT TERMS
•HAS THE RIGHT TO SEEK LEGAL RECOURCE, LEGITIMACY OF LAW
•IT LIKES DELIVERY.... “WALKING THE WALK”. EXPECTATI ONS NEED SETTING
•GOVERNMENT HAS THE ABILITY TO CONSTRUCTIVELY LEAD D EVELOPMENT VIA TAX, MIMNING LAW, INFRASTRUCTURE...SHORT TERM & LONG TER M
•CONSISTENCY OF LEGISLATION AND TREATMENT OF MINING CAPITAL