14/02/2007 Paolo Walter Cattaneo 1 1.Trigger analysis 2.Muon rate 3.Q distribution 4.Baseline...
23
14/02/2007 Paolo Walter Cattaneo 1 1. Trigger analysis 2.Muon rate 3. Q distribution 4.Baseline 5.Pulse shape 6.Z measurement 7. Att measurement OUTLINE
-
Upload
molly-garrett -
Category
Documents
-
view
216 -
download
0
Transcript of 14/02/2007 Paolo Walter Cattaneo 1 1.Trigger analysis 2.Muon rate 3.Q distribution 4.Baseline...
14/02/2007 Paolo Walter Cattaneo 1
1. Trigger analysis
2. Muon rate
3. Q distribution
4. Baseline
5. Pulse shape
6. Z measurement
7. Att measurement
OUTLINE

14/02/2007 Paolo Walter Cattaneo 2
Trigger DataCharge vs Amplitude PMT
Key for the Trigger System using pulse height with no information about pulse charge (RUN
236,237,239)
Amplitude (a.u.)
Charg
e (
a.u
.)
14/02/2007 Paolo Walter Cattaneo 3
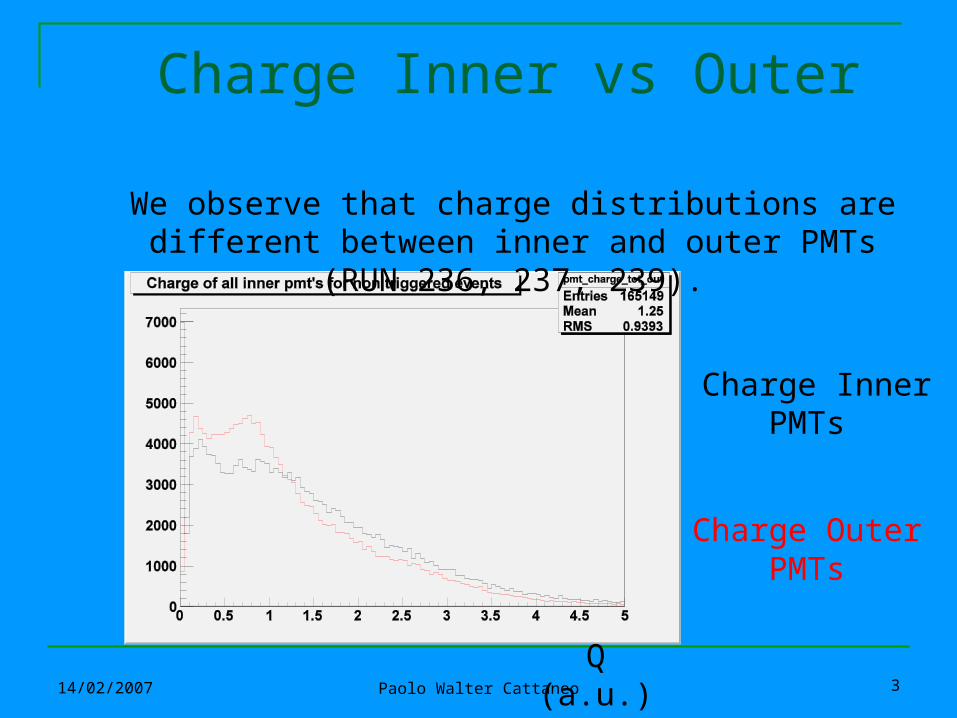
Charge Inner vs Outer
We observe that charge distributions are different between inner and outer PMTs (RUN
236, 237, 239).
Charge Inner PMTs
Charge Outer PMTs
Q (a.u.)

14/02/2007 Paolo Walter Cattaneo 4
Comparison with MC Data
DATA
MONTECARLO
Measured charge distribution for inner PMTs the Montecarlo
one are in agreement, as well as the outer ones
Q (a.u.)
14/02/2007 Paolo Walter Cattaneo 5
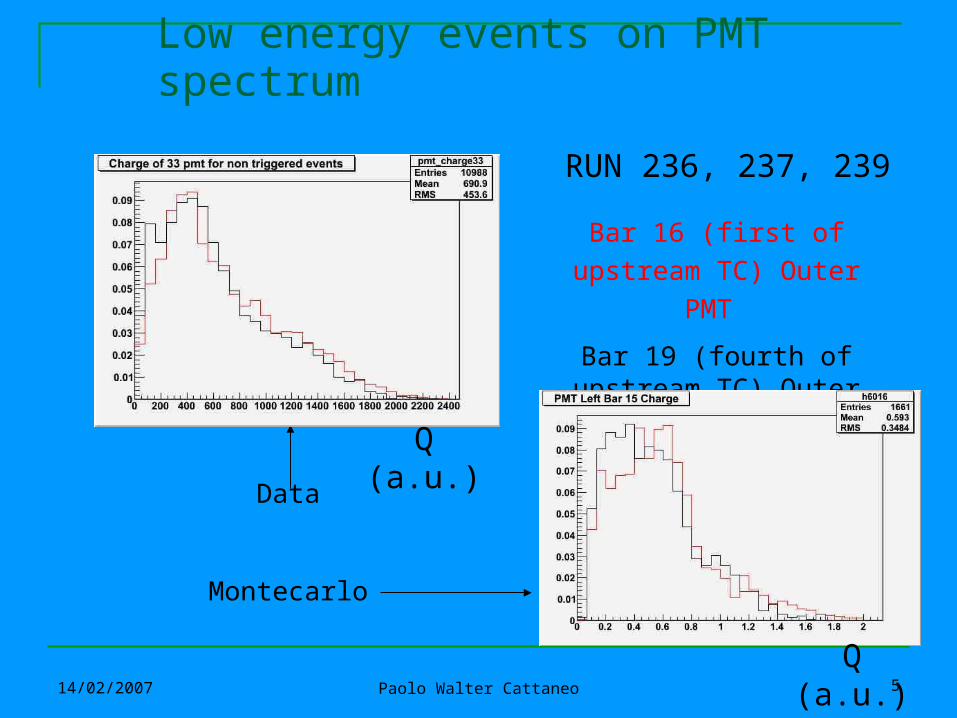
Low energy events on PMT spectrum
Bar 16 (first of upstream TC) Outer PMT
Bar 19 (fourth of upstream TC) Outer PMT
Data
Montecarlo
Q (a.u.)
Q (a.u.)
RUN 236, 237, 239
14/02/2007 Paolo Walter Cattaneo 6
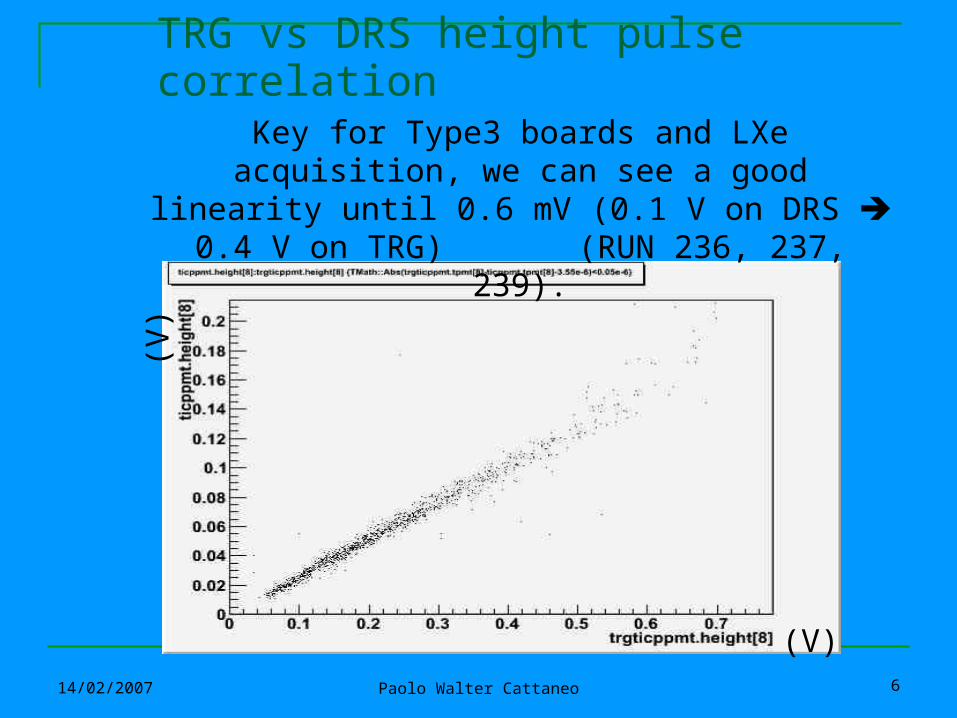
TRG vs DRS height pulse correlation Key for Type3 boards and LXe acquisition, we can see a good linearity until 0.6 mV (0.1 V on DRS 0.4 V on TRG) (RUN 236, 237,
239).
(V)
(V)
14/02/2007 Paolo Walter Cattaneo 7
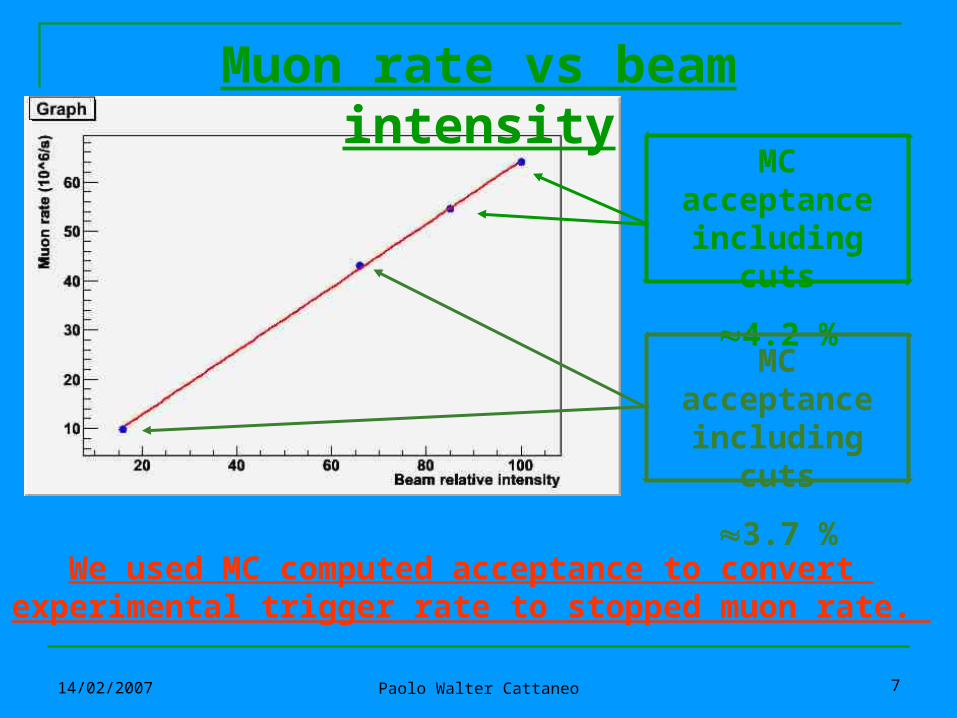
We used MC computed acceptance to convert experimental trigger rate to stopped muon rate.
Muon rate vs beam intensity
MC acceptance including cuts
4.2 %
MC acceptance including cuts
3.7 %
14/02/2007 Paolo Walter Cattaneo 8
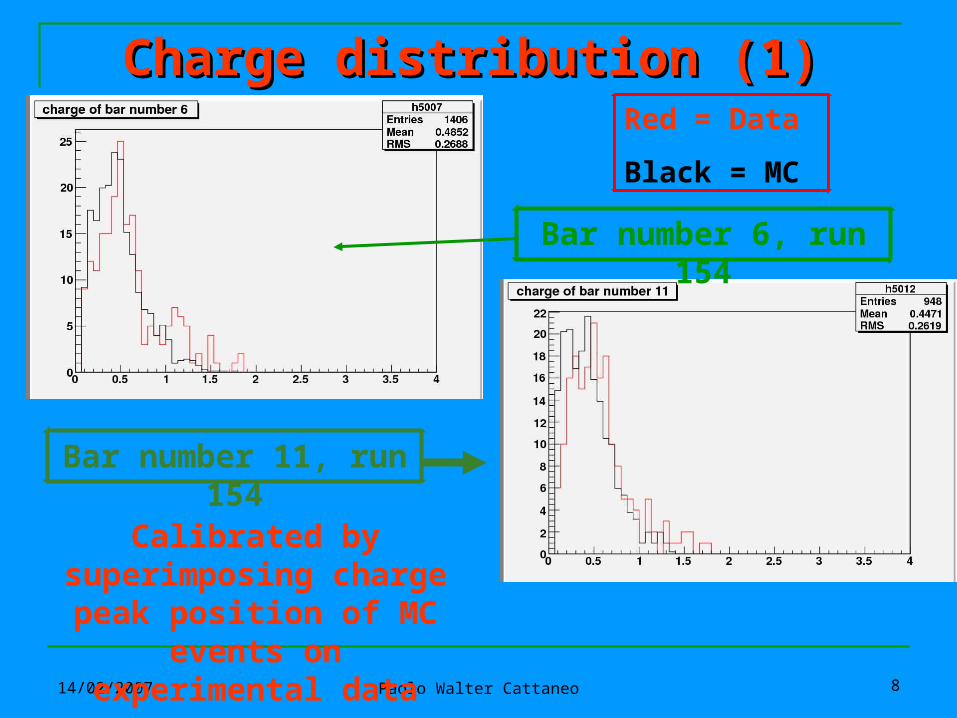
Bar number 11, run 154
Bar number 6, run 154
Calibrated by superimposing charge peak position of MC events on experimental data
Charge distribution (1)Charge distribution (1)Red = Data
Black = MC

14/02/2007 Paolo Walter Cattaneo 9
Charge distribution (2)
Data wider probably for difficulties of individual software calibration
Run 154 Low Intensity
Run 236 High Intensity
Red = Data
Black = MC
Charge
Charge
All bars together
All bars together

14/02/2007 Paolo Walter Cattaneo 10
Run 154 Low Intensity
Red = Data
Black = MC
Run 236 High Intensity
Number of hit bar per Number of hit bar per eventevent
14/02/2007 Paolo Walter Cattaneo 11
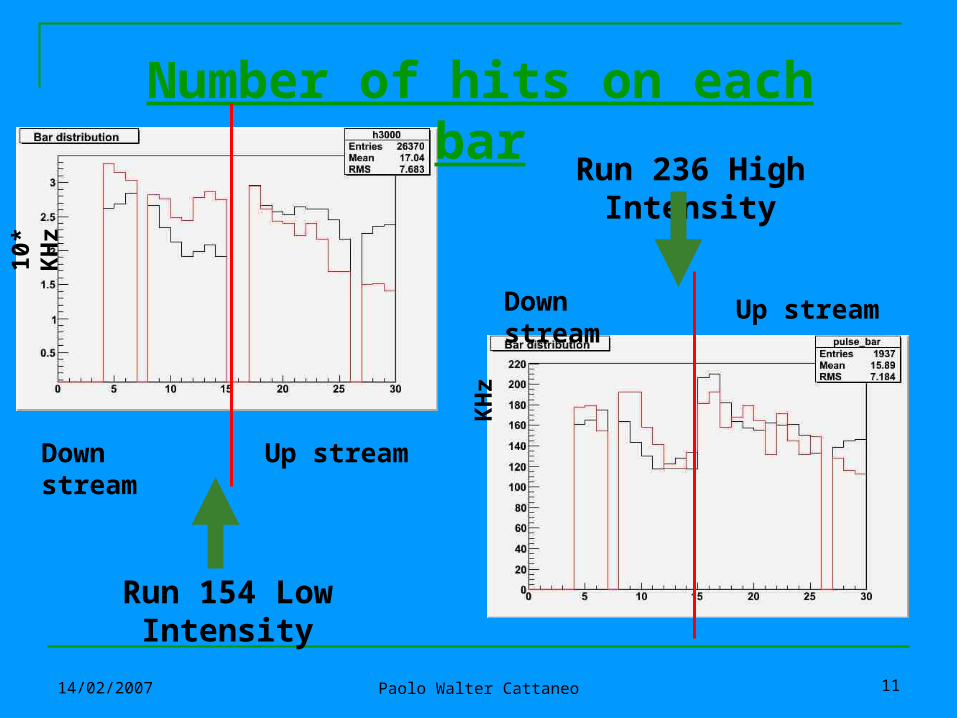
Number of hits on each bar
Down stream
Down stream
Up stream
Up stream
Run 154 Low Intensity
Run 236 High Intensity
10*
KH
z
KH
z
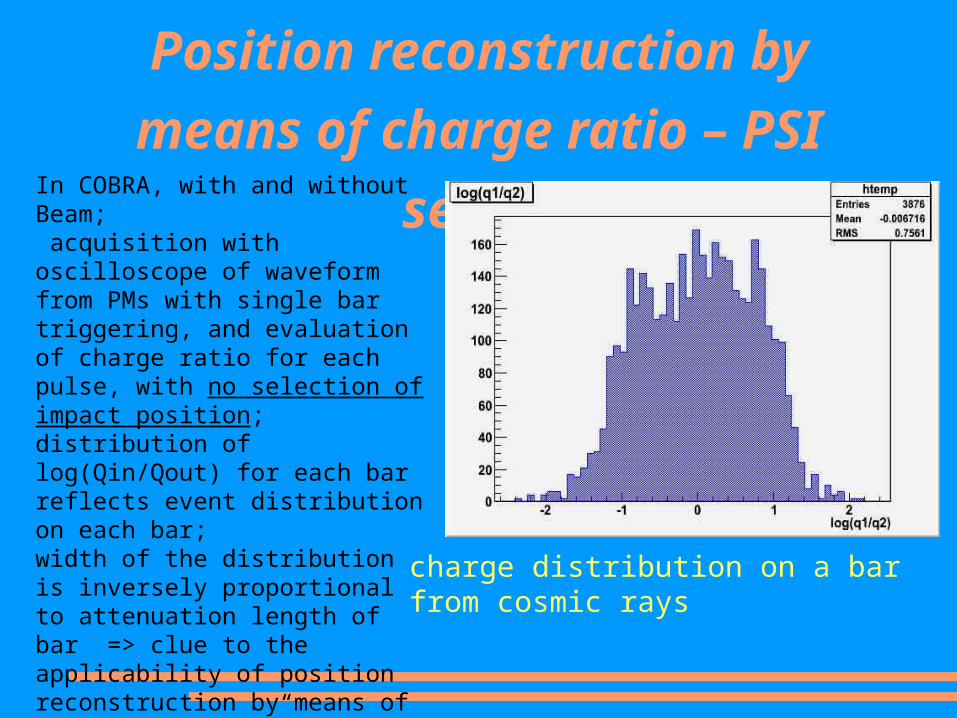
In COBRA, with and without Beam; acquisition with oscilloscope of waveform from PMs with single bar triggering, and evaluation of charge ratio for each pulse, with no selection of impact position;distribution of log(Qin/Qout) for each bar reflects event distribution on each bar; width of the distribution is inversely proportional to attenuation length of bar => clue to the applicability of position reconstruction by means of “charge division”
Position reconstruction by
means of charge ratio – PSI
setup
charge distribution on a bar from cosmic rays
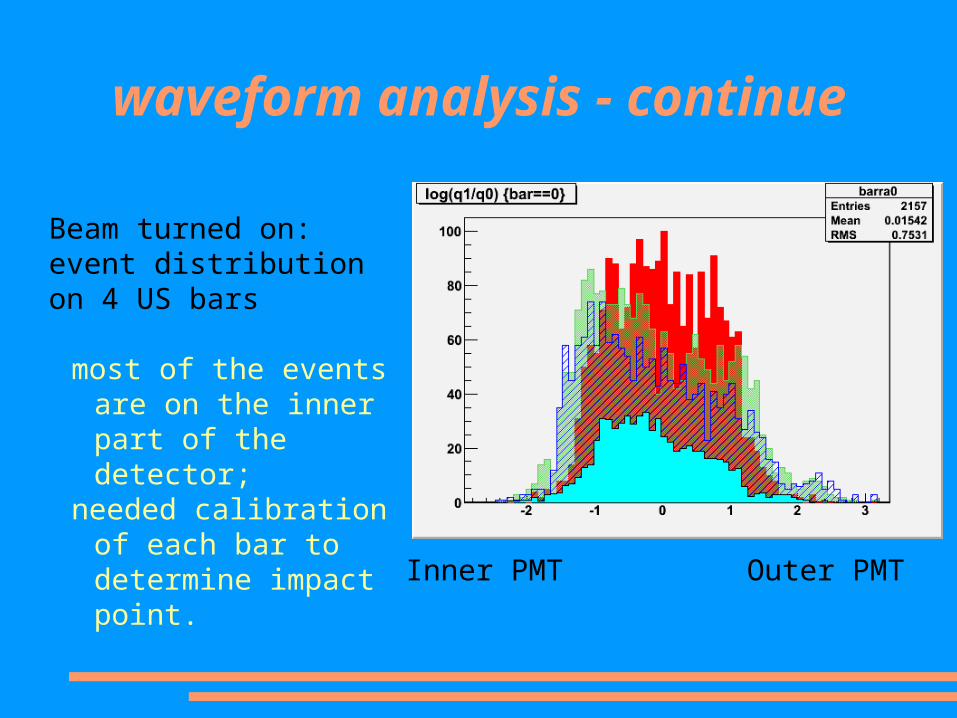
waveform analysis - continue
Beam turned on: event distribution on 4 US bars
most of the events are on the inner part of the detector;
needed calibration of each bar to determine impact point.
Inner PMT Outer PMT
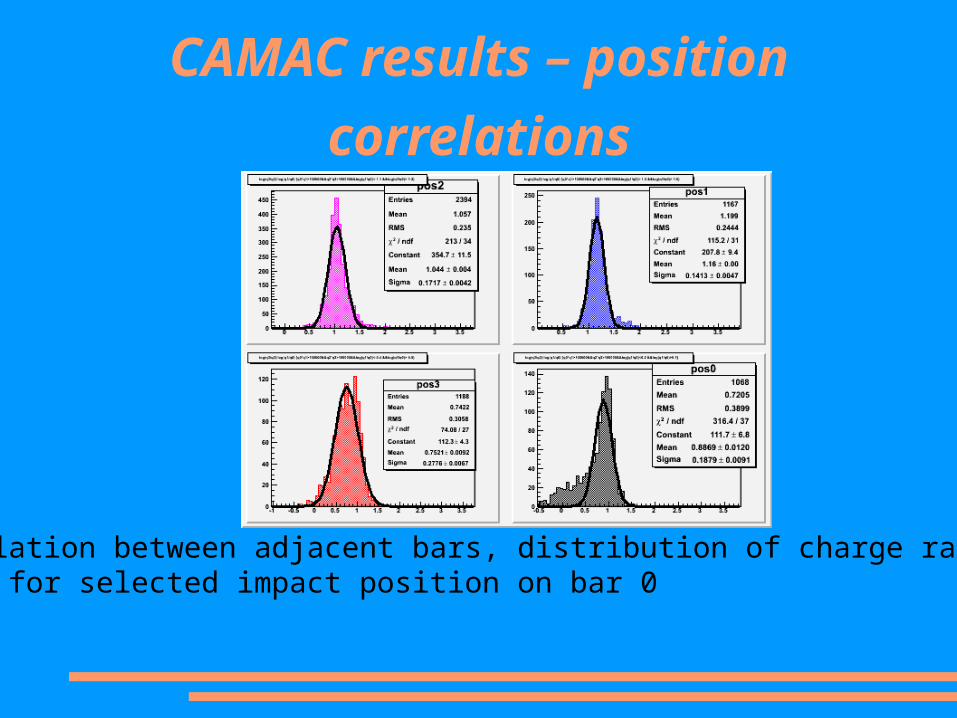
CAMAC results – position
correlations
correlation between adjacent bars, distribution of charge ratio on bar 1 for selected impact position on bar 0
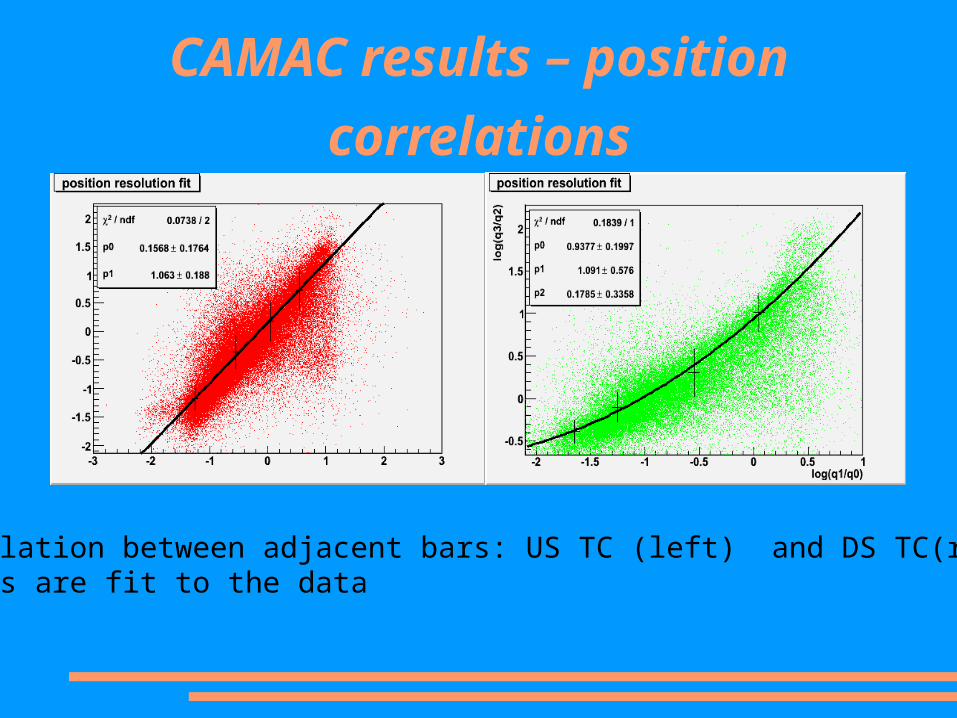
CAMAC results – position
correlations
correlation between adjacent bars: US TC (left) and DS TC(right);curves are fit to the data

14/02/2007 Paolo Walter Cattaneo 16
Baseline & noise analysis 1Search signal
pulse
Search pulsein the region
Fix region just before pulse
calculate baseline use database value
no
no yes
yes
low threshold
Threshold ?
Range ?
How stable ?
How often ?
● averaging● did not try fitting

14/02/2007 Paolo Walter Cattaneo 17
Baseline & noise analysis 2: StabilityNoise level 0.6 ~ 1mV
Baseline fluctuation in a run ~0.3mV
Baseline shift
with change of beam intensity
with change of trigger type
Baseline is stable among same condition runs
We need baseline value in database each run condition.
TC no
TC high
NaI no
TC no
TC low
NaI low
NaI high
NaI no
NaI highbaseline fluctuation
Baseline run in database
already in database for all run
14/02/2007 Paolo Walter Cattaneo 18
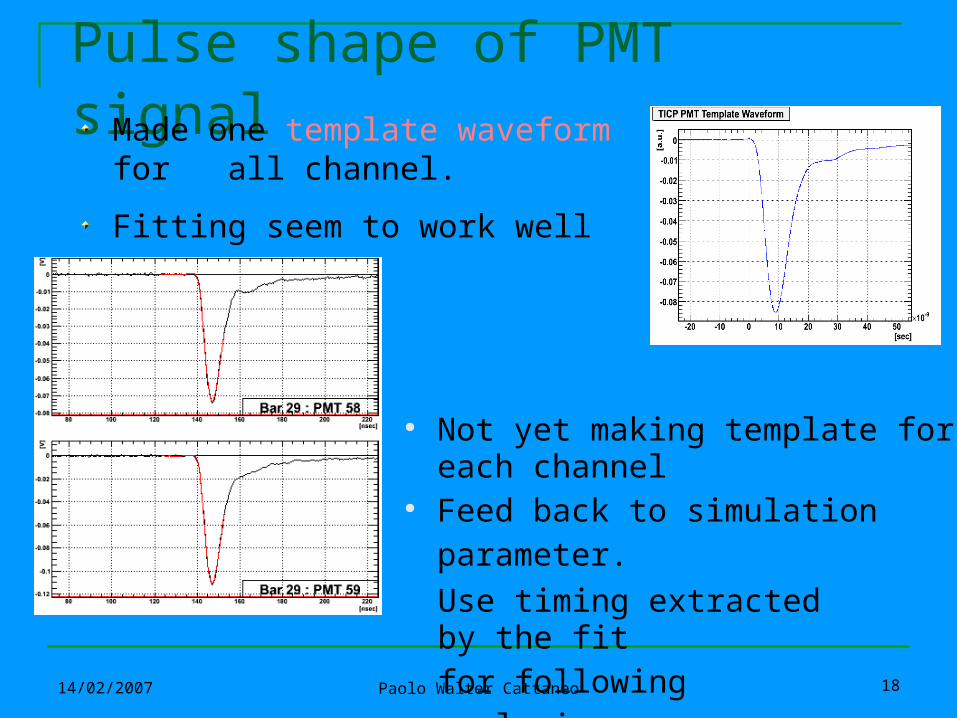
Pulse shape of PMT signalMade one template waveform for all channel.
Fitting seem to work well
● Not yet making template for each channel
● Feed back to simulation parameter.
Use timing extracted by the fitfor following analysis.
14/02/2007 Paolo Walter Cattaneo 19
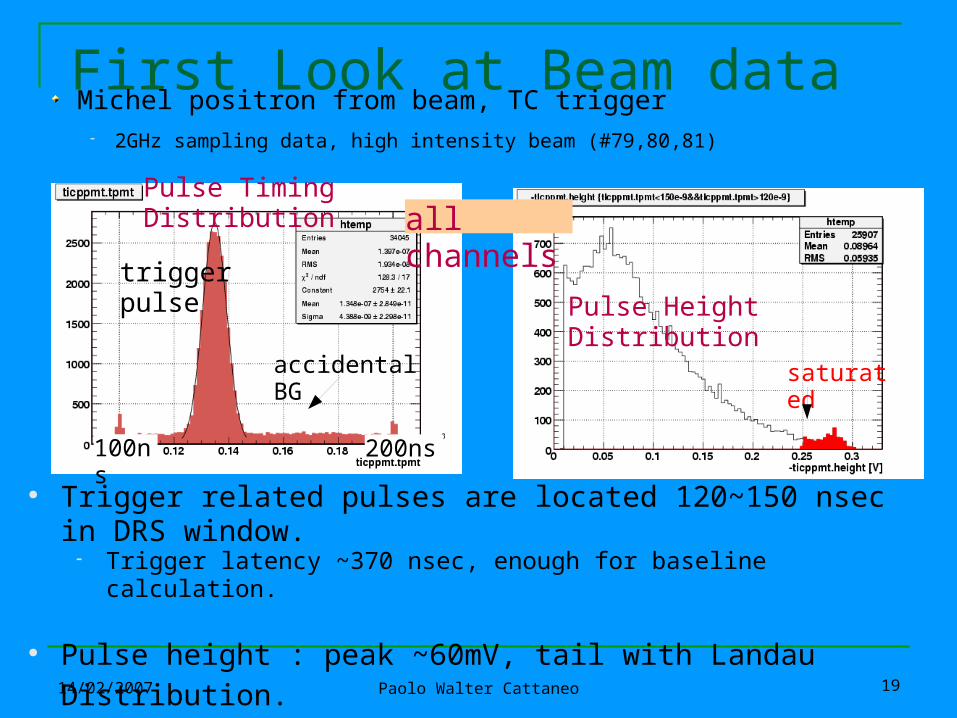
First Look at Beam dataMichel positron from beam, TC trigger
2GHz sampling data, high intensity beam (#79,80,81)
● Trigger related pulses are located 120~150 nsec in DRS window. Trigger latency ~370 nsec, enough for baseline calculation.
● Pulse height : peak ~60mV, tail with Landau Distribution. about 2.2% pulses are saturated.
Pulse Timing Distribution
Pulse Height Distribution
saturated
trigger pulse
accidental BG
all channels
100ns 200ns
14/02/2007 Paolo Walter Cattaneo 20
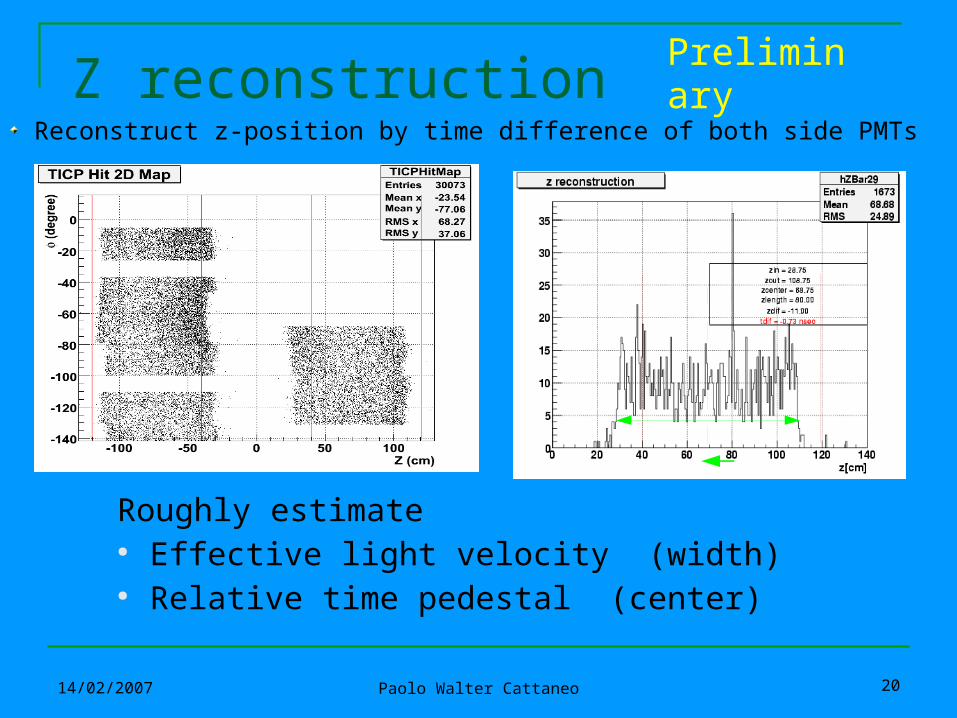
Z reconstructionReconstruct z-position by time difference of both side PMTs
Roughly estimate ● Effective light velocity (width)● Relative time pedestal (center)
Preliminary
14/02/2007 Paolo Walter Cattaneo 21
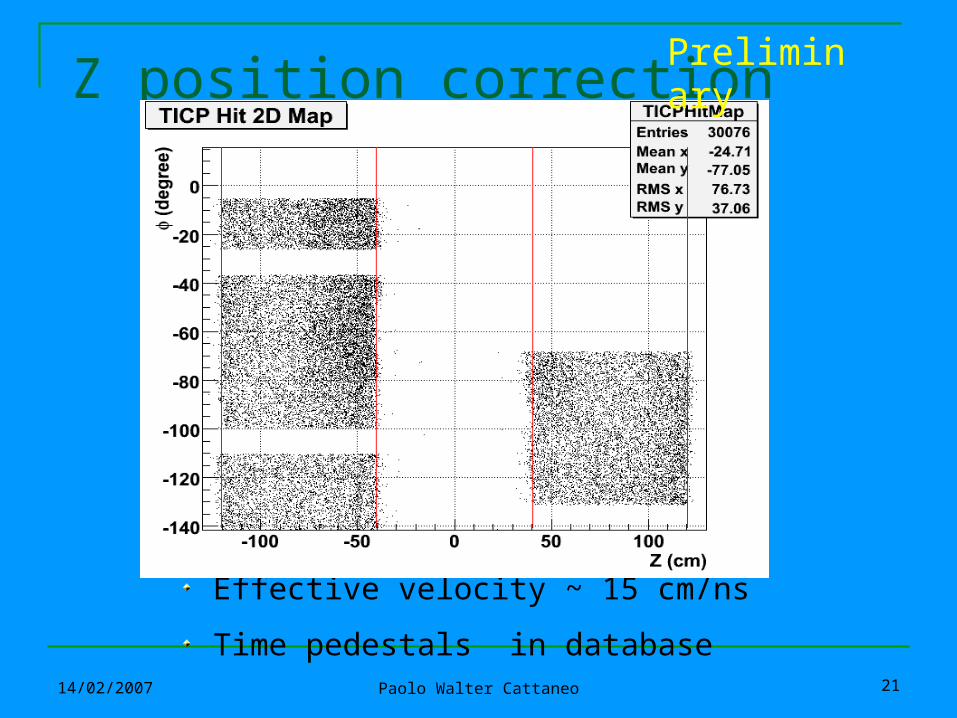
Z position correction
Effective velocity ~ 15 cm/ns
Time pedestals in database
Preliminary

14/02/2007 Paolo Walter Cattaneo 22
Relative gain estimationUsing spectra, estimated relative gain.
Pulse height after correction by position
● Fit with Landau distribution● Compare the MPV
Preliminary

14/02/2007 Paolo Walter Cattaneo 23
Height ratioIf pulse height ratio is mainly determined by attenuation length,
● Roughly extracted effective attenuation length Att ~ 96 cm
Preliminary
log(H0/H1) = z*2/Att
Due to variety of solid angle