14.0 Social infrastructure Education14
15
The solution Section 14 Social Infrastructure Page 173 Infrastructure NSW | State Infrastructure Strategy 14.0 Social infrastructure 14.1 Education Summary • NSW’s school population is expected to grow by around 250,000 in the next 20 years, with more than a million students in 2031. • Infrastructure NSW’s recommended strategy is for 90 percent of new students to be accommodated in existing schools, leveraging the existing infrastructure, with some conversions to renew the portfolio of education without increasing its footprint. Increasing the average size of schools makes better use of existing assets and provides better learning outcomes. • In addition, 29 new schools, including eight in regional areas, are expected to be built across NSW in the next 10 years. • A new classroom design for technology driven teaching methods and learning is recommended as an urgent priority. Input from the NSW Government’s Information and Communication Technology (ICT) Board, industry and the private sector will ensure the standard is innovative and reflects the next generation’s use of technology. • Strategies are recommended to increase the use of school facilities by the community, such as playing fields and libraries. • Local decision-making about minor capital works and infrastructure priorities will help to rapidly bring NSW schools up to the new national minimum standard. School principals and TAFE directors will have authority to prioritise work to meet local needs. 14.1.1 Education snapshot The NSW Government provides teaching and learning to over 1.4 million students. • the NSW Government has $21 billion 1 invested in public education infrastructure. – 66 percent of NSW’s school student population attends Government schools (around 800,000 students). – TAFE delivers around two thirds of accredited training in NSW to around 600,000 students. • these services are provided through 2,234 schools and 130 TAFE campuses, accommodated in over 26,000 buildings. • investment in education infrastructure in the past decade was driven by changing class sizes and other policies; the school population did not significantly grow. • however, primary and secondary school populations are expected to grow, with over 70,000 new students in the next 10 years. • TAFE demand is not expected to grow as vocational learning is increasingly provided by the private market. • average expenditure by the NSW Government over the past 10 years has been around $500 million per annum across the school and TAFE sectors (excluding the Building the Education investment of around $3 billion in the past three years). 1 NSW Government, 2012-13 Budget Paper 4. • the Education Department’s forecast investment in education infrastructure for the next 10 years is around $600 million per annum. • higher education and the university sector is outside the scope of the Strategy. However, a robust and successful tertiary sector is vital to ensuring NSW is attractive to both business and the knowledge workers who drive the economy. 14.1.2 Review of Funding for Schooling Findings Infrastructure NSW’s recommendations and strategies for public education are informed by the findings and recommendations of the Commonwealth’s Review of Funding for Schooling, (the Gonski Review). The Review reported a decline in education standards in the past decade and recommended increased funding. The report highlighted that the quality of infrastructure does have a strong influence on education outcomes (although it is difficult to measure) 2 . The Review concluded that both additional infrastructure funding and better planning was needed to bring Government schools up to a quality standard and recommended the introduction of new national facilities standards. The panel recommended the Commonwealth Government provide a substantial contribution 3 . 2 Australian Government 2011, Review of Funding for Schooling, Final Report. 3 Australian Government 2011, Review of Funding for Schooling, Final Report.
Transcript of 14.0 Social infrastructure Education14

The solution Section 14 Social Infrastructure Page 173 Infrastructure NSW | State Infrastructure Strategy
14.0 Social infrastructure 14.1 EducationSummary • NSW’s school population is expected to grow by
around 250,000 in the next 20 years, with more than a million students in 2031.
• Infrastructure NSW’s recommended strategy is for 90 percent of new students to be accommodated in existing schools, leveraging the existing infrastructure, with some conversions to renew the portfolio of education without increasing its footprint. Increasing the average size of schools makes better use of existing assets and provides better learning outcomes.
• In addition, 29 new schools, including eight in regional areas, are expected to be built across NSW in the next 10 years.
• A new classroom design for technology driven teaching methods and learning is recommended as an urgent priority. Input from the NSW Government’s Information and Communication Technology (ICT) Board, industry and the private sector will ensure the standard is innovative and reflects the next generation’s use of technology.
• Strategies are recommended to increase the use of school facilities by the community, such as playing fields and libraries.
• Local decision-making about minor capital works and infrastructure priorities will help to rapidly bring NSW schools up to the new national minimum standard. School principals and TAFE directors will have authority to prioritise work to meet local needs.
14.1.1 Education snapshot
The NSW Government provides teaching and learning to over 1.4 million students.
• the NSW Government has $21 billion1 invested in public education infrastructure.
– 66 percent of NSW’s school student population attends Government schools (around 800,000 students).
– TAFE delivers around two thirds of accredited training in NSW to around 600,000 students.
• these services are provided through 2,234 schools and 130 TAFE campuses, accommodated in over 26,000 buildings.
• investment in education infrastructure in the past decade was driven by changing class sizes and other policies; the school population did not significantly grow.
• however, primary and secondary school populations are expected to grow, with over 70,000 new students in the next 10 years.
• TAFE demand is not expected to grow as vocational learning is increasingly provided by the private market.
• average expenditure by the NSW Government over the past 10 years has been around $500 million per annum across the school and TAFE sectors (excluding the Building the Education investment of around $3 billion in the past three years).
1 NSW Government, 2012-13 Budget Paper 4.
• the Education Department’s forecast investment in education infrastructure for the next 10 years is around $600 million per annum.
• higher education and the university sector is outside the scope of the Strategy. However, a robust and successful tertiary sector is vital to ensuring NSW is attractive to both business and the knowledge workers who drive the economy.
14.1.2 Review of Funding for Schooling Findings
Infrastructure NSW’s recommendations and strategies for public education are informed by the findings and recommendations of the Commonwealth’s Review of Funding for Schooling, (the Gonski Review).
The Review reported a decline in education standards in the past decade and recommended increased funding. The report highlighted that the quality of infrastructure does have a strong influence on education outcomes (although it is difficult to measure)2.
The Review concluded that both additional infrastructure funding and better planning was needed to bring Government schools up to a quality standard and recommended the introduction of new national facilities standards. The panel recommended the Commonwealth Government provide a substantial contribution3.
2 Australian Government 2011, Review of Funding for Schooling, Final Report.3 Australian Government 2011, Review of Funding for Schooling, Final Report.

The solution Section 14 Social Infrastructure Page 174 Infrastructure NSW | State Infrastructure Strategy
Infrastructure NSW’s recommendations reflect some of the Gonski Review conclusions, as outlined below:
1. Introducing new facilities standards (refer Recommendation 5)
2. Joint planning with the private sector (discussed below)
3. Greater local accountability for investment (refer to Recommendation 4).
New facilities standardsInfrastructure NSW supports a national minimum standard for education facilities if it is implemented consistently with the Local Schools, Local Decisions reform by the NSW Government. Infrastructure NSW supports publishing a minimum standard, (which would be known to communities) with responsibility for maintaining that standard devolved to school principals.
Joint planning The Review Panel observed that there are currently no coherent and transparent institutional or regulatory arrangements by which the public and private education sectors can participate to agree the best approach to school provision4.
4 Australian Government, 2011 Review of Funding for Schooling, Final Report.
The Review recommended a School Planning Authority be established in each state and territory to promote comprehensive and co-ordinated planning for schooling (across public and private sectors) and to avoid unnecessary duplication and under-utilisation of assets.
Infrastructure NSW notes that, collaborative co-planning could be achieved by:
• providing greater opportunity for the private sector to identify market entry points through published demographic and planning information
• removing any barriers against private schools in the planning, licensing process and promoting coordination from the earliest stages of the planning process
• increasing opportunities for shared use of facilities e.g. design new schools to enable shared access to playing fields or libraries.
Inefficient investment in and use of school facilitiesThe Review identified community concerns about inefficient investment in and use of school facilities with some submissions to the inquiry raising the need for school facilities to be accessible outside of school hours for community use. The Department of Education and Communities has identified options such as open space sharing on a case-by-case basis. Infrastructure NSW notes that there is potential for greater collaboration and development particularly with other education providers and local councils.
These findings are built into the strategies and recommendations below.
14.1.3 School Demand
There were 435,000 primary students and 317,000 high school students in 2,234 NSW public schools in 2011. The school population is expected to grow to 486,000 and 335,000 respectively in the next 10 years, meaning nearly 70,000 additional public school enrolments are expected throughout NSW.
Demand for education infrastructure has been impacted by:
• the post millennium ‘baby boom’ – the size of the student aged population is forecast to grow by nearly one percent per annum in the next 20 years
• an increase in private enrolments to 34 percent from just under 31 percent in 2000
• smaller class sizes introduced over the past 10 years which require more separate teaching spaces and have reduced capacity to absorb additional enrolments within existing facilities
• the increase in 2010 of the minimum school leaving age from 15 to 17
• demand is managed to some extent through catchment boundaries, which are reviewed to direct students to schools with capacity.
Growth occurs largely in the primary sector in the next 10 years, which means that the secondary schools will see more growth in the second decade, as shown in Figure 14.1.

The solution Section 14 Social Infrastructure Page 175 Infrastructure NSW | State Infrastructure Strategy
Primary Secondary
2012
2013
2014
2015
2016
2017
2018
2019
2020
2021
(2,000)
0
2,000
4,000
6,000
8,000
10,000
Num
ber o
f stu
dent
s
Figure 14.1 Forecast Annual Increase in Student Numbers – 2012-21
Source: NSW Department of Education and Communities.
14.1.4 School capacity
Overall, NSW primary schools had a utilisation rate of permanent teaching spaces (PTS) of 99.1 per cent in 2011 (refer to Figure 14.2). Utilisation rates greater than 100 per cent are supported with demountable accommodation, counted in the Total Teaching Spaces (TTS) ratio.
PTS Utilisation %
PTS = Permanent Teaching Spaces TTS = Total Teaching Spaces
TTS Utilisation %
Rive
rina
New
Eng
land
Wes
tern
NSW
Sydn
ey
Illaw
arra
Sout
h Ea
st
Wes
tern
Syd
ney
Sout
h W
este
rnSy
dney
North
Coa
st
Hunt
er/C
entra
lCo
ast
North
ern
Sydn
ey
NSW
Tot
al
0
20
40
60
80
100
120
Perc
enta
ge
Department of Education Regions
Target Range
Figure 14.2 Teaching Space Utilisation for Public Primary Schools 2011
Source: NSW Department of Education and Communities cited by PwC.
High schools have lower permanent teaching space utilisation5 rate of 86.5 percent, that is, there are 2,443 permanent teaching spaces more than required by the overall current level of high school demand as of March 2011 as shown in Figure 14.2 and 14.3.
5 Teaching space ratios are calculated differently for high schools, based on teacher numbers times a ratio of face to face teaching time.
PTS Utilisation %
PTS = Permanent Teaching Spaces TTS = Total Teaching Spaces
TTS Utilisation %
0
20
40
60
80
100
120
Perc
enta
ge
Department of Education Regions
Target Range
Figure 14.3 Teaching Space Utilisation for Public High Schools 2011
Source: NSW Department of Education and Communities cited by PwC.
Rive
rina
New
Eng
land
Wes
tern
NSW
Sydn
ey
Illaw
arra
Sout
h Ea
st
Wes
tern
Syd
ney
Sout
h W
este
rnSy
dney
North
Coa
st
Hunt
er/C
entra
lCo
ast
North
ern
Sydn
ey
NSW
Tot
al
In high schools, low enrolments lead to poor student outcomes because the full range of subject choices and teachers for specialty subjects become unavailable to students and the average achievement level falls.

The solution Section 14 Social Infrastructure Page 176 Infrastructure NSW | State Infrastructure Strategy
14.1.5 TAFE demand and capacity
Increased contestability of funding for vocational training and flat student numbers over the past eight years suggests that TAFE enrolment numbers will be lower than population growth.
Demand for infrastructure in this sector is more likely to be driven by the need for use of upgraded technology and industry compatible facilities to enhance the development of vocational skills. Future TAFE reforms may significantly alter asset requirements.
Around 575 hectares of land is shared between schools and TAFE, and in many cases the learning environments needed to deliver TAFE and high school courses are compatible.
Recommendation Given forecasts of demand, Infrastructure NSW recommends merging the asset management functions across the education portfolio to unlock the significant potential to improve asset utilisation across TAFE and high schools.
Infrastructure NSW supports greater local decision making by school principals and TAFE directors. Merging the asset ‘head office’ functions is consistent with the Commission of Audit recommendations for greater devolution and efficiency.
14.1.6 Meeting demand
Infrastructure NSW recommends a new approach to accommodating more students through greater use of existing assets. 90 percent of new students will be accommodated by expanding existing schools. This has
the potential to lower the capital cost per student and improves educational outcomes, as research has shown that larger schools achieve higher results on average.
However, 29 new schools are expected to be built, in the next 10 years, subject to location reviews in due course. The proposed new schools and the demographic trends in each region as shown in Figure 14.4 (note: some of these projects are yet to be assessed or considered for funding).
Accommodating 90 percent of students in existing schools will meet demand at a lower capital cost and will reduce operating costs over the long term. Larger schools can have advantages over smaller schools including providing greater subject choice, more extra-curricular activities, ability to attract experienced, quality teachers and capacity to provide more specialised infrastructure and equipment. However, expanding existing schools in built up areas including large infill developments requires a new approach and a “Brownfield Partnership” model is being developed. The new approach involves partnerships with developers, local councils and greater co-ordination across Government and with the private education sector.
These partnerships may involve:
• Working with developers to expand school infrastructure at the time of building high density residential developments.
• Active management of land and exploiting all opportunities for expanding using other Government land and sharing land (eg sporting fields).
• Reconfiguration of a precinct of small schools to increase total capacity. Some opportunities exist for rationalistion and recycling capital to provide quality school outcomes.
Recommendation Infrastructure NSW recommends accommodating 90 percent of new students in existing schools. The increase in average size of schools makes better use of existing assets and provides better learning outcomes.
New classroom designsThe current standards for schools, including the spatial and technical requirements and design, were developed in the 1970s and do not reflect rapid technology driven changes to how teaching and learning occur. The Department of Education and Communities has started the project to review and modernise the designs, and develop a new classroom standard. The first step is to assess functionality and requirements of the physical learning environment which will involve case studies of 13 schools.
Infrastructure NSW recommends that this work be supported and accelerated. This program should employ the Government’s ICT Board, industry and the private sector to ensure the standard is innovative and reflects the next generation’s use of technology.
Recommendation Infrastructure NSW supports rapid development of new classroom design and standards for technology-driven learning.

The solution Section 14 Social Infrastructure Page 177 Infrastructure NSW | State Infrastructure Strategy
Inland NSW - 0.7%
Murray 4%
North Coast 8%
South Coast 8%
Percentage growth in primary student numbers
Negative growth0-5%5-10%Greater than 10%
New School
Source: Department of Education and Communities.* Greater Sydney represented by Department of Education and Communities boundaries.
Figure 14.4 New Schools and Demographic Trends by region
New South Wales Greater Sydney
South Western 15%
Western 19%
Hunter 8%
Sydney (East and Inner west) 14%
Northern 16%
Infrastructure NSW | State Infrastructure Strategy

The solution Section 14 Social Infrastructure Page 178 Infrastructure NSW | State Infrastructure Strategy
14.1.7 Local decisions for better value for money
The NSW Government is implementing the Local Schools Local Decisions policy and action plan aimed at improving teaching and learning in public schools by increasing the authority of local schools to make decisions about how they deliver education and maintain facilities for students.
As part of this process, schools will manage a much greater proportion of their budgets. Schools have the choice to self-manage annual planned maintenance, and a $40 million “Local Schools Upgrade Fund” has been established to empower local principals and communities to upgrade facilities based on local agreed priorities.
A large proportion of the existing capital budget is absorbed in refurbishments which are often avoidable if maintenance standards had been kept up. Infrastructure NSW supports a minimum facilities standard with local principals responsible for monitoring the standard. Asset management plans will be provided to school communities about the condition of assets and when major refurbishments will occur. This can generate a range of benefits and leverage Parents and Citizens input to funding school facilities.
Impact of the Building the Education RevolutionBetween 2009-10 to 2010-11, the Building the Education Revolution (BER) fiscal stimulus provided an additional $3 billion of additional investment in schools. The Commonwealth investment in infrastructure has not reduced the need for NSW Government investment in any measureable way and, in some cases, has caused local planning disruption and community dissatisfaction
with other facilities. Maintaining the Building the Education Revolution facilities could also cost in the order of $60 million per annum once the facilities age.
Community co-use The Department of Education has also initiated measures to increase the extent of engagement with the local community to ensure co-use of facilities (such as playing fields, libraries etc) are fully explored before building projects are authorised.
The Local Schools Local Decisions policy is fostering innovation and significant opportunities for co-use. Engagement at the early stages of planning with the local community means proposals are being generated that encompass greater co-use of facilities.
Case Study: Canada Bay LGA Primary School
• DEC has been working with City of Canada Bay Council to identify a site for new schools. The community is being encouraged to be involved in the school’s development and operation
• A council-owned site has been identified and there is in-principle agreement to use part of the site for the new school and to share the remaining playing field part with the local community
• The development will provide new parking and bus layover facilities for the school which will also be used by the community during sports events.
Recommendation Infrastructure NSW supports a new school facilities national standard (to be determined federally) and greater community use of facilities out of school hours i.e. libraries and, co-use of open space. These recommendation could be delivered through the Local Schools Local Decisions policy.

The solution Section 14 Social Infrastructure Page 179 Infrastructure NSW | State Infrastructure Strategy
14.1.9 Summary of education recommendations
Table 14.1 Summary of recommended actions
Recommended action Years Type Cost and funding implications
62 Target provision of 90 percent of new school places on existing school sites 0 – 5 Program Potential capital savings
63 New classroom design for technology-driven learning 0 – 5 Planning Cost of concept development is not material
64 Increase shared community use of school assets, including repurposing assets where appropriate
0 – 5 Asset utilisation Potential capital savings
65 Combine TAFE and school asset management function to increase utilisation 5 – 10 Asset utilisation Potential capital savings
66 Upgrade and build new educational facilities in accordance with projected demand 0 – 20 Program Existing Government commitment. Program will reflect agency preferred models of learning

The solution Section 14 Social Infrastructure Page 180 Infrastructure NSW | State Infrastructure Strategy
14.2 Arts, recreation and the visitor economySummary • Our arts and recreational facilities support a
vibrant and creative NSW. Cultural and sporting institutions are vital for attracting and retaining the people and skills that NSW needs to compete in the global economy.
• The NSW Government’s plan to double the visitor economy will require targeted investment in infrastructure relevant to visitors, particularly those coming from overseas.
• The Visitor Economy Taskforce has identified potential for arts infrastructure to act as an enabler to support visitor growth, creative industries and economic growth in regional NSW.
• Given constraints on NSW Government funding, new partnership models with the private sector will be required to deliver the infrastructure proposals from the sector over the timeframe of the Strategy.
In the area of the arts, Infrastructure NSW supports:
• Arts NSW’s Cultural Venues Plan, which includes the development of an Arts Ribbon around the CBD, the development of a world class arts and cultural precinct at Walsh Bay and phased renewal of the Opera House and expansion of the Art Gallery of New South Wales.
• The establishment of new partnership models with the private sector and the Commonwealth, based on the successful “Development Partnership” models used in London and New York.
In the area of Recreation, Infrastructure NSW supports:
• A review of Sydney Olympic Park to consider how best to realise the value of the NSW Government’s $1.8 billion infrastructure investment in this precinct.
• Linking the Moore Park precinct with Central Railway Station by light rail.
For the visitor economy Infrastructure NSW supports the construction and delivery of the Sydney International Convention, Exhibition and Entertainment Precinct (SICEEP).
14.2.1 Arts and Recreation Snapshot
• The NSW Government has about $9 billion invested in the Arts and Recreation portfolios, including $3 billion in cultural institutions, more than $4 billion in collections and $2 billion in sporting venues.
• The average expenditure by the NSW Government over the last 10 years has been $114 million per annum, 55 percent on sporting venues and 45 per cent on cultural venues1.
• The capital budget for 2012-13 for the Arts and Recreation portfolios is around $250 million including major work at the Opera House ($82 million) and Sydney Cricket Ground ($72 million).
• Some five million people attended a sporting event at NSW Government venues last year and 25 million visited the many parks and outdoor facilities provided and operated by the NSW Government.
• Nearly five million people attended a cultural venue at lEast once last year.
• The Australia Bureau of Statistics (ABS) estimates that key cultural and arts sectors contribute over $4.5 billion annually (or four percent) to the NSW economy.
• Infrastructure in Regional NSW to support cultural facilities is provided by local Government, supported by grants from the NSW Government. The majority of the State Government’s expenditure on arts and recreation is provided to local Government and arts organisations.
1 Asset values and expenditure exclude Museum of Contemporary Art’s expansion as it is not a NSW Government owned institution.

The solution Section 14 Social Infrastructure Page 181 Infrastructure NSW | State Infrastructure Strategy
• Infrastructure investment in these portfolios has, however, historically been ad hoc and without an overarching strategy.
• The NSW Government is preparing a Cultural Venues Plan and has initiated reform to the management of recreational venues via development of the NSW Stadium Strategy and the establishment of Venues NSW.
• The NSW Government’s Visitor Economy Taskforce has also recognised the critical role of arts and recreation in achieving economic benefits from the visitor economy both in Sydney and in Regional NSW.
14.2.2 Industry Structure
ArtsSydney has Australia’s largest community of artists across fields including music, film, performing arts, visual arts, museums and festival events. Ten of the 28 major performing arts group in Australia are located within the State. The Sydney-based cultural institutions also play an important role in Regional NSW through lending and touring collections, offsite presentations and providing online access to resources and digitised collections.
Future growth of these institutions, however, may be constrained by infrastructure limitations. For example, the Art Gallery NSW exhibition space, (23,000m²), is half the size of comparable facilities in Canberra, Melbourne and Brisbane. Only two of the last 10 blockbuster exhibitions in Australia took place in Sydney2.
2 PwC 2012, Arts and Recreation Report.
RecreationNSW’s recreational facilities include leading sporting venues, beaches, parks and reserves. Many of these facilities have strong links to the community and are a core component of a high quality of life.
There are over 25 million visits to parklands each year - 12 million visits to Sydney Olympic Park, 11 million at Centennial Parklands and around two million at Parramatta Park. The NSW Stadium Strategy and the establishment of Venues NSW will improve management of Government-owned sporting and entertainment venues in the Hunter, Western Sydney and the Illawarra. Infrastructure NSW has considered the two largest infrastructure assets – Sydney Olympic Park and the Moore Park precinct.
Visitor EconomyOverall visitor numbers in Sydney have remained broadly flat over the past decade, averaging 2.7 million visitors per year. International holiday visitor numbers are lower in 2010 (1.9 million) than they were in 2001 (2.3 million).
The Visitor Economy Taskforce strategies to increase visitor numbers rely, to some extent, on the attractiveness of our cultural institutions and programs.
As figure 14.5 illustrates, in 2010 3.6 million people attended the State’s four leading cultural institutions and 4.7 million people attended Government-owned sporting venues:
Culture venues
Tota
l num
ber o
f Atte
ndee
s (m
)
Sporting venues and events0
0.5
1.0
1.5
2.0
2.5
3.0
3.5
4.0
4.5
5.0
Sydney Opera House
Australian Museum
Hunter Region Sporting Venues
Centennial Park and Moore Park Trust
Illawarra Venues
Parramatta Stadium
Major Stadiums at Sydney Olympic Park
Sydney Cricket and Sports Grand Trust
Figure 14.5 Attendance at Major Cultural and Recreational Institutions 2010/11
Source: Arts NSW, referenced in PwC; Repucom; INSW analysis Note: Does not include estimated site visits or trips to parklands. Visits to parklands are estimated at 12.5million visits to Sydney Olympic Park, 11million at Centennial Park and over 1.7million at Parramatta Park. Figures for Major stadiums at Sydney Olympic Park and Parramatta Stadium not speci�ed for 2010/11; based on 2009/10 data.
Art Gallery of NSW
Museum of Applied Arts and Sciences

The solution Section 14 Social Infrastructure Page 182 Infrastructure NSW | State Infrastructure Strategy
14.2.3 Private Participation and Funding
The arts sector is funded by ticket sales, sponsorship, philanthropy and the three levels of Government, Commonwealth, state and local. Arts ticket sales in NSW raised $465 million in 2009-10, the largest of any State, but this is not used to fund infrastructure.
Private funding for NSW cultural institutions has nearly doubled over the past decade and now accounts for over 10 percent of total funding. NSW accounts for the largest share of private sector support in Australia, 37 percent.
Arts NSW advise that private and philanthropic funding is directed to public facing works such as new galleries, acquisitions or extensions to exhibition space. All acquisitions made by the Art Gallery of NSW are fully privately funded.
Infrastructure NSW notes that arts cluster renewal and support of institutions in other cities has been driven, supported and delivered by businesses, industry groups and individuals in a “Development Partnership” model. For example, development partnerships have been used in London and New York to increase funding for clusters as part of broad regeneration efforts3.
Investment in infrastructure could also generate more philanthropy for collections, sponsorship of programs and events and increase self-generated revenue.
Infrastructure NSW proposes that Arts NSW and the Australian Business Arts Foundation develop the new “Arts Development Partnership” approach to infrastructure funding.
3 Global Sydney, A Five Year Strategy for a Vibrant & Competitive City of Sydney.
0
20
40
60
80
100
Donations Sponsorship
09/10 09/10 09/10 09/10 09/10 09/10 09/10
NSW VIC QLD WA SA TAS ACT
Figure 14.6 Arts sponsorship & giving by State/Territory
Source: Australia Business Arts Foundation; cited by PwC.
Recommendation Infrastructure NSW recommends a new approach to arts funding by supporting the establishment of an Arts Development Partnership which explores alternative partnership models for capital funding.
14.2.4 Developing the Arts Ribbon
Arts and cultural policies and investments that are integrated with broader development and regeneration effort achieve the highest benefits. Infrastructure NSW supports the development of the Arts Ribbon linking the cultural venues around Sydney Harbour and the CBD.
Government funding is limited, and accordingly alternative funding sources will be critical, particularly in respect of planned refurbishment of the Opera House.
In the next five years, the Arts Ribbon will be stimulated by committed investments at Walsh Bay, Barangaroo and Darling Harbour.
The Barangaroo Delivery Authority proposes the following core cultural components for Barangaroo:
• a new Australian Centre for Indigenous Culture including a Gallery of Art and performance spaces
• a new Australian design centre
• a landmark public art commission.
These projects will be privately funded. At this time there is no detailed timeline or funding strategy for delivery of these assets.
Infrastructure NSW has reviewed the following infrastructure priorities within the Arts Ribbon that are highest value in the proposed NSW Government’s Culture Venues Plan (while noting that other proposals, State Library and Australian Museum, are being prepared).

The solution Section 14 Social Infrastructure Page 183 Infrastructure NSW | State Infrastructure Strategy
Parramatta Rd
Wattle St
Ultimo Rd
Pitt St
Goulburn St
Oxford St
Bour
ke S
t
Eliza
beth
St
Ocean St
Chal
mer
s St
Crow
n St
Burton St
Liverpool St
King St
York St
Market St
Bridge St
Sussex St
Wigram Rd
M4 Western Distributor Freeway
SydneyOpera House
MaritimeMuseum
Museum ofContemporary Art
PowerhouseMuseum
Chinese Gardens Australian
Museum
Sydney Exhibition and
Convention Centre
Art Gallery of NSW
State Libraryof NSW
Walsh BayBalmain
East
Barangaroo
RushcuttersBay
Port Jackson
Kirribilli
Dawes Point
North SydneyMcMahons Point
Milson Park
Cremorne Point
The Rocks
Woolloomooloo
Potts Point ElizabethBay
DarlingPoint
Double Bay
Paddington
Surry HillsRedfern
Ultimo
Haymarket
Glebe
CamperdownUniversity of Sydney
Darlinghurst
Woollahra
Royal BotanicGardens
Wynyard
Balmain
Birchgrove
Cockle Bay
Darling Harbour
JohnsonsBay
Mort Bay
Berrys BayParramatta River
Lavender Bay
Mosman Bay
Sydney Cove
Farm Cove
WoolloomoolooBay
ElizabethBay
PyrmontBay
Rozelle BayBlackwattle
Bay
Figure 14.7 Cultural venues around Sydney’s Harbour and CBD
Source: PwC.
Walsh Bay Arts Precinct A priority action in NSW 2021, and hence the main priority for Arts NSW, is finalising long-term plans for Pier 2/3, Wharf 4/5 and Sydney Theatre at Walsh Bay and the development of the Walsh Bay Arts Precinct.
The vision for Walsh Bay is to create a world class arts and culture precinct that supports and nurtures Sydney’s home-grown culture and creativity, including the next generation of artists, performers and cultural innovators.
It will be a distinctly Sydney experience profiling the State’s major arts organisations in a renewed urban environment. It will complement neighbouring cultural activities at Barangaroo, Sydney Opera House and the Museum of Contemporary Art. A masterplan for the investment has been completed.
Art Gallery of NSW The Art Gallery has reached the capacity of its current footprint and proposes to double the floor area through the construction of a new wing, possibly to the North East of the existing building, at an estimated capital cost of $400 million. The concepts for the expansion of the gallery could include new transport links and a doubling of the existing exhibition space as well as allowing for blockbuster exhibitions and more of the permanent collection to be on display.
There is an opportunity for this proposal to be integrated with a broader vision for improved access to the Royal Botanic Gardens and the Domain. No design or funding strategy has yet been identified for this scheme.

The solution Section 14 Social Infrastructure Page 184 Infrastructure NSW | State Infrastructure Strategy
Sydney Opera House The Sydney Opera House is currently undergoing staged refurbishment and a broad ranging renewal proposal is expected to be finalised in 2012-13.
The current works are modular – works to improve access have commenced at a cost of $152 million and accounts for the increase in the arts capital budget in 2011-12 and 2012-13. The proposed next stage is refurbishment of the Opera Theatre. The Opera House reports that, without renewal, the Opera Theatre may have to be repurposed to a drama or recital hall.
Infrastructure NSW has concluded that the scale of expenditure proposed by the Opera House is likely to be beyond the funding capacity of the NSW Government.
The Sydney Opera House is a World Heritage listed site, with iconic status. Given the significance of the Opera House to Australia and the visitor economy, Infrastructure NSW is of the view that future funding discussions should be held with the Commonwealth, the private sector and individual philanthropists to fund the project.
Sydney International Convention, Exhibition and Entertainment CentreThe Sydney International Convention, Exhibition and Entertainment Precinct (SICEEP) will deliver Australia’s largest convention, exhibition and entertainment facilities on a 20 hectare site in South Darling Harbour by the end of 2016.
SICEEP has been designed to complement Sydney Olympic Park (SOP) over the longer term. As the Homebush site evolves, Sydney will enjoy the benefits of
a ‘two precinct’ model for exhibitions, with the largest exhibitions potentially moving out to SOP.
Recommendation Infrastructure NSW supports Arts NSW’s Cultural Venues Plan (draft) and focus on the development of an Arts Ribbon around the CBD, the development of a world class arts and cultural precinct at Walsh Bay and phased renewal of the Opera House and expansion of the Art Gallery of New South Wales.
All projects are subject to future detailed planning work and approvals.
14.2.6 Sports and Recreational Precincts
Sydney Olympic Park Sydney Olympic Park (SOP) comprises a 640 hectare precinct at Homebush, under the management of the Sydney Olympic Park Authority. The site includes sporting venues, parklands, the Royal Agricultural Society (RAS) showground, commercial development and residential development. There is over $1.8 billion of infrastructure at SOP, most of which has been funded by the NSW Government4.
The SOP has largely achieved its masterplan to provide capacity for a daily population of over 51,500 people in addition to visitors and event patrons, including more than 31,500 jobs and about 6,000 new dwellings housing approximately 14,000 residents. Sydney Olympic Park’s major event capability is up to 250,000 patrons at any one time.
4 Sydney Olympic Park Authority.
SOP is now a maturing asset, which requires a new strategy that can move forward from the Olympics era. With more than a decade’s worth of operating experience, it is now possible to assess the strengths and weaknesses of the current customer offering at SOP. Consideration can also be given as to how best to realise value from the Government’s investment in the precinct.
Recommendation Infrastructure NSW recommends a review of Sydney Olympic Park to identify the optimal development path. The focus of this review should be identifying a business plan that best meets the State’s development and financial objectives.
Moore Park PrecinctThe Moore Park provides a sporting and recreational precinct that includes the Sydney Cricket Ground (SCG), the Sydney Football Stadium (Allianz Stadium) and the Entertainment Quarter. It also adjoins the Centennial Parklands.
The NSW Government has allocated $72 million towards a major renewal of the SCG by the end of 2014. This upgrade will secure the SCG’s future as a leading sporting venue for the next generation.
Public transport to the Moore Park precinct is currently provided by special event buses from Central and Circular Quay. While these arrangements have generally proved adequate, the experience falls short of world class standards. For example, Melbourne’s leading venues are well served by both trains and trams.
The solution Section 14 Social Infrastructure Page 185 Infrastructure NSW | State Infrastructure Strategy
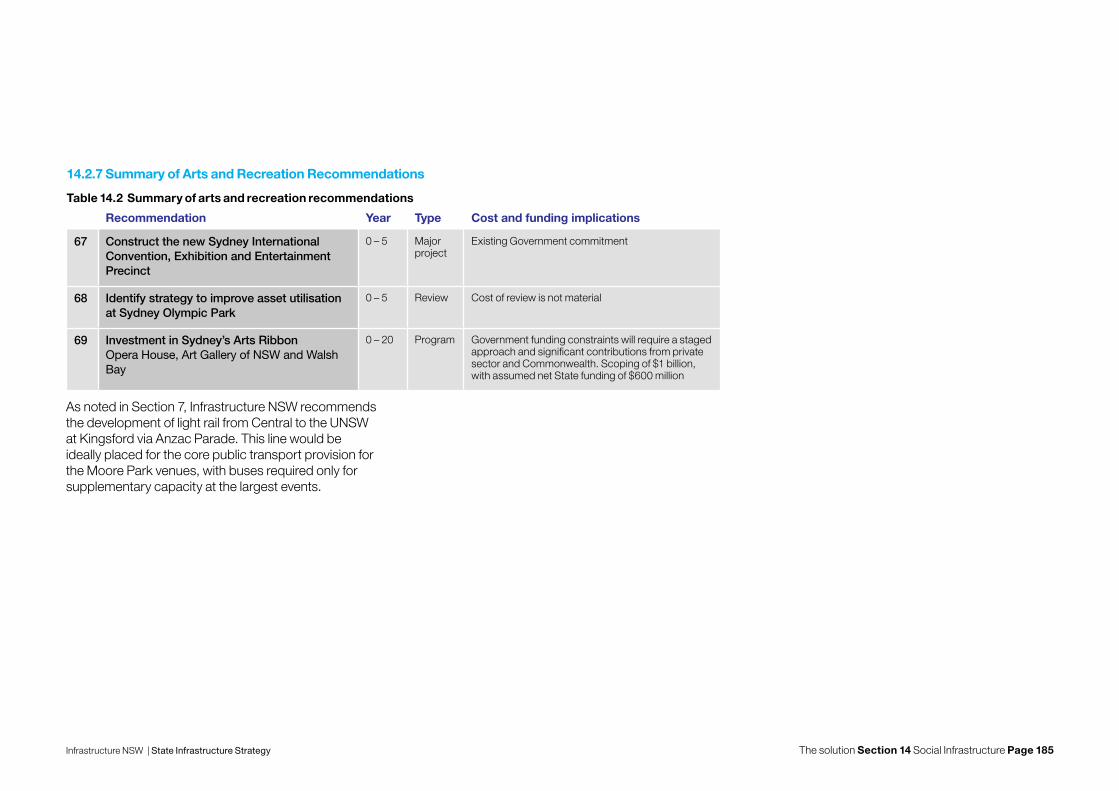
14.2.7 Summary of Arts and Recreation Recommendations
Table 14.2 Summary of arts and recreation recommendations
Recommendation Year Type Cost and funding implications
67 Construct the new Sydney International Convention, Exhibition and Entertainment Precinct
0 – 5 Major project
Existing Government commitment
68 Identify strategy to improve asset utilisation at Sydney Olympic Park
0 – 5 Review Cost of review is not material
69 Investment in Sydney’s Arts Ribbon Opera House, Art Gallery of NSW and Walsh Bay
0 – 20 Program Government funding constraints will require a staged approach and significant contributions from private sector and Commonwealth. Scoping of $1 billion, with assumed net State funding of $600 million
As noted in Section 7, Infrastructure NSW recommends the development of light rail from Central to the UNSW at Kingsford via Anzac Parade. This line would be ideally placed for the core public transport provision for the Moore Park venues, with buses required only for supplementary capacity at the largest events.

The solution Section 14 Social Infrastructure Page 186 Infrastructure NSW | State Infrastructure Strategy
14.3 JusticeSummary• The justice sector requires less investment in
infrastructure in the next 20 years.
• As a result of lower demand and technology driven improvements in service models, there is an opportunity to reconfigure and dispose of surplus justice infrastructure in NSW.
• The NSW Government has expanded policing with more community and transport police presence; this means more police stations are needed.
• Infrastructure NSW recommends repurposing underused Court Houses, which would provide additional capital for the police program.
• There is no forecast need for new large correctional facilities. Infrastructure NSW recommends a review of the benefits of a full service outsourcing model for correctional facilities.
14.3.1 Justice snapshot
• The NSW Government has $5 billion invested in justice assets.
• Justice infrastructure includes 163 court facilities, 33 correctional centres, nine juvenile custodial centres (two will be closed in 2012-13) and 1,500 police stations and residences.
• Capital expenditure has averaged $324 million per annum over the last 10 years but forecast expenditure over the budget estimates is nearly 25 percent lower at $263 million per annum.
• Less investment is needed over the next 20 years because existing infrastructure largely meets existing demand and ICT is facilitating improved access to services with less reliance on physical infrastructure. Some assets are already under-utilised – court houses have an average utilisation rate of 52 per cent.
14.3.2 Demand
Demand across the justice portfolio is relatively flat and in some areas declining. In 2010-11 the prison inmate population declined (for the first time in 13 years) by 337, around three percent of capacity, and a 2006 program to provide 1,000 additional beds will be suspended after securing 850 new beds.
Court houses in particular have excess capacity. This results from a combination of:
• Policies to reduce recidivism including through greater use of non-custodial punishment for less serious offences, particularly for juvenile offenders.
• Greater use of technology across the portfolio which means there is less need for individuals to be physically present e.g. ‘virtual’ court proceedings.
• The decline in the prison population in tandem with the opening of a new correctional centre on the South Coast allowed for closure of three prisons in 2011.
There is higher demand for police infrastructure. Increasing police numbers means targeted expansion of some facilities is needed to accommodate additional police and delivery of new community services, including transport policing.
14.3.3 ICT enabled service delivery
A variety of delivery models have potential to generate capital and operating cost savings if delivered effectively and if they are accompanied by disposal of under-utilised assets. Information and Communication Technologies (ICT) is reducing the dependence on physical assets. For example, remote witness and video conferencing facilities are being expanded across the State allowing witnesses to give evidence from remote locations thereby reducing the need for purpose built buildings.
As a result, less physical infrastructure is needed. Investment is needed in technology infrastructure.
Recommendation Infrastructure NSW recommends reconfiguring and disposing of surplus court house, with increased use of technology to offset capital requirements

The solution Section 14 Social Infrastructure Page 187 Infrastructure NSW | State Infrastructure Strategy
Centres of Excellence and justice precincts Co-location of court, police and education facilities (University law faculties) has some agglomeration benefit and also provides potential for development of specialty centres.
A justice precinct strategy was the basis for investment in a new building in Parramatta and is being partially implemented in Newcastle. It was originally envisaged that State and Federal Police and Court facilities as well as the University of Newcastle University Law Faculty would be co-located. Currently, a NSW court complex is under construction with potential for re-location of the Newcastle University Law Faculty.
Shortcomings in cross-portfolio planning and securing agreement with the Commonwealth Government has hampered this initiative and future cross-sector planning needs greater integration.
Private sector provisionThe level of involvement of the private sector in NSW is lower than Victoria, which has a much higher proportion of inmates in private facilities. Two prisons in NSW are currently operated by the private sector – Junee and Parklea. The private sector designed and built Junee Correctional Centre in the early 1990s. Parklea was originally publicly built and operated but its management and operation was contracted out in 2009.
Some facilities within prison complexes have also been delivered using PPPs including an 85 bed prison hospital to replace an existing facility, and a new 135 bed forensic hospital within the Long Bay Correctional Complex at Malabar, completed in 2008.
There are varying estimates of cost savings for private prisons relative to public prisons – these include 11 to 30 per cent in the United Kingdom and five to 15 percent in the United States1. However, there are no comparisons available for NSW on a like-for-like basis, including consideration of the many maintenance roles currently performed by prisoners.
Infrastructure NSW supports development of a full service outsourcing model for correctional facilities.
Table 14.3 Summary of justice recommended actions
Recommended Action Year Type Cost and funding implications
70 Reconfigure court house assets, with increased use of ICT for less capital intensive delivery
0 – 5 Asset utilisation Potential capital savings
1 The expected savings for contracting out the management and operation of Parklea and Cessnock prisons was $15 million per annum. Source: General Purpose Standing Committee No.3 2009.