1.4 Relations between sedimentary basins and petroleum provinces · 2016-02-09 · sedimentary...
44
1.4.1 Plate tectonics Plate tectonics is the theory, supported by large amounts of empirical data, which explains the evolution of the Earth’s outer shell, or lithosphere. The lithosphere is fragmented into a series of smaller segments, known as plates, which move relative to one another. The term plate tectonics also refers to that branch of the geological sciences which studies the morphology and movements of plates, and the various phenomena affecting them. This fragmentation and movement, responsible for the current configuration of the Earth’s crust, generate seismic phenomena and cause the formation of the sedimentary basins which contain almost all the source and reservoir rocks where hydrocarbons accumulate. Life on Earth is made possible by the atmosphere and hydrosphere which were produced and continue to be sourced primarily by the degassing of the mantle through volcanism and other phenomena that are a direct consequence of plate tectonics. As such, the movements of the plates can be said to represent the basis for life on Earth. In this article, we will outline the essential aspects of plate tectonics. We will first describe the structure of the lithosphere and analyse the data currently available on the movements of the plates (in other words, their kinematics) on the basis of geological and seismological methodologies, and on space geodesy. We will then describe the three main types of plate margins: divergent (or rifting), transform (laterally moving) and convergent (or subductions). We will deal summarily with sedimentary basins, as a function of their geodynamic environment, and then with their nature and origin. Finally, we will examine hypotheses regarding the dynamics and energy sources governing the movement of the plates. Lithosphere The lithosphere is made up of the crust and the lithospheric mantle. Since we differentiate between oceanic and continental crust (Fig. 1), the lithosphere is subdivided in the same way. The crust and the lithospheric mantle are separated by the Moho discontinuity. Beneath this, in the mantle, the propagation velocity of seismic P-waves (longitudinal) increases abruptly from about 6.8-7 kms to about 8-8.2 kms, and that of S-waves (transverse) from 3.9 kms to 4.5 kms. We do not have sufficient data to determine the extent to which oceanic lithospheric mantle differs from continental lithospheric mantle; we therefore assume a peridotitic composition for 117 1.4 Relations between sedimentary basins and petroleum provinces Moho (30-40 km) lithosphere upper mantle continent ocean ASTHENOSPHERE lithospheric mantle s. l. passive margin sedimentary cover basement lower stratified crust crust 3.3 g/cm 3 3.0 g/cm 3 2.8 g/cm 3 3.4 g/cm 3 Fig. 1. Schematic stratigraphy of the crust and continental and oceanic lithosphere. VOLUME I / EXPLORATION, PRODUCTION AND TRANSPORT
Transcript of 1.4 Relations between sedimentary basins and petroleum provinces · 2016-02-09 · sedimentary...
1.4.1 Plate tectonics
Plate tectonics is the theory, supported by largeamounts of empirical data, which explains theevolution of the Earth’s outer shell, or lithosphere. The lithosphere is fragmented into a series of smallersegments, known as plates, which move relative toone another. The term plate tectonics also refers tothat branch of the geological sciences which studiesthe morphology and movements of plates, and thevarious phenomena affecting them. Thisfragmentation and movement, responsible for thecurrent configuration of the Earth’s crust, generateseismic phenomena and cause the formation of thesedimentary basins which contain almost all thesource and reservoir rocks where hydrocarbonsaccumulate. Life on Earth is made possible by theatmosphere and hydrosphere which were producedand continue to be sourced primarily by the degassingof the mantle through volcanism and otherphenomena that are a direct consequence of platetectonics. As such, the movements of the plates can besaid to represent the basis for life on Earth.
In this article, we will outline the essentialaspects of plate tectonics. We will first describe thestructure of the lithosphere and analyse the datacurrently available on the movements of the plates(in other words, their kinematics) on the basis ofgeological and seismological methodologies, and onspace geodesy. We will then describe the three maintypes of plate margins: divergent (or rifting),transform (laterally moving) and convergent(or subductions). We will deal summarily withsedimentary basins, as a function of theirgeodynamic environment, and then with their natureand origin. Finally, we will examine hypothesesregarding the dynamics and energy sourcesgoverning the movement of the plates.
LithosphereThe lithosphere is made up of the crust and the
lithospheric mantle. Since we differentiate betweenoceanic and continental crust (Fig. 1), the lithosphere issubdivided in the same way. The crust and thelithospheric mantle are separated by the Mohodiscontinuity. Beneath this, in the mantle, thepropagation velocity of seismic P-waves (longitudinal)increases abruptly from about 6.8-7 km�s to about 8-8.2 km�s, and that of S-waves (transverse) from3.9 km�s to 4.5 km�s. We do not have sufficient data todetermine the extent to which oceanic lithosphericmantle differs from continental lithospheric mantle;we therefore assume a peridotitic composition for
117
1.4
Relations between sedimentary basinsand petroleum provinces
Moho(30-40 km)
lith
osp
her
e
upp
er m
an
tle
continent
ocean
ASTHENOSPHERE
lith
osp
her
ic m
an
tle
s. l.passive marginsedimentary cover
basement
lower stratified crust
cru
st
3.3 g/cm3
3.0 g/cm3
2.8 g/cm3
3.4 g/cm3
Fig. 1. Schematic stratigraphy of the crustand continental and oceanic lithosphere.
VOLUME I / EXPLORATION, PRODUCTION AND TRANSPORT
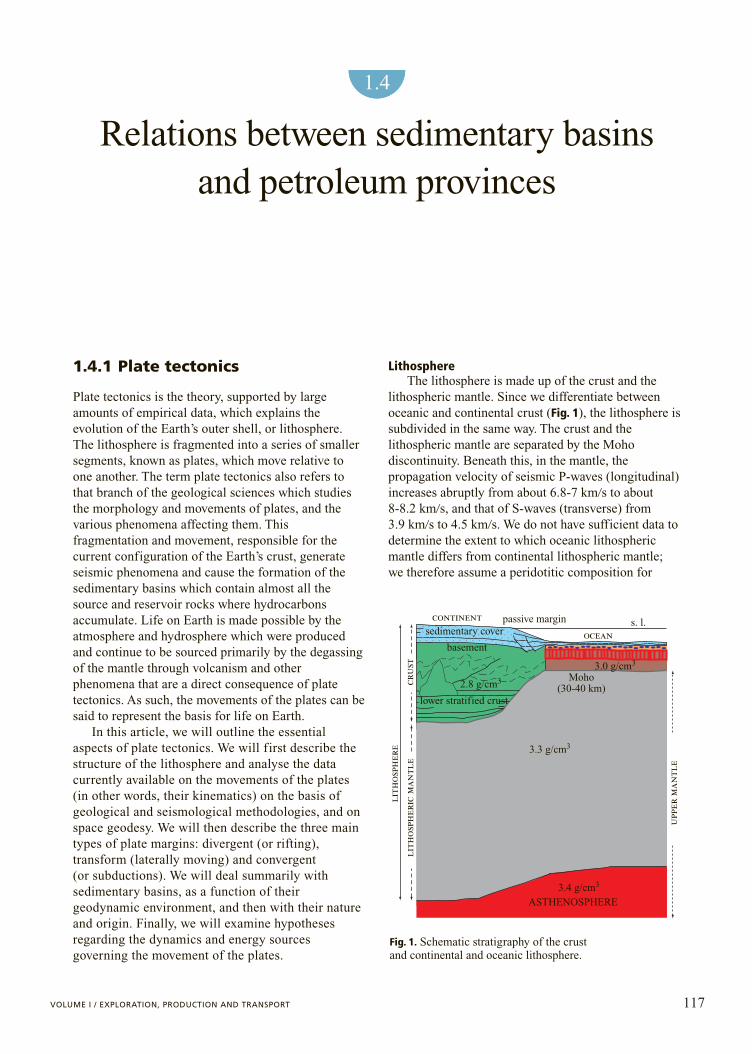
both, with a density of about 3.3 g�cm3. Thelithosphere thus starts at the Earth’s surface andreaches down to the isotherm of about 1,300°C; abovethis temperature, the mantle begins to melt partially.This marks the boundary with the zone known as theasthenosphere (from the Greek asÿenØj for “weak”),or ‘low velocity channel’ where, as a result of thepartial melting of the mantle, P-waves and S-wavesslow respectively to velocities of 7.9 km/s and 4.4km/s. The base of the lithosphere is thus interpretedmainly as a phase transition, rather than as a chemicalvariation (Fig. 2).
The oceanic lithosphere is thinnest next to mid-ocean ridges (about 10 km) and thickens as it moves
away up to about 100 km. This distance corresponds toan increase in ocean depth. The older the oceaniccrust, the deeper the seafloor. We therefore believe thatthe 1,300°C isotherm, marking the base of the oceaniclithosphere, sinks as the lithosphere cools and spreadsaway from the mid-ocean ridge. Consequently theseafloor also sinks, due to the higher density of thelithosphere. During the first 10 My (million years)after its formation, the seafloor subsides by about1,000 m as it spreads away from the mid-ocean ridge;during the following 26 My it subsides by a further1,000 m. This variation is described by the simpleformula z�k��E where z is the difference in depthbetween the mid-ocean ridge and the seafloor
118 ENCYCLOPAEDIA OF HYDROCARBONS
GEOSCIENCES
Pacific Ocean
Andes
SouthAmerica
AfricaAsia
back-arcbasin
asthenosphere
Pacific Ocean
Hawaiihotspot
Red SeaZagros
continental LITHOSPHEREdensity 2.3-3.3 g/cm3
70-200 km
oceanic LITHOSPHEREdensity 2.7-3.3 g/cm3
30-90 km
subduction
high speed
low speed
Mariana Islands
subduction Atlantic Ocean
6,500° Cdensity 13 g/cm3
INTERNALSOLIDCORE
6,371 km
UPPER MANTLE
LOWER MANTLEdensity 4-5 g/cm3
EXTERN FLUID COREdensity 10-12 g/cm3
2,890 km
3,000-4,000° C
1,300° C
400 km
670 km
5,150 km
Fig. 2. Model of the Earth where the various shells correspond to physical discontinuities allowing them to slide past oneanother, similar to that between the molten outer core and the inner core, whose differential rotation generates the Earth’s magnetic field. The lithosphere behaves in an elastic manner, whereas the mantle exhibits visco-elastic behaviour, giving it theability to flow if subjected to stress over a long period of time. The convective motions postulated for the mantle therefore takeplace in the solid state. There are two large areas in the lower mantle which show relatively low seismic velocities beneath thecentral Pacific and Africa.
expressed in metres, k is a constant equal to about 320and E is the age of the oceanic crust expressed in My.This important relation, known as the Sclater curve,allows us to calculate the depth of the sea below amid-ocean ridge up to the age of about 60-80 millionyears. Over this age, seafloors no longer appear to sinkas a consequence of thermal effects. Heat flowdiminishes with distance from the mid-ocean ridge(Stein, 1995) and the velocity of seismic S-wavesincreases; these facts indicate a decrease in ‘melt’ inthe underlying mantle.
The oceanic crust is about 5-8 km thick and has anaverage density of 2.9-3 g�cm3. It is made up of threelayers, not all of which are necessarily present,forming a sequence from bottom to top of: a layer ofgabbro, a layer of dikes, and an upper layer of lavas,pillow lavas and oceanic sediments.
The continental crust, being less dense (about 2.7-2.8 g�cm3), is thicker than the oceanic crust, withthe Moho at an average depth of about 30-40 km. Thecrust thickens beneath cratons and orogens up to about70 km, and thins at passive continental margins toabout 15 km. Continental crust consists of a sequencefrom bottom to top of: a lower femic crust, generallystratified by magmatic and metamorphic processes; anupper crust, mainly consisting of rocks of varyingmetamorphic grade and granite intrusions due toearlier orogenies; a sedimentary cover whose thicknessvaries from 0 to 15 km. The sedimentary coverconsists of sediments deposited during eustatic raisesor epeirogenic subsidence within cratons, or ofintraplate or passive continental margin syn-riftsediments. In the proximity of orogens, the upper layeris composed of foreland basin sediments (flysch andmolasse).
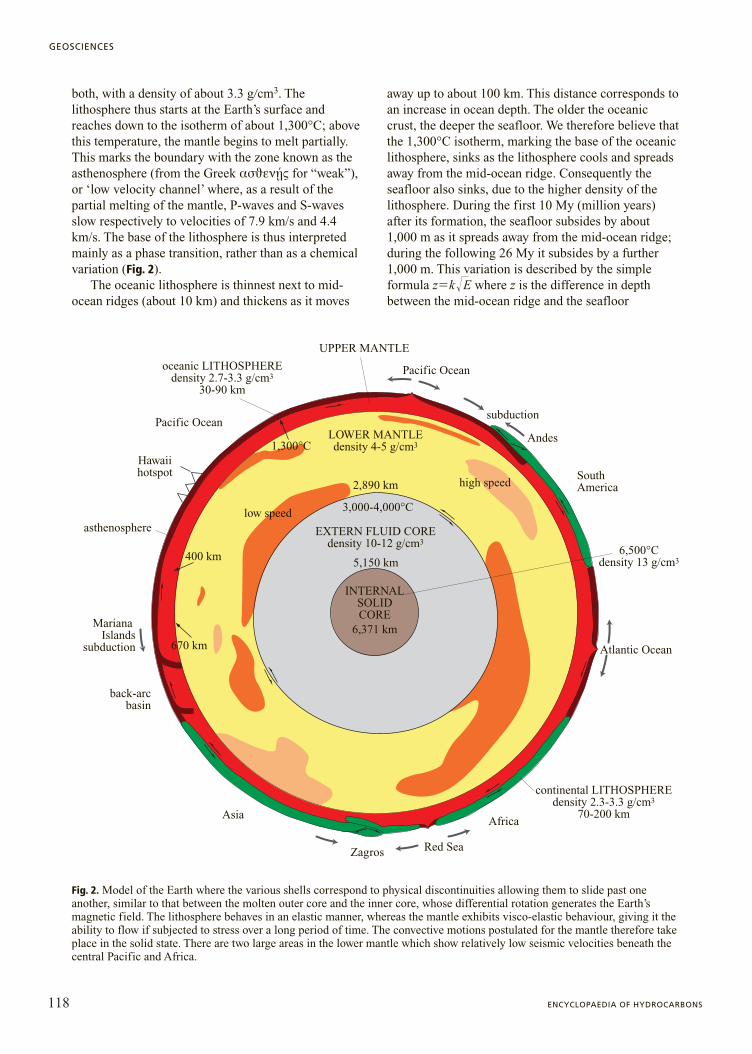
The age of the oceanic crust ranges from 0 to 180 My(Fig. 3), whereas the continental crust may reach agesof over 3,900 My. This is a consequence of theextreme mobility of the oceanic crust, which forms
rapidly in mid-ocean ridge zones and disappearsequally rapidly in subduction zones due to its higherdensity. The lighter continental crust, on the otherhand, subducts less easily into the mantle and thusremains floating on the surface, growing slowly toincrease the area dimensions of the continentallithosphere, which has an average thickness of about100-150 km, up to a maximum of about 200-250 kmbeneath the major cratons (Windley, 1995;Gung et al., 2003).
The lithosphere is subdivided into plates; a plate isa segment of lithosphere characterized by itsindependent motion relative to the adjacentlithosphere. The major plates are: the North American,South American, European, African, Arabian, Indian,Australian, Antarctic, Pacific and Nazca plates. Thereare other smaller plates such as the Philippine, Cocosand Juan de Fuca plates. Plate tectonics is generatedby the different velocities among the plates. Themovement of the plates towards or away from oneanother is governed by the relationship, or the degreeof coupling, between the lithosphere and theunderlying mantle. The Earth’s seismicity ismanifested only within the lithosphere, and disappearsat a depth of 670 km. This is the maximum depth atwhich subduction zones can be detected, at thetransition between the upper and lower mantle.
Plate kinematicsOne fundamental aim of tectonics is to determine
the depth of decollements (or decoupling zones).Along decollements, upper and lower zones slide pastone another. In plate tectonics, the main decollementlies at the base of the lithospheric mantle, coincidentwith the asthenosphere. This part of the mantle has thelowest average viscosity, generally between 1017 and1019 Pa�s, and locally as little as 1015 Pa�s where theasthenosphere is hydrated. There are various structureswithin the asthenospheric decollement which may
119VOLUME I / EXPLORATION, PRODUCTION AND TRANSPORT
RELATIONS BETWEEN SEDIMENTARY BASINS AND PETROLEUM PROVINCES
Fig. 3. Map showing the age of oceanic crust. The blue areas of most ancientoceanic crust (Jurassic) are located in the westernPacific, the central Atlantic,and the western Indian Ocean(Müller et al., 1997).
tim
e (M
y)
180.0
154.3147.7139.6131.9126.7120.4
83.5
67.7
55.947.940.133.1
20.19.70.0
explain the differences in velocity between the platesabove, in other words their relative motion.
Faults are surfaces of fracture and movement of thebrittle part of the crust, which behaves in a mainlyelastic way. These may be horizontal (i.e.decollements) or inclined up to 90°. The rock above afault is known as the hangingwall; that below a fault isknown as the footwall. When the hangingwall movesup relative to the footwall, the fault is known as areverse fault; it is described as a thrust fault if it has anaverage inclination of about 30°. If the hangingwallmoves down relative to the footwall, the fault is knownas an extensional or normal fault, and has an averageinclination of 60°. When hangingwall and footwall areindistinguishable because the fault is vertical andmovement purely horizontal, we speak of atranscurrent or strike-slip fault. At the crustal level, thedepth of the decollement determines the spacingbetween faults: the more superficial the decollement,the closer together the faults, and vice versa.
In subduction zones, where one plate sinks beneathan immediately adjacent plate, accretionary prisms areformed. These are mainly a combination of thrusts andfolds, which pile up and warp the rocks of the platesabove and below the subduction zone (overriding anddowngoing plates). Accretionary prisms thicken in thedirection of subduction, taking on a wedge shape; theyare therefore also known as accretionary wedges. Thedeeper the basal decollement, the greater the volume of
the accretionary prism. The term accretion refers to thetransfer of rock from the downgoing to the overridingplate, where the accretionary prism itself is located.The expression tectonic erosion, on the other hand,refers to the transferral of the decollement into theoverriding plate, thus temporarily subducting fragmentsof the downgoing plate. In this case there is noaccretion; this type of mechanism has been suggestedfor some sectors of the Andean subduction zone.
In areas where plates are moving apart (or riftingzones) the asthenosphere also seems to be the mainbasal decollement.
Plate movementsThe movement of the plates is obvious both from
tectonic structures (Fig. 4), and from seismicity andgeodetic measurements (Fig. 5). Space geodesy hasconfirmed that the relative movement of the plates isoften distributed in a zone at their margins, with awidth varying from 10 km to several hundred km,through numerous active faults which absorb thedeformation. Generally speaking, transform marginsare narrower than convergent margins. Pastmovements are recorded by the formation of orogensalong subduction zones, indicating that the plates haveconverged, and by the specularity of magneticanomalies in oceanic rifts. The movements of theplates can be analysed in relative terms, between pairsof plates; however we can also attempt to examine
120 ENCYCLOPAEDIA OF HYDROCARBONS
GEOSCIENCES
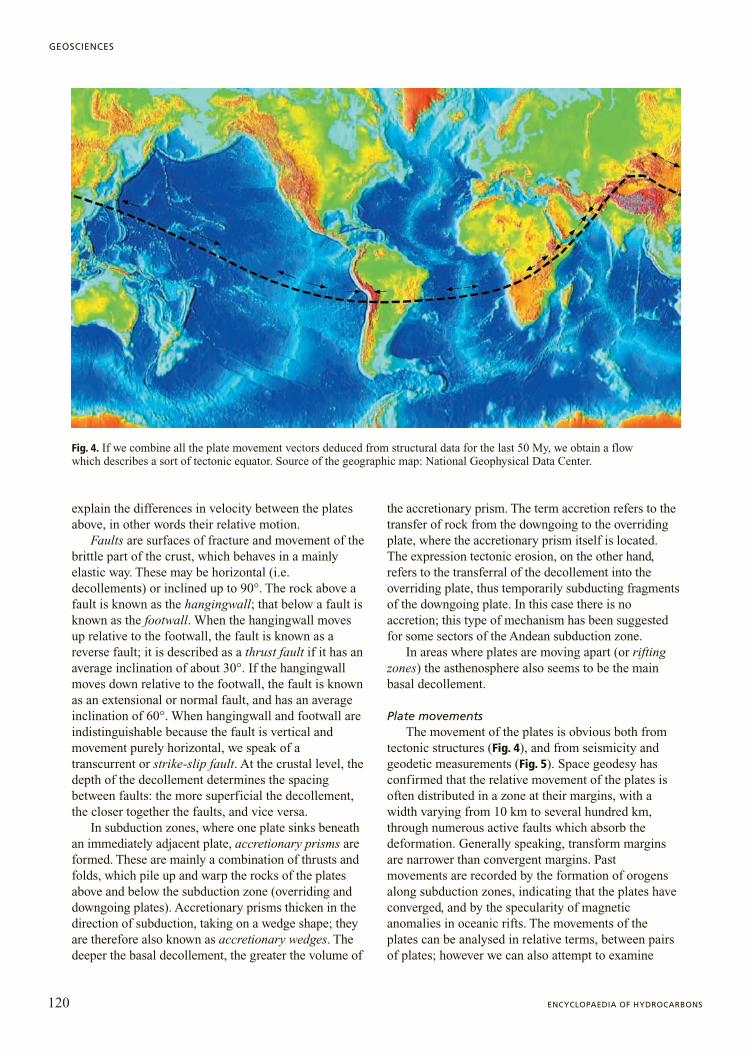
Fig. 4. If we combine all the plate movement vectors deduced from structural data for the last 50 My, we obtain a flow which describes a sort of tectonic equator. Source of the geographic map: National Geophysical Data Center.
them in terms of absolute movements, usingindependent reference systems such as hotspots, thefixed stars, or the Earth’s centre of mass.
The movement between two plates may occur atany angle, creating a full range of tectonicenvironments (i.e., compressional, transcurrent orextensional), and all situations in between where platesconverge with a lateral or transcurrent component(transpressional environments), or diverge with atranscurrent component (transtensional environments).Movements currently measured using space geodesyare of the same order of magnitude as those which canbe deduced for the geological past from the study ofmagnetic anomalies in the oceanic crust.Consequently, despite slight oscillations in longwavelength velocities, the movements of the plates canbe considered stable over time. It remains to be saidthat plate margins are born and die, modifying orabolishing velocity gradients.
Since the plates are moving over a sphere, therelative motion of two plates can be described usingEuler’s fixed point theorem (according to which themotion of a portion of a spherical surface can berepresented as a single rotation around a fixed point).Specifically, by identifying the rotation pole of thisrelative motion, we can calculate the increase in linearvelocity as distance from the pole increases (Fowler,1990). However, in nature two plates may have arotation pole which is not fixed, especially where oneof the two plates also has an independent sub-rotation.
If we consider the movements of the plates, whichcan be deduced for at least the last 50 My from
structural data such as rift zones, transform zones andorogens, we can conclude that the plates do not moverandomly, but follow a global flow. This flow has ageneral undulation (see again Fig. 4) describing a sortof tectonic equator, although this seems to represent asinusoid rather than a great circle. The lines of flowrepresent the mean direction of plate movements. Alongoblique plate margins (transtensional or transpressionalenvironments) the stress field is deviated and is notparallel to either the relative or absolute movement ofthe plates. For example, the Arabian Plate is movingNE-SW, the Red Sea Rift is a sinistral transtension andthe Gulf of Aden a dextral transtension.
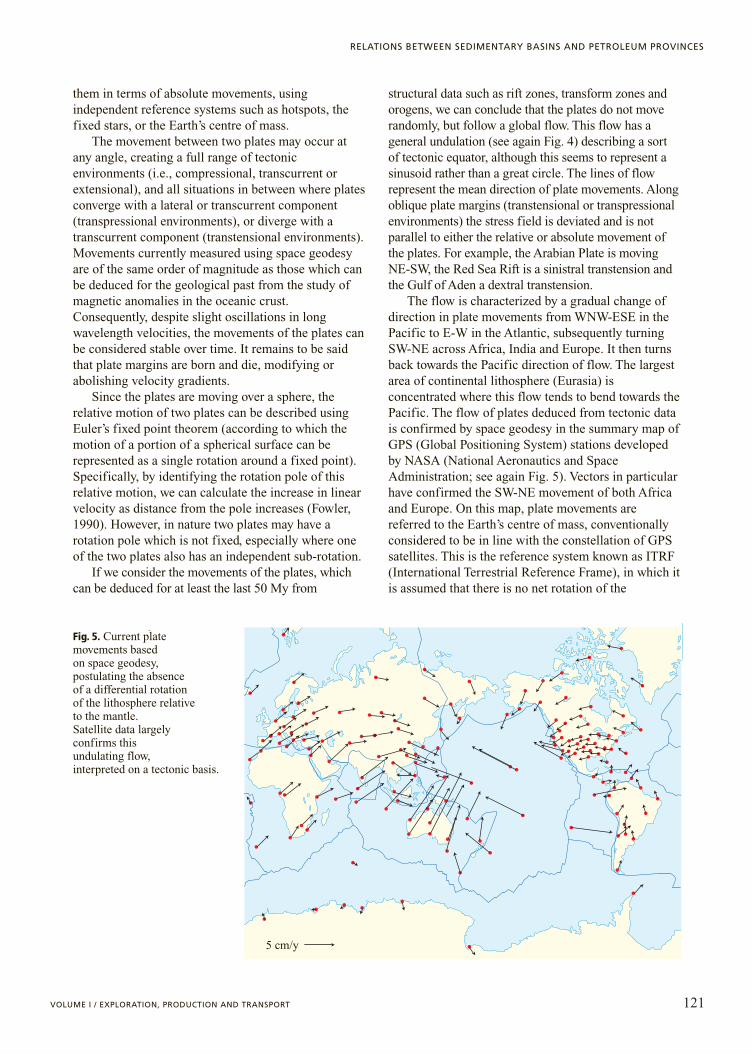
The flow is characterized by a gradual change ofdirection in plate movements from WNW-ESE in thePacific to E-W in the Atlantic, subsequently turningSW-NE across Africa, India and Europe. It then turnsback towards the Pacific direction of flow. The largestarea of continental lithosphere (Eurasia) isconcentrated where this flow tends to bend towards thePacific. The flow of plates deduced from tectonic datais confirmed by space geodesy in the summary map ofGPS (Global Positioning System) stations developedby NASA (National Aeronautics and SpaceAdministration; see again Fig. 5). Vectors in particularhave confirmed the SW-NE movement of both Africaand Europe. On this map, plate movements arereferred to the Earth’s centre of mass, conventionallyconsidered to be in line with the constellation of GPSsatellites. This is the reference system known as ITRF(International Terrestrial Reference Frame), in which itis assumed that there is no net rotation of the
121VOLUME I / EXPLORATION, PRODUCTION AND TRANSPORT
RELATIONS BETWEEN SEDIMENTARY BASINS AND PETROLEUM PROVINCES
5 cm/y
Fig. 5. Current plate movements based on space geodesy, postulating the absence of a differential rotation of the lithosphere relative to the mantle. Satellite data largely confirms this undulating flow, interpreted on a tectonic basis.
lithosphere relative to the Earth’s underlying interior(no-net-rotation).
In fact, if we analyse plate movements using otherreference systems, such as hotspots or the Antarctic,the lithosphere does have a net rotation relative to themantle, with a mean westward direction. This isparticularly evident if we consider the velocity at whichthe Pacific travels WNW, so high that the sum of themovements of all the other plates cannot compensatefor it, thus determining a residual westward movement.
The movement of the plates is faster in theequatorial and tropical belts, as indicated by spacegeodesy, earthquakes and magnetic anomalies for pastmovements. The flow of the plates, its westwardpolarization and the greater velocity of plates at lowlatitudes suggest that plate tectonics is influenced bythe Earth’s rotation. The concentration of the mantlealso seems to support this hypothesis; it is colder andheavier in the equatorial belt. The drift to the west, ormore accurately along the tectonic equator, is alsoevident from surface geology, such as the asymmetriesof mountain belts on the western and eastern Pacificmargins (see again Fig. 4), the arcs of westward-dipping subductions indicating the presence of anobstacle to flow in the opposite direction, and theasymmetry of rifting zones.
HotspotsHotspots are important for an understanding of the
internal dynamics of the Earth, and are particularlyuseful to measure plate movements with respect to thereference frame which they themselves represent.There are areas of enormous lava emission on both thecontinental and oceanic lithosphere, where severalmillion cubic metres of basalt are erupted over thespace of a few million years, such as the basalt traps ofParanà in Brazil, the Deccan Traps in India, or theOntong-Java Plateau in the south-western Pacific(LIPs, Large Igneous Provinces). Their origin is notclear, either as regards the depth of their source or thedynamics of the process. There are also magmaticevents which describe linear tracks over the Earth’ssurface, both subsea and subaerial, which become morerecent in a given direction. These lines are known ashotspots, and can be found both within plates and atplate margins. The most typical examples of intraplatehotspots are the Hawaiian-Emperor chain – whose ageranges from over 70 My to the current active volcanismof Mauna Loa, with an intermediate bend in themigration at about 47 My – or the islands of Luisvilleand MacDonald, also in the Pacific Plate. Other typicalexamples of hotspots which have created chains ofprogressively younger volcanoes located near platemargins are Iceland, the islands of Ascension andTristan da Cunha along the Mid-Atlantic Ridge, or
Easter Island near the East Pacific Rise. There arevarious schools of thought as to the origin of hotspots:among wich that they are sourced from the lowermantle, or from the upper mantle. Whatever the depthof their source, hotspots indicate that the lithosphereand asthenosphere are moving relative to one another.According to other studies, hotspots originate as aresult of excess heat produced by radioactive decay orthe heat of the Earth’s core welling upwards along apath of least resistance. Another possibility is thepresence of more fluids, lowering the meltingtemperature and thus generating greater magmatism atlower temperatures. In the latter case, hotspots are alsoknown as wetspots since the mantle is not hotter thannormal, but simply has a higher water content. Thismodel may provide a concrete explanation for theexistence of hotspots along mid-ocean ridges. Oneinterpretation of intraplate hotspots suggests thatmagmatism is generated by the heat of viscous frictionin the decollement of the astenosphere between thelithosphere and the sub-asthenospheric mantle.
Hotspots thus represent an important referencesystem for the study of plate movements. Specifically,hotspots within the Pacific Plate have remained fixedrelative to one another for at least 5 My. This gives us areference point in the mantle to study the relativemovement of the lithosphere; the relative movements ofplates can be recalculated using this reference system,which conventionally does not assume the absence of adifferential rotation between lithosphere and mantle.Using the hotspots reference system, Gripp and Gordon(2002) have observed that the lithosphere has a netwestward rotation of about 50 mm�y relative to themantle, with a pole of rotation at 56°S 70°E. However,this calculation also takes into account hotspots locatedat plate margins, postulating that these are sourcedfrom the lower mantle. If we consider only the hotspotswithin the Pacific Plate, and assume that the source ofmagmatism is located in the decollement due to theheat of friction, the westward drift of the lithosphererelative to the mantle is much greater, roughly double.This means that the flow of plates in Fig. 4 has a meanwestward orientation, in other words all the platesmove along this sinusoidal flow, but at differentvelocities. Velocity gradients, determined by the degreeof decoupling from the mantle, generate the varioustypes of plate margin and plate tectonics. The lower theviscosity of the asthenosphere, the faster the overlyingplate moves westward. The viscosity of theasthenosphere is lowest beneath the Pacific (5�1017 Pa�s)and the Pacific Plate moves most rapidly WNW(�100 mm�y). Therefore lateral variations of theasthenosphere viscosity, and variations of theasthenospheric and lithospheric thicknesses, shouldcontrol the different plate velocities. When a plate
122 ENCYCLOPAEDIA OF HYDROCARBONS
GEOSCIENCES

moves westward faster than the plate to its east theplate margin is divergent; if the former moves moreslowly the margin is convergent.
Rifting zonesRifting zones are areas where the lithosphere
separates into two plates that diverge from oneanother. The continental rifting stage is extremelyslow, with rates of horizontal extension in the orderof 0.1-0.3 mm/y, and may last for long periods(30-50 My or more). The process of extension (rifting)initially involves a lengthening and flatteningof the continental lithosphere. This processcan be quantified by dividing the initial thicknessof the lithosphere by its thickness when flatteneda ratio known as the b factor (McKenzie, 1978).For example, an area of lithosphere 100 km thick,subjected to tension and reduced to a thicknessof 20 km, has a b factor of 5. This meansthat the higher the value of b, the greaterthe thinning and the rise of isotherms,and consequently the heat flow.
The continental rifting stage is accompanied bygrowth sedimentation, with a typical tripartitesequence from bottom to top of: fluvial sandstones,evaporite deposits and carbonatic sediments. Thissequence is evidence of the gradual entry of the seainto the thinned zone of continental lithosphere;
subsidence is thus generated by the simultaneous riseof the denser asthenosphere from below.
Models of lithospheric extension can be dividedinto pure shear, simple shear and detachment models(Fig. 6). In pure shear, the lithosphere thinsinstantaneously and symmetrically, subsequentlyundergoing thermal cooling with accompanyingsubsidence (McKenzie, 1978). In simple shear, thelithosphere is cut by a large-scale low-angle fault, withone plate overlying and another underlying theextension, giving the rift a strongly asymmetricalcomponent (Wernicke, 1985). Isostatic uplift of theunderlying plate, and an axial disalignment betweenthe superficial extension and the uplift of theunderlying mantle have been suggested. Other modelscombine the two described above (Buck et al., 1988),or involve detachment (Lister et al., 1986) where theshear zone presents decollements between the brittleupper crust and the ductile lower crust, and betweenthe latter and the lithospheric mantle.
Rifts do not always evolve into oceanic rifts; inother words, they may abort or even becomerecompressed, giving rise to tectonic inversionstructures (as in the North Sea). Alternatively theymay lead to the complete fracture of the continentallithosphere, allowing the formation of new oceaniccrust; for this reason divergent margins are also knownas constructive margins. In this case, passivecontinental margins are formed; these may develop inthe presence of extensive magmatism or grow in analmost complete absence of volcanism; we thereforespeak of volcanic and non-volcanic continentalmargins. For example, the Atlantic margins of Braziland Greenland are classic volcanic margins, sinceduring the Cretaceous and Cenozoic rifting they wereaccompanied by large-scale emissions of magma.Variations in syn-rift magmatism may be due tochemical and thermal heterogeneities in the mantle, orto the variable presence of water, an abundance ofwhich causes a decrease in the melting temperature ofmantle rocks, and thus an increase in lava production.
At the point where two plates are separating, theunderlying mantle rises to compensate isostatically forthe mass deficit (Fig. 7). This upwelling, consideredadiabatic, decompresses the mantle and allows it tomelt. The magmas of rift zones have characteristicsranging from alkaline to tholeiitic.
The transition from continental to oceanic rifting isalso known as breakup. Sedimentation within thepassive continental margin is marked by the so-calledbreakup unconformity, an unconformity which buriesthe main extensional growth structures, and whichsignals and dates not only the birth of the new ocean,but also the passive continental margin’s transitionfrom tectonic subsidence to thermal subsidence, and
123VOLUME I / EXPLORATION, PRODUCTION AND TRANSPORT
RELATIONS BETWEEN SEDIMENTARY BASINS AND PETROLEUM PROVINCES
listric fault
basin
asthenospheremagma
magmamantle
ductile crust brittle crust
brittle upper crust
brittle upper crust
ductile crust
ductile crust
mohomoho
mohomoho
mohomoho
stretching
hot mantle
mantle
Fig. 6. Comparative models of rifting: A, pure shear (McKenzie, 1978); B, simple shear (Wernicke, 1985); C, detachment (Lister et al., 1986).
A
B
C
thus from a state of rifting to one of drifting. Thetectonic and thermal subsidence of the margin takesplace at a low rate (0.1 mm�y).
The transition from continental to oceanic riftingcauses an enormous acceleration (100-1,000 times)in extensional velocity, which passes from ratesof continental extension of 0.1 mm�y to ratesof oceanic extension of 10-100 mm�y.
The development of new oceanic crust takes theform of a sort of ‘new skin’ generated by the mantle asit nears the surface. Mid-ocean ridges can be dividedinto three types, depending on their velocity: slow(Mid-Atlantic Ridge, 20 mm�y); intermediate (IndianRidge, 30-50 mm�y); and fast (East Pacific Rise, �100 mm�y). Slow mid-ocean ridges generate a riftvalley and have a more elevated and jagged topography,whereas fast mid-ocean ridges have no rift valley, are
less elevated and have a gentler morphology. The Mid-Atlantic Rift Valley is also more irregular inmorphology and is characterized by the presence ofnumerous extensional faults.
Various ocean basins have opened alongthickenings in the lithosphere generated by previousorogens. For example, the central and north Atlanticappeared where the Palaeozoic Appalachian mountainbelt had previously developed. The oceans then closed,completing the Wilson cycle, which postulates thatrifts are created at the location of earlier subductionzones and that orogenic belts close earlier rift zones.This indicates that rift zones are caused byheterogeneities in the lithosphere and their interactionswith the underlying asthenosphere, apparentlyindependent of lower mantle processes.
We can distinguish between various types of riftingon Earth, alongside the linear rifts which produce themajor ocean basins. These include the back-arc basinswhich form over W-directed subductions, characterizedby high rates of subsidence (0.6 mm�y); these areassociated with the eastwards retreat of the subductingslab. Examples are the Caribbean, the westernMediterranean, the Pannonian Basin and the Japan Sea.
Extensional tectonic episodes may also occur inaccretionary prisms when the critical angle of reposeis exceeded. However, these extensional faults have asuperficial decollement (in the upper few km),whereas extensional faults in classic rifts havedecollements in the brittle regime of the upper crust,and the ductile regime of the lower crust, reaching thebase of the lithosphere at the boundary with theasthenosphere.
In continental margins and back-arc basins majorfaults seem to be evenly spaced, with two peaks inaverage spacing at 25-30 km and 4-6 km. Rifts may beconcentrated in a few km (for example the EastAfrican Rift Valley which crosses the entire length ofEast Africa, but has an average width of a few tens ofkm), or may be several hundred km wide (such as theBasin and Range in the western United States).
Studies of ophiolites, remnants of oceanic crustembedded in orogens, and the polarization of seismicS-waves in the mantle indicate that olivine crystalstend to lengthen parallel to the direction of extension.This confirms the hypothesis that there is a significantdecollement between lithosphere and asthenospherewhich causes the iso-orientation of the crystals, as isalso shown by the deformed xenoliths ofasthenospheric mantle found in lava.
Asymmetry ascribable to geographical polaritycan also be seen in rift zones, where the eastern flankis on average 100-300 m higher than the oppositeflank, both in subsea and subaerial environments. Theexplanation advanced for this asymmetry is that the
124 ENCYCLOPAEDIA OF HYDROCARBONS
GEOSCIENCES
plates relative motion
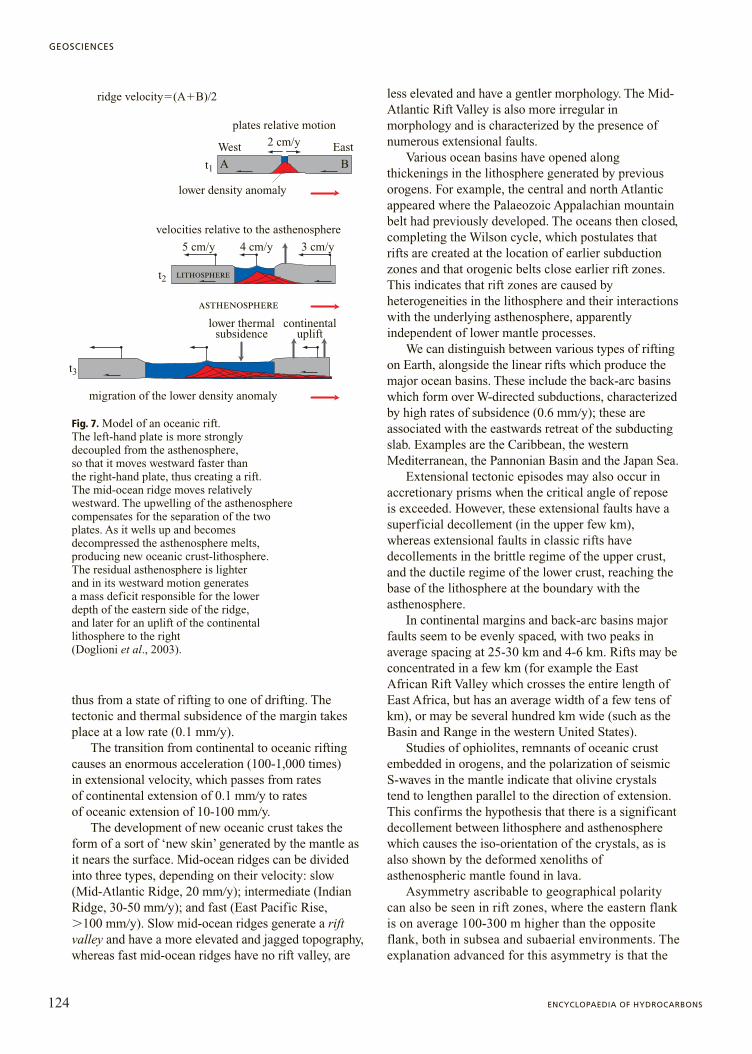
ridge velocity�(A�B)/2
velocities relative to the asthenosphere
lithosphere
asthenosphere
lower thermalsubsidence
migration of the lower density anomaly
continentaluplift
lower density anomaly
West East
A
5 cm/y 4 cm/y 3 cm/y
B
2 cm/y
t2
t3
t1
Fig. 7. Model of an oceanic rift. The left-hand plate is more strongly decoupled from the asthenosphere, so that it moves westward faster than the right-hand plate, thus creating a rift. The mid-ocean ridge moves relatively westward. The upwelling of the asthenospherecompensates for the separation of the twoplates. As it wells up and becomes decompressed the asthenosphere melts, producing new oceanic crust-lithosphere. The residual asthenosphere is lighter and in its westward motion generates a mass deficit responsible for the lower depth of the eastern side of the ridge, and later for an uplift of the continental lithosphere to the right (Doglioni et al., 2003).
mantle which melts beneath a mid-ocean ridge losesiron and other elements which melt more quickly.The residual mantle thus becomes lighter by about20-60 kg�m3, passing for example from 3,400 kg�m3
to 3,360 kg�m3, and moving eastwards underneath thelithosphere. The presence of lower density mantleunderneath the eastern sides of rifts indicates a massdeficit offset by a corresponding uplift which, in theflank of a mid-ocean ridge, slightly decreasesthermal subsidence. Asthenospheric mantle lightenedby partial melting beneath a mid-ocean ridge causesisostatic uplift when it passes underneath a continentand replaces denser asthenosphere. This mechanismmay explain the uplift of Africa, France or India as aresult of the passage beneath the continentallithosphere of lighter asthenosphere, depletedbeneath the Mid-Atlantic Ridge or the Indian Ridge(see again Fig. 7).
Transform zonesPlate margins moving roughly parallel to the
relative movement between two plates are describedas transform boundaries, where the prevalenttectonics is transcurrent. These margins probablyhave a decollement at the base of the lithosphere.Transform faults, also known as transcurrent orconservative margins, may develop in bothcontinental and oceanic lithosphere. A typicalcontinental example is the sinistral transcurrent faultof the Dead Sea which separates the Arabian Platefrom the African Plate. Oceanic examples includethe Romanche and Vema fracture zones in thecentral Atlantic, with dextral transcurrence,separating the African Plate to the north from theSouth American Plate to the south. Oceanictransform faults are among the Earth’s longesttectonic structures; they may be several thousands ofkm long. As a consequence of the convergence oflithosphere of different ages, and thus with differentthermal states and bathymetry, bathymetricdifferences of 2-4 km between the two sides of thefault may develop along its length. Completesections of oceanic crust may be exposed along thesesubmarine escarpments, with their correspondingbasal Moho and transition to the underlying mantle(Bonatti et al., 2003).
In some cases, oceanic transform faults resultfrom the irregular propagation of continental rifting,which follows the weakest zones of the lithosphere.This is the case, for example, in the Romanchetransform fault which reflects a large undulation inthe Mid-Atlantic Ridge, exemplified by the largepromontory of north-west Africa. Other smallertransform faults form near mid-ocean ridges, withoutcorresponding undulations on continental margins;
their origin seems to be linked mainly to the intrinsicdynamics of oceanic rifts.
Undulations along transcurrent faults create localtranstensional depressions such as pull-apart basins,or uplifts in transpression zones, such as push-upstructures. It has been noted that rates of magmaproduction in rift zones are proportional to the velocityof expansion. As the angle of a mid-ocean ridge withrespect to the movement of the plates graduallydecreases until it becomes inserted into a transformzone, magmatism gradually disappears because therate of expansion in a pure transform margin is zero.
In terms of energy, transform faults are passivestructures, which apparently do not contribute activelyto plate tectonics, unlike the phenomena of ridge pushfor mid-ocean ridges and slab pull in subduction zones.
The San Andreas Fault in California is frequentlycited as an archetypical example of transform andtranscurrent faults. However, this fault has unique andunusual geodynamic characteristics when comparedto typical transform faults, and cannot be considered aclassic example of a transcurrent zone. This fault,with its associated fault system, forms the belt wherethe North American Plate interacts with the PacificPlate, along the zone where the Pacific Ridgetransfers from the Juan de Fuca Ridge to thenorthwest (Mendocino transform fault) to the EastPacific Rise to the south-east.
As is well-know, this plate margin is a dextraltranspression zone, where transcurrent dextralmovements occur alongside thrusts parallel totranscurrence, as indicated by geological data and thefocal mechanisms of earthquakes.
The Pacific Plate is moving in a direction of 300°,forming an angle of about 25° with the San AndreasFault, which has a direction of 325°. Since the PacificPlate is moving WNW faster than the North AmericanPlate, the angle between the fault and the direction ofthe Pacific should generate a dextral transtensionrather than a transpression. However, the zone wherethe Pacific Ridge transfers from the Juan de FucaRidge to the East Pacific Rise in the Gulf of Californiais moving WNW more slowly than the NorthAmerican Plate, which is thus able to overthrustobliquely towards the west onto the Pacific Plate, witha sinistral transpressional component.
The dextral transpressional tectonics of the SanAndreas system can therefore be subdivided into twocomponents: sinistral transpression along the obliquewestern margin of the North American Plate,responsible for most compressional earthquakes, andoverthrusting of the North American plate onto thedextral transtensional transfer zone of the PacificRidge. Since the dextral transtension is faster thanthe sinistral transpression, the dominant movement is
125VOLUME I / EXPLORATION, PRODUCTION AND TRANSPORT
RELATIONS BETWEEN SEDIMENTARY BASINS AND PETROLEUM PROVINCES
dextral. This unusual situation is due to the obliquedirections of the margins of the Pacific and NorthAmerican plates relative to their absolute motion, andthe different velocities of the three elements in play:Pacific Plate, the transfer zone of the Pacific Ridge,and North American plate.
Californian geodynamics is thus characterizedby an unusual subduction in which, in contrast tonormal subduction zones, in E-W section thedowngoing plate of the subduction diverges fromthe overriding plate, whilst overriding anddowngoing plates converge, albeit more slowly, in aNE-SW direction. The E-W divergence is absorbedby the extension in the Basin and Range, whereasthe NE-SW compressional component is expressedmainly in the overthrusts and transpression of theCoast Ranges and the Californian offshore. Thissuggests that the compression perpendicular to theSan Andreas Fault is not the natural consequence ofa transcurrent movement, but rather an independenttectonic factor, showing that different tectonicstyles, but above all independent geodynamiccauses, may coexist in a single area; in this case,the sinistral transpression and the faster dextraltranstension.
Subduction zones and orogensConvergent, or destructive, margins are created
when a plate sinks, or is subducted, into the mantle.The subducting lithosphere is known as a slab.Orogens or accretionary prisms are formed inassociation with subduction zones (Bally, 1983);these are characterized by a series of parameters
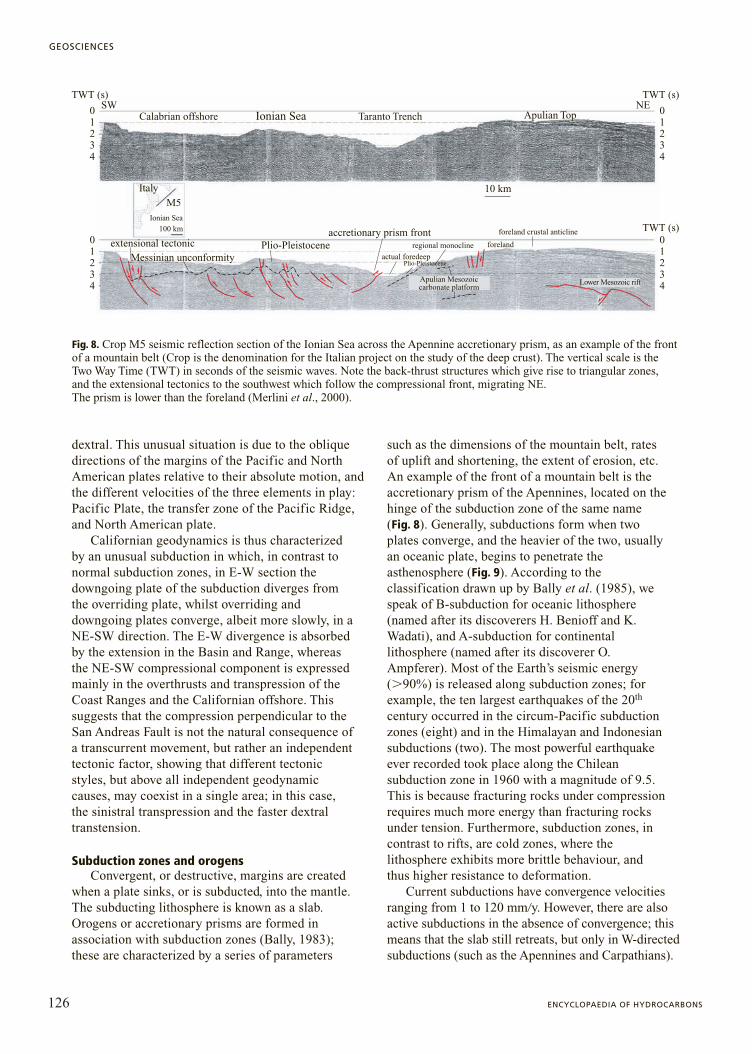
such as the dimensions of the mountain belt, ratesof uplift and shortening, the extent of erosion, etc.An example of the front of a mountain belt is theaccretionary prism of the Apennines, located on thehinge of the subduction zone of the same name(Fig. 8). Generally, subductions form when twoplates converge, and the heavier of the two, usuallyan oceanic plate, begins to penetrate theasthenosphere (Fig. 9). According to theclassification drawn up by Bally et al. (1985), wespeak of B-subduction for oceanic lithosphere(named after its discoverers H. Benioff and K.Wadati), and A-subduction for continentallithosphere (named after its discoverer O.Ampferer). Most of the Earth’s seismic energy(�90%) is released along subduction zones; forexample, the ten largest earthquakes of the 20th
century occurred in the circum-Pacific subductionzones (eight) and in the Himalayan and Indonesiansubductions (two). The most powerful earthquakeever recorded took place along the Chileansubduction zone in 1960 with a magnitude of 9.5.This is because fracturing rocks under compressionrequires much more energy than fracturing rocksunder tension. Furthermore, subduction zones, incontrast to rifts, are cold zones, where thelithosphere exhibits more brittle behaviour, andthus higher resistance to deformation.
Current subductions have convergence velocitiesranging from 1 to 120 mm�y. However, there are alsoactive subductions in the absence of convergence; thismeans that the slab still retreats, but only in W-directedsubductions (such as the Apennines and Carpathians).
126 ENCYCLOPAEDIA OF HYDROCARBONS
GEOSCIENCES
01234
01234
01234
01234
TWT (s) TWT (s)
TWT (s)
SW NECalabrian offshore Taranto Trench Apulian TopIonian Sea
10 km
100 km
Italy
M5
extensional tectonicMessinian unconformity
Plio-Pleistoceneaccretionary prism front
actual foredeepPlio-Pleistocene.
regional monocline foreland
foreland crustal anticline
Apulian Mesozoiccarbonate platform
Lower Mesozoic rift
Ionian Sea
Fig. 8. Crop M5 seismic reflection section of the Ionian Sea across the Apennine accretionary prism, as an example of the frontof a mountain belt (Crop is the denomination for the Italian project on the study of the deep crust). The vertical scale is theTwo Way Time (TWT) in seconds of the seismic waves. Note the back-thrust structures which give rise to triangular zones, and the extensional tectonics to the southwest which follow the compressional front, migrating NE. The prism is lower than the foreland (Merlini et al., 2000).

The deep zones where the subduction isinterrupted or absent are known as slab windows.These may form as a result of the lengthening of theslab as the subduction becomes arched, or of thedifferent subduction velocities of two underlyingplates. An alternative interpretation explains slabdetachment on the grounds of weight.
Subductions have a retreating hinge, whose velocitymay be greater or lower than the convergence velocitybetween the two plates above and below thesubduction. If the overlying slab has a lower velocity ofconvergence than the retreat of the slab, a back-arc
basin is formed (for example, the Japan Sea is theback-arc basin of the subduction of the same name, theTyrrhenian Sea and the entire western Mediterraneanare the back-arc basin of the Apennine-Maghrebidmountain belt, and the Pannonian Basin is the back-arcbasin of the Carpathians). This, too, is a situation whichappears to occur only in W-directed subductions. Bycontrast, if the rate of convergence is greater than theretreat of the slab, as is frequently the case, anextremely high two-sided orogen is formed (such as theAlps). In the first case an accretionary prism forms,bringing with it a wave of extensional tectonics which
127VOLUME I / EXPLORATION, PRODUCTION AND TRANSPORT
RELATIONS BETWEEN SEDIMENTARY BASINS AND PETROLEUM PROVINCES
Fig. 10. The mountain belts which form above W-directed subductions consist mainly of sedimentary cover; the exposed area of the mountain belt is always less than the area of the foreland basin; the regional monocline has an angleof 4-10°; the asthenosphere and a newly formed Moho lie at a shallow depth beneath the western part of the mountainbelt: the Apennines are an example. Mountain belts linked to E-directed subductions always heavily involve the crystallinebasement; the exposed area of the mountain belt is always greater than the area of the two foreland basins; the regional monoclines are less steeply angled (2-5°); the crust is thickened by the superimposition of two Mohos precedingthe subduction: the Alps are an example.
back-arc basin-low elevationsingle vergence East-1 deep foredeep
high elevation-double vergence2 shallow foredeeps
back-arc basinE-NEW
lithosphere
670 km
relative asthenospheric flow
lithosphericnegative balance
lithosphericpositive balance
W
back-arc basin
asthenosphericwedge
frontal thrustbelt frontal thrustbelt
crust
Moho
LITHOSPHERIC MANTLE
back-thrustbelt
SEDIMENTARY COVER BASEMENT E-NE
0 30 km
Fig. 9. Differences between W-directed and E- or NE-directed subduction zones, and comparisons of the associated orogens.W-directed subductions are steeper and deeper. Their basal decollement is warped and subducted. In E-directed subductions,where the rate of convergence is higher than the velocity of slab retreat, the decollement in the overriding plate rises towardsthe surface, and is thus able to lift up the entire crust in the accretionary prism. This asymmetry may be interpreted by assuming a westward drift of the lithosphere relative to the mantle (Doglioni et al., 1999).
causes the rifting of the back-arc (Fig. 10). The pairingcompression-extension in W-directed subductions isreplaced by compression-compression in mountainbelts created by E- or NE-directed subductions,creating typical two-sided orogens. Extensionaltectonics may shape the upper part of these mountainbelts when the critical angle of repose is exceeded.
If the overlying plate is continental, and two platesare converging, the transition from oceanic tocontinental subduction is known as the collision phase.Magmas in subduction zones vary in character fromcalc-alkaline to shoshonitic. Magmatism is foundin vertical projection from the isobath of about100-130 km of the subducting slab, and is thought tobe generated by the fluids released by the subductionzone, leading to the partial melting of the overlyingmantle. The number of volcanoes and the volume ofmagma erupted are proportional to the velocity ofsubduction. This suggests that the heat of friction maycontribute to the production of magma. Magmatism isconditioned by the composition of the subductinglithosphere, the thermal state of the slab, its angle ofdip and thickness.
W-directed subductions are on average more recentthan 50 My, whilst E-directed subductions may be olderthan 100 My. In W-directed subductions the overlyinglithosphere is thin (20-40 km), whereas the underlyingplate is always thicker (see again Fig. 10). The Moho inthe overriding plate is generally newly formed, migrateseastwards and develops during the growth of the back-arc basin. The crust of the overlying plate is thinned andhas a depth of 10-25 km. By contrast, the Moho in theunderlying plate is pre-existing and of variable age. Inmountain belts linked to E- or NE-directed subductions,on the other hand, the pre-existing Mohos in the twoplates are superimposed beneath the orogen (see againFig. 10) and the thickness of the crust reaches itsmaximum values (55-70 km).
W-directed subductions nucleate along the back-thrust belts of E- or NE-directed subductionswhen thin oceanic or continental lithosphere is presentin the foreland of the back-thrust belt. For example, theLesser Antilles islands arc began to form along theback-thrust belt of the Central American Cordillera,and migrated eastwards only where the NorthAmerican and South American continents narrowed;Atlantic oceanic lithosphere was present at the front ofthe Central American orogen’s back-thrust belt.
A similar interpretation can be proposed for theApennines, which originated along the back-thrust beltof the Alps; the Alpine foreland contained a relictbranch of the Mesozoic Tethys Ocean. These ‘Palaeo-Alps’ are now buried and flattened beneath thewestern Apennines and the Tyrrhenian Sea, whichis the back-arc basin of the Apennine subduction.
A similar relationship may apply to the Carpathiansubduction, which originated along the back-thrust beltof the Dinarides. In back-arc basins, rapid and irregularthinning takes place with areas where new oceaniccrust develops or areas where thicker remnants ofcontinental lithosphere remain. This results in thephenomenon known as boudinage, or a situation whereduring extension more competent blocks are heldwithin a less viscous matrix, which flows in the thinnedareas (necks). The arcs of W-directed subductions are1,500-2,000 km long.
W-directed subductions are on average deeper, up to670 km, and more steeply inclined (45°-90°) than E- or NE-directed subductions (see again Fig. 9); in thelatter most seismicity generally disappears at 300 km,and the angle of dip is lower (15°-60°). The westwarddrift of the lithosphere relative to the underlying mantlemay explain this difference in dip angle, which in thepast was attributed exclusively to the different age of thesubducting oceanic lithosphere; in other words, as aneffect of the weight of cold oceanic lithosphere.However, there are instances where the same lithospheresubducts in two opposing directions yet maintains thisasymmetry; there are also W-directed subductionscharacterized by a steep dip angle and the featuresdescribed above which involve both young oceaniclithosphere (for example, the Sandwich Islands arc in thesouth-west Atlantic) or even continental lithosphere (thecentral and northern Apennines, the Carpathians, and theBanda Arc). In W-directed subductions, the basaldecollement of the overriding plate is folded andsubducted, and the accretionary prism involves only theupper surface of the underlying plate. In E-directedsubductions, the basal decollement of the overridingplate actively carries upwards elements of both theunderlying and overriding plate, thus thickening thecrust and the corresponding orogen (see again Fig. 9).The differing behaviour of decollements in these twotypes of subduction would explain why accretionaryprisms in W-directed subductions are composed mainlyof sedimentary cover whereas in the orogens of E-directed subductions the whole crust is warped,causing a higher structural elevation of the mountainbelt, and substantial outcrops of crystalline basement(see again Fig. 10). The different behaviour ofdecollements in these two types of subduction also leadsto variations in the pressure and temperature to whichaccretionary prism rocks are subjected, generatingunusual metamorphisms. For example, high pressureand low temperature metamorphism is more frequent inmountain belts associated with E- or NE-directed subductions, whereas high temperature andlow pressure metamorphism is more frequently foundabove W-directed subductions, where the asthenospherereplaces the slab at a shallow depth in the back-arc basin.
128 ENCYCLOPAEDIA OF HYDROCARBONS
GEOSCIENCES
The strongest evidence that the lithosphere isdrifting westward, and therefore that the underlyingmantle is rotating in the opposite direction, comesfrom the persistent asymmetries between W-directedsubduction zones and those directed E or NE.Orogens associated with W-directed subductionzones have a lower topographical and structuralprofile than mountain belts associated with E-directed subductions. This is clear if we comparesubductions in the western Pacific with those in theeastern Pacific, for example the Marianas and theAndes (see again Fig. 4).
In the first case, a back-arc basin is formed, and thesubduction trench is extremely deep, on average over4,000 m; the accretionary prism involves the upperlayers of the subducting crust, in general thesedimentary cover. On average, prisms in this type ofsubduction are below sea-level, as in the islands of Fiji,the Marianas and Barbados. The highest mountain beltsin this type of subductions are the Apennines, theCarpathians and the mountains of Japan, where theaccretionary prisms have deeper basal decollements,and the volumes involved above the subduction aregreater. Gravimetric anomalies in W-directedsubductions are much more pronounced than those inE-directed subductions, with a negative maximum inthe foreland basin and a positive maximum in the back-arc basin, where the asthenosphere reaches layers veryclose to the surface. A similar pattern characterizesvariations in heat flow, lowest in the foreland basin andhighest in the back-arc basin.
In E- or NE-directed subductions such as theAndes or the Himalayas, there is no back-arc basin;
the mountain belt is double-sided and therefore hastwo foreland basins, in front of the frontal belt andone in front of the back-thrust belt (see again Fig. 10).On average, these mountain belts are above sea level;the foreland basins have an average depth of about3,000 m in oceanic subductions, and are often abovesea-level in continental subductions, on both sides ofthe orogen. The mountain belt has decollementswhich enter the mantle, the entire crust is involved inaccretion, and the surface rocks thus cover the wholespectrum of metamorphic and intrusive basementrocks.
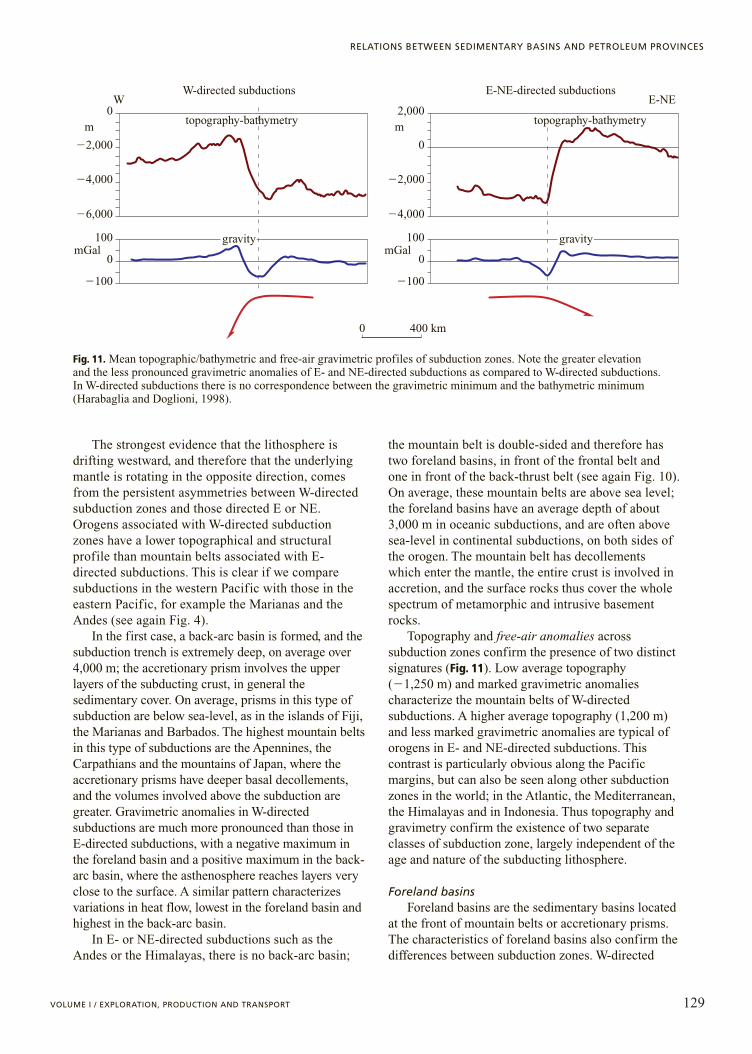
Topography and free-air anomalies acrosssubduction zones confirm the presence of two distinctsignatures (Fig. 11). Low average topography(�1,250 m) and marked gravimetric anomaliescharacterize the mountain belts of W-directedsubductions. A higher average topography (1,200 m)and less marked gravimetric anomalies are typical oforogens in E- and NE-directed subductions. Thiscontrast is particularly obvious along the Pacificmargins, but can also be seen along other subductionzones in the world; in the Atlantic, the Mediterranean,the Himalayas and in Indonesia. Thus topography andgravimetry confirm the existence of two separateclasses of subduction zone, largely independent of theage and nature of the subducting lithosphere.
Foreland basinsForeland basins are the sedimentary basins located
at the front of mountain belts or accretionary prisms.The characteristics of foreland basins also confirm thedifferences between subduction zones. W-directed
129VOLUME I / EXPLORATION, PRODUCTION AND TRANSPORT
RELATIONS BETWEEN SEDIMENTARY BASINS AND PETROLEUM PROVINCES
WW-directed subductions E-NE-directed subductions
topography-bathymetrytopography-bathymetry
gravity gravity
0
�2,000
�4,000
�6,000
100
0
�100
E-NE2,000
0
�2,000
�4,000
100
0
�100
0 400 km
m m
mGalmGal
Fig. 11. Mean topographic/bathymetric and free-air gravimetric profiles of subduction zones. Note the greater elevation and the less pronounced gravimetric anomalies of E- and NE-directed subductions as compared to W-directed subductions. In W-directed subductions there is no correspondence between the gravimetric minimum and the bathymetric minimum(Harabaglia and Doglioni, 1998).
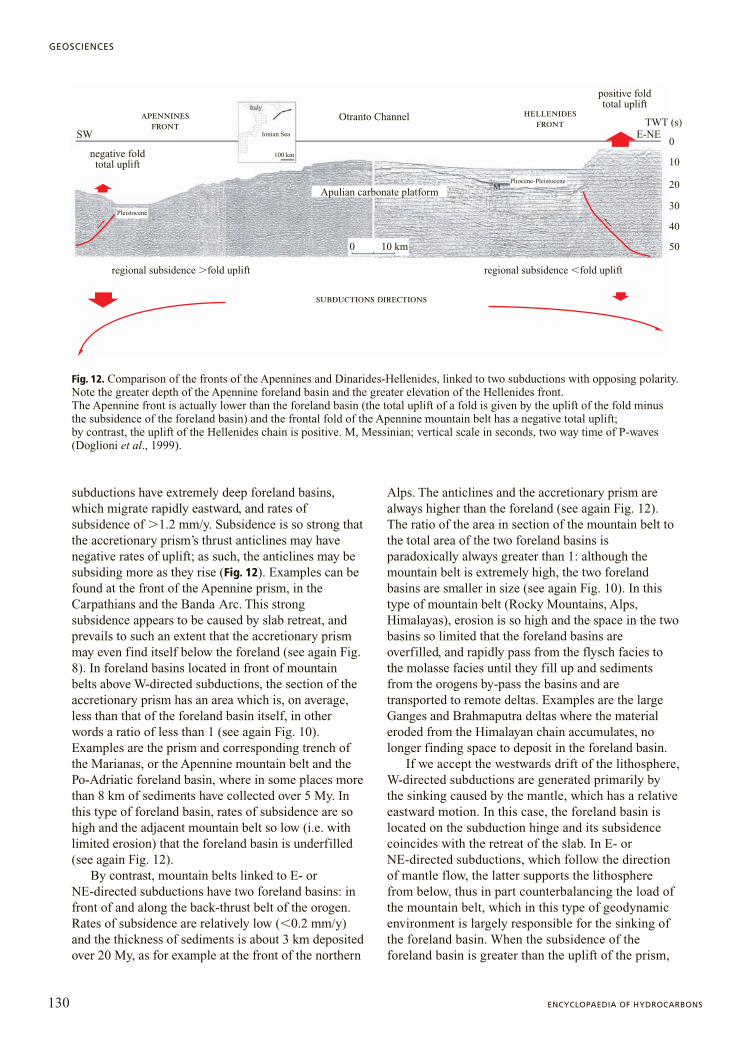
subductions have extremely deep foreland basins,which migrate rapidly eastward, and rates ofsubsidence of �1.2 mm/y. Subsidence is so strong thatthe accretionary prism’s thrust anticlines may havenegative rates of uplift; as such, the anticlines may besubsiding more as they rise (Fig. 12). Examples can befound at the front of the Apennine prism, in theCarpathians and the Banda Arc. This strongsubsidence appears to be caused by slab retreat, andprevails to such an extent that the accretionary prismmay even find itself below the foreland (see again Fig.8). In foreland basins located in front of mountainbelts above W-directed subductions, the section of theaccretionary prism has an area which is, on average,less than that of the foreland basin itself, in otherwords a ratio of less than 1 (see again Fig. 10).Examples are the prism and corresponding trench ofthe Marianas, or the Apennine mountain belt and thePo-Adriatic foreland basin, where in some places morethan 8 km of sediments have collected over 5 My. Inthis type of foreland basin, rates of subsidence are sohigh and the adjacent mountain belt so low (i.e. withlimited erosion) that the foreland basin is underfilled(see again Fig. 12).
By contrast, mountain belts linked to E- or NE-directed subductions have two foreland basins: infront of and along the back-thrust belt of the orogen.Rates of subsidence are relatively low (�0.2 mm/y)and the thickness of sediments is about 3 km depositedover 20 My, as for example at the front of the northern
Alps. The anticlines and the accretionary prism arealways higher than the foreland (see again Fig. 12).The ratio of the area in section of the mountain belt tothe total area of the two foreland basins isparadoxically always greater than 1: although themountain belt is extremely high, the two forelandbasins are smaller in size (see again Fig. 10). In thistype of mountain belt (Rocky Mountains, Alps,Himalayas), erosion is so high and the space in the twobasins so limited that the foreland basins areoverfilled, and rapidly pass from the flysch facies tothe molasse facies until they fill up and sedimentsfrom the orogens by-pass the basins and aretransported to remote deltas. Examples are the largeGanges and Brahmaputra deltas where the materialeroded from the Himalayan chain accumulates, nolonger finding space to deposit in the foreland basin.
If we accept the westwards drift of the lithosphere,W-directed subductions are generated primarily bythe sinking caused by the mantle, which has a relativeeastward motion. In this case, the foreland basin islocated on the subduction hinge and its subsidencecoincides with the retreat of the slab. In E- or NE-directed subductions, which follow the directionof mantle flow, the latter supports the lithospherefrom below, thus in part counterbalancing the load ofthe mountain belt, which in this type of geodynamicenvironment is largely responsible for the sinking ofthe foreland basin. When the subsidence of theforeland basin is greater than the uplift of the prism,
130 ENCYCLOPAEDIA OF HYDROCARBONS
GEOSCIENCES
10 km0
0
10
20
30
40
50
100 km
Pliocene-Pleistocene
Pleistocene
M
SW E-NETWT (s)
apenninesfront
subductions directions
hellenidesfront
negative foldtotal uplift
positive foldtotal uplift
Otranto Channel
Apulian carbonate platform
regional subsidence �fold uplift regional subsidence �fold uplift
Italy
Ionian Sea
Fig. 12. Comparison of the fronts of the Apennines and Dinarides-Hellenides, linked to two subductions with opposing polarity.Note the greater depth of the Apennine foreland basin and the greater elevation of the Hellenides front. The Apennine front is actually lower than the foreland basin (the total uplift of a fold is given by the uplift of the fold minusthe subsidence of the foreland basin) and the frontal fold of the Apennine mountain belt has a negative total uplift; by contrast, the uplift of the Hellenides chain is positive. M, Messinian; vertical scale in seconds, two way time of P-waves(Doglioni et al., 1999).

the total uplift of the anticlines is negative; otherwiseit is always positive (see again Fig. 12).
These asymmetries are in line with the supposedimpact of the westward drift of the lithosphere relativeto the mantle; the movement of the latter towards theeast inclines the subductions westward, making themretreat, and generating the arcuate shapes typical ofthe Lesser Antilles, Sandwich, the Apennines,Carpathians, Marianas, Japan, Banda, etc. In thesesubductions the lithosphere is mainly dispersed withinthe mantle (see again Fig. 9). In E- or NE-directedsubductions, which dip in the direction of movementof the underlying mantle, the lithosphere is held up bythe flow and thickens.
There are orogens which do not follow the flowshown in Fig. 4, such as for example the northern partof South American and the Pyrenees. These orogensare linked to subductions generated by the sub-rotationof the South American and Iberian plates, and havecharacteristics resembling those of orogens associatedwith E-directed subductions; in other words, two-sidedness, absence of back-arc extension, highstructural and morphological elevation, and forelandbasins with low rates of subsidence.
Sedimentary basinsThe sedimentary basins in which organic substances
that may generate hydrocarbons accumulate are a directconsequence of plate tectonics. These form both withinplates and at their margins as a result of three mainprocesses of subsidence: thinning of the lithosphere, inother words extensional or transtensional tectonics;thermal cooling of oceanic and continental lithosphereat passive margins; folding of the lithosphere at
subduction zone hinges due to slab retreat, or to sinkinggenerated by the load of a mountain belt or a delta on acontinental margin (Fig. 13).
Sedimentary basins form where the crust subsidesor where there is a pre-existing empty basin which canbe filled with sediments. The weight of the sedimentsusually generates a further load which causes thelithosphere to sink. The compacting of sedimentscaused by lithostatic stress (equal to rgz, where r is thedensity of the column of rock, g the gravitationalacceleration, and z the thickness of the column of rock)leads to a decrease in the porosity of the rock, and anexpulsion of fluid from its pores and thus furthersubsidence. Lithostatic stress also leads to a decrease involume caused by pressure-solution, and thus furthersubsidence.
Subsidence in an extensional zone is a function ofthe rate of extension and the inclination of theextensional faults. Given identical rates of extension,more steeply angled faults allow for more rapidsubsidence.
Intraplate extensional basins cause the crust and thelithosphere to weaken; as a result, if there is amodification in the stress field these are the first areasto undergo tectonic inversion. A classic example is theAtlas mountain chain, generated by a sinistraltranstension and en échelon (stepped) extension duringthe Mesozoic, and later inverted to form a dextraltranspression.
The thermal subsidence of the oceanic crustdiscussed above also takes place at passive continentalmargins if the adjacent oceanic crust is no older than60 My. Foreland basins are typical basins linked to thefolding or sinking of the lithosphere, and form as aresult either of the load of a mountain belt and itssediments, or the retreat of the subduction. The slopeof the basement beneath the foreland basin, towardsthe interior of the mountain belt, is known as theforeland regional monocline; it is less steeply angled(2-5°) in mountain belts where load is responsible forsubsidence, and more steeply angled (4-10°) inforeland basins where subduction hinges of west-directed subductions are retreating ‘eastwards’ (seeagain Fig. 10).
In line with subsidence values for other majortectonic environments, foreland basins linked to W-directed subductions are those with the highest values.
There are areas of the Earth where severalgeodynamic factors governing the evolution of a basinmay simultaneously coexist. For example, in the SicilianChannel an active extension with extensional faultsoriented NW-SE is separating Sicily from Africa;simultaneously the overthrusts of the Apennine-Maghrebid chain, oriented roughly E-W, are advancingtowards the southeast, cutting across the normal faults;
131VOLUME I / EXPLORATION, PRODUCTION AND TRANSPORT
RELATIONS BETWEEN SEDIMENTARY BASINS AND PETROLEUM PROVINCES
33 km
0 200 km
continentalcrust oceanic crust
sediments
Fig. 13. Model of subsidence at a passivecontinental margin due to the weight of sediments which replace lighter water,exerting a load which generates a spacewhere coastal plain and escarpment depositscan accumulate, thus causing a further subsidence of crust and lithosphere (Bott, 1979).
these in turn cut across the overthrusts. The plain ofnorth-eastern Italy is the foreland of the Alpineretrobelt, of the front of the Dinaric belt and of theApennine chain; we thus have the combined effect ofthree different mountain belts generating subsidence inthe same area with different mechanisms, velocities andin different directions. The San Andreas Fault is anotherexample of a sinistral transpression superimposed on afaster dextral transtension oriented WNW-ESE.
Plate dynamicsDespite the enormous progress made in the Earth
sciences, we still have no complete theory regardingthe mechanisms which move plates, able to reconcilesurface kinematics with supposed movements insidethe planet. The forces acting on the lithosphere are ofdifferent types: the pull exerted by convectivemotions in the underlying mantle; ridge push, inother words the weight of mid-ocean ridges; slabpull, in other words the weight of subducting slabs;forces external to the planet such as those responsiblefor the tides (Bostrom, 2000). Plate movements areso slow that the corresponding forces of inertia arenegligible.
Mantle convectionThe upwelling of the mantle in rift zones and the
sinking of lithosphere in subduction zones are inthemselves evidence of the convection taking place inthe mantle. On the geologic time-scale, the Earth’smantle, though apparently solid, can be consideredan extremely viscous fluid (with a viscosity above1022 Pa�s). A fluid heated from below and cooled fromabove may transfer heat through its thickness in twoways: conduction or convection. The mantle has aninternal temperature gradient of less than 1°C�km. TheRayleigh number (Ra) measures the ability of a fluidto transmit heat by convection. The lithospheretransmits heat both by conduction and by convectivemotions in the fluids which cross it.
The Rayleigh number for a layer of thickness hwith constant temperatures T0 and T1 above and below,is given by:
Ra�r2gcpa(T1�T0 )h3�mk
where r is the density, g the gravitationalacceleration, cp the specific heat, a the thermalexpansion coefficient, m the viscosity and k thethermal diffusivity (given by the ratio k�rcv, wherek is the thermal conductivity). Quantities in thenumerator favour convection, whereas quantities inthe denominator indicate diffusivity and thus thermalconductivity, as well as the viscosity which slowsconvection. Thus in the presence of a high Rayleighnumber convection is prevalent, whereas a low value
indicates a predominance of conduction. Theso-called critical Rayleigh number marks thetransition between these two regimes. It is thoughtthat about 90% of the mantle’s heat derives fromradioactive decay occurring within it, whilst only 10%derives from the underlying core. The value of theRayleigh number required to render a sphericalmantle convective is equal to about 3�103 but in fact,if we assume the values estimated by PREM(Preliminary Reference Earth Model; Anderson,1989), the value of Ra calculated for the mantle isequal to about 9�106. This means that convectivemotions must be occurring in the mantle; however, wedo not know either their kinematics (pattern of thelines of flow and velocity), or how these internalmovements can be reconciled with plate kinematics,which is much simpler than that of the convectioncells which can be deduced from models.
The part of the mantle where convectivephenomena could be expected to occur is the uppermantle. Here the Rayleigh number is higher becauseviscosity is lower, thermal conduction is lowerbecause this zone contains less iron than the lowermantle, and the thermal gradient is higher than in thelower mantle. In the latter, the temperature increasesby less than a degree per km, whereas in the uppermantle it may increase by several degrees per km.
There are two large areas where we can assume anupwelling of the lower mantle, identified by seismictomography as volumes characterized by the lowerpropagation velocity of seismic waves: one in thecentral Pacific, and one in central-southern Africa(Romanowicz and Gung, 2002). Models linked toconvection often conflict with evidence gathered at thesurface: for example, the composition of the mantle isassumed to be homogeneous, although it is well-known that the whole Earth is intensely stratified.Were the mantle homogeneous, and its motions guidedonly by thermal gradients, we would expect portionsof lithospheric mantle to become detached and sinkinto the underlying mantle. However, this phenomenonis currently unknown; were it to occur, it wouldgenerate an uplift of the surrounding residuallithosphere.
In convection models, upwellings of mantle areassociated with lateral descending currents, but theAtlantic, East African and Indian rifts developedwithout any intermediate subduction. There are alsocases of neighbouring pairs of subductions withoutrifting in between. In convection models, rising andsinking currents are stationary, whereas in nature allplate margins, rifts, subductions and transform zonesmigrate. Convection cells in models have polygonalshapes, whereas real plate margins, such as the Mid-Atlantic Ridge, are linear.
132 ENCYCLOPAEDIA OF HYDROCARBONS
GEOSCIENCES
Given the obvious incompatibility betweenconvection and surface kinematics, convection in themantle cannot be considered the ‘conveyor belt’ whichmoves the plates (mantle drag). Furthermore, thelithosphere is decoupled from the mantle, as evidencedfor example by the Hawaii hotspot, whose sourcewithin the mantle is moving ESE relative to theoverlying lithosphere. The Mid-Atlantic and Indianridges have moved away from Africa during theirdevelopment, and are therefore moving relative to oneanother. This means that an active upwelling of stablemantle beneath the two mid-ocean ridges is notcompatible with plate kinematics, and that rifts arepassive structures, decoupled from and movingrelative to the mantle. If mid-ocean rifts are movinglaterally, this may explain why these are alwayssourced from still-productive mantle; were theystatically positioned on the mantle, their sources wouldgradually become depleted. Seismic tomography hasconfirmed the presence of low propagation velocitiesfor seismic waves only to a depth of up to 100-200 kmbeneath mid-ocean ridges. This probably indicatespartial melting, whilst the underlying mantle often hasrelatively higher seismic velocities, suggesting thepresence of cold mantle, and thus the absence of adeep source for mid-ocean ridges.
Ridge push. The rise of a mid-ocean ridge causes anincrease in potential gravitational energy, in otherwords ‘ridge push’. Since this push is not linked to theupwelling of magma along the ridge, only the increasedweight determined by the greater height of the ridge istaken into account. A simple expression of ridge push(Frp) per unit of length (of the ridge) is: Frp= grm �hdx�gpw�w dx where g is the gravitational acceleration,rm the density of the mantle, h the elevation of theridge above the seafloor, x the horizontal width of theflanks of the ridge, w the depth of the seafloor relativeto the ridge and rw the density of the water. The valueobtained for ridge push, also taking into account theeffect of the cooling of the lithosphere and the weightof water, is equal to about 3.9�1012Nm�1 (Turcotte andSchubert, 2002).
Slab pull. Slab pull (downwards pull of thesubduction) is the mechanical action which can beascribed to the lower temperature of the subductingslab relative to the warmer surrounding mantle. Asthey subduct, oceanic basalts may be transformed intoeclogites, high density rocks, due to the extremelyhigh pressure; the subducting slab thus has a negativedensity gradient relative to the surrounding uppermantle. The simplest expression of slab pull (Fsp) perunit of length, assuming that lithosphere and mantleare of identical composition, and that there is onlyone thermal boundary is: Fsp�gz(rl�rm )d, where g isthe gravitational acceleration, d the thickness of the
subducting lithosphere, z the depth of the subductingslab, rl the density of the lithosphere, and rm thedensity of the mantle. Assuming values of 10 ms�2
for g, 100 km for d, 660 km for the depth of the slab z,and 3,300kg/m3 and 3,220 kg�m3 for the density ofthe lithosphere and the mantle respectively, we obtaina slab pull of about 5.2�1013 Nm�1. However, thesubducting lithosphere is often thinner than this, andmore importantly the upper mantle has densities fargreater than 3,220 kg�m3, partly because it probablyhas chemical and mineralogical stratifications, with agradual increase in density from top to bottom.Turcotte and Schubert (2002) calculate a slab pull ofabout 3.3�1013 Nm�1. PREM, for example, suggests adensity of 3,970 kg�m3 for the mantle at a depth of600 km.
The olivine in the mantle, in addition to theolivine/spinel transformation at a depth of about400 km which increases its density, may transformfrom magnesium-rich olivine (forsterite) to iron-richolivine (fayalite), thus causing a further increase indensity and decrease in volume. The value of slab pullis, therefore, probably an overestimate. Anotherargument against slab pull is the fact that the focalmechanisms of earthquakes mainly indicate thatsubducting slabs are subjected to internal compressionparallel to the slab; were slab pull taking place, theslab would be undergoing traction. Nevertheless, slabpull is currently considered the greatest force affectingthe lithosphere, being of a greater order of magnitudethan ridge push.
There is geological and tomographic evidence thatcontinental lithosphere is also subducted. OttoAmpferer, an early 20th century Austrian geologist,suggested the existence of a continental subductionbeneath the Alps, based on the stacking of the Alpinenappes. The accretionary prisms where passivecontinental margin sediments can be seen piled up,indicate that the lithosphere on which they once restedhas disappeared due to subduction. We have no data onthe depth to which continental lithosphere, despite itslower density, can subduct with the help oftransformations which increase its weight. In thecentral-northern Apennines there is a continentalsubduction reaching a depth of at least 100-150 km.This indicates that it is not only the weight of coldoceanic lithosphere which moves plates by slab pull,since in this case continental lithosphere would beunable to subduct. An eastward flow of the mantle, onthe other hand, would contribute to the retreat andsubduction of the lithosphere.
Another force which may act on the lithosphere istrench suction. As it retreats, a subduction zone sucksthe overlying plate towards the hinge zone of the slab,moving it towards the subduction itself and/or causing
133VOLUME I / EXPLORATION, PRODUCTION AND TRANSPORT
RELATIONS BETWEEN SEDIMENTARY BASINS AND PETROLEUM PROVINCES
its margin to thin. This mechanism also becomessecondary if slab pull is not the driving force behindplate dynamics.
Effects of the Earth’s rotationPlate tectonics has hitherto been attributed
exclusively to endogenous phenomena: the cooling ofthe planet and thermal convection. However, it hasbeen shown that the movements of the mantle andplates disturb the Earth’s rotation, provokingoscillations in the rotational axis. The westward driftof the lithosphere relative to the mantle, and all itstectonic implications, in turn indicate that the Earth’srotation contributes to plate dynamics, both in termsof the direction of movement, and above all in termsof energy.
The gravitational attraction of the Moon and Sungenerates both fluid and solid tides on Earth, creatinga permanent westward drift of the lithosphere, andsimultaneously acting as a brake on the velocity of theEarth’s rotation. An increase in the duration of a dayof about 1.79 ms�century has been measured. Forexample, thanks to studies of stromatolites and tidaldeposits, it has been established that 700 million yearsago a year consisted of about 400-430 days; in otherwords the length of a day was about 21-20 hours, dueto the greater velocity of the Earth’s rotation (Denis etal., 2002). This greater velocity of rotation alsocaused a greater flattening of the Earth’s poles;between 2.5 billion years ago and today the flatteningof the poles relative to the equator has decreased from0.005 to 0.003.
The centre of gravity of the Earth-Moon systemlies within the mantle; Bostrom (2000) has shown thatif we consider this system a double planet, gravity atthe Earth’s surface is slightly angled (0.38°) as aneffect of the Moon’s gravity. This inclination alsocauses asymmetry in mantle convection.
The Earth’s solid inner core did not exist until 2billion years ago, and according to some authors onlybegan to solidify in the last 500 My. The lower mantlealso shows an accumulation of denser material in itsinner parts; this material can no longer rise due to theimmense pressures at a depth of about 2,800-2,900 km.This means that the densest elements are slowlyaccumulating in the lower parts of both the core and themantle, provoking a decrease in the Earth’s moment ofinertia and a corresponding increase in the velocity ofrotation; however, this is not sufficient to compensatefor the slowing due to tides. The combination of tidaleffects and the sinking of the denser parts of the Earthtowards the core represent a pair of forces acting on theasthenosphere, the layer of least resistance, whichmight explain the mean westward movement of thelithosphere. In this model, plate tectonics is a
combination of rotational effects and convectivemotions in the mantle (Scoppola et al., 2003).
Were it to be confirmed that OIB (Ocean IslandBasalt) magmas at hotspots are sourced from theasthenosphere, as are MORBs (Middle Oceanic RidgeBasalts) at mid-ocean ridges, and IABs (Island ArcBasalts) in subduction zones, sourced from depths of100-150 km, there would be strong evidence that mostof the Earth’s magma comes from the superficial layerof the upper mantle. As such, given the lack ofconcrete petrological data on the composition of thelower mantle, the latter may be richer in iron, and thusdenser, than hitherto thought. In this case, the effectof slab pull would be even less than estimated above,and no longer able to drive plate dynamics. Acombination of astronomical effects and convection istherefore better able to explain the Earth’sgeodynamics.
References
Anderson D.L. (1989) Theory of the Earth, Boston (MA),Blackwell.
Bally A.W. (1983) Seismic expression of structural styles.A picture and workatlas, Tulsa (OK), American Associationof Petroleum Geologists, 3v.
Bally A.W. et al. (1985) Elementi di tettonica regionale.Evoluzione dei bacini sedimentari e delle catene montuose,Bologna, Pitagora.
Bonatti E. et al. (2003) Mantle thermal pulses below themid-Atlantic ridge and temporal variations in the formationof oceanic lithosphere, «Nature», 423, 499-505.
Bostrom R.C. (2000) Tectonic consequences of the Earth’srotation, Oxford, Oxford University Press.
Bott M.H.P. (1979) Subsidence mechanisms at passivecontinental margins, «American Association of PetroleumGeologists. Memoir», 29, 8-19.
Buck W.R. et al. (1988) Thermal consequences of lithosphericextension. Pure and simple, «Tectonics», 7, 213-234.
Denis C. et al. (2002) Despinning of the Earth rotation in thegeological past and geomagnetic paleointensities, «Journalof Geodynamics», 34, 667-685.
Doglioni C. et al. (1999) Orogens and slabs vs. their directionof subduction, «Earth Science Review», 45, 167-208.
Doglioni C. et al. (2003) Rift asymmetry and continentaluplift, «Tectonics», 22, 1024.
Fowler C.M.R. (1990) The solid Earth. An introduction toglobal geophysics, Cambridge, Cambridge University Press.
Gripp A.E., Gordon R.G. (2002) Young tracks of hotspotsand current plate velocities, «Geophysical JournalInternational», 150, 321-361.
Gung Y. et al. (2003) Global anisotropy and the thicknessof continents, «Nature», 422, 707-711.
Harabaglia P., Doglioni C. (1998) Topography and gravityacross subduction zones, «Geophysical Research Letters»,25, 703-706.
Lister G.S. et al. (1986) Detachment faulting and the evolutionof passive continental margins, «Geology», 14, 246-250.
134 ENCYCLOPAEDIA OF HYDROCARBONS
GEOSCIENCES
McKenzie D.P. (1978) Some remarks on the developmentof sedimentary basins, «Earth and Planetary ScienceLetters», 40, 25-32.
Merlini S. et al. (2000) On the seismic profile crop M5 inthe Ionian Sea, «Bollettino della Società GeograficaItaliana», 119, 227-236.
Müller R.D. et al. (1997) Digital isochrons of the world’socean floor, «Journal of Geophysical Research», 102, 3211-3214.
Romanowicz B., Gung Y. (2002) Superplumes from thecore-mantle boundary to the lithosphere. Implications forheat flux, «Science», 296, 513-516.
Scoppola B. et al. (2003) Earth’s rotation and the westwarddrift of the lithosphere, «Geophysical Research Abstracts», 5.
Stein C.A. (1995) Heat flow of the Earth, in: Ahrens T.J.
(editor) Global Earth physics. A handbook of physicalconstants, Washington (D.C.), American Geophysical Union,144-158.
Turcotte D.L., Schubert G. (2002) Geodynamics,Cambridge, Cambridge University Press.
Wernicke B. (1985) Uniform-sense normal simple shear ofthe continental lithosphere, «Canadian Journal of EarthSciences», 22, 108-125.
Windley B.F. (1995) The evolving continents, Chichester,John Wiley.
Carlo DoglioniDipartimento di Scienze della Terra
Università degli Studi di Roma ‘La Sapienza’Roma, Italy
135VOLUME I / EXPLORATION, PRODUCTION AND TRANSPORT
RELATIONS BETWEEN SEDIMENTARY BASINS AND PETROLEUM PROVINCES
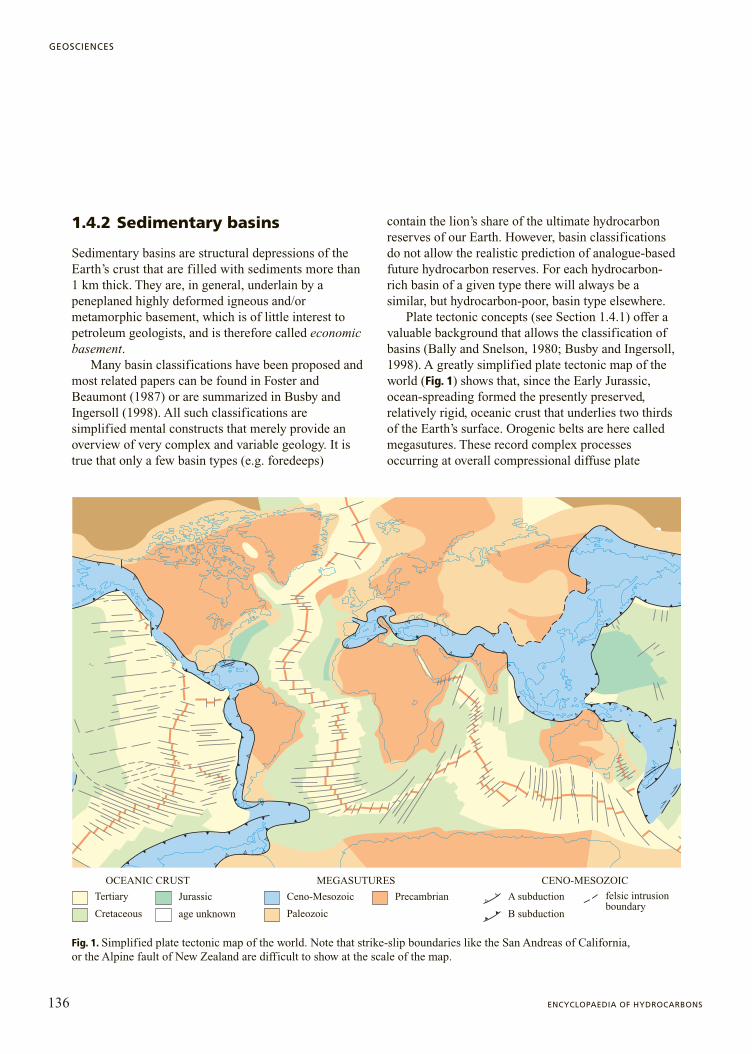
1.4.2 Sedimentary basins
Sedimentary basins are structural depressions of theEarth’s crust that are filled with sediments more than1 km thick. They are, in general, underlain by apeneplaned highly deformed igneous and/ormetamorphic basement, which is of little interest topetroleum geologists, and is therefore called economicbasement.
Many basin classifications have been proposed andmost related papers can be found in Foster andBeaumont (1987) or are summarized in Busby andIngersoll (1998). All such classifications aresimplified mental constructs that merely provide anoverview of very complex and variable geology. It istrue that only a few basin types (e.g. foredeeps)
contain the lion’s share of the ultimate hydrocarbonreserves of our Earth. However, basin classificationsdo not allow the realistic prediction of analogue-basedfuture hydrocarbon reserves. For each hydrocarbon-rich basin of a given type there will always be asimilar, but hydrocarbon-poor, basin type elsewhere.
Plate tectonic concepts (see Section 1.4.1) offer avaluable background that allows the classification ofbasins (Bally and Snelson, 1980; Busby and Ingersoll,1998). A greatly simplified plate tectonic map of theworld (Fig. 1) shows that, since the Early Jurassic,ocean-spreading formed the presently preserved,relatively rigid, oceanic crust that underlies two thirdsof the Earth’s surface. Orogenic belts are here calledmegasutures. These record complex processesoccurring at overall compressional diffuse plate
136 ENCYCLOPAEDIA OF HYDROCARBONS
GEOSCIENCES
Jurassic
Cretaceous age unknown B subduction
A subduction felsic intrusionboundary
Ceno-Mesozoic
Paleozoic
PrecambrianTertiary
MEGASUTURES CENO-MESOZOICOCEANIC CRUST
Fig. 1. Simplified plate tectonic map of the world. Note that strike-slip boundaries like the San Andreas of California, or the Alpine fault of New Zealand are difficult to show at the scale of the map.
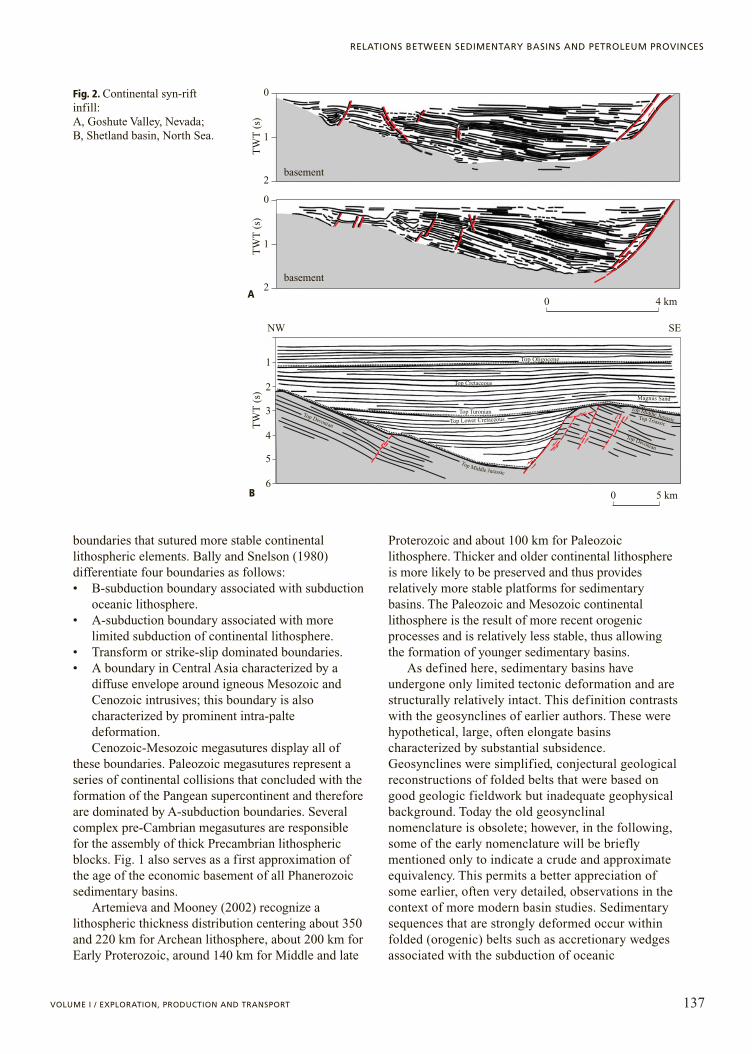
boundaries that sutured more stable continentallithospheric elements. Bally and Snelson (1980)differentiate four boundaries as follows: • B-subduction boundary associated with subduction
oceanic lithosphere.• A-subduction boundary associated with more
limited subduction of continental lithosphere.• Transform or strike-slip dominated boundaries.• A boundary in Central Asia characterized by a
diffuse envelope around igneous Mesozoic andCenozoic intrusives; this boundary is alsocharacterized by prominent intra-paltedeformation.Cenozoic-Mesozoic megasutures display all of
these boundaries. Paleozoic megasutures represent aseries of continental collisions that concluded with theformation of the Pangean supercontinent and thereforeare dominated by A-subduction boundaries. Severalcomplex pre-Cambrian megasutures are responsiblefor the assembly of thick Precambrian lithosphericblocks. Fig. 1 also serves as a first approximation ofthe age of the economic basement of all Phanerozoicsedimentary basins.
Artemieva and Mooney (2002) recognize alithospheric thickness distribution centering about 350and 220 km for Archean lithosphere, about 200 km forEarly Proterozoic, around 140 km for Middle and late
Proterozoic and about 100 km for Paleozoiclithosphere. Thicker and older continental lithosphereis more likely to be preserved and thus providesrelatively more stable platforms for sedimentarybasins. The Paleozoic and Mesozoic continentallithosphere is the result of more recent orogenicprocesses and is relatively less stable, thus allowingthe formation of younger sedimentary basins.
As defined here, sedimentary basins haveundergone only limited tectonic deformation and arestructurally relatively intact. This definition contrastswith the geosynclines of earlier authors. These werehypothetical, large, often elongate basinscharacterized by substantial subsidence.Geosynclines were simplified, conjectural geologicalreconstructions of folded belts that were based ongood geologic fieldwork but inadequate geophysicalbackground. Today the old geosynclinalnomenclature is obsolete; however, in the following,some of the early nomenclature will be brieflymentioned only to indicate a crude and approximateequivalency. This permits a better appreciation ofsome earlier, often very detailed, observations in thecontext of more modern basin studies. Sedimentarysequences that are strongly deformed occur withinfolded (orogenic) belts such as accretionary wedgesassociated with the subduction of oceanic
137VOLUME I / EXPLORATION, PRODUCTION AND TRANSPORT
RELATIONS BETWEEN SEDIMENTARY BASINS AND PETROLEUM PROVINCES
0
1T
WT
(s)
TW
T (
s)T
WT
(s)
2
0
1
2
0
1
2
3
4
5
65 km
0 4 kma
b
basement
basement
Top Oligocene
Top Cretaceous
Top Lower CretaceousTop Turonian
Magnus Sand
Top Middle Jurassic
Top Middle Jurassic
Top Devonian
Top DevonianTop Triassic
NW SE
Fig. 2. Continental syn-riftinfill: A, Goshute Valley, Nevada; B, Shetland basin, North Sea.
A
B
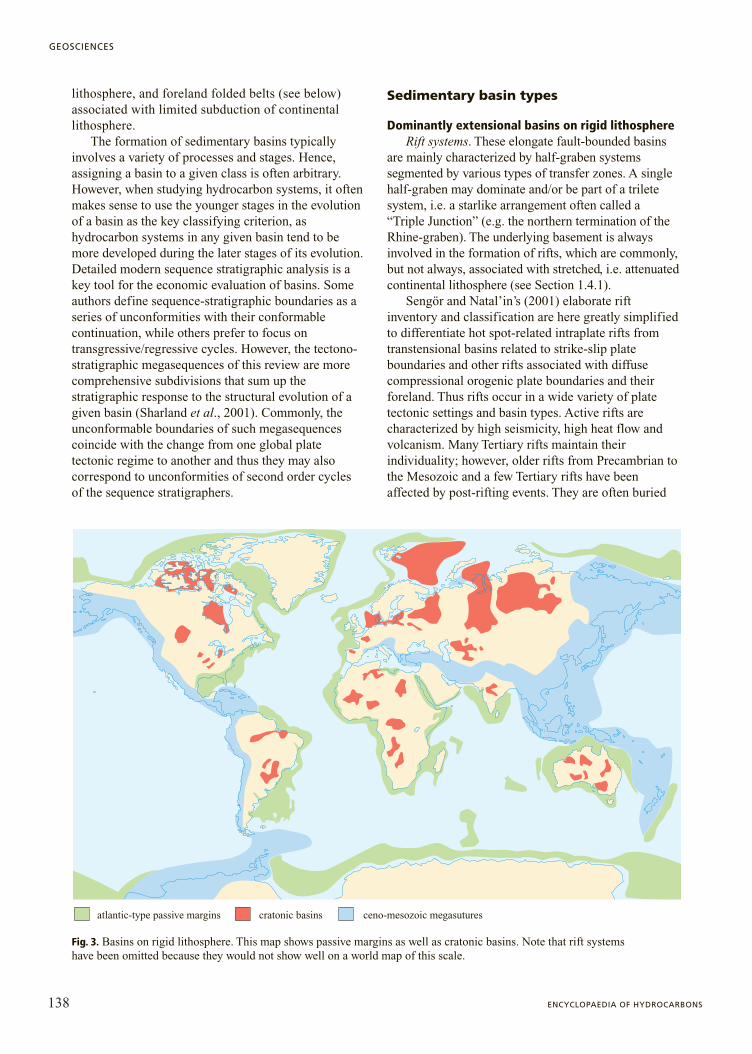
lithosphere, and foreland folded belts (see below)associated with limited subduction of continentallithosphere.
The formation of sedimentary basins typicallyinvolves a variety of processes and stages. Hence,assigning a basin to a given class is often arbitrary.However, when studying hydrocarbon systems, it oftenmakes sense to use the younger stages in the evolutionof a basin as the key classifying criterion, ashydrocarbon systems in any given basin tend to bemore developed during the later stages of its evolution.Detailed modern sequence stratigraphic analysis is akey tool for the economic evaluation of basins. Someauthors define sequence-stratigraphic boundaries as aseries of unconformities with their conformablecontinuation, while others prefer to focus ontransgressive/regressive cycles. However, the tectono-stratigraphic megasequences of this review are morecomprehensive subdivisions that sum up thestratigraphic response to the structural evolution of agiven basin (Sharland et al., 2001). Commonly, theunconformable boundaries of such megasequencescoincide with the change from one global platetectonic regime to another and thus they may alsocorrespond to unconformities of second order cyclesof the sequence stratigraphers.
Sedimentary basin types
Dominantly extensional basins on rigid lithosphere Rift systems. These elongate fault-bounded basins
are mainly characterized by half-graben systemssegmented by various types of transfer zones. A singlehalf-graben may dominate and/or be part of a triletesystem, i.e. a starlike arrangement often called a“Triple Junction” (e.g. the northern termination of theRhine-graben). The underlying basement is alwaysinvolved in the formation of rifts, which are commonly,but not always, associated with stretched, i.e. attenuatedcontinental lithosphere (see Section 1.4.1).
Sengör and Natal’in’s (2001) elaborate riftinventory and classification are here greatly simplifiedto differentiate hot spot-related intraplate rifts fromtranstensional basins related to strike-slip plateboundaries and other rifts associated with diffusecompressional orogenic plate boundaries and theirforeland. Thus rifts occur in a wide variety of platetectonic settings and basin types. Active rifts arecharacterized by high seismicity, high heat flow andvolcanism. Many Tertiary rifts maintain theirindividuality; however, older rifts from Precambrian tothe Mesozoic and a few Tertiary rifts have beenaffected by post-rifting events. They are often buried
138 ENCYCLOPAEDIA OF HYDROCARBONS
GEOSCIENCES
atlantic-type passive margins cratonic basins ceno-mesozoic megasutures
Fig. 3. Basins on rigid lithosphere. This map shows passive margins as well as cratonic basins. Note that rift systems have been omitted because they would not show well on a world map of this scale.
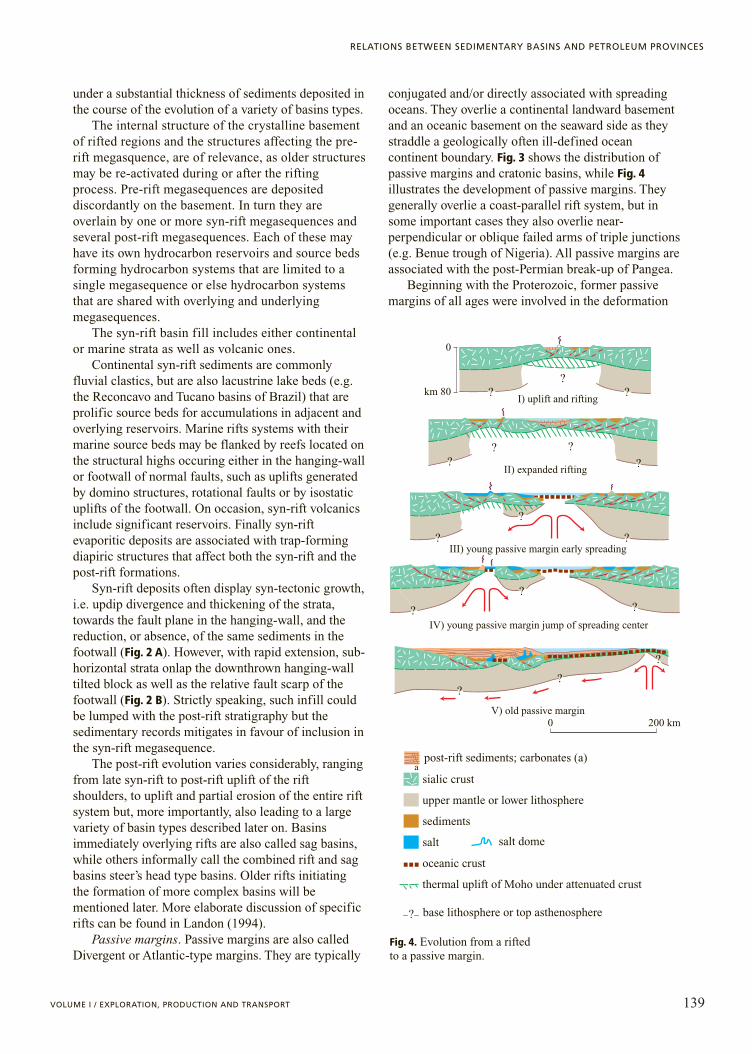
under a substantial thickness of sediments deposited inthe course of the evolution of a variety of basins types.
The internal structure of the crystalline basementof rifted regions and the structures affecting the pre-rift megasquence, are of relevance, as older structuresmay be re-activated during or after the riftingprocess. Pre-rift megasequences are depositeddiscordantly on the basement. In turn they areoverlain by one or more syn-rift megasequences andseveral post-rift megasequences. Each of these mayhave its own hydrocarbon reservoirs and source bedsforming hydrocarbon systems that are limited to asingle megasequence or else hydrocarbon systemsthat are shared with overlying and underlyingmegasequences.
The syn-rift basin fill includes either continentalor marine strata as well as volcanic ones.
Continental syn-rift sediments are commonlyfluvial clastics, but are also lacustrine lake beds (e.g.the Reconcavo and Tucano basins of Brazil) that areprolific source beds for accumulations in adjacent andoverlying reservoirs. Marine rifts systems with theirmarine source beds may be flanked by reefs located onthe structural highs occuring either in the hanging-wallor footwall of normal faults, such as uplifts generatedby domino structures, rotational faults or by isostaticuplifts of the footwall. On occasion, syn-rift volcanicsinclude significant reservoirs. Finally syn-riftevaporitic deposits are associated with trap-formingdiapiric structures that affect both the syn-rift and thepost-rift formations.
Syn-rift deposits often display syn-tectonic growth,i.e. updip divergence and thickening of the strata,towards the fault plane in the hanging-wall, and thereduction, or absence, of the same sediments in thefootwall (Fig. 2 A). However, with rapid extension, sub-horizontal strata onlap the downthrown hanging-walltilted block as well as the relative fault scarp of thefootwall (Fig. 2 B). Strictly speaking, such infill couldbe lumped with the post-rift stratigraphy but thesedimentary records mitigates in favour of inclusion inthe syn-rift megasequence.
The post-rift evolution varies considerably, rangingfrom late syn-rift to post-rift uplift of the riftshoulders, to uplift and partial erosion of the entire riftsystem but, more importantly, also leading to a largevariety of basin types described later on. Basinsimmediately overlying rifts are also called sag basins,while others informally call the combined rift and sagbasins steer’s head type basins. Older rifts initiatingthe formation of more complex basins will bementioned later. More elaborate discussion of specificrifts can be found in Landon (1994).
Passive margins. Passive margins are also calledDivergent or Atlantic-type margins. They are typically
conjugated and/or directly associated with spreadingoceans. They overlie a continental landward basementand an oceanic basement on the seaward side as theystraddle a geologically often ill-defined oceancontinent boundary. Fig. 3 shows the distribution ofpassive margins and cratonic basins, while Fig. 4illustrates the development of passive margins. Theygenerally overlie a coast-parallel rift system, but insome important cases they also overlie near-perpendicular or oblique failed arms of triple junctions(e.g. Benue trough of Nigeria). All passive margins areassociated with the post-Permian break-up of Pangea.
Beginning with the Proterozoic, former passivemargins of all ages were involved in the deformation
139VOLUME I / EXPLORATION, PRODUCTION AND TRANSPORT
RELATIONS BETWEEN SEDIMENTARY BASINS AND PETROLEUM PROVINCES
0 200 km
a
??
?
?
??
?
? ?
?? ?
?
?? ?
sialic crust
upper mantle or lower lithosphere
sediments
salt
oceanic crust
thermal uplift of Moho under attenuated crust
base lithosphere or top asthenosphere
I) uplift and rifting
II) expanded rifting
III) young passive margin early spreading
V) old passive margin
IV) young passive margin jump of spreading center
km 80
0
?
salt dome
post-rift sediments; carbonates (a)
Fig. 4. Evolution from a rifted to a passive margin.
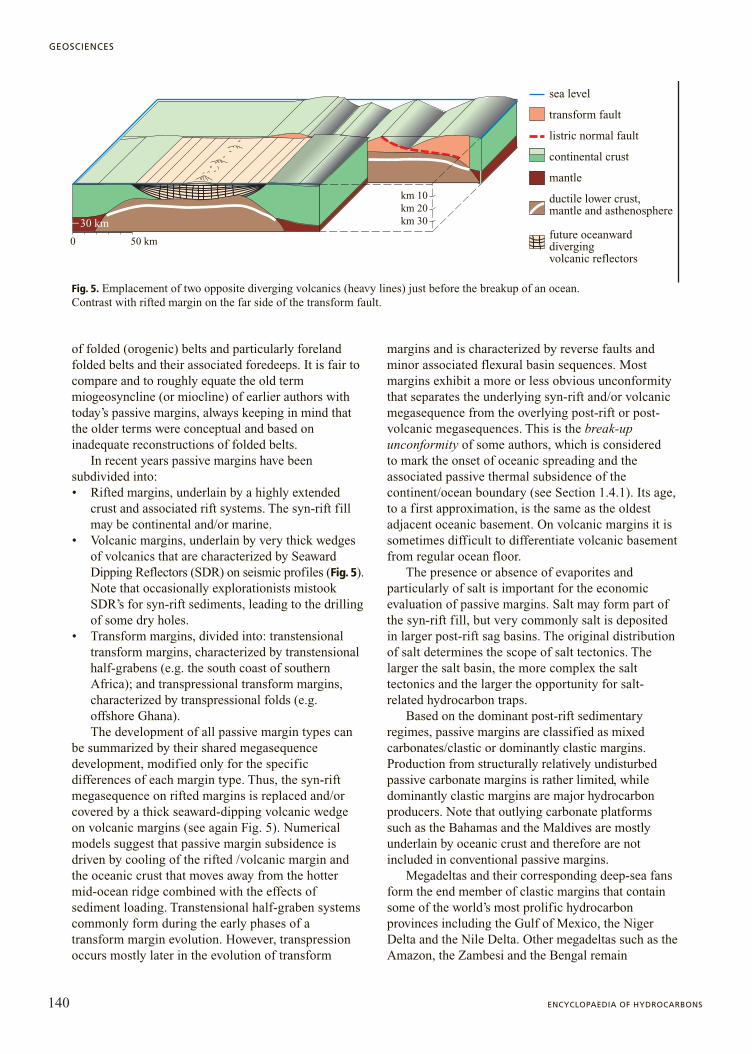
of folded (orogenic) belts and particularly forelandfolded belts and their associated foredeeps. It is fair tocompare and to roughly equate the old termmiogeosyncline (or miocline) of earlier authors withtoday’s passive margins, always keeping in mind thatthe older terms were conceptual and based oninadequate reconstructions of folded belts.
In recent years passive margins have beensubdivided into:• Rifted margins, underlain by a highly extended
crust and associated rift systems. The syn-rift fillmay be continental and/or marine.
• Volcanic margins, underlain by very thick wedgesof volcanics that are characterized by SeawardDipping Reflectors (SDR) on seismic profiles (Fig. 5).Note that occasionally explorationists mistookSDR’s for syn-rift sediments, leading to the drillingof some dry holes.
• Transform margins, divided into: transtensionaltransform margins, characterized by transtensionalhalf-grabens (e.g. the south coast of southernAfrica); and transpressional transform margins,characterized by transpressional folds (e.g.offshore Ghana).The development of all passive margin types can
be summarized by their shared megasequencedevelopment, modified only for the specificdifferences of each margin type. Thus, the syn-riftmegasequence on rifted margins is replaced and/orcovered by a thick seaward-dipping volcanic wedgeon volcanic margins (see again Fig. 5). Numericalmodels suggest that passive margin subsidence isdriven by cooling of the rifted /volcanic margin andthe oceanic crust that moves away from the hottermid-ocean ridge combined with the effects ofsediment loading. Transtensional half-graben systemscommonly form during the early phases of atransform margin evolution. However, transpressionoccurs mostly later in the evolution of transform
margins and is characterized by reverse faults andminor associated flexural basin sequences. Mostmargins exhibit a more or less obvious unconformitythat separates the underlying syn-rift and/or volcanicmegasequence from the overlying post-rift or post-volcanic megasequences. This is the break-upunconformity of some authors, which is consideredto mark the onset of oceanic spreading and theassociated passive thermal subsidence of thecontinent/ocean boundary (see Section 1.4.1). Its age,to a first approximation, is the same as the oldestadjacent oceanic basement. On volcanic margins it issometimes difficult to differentiate volcanic basementfrom regular ocean floor.
The presence or absence of evaporites andparticularly of salt is important for the economicevaluation of passive margins. Salt may form part ofthe syn-rift fill, but very commonly salt is depositedin larger post-rift sag basins. The original distributionof salt determines the scope of salt tectonics. Thelarger the salt basin, the more complex the salttectonics and the larger the opportunity for salt-related hydrocarbon traps.
Based on the dominant post-rift sedimentaryregimes, passive margins are classified as mixedcarbonates/clastic or dominantly clastic margins.Production from structurally relatively undisturbedpassive carbonate margins is rather limited, whiledominantly clastic margins are major hydrocarbonproducers. Note that outlying carbonate platformssuch as the Bahamas and the Maldives are mostlyunderlain by oceanic crust and therefore are notincluded in conventional passive margins.
Megadeltas and their corresponding deep-sea fansform the end member of clastic margins that containsome of the world’s most prolific hydrocarbonprovinces including the Gulf of Mexico, the NigerDelta and the Nile Delta. Other megadeltas such as theAmazon, the Zambesi and the Bengal remain
140 ENCYCLOPAEDIA OF HYDROCARBONS
GEOSCIENCES
�30 km km 30km 20km 10
50 km0
sea level
transform fault
listric normal fault
continental crust
mantle
ductile lower crust,mantle and asthenosphere
future oceanwarddivergingvolcanic reflectors
Fig. 5. Emplacement of two opposite diverging volcanics (heavy lines) just before the breakup of an ocean. Contrast with rifted margin on the far side of the transform fault.
underexplored. The attractiveness of megadeltas isunderscored by the common presence of marinesource beds, and by widespread syn-sedimentarygrowth-fault systems that are due to gravitationalspreading associated with a shifting load of deltaicdepocenters. Deltaic and various shallow anddeepwater sands offer good reservoirs separated byadequate seals. The importance of salt and shaletectonics associated with megadeltas is discussed in aseries of papers by Edwards and Santogrossi (1990),Jackson et al. (1995), Cameron et al. (1999), Mohriakand Talwani (2000), and Arthur et al. (2003).
Ocean basins. Strictly speaking, the great oceanbasins of the world ought to be included in anydiscussion of basins. Their origin has been brieflysummarized in the introduction. Outward from thepassive margins, oceanic basins are of little economicinterest to hydrocarbon explorationists. The oceaniccrust is typically overlain by a relatively thin cover ofmudstones that may well include some, mostlyimmature, source beds and fewer significant reservoirswith increasing distance away from continental margins.
Cratonic basins. Cratonic or intracratonic basins(the sineclises of Russian authors) form oncontinental lithosphere or cratons (see again Fig. 3).They are deceptively simple, but views regardingtheir origin vary widely, reflecting the differingbackgrounds of various authors. The term cratonimplies stability of large continental platforms.Particularly stable Precambrian provinces are thoughtto be associated with stable, deep and buoyantcratonic roots, yet cratonic basins and their adjacentarches (the anticlises of Russian authors) still recorda significant degree of instability. Some of thefactors influencing such instability are thought toinclude asthenospheric upwelling, intraplateextension/rifting associated with lithosphericattenuation and intraplate compression. Paleozoicand Mesozoic lithosphere is thinner and weaker thanPrecambrian lithosphere (see above), which tends todistinguish cratonic basins that overlie Precambrianlithosphere from those that overlie Paleozoic andyounger lithosphere. Precambrian shields are largeoutcrops of the cratonic basement exposing highlydeformed, often metamorphic and igneous, rocks(see again Fig. 1). In their subsurface continuationthey are separated from all the overlying sedimentsby widespread regional unconformities. On occasionsome Proterozoic basin remnants underlie theseunconformities. The overlying Paleozoic andMesozoic megasequences are of exploration interestas they often contain source beds, reservoirs andseals. The concept of worldwide correlatable cratonicmegasequences was originally developed by Sloss(1963, 1988), who gave them the names of Indian
tribes. While the reality of these worldwidecorrelatable megasequences is not questioned, thereremains an ongoing debate as to whether they arerelated to worldwide tectonic phases and/or localchanges in structural regimes or else to eustatic sea-level changes or perhaps more plausibly to acombination of all of these factors. The cratonicmegasequences in general correspond to secondorder cycles recognized by sequence stratigraphersand it is likely that their boundaries correspond tomajor worldwide plate re-organizations.
Paleozoic cratonic basins should be viewed in thecontext of a Permo-Triassic Pangea assembly, whichshows that, with the exception of the margin thatextends from North Africa to northwestern Australia,most of the Pangean supercontinent was surroundedby Paleozoic active margins thus weakening themargins of the Precambrian cratons adjacent to thesefolded belts (Bally and Snelson, 1980). Particularly forNorth America and South America it may be plausibleto infer that, in addition to Proterozoic riftingprocesses, intraplate compression may have made asignificant contribution to the formation of Paleozoiccratonic basins and intervening arches. Compare thiswith Mesozoic Africa, which is surrounded byspreading ocean ridges associated with the Mesozoicbreak-up of Pangea leading to widespread cratonic riftsystems (Arthur et al., 2003). Many cratonic basins ofWestern, Central Europe (Ziegler, 1990; Baldschuhn etal., 2001) and West Siberia overlie a relatively thin andunstable Paleozoic lithosphere, facilitating bothextensional and compressional reactivations of theunderlying basement structures. Finally it isnoteworthy that a number of cratonic basins arecharacterized by widespread flood-basalts perhapsrelated to the presence of underlying hot spots (e.g. theSiberian Platform and the West Siberian basin).Depending on their timing of emplacement anddistribution, these may influence the thermal evolutionof the basin. The apparent simplicity of cratonic basinshides a great deal of complexity due to the interplay oflocal tectonics with distant tectonics and their impacton the stratigraphic evolution of these basins. Thus itis not sensible to develop a single idealized simpleprototype for cratonic basins or else for theircounterparts, the cratonic arches. The differentiationof megasequences and/or Sloss-type cratonicsequences (see above) is useful to describehydrocarbon systems of cratonic basins. However, itshould be noted that some cratonic basins share thesame source beds with neighbouring foreland basins(e.g. some Paleozoic source beds of North America),while other cratonic basins develop their very ownsource beds (e.g. the Neocomian Bazhenov source bedof West Siberia).
141VOLUME I / EXPLORATION, PRODUCTION AND TRANSPORT
RELATIONS BETWEEN SEDIMENTARY BASINS AND PETROLEUM PROVINCES
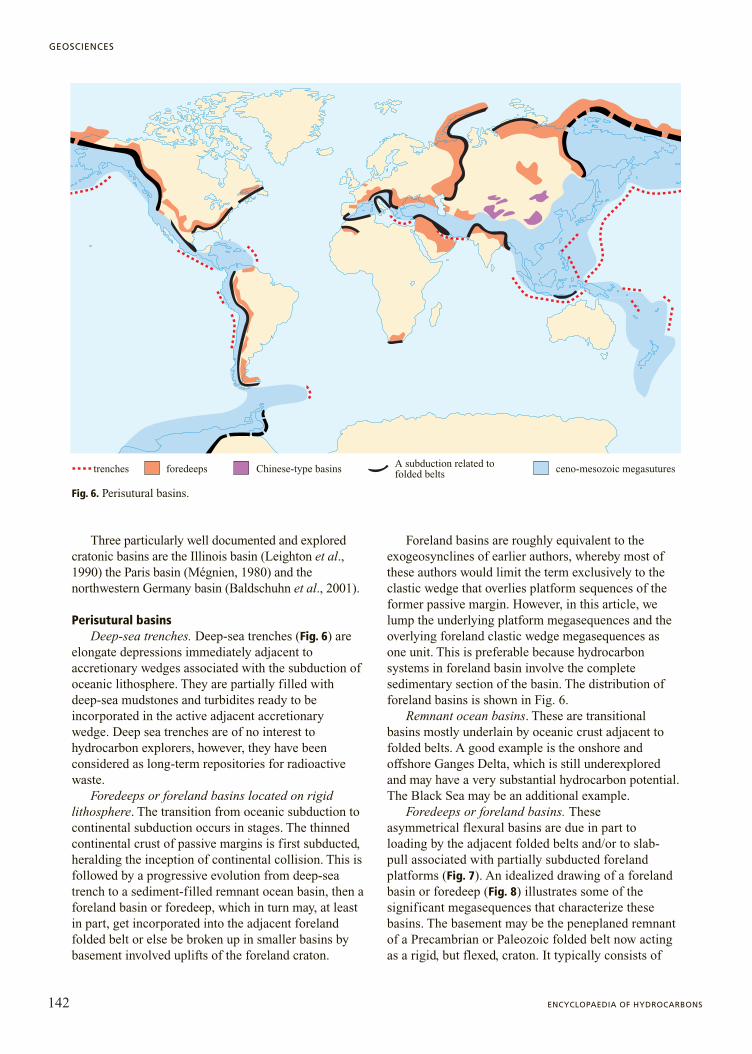
Three particularly well documented and exploredcratonic basins are the Illinois basin (Leighton et al.,1990) the Paris basin (Mégnien, 1980) and thenorthwestern Germany basin (Baldschuhn et al., 2001).
Perisutural basinsDeep-sea trenches. Deep-sea trenches (Fig. 6) are
elongate depressions immediately adjacent toaccretionary wedges associated with the subduction ofoceanic lithosphere. They are partially filled withdeep-sea mudstones and turbidites ready to beincorporated in the active adjacent accretionarywedge. Deep sea trenches are of no interest tohydrocarbon explorers, however, they have beenconsidered as long-term repositories for radioactivewaste.
Foredeeps or foreland basins located on rigidlithosphere. The transition from oceanic subduction tocontinental subduction occurs in stages. The thinnedcontinental crust of passive margins is first subducted,heralding the inception of continental collision. This isfollowed by a progressive evolution from deep-seatrench to a sediment-filled remnant ocean basin, then aforeland basin or foredeep, which in turn may, at leastin part, get incorporated into the adjacent forelandfolded belt or else be broken up in smaller basins bybasement involved uplifts of the foreland craton.
Foreland basins are roughly equivalent to theexogeosynclines of earlier authors, whereby most ofthese authors would limit the term exclusively to theclastic wedge that overlies platform sequences of theformer passive margin. However, in this article, welump the underlying platform megasequences and theoverlying foreland clastic wedge megasequences asone unit. This is preferable because hydrocarbonsystems in foreland basin involve the completesedimentary section of the basin. The distribution offoreland basins is shown in Fig. 6.
Remnant ocean basins. These are transitionalbasins mostly underlain by oceanic crust adjacent tofolded belts. A good example is the onshore andoffshore Ganges Delta, which is still underexploredand may have a very substantial hydrocarbon potential.The Black Sea may be an additional example.
Foredeeps or foreland basins. Theseasymmetrical flexural basins are due in part toloading by the adjacent folded belts and/or to slab-pull associated with partially subducted forelandplatforms (Fig. 7). An idealized drawing of a forelandbasin or foredeep (Fig. 8) illustrates some of thesignificant megasequences that characterize thesebasins. The basement may be the peneplaned remnantof a Precambrian or Paleozoic folded belt now actingas a rigid, but flexed, craton. It typically consists of
142 ENCYCLOPAEDIA OF HYDROCARBONS
GEOSCIENCES
trenches foredeeps Chinese-type basins A subduction related tofolded belts ceno-mesozoic megasutures
Fig. 6. Perisutural basins.
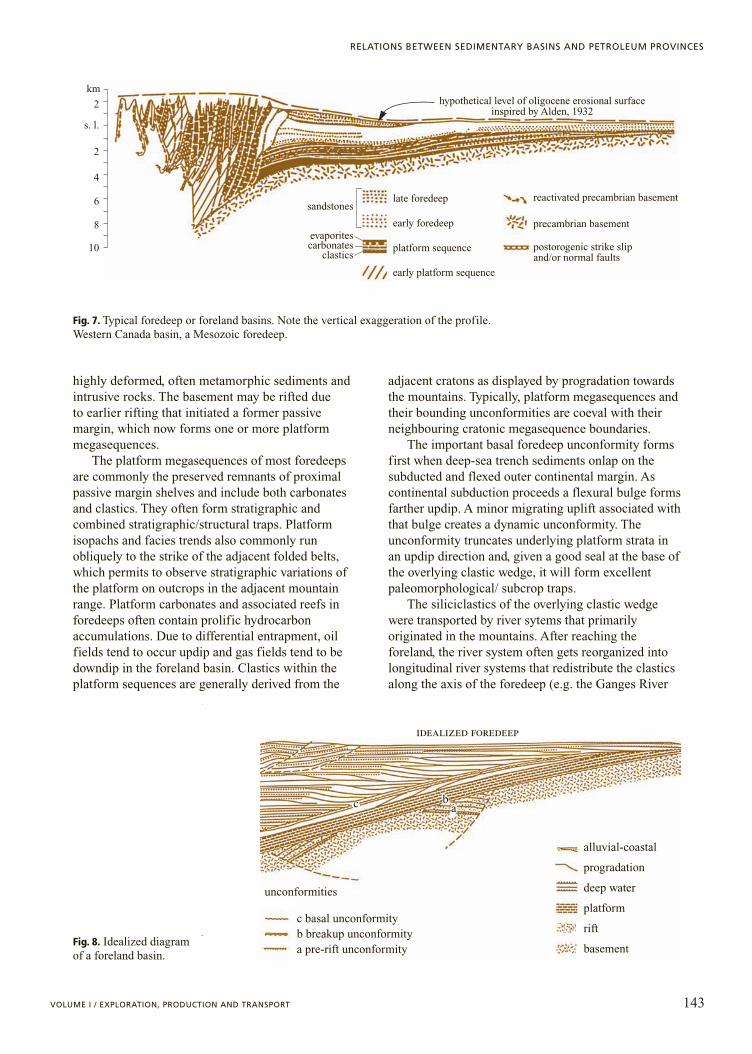
highly deformed, often metamorphic sediments andintrusive rocks. The basement may be rifted due to earlier rifting that initiated a former passivemargin, which now forms one or more platformmegasequences.
The platform megasequences of most foredeepsare commonly the preserved remnants of proximalpassive margin shelves and include both carbonatesand clastics. They often form stratigraphic andcombined stratigraphic/structural traps. Platformisopachs and facies trends also commonly runobliquely to the strike of the adjacent folded belts,which permits to observe stratigraphic variations ofthe platform on outcrops in the adjacent mountainrange. Platform carbonates and associated reefs inforedeeps often contain prolific hydrocarbonaccumulations. Due to differential entrapment, oilfields tend to occur updip and gas fields tend to bedowndip in the foreland basin. Clastics within theplatform sequences are generally derived from the
adjacent cratons as displayed by progradation towardsthe mountains. Typically, platform megasequences andtheir bounding unconformities are coeval with theirneighbouring cratonic megasequence boundaries.
The important basal foredeep unconformity formsfirst when deep-sea trench sediments onlap on thesubducted and flexed outer continental margin. Ascontinental subduction proceeds a flexural bulge formsfarther updip. A minor migrating uplift associated withthat bulge creates a dynamic unconformity. Theunconformity truncates underlying platform strata inan updip direction and, given a good seal at the base ofthe overlying clastic wedge, it will form excellentpaleomorphological/ subcrop traps.
The siliciclastics of the overlying clastic wedgewere transported by river sytems that primarilyoriginated in the mountains. After reaching theforeland, the river system often gets reorganized intolongitudinal river systems that redistribute the clasticsalong the axis of the foredeep (e.g. the Ganges River
143VOLUME I / EXPLORATION, PRODUCTION AND TRANSPORT
RELATIONS BETWEEN SEDIMENTARY BASINS AND PETROLEUM PROVINCES
Fig. 7. Typical foredeep or foreland basins. Note the vertical exaggeration of the profile. Western Canada basin, a Mesozoic foredeep.
10
8
6
4
2
2
late foredeep
early foredeep
sandstones
evaporites carbonates
clasticsplatform sequence
early platform sequence
reactivated precambrian basement
hypothetical level of oligocene erosional surfaceinspired by Alden, 1932
precambrian basement
postorogenic strike slipand/or normal faults
s. l.
km
bc a
alluvial-coastal
progradation
deep water
platform
rift
basement
c basal unconformityb breakup unconformitya pre-rift unconformity
unconformities
idealized foredeep
Fig. 8. Idealized diagramof a foreland basin.
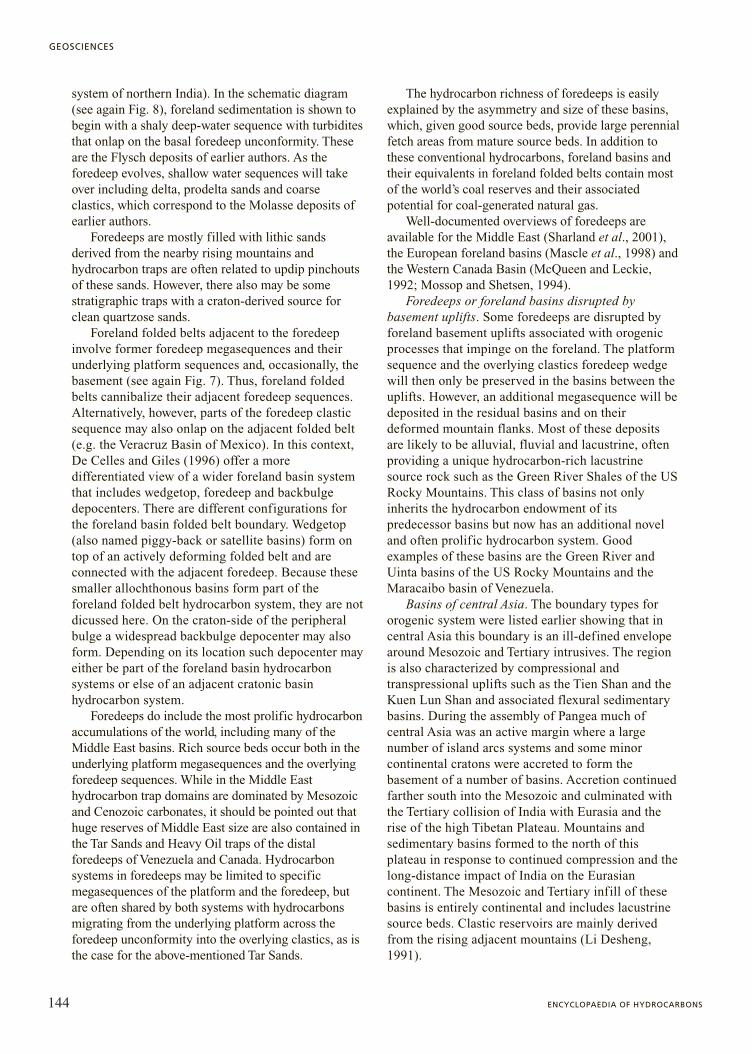
144 ENCYCLOPAEDIA OF HYDROCARBONS
GEOSCIENCES
system of northern India). In the schematic diagram(see again Fig. 8), foreland sedimentation is shown tobegin with a shaly deep-water sequence with turbiditesthat onlap on the basal foredeep unconformity. Theseare the Flysch deposits of earlier authors. As theforedeep evolves, shallow water sequences will takeover including delta, prodelta sands and coarseclastics, which correspond to the Molasse deposits ofearlier authors.
Foredeeps are mostly filled with lithic sandsderived from the nearby rising mountains andhydrocarbon traps are often related to updip pinchoutsof these sands. However, there also may be somestratigraphic traps with a craton-derived source forclean quartzose sands.
Foreland folded belts adjacent to the foredeepinvolve former foredeep megasequences and theirunderlying platform sequences and, occasionally, thebasement (see again Fig. 7). Thus, foreland foldedbelts cannibalize their adjacent foredeep sequences.Alternatively, however, parts of the foredeep clasticsequence may also onlap on the adjacent folded belt(e.g. the Veracruz Basin of Mexico). In this context,De Celles and Giles (1996) offer a moredifferentiated view of a wider foreland basin systemthat includes wedgetop, foredeep and backbulgedepocenters. There are different configurations forthe foreland basin folded belt boundary. Wedgetop(also named piggy-back or satellite basins) form ontop of an actively deforming folded belt and areconnected with the adjacent foredeep. Because thesesmaller allochthonous basins form part of theforeland folded belt hydrocarbon system, they are notdicussed here. On the craton-side of the peripheralbulge a widespread backbulge depocenter may alsoform. Depending on its location such depocenter mayeither be part of the foreland basin hydrocarbonsystems or else of an adjacent cratonic basinhydrocarbon system.
Foredeeps do include the most prolific hydrocarbonaccumulations of the world, including many of theMiddle East basins. Rich source beds occur both in theunderlying platform megasequences and the overlyingforedeep sequences. While in the Middle Easthydrocarbon trap domains are dominated by Mesozoicand Cenozoic carbonates, it should be pointed out thathuge reserves of Middle East size are also contained inthe Tar Sands and Heavy Oil traps of the distalforedeeps of Venezuela and Canada. Hydrocarbonsystems in foredeeps may be limited to specificmegasequences of the platform and the foredeep, butare often shared by both systems with hydrocarbonsmigrating from the underlying platform across theforedeep unconformity into the overlying clastics, as isthe case for the above-mentioned Tar Sands.
The hydrocarbon richness of foredeeps is easilyexplained by the asymmetry and size of these basins,which, given good source beds, provide large perennialfetch areas from mature source beds. In addition tothese conventional hydrocarbons, foreland basins andtheir equivalents in foreland folded belts contain mostof the world’s coal reserves and their associatedpotential for coal-generated natural gas.
Well-documented overviews of foredeeps areavailable for the Middle East (Sharland et al., 2001),the European foreland basins (Mascle et al., 1998) andthe Western Canada Basin (McQueen and Leckie,1992; Mossop and Shetsen, 1994).
Foredeeps or foreland basins disrupted bybasement uplifts. Some foredeeps are disrupted byforeland basement uplifts associated with orogenicprocesses that impinge on the foreland. The platformsequence and the overlying clastics foredeep wedgewill then only be preserved in the basins between theuplifts. However, an additional megasequence will bedeposited in the residual basins and on theirdeformed mountain flanks. Most of these depositsare likely to be alluvial, fluvial and lacustrine, oftenproviding a unique hydrocarbon-rich lacustrinesource rock such as the Green River Shales of the USRocky Mountains. This class of basins not onlyinherits the hydrocarbon endowment of itspredecessor basins but now has an additional noveland often prolific hydrocarbon system. Goodexamples of these basins are the Green River andUinta basins of the US Rocky Mountains and theMaracaibo basin of Venezuela.
Basins of central Asia. The boundary types fororogenic system were listed earlier showing that incentral Asia this boundary is an ill-defined envelopearound Mesozoic and Tertiary intrusives. The regionis also characterized by compressional andtranspressional uplifts such as the Tien Shan and theKuen Lun Shan and associated flexural sedimentarybasins. During the assembly of Pangea much ofcentral Asia was an active margin where a largenumber of island arcs systems and some minorcontinental cratons were accreted to form thebasement of a number of basins. Accretion continuedfarther south into the Mesozoic and culminated withthe Tertiary collision of India with Eurasia and therise of the high Tibetan Plateau. Mountains andsedimentary basins formed to the north of thisplateau in response to continued compression and thelong-distance impact of India on the Eurasiancontinent. The Mesozoic and Tertiary infill of thesebasins is entirely continental and includes lacustrinesource beds. Clastic reservoirs are mainly derivedfrom the rising adjacent mountains (Li Desheng,1991).
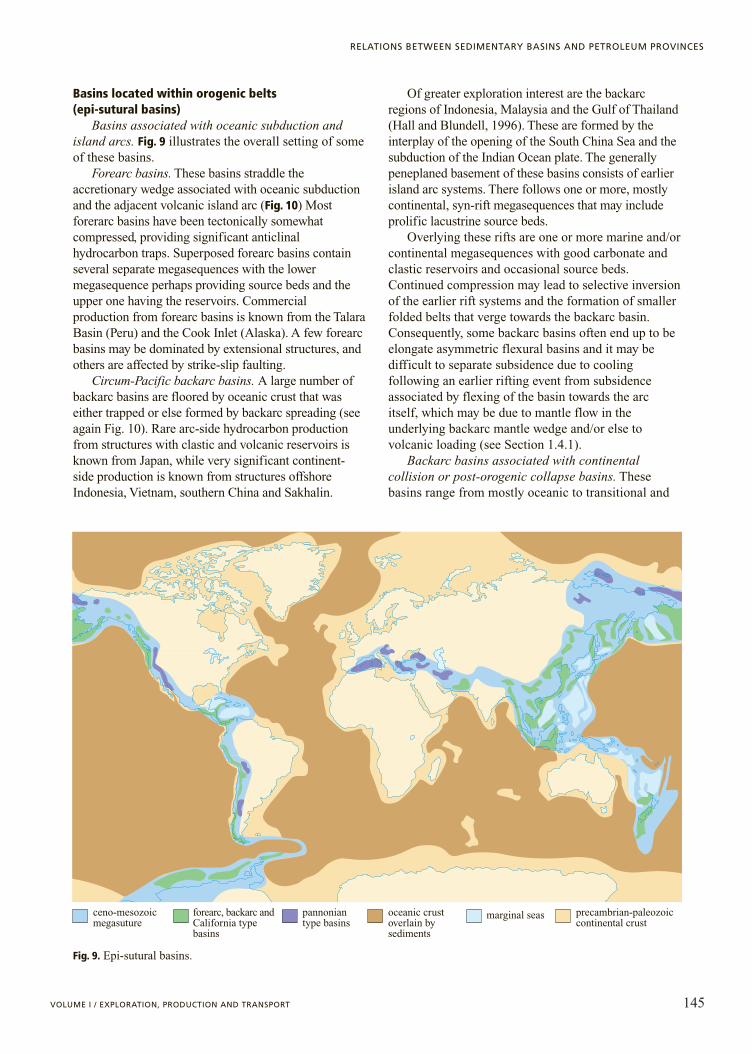
Basins located within orogenic belts (epi-sutural basins)
Basins associated with oceanic subduction andisland arcs. Fig. 9 illustrates the overall setting of someof these basins.
Forearc basins. These basins straddle theaccretionary wedge associated with oceanic subductionand the adjacent volcanic island arc (Fig. 10) Mostforerarc basins have been tectonically somewhatcompressed, providing significant anticlinalhydrocarbon traps. Superposed forearc basins containseveral separate megasequences with the lowermegasequence perhaps providing source beds and theupper one having the reservoirs. Commercialproduction from forearc basins is known from the TalaraBasin (Peru) and the Cook Inlet (Alaska). A few forearcbasins may be dominated by extensional structures, andothers are affected by strike-slip faulting.
Circum-Pacific backarc basins. A large number ofbackarc basins are floored by oceanic crust that waseither trapped or else formed by backarc spreading (seeagain Fig. 10). Rare arc-side hydrocarbon productionfrom structures with clastic and volcanic reservoirs isknown from Japan, while very significant continent-side production is known from structures offshoreIndonesia, Vietnam, southern China and Sakhalin.
Of greater exploration interest are the backarcregions of Indonesia, Malaysia and the Gulf of Thailand(Hall and Blundell, 1996). These are formed by theinterplay of the opening of the South China Sea and thesubduction of the Indian Ocean plate. The generallypeneplaned basement of these basins consists of earlierisland arc systems. There follows one or more, mostlycontinental, syn-rift megasequences that may includeprolific lacustrine source beds.
Overlying these rifts are one or more marine and/orcontinental megasequences with good carbonate andclastic reservoirs and occasional source beds.Continued compression may lead to selective inversionof the earlier rift systems and the formation of smallerfolded belts that verge towards the backarc basin.Consequently, some backarc basins often end up to beelongate asymmetric flexural basins and it may bedifficult to separate subsidence due to coolingfollowing an earlier rifting event from subsidenceassociated by flexing of the basin towards the arcitself, which may be due to mantle flow in theunderlying backarc mantle wedge and/or else tovolcanic loading (see Section 1.4.1).
Backarc basins associated with continentalcollision or post-orogenic collapse basins. Thesebasins range from mostly oceanic to transitional and
145VOLUME I / EXPLORATION, PRODUCTION AND TRANSPORT
RELATIONS BETWEEN SEDIMENTARY BASINS AND PETROLEUM PROVINCES
forearc, backarc andCalifornia typebasins
pannoniantype basins
oceanic crustoverlain bysediments
marginal seas precambrian-paleozoiccontinental crust
ceno-mesozoicmegasuture
Fig. 9. Epi-sutural basins.
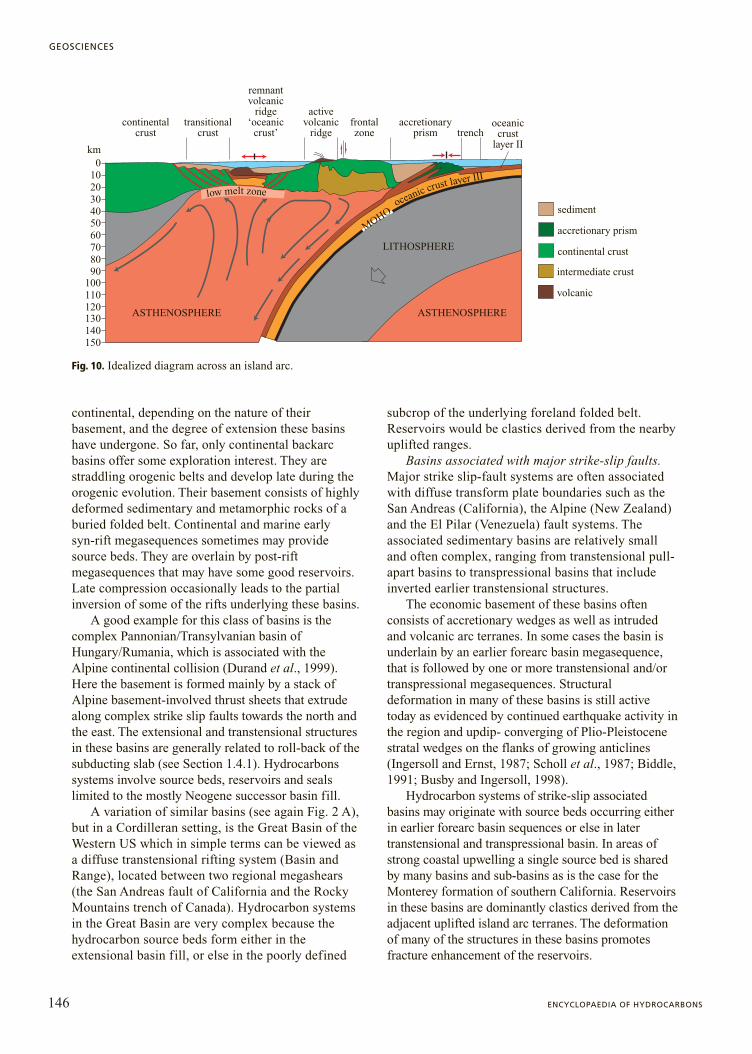
continental, depending on the nature of theirbasement, and the degree of extension these basinshave undergone. So far, only continental backarcbasins offer some exploration interest. They arestraddling orogenic belts and develop late during theorogenic evolution. Their basement consists of highlydeformed sedimentary and metamorphic rocks of aburied folded belt. Continental and marine early syn-rift megasequences sometimes may providesource beds. They are overlain by post-riftmegasequences that may have some good reservoirs.Late compression occasionally leads to the partialinversion of some of the rifts underlying these basins.
A good example for this class of basins is thecomplex Pannonian/Transylvanian basin ofHungary/Rumania, which is associated with theAlpine continental collision (Durand et al., 1999).Here the basement is formed mainly by a stack ofAlpine basement-involved thrust sheets that extrudealong complex strike slip faults towards the north andthe east. The extensional and transtensional structuresin these basins are generally related to roll-back of thesubducting slab (see Section 1.4.1). Hydrocarbonssystems involve source beds, reservoirs and sealslimited to the mostly Neogene successor basin fill.
A variation of similar basins (see again Fig. 2 A),but in a Cordilleran setting, is the Great Basin of theWestern US which in simple terms can be viewed asa diffuse transtensional rifting system (Basin andRange), located between two regional megashears(the San Andreas fault of California and the RockyMountains trench of Canada). Hydrocarbon systemsin the Great Basin are very complex because thehydrocarbon source beds form either in theextensional basin fill, or else in the poorly defined
subcrop of the underlying foreland folded belt.Reservoirs would be clastics derived from the nearbyuplifted ranges.
Basins associated with major strike-slip faults.Major strike slip-fault systems are often associatedwith diffuse transform plate boundaries such as theSan Andreas (California), the Alpine (New Zealand)and the El Pilar (Venezuela) fault systems. Theassociated sedimentary basins are relatively smalland often complex, ranging from transtensional pull-apart basins to transpressional basins that includeinverted earlier transtensional structures.
The economic basement of these basins oftenconsists of accretionary wedges as well as intrudedand volcanic arc terranes. In some cases the basin isunderlain by an earlier forearc basin megasequence,that is followed by one or more transtensional and/ortranspressional megasequences. Structuraldeformation in many of these basins is still activetoday as evidenced by continued earthquake activity inthe region and updip- converging of Plio-Pleistocenestratal wedges on the flanks of growing anticlines(Ingersoll and Ernst, 1987; Scholl et al., 1987; Biddle,1991; Busby and Ingersoll, 1998).
Hydrocarbon systems of strike-slip associatedbasins may originate with source beds occurring eitherin earlier forearc basin sequences or else in latertranstensional and transpressional basin. In areas ofstrong coastal upwelling a single source bed is sharedby many basins and sub-basins as is the case for theMonterey formation of southern California. Reservoirsin these basins are dominantly clastics derived from theadjacent uplifted island arc terranes. The deformationof many of the structures in these basins promotesfracture enhancement of the reservoirs.
146 ENCYCLOPAEDIA OF HYDROCARBONS
GEOSCIENCES
km
MOHO
0102030405060708090
100110120130140150
continentalcrust
transitionalcrust
remnantvolcanic
ridge‘oceanic
crust’oceanic
crustlayer II
activevolcanic
ridgefrontalzone
accretionaryprism trench
sediment
accretionary prism
continental crust
intermediate crust
volcanic
low melt zoneoceanic crust layer III
LITHOSPHERE
ASTHENOSPHEREASTHENOSPHERE
Fig. 10. Idealized diagram across an island arc.
Concluding commentsA reasonable incentive for grouping basins into
different classes would be to extract generalizationsthat are useful for the study of less explored basins,based on the exploration experience gained elsewherein similar situations. Geologists know that there issome justification for using analogues. However, thereare severe limitations to the use of exploration andproduction statistics from other apparently similarbasins to bolster economic forecasts in less exploredbasins elsewhere. It is easy to demonstrate that therichness (i.e. the ultimate hydrocarbon reserve per areaor else volume of sediment per area) of a given basintype ranges from very rich to very lean for individualbasins within the same class. Some of the richestbasins in the world such as the Los Angeles, theArdmore, the Maracaibo and the Sumatra basins,present quite unique combinations of source, reservoir,seal and an overall basin evolution that cannot besatisfactorily replicated elsewhere (Bally and Snelson,1980).
Even so, hydrocarbon explorers, rightly, continueto compare and analyse sedimentary basins to discoverand /or understand hydrocarbon systems. Inunexplored or underexplored basins, source beds andreservoirs are poorly known, but often analogues fromsimilar basins elsewhere are useful to support anuntested play, i.e the explorer’s grand vision. However,the use of such analogies remains very limited assuggested by the general observation that new plays,often initiated by the discovery of giant fields, aresurprises that at first sight don’t fit easily with anyanalogues elsewhere. This is particularly true forsubtle stratigraphic and combinedstratigraphic/structural traps. On the other hand,following the discovery of a new play, it is of coursesensible to use reservoir and hydrocarbon parametersfrom initial discoveries as analogues to reduceexploration risk.
In fact, worldwide, most of today total onshoreand near-offshore ultimate hydrocarbon reserveshave been found in close proximity (within a radiusof about 200 km) of surface oil shows that werealready known early in the last century (Höfer,1909). Over the years increasingly moresophisticated technology improved the definition ofprimarily structural targets. Only in recent decadeshas there been an increased effort to understand thecontext of sedimentary basins in their totality(Mégnien, 1980; Mossop and Shetsen, 1994).For the hydrocarbon explorer basin analysisultimately will always and primarily be basedon the best possible seismic resolution, which willbe particularly useful in definition of new typesof stratigraphic traps.
References
Artemieva I.M., Mooney W.D. (2002) On the relationsbetween cratonic lithosphere thickness, plate motions, andbasal drag, «Tectonophysics», 358, 211-231.
Arthur T.J. et al. (edited by) (2003) Petroleum geology ofAfrica. New themes and developing technologies, London,Geological Society.
Baldschuhn R. et al. (2001) Geotektonischer Atlas vonNordwest Deutschland und dem Deutschen Nordsee-Sektor,Hannover, Schweizerbat, 3 Cd-Rom.
Bally A.W., Snelson S. (1980) Realms of subsidence, in:Miall A.D. (edited by) Facts and principles of worldpetroleum occurrence, Calgary, Canadian Society ofPetroleum Geologists, 9-94.
Biddle K.T. (edited by) (1991) Active margin basins, Tulsa(OK), American Association of Petroleum Geologists.
Busby C.J., Ingersoll R.V. (edited by) (1998) Tectonics ofsedimentary basins, Cambridge (MA), Blackwell.
Cameron N.R. et al. (edited by) (1999) The oil and gas habitatsof the South Atlantic, London, Geological Society.
De Celles P.G., Giles K.A. (1996) Foreland basin systems,«Basin Research», 8, 105-123.
Durand B. et al. (edited by) (1999) The Mediterranean basins.Tertiary extension within the Alpine orogen, London,Geological Society.
Edwards J.D., Santogrossi P.A. (1990) Divergent/passivemargins, Tulsa (OK), American Association of PetroleumGeologists.
Foster N.H., Beaumont E.A. (compiled by) (1987) Geologicbasins I. Classification, modeling and predictivestratigraphy, Tulsa (OK), American Association ofPetroleum Geologists, 2v.
Hall R., Blundell D.J. (edited by) (1996) Tectonic evolutionof Southeast Asia, London, Geological Society.
Höfer H. (1909) Die Geologie, Gewinnung und der Transportdes Erdöls, in: Engler C., Höfer H. (hrsg. von), Das Erdöl,Leipzig, S. Hirzel, 2v.; v.I.
Ingersoll R.V., Ernst W.G. (editors) (1987) Cenozoic basindevelopment of coastal California, Englewood Cliffs (NJ),Prentice Hall.
Jackson M.P.A. et al. (edited by) (1995) Salt tectonics. Aglobal perspective, Tulsa (OK), American Association ofPetroleum Geologists.
Landon S.M. (edited by) (1994) Interior rift basins, Tulsa(OK), American Association of Petroleum Geologists.
Leighton M.W. et al. (edited by) (1990) Interior cratonic basins,Tulsa (OK), American Association of Petroleum Geologists.
Li Desheng (1991) Tectonic types of oil and gas basins inChina, Beijing, Petroleum Industry Press.
McQueen R.W., Leckie D.A. (edited by) (1992) Forelandbasins and folded belts, Tulsa (OK), American Associationof Petroleum Geologists.
Mascle A. et al. (edited by) (1998) Cenozoic foreland basinsof Western Europe, London, Geological Society.
Mégnien C. (coordonné par) (1980) Synthèse géologique duBassin de Paris, Orléans, Bureau de RecherchesGéologiques et Minières 101-103.
Mohriak W., Talwani M. (2000) Atlantic rifts and continentalmargins, Washington (D.C.), American Geophysical Union.
147VOLUME I / EXPLORATION, PRODUCTION AND TRANSPORT
RELATIONS BETWEEN SEDIMENTARY BASINS AND PETROLEUM PROVINCES

Mossop G., Shetsen I. (1994) Geological atlas of the Westernsedimentary basin, Calgary, Canadian Society of PetroleumGeologists; Edmonton, Alberta Research Council.
Scholl D.W. et al. (edited by) (1987) Geology and resourcepotential of the continental margin of North America andadjacent ocean basins-Beaufort Sea to Baja California,Houston (TX), Circum-Pacific Council for Energy andMineral Resources.
Sengör A.M.C., Natal’in B.A. (2001) Rifts of the world, in:Ernst R.E., Buchan K.L. (edited by) Mantle plumes. Theiridentification through time, Boulder (CO), GeologicalSociety of America, 389-482.
Sharland P.R. et al. (2001) Arabian plate sequencestratigraphy, Manama (Barhain), Gulf PetroLink.
Sloss L.L. (1963) Sequences in the cratonic interior of NorthAmerica, «Geological Society of America. Bulletin», 74.
Sloss L.L. (edited by) (1988) Sedimentary cover-NorthAmerican craton: US, Boulder (CO), Geological Societyof America.
Ziegler P.A. (1990) Geological atlas of Western and CentralEurope, The Hague, Shell International PetroleumMaatschapij.
Albert BallyDepartment of Earth Science
Wiess School of Natural SciencesHouston, Texas, USA
148 ENCYCLOPAEDIA OF HYDROCARBONS
GEOSCIENCES
VOLUME I / EXPLORATION, PRODUCTION AND TRANSPORT
1.4.3 Source rocks: formation and distribution
We can define a petroleum system as a sedimentarybasin or a portion of a sedimentary basin combiningall the required elements and processes conducivefor the formation of oil and gas accumulations(Magoon and Dow, 1994). The elements requiredinclude source rocks, migration routes, reservoirrocks, impervious seals, and traps. The processesinvolved include: the formation of hydrocarbons as aresult of an appropriate burial-thermal history of thesource rock; the efficient migration of the generatedproducts along carrier beds and permeable migrationconduits, such as porous sedimentary units,fractured rocks or faults; the focusing ofhydrocarbon flows towards structural orstratigraphic features acting as traps, where they canaccumulate; and the eventual preservation-alterationof hydrocarbons in reservoirs over geological timefrom accumulation to the present day.
As a part of this scenario, the source rock isindeed a crucial factor because it represents thegeological object that feeds the oil and gas chargeinto the system. In this respect, the nature of thesource rock is a major concern in the risk analysisof exploration ventures. Consequently, source rockgeology and geochemistry have attracted a greatdeal of interest and research activity in order toprovide exploration experts with the best datapossible. This information is directed to minimizethe uncertainties on occurrence, stratigraphiclocation, spatial distribution and thickness, as wellas determining the petroleum potential of sourcerock(s) within a prospective area. The resultingknowledge forms an important basis for anylegitimate attempt at risk analysis and theeconomic assessment of exploration plays.
The purpose of this article is to review the notionof source rock through a discussion on its formation,depositional environment, habitat and stratigraphy.
Formation of source rocksA source rock is a sedimentary unit, hosting
substantial amounts of fossilized organic matter,which is incorporated into the sediment at the timeof deposition. Upon burial and associated thermal
history, this sedimentary organic matter issubsequently thermally cracked to generate oil andgas (Hunt, 1995; Tissot and Welte, 1984). Thesedimentary organic material is mainly derived fromalgal, bacterial and higher plant tissues that togethermake up the major part of our Planet’s biomass(Tyson, 1995). For a rock to be termed a sourcerock, its organic matter content should account for atleast 1-2% of the weight of the rock (Bordenave,1993). This kind of rock is far from common andrequires some very specific formation conditions.These conditions, which have been actively debatedover the last decades, include the local biomassproductivity and the preservation of organicresidues, strongly favoured under anoxic regimes, aswell as the length and type of transport of organicmaterial from the place of biological production tothe sediment repository. One of the mostcontroversial questions hinges on the relativeimportance attributed to primary productivity versusanoxia.
One school of thought has advocated thatorganic matter accumulation in the marine realm islinked to high organic productivity in the euphoticzone (e.g. upwelling areas), and that anoxia of thebottom water is actually a direct consequence of thisproductivity (Calvert and Pedersen, 1992).
Other authors have considered that the mainfactor controlling organic accumulation is thepresence of anoxic bottom water, which favours thepreservation of organic matter, independently fromproductivity (Demaison and Moore, 1980; Tyson,1995).
A more consensual vision is currently emergingfrom this controversy, acknowledging that bothsituations can be instrumental and that, moreimportantly, they are often interdependent.Furthermore, other additional factors have beenproposed as influencing the process of the formationof organic-rich sediments, such as:• The role of highly resistant biopolymers derived
from algae, i.e. ‘algeanan’ (Largeau et al.1990), and from higher plants, ‘cutan’ and‘suberan’ (De Leeuw and Largeau, 1993). Theorganic material is better preserved whenderived from specific populations of bio-organisms containing a large amount of such
149
RELATIONS BETWEEN SEDIMENTARY BASINS AND PETROLEUM PROVINCES
substances. Massive organic rocks such astorbanites, solely made of preserved resistantremains of chlorococcale algae (Botryococcus),and cannel coals, solely made of spore remains,represent extreme examples of this process.
• The protection of organic compounds bysorption onto clays, leading to steric hindrancethat prevents the degradation of the organicmaterial associated with the minerals (Hedges etal., 2001).Organic productivity. For significant quantities
of organic matter to accumulate in a sediment, thedepositional environment must be associated withan ecosystem that produces a sufficient amount ofbiomass (Pedersen and Calvert, 1990). As a matterof fact, it is well documented that the present-daydistribution of organic-rich surface sediments inthe world ocean corresponds to the areas of highplankton productivity (Huc, 1988b). Theproduction of primary organic matter is mainlybased on photosynthesis occurring on land andwithin the euphotic layer of the water masses(� upper 100 m). In general, a small proportion(� 0.5%) of the organic matter produced on thepresent-day land surface escapes the continentalbiological cycle and ultimately makes its way intothe seas where part of it eventually accumulates incoastal environments. Consequently, accumulationsof terrestrial organic matter are more likely tooccur at the outlets of rivers. Under specificsedimentary and climatic conditions, delta settingsrepresent a unique type of environment, since alarge volume of organic shales and coals canaccumulate there as the result of the in situ (orproximal) production of biomass. On land, highproductivity is encountered in regions of highrainfall, so the geographical distribution of coalshas been related to rainfall patterns (McCabe andParrish, 1992). This situation also induces intensiverun-off and increased supply of terrestrial organicmatter to the adjoining seas and lakes.
Aquatic photosynthesis is mainly controlled bythe local availability of nutrients such as phosphatesand nitrates and/or micro-nutriments such as iron inthe photic zone. Phytoplankton growth leads to arapid depletion of nutrients in surface waters. Thenutrients are exported towards underlying watersdue to their release during the decomposition ofsettling organic matter. Hence, high planktonproductivity occurs only in specific areas wherethese nutrients can be replenished at a sufficientrate. Such a situation may be encountered inintracratonic seas and lakes or in near-shore regionswhen rivers can supply nutrients originating fromcontinental run-off by conveying the products of the
chemical weathering of rocks. High productivityalso occurs in areas where upwelling of deep oceanwater enables the nutrient pool to be returned to thephotic zone. For instance, high productivity isstimulated by coastal upwelling in areas wherenutrient-poor surface waters are driven offshore bywind and currents, allowing their replacement bysubsurface waters rich in nutrients. Modernsediments deposited under very active coastalupwellings (i.e. offshore Namibia or offshore Peru)are well known to be organic-rich. The MontereyFormation (Miocene of California) and PhosphoriaFormation (Permian of West-Central USA) areexamples of source rocks related to such ancientupwelling settings.
Preservation of organic matter. Living tissuesare composed of an assemblage of bio-molecules,which are thermodynamically unstable. As soon asthese bio-molecules cease to be involved in livingprocesses, i.e. when they are secreted or excreted,or after the death of the organisms, they tend toloose their integrity and can be ultimatelytransformed into simple more stable componentssuch as CO2, H2O, CH4, NH4
�, etc. Thisdegradation can depend on physicochemicalprocesses (oxidation, photolysis, etc.), but ispredominantly mediated by biological processes.
Organic matter is actually a basic source ofnutrients and energy for heterotrophic livingorganisms, including consumers (zooplankton,nekton, zoobenthos, land animals, insects and soildwellers) and decomposers (microbialcommunities). The processes and efficiency ofalteration as well as the resulting end-products oforganic matter decomposition are to a large extentcontrolled by the availability of electron acceptors.The presence of adequate oxygen concentration(atmospheric or dissolved in water) provides asuitable living medium for organisms ranging fromaerobic microbes to higher. In such a situation, theoverall decomposition process corresponds tooxidation using molecular oxygen as an electronacceptor.
In the absence of molecular oxygen, anaerobicmicro-organisms use nitrates followed by sulphatesas an oxygen source in order to oxidize organicmatter. Ultimately, when the medium is totallydevoid of oxidants (O2, NO3
�, SO42�) fermentative
degradation occurs using organic matter itself as anelectron acceptor, while methanogenesis takes place,via CO2 and acetate reduction.
Degradation caused by aerobic organisms is byfar the most efficient process for the breakdown oforganic matter. It is enhanced by the mechanical andenzymatic breakdown of tissues due to feeding and
150 ENCYCLOPAEDIA OF HYDROCARBONS
GEOSCIENCES
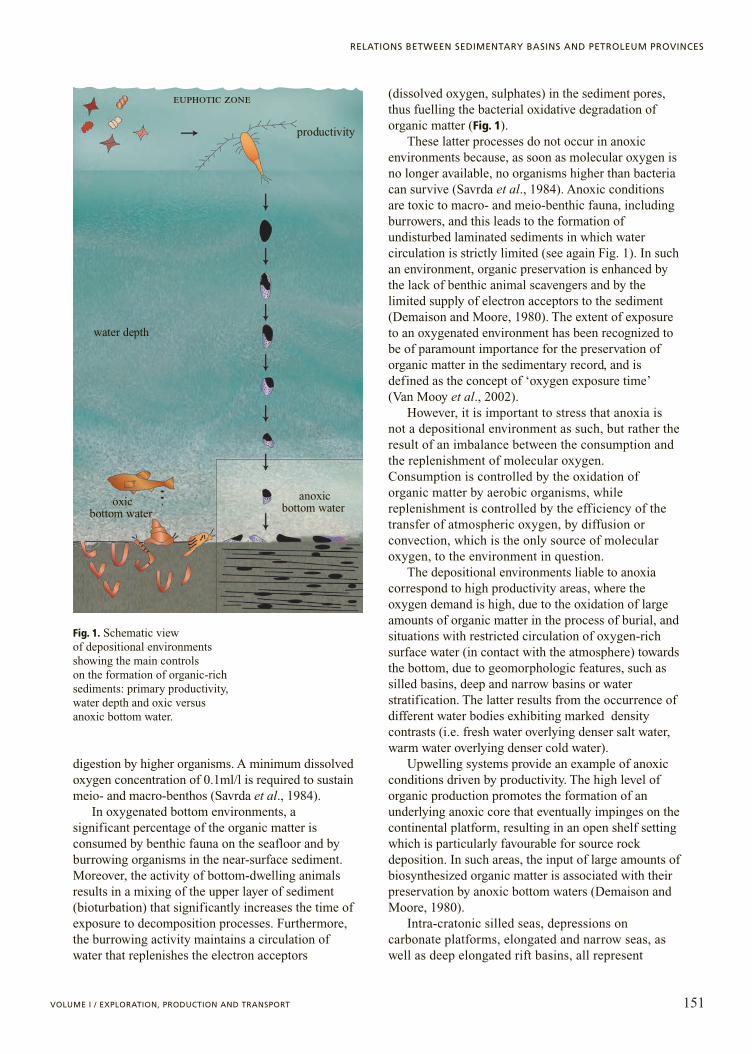
digestion by higher organisms. A minimum dissolvedoxygen concentration of 0.1ml/l is required to sustainmeio- and macro-benthos (Savrda et al., 1984).
In oxygenated bottom environments, asignificant percentage of the organic matter isconsumed by benthic fauna on the seafloor and byburrowing organisms in the near-surface sediment.Moreover, the activity of bottom-dwelling animalsresults in a mixing of the upper layer of sediment(bioturbation) that significantly increases the time ofexposure to decomposition processes. Furthermore,the burrowing activity maintains a circulation ofwater that replenishes the electron acceptors
(dissolved oxygen, sulphates) in the sediment pores,thus fuelling the bacterial oxidative degradation oforganic matter (Fig. 1).
These latter processes do not occur in anoxicenvironments because, as soon as molecular oxygen isno longer available, no organisms higher than bacteriacan survive (Savrda et al., 1984). Anoxic conditionsare toxic to macro- and meio-benthic fauna, includingburrowers, and this leads to the formation ofundisturbed laminated sediments in which watercirculation is strictly limited (see again Fig. 1). In suchan environment, organic preservation is enhanced bythe lack of benthic animal scavengers and by thelimited supply of electron acceptors to the sediment(Demaison and Moore, 1980). The extent of exposureto an oxygenated environment has been recognized tobe of paramount importance for the preservation oforganic matter in the sedimentary record, and isdefined as the concept of ‘oxygen exposure time’(Van Mooy et al., 2002).
However, it is important to stress that anoxia isnot a depositional environment as such, but rather theresult of an imbalance between the consumption andthe replenishment of molecular oxygen.Consumption is controlled by the oxidation oforganic matter by aerobic organisms, whilereplenishment is controlled by the efficiency of thetransfer of atmospheric oxygen, by diffusion orconvection, which is the only source of molecularoxygen, to the environment in question.
The depositional environments liable to anoxiacorrespond to high productivity areas, where theoxygen demand is high, due to the oxidation of largeamounts of organic matter in the process of burial, andsituations with restricted circulation of oxygen-richsurface water (in contact with the atmosphere) towardsthe bottom, due to geomorphologic features, such assilled basins, deep and narrow basins or waterstratification. The latter results from the occurrence ofdifferent water bodies exhibiting marked densitycontrasts (i.e. fresh water overlying denser salt water,warm water overlying denser cold water).
Upwelling systems provide an example of anoxicconditions driven by productivity. The high level oforganic production promotes the formation of anunderlying anoxic core that eventually impinges on thecontinental platform, resulting in an open shelf settingwhich is particularly favourable for source rockdeposition. In such areas, the input of large amounts ofbiosynthesized organic matter is associated with theirpreservation by anoxic bottom waters (Demaison andMoore, 1980).
Intra-cratonic silled seas, depressions oncarbonate platforms, elongated and narrow seas, aswell as deep elongated rift basins, all represent
151VOLUME I / EXPLORATION, PRODUCTION AND TRANSPORT
RELATIONS BETWEEN SEDIMENTARY BASINS AND PETROLEUM PROVINCES
productivity
euphotic zone
water depth
oxicbottom water
anoxicbottom water
Fig. 1. Schematic view of depositional environments showing the main controls on the formation of organic-richsediments: primary productivity, water depth and oxic versus anoxic bottom water.
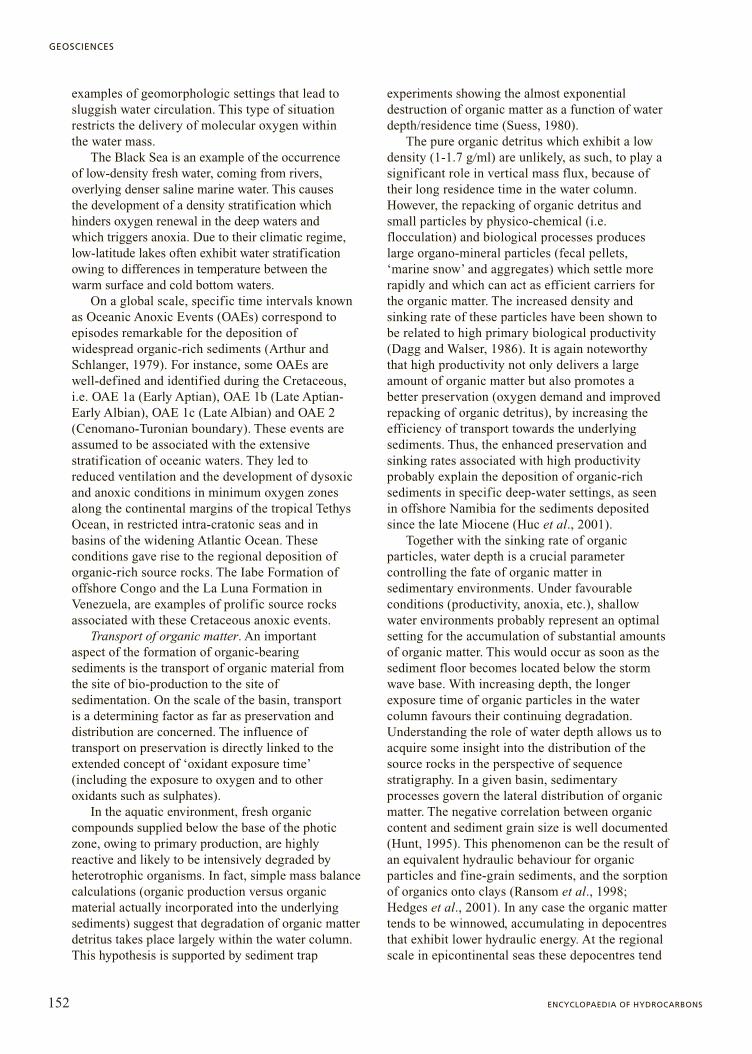
examples of geomorphologic settings that lead tosluggish water circulation. This type of situationrestricts the delivery of molecular oxygen withinthe water mass.
The Black Sea is an example of the occurrenceof low-density fresh water, coming from rivers,overlying denser saline marine water. This causesthe development of a density stratification whichhinders oxygen renewal in the deep waters andwhich triggers anoxia. Due to their climatic regime,low-latitude lakes often exhibit water stratificationowing to differences in temperature between thewarm surface and cold bottom waters.
On a global scale, specific time intervals knownas Oceanic Anoxic Events (OAEs) correspond toepisodes remarkable for the deposition ofwidespread organic-rich sediments (Arthur andSchlanger, 1979). For instance, some OAEs arewell-defined and identified during the Cretaceous,i.e. OAE 1a (Early Aptian), OAE 1b (Late Aptian-Early Albian), OAE 1c (Late Albian) and OAE 2(Cenomano-Turonian boundary). These events areassumed to be associated with the extensivestratification of oceanic waters. They led toreduced ventilation and the development of dysoxicand anoxic conditions in minimum oxygen zonesalong the continental margins of the tropical TethysOcean, in restricted intra-cratonic seas and inbasins of the widening Atlantic Ocean. Theseconditions gave rise to the regional deposition oforganic-rich source rocks. The Iabe Formation ofoffshore Congo and the La Luna Formation inVenezuela, are examples of prolific source rocksassociated with these Cretaceous anoxic events.
Transport of organic matter. An importantaspect of the formation of organic-bearingsediments is the transport of organic material fromthe site of bio-production to the site ofsedimentation. On the scale of the basin, transportis a determining factor as far as preservation anddistribution are concerned. The influence oftransport on preservation is directly linked to theextended concept of ‘oxidant exposure time’(including the exposure to oxygen and to otheroxidants such as sulphates).
In the aquatic environment, fresh organiccompounds supplied below the base of the photiczone, owing to primary production, are highlyreactive and likely to be intensively degraded byheterotrophic organisms. In fact, simple mass balancecalculations (organic production versus organicmaterial actually incorporated into the underlyingsediments) suggest that degradation of organic matterdetritus takes place largely within the water column.This hypothesis is supported by sediment trap
experiments showing the almost exponentialdestruction of organic matter as a function of waterdepth/residence time (Suess, 1980).
The pure organic detritus which exhibit a lowdensity (1-1.7 g�ml) are unlikely, as such, to play asignificant role in vertical mass flux, because oftheir long residence time in the water column.However, the repacking of organic detritus andsmall particles by physico-chemical (i.e.flocculation) and biological processes produceslarge organo-mineral particles (fecal pellets,‘marine snow’ and aggregates) which settle morerapidly and which can act as efficient carriers forthe organic matter. The increased density andsinking rate of these particles have been shown tobe related to high primary biological productivity(Dagg and Walser, 1986). It is again noteworthythat high productivity not only delivers a largeamount of organic matter but also promotes abetter preservation (oxygen demand and improvedrepacking of organic detritus), by increasing theefficiency of transport towards the underlyingsediments. Thus, the enhanced preservation andsinking rates associated with high productivityprobably explain the deposition of organic-richsediments in specific deep-water settings, as seenin offshore Namibia for the sediments depositedsince the late Miocene (Huc et al., 2001).
Together with the sinking rate of organicparticles, water depth is a crucial parametercontrolling the fate of organic matter insedimentary environments. Under favourableconditions (productivity, anoxia, etc.), shallowwater environments probably represent an optimalsetting for the accumulation of substantial amountsof organic matter. This would occur as soon as thesediment floor becomes located below the stormwave base. With increasing depth, the longerexposure time of organic particles in the watercolumn favours their continuing degradation.Understanding the role of water depth allows us toacquire some insight into the distribution of thesource rocks in the perspective of sequencestratigraphy. In a given basin, sedimentaryprocesses govern the lateral distribution of organicmatter. The negative correlation between organiccontent and sediment grain size is well documented(Hunt, 1995). This phenomenon can be the result ofan equivalent hydraulic behaviour for organicparticles and fine-grain sediments, and the sorptionof organics onto clays (Ransom et al., 1998;Hedges et al., 2001). In any case the organic mattertends to be winnowed, accumulating in depocentresthat exhibit lower hydraulic energy. At the regionalscale in epicontinental seas these depocentres tend
152 ENCYCLOPAEDIA OF HYDROCARBONS
GEOSCIENCES

to occur in the bathymetric lows of the basin,which produces a concentric pattern with aprogressive centripetal increase in the organiccontent of the sediments (Fig. 2). This ‘bull’s eye’pattern is documented in recent environments, i.e.Caspian Sea, Black Sea, Lake Bogaria in Kenya,etc., and in the sedimentary record, i.e. UpperJurassic Bazhenov Formation in Western Siberia,Lias of the Paris Basin, Oligocene of the Dongyingdepression in China, Lower Jurassic of the northernNorth Sea, etc. (Huc, 1988a).
Type of organic matterSource rocks are characterized by the nature of
the organic matter they contain. The organic mattercontained in the source rocks is the result of thefossilization of the organic remains of once-livingorganisms. According to the usual definition(Durand, 1980), kerogen is the part of this organicmatter that is insoluble in organic solvents (such aschloroform or dichloromethane). In thermallyimmature sediments, the kerogen accounts for almostall the organic matter present. The kerogen iscomposed of more or less altered organic materialdirectly derived from the biopolymers making up thetissues and products of the living precursors
(inheritance). It also contains other products of therandom polycondensation of intermediate moietiescoming from the decomposition of these biopolymers(neoformation).
As previously mentioned, the main precursors ofthese organic remains are mostly algae, bacteria andhigher plants. The relative contribution of thesedifferent precursors and their degree of alterationvary as a function of depositional environment. Thisis the principal factor controlling the properties ofthe kerogens.
Living organisms are constituted of biopolymersincluding proteins, carbohydrates (e.g. cellulose),lipids and lignin, the latter only being present in thetissues of the terrestrial higher plants. Hydrogen isthe most abundant atom in petroleum compounds,followed by carbon, with hydrocarbon moleculesthemselves being made up only from these twospecific atoms. In this respect, the most prolifickerogens in terms of petroleum generation are thosecontaining the highest concentration of hydrogen andthe least of oxygen. Most of the proteins and many ofthe carbohydrates are destroyed during the earlydiagenesis (the first tens or hundred metres ofburial). However, regarding the carbohydrates, weshould point out that cellulose is a notable exception.Cellulose is less subject to decomposition, and, tosome extent, can ‘survive’ diagenesis with relativelylittle alteration. Broadly speaking, compoundsderived from lipids (very rich in hydrogen), lignin(poor in hydrogen, due to its aromatic nature) andcellulose (rich in oxygen), and which are thereforethe most resistant, are preferentially preserved andrelatively concentrated in the resulting fossilizedorganic matter. The partly inherited and partlyneoformed kerogen are thus exhibits the more or lessaltered chemical imprint of its precursors.
Within detrital environments (i.e. deltaic), thecontribution of terrestrial higher plants implies thepreferential occurrence of ligno-cellulosic material(i.e. wood fragments, etc.), exhibiting a low H/Catomic ratio and a high content of oxygen. Thisresults in kerogens displaying a less hydrocarbon-prone character than the kerogens derived from algal(i.e. phytoplankton) or bacterial material: neithercontain lignin, algae are poorer in cellulose (mainlyoccurring in cell membranes) than higher plants, andbacteria are devoid of cellulose.
The H�C and O�C atomic ratios of kerogens areconventionally used to sort the organic matter ofsediments into three main practical and classical‘types’. These types are schematically related tothree main depositional environments (Fig. 3). Type I(H�C�1.6, O�C�0.1): lacustrine environments; TypeII (1.2�H�C�1.6, 0.1�O�C�0.2): marine
153VOLUME I / EXPLORATION, PRODUCTION AND TRANSPORT
RELATIONS BETWEEN SEDIMENTARY BASINS AND PETROLEUM PROVINCES
Novosibirsk
Ob
TOC (%)
<1
1-3
3-7
7-10
>10
0 500 km
ARCTIC OCEAN
Fig. 2. Regional distribution of organic carbon content in the Bazhenov Formation of Western Siberia (Kontorovich, 1984).
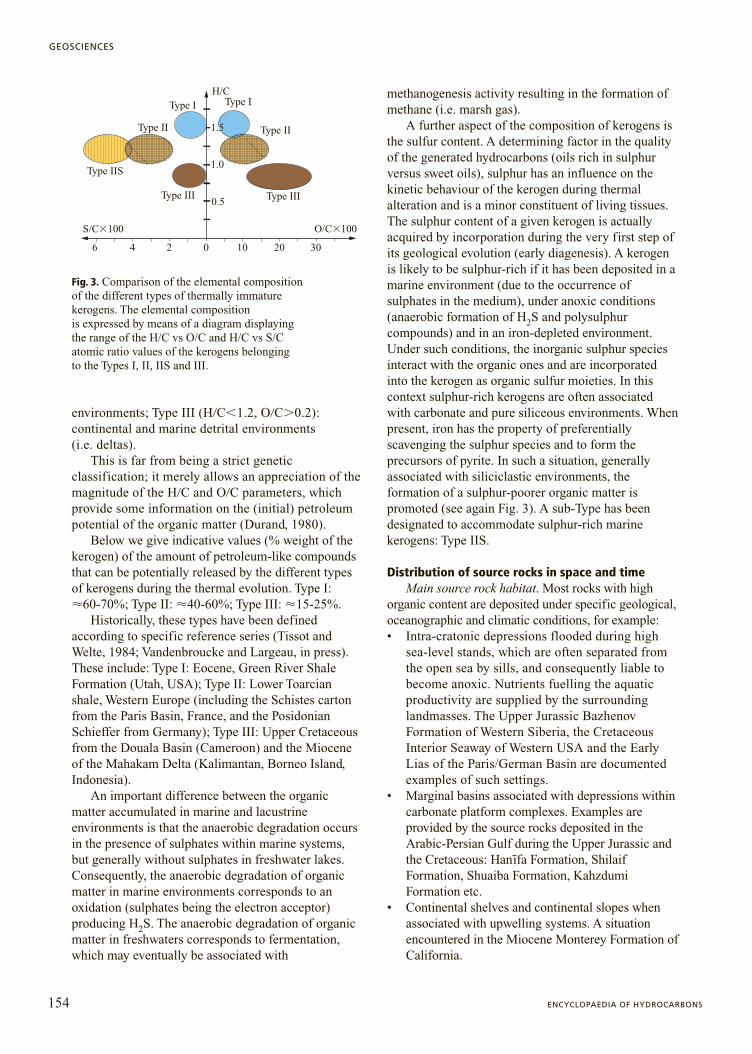
environments; Type III (H�C�1.2, O�C�0.2):continental and marine detrital environments(i.e. deltas).
This is far from being a strict geneticclassification; it merely allows an appreciation of themagnitude of the H�C and O�C parameters, whichprovide some information on the (initial) petroleumpotential of the organic matter (Durand, 1980).
Below we give indicative values (% weight of thekerogen) of the amount of petroleum-like compoundsthat can be potentially released by the different typesof kerogens during the thermal evolution. Type I: �60-70%; Type II: �40-60%; Type III: �15-25%.
Historically, these types have been definedaccording to specific reference series (Tissot andWelte, 1984; Vandenbroucke and Largeau, in press).These include: Type I: Eocene, Green River ShaleFormation (Utah, USA); Type II: Lower Toarcianshale, Western Europe (including the Schistes cartonfrom the Paris Basin, France, and the PosidonianSchieffer from Germany); Type III: Upper Cretaceousfrom the Douala Basin (Cameroon) and the Mioceneof the Mahakam Delta (Kalimantan, Borneo Island,Indonesia).
An important difference between the organicmatter accumulated in marine and lacustrineenvironments is that the anaerobic degradation occursin the presence of sulphates within marine systems,but generally without sulphates in freshwater lakes.Consequently, the anaerobic degradation of organicmatter in marine environments corresponds to anoxidation (sulphates being the electron acceptor)producing H2S. The anaerobic degradation of organicmatter in freshwaters corresponds to fermentation,which may eventually be associated with
methanogenesis activity resulting in the formation ofmethane (i.e. marsh gas).
A further aspect of the composition of kerogens isthe sulfur content. A determining factor in the qualityof the generated hydrocarbons (oils rich in sulphurversus sweet oils), sulphur has an influence on thekinetic behaviour of the kerogen during thermalalteration and is a minor constituent of living tissues.The sulphur content of a given kerogen is actuallyacquired by incorporation during the very first step ofits geological evolution (early diagenesis). A kerogenis likely to be sulphur-rich if it has been deposited in amarine environment (due to the occurrence ofsulphates in the medium), under anoxic conditions(anaerobic formation of H2S and polysulphurcompounds) and in an iron-depleted environment.Under such conditions, the inorganic sulphur speciesinteract with the organic ones and are incorporatedinto the kerogen as organic sulfur moieties. In thiscontext sulphur-rich kerogens are often associatedwith carbonate and pure siliceous environments. Whenpresent, iron has the property of preferentiallyscavenging the sulphur species and to form theprecursors of pyrite. In such a situation, generallyassociated with siliciclastic environments, theformation of a sulphur-poorer organic matter ispromoted (see again Fig. 3). A sub-Type has beendesignated to accommodate sulphur-rich marinekerogens: Type IIS.
Distribution of source rocks in space and time Main source rock habitat. Most rocks with high
organic content are deposited under specific geological,oceanographic and climatic conditions, for example:• Intra-cratonic depressions flooded during high
sea-level stands, which are often separated fromthe open sea by sills, and consequently liable tobecome anoxic. Nutrients fuelling the aquaticproductivity are supplied by the surroundinglandmasses. The Upper Jurassic BazhenovFormation of Western Siberia, the CretaceousInterior Seaway of Western USA and the EarlyLias of the Paris/German Basin are documentedexamples of such settings.
• Marginal basins associated with depressions withincarbonate platform complexes. Examples areprovided by the source rocks deposited in theArabic-Persian Gulf during the Upper Jurassic andthe Cretaceous: Hanı̄fa Formation, ShilaifFormation, Shuaiba Formation, KahzdumiFormation etc.
• Continental shelves and continental slopes whenassociated with upwelling systems. A situationencountered in the Miocene Monterey Formation ofCalifornia.
154 ENCYCLOPAEDIA OF HYDROCARBONS
GEOSCIENCES
H/C
S/C�100 O/C�100
0.5
1.0
1.5
2 046 10 20 30
Type IType I
Type IIType II
Type III Type III
Type IIS
Fig. 3. Comparison of the elemental compositionof the different types of thermally immaturekerogens. The elemental composition is expressed by means of a diagram displayingthe range of the H/C vs O/C and H/C vs S/Catomic ratio values of the kerogens belonging to the Types I, II, IIS and III.
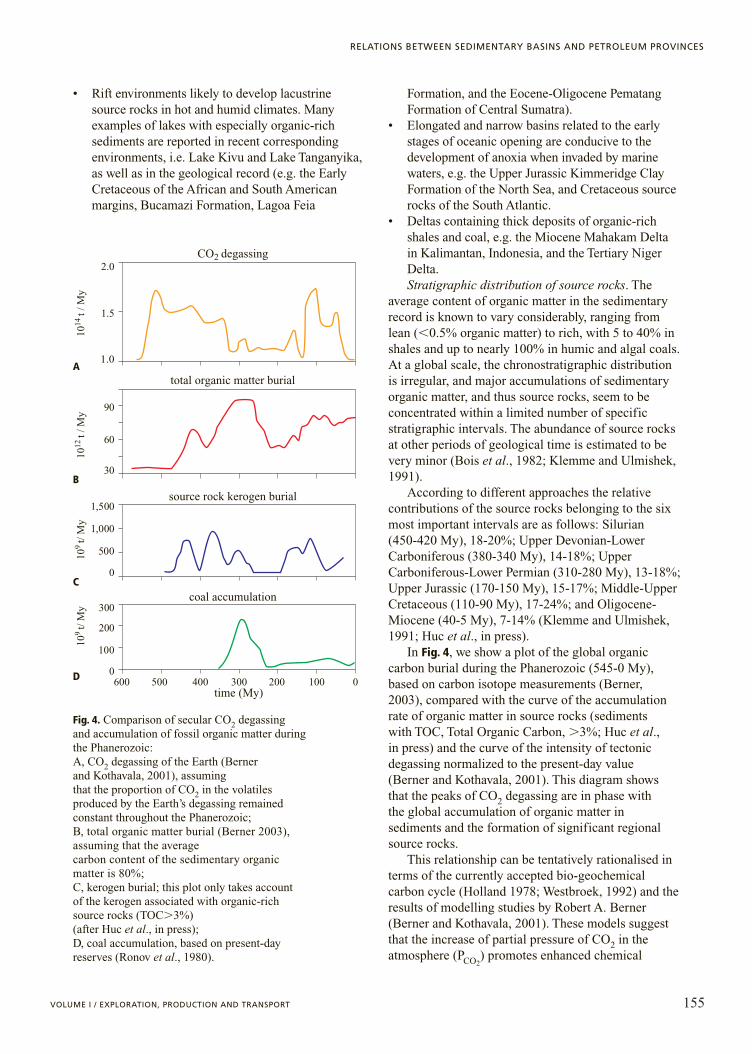
• Rift environments likely to develop lacustrinesource rocks in hot and humid climates. Manyexamples of lakes with especially organic-richsediments are reported in recent correspondingenvironments, i.e. Lake Kivu and Lake Tanganyika,as well as in the geological record (e.g. the EarlyCretaceous of the African and South Americanmargins, Bucamazi Formation, Lagoa Feia
Formation, and the Eocene-Oligocene PematangFormation of Central Sumatra).
• Elongated and narrow basins related to the earlystages of oceanic opening are conducive to thedevelopment of anoxia when invaded by marinewaters, e.g. the Upper Jurassic Kimmeridge ClayFormation of the North Sea, and Cretaceous sourcerocks of the South Atlantic.
• Deltas containing thick deposits of organic-richshales and coal, e.g. the Miocene Mahakam Deltain Kalimantan, Indonesia, and the Tertiary NigerDelta.Stratigraphic distribution of source rocks. The
average content of organic matter in the sedimentaryrecord is known to vary considerably, ranging fromlean (�0.5% organic matter) to rich, with 5 to 40% inshales and up to nearly 100% in humic and algal coals.At a global scale, the chronostratigraphic distributionis irregular, and major accumulations of sedimentaryorganic matter, and thus source rocks, seem to beconcentrated within a limited number of specificstratigraphic intervals. The abundance of source rocksat other periods of geological time is estimated to bevery minor (Bois et al., 1982; Klemme and Ulmishek,1991).
According to different approaches the relativecontributions of the source rocks belonging to the sixmost important intervals are as follows: Silurian (450-420 My), 18-20%; Upper Devonian-LowerCarboniferous (380-340 My), 14-18%; UpperCarboniferous-Lower Permian (310-280 My), 13-18%;Upper Jurassic (170-150 My), 15-17%; Middle-UpperCretaceous (110-90 My), 17-24%; and Oligocene-Miocene (40-5 My), 7-14% (Klemme and Ulmishek,1991; Huc et al., in press).
In Fig. 4, we show a plot of the global organiccarbon burial during the Phanerozoic (545-0 My),based on carbon isotope measurements (Berner,2003), compared with the curve of the accumulationrate of organic matter in source rocks (sedimentswith TOC, Total Organic Carbon, �3%; Huc et al.,in press) and the curve of the intensity of tectonicdegassing normalized to the present-day value(Berner and Kothavala, 2001). This diagram showsthat the peaks of CO2 degassing are in phase withthe global accumulation of organic matter insediments and the formation of significant regionalsource rocks.
This relationship can be tentatively rationalised interms of the currently accepted bio-geochemicalcarbon cycle (Holland 1978; Westbroek, 1992) and theresults of modelling studies by Robert A. Berner(Berner and Kothavala, 2001). These models suggestthat the increase of partial pressure of CO2 in theatmosphere (PCO2
) promotes enhanced chemical
155VOLUME I / EXPLORATION, PRODUCTION AND TRANSPORT
RELATIONS BETWEEN SEDIMENTARY BASINS AND PETROLEUM PROVINCES
90
60
30
1,500
1,000
500
0
300
200
100
0
2.0
1.5
1.0
600 500 400 300 200 100 0
109
t/ M
y10
9 t/
My
1012
t / M
y10
14 t /
My
time (My)
source rock kerogen burial
coal accumulation
total organic matter burial
CO2 degassing
Fig. 4. Comparison of secular CO2 degassing and accumulation of fossil organic matter duringthe Phanerozoic: A, CO2 degassing of the Earth (Berner and Kothavala, 2001), assuming that the proportion of CO2 in the volatilesproduced by the Earth’s degassing remainedconstant throughout the Phanerozoic; B, total organic matter burial (Berner 2003),assuming that the averagecarbon content of the sedimentary organicmatter is 80%;C, kerogen burial; this plot only takes accountof the kerogen associated with organic-richsource rocks (TOC�3%) (after Huc et al., in press); D, coal accumulation, based on present-dayreserves (Ronov et al., 1980).
A
B
C
D
weathering of rocks. This is mainly mediated by plantswhich disrupt and chemically destroy the bed rocks bythe action of their root systems and associated micro-organisms in the rhizosphere. Such micro-organismsproduce aggressive acids in order to extract nutrients,metals and oligo-elements needed for their growthfrom minerals. The chemical weathering oncontinental masses yields ionic species includingCa2�, HCO3
� and nutrients that feed into surface andground waters. The dissolved Ca2� and the HCO3
�
are transported to the sea where they are precipitatedas carbonates, mainly through biological processes.These carbonate deposits ultimately act as a sink forthe atmospheric CO2.
With the notable exception of the Silurian, it can beseen that, at the first order scale, the periods ofenhanced organic matter accumulation correspond toperiods of favoured carbonate accumulation (Ronov etal. 1980). Both phenomena lead to a naturalsequestration of CO2 during periods of increasingatmospheric CO2. The increased PCO2
induces anegative feedback phenomenon that ultimately reducesthe atmospheric CO2 by storage in the form ofcarbonates. Such deposits represent the largestreservoir of carbon in the Earth’s crust (75%), whilesedimentary organic matter accounts for the remainder(25%) (Hayes et al. 1999).
The process of photosynthesis controls theintensity of chemical weathering. As photosyntheticactivity increases, soil formation intensifies anddeepens as land plants take up their need for mineral-derived nutrients. Indeed, while these nutrients areactively recycled by land plants, they are ultimatelytransported, along with the Ca2+ and HCO3
� ions, tolakes and marine waters, thus enhancing the planktonproductivity for which nutrient availability is the mainlimiting factor (Holland 1978). Consequently,increased PCO2
levels can be considered a potentiallymajor factor in enhancing organic matteraccumulation. Keeping all other parameters constant,increasing the PCO2
is actually reported (Mellilo et al.,1993) as substantially enhancing the primaryproductivity of land plants on continents (CO2fertilisation). It also promotes chemical weatheringand increases the input of nutrients to soil, streams andeventually to the seas and oceans. As a consequence,we may tentatively propose that the secular increase ofthe atmospheric CO2 (first and second order cycles),although acting in an indirect way, is a key factor inthe deposition of source rocks within givenstratigraphic intervals on the global scale. The CO2fertilisation of the land biomass induces an acceleratedformation of deeper soils associated with enhancedchemical weathering. This increase of the nutrientspool on the global scale therefore promotes aquatic
productivity as well as the accumulation of organicmatter in sediments.
This model emphasises the role of primaryproductivity in the formation of organic-rich sedimentat the global scale and in the long term (first andsecond order cycles). At the same time, it reconcilesthe observed correlation between geological timeintervals hosting large volumes of source rocks, andepisodes of increased atmospheric CO2 due toaccelerated secular tectonic activity. However, theseperiods of increased rates of subduction,metamorphism and volcanism, that introduce CO2 intothe atmosphere, are also associated with periods ofhigh sea level. At such time, large areas of thecontinental shelf are flooded, giving rise to widespreadintra-cratonic seas that set the stage, at the globalscale, for a better preservation of the biologicallyproduced organic matter (Tissot and Welte, 1984).Moreover, most of these periods are characterised bythe extensive deposition of carbonates (see above) oncontinental shelves that often form widespreadplatforms harbouring shallow intra-shelf basins. Thesedepositional settings, including epicontinental seas andintra-shelf basins, favour the formation of depositionalenvironments in shallow, isolated or silled basinswhere water bodies are liable to develop anoxicbottom conditions due to a lack of renewal ofdissolved oxygen. Moreover, the sinking organicmatter has a reduced residence time within a watercolumn of limited thickness. Both factors imply adecreased ‘oxygen exposure time’ for theaccumulating organic matter, which enhances itschance of preservation (Van Mooy et al., 2002). Thewhole process may be referred to as CO2-inducedeutrophication.
Although organic-rich deposits, acting as sourcerocks, are well documented since the latest Proterozoic,the first appearance of widespread source rocks at theglobal scale corresponds to the rise of land plants duringthe Silurian. This observation is significant in that landplants are instrumental in soil formation and chemicalweathering. Prior to the Middle Silurian the land surfacewas probably either formed of exposed bedrock orcovered by thin microbial protosoils (Algeo et al., 2001).
When considering the distribution at the first-orderscale, there is an apparent offset between the times ofmaximum accumulation of bulk organic matter in sourcerocks, and the times of maximum occurrence of coal andType III source rocks (Ronov et al., 1980; Bois et al.,1982; Klemme and Ulmishek, 1991), as illustrated bythe change in the (coal � Type III)/total source rocksratio (Berner 2003). This pattern characterises both thePalaeozoic megacycle and the Mesozoic megacycle(see again Fig. 4, and Fig. 5). Coal and Type III sourcerock deposits are subordinate during the organic-
156 ENCYCLOPAEDIA OF HYDROCARBONS
GEOSCIENCES
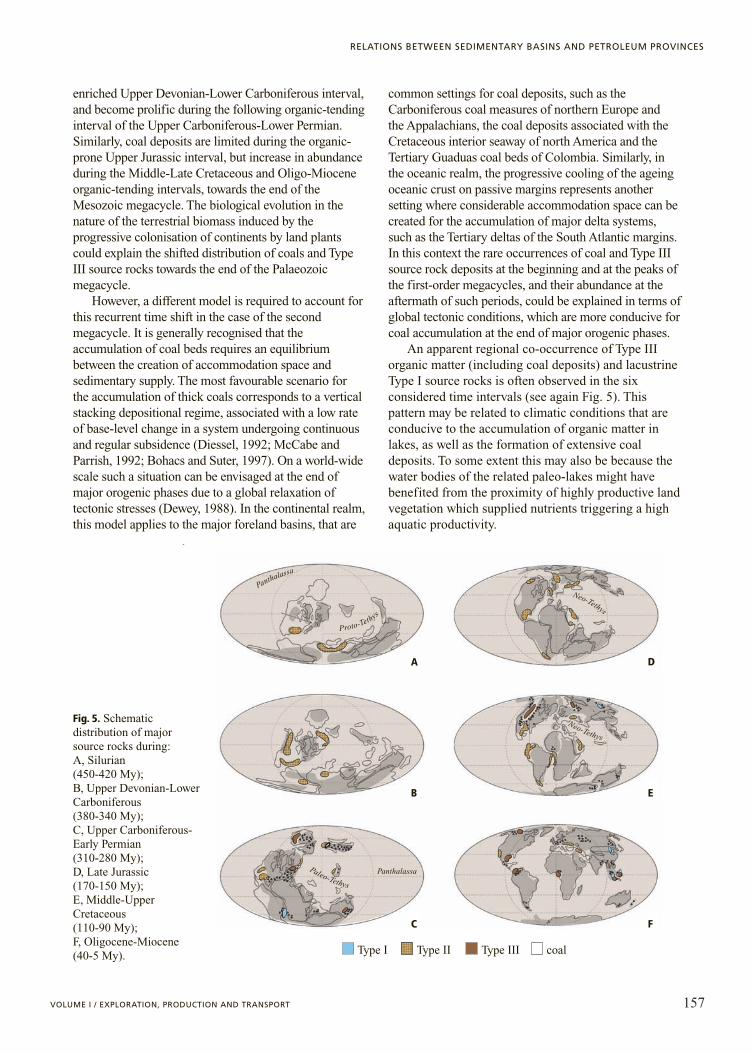
enriched Upper Devonian-Lower Carboniferous interval,and become prolific during the following organic-tendinginterval of the Upper Carboniferous-Lower Permian.Similarly, coal deposits are limited during the organic-prone Upper Jurassic interval, but increase in abundanceduring the Middle-Late Cretaceous and Oligo-Mioceneorganic-tending intervals, towards the end of theMesozoic megacycle. The biological evolution in thenature of the terrestrial biomass induced by theprogressive colonisation of continents by land plantscould explain the shifted distribution of coals and TypeIII source rocks towards the end of the Palaeozoicmegacycle.
However, a different model is required to account forthis recurrent time shift in the case of the secondmegacycle. It is generally recognised that theaccumulation of coal beds requires an equilibriumbetween the creation of accommodation space andsedimentary supply. The most favourable scenario forthe accumulation of thick coals corresponds to a verticalstacking depositional regime, associated with a low rateof base-level change in a system undergoing continuousand regular subsidence (Diessel, 1992; McCabe andParrish, 1992; Bohacs and Suter, 1997). On a world-widescale such a situation can be envisaged at the end ofmajor orogenic phases due to a global relaxation oftectonic stresses (Dewey, 1988). In the continental realm,this model applies to the major foreland basins, that are
common settings for coal deposits, such as theCarboniferous coal measures of northern Europe andthe Appalachians, the coal deposits associated with theCretaceous interior seaway of north America and theTertiary Guaduas coal beds of Colombia. Similarly, inthe oceanic realm, the progressive cooling of the ageingoceanic crust on passive margins represents anothersetting where considerable accommodation space can becreated for the accumulation of major delta systems,such as the Tertiary deltas of the South Atlantic margins.In this context the rare occurrences of coal and Type IIIsource rock deposits at the beginning and at the peaks ofthe first-order megacycles, and their abundance at theaftermath of such periods, could be explained in terms ofglobal tectonic conditions, which are more conducive forcoal accumulation at the end of major orogenic phases.
An apparent regional co-occurrence of Type IIIorganic matter (including coal deposits) and lacustrineType I source rocks is often observed in the sixconsidered time intervals (see again Fig. 5). Thispattern may be related to climatic conditions that areconducive to the accumulation of organic matter inlakes, as well as the formation of extensive coaldeposits. To some extent this may also be because thewater bodies of the related paleo-lakes might havebenefited from the proximity of highly productive landvegetation which supplied nutrients triggering a highaquatic productivity.
157VOLUME I / EXPLORATION, PRODUCTION AND TRANSPORT
RELATIONS BETWEEN SEDIMENTARY BASINS AND PETROLEUM PROVINCES
IDROCARBURI
a
b
c
d
e
f
Panthalassa
Proto-Tethys
Neo-Tethys
Neo-Tethys
PanthalassaPaleo-Tethys
Type I Type II Type III coal
Fig. 5. Schematicdistribution of majorsource rocks during: A, Silurian (450-420 My);B, Upper Devonian-LowerCarboniferous (380-340 My); C, Upper Carboniferous-Early Permian (310-280 My);D, Late Jurassic (170-150 My); E, Middle-UpperCretaceous (110-90 My); F, Oligocene-Miocene(40-5 My).
A
B
C
D
E
F

Source rocks in a sequence stratigraphyperspective. In terms of sequence stratigraphy,certain authors have noted a potential relationshipbetween the main periods of organic accumulationin the rock record and the first and second orderincrease of sea level caused by tectonic shifting(Tissot and Welte, 1984; Huc, 1991). This has ledto the proposal that the most favourablestratigraphic locations for the development ofsource rocks correspond to global downlapsurfaces (termination of basal strata with sigmoidalgeometry on an underlying surface) associated withmajor cycles of marine ingression onto thecontinents (Duval et al., 1986). This holds true forthe higher third and fourth order cycles. Theorganic-rich intervals are usually associated withthe maximum flooding surface, and more widelywith the end of the retrogradation of thedepositional systems towards the coastal areas andthe beginning of the progradation of thedepositional systems towards the open sea, as longas deposition occurs below the storm wave base(Pasley et al., 1991). This stratigraphic position iswell documented for the Kimmedridgian/Tithonianin north-western Europe, the Lias of the ParisBasin, the Paradox Formation (UpperCarboniferous) in the western United States andthe Natih Formation (Cenomanian/Turonian) ofnorthern Oman.
Such a scenario can be explained by theoccurrence or co-occurrence of various conditionswhich favour some rock sedimentation, and whichoccur during the development of depositionalsystems, including:• The occurrence of widespread intra-cratonic seas,
favoured by high sea level stand, in which a highconcentration of organic matter could be triggeredby the input of nutrients conveyed by riversdraining the chemical weathering products ofsurrounding continental surfaces, or by theintroduction of nutrients from previously exposedsoil horizons, as a result of the erosion associatedwith progressing flooding of coastal areas (Katz,1994).
• The occurrence of shallow, isolated or silledbasins that are conducive to the formation ofanoxic bottom conditions due to the lack ofrenewal of dissolved oxygen (Demaison andMoore, 1980). This also implies a water columnof limited thickness reducing the residence timefor sinking organic matter.
• The increased concentration of organic matter inthe basin mainly due to a reduced dilution withclastic/carbonate build-up trapped in marginalareas. In some cases this leads the source rocks to
be expressed as a condensed section (Creaney andPassey, 1993; van Buchem et al., in press).
ConclusionsSource rocks play a central role in the formation
of oil and gas accumulations in petroleum systems.The specific conditions of their formation, the factorscontrolling organic matter content and quality, aswell as the rationale underlying their stratigraphicand regional distribution, have been the subject of aconsiderable amount of work during the last fewdecades. The resulting concepts are now widely usedin conjunction with seismic sections (see Chapter2.3), wireline logs and data collectedin the well,through a series of analytical approaches allowing thedetermination of source rock attributes (organiccontent and type) at the sample scale. The resultingmodels can be used as a guide to assess theoccurrence, quality, thickness, stratigraphicdistribution and lateral extent of source beds insedimentary basins, and provide improved input datafor basin modelling applications (see Chapter 2.4).
References
Algeo T.J. et al. (2001) Effects of the middle to late Devonianspread of vascular land plants on weathering regimes,marine biota, and global climate, in: Gensel P.G., EdwardsD. (editors) Plants invade the land. Evolutionary andenvironmental perspectives, New York, Columbia UniversityPress, 213-236.
Arthur M.A., Schlanger S.O. (1979) Middle Cretaceous“Oceanic Anoxic Events” as casual factors in developmentof reef-reservoired giant oil fields, «American Associationof Petroleum Geologists. Bulletin», 63, 870-885.
Berner R.A. (2003) The long-term carbon cycle, fossil fuelsand atmospheric composition, «Nature», 426, 323-326.
Berner R.A., Kothavala Z. (2001) GEOCARB III. A revisedmodel of atmospheric CO2 over Phanerozoic time,«American Journal of Science», 301, 182-204.
Bohacs K., Suter J. (1997) Sequence stratigraphic distributionof coaly rocks. Fundamental controls and paralic examples,«American Association of Petroleum Geologists. Bulletin»,81, 1612-1639.
Bois C. et al. (1982) Global geologic history and distributionof hydrocarbon reserves, «American Association ofPetroleum Geologists. Bulletin», 66, 1248-1270.
Bordenave M.L. (edited by) (1993) Applied petroleumgeochemistry, Paris, Technip.
Buchem F.S.P. van et al. (in press) Stratigraphic control onthe distribution of carbonates source rocks. The 3rd, 4th and5th order scale, with special attention to the role of climateand sediment flux, in: Harris N.H., Pradier B. (editors) Thedepositon of organic rich sediments models, mechanismsand consequences, Tulsa (OK), SEPM.
Calvert S.E., Pedersen T.F. (1992) Organic accumulationand preservation in marine sediments. How important is
158 ENCYCLOPAEDIA OF HYDROCARBONS
GEOSCIENCES
anoxia?, in: Whelan J.K., Farrington J.W. (edited by) Organicmatter. Productivity, accumulation, and preservation inrecent and ancient sediments, New York, ColumbiaUniversity Press, 231-263.
Creaney S., Passey Q.R. (1993) Recurring patterns of totalorganic carbon and source rock quality within a sequencestratigraphic framework, «American Association ofPetroleum Geologists. Bulletin», 77, 386-401.
Dagg M. J., Walser W.E. (1986) The effect of foodconcentration on faecal pellet size in marine copepods,«Limnology and Oceanography», 31, 1066-1071.
De Leeuw J.W., Largeau C. (1993) A review of macromolecularcompounds that comprise living organisms and theirrole in kerogen, coal and petroleum formation, in: EngelM.H., Macko S.A. (editors) Organic geochemistry.Principles and applications, New York, Plenum Press,23-72.
Demaison G.J., Moore G.T. (1980) Anoxic environmentsand oil source bed genesis, «American Association ofPetroleum Geologists. Bulletin», 64, 1179-1209.
Dewey J.F. (1988) Extensional collapse of orogens, «Tectonics»,7, 1123-1139.
Diessel C.F.K. (1992) Coal-bearing depositional systems,Berlin-New York, Springer.
Durand B. (1980) Sedimentary organic matter and kerogen.Definition and quantitative importance of kerogen, in:Durand B. (editor) Kerogen, insoluble organic matter fromsedimentary rocks, Paris, Technip, 13-34.
Duval B. et al. (1998) Stratigraphic cycles and major marinesource rocks, in: Graciansky P.C. et al. (editors) Mesozoicand cenozoic sequence stratigraphy of European basins,Tulsa (OK), SEPM, 43-51.
Hayes J.M. et al. (1999) The abundance of 13C in marineorganic matter and isotopic fractionation in the globalbiogeochemical cycle of carbon during the past 800 Ma,«Chemical Geology», 161, 103-125.
Hedges J.I. et al. (2001) Evidence for non-selective preservationof organic matter in sinking marine particles, «Nature»,409, 801-804.
Holland H.D. (1978) The chemistry of the atmosphere andoceans, New York-Chichester, John Wiley.
Huc A.-Y. (1988a) Aspects of depositional processes of organicmatter in sedimentary basins, «Organic Geochemistry»,13, 433-443.
Huc A.-Y. (1988b) Sedimentology of organic matter, in:Frimmel F. H., Christman R. F. (editors) Humic substancesand their role in the environment. Report of the Dahlemworkshop, Berlin, 29 March-3 April, 215-243.
Huc A.-Y. (1991) Strategy for source rock identification insedimentary basins, in: Proceedings of the 13th Worldpetroleum congress, Buenos Aires, 20-25 October, v. II,85-93.
Huc A.-Y. et al. (2001) Organic sedimentation in deep offshoresettings. The Quaternary sediments approach, «Marine andPetroleum Geology», 18, 513-517.
Huc A.-Y. et al. (in press) Stratigraphic control on source rocksdistribution. First and second order scale, in: Harris N.B.,Pradier B. (editors) The deposition of organic carbon richsediments models, mechanisms and consequences, Tulsa(OK), SEPM.
Hunt J.M. (1995) Petroleum geochemistry and geology, NewYork, W.H. Freeman.
Katz B.J. (editor) (1994) Petroleum source rocks, Berlin-NewYork, Springer.
Klemme H.D., Ulmishek G.F. (1991) Effective petroleumsource rocks of the world. Stratigraphic distribution andcontrolling depositional factors, «American Associationof Petroleum Geologists. Bulletin», 75, 1809-1851.
Kontorovich A.E. (1984) Geochemical methods for thequantitative evaluation of the petroleum potential ofsedimentary basins, in: Demaison G.J., Murris R.J. (editedby) Petroleum geochemistry and basin evaluation, Tulsa(OK), American Association of Petroleum Geologists,79-110.
Largeau C. et al. (1990) Occurrence and origin of “ultralaminar”structure in “amorphous” kerogens of various source rocksand oil shales, «Organic Geochemistry», 16, 889-895.
McCabe P.J., Parrish J.T. (1992) Tectonic and climatic controlson the distribution and quality of cretaceous coals, in:McCabe P.J., Parrish J.T. (editors) Controls on thedistribution and quality of cretaceous coals, Boulder (CO),Geological Society of America, 1-15.
Magoon L.B., Dow W.G. (1994) The petroleum system. Fromsource to trap, «American Association of PetroleumGeologists. Memoir», 60.
Mellilo J.M. et al. (1993) Global climate change and terrestrialnet primary production, «Nature», 363, 234-240.
Mooy B.S.A. van (2002) Impact of suboxia on sinkingparticulate organic carbon. Enhanced carbon flux andpreferential degradation of amino acids via denitrification,«Geochimica et Cosmochimica Acta», 66, 457-465.
Pasley M.A. et al. (1991) Organic matter variations intransgressive and regressive shales, «Organic Geochemistry»,17, 483-509.
Pedersen T.F., Calvert S.E. (1990) Anoxia versusproductivity. What controls the formation of organic richsediments and sedimentary rocks?, «American Associationof Petroleum Geologists. Bulletin», 74, 454-466.
Ransom B. et al. (1998) Organic matter preservation oncontinental slopes. Importance of mineralogy and surfacearea, «Geochimica et Cosmochimica Acta», 62, 1329-1345.
Ronov A.B. et al. (1980) Quantitative analysis of phanerozoicsedimentation, «Sedimentary Geology», 25, 311-325.
Savrda C.E. et al. (1984) Development of a comprehensiveoxygen-deficient marine biofacies model. Evidence fromSanta Monica, San Pedro and Santa Barbara basins,California continental borderland, «American Associationof Petroleum Geologists. Bulletin», 68, 1179-1192.
Suess E. (1980) Particulate organic carbon flux in the ocean-surface productivity and oxygen utilization, «Nature», 288,260-263.
Tissot B.P., Welte D.H. (1984) Petroleum formation andoccurrence, Berlin-New York, Springer.
Tyson R.V. (1995) Sedimentary organic matter. Organic faciesand palynofacies, London, Chapman & Hall.
Vandenbroucke M., Largeau C. (in press) Kerogen. Origin,evolution and structure, «Organic Geochemistry».
Westbroek P. (1992) Life as a geological force. Dynamics ofthe Earth, New York, W.W. Norton.
Alain-Yves HucInstitute Français du Pétrole
Reuil-Malmaison, France
159VOLUME I / EXPLORATION, PRODUCTION AND TRANSPORT
RELATIONS BETWEEN SEDIMENTARY BASINS AND PETROLEUM PROVINCES