14 - CABI.org In Review 2014 Book Chapters.pdf · (Meloidogyne spp.) 196 Life cycle and development...
93
Selected book chapters For our annual review this year, we have made available selected chapters from CABI books in a CABI in Review 2014 eBook. The chapters have been taken from the following books (click on the book to take you directly to that chapter). Click here for more information about our work in Knowledge and Publishing 14 CABI in review
Transcript of 14 - CABI.org In Review 2014 Book Chapters.pdf · (Meloidogyne spp.) 196 Life cycle and development...

Selected book chapters For our annual review this year, we have made available selected chapters from CABI books in a CABI in Review 2014 eBook.
The chapters have been taken from the following books (click on the book to take you directly to that chapter).
Click here for more information about our work in Knowledge and Publishing
14CABIin review

This chapter is from the book:
9781780644158.pdf
ISBN: 9781780644158
v
Contents
Foreword xv
Preface xix
Acknowledgements xxiii
SECTION I SETTING THE SCENE
1 Ecosystem Services and the Concept of ‘Integrated Soil Biology Management’ 3Agriculture from an Ecological Perspective 3Biotic Interactions within the Soil Food Web 4Biological Control of Plant-parasitic Nematodes 5Sustainable Agriculture 6Soil Health 7The Rise of Conservation Agriculture 7Biological Control of Nematodes: Current Status and the Way Forward 7Integrated Soil Biology Management 9Transferring Ecological Knowledge into Practical Outcomes 10
SECTION II THE SOIL ENVIRONMENT, SOIL ECOLOGY, SOIL HEALTH AND SUSTAINABLE AGRICULTURE
2 The Soil Environment and the Soil–Root Interface 15The Process of Soil Formation and the Composition of Soil 16
The soil mineral fraction 16Soil organic matter 16
Impact of Organic Matter on Soil Properties 19Organic matter and soil physical fertility 19Organic matter and soil chemical fertility 21Organic matter and soil biological fertility 22
The Soil Environment and Its Impact on Nematodes and Other Soil Organisms 23
Physical structure 23

vi Contents
Soil water 24Aeration 25pH 26Soil temperature 27
The Soil–Root Interface 27Roots and rhizodeposits: the energy source that sustains the soil biological community 28Microbial inhabitants of the soil and rhizosphere 32Microbial colonization of the rhizosphere 34Communication within the rhizosphere 35Plant–microbe–faunal interactions in the rhizosphere 36Effects of rhizosphere inhabitants on plant growth 40Manipulating the rhizosphere community 41
Implications for Biological Control 43Impact of the soil environment 43Multitrophic interactions in a complex environment 44The soil and rhizosphere as a source of antagonists 45Establishment of biological control agents in soil and the rhizosphere 46Manipulating the soil biological community 46The role of organic matter 47
3 The Soil Food Web and the Soil Nematode Community 48Major Groups of Organisms in Soil 48
Microbiota 49Microfauna 49Mesofauna 50Macrofauna 50
Structure of the Soil Food Web 50Impact of Land Management on Energy Channels within the Soil Food Web 52Interactions within the Soil Food Web 55Regulation of Populations by Resource Supply and Predation 56Impacts of the Soil Food Web on Ecosystem Processes: Storage and Cycling of Nutrients 57The Soil Nematode Community 59
Trophic groups within the soil nematode community 59A functional guild classification for soil nematodes 62Ecological roles of free-living nematodes 62
Microbial feeding 63Microbial transport 65Nutrient cycling 65Regulation of populations 66
Plant-parasitic nematodes 67Major groups of plant-feeding nematodes and their economic impact 67Population dynamics and damage thresholds 70
Implications for Biological Control 71The role of the soil food web and the soil environment 71Major crops and nematode pests: their relevance to biological control 72Endoparasitic nematodes as a target for biological control agents 74
Sedentary endoparasites 74Migratory endoparasites 75
Features that protect plant-parasitic nematodes from parasitism and predation 76

Contents vii
4 Global Food Security, Soil Health and Sustainable Agriculture 77Global Food Security 77Sustainable Farming Systems 78
Sustainable agricultural intensification 79Reduced tillage 79Continual cropping and maintenance of a permanent cover of plant residues 79Greater plant diversity 80Improved crop yield potential 80Optimized crop nutrition 80Efficient water management 81Site-specific management 81Integrated pest management 81Integrated crop and livestock production 81
Soil Health 81Management impacts on soil health and the role of conservation agriculture 82Other management practices to improve soil health 83
Well-adapted, high-yielding varieties 83Optimal nutrient management 84Efficient water management 84Integrated pest management 85Variable-rate application and site-specific management 85Integrated crop and livestock production 85
Ecologically sound management systems: the pathway to healthy soils 86Soil-health benefits from conservation agriculture and precision farming: Australian examples 86Indicators of soil health 88
Ecological Knowledge, Biotic Interactions and Agricultural Management 90Management effects on the soil biota and the limiting role of the environment 91Provision of ecosystem services by the soil biota and the role of management 92
Integrated Soil Biology Management 93Ecologically Based Management Systems and the Role of Farmers 95Implications for Biological Control 96
SECTION III NATURAL ENEMIES OF NEMATODES
5 Nematophagous Fungi and Oomycetes 101Taxonomy, Infection Mechanisms, General Biology and Ecology 102
Nematode-trapping fungi in the order Orbiliales 102Trapping structures 102Taxonomy 103Occurrence 105General biology and ecology 106
Fungal and oomycete parasites of vermiform nematodes 106Stylopage 106Catenaria 106Nematoctonus, Hohenbuehelia and Pleurotus 108Drechmeria 108Harposporium 109Hirsutella 111

viii Contents
Nematophagous oomycetes: Myzocytiopsis, Haptoglossa, Nematophthora and Lagenidiaceae 113
Cyst and egg parasites 115Pochonia 115Purpureocillium 119Brachyphoris, Vermispora and the ARF fungus 123
Other fungi 124Fungal–Nematode Interactions in Soil 127
Saprophytic and parasitic modes of nutrition 127Factors influencing the saprophytic and parasitic activity of nematophagous fungi in soil 127
Density-dependent response as nematode populations increase 127Competition from other soil organisms for nutrients 128Competition for nitrogen in high-carbon, low-nitrogen environments 130
Nematophagous Fungi as Agents for Suppressing Nematode Populations 131Occurrence in agricultural soils 131Population density and predacious activity in soil 132The regulatory capacity of nematophagous fungi 136
Endoparasitic fungi 137Nematode-trapping fungi 138Cyst and egg parasites 139
Host specificity within the nematophagous fungi 139Interactions between nematophagous fungi and nematodes in the rhizosphere 140
Association of nematode-trapping and endoparasitic fungi with roots 141Rhizosphere competence of fungi and oomycetes capable of parasitizing nematode cysts and eggs 141
Nematophagous fungi and entomopathogenic nematodes 142Citrus root weevil, entomopathogenic nematodes and nematophagous fungi in citrus soil 143Moth larvae, entomopathogenic nematodes and nematophagous fungi in natural shrub-land soil 144
The impact of organic matter on predacious activity 146Other factors influencing predacious activity 150
Maximizing the Predacious Activity of Nematophagous Fungi in Agricultural Soils 152
6 Nematodes, Mites and Collembola as Predators of Nematodes, and the Role of Generalist Predators 157Predatory Nematodes 157
Characteristics of the five major groups of predatory nematodes 158The prey of predatory soil nematodes 159Predatory nematodes as regulatory forces in the soil food web 163Impacts of agricultural management on omnivorous nematodes and generalist predators 164
Short- and long-term effects of soil fumigation 164Negative effects of other agricultural management practices 165
Management to maintain a well-structured soil food web 167Maintaining the suppressive services provided by predatory nematodes and other generalist predators 170Predatory nematodes and inundative biocontrol 171
Microarthropods as Predators of Nematodes 171The main members of the soil mesofauna: mites, Collembola and Symphyla 171

Contents ix
Evidence of nematophagy in various groups of microarthropods 172Results from field observations, feeding studies and analyses of gut contents 172Detection of predation using stable isotope ratios and molecular techniques 174Studies of ‘fungivorous’ and ‘predatory’ arthropods in microcosms 175
Mesostigmata as predators of nematodes in agroecosystems 177Management to enhance microarthropod abundance and diversity in agricultural soils 178
Miscellaneous Predators of Nematodes 181Generalist Predators as Suppressive Agents 182Concluding Remarks 185
Generalist predators as indicators of ecological complexity and a capacity to suppress pests 185Conservation (or autonomous) biological control 186Practices associated with developing self-regulating agroecosystems 188The disconnect between agricultural scientists, soil ecologists and the farming community 188
7 Obligate Parasites of Nematodes: Viruses and Bacteria in the Genus Pasteuria 193Viral Infectious Agents of Nematodes 193Bacteria in the Genus Pasteuria 194
Distribution, host range and diversity 194Taxonomy, systematics and phylogeny 194
Pasteuria penetrans: A Parasite of Root-knot Nematodes (Meloidogyne spp.) 196
Life cycle and development 196Pathogenicity, pathogenesis and the impact of temperature 198Host specificity 199Estimating endospore numbers in soil 200The interaction between P. penetrans and its nematode host in soil 201
Endospore production and release into soil 202The impact of the physical and chemical environment on endospores, and on the spore-attachment process 202Impact of spore concentration on nematode infectivity and fecundity 204Miscellaneous factors influencing the production and survival of endospores in soil 208
The potential of P. penetrans as a biological control agent 209Pasteuria as a Parasite of Cyst Nematodes (Heterodera and Globodera spp.) 210
Taxonomy, phylogeny and host specificity 210Ecology and biological control potential 211
Candidatus Pasteuria usgae Parasitic on Sting Nematode (Belonolaimus longicaudatus) 212
Taxonomy and host specificity 212Ecology and biological control potential 213Commercial products created by in vitro culture 216
Pasteuria as a Parasite of Other Plant-parasitic and Free-living Nematodes 216Parasitism of root-lesion nematodes (Pratylenchus spp.) by Pasteuria thornei 216Parasitism of citrus nematode (Tylenchulus semipenetrans) by Pasteuria 217An isolate of Pasteuria parasitizing a reniform nematode (Rotylenchulus reniformis) 218

x Contents
Density-dependent parasitism of Xiphinema diversicaudatum by Pasteuria 218Associations between Pasteuria and other nematodes 219
Concluding Remarks 220
SECTION IV PLANT–MICROBIAL SYMBIONT–NEMATODE INTERACTIONS
8 Arbuscular Mycorrhizal Fungi, Endophytic Fungi, Bacterial Endophytes and Plant Growth-promoting Rhizobacteria 225Arbuscular Mycorrhizal Fungi 225
Benefits to plants from a symbiotic relationship with arbuscular mycorrhizal fungi 226
Enhanced nutrient uptake 226Drought tolerance 227Improved soil structure 227Disease resistance 227
Interactions between plants, arbuscular mycorrhizal fungi and plant-parasitic nematodes 228Management to enhance arbuscular mycorrhizal fungi 231
Reduced tillage 231Fallow management, cropping intensity, crop sequence and cover cropping 231Other crop and soil management practices 232
Improving soil and plant health, and managing nematodes with arbuscular mycorrhizal fungi 233
Endophytic Fungi 234Grass endophytes 235Fusarium endophytes 236
Nematode control with endophytic strains of Fusarium oxysporum 236Approaches to utilizing Fusarium-mediated resistance to plant-parasitic nematodes 238
Endophytic nematophagous fungi 239Concluding remarks on fungal endophytes: moving into uncharted waters 239
Bacterial Endophytes and Rhizosphere-inhabiting Bacteria 239Mechanisms associated with growth promotion by rhizobacteria 240
Provision of nutrients 241Production of plant growth regulators 241Suppression of soilborne pathogens 241
The impact of plant growth-promoting rhizobacteria on plant-parasitic nematodes 241Interactions between rhizosphere- and root-inhabiting bacteria and plant-parasitic nematodes 244Mechanisms by which root-associated bacteria influence plant-parasitic nematodes 245
Production of bioactive compounds 245Chitinolytic, proteolytic and lipolytic activity 246Induction of systemic resistance 248
Manipulating populations of rhizobacteria for nematode management 249Impact of crop rotation, organic amendments and other practices 249
Root-associated Symbionts: Only One Component of the Rhizosphere Microbiome 250

Contents xi
SECTION V NATURAL SUPPRESSION AND INUNDATIVE BIOLOGICAL CONTROL
9 Suppression of Nematodes and Other Soilborne Pathogens with Organic Amendments 255Organic Matter-mediated Suppressiveness for Managing Soilborne Diseases 256
Sources of organic matter for use as amendments, and their beneficial effects 256Impact of organic source and application rate on disease suppression 258Effects on pathogen populations and disease 259Variation in responses to organic inputs 259Mechanisms of action 260Indicators of broad-spectrum disease suppressiveness 260
Organic Matter-mediated Suppressiveness to Plant-parasitic Nematodes 262
Soil fertility and plant nutrition effects of organic amendments 264Nematicidal compounds from decomposing organic matter 265
Pre-formed chemicals in plant materials 265Chemicals released during the decomposition process 266The contribution of phytochemicals to the nematicidal effects of organic amendments 267Nematicidal properties of nitrogenous amendments 268
Enhancing biological control mechanisms with organic amendments 269Impact of amendments on natural enemies, particularly nematophagous fungi 269The capacity of different types of organic matter to enhance biological mechanisms of nematode suppression 271Amendments with a high C:N ratio: are they the key to more sustained suppressiveness? 273Temporal effects of amending soil with organic matter 275Incorporation of amendments versus mulching 275
The way forward: combining multiple mechanisms of action 277
10 Specific Suppression of Plant-parasitic Nematodes 280The Role of Fungi and Oomycetes in the Decline of Heterodera avenae 280Parasitism of Meloidogyne spp. on Peach by Brachyphoris oviparasitica 286Suppression of Heterodera schachtii by Brachyphoris oviparasitica and Other Fungi 287Parasitism of Mesocriconema xenoplax and Heterodera spp. by Hirsutella rhossiliensis 288Decline of Heterodera glycines and the Possible Role of Egg-parasitic Fungi 290Suppression of Root-knot Nematode by Pochonia chlamydosporia and Other Organisms 292Suppression of Heterodera glycines and Sudden Death Syndrome of Soybean 293Suppression of Root-knot Nematodes by Pasteuria penetrans 294Suppression of Heterodera glycines by Pasteuria nishizawae 297Management Options to Enhance Specific Suppressiveness 298
The role of tolerance, resistance and crop rotation 298The impact of tillage 300Integrated management to improve the efficacy of Pasteuria 300
Making Better Use of Natural Control: The Way Forward 301

xii Contents
11 Integrated Soil Biology Management: The Pathway to Enhanced Natural Suppression of Plant-parasitic Nematodes 304Assessing Soils for Suppressiveness to Plant-parasitic Nematodes 305
Survey methods to identify nematode-suppressive soils 305Bioassays for suppressiveness 306Indicators of suppressiveness 306
Modifying Farming Systems to Enhance Suppressiveness 308Organic Matter Management: The Key to General Suppressiveness 309
Management impacts on soil carbon, and flow-on effects to the soil biota 309Tillage and its impact on suppressiveness 312Using organic amendments, cover crops and mulches to enhance suppressiveness 313
Impact of Management on Specific Suppressiveness 314Integrated Nematode Management or Integrated Soil Biology Management? 315Integrated Soil Biology Management in Various Farming Systems: The Pathway to Enhanced Suppressiveness 317
Grains, oilseeds, pulses, fibre crops and pastures 318The key role of conservation agriculture 318Integration of pastures into crop-based farming systems 320Impact of management on soil biological parameters 322
Vegetable crops 324Organic amendments 325Crop rotation, cover cropping and other practices 325Integrated management 326
Perennial crops 328Enhancement of general suppressiveness 330Enhancement of specific suppressiveness 331An example of progress: nematode-suppressive soils in sugarcane 332
Organic farming systems 335Impediments to the Development and Adoption of Farming Systems that Improve Soil Health and Enhance Suppressiveness 337Sustainable Weed Management Systems for Minimum-till Agriculture: A Priority for Research 338The Way Forward: A Farming Systems Approach to Managing Nematodes 339
12 Biological Products for Nematode Management 342Experimental Methods 343General Soil Biostasis and the Fate of Introduced Organisms 344Monitoring Introduced Biological Control Agents 348Commercial Implementation of Biological Control 350Inundative Biological Control of Nematodes: An Assessment of Progress with a Diverse Range of Potentially Useful Organisms 351
Nematode-trapping fungi 351Endoparasitic fungi 358Cyst and egg parasites 360
Pochonia 360Purpureocillium 362Trichoderma 367Other fungi 368Pasteuria 370

Contents xiii
Predatory and entomopathogenic nematodes, and microarthropods 375Plant growth-promoting rhizobacteria and endophytes 377
Rhizobacteria and bacterial endophytes 377Arbuscular mycorrhizal fungi 379Fusarium endophytes 381
Combinations of Biocontrol Agents 383The Role of Organic Amendments in Enhancing the Performance of Biological Products for Nematode Control 385Inundative Biological Control as a Component of Integrated Nematode Management 386Summary and Conclusions 387
SECTION VI SUMMARY, CONCLUSIONS, PRACTICAL GUIDELINES AND FUTURE RESEARCH
13 Biological Control as a Component of Integrated Nematode Management: The Way Forward 393Ecosystem Services Provided by the Soil Biological Community, and the Key Role of Organic Matter 394Farming Systems to Improve Soil Health and Sustainability 394Will Suppressiveness be Enhanced by Modifying the Farming System? 395
The impact of plant residues, root exudates and other sources of organic matter on natural enemies of nematodes 395The role of continual cropping and increased cropping intensities 396Reducing tillage results in multiple benefits that will improve soil health and enhance suppressiveness 397
The Role of Inundative and Inoculative Biological Control 398Moving from Theory to Practice: Issues Requiring Attention 398
Assessment of suppressive services in long-term trials 399Relationships between soil carbon status, biological activity, biodiversity and general suppressiveness 400Management of specific suppressiveness 400Understanding interactions between the nematode community, natural enemies and organic matter 401Food preferences of parasites and predators in the soil environment 402Improved monitoring and diagnostic services for nematode pests and their natural enemies 403Coping with biological complexity 403Multidisciplinary research, innovation networks, research/extension models and the role of farmers 404The efficacy of inundative biological control in complex and dynamic soil environments 405
Concluding Remarks 406
14 A Practical Guide to Improving Soil Health and Enhancing Suppressiveness to Nematode Pests 408Sustainable Agriculture and its Ecological Basis 408
Biological communities and ecosystem services 408Soil biological communities 409The soil food web 409Soil physical and chemical fertility, and the role of organic matter 412

xiv Contents
Soil fertility decline and the impact of management 413Excessive tillage 413Inadequate residue management 414Excessive fertilizer and pesticide inputs 414Soil compaction 414
Sustainable farming systems 414A Guide to Improving Soil Health and Minimizing Losses from Soilborne Diseases 415
Step 1. Assess soil health 415Step 2. Assess impacts of the farming system on soil health and consider options for improvement 415Step 3. Modify soil and crop management practices and assess the outcomes 416
Biological Control of Nematodes: One of Many Important Ecosystem Services 417
Nematode-suppressive soils 418Nematode Management within Sustainable Farming Systems 420
Examples of potentially sustainable farming systems 420Large-scale production of grains, oilseeds, fibre crops and pastures 420Vegetable crops 421Perennial trees and vines 422Other crops 423
Indicators of improvement 423Potential problems and possible solutions 424Conclusions 424
Questions Related to Soil Health, Soil Organic Matter and Nematode Management 425Useful Information on Soil Health 427
References 429
Index of Soil Organisms by Genus and Species 495
General Index 501

© G.R. Stirling 2014. Biological Control of Plant-parasitic Nematodes, 2nd Edition (G.R. Stirling) 77
The decision to commence this book with a broad overview of the many issues likely to affect the development of biological controls for plant-parasitic nematodes was deliberate. The complexity of the soil environment; the diversity of agricultural production systems; and the sheer number of economic and production-related issues that must be considered by today’s food producers mean that numerous factors will impinge on any attempt to introduce alternative methods of managing nematodes. The soil environ-ment; the soil biota; the role of organic matter; the biological interactions that occur at the root–soil interface; the soil food web; and the soil nematode community were discussed in Chapters 2 and 3. This chapter aims to cover some of the agricultural issues that affect our attempts to establish reliable systems of biological control. Land managers and farmers live in the real world, and so their management options are limited by climate, the inherent properties of the soil resource, economics, market requirements and many other factors. Alternative pest control strategies will only be adopted if they are feas ible, cost-effective and consistently successful.
Global Food Security
Agriculture is a vibrant, innovative and suc-cessful industry. Despite a doubling of the global population in the last 50 years, food
production has increased to an even greater extent, markedly decreasing the proportion of malnourished people in the world. New livestock and crop production technologies have enabled food to be produced in ways that would never have been contemplated by previous generations of farmers. However, world population is expected to reach 9 bil-lion by 2050, and since steps are unlikely to be taken to regulate population growth, the level of innovation that characterized the latter part of the 20th century will have to continue unabated for many more years. Thus, the challenge facing agriculture is to meet the food requirements of a larger and more afflu-ent population in an era when food producers are experiencing greater competition for land, water and energy (Godfray et al., 2010; Gomiero et al., 2011a).
Increases in crop production derive from three main sources: expansion of arable land; increases in cropping intensity (the frequ-ency with which crops are harvested from a given area); and improvements in yield. Since the 1960s, the United Nations Food and Agriculture Organization (FAO) has shown that yield improvements made by far the greatest contribution to the increase in global food production, accounting for about 78% of the increase between 1961 and 1999. The remainder came from an expansion in the arable area (15%) and increased cropping
4
Global Food Security, Soil Health and Sustainable Agriculture
78 Chapter 4
intensity (7%) (Bruinsma, 2003). Future pro-jections suggest that this situation is unlikely to change. There will be opportunities to expand the arable area in sub-Saharan Africa and Latin America, but in developing countries overall, 80% of increased crop production will have to come from intensifi-cation, higher yields, greater levels of mul-tiple cropping and shorter fallow periods. In developed economies, where agricul-tural land is increasingly being planted to energy-producing biomass crops, virtually all the required increase in food production will come from yield improvements and intensification.
The need to produce more food on land that is already being used for food crops raises the question of whether land can be farmed more intensively without increasing the rate of soil degradation. Agricultural land is automatically degraded when nutri-ents are removed in harvested crops, but further degradation may occur through water and wind erosion, desertification, salinization and leaching of nutrients. Nevertheless, there are a number of reasons why agricultural intensification will not necessarily increase the rate of these pro-cesses: (i) evolving technologies in no-till/conservation agriculture can maintain year-round soil cover and increase soil organic matter, thereby reducing water and wind erosion while maintaining soil health; (ii) most irrigated agricultural land is rela-tively flat and is little affected by erosion, while abandonment of marginal land that is too steep for agriculture, together with prac-tices such as contour banking, will reduce water erosion; (iii) agroforestry (the integra-tion of cropping and or/livestock produc-tion with trees or shrubs) offers opportunities to reduce soil erosion, restore soil fertility and increase biodiversity; (iv) a shift towards raising livestock in more intensive systems will reduce grazing pressures on dryland pastures; (v) a range of intensifica-tion practices (increased fertilizer con-sumption, more efficient fertilizer use, the introduction of drought- and salt-tolerant crops, the use of grazing-tolerant pastures and the introduction of irrigation) will
reduce erosion by increasing plant biomass, root growth and ground cover; and (vi) the cultivation of legumes in cropping and mixed crop–livestock farming systems will add nitrogen to soils and improve their sta-bility and texture.
Attention to issues associated with soil degradation will always be an important pri-ority for land managers, but the important message from the previous paragraph is that as food production becomes more intensive, many practices are available to minimize soil degradation, and they must be compo-nents of future soil management programmes. At the same time, future farming systems will have to address the environmental impact of agriculture. Agricultural activities, particularly those resulting in emissions to air and water, can have significant effects long distances from where those activities take place. Pesticides and nutrients can move into surface and ground water, while greenhouse gases can be emitted to the atmosphere, and so steps must be taken to minimize these negative impacts. Practices such as integrated pest management; optimization of water, nutrient and pesticide inputs through pre-cision agriculture; and a whole range of practices to conserve soil and water (e.g. con-servation tillage, cover cropping, controlled traffic, contour farming and mulching) will also have to be adopted more widely by farming communities. Food production must continue to increase in the 21st century, but it will have to be done in an environmentally sustainable manner, a process that has been termed ‘sustainable intensification’ (Royal Society, 2009).
Sustainable Farming Systems
Responsible and enduring stewardship of agricultural land is the essence of sustainable agriculture: land is managed in ways that maintain its long-term productivity, resilience and vitality while minimizing adverse environ-mental impacts. Although it has been vari-ously defined (Hamblin, 1995; Lewandowski et al., 1999; Gliessman, 2007; Gold, 2007;

Global Food Security and Sustainable Agriculture 79
Pretty, 2008), sustainable agriculture is generally considered to: (i) replenish the resource base that sustains agricultural pro-duction, and then maintain it in a condition that does not compromise its use by future generations; (ii) integrate biological and ecological processes such as nutrient cycling, nitrogen fixation, soil regeneration, allellopathy, competition and the regula-tory effects of pests’ natural enemies, into food production systems; (iii) utilize eco-logical knowledge, the basics of agricul-tural science and the management skills and ingenuity of farmers to develop farm-ing systems appropriate for the soil, climate and production goals; (iv) opti-mize the use of resources and minimize the use of non-renewable inputs; and (v) mini-mize the impact of pest management, crop nutrition, irrigation and other produc-tion practices on human health and the environment.
Sustainable agriculture is not a pre-scribed set of practices. It challenges land managers to think about the long-term implications of the practices they use, and to understand the interactions that occur within and between the many components of agricultural systems. A key goal is to view agriculture from an ecological perspective and balance the requirements for productiv-ity and profitability with an understanding of nutrient and energy dynamics and the biological interactions that occur in agroeco-systems. Any new practice or technology that improves productivity for farmers but does not cause undue harm to the soil biological environment is likely to enhance sustainability.
Sustainable agricultural intensification
Sustainable agricultural intensification is essentially about increasing productivity in ways that make better use of existing resources while minimizing environmental harm. There are many pathways to agricultural sustainability, and no single configuration of technologies, inputs and management prac-tices is likely to be applicable in all situations
(Pretty, 2008). However, a number of key practices are consistently associated with sustainability (Goulding et al., 2008; Shennan, 2008; Wilkins, 2008; Kassam et al., 2009), and they are summarized next. Applied together, or in various combinations, these practices work synergistically to increase productivity and also to contribute important ecosystem services that enhance sustainability. How-ever, it is important to recognize that there is no prescriptive list of sustainable practices: farmers have many options available to them, and their management practices must be cho-sen and adapted according to local production conditions and environmental constraints.
Reduced tillage
The negative impacts of mechanical tillage on soil carbon reserves and the increased susceptibility of cultivated soil to water and wind erosion have demonstrated that farm-ing systems based on inversion tillage are not sustainable. Many options are available to reduce the depth, frequency and intensity of tillage operations, but no-till is associated with the least physical disturbance. It improves levels of soil organic matter, has profound direct and indirect effects on soil structure and aggregation, does not disrupt the soil biota, minimizes the consumption of fossil fuels and reduces labour requirements. Since a move to reduced tillage can increase compaction problems, particularly in farm-ing systems with heavy equipment and ran-dom traffic, controlled traffic systems are usually an integral component of no-till agriculture.
Continual cropping and maintenance of a permanent cover of plant residues
This component of intensification minimizes the length of fallow periods and helps to ensure that the resources provided by roots and their exudates are continually available to the soil biological community. Continual cropping (within the limits imposed by the environment) and maintenance of a protec-tive cover of organic matter on the soil sur-face mimics, to some extent, the way plants and soil interact in the natural environment.

80 Chapter 4
Roots produced by previous crops are not disturbed, while the residues produced by the primary crops and any cover crops are left on the soil surface, where they moderate tem-perature fluctuations, conserve water and nutrients, protect the soil from erosion, mini-mize weeds and promote soil biological activity. Thus, crop residues are seen as a valu able resource in a sustainable farming system, rather than something that should be burnt or removed because it is a hindrance to future production. The extent of the benefits from residue retention will depend on the quantity and quality of the residues pro-duced, and how they are manipulated.
Greater plant diversity
The practice of crop rotation plays a vital role in sustainable agriculture, as it is one of the simplest ways of minimizing losses from pests and pathogens that are often relatively crop-specific. However, there are many other options that can be used to increase bio-logical diversity within agroecosystems, and enhance system resilience and sustainability. Examples include the maintenance of natural habitats in farming areas; integration of vari-ous forms of forestry with agriculture; the use of intercrop systems in which multiple crops are grown in mixed or structured arrange-ments; the planting of hedgerows and alley crops or the introduction of banker plants to encourage predators of pests; the retention or provision of windbreaks; and the introduc-tion of legumes to fix nitrogen. In the long term, research aimed at replacing annual grain and oilseed crops with perennials (see Cox et al., 2006; Glover et al., 2007) will not only provide opportunities to increase crop diversity, but also help to make agriculture more sustainable.
Improved crop yield potential
The process of improving crops through plant breeding and genetic modification has played a major role in increasing world food produc-tion over the last 50 years. However, the effects on agricultural sustainability have been mixed. On the positive side, modern crop varieties with pest and disease resistance
prevent the world’s major food crops from being regularly decimated by rusts, mildews and a range of insect and nematode pests, and do so in such an effective manner that fungi-cides, insecticides and nematicides are not widely used on many crops. However, there are concerns that plant breeders working in high-input systems have inadvertently selected plants with poor root systems; that higher external inputs are often needed to obtain improved yields; and that genetic uni-formity and a narrowing of the genetic base may lead to decreased resilience in the face of environmental stress. Future plant-breeding programmes must, therefore, concentrate on producing well-adapted varieties that not only resist or tolerate the effects of important pests and pathogens, but also have a root structure and biomass capable of retrieving nutrients effectively. The cultivars available in future must also have a greater capacity to cope with common abiotic stresses such as heat, drought and salinity.
Optimized crop nutrition
In many modern farming systems, fertilizers and manures are applied excessively because the economic response in crop yield far out-weighs the cost of the fertilizer. Consequently, enormous quantities of fertilizer are being wasted. For example, about 50%, and some-times even more, of the synthetic nitrogen applied to crops is usually lost to the environ-ment as gaseous emissions to the atmosphere, leaching to groundwater, and runoff to sur-face waters (Tomich et al., 2011). Improved nutrient-use efficiency must, therefore, be one of the cornerstones of sustainable intensifica-tion. This is not an impossible task, as many relatively simple practices are available to optimize crop nutrition. Some of the options include the use of soil analyses to determine nutrient requirements; application of lime to maintain the appropriate pH for optimum nutrient supply; use of leaf and sap analysis to match nutrient applications to the crop’s requirements; inclusion of organic soil amend-ments in the nutrition programme; use of controlled-release fertilizers or nitrogenous products containing nitrification inhibitors; and the introduction of legumes to provide

Global Food Security and Sustainable Agriculture 81
biologically fixed nitrogen. Ultimately, how-ever, sustainable nutrient management must also take into account the nutrients immobi-lized and mineralized by the soil biota. Inter-actions between soil organisms and organic matter govern nutrient availability to plants, and greater efforts must be made at a research level to reliably predict the outcome of these interactions, so that nutrient applications can be adjusted accordingly.
Efficient water management
Although only about 18% of the world’s cropped land is irrigated, this land is vitally important, as it produces about 45% of the global food supply (Morison et al., 2008). However, irrigation water will always be a scarce resource due to the competing dem-ands of agriculture and industry, and the requirements for human consumption. From an agricultural perspective, misuse of irriga-tion water results in soil health and environ-mental problems, while current and future water supplies will be depleted if irrigation use outpaces recharge rates. Thus, efficient water management is the key to sustainable irrigated agriculture. It can be achieved by improving irrigation infrastructure; by reducing evaporative losses; and by matching water inputs to the crop’s requirements through the use of technologies that monitor soil moisture, environmental conditions and plant growth.
Site-specific management
Precision farming or site-specific manage-ment involves observing, measuring and then responding to intra-field variability so that agronomic practices and resource alloca-tion are matched to soil and crop require-ments. Nutrients, pesticides and other inputs are applied differentially using predefined maps based on soil or crop condition, or with sensors that control application as machinery traverses the field (Srinivasan, 2006). The capacity of precision agriculture to vary inputs based on variability in soil properties (e.g. soil texture, water-holding capacity, organic matter status), or biological factors (e.g. weed populations, insect populations,
disease occurrence, crop growth, harvestable yield) offers the potential to improve sustain-ability by maintaining or enhancing crop yields while reducing some of the environ-mental problems associated with nutrient and pest management.
Integrated pest management
Integrated pest management has been defined in various ways (Stirling, 1999), but is essen-tially about using our knowledge of pest and plant biology to prevent pests from causing economic damage. Pest populations are moni-tored; damage thresholds are determined; the impact of environmental factors on interactions between the pest and the plant are understood; a wide range of techniques (e.g. genetically resistant hosts, environmental modifications and biological control agents) are used to reduce pest populations to tolerable levels; and pesticides are only used as a last resort. IPM systems that reflect this philosophy will enhance sustai nability because they are based on sound ecological principles.
Integrated crop and livestock production
One factor that impacts negatively on the sus-tainability of modern agriculture, particularly in developed countries, is the trend towards farm-level specialization. Crop production is becoming more specialized and crop and live-stock enterprises are often separated, despite the clear soil health and environmental bene-fits associated with mixed crop–livestock sys-tems. Farm livestock excrete some 50–95% of the nutrients they consume, and from an efficiency and sustainability perspective, there is a strong case for better integration of crop and livestock production, both at the individ-ual farm and regional level (Wilkins, 2008; Kirkegaard et al., 2010).
Soil Health
The quality or health of the soils used to pro-duce crops and livestock is intimately linked to the issue of sustainable agriculture. Although some minor crops are grown hydroponically – and commercial facilities may be established
82 Chapter 4
to produce livestock, poultry and fish – food production is largely dependent on the thin layer of soil that covers the earth’s surface. This non-renewable resource has a number of ecologically important functions: providing a suitable medium for plant growth; sustain-ing biological processes responsible for decom-posing organic matter; cycling nutrients; maintaining soil structure; regulating pest populations; and detoxifying hazardous com-pounds (Powlson et al., 2011a). It is important from an agricultural production, environ-mental and sustainability perspective that those functions are maintained indefinitely.
Although it is widely recognized that maintaining healthy soil is a vital component of sustainable agriculture (Doran et al., 1994; 1996; Lal and Stewart, 1995; Doran and Safley, 1997; Rapport et al., 1997; Gregorich and Carter, 1997; Kibblewhite et al., 2008), the term ‘soil health’ has been the subject of fierce debate in the scientific literature (Sojka and Upchurch, 1999; Karlen et al., 2001; 2003a,b; Letey et al., 2003; Sojka et al., 2003). First, argu-ments abound as to how soil health should be defined and whether ‘soil quality’ is a more appropriate term. Second, it has been particu-larly difficult to find a definition of soil qual-ity/soil health that satisfies everyone, because soil performs multiple functions simultane-ously. Thus, high soil quality for one function (e.g. crop production) does not guarantee high quality for another function (e.g. envir-onmental protection), and vice versa. Third, attempts to develop soil-quality indices have been criticized on the basis that the process does nothing more than provide a highly generalized and non-specific assessment of the overall worth, value or condition of a soil. One of the major concerns is that assess-ment tools do not objectively and simultane-ously consider both the potential positive and negative impacts of all indicators on pro-duction, sustainability and the environment. Thus, some highly valued parameters such as levels of soil organic matter and numbers of earthworms are almost always viewed posi-tively, even though an increase in these parameters may sometimes result in negative outcomes. Finally, there are differences between those who evaluate soil health or quality on the basis of biodiversity, bioactivity or some other
attribute believed to be reflective of ‘natural’ benchmark conditions, and those who argue that production agriculture is not a natural system, and that the debate should be about how soils are managed to achieve the required production and environmental outcomes.
The terms ‘soil health’ and ‘soil quality’ are often used synonymously, but the former term is used here because most farmers have at least some understanding of the concept. Soil is healthy if it is fit for a purpose, which in the case of agriculture is the production of a particular crop. However, agricultural land is a component of a larger ecosystem, so it must also provide functions that prevent degradation of neigh-bouring environments. The definition used by Kibblewhite et al. (2008) encompasses both of these important functions:
a healthy agricultural soil is one that is capable of supporting the production of food and fibre, to a level and with a quality that is sufficient to meet human requirements, together with continued delivery of other ecosystem services that are essential for maintenance of the quality of life for humans and the conservation of biodiversity.
Management impacts on soil health and the role of conservation agriculture
Farmers and land managers are well aware of the many constraints that affect the produc-tivity of the soils used for agriculture. Those constraints are too numerous to discuss here, but include soil compaction; poor structure; surface crusting; limited water infiltration; excessive leaching of nutrients; susceptibility to erosion; high weed pressure; poor nutrient retention; low water-holding capacity; nutri-ent deficiencies; sub-optimal pH; excessive salinity; low biological activity; limited bio-logical diversity; and high levels of soilborne pathogens. Although most soils have only some of these problems, no soil could ever be considered completely healthy from a pro-duction perspective, while environmental issues such as off-site movement of nutrients and pesticides, and greenhouse gas emissions, are universal problems. Thus, one of the most important roles of a farm manager is to identify and prioritize the main factors

Global Food Security and Sustainable Agriculture 83
causing soil-related problems, and then attempt to improve the health of the soil through management.
In a complex system such as soil where many factors interact, the most robust ap -proach to soil health problems is to consider how a farming system could be modified to rectify existing problems and prevent them from recurring. For example, poor soil health is often associated with low levels of soil organic matter, and so tackling that issue in particular can lead to improvements in a whole range of soil physical, chemical and biological properties. Thus, the practices previously identified as the keys to sustainable agricul-ture are also the keys to improving soil health.
The three most important soil improve-ment practices (minimal soil disturbance, permanent plant residue cover and crop rota-tion) form the basis of conservation agricul-ture (Baker et al., 2006; Hobbs et al., 2008; Kassam et al., 2009), a relatively recent agri-cultural management system that has been adopted widely in some parts of the world, particularly North America, Latin America and Australia. Conservation tillage (variously described as minimum tillage, reduced till-age, no-till or direct drill) and retention of crop residues are the primary components of con-servation agriculture, and when used together, these practices reduce soil erosion and slow or reverse the precipitous decline in soil organic matter that has occurred in conven-tionally tilled agricultural soils over the last 100 years (Reeves, 1997; Uri, 1999; Paustian et al., 2000; Franzluebbers, 2004). When com-bined with diversified crop rotations that include cover crops, mulch-producing crops and nitrogen-fixing legumes, many soil prop-erties are affected (Table 4.1), soil health generally improves, and suppressiveness to root pat ho gens is often enhanced (Sturz et al., 1997). However, as pointed out by many authors, including Blevins and Frye (1993) and Sojka et al. (2003), there are situations where the effects of conservation agriculture and increased levels of soil organic matter are not always positive. Examples include the imp-act of mulch cover on soil temperature, which can im p r ove crop growth in a hot climate but slow early emergence and growth in temperate regions; decreased availability of plant-available
nitrogen due to immobilization; exacerbation of diseases caused by pathogens that survive on crop residues; difficulties associated with managing some weeds in the absence of till-age; herbicide carryover and runoff; the potential for weed populations to become resistant to herbicides; and the impact of soil organic matter and earthworm burrowing on porosity and macropore formation, which can increase the risk of nutrients and pesticides becoming groundwater contaminants.
The individual economic, soil health and other benefits listed in Table 4.1 will not be obtained in every situation, but collec-tively these benefits provide compelling rea-sons for farmers to minimize tillage and incorporate residue retention and crop rota-tion into their farming systems. However, perhaps the most persuasive reason for adopting the soil and crop management prac-tices associated with conservation agriculture is that they enhance soil organic carbon pools, thereby reducing atmospheric CO2 emissions associated with climate change (Powlson et al., 2011b). Continuous surface cover and the increase in water-holding capacity associ-ated with higher levels of soil organic matter also help mitigate the effects of any change in climate by increasing the tolerance of crops to higher temperatures and drought conditions (Lal, 2009: Lal et al., 2011).
Other management practices to improve soil health
Although integrating conservation tillage, residue retention and crop rotation is the first step towards greater sustainability and improved soil health, further incremental improvements can be obtained by adopting a range of other practices.
Well-adapted, high-yielding varieties
Genome sequencing, DNA marker technolo-gies, and phenotype analysis are just some of the many tools currently being used by plant breeders to improve the resistance of crops to pests and diseases, and to increase their tolerance to abiotic stresses. The addi-tional biomass produced by higher-yielding

84 Chapter 4
crops should result in soil organic matter gains that will improve the health of agri-cultural soils. Well-adapted, disease-resistant varieties could also help to reduce the off-site impacts of agriculture, provided they have root systems that utilize applied nutrients more effectively than their susceptible counterparts.
Optimal nutrient management
In soils used for agriculture, nutrient levels must be maintained by replacing the nutri-ents removed in the harvested product. However, whenever industrially produced fertilizers and their organic alternatives are applied excessively, the nutrients they con-tain will either become environmental pol-lutants or be detrimental to some components of the soil biota. Thus, high nutrient-use effi-ciency is an important component of main-taining soil fertility, but is also essential for minimizing off-site impacts.
Efficient water management
The soil health and environmental problems associated with irrigation are widely recog-nized. Water tables rise when irrigation water is applied; salinity is a constant threat to irri-gated agriculture; excessive inputs of water cause waterlogging and drainage problems; and salts, nutrients, herbicides and pesti-cides that are leached through the soil pro-file or transported by overland water flow will reduce the quality of downstream water. However, it is possible to avoid these nega-tive impacts. Trickle irrigation; precision land levelling to improve surface irrigation; and monitoring soil water at multiple depths in the profile and then using the data to match irrigation inputs to plant uptake are just some of the practices that will markedly reduce deep percolation losses to groundwater. Deficit irrigation and partial root-zone drying are other management techniques that can be
Table 4.1. The effects of the principal components of conservation agriculture on soil health and sustainability.
Effect
Component
Mulch cover (crop residues, cover crops,
green manures)
No tillage (minimal or
no soil disturbance)
Crop rotation (includes legumes
for nitrogen fixation)
Maintains a permanent residue cover on the soil surface + + +Reduces evaporative loss from upper soil layers + +Maintains the natural stratification of the soil profile + +Minimizes oxidation of soil organic matter +Sequesters carbon and minimizes CO2 loss + + +Minimizes compaction by intense rainfall +Minimizes temperature fluctuations at the soil surface +Maintains a supply of organic matter for the soil biota + + +Increases and maintains nitrogen levels in the root zone + + +Increases cation exchange capacity + + +Maximizes rainfall infiltration and minimizes runoff + +Minimizes erosion losses from water and wind + +Increases water-holding capacity + +Minimizes weeds + +Increases the rate of biomass production + + +Speeds the recuperation in soil porosity by the soil biota + + +Rebuilds damaged soil conditions and dynamics + + +Recycles nutrients + + +Reduces pests and diseases +Reduces labour input +Reduces fuel-energy input +
Modified from Kassam et al. (2009).

Global Food Security and Sustainable Agriculture 85
used to improve water use efficiency and minimize the off-site impacts of irrigation (Loveys et al., 2004; Morison et al., 2008).
Integrated pest management
Although IPM is widely promoted as a pest and disease-control strategy, the rates of adoption and the tactics employed vary considerably from industry to industry and from one pest to another. In some crops, pest populations are monitored and crop losses are minimized by integrating various cultural and biological controls, while in others, IPM involves little more than pesti-cide management. In situations where insecticides and fungicides are included in IPM programmes for above-ground pests, the possibility that residues could impact negatively on the soil biological community is rarely considered. Thus, the ultimate land management objective should be to develop a fully integrated system of man-aging the soil, the crops, and all pests and diseases. The IPM component would ide-ally be effective enough to control the key pests with minimal need for pesticides, while the crop and soil management com-ponent would aim to generate a healthy, biologically active soil capable of degrad-ing any pesticide that might be required, thereby preventing it from becoming an environmental contaminant.
Variable-rate application and site-specific management
Intra- and inter-field variability in soil prop-erties such as texture, depth, nutrient con-tent and disease levels are the norm in an agricultural landscape. Variable-rate appli-cation techniques associated with precision agriculture provide the tools to optimize management in such situations. Soil varia-bility across a field is mapped, a satellite positioning system (e.g. GPS) determines the location of farm equipment within the field, and variable-rate applicators can then apply fertilizers, pesticides and biological products in amounts that are appropriate for the crop’s needs in a given location. In the same way, optical sensors are used to
detect weeds and ensure that chemical or non-chemical weed controls are applied only where they are needed. Thus, variable-rate application minimizes the environmen-tal footprint of farming, reduces costs and ensures that soil is not degraded by exces-sive external inputs.
A range of soil sensors is available in pre-cision agriculture to measure various soil physical and chemical properties (Adamchuck et al., 2004), while geo-referenced soil sam-ples are widely used to determine nutrient requirements in fields that may vary in soil type, topography, cropping history or previ-ous fertilizer inputs. Such samples can also be used to obtain an accurate base map of organic matter status. Although such infor-mation is a useful starting point for mana g-ing the soil biological community in a site-specific manner, the ultimate research objective should be to provide growers with data on the spatial and temporal variability of key soilborne pests and their natural en -emies. High-throughput molecular methods of enumerating soil organisms are currently too expensive to be used in diagnostic services, but since this will change with improve-ments in sequencing methods and advances in bioinformatics, it will eventually be pos-sible to integrate molecular diagnostics with the technologies available in precision agriculture.
Integrated crop and livestock production
The permanent nature of pastures and the continual presence of perennial plant species mean that soils under pasture are generally healthier than cropped soils. Pasture-based crop and livestock production systems (e.g. mixed farming systems and zero-grazing cut-and-carry systems) also require fewer external nutrient inputs than systems dominated by crop-ping, and so they tend to be more sustainable (Wilkins, 2008). Also, in landscapes that are subject to dryland salinity, the inclusion of deep-rooted perennials such as lucerne in a cropping rotation reduces deep drainage and prevents salinization (Bellotti, 2001). Thus, from soil health and sustainability perspec-tives, it makes sense to integrate livestock production and cropping.

86 Chapter 4
Ecologically sound management systems: the pathway to healthy soils
The ultimate challenge of agricultural land management is to integrate the best available practices into a farming system that is not only productive and profitable, but also sustains the soil’s productive capacity. The actual farming system that is chosen will depend on climatic factors, the basic proper-ties of the soil being farmed, the resources available to implement change, and the com-modity being produced. However, there is little doubt that major improvements are possible in all the world’s current farming systems. The fact that the principles of con-servation agriculture are being incorporated into a diverse range of farming systems in developed and developing countries around the world (Hobbs et al., 2008; Kassam et al., 2009) is testimony to the fact that progress is being made.
Soil-health benefits from conservation agriculture and precision farming:
Australian examples
Conservation agriculture is widely practised in five countries: the United States, Brazil, Argentina, Canada and Australia, but the Australian situation is of particular interest. Australia has the poorest soils and one of the most variable climates in the world, and its successes with conservation agriculture sug-gest that the principles involved could be adopted by farmers producing almost any crop, in most regions of the world. Australia’s major crops are grains (wheat and other cer-eals, pulses and oilseeds) and sugarcane, and the practices now used to produce those crops, and their impact on productivity and soil health, are summarized next. Further detail on grain-cropping systems can be obtained from various chapters in Tow et al. (2011); the sugarcane farming system is dis-cussed by Garside et al. (2005); while issues associated with soil health and the soil biota are reviewed by Bell et al. (2007), Stirling (2008), Gupta and Knox (2010) and Gupta et al. (2011).
In Australia, grain is grown in a wide variety of climatic zones (dry subtropics to cool temperate and Mediterranean climates) and on vastly differing soil types (from heavy clays to coarse sands), and crops are almost always produced under rainfed conditions. Rainfall is generally low and highly variable, with most cropping regions receiving between 250 and 600 mm of rain per year. However, despite the limitations of soil and climate and the absence of government subsi-dies, Australian agriculture has achieved greater productivity growth than most other agricultural economies over the last 30 years (Mullen, 2007). This success has largely been achieved through the widespread adoption of conservation agriculture. Although manage-ment practices vary at a regional and local level, most leading farmers have made the change to no-till agriculture; crops are sown using equipment that incorporates improved disc-seeding technologies; in-field traffic is controlled using GPS guidance; rotational cropping or pasture leys are included in the farming system; legume crops provide nitrogen inputs; crop residues are retained on the soil surface; scanning technologies and variable-rate injection systems are used to optimize chemical application; optical-sensing devices ensure that herbicides are applied on weeds rather than on bare soil; while in-vehicle, aerial or remote sensing systems are available to provide information on environmental fac-tors such as temperature and humidity, and the health status of the crop.
From the perspective of soil health, the introduction of these practices has gener-ally had a positive effect. The move towards reduced-till and direct-drill systems, with associated stubble retention and traffic con-trol, has improved most measures of physical structure (e.g. aggregate stability, the pres-ence of stable macropores and shear strength) and also reduced compaction, thereby revers-ing the negative effects of conventional tillage on soil physical properties. Soil organic car-bon levels have generally improved, particu-larly in the upper 10 cm of the profile, although studies in some environments have shown no significant change. The develop-ment of biologically mediated suppression of two of the most important soilborne diseases

Global Food Security and Sustainable Agriculture 87
of wheat (Rhizoctonia bare patch and take-all) has also been observed in long-term experiments and some commercial fields (Roget, 1995; Roget et al., 1999; Pankhurst et al., 2002; Gupta et al., 2011) and is associated with a build-up of organic carbon and micro-bial biomass under direct-drilling with stub-ble retention (Pankhurst et al., 2002). There is also evidence that soil in the upper 25 cm of the soil profile is suppressive to root lesion nematode, Pratylenchus thornei, a major con-straint to production in subtropical grain-growing areas (Stirling, 2011b). Another important soil-health benefit has been an increase in the capacity of soils to infiltrate and store water, and an improvement in the ability of roots to extract water from the soil (Turner, 2004). Therefore, crops are much more likely to reach their water-limited yield potential, with concomitant effects on pro-ductivity and the amount of organic matter returned to soil. Because there have also been negative effects in some situations (e.g. slower early-season growth under direct drill, nutri-ent stratification in surface soils and increases in diseases such as crown rot where patho-gen inoculum survives on stubble), ongoing research and constant fine-tuning by farmers is required to continually improve and fully optimize the new system.
The Australian sugar industry is vastly different from the grains industry. Farms are much smaller (commonly 40–200 ha), the crop is grown largely as a monoculture, and inputs of fertilizer and pesticides are much higher. Also, the industry’s location in the tropics and subtropics means that water is not a limitation: between 1200 and 4200 mm of rain is received each year, and in the drier areas, rainfall is supplemented by irrigation.
In the early 1990s, the Australian sugar industry was facing an uncertain future because productivity was declining due to a problem known as yield decline. At that time, sugarcane was grown on beds 1.5 m apart, machinery wheel spacing did not match crop row spacing, and the crop residues remaining after harvest were often burnt. After a plant and 3–4 ratoon crops, an expensive pro-gramme of ripping and cultivation was required to remove the old crop, alleviate compaction caused by farm machinery and
then replant the field to sugarcane. A multi-disciplinary research team was established to develop solutions to the problem, and its ini-tial studies showed that soils under long-term sugarcane monoculture were physically and chemically degraded. Results of later experi-ments indicated that biological constraints were also limiting productivity, as large yield responses were obtained when soil fumi-gants, fungicides and nematicides were applied; or pasture, another crop species, or bare fallow were included in the rotation (Garside and Bell, 2011a, b). Ultimately, the 12-year research programme (summarized by Garside et al., 2005; Stirling, 2008) resulted in the development of a new farming system based on permanent raised beds, residue retention, minimum tillage, a leguminous rotation crop and controlled traffic using GPS guidance. This system is now being adopted by growers because it increases sugar yields, reduces costs and provides additional income from rotation crops such as soybean and peanut.
Although economic considerations (lower fuel and labour costs, and the replacement of fertilizer nitrogen with biologically fixed nitrogen from legumes) motivated growers to adopt the new sugarcane farming system, improvements in soil health were the main reason that yield increases of 20–30% were consistently obtained. Random trafficking of fields, often in wet conditions, by the heavy machinery used to plant, harvest and trans-port the crop meant that soil compaction was a major problem in the previous farm-ing system. Soil physical properties improved markedly when beds were widened to accom-modate controlled traffic. The introduction of a rotation crop reduced populations of fun-gal and nematode pathogens that were con-straining crop production. A reduction in till-age increased earthworm populations, with consequential effects on macroporosity and water infiltration rates. In rainfed situations, improved water capture in periods of low rainfall contributed to yield increases, while improved percolation through macropores and retention of surface cover protected soils from erosion during intense tropical storms. There have also been signs of improvement in some chemical, biochemical and biological

88 Chapter 4
properties associated with soil health (Stirling et al., 2010), and surface soils are now sup-pressive to Pratylenchus zeae, the main nematode pest of sugarcane (see Chapter 11 for details). Further improvements are expec-ted to occur over time, but it is likely to take at least 15 years to fully realize the ben-efits from the new farming system (Stirling et al., 2010, 2011b).
In summary, these Australian examples show that: (i) the principles of conservation agriculture are applicable in diverse envir-onments and quite different farming sys-tems; (ii) major changes in farming systems can be made relatively quickly in an envir-onment where there is a strong level of agronomic research and good communica-tion between scientists, extension personnel and farmers; and (iii) the economic and other benefits of conservation agriculture (e.g. reduced labour costs, much lower energy inputs, improved timeliness of oper-ations and greater profitability) are so com-pelling that growers are generally willing to consider making changes to their farming system.
Although minimum tillage, residue retention and crop rotation interact together to improve a whole range of physical, chem-ical and biological properties associated with soil health, this does not mean that farming systems based on these practices are problem- free. Numerous issues are the subject of con-tinuing research (e.g. nutrient stratification; management of herbicide-resistant weeds; overcoming soil structural problems during the transition to minimum till; alternative crops for inclusion in rotations), while grow-ers may need to modify some management practices to fit the soil and climatic conditions on their farms. It is also recognized that soil organisms are a major determinant of a soil’s productive capacity, and that further research is needed to fully harness the biological potential of soil.
Indicators of soil health
Soil health cannot be measured directly, because a soil’s capacity to produce crops and also safeguard the environment is determined
by numerous physical, chemical and bio-logical properties, and the way they interact. However, the literature is replete with lists of measurable properties that collectively provide a broad indication of the health of a soil, and can be used to assess the impact of soil management practices on soil health (e.g. Doran and Parkin, 1994; Pankhurst et al., 1997). A variety of physical, chemical and biological parameters are usually measured during the soil-health assess-ment process (e.g. Idowu et al., 2009) and a subset of these indicators is then used to compile a relatively simple report that is designed to help growers make manage-ment decisions (e.g. Gugino et al., 2009). Although such reports are useful, the prac-ticality of measuring numerous parameters is often questioned, as certain parameters (e.g. total carbon and labile carbon) are often closely correlated with the physical and chemical properties assessed in soil-health tests.
Although it is recognized that most soil properties are ultimately determined by interactions between soil organic matter and the soil biota, biological measurements are rarely included in soil-health tests, as levels of organic matter and active carbon are often used as surrogates for biological activity and diversity. Hundreds of ‘poten-tially useful’ biological indicators have been proposed, but in many cases they sim-ply reflect the discipline bias of the propo-nent. Also, most do not meet the criteria proposed by Doran and Zeiss (2000) as being required for any biological parameter that is to be used as an indicator of soil health: (i) sensitivity to variations in man-agement; (ii) well-correlated with beneficial soil functions; (iii) useful for elucidating ecosystem processes; (iv) comprehensible and useful to land managers; and (v) easy and inexpensive to measure. This prompted Ritz et al. (2009) to look for biological indica-tors that not only provided information on important soil functions, but were also suit-able for use in national-scale soil-monitoring programmes. A list of top-ranked indica-tors was developed (Box 4.1), but at the end of the process, the authors recognized that many of the selected indicators did not

Global Food Security and Sustainable Agriculture 89
Box 4.1. Biological indicators for use in monitoring soil health or quality
Ritz et al. (2009) ranked the plethora of biological methods that have been suggested for monitoring soil quality and produced a list of 21 biological indicators that were considered ecologically relevant. However, four of these could not be deployed in national-scale monitoring schemes, as further methodo-logical development was required. The remaining indicators have been consolidated into eight groups, and the authors’ comments on each of these groups are outlined as follows.
Soil microbial taxa and community structure using molecular techniques
Recent advances in molecular technologies have provided a range of methods that can be used to monitor various components of the soil biological community. Although terminal restriction length polymorphism (TRFLP) analysis has been used widely, the advent of faster, cheaper and higher- resolution sequencing technologies is providing many other options. Molecular methods are useful because high throughput is possible; information on biodiversity is obtained; results can be related to function; and DNA can be archived. However, further work is required to identify the most suitable primers, and to optimize the polymerase chain reaction (PCR), restriction and fingerprinting steps for particular groups of organisms. Also, these methods are extremely sensitive and discriminatory, and so it is not yet known how they are best applied in field situations, where spatial and temporal variability is the norm.
Soil microbial community structure and biomass from phospholipid fatty acids
Extracted lipids, in particular phospholipid fatty acids (PLFA), can be used as signature lipid biomarkers in studies of soil microbial communities. The total PLFA content is indicative of total viable biomass. Individual PLFAs (or suites thereof) can be related to community structure, as they are found predom-inantly, but not exclusively, in distinct microbial groups (e.g. fungi, bacteria, Gram-negative bacteria and actinobacteria). The main advantage of PLFA profiling is that it is semi-quantitative, does not rely on cultivability and provides wide coverage of the soil microbial community.
Soil respiration and carbon cycling from multiple substrate-induced respiration
Carbon cycling is fundamental to soil function, and the respiration of CO2 from soils, arising from community-level biotic activity, is an intrinsic indicator of carbon cycling. Since measurement of this property in isolation does not provide discrimination, a multiple substrate-induced respiration (MSIR) approach is more useful, as it characterizes how a soil community responds when exposed to a range of carbon substrates of differing chemical status. As it is a laborious process to generate MSIR profiles, this method is constrained by difficulties involved in achieving high-throughput systems.
Biochemical processes from multi-enzyme profiling
Biochemical reactions in soils are mediated by enzymes produced by the soil biota. A plethora of individual enzymes can be profiled, relating to virtually any defined biochemical transformation. However, a multiple enzyme fluorometric approach is particularly useful, as sensitive measurements can be made on small samples; high-throughput assay systems are possible; and several ecological processes can be assessed in a single assay. Another advantage of this approach is that many different fluorescently labelled substrates are available to target carbon-transforming enzymes, and phosphatase and sulfatase activity.
Nematodes
The potential of nematodes as biological indicators has long been recognized, as they are abundant in soil and have a wide range of feeding habits. The total number of nematode taxa, the abundance of indi-vidual functional groups and a wide range of indices that reflect the composition of the nematode com-munity are widely used as indicators. Since nematode extraction methods are laborious, and highly trained experts are required to identify nematodes (even to functional group level), ultimately nematode community analysis will be carried out using molecular techniques.
Continued

90 Chapter 4
satisfy all of the criteria considered essential by Doran and Zeiss (2000). Also, they did not know whether the indicators would prove to be reliable when used across diverse land-scapes, and under environmental conditions that vary from season to season.
Soil microbial biomass is one of the sim-plest and most widely used means of estimat-ing a soil’s biological status, but it did not appear in the suite of top-ranked indicators identified by Ritz et al. (2009), largely because it was seen as a relatively gross measure that did not discriminate between various components of the soil biological community. Gonzales-Quiñones et al. (2011) generally agreed with that assessment, and argued that soil biomass data would be more useful if critical values were established at a regional level for specific soil type × land use combinations. They also indicated that the relationship between soil microbial biomass measurements and manage-ment practice would have to be better under-stood before farmers could use this parameter as a reliable indicator of soil health.
Although a paucity of reliable biological indicators limits the value of most soil-health assessments, an even greater problem is that soilborne pests and pathogens are usually ignored. A soil cannot be considered healthy if the crops that are grown in it suffer losses from soilborne diseases, and yet few of the data sets used to evaluate soil health attempt
to quantify populations of nematode or insect pests; measure the inoculum density of par-ticular pathogens; or assess the suppressive-ness of the soil to key pests or pathogens. The latter characteristic is a particularly useful indicator of soil health, because a capacity to prevent soilborne pests from multiplying to destructive levels demonstrates that an active and diverse biological community is present, and that the regulatory functions within the soil food web are operating effectively. Unfortunately, however, there is not yet any simple way to assess suppressiveness to root diseases. Pathogen-specific bioassays are time-consuming and labour-intensive; multi-ple measurements are required to monitor characteristics that are related to suppressive-ness (e.g. resilience in the face of a disturbance or stress event); and the various microbial parameters that have been assessed do not show consistent relationships to suppressive-ness (van Bruggen and Semenov, 2000; Janvier et al., 2007).
Ecological Knowledge, Biotic Interactions and Agricultural
Management
Modern agriculture faces the twin challenges of being both highly productive and sustainable,
Box 4.1. Continued.
Microarthropods
Acari (mites) and Collembola (springtails) have been proposed as potential biological indicators because they are the dominant arthropods in many soils. Extraction methods are fairly straightforward, but the use of arthropods as indicators has been limited by the need for expert skills in identification, and by concerns about which metrics are most useful in ecological studies.
On-site visual recording of soil fauna and flora
Organisms that are readily visible (ants, earthworms and fungal fruiting bodies) are considered useful biological indicators because data can be collected relatively easily. However, consistent methodologies are required before such parameters can be used in on-site recording.
Pitfall traps for ground-dwelling and soil invertebrates
Pitfall traps are a well-established technique for assessing ground-dwelling and soil invertebrates, and are used widely in environmental surveillance. However, one disadvantage is that return visits are required to collect data.

Global Food Security and Sustainable Agriculture 91
and as Gliessman (2007) pointed out, this can only be achieved by applying ecological concepts and principles to the design and management of agroecosystems. Although there is general agreement on the need for an ecological approach to farming, discus-sion on what constitutes ecologically sound agriculture is often polarized by arguments about what type of farming system (e.g. tra-ditional, organic, biodynamic, conventional, integrated, community-based, free-range, low input, etc.) is best able to provide the world’s food needs with the least environ-mental impact (Trewavas, 2001, 2004; Badgley et al., 2007; Badgley and Perfecto, 2007; Cassman, 2007). However, when farm-ing systems are viewed from an ecological perspective, they all contain both positive and negative elements. Thus, it is more enlightening to focus on the impact of man-agement on the ecosystem services provided by the soil biota: production of food and fibre; maintenance of soil structure; storage and supply of nutrients; retention and release of water; and regulation of popula-tions of soil organisms.
Management effects on the soil biota and the limiting role of the environment
It should be clear from this and preceding chapters that the provision of ecosystem ser-vices by the soil biota is intimately linked to the quantity and quality of soil organic mat-ter. Manage ment practices determine carbon inputs and losses, with flow-on effects to the soil biota, but levels of soil organic matter will also be influenced by climatic factors (par-ticularly temperature and precipitation) and numerous soil properties (e.g. texture, depth and mineral composition). Thus, manage ment plays an important role in determining the biological status of a soil, but the environment limits what is achievable.
The role of environmental factors in limiting carbon sequestration in soils was recognized by Ingram and Fernandes (2001), who used the term ‘attainable’ to describe the amount of carbon that could be sequestered in a particular situation, given
the limitations of soil and climate. Since there is a close association between soil organic matter and the soil biota, this conceptual frame-work was extended by Gonzales-Quiñones et al. (2011) and used to explain the size of the soil microbial biomass pool. Potential soil microbial biomass was considered to be the maximum microbial population that could be sustained given otherwise non-limiting conditions, and was constrained by inherent site and soil characteristics (Fig. 4.1). For any particular land-use system, the attainable target value for soil microbial bio-mass was defined by factors controlling inputs of organic carbon to soil. Any man-agement practice that increased carbon inputs (e.g. greater net primary production due to fertilization or irrigation) would tend to increase attainable soil microbial bio-mass towards the potential. For soil-monitoring purposes, two lower limits were added. Critical was the soil microbial biomass value below which biological soil function was lost irreversibly, while constraining described the situation where soil biologic- al function still occurred but was at the lower limit of the desirable range of values (Fig. 4.1). Once appropriate attainable val-ues were determined, management action could be initiated to move the actual value towards the desired target.
Although these concepts are relevant to soil carbon and microbial biomass, there is no reason why they could not be applied to other soil biological characteristics of interest (e.g. the level of nutrient cycling; the extent of biodiversity; the rate of a par-ticular biochemical transformation; or the level of suppressiveness to a particular pest or pathogen). The advantage of visualizing soil biological attributes in this way is that it encourages scientists and land managers to consider the edaphic and climatic con-straints that limit what is possible in a spe-cific situation, and then think about how management might move levels of a par-ticular attribute from current or actual levels towards an attainable target. The challenge for biological scientists is to provide farmers with some indication of what targets are achievable in a given soil type, land use and environment.

92 Chapter 4
Provision of ecosystem services by the soil biota and the role of management
The soil biological community is responsible for providing a range of ecosystem services, and when these natural services are lost due to biological simplification, they must be replaced by external inputs (Altieri, 1999; Shennan, 2008). Thus, insecticides, nematicides and fungicides are required when regulatory processes are no longer effective enough to suppress pests and patho gens. The essence of ecologically sound agriculture is to understand the bio-logical interactions involved in the provi-sion of a desired service and then use that knowledge to manipulate the biota through management, thereby minimizing or elimi-nating the need for external inputs. In the case of crop nutrition, this process might involve: (i) knowing the level of nutrients required to replace the nutrients removed in
the harvested product; (ii) reducing leaching losses by increasing the soil’s cation exchange capacity; (iii) minimizing denitri-fication losses through better drainage; (iv) including legumes in the rotation to supply biologically fixed nitrogen; (v) opti-mizing mycorrhizal symbioses with plant roots to enhance phosphorus and micro-nutrient uptake; (vi) understanding the mineralization and immobilization pro-cesses associated with soil organic matter, and then adjusting residue management practices so that naturally cycled nutrients are available when they are required by the crop; (vii) ensuring that nutrients are not applied in excess of crop requirements; and (viii) applying nutrients in forms that do not impact negatively on key components of the soil biota.
Given the number of issues listed above, it should be apparent that taking an ecological approach to nutrient management is a huge
Fig. 4.1. Conceptual diagram showing the size of the soil microbial biomass pool in relation to target values and their defining factors. (From Gonzales-Quiñones et al., 2011, with permission.)

Global Food Security and Sustainable Agriculture 93
challenge. Biotic interactions are important mediators of nutrient availability, but we are not yet able to connect population and community ecology with fluxes of nutrients. Also, the interactions involved in biologic- al nutrient cycling are complex and often multitrophic, and our understanding of the processes involved is too rudimentary to be used successfully in crop management (Plenchette et al., 2005; Goulding et al., 2008). Results from organic farming systems, where nutrient-cycling processes form the basis of crop nutrition, are testimony to the difficulties involved in taking such an approach to maintaining soil fertility: yields are generally lower than in conventional farming systems (Posner et al., 2008); the biological community is not always enhan-ced by organic inputs (Shannon et al., 2002); and high levels of mycorrhizal colonization do not necessarily overcome phosphorus deficiency (Kirchmann and Ryan, 2004). Thus, there is a need for research to better understand and manage the microbially mediated processes that impact on soil nut-rient dynamics. A return to more diverse crop rotations and increased use of cover or catch crops, for example, is likely to improve soil health and provide some pest and dis-ease control, but may have both positive and negative effects from a nutritional per-spective. Fertilizer nitrogen requirements may be reduced and nutrient-use efficiency may improve, but more nitrates may be leached from the profile, an outcome which indicates that changes in practice do not always produce positive results (Goulding et al., 2008).
A similar situation applies to another important service provided by the soil biota: regulation of soilborne pests and diseases. There is plenty of evidence to demonstrate that biological mechanisms of suppression operate in agricultural soils; that they act against a wide range of pests and patho-gens; and that they are influenced by man-agement (Baker and Cook, 1974; Stirling, 1991; Hoitink and Boehm, 1999; Kerry, 2000; Weller et al., 2002; Stone et al., 2004). Sometimes the suppressive agents are highly specialized antagonists, while in other cases suppression is associated with
the wider biological community. However, we are not yet able to define the type of biological community and the level of biological activity required to maintain populations of specific pests and patho-gens at levels that do not cause economic damage.
Integrated Soil Biology Management
The material presented in this chapter outlines the many issues that must be con sidered by anyone wishing to manage soil biotic interactions in such a way that crop produc-tivity is maintained or improved; soil health is enhanced; off-site environmental impacts are minimized; natural processes are contrib-uting to crop nutrition; and regulatory mech-anisms are providing some pest and disease control. Clearly, this is an overwhelming task that involves what was referred to in Chapter 1 as ‘integrated soil biology management’: a management approach that not only requires crop-specific and site-specific knowledge, but a capacity to integrate various practices into a productive and sustainable farming system that provides a full range of ecosystem services. Although the complexities associ-ated with this approach are obvious, it is only by considering the full gamut of issues that affect crop production (crops, soils, climate, water, organic matter, crop rotations, tillage practice, nutrients, weeds, pests, diseases and beneficial organisms) that farming sys-tems can be improved. Improvements will always be incremental, but that is to be expected, given the inherent complexity of all farming systems.
The essence of integrated soil biology management is to manage agroecosystems at a farm and landscape level so that services such as soil formation, carbon sequestration, nutrient cycling, water regulation and pest and disease suppression are maximized and disservices such as nutrient runoff, sedimen-tation of waterways and greenhouse gas emis sions are minimized. The issues involved were depicted previously in Fig. 1.1 and dis-cussed by Power (2010) and Powlson et al. (2011a). Although the approach involves

94 Chapter 4
manipulating soil, crops and farm animals to achieve the desired effects, the term ‘inte-grated soil biology management’ is used because the outcomes are manifested through the soil biota.
Managing soil organic carbon is cent-ral to integrated soil biology management because the quantity and quality of soil organic inputs affect the activity and diver-sity of organisms within the soil food web, and they, in turn, influence numerous soil properties relevant to ecosystem function and crop growth. Since organic carbon levels in many cropped soils have declined to the point where agricultural productivity is being compromised, practices that promote carbon sequestration are actively promoted in the literature on sustainable farming systems, and soil organic carbon is always seen as a keystone indicator of soil health. There is no particular critical threshold for organic carbon that is applicable across dif-ferent soils and environments (see review by Loveland and Webb, 2003), but it is clear that carbon levels in most agricultural soils are well below the maximum level attainable in a given soil type and location. Raising total carbon levels normally provides benefits, but as the above review indicated, the ‘active’ or ‘fresh’ fraction seems to be more important in determining services associ-ated with soil structure and aggregation. Since these fractions support the soil biota, they are also the key to maintaining func-tions such as nutrient cycling and biological suppressiveness.
The organic carbon content of a soil is the result of a balance between inputs (plant roots, root exudates, plant residues and manures) and outputs (evolution of CO2 due to respiration by the soil food web, leaching of soluble organic carbon compounds down the soil profile, and particulate losses from erosion). However, in the absence of substan-tial inputs of manure or other organic mater-ials, it is difficult to influence these processes and increase the total organic carbon content of arable soils. Nevertheless, this is a worth-while objective, as small changes in total car-bon content can have disproportionally large effects on a range of soil properties (Powlson et al., 2011a). Thus, from the perspective of
enhancing the activity and diversity of the soil biological community, farmers must focus on adopting practices that increase total carbon inputs, maintain labile carbon frac-tions in the rooting zone and reduce the rate of decomposition of organic matter. Such practices include rotational cropping, inter-cropping with perennials, green manuring, residue retention, mulching and minimum tillage.
Since nutrient cycling/recycling is one of the ecosystem services provided by soil organisms, plant nutrition is one of the key elements to be considered when attempts are made to manipulate the soil biological com-munity. Crop residues and organic amend-ments are the only source of nitrogen and other plant nutrients in low input and organic farming systems, and their availabil-ity to the crop is mediated by the soil biota. However, in conventional farming systems, these natural decomposition and mineraliza-tion processes are largely overridden, with crop nutrient requirements being supplied as mineral fertilizers. The challenge of inte-grated soil biology management is to man-age carbon inputs so that biological processes provide a greater proportion of the nutrients required by the crop. Instead of applying a single pulse of fertilizer at excessive rates (because leaching or other losses are expected later in the growing season), the aim would be to develop better ways of utilizing the nutrients gradually made available from soil reserves, crop residues and biological nitrogen fixation. The plants’ additional growth require-ments would be satisfied with judiciously placed and appropriately timed inputs of organic or synthetic fertilizers at critical periods.
As we learn more about the organisms that provide these nutrient-cycling services, and are more easily able to enumerate them using molecular methods, this type of man-agement will become increasingly feasible. For example, in a series of studies cited by Ferris (2010), bacterial-feeding nematodes mineral-ized nitrogen throughout the growing season, but due to the different temperature adapta-tions of the nematodes involved, the nutritional service was mainly provided by rhabditids in spring and cephalobids in summer (Fig. 4.2). In another example, concentrations of mineral

Global Food Security and Sustainable Agriculture 95
nitrogen available to a tomato crop were enhanced by manipulating cover cropping and irrigation practices to create conditions suitable for biological activity, particularly bacterivore nematodes (Ferris et al., 2004). Since environmental conditions that favou-red bacterivore nematodes probably also favoured other microbial grazers, including protozoa, the abundance of these nematodes was considered a useful indicator of overall grazing activity and nitrogen mineralization rates from soil fauna. Therefore, both these examples suggest that identifying the key organisms responsible for nutrient-cycling services and then manipulating their popula-tions through management is a pathway to more sustainable nutrient usage.
One ecosystem service that has been lost in modern agriculture is the capacity of the system to suppress soilborne pests and diseases. Plant-parasitic nematodes and other soilborne pathogens normally do not cause problems in natural systems because they are kept under control by organisms that compete with them for the same food resource, and by parasites and predators at higher trophic levels in the soil food web. This interacting biological community remains active and diverse because it is con-tinually maintained by carbon inputs from plants. The suppressive services provided
by this community have largely disap-peared from agricultural soils because the soil food web is repeatedly disrupted by cultivation; beneficial organisms are dis-turbed or killed by pesticide and nutrient inputs; vital food reserves are depleted because carbon is exported as harvested product and not replaced; and decomposi-tion processes that convert organic matter to CO2 are accelerated by tillage. Integrated soil biology management means thinking holistically about all the practices used to produce crops; recognizing that the sup-pressive services provided by the soil food web are affected by management; and then redesigning the farming system so that those services begin to operate effectively. This issue is explored in more detail in Chapter 11.
Ecologically Based Management Systems and the Role of Farmers
It is easy to idealize that ecologically based decision making should play a greater role in agriculture. However, achieving this in prac-tice will require mechanisms for dealing with the complexity that is inevitably associated
300
200
100
Num
ber
of n
emat
odes
N-m
iner
aliz
atio
n
0Mar Apr May
Functional complementarity of N-mineralizationby rhabditid nematodes
Functional complementarity of N-mineralizationby cephalobid nematodes
Functional continuity of N-mineralization by bacterial-feeding nematodes
Jun Jul Aug Sep0
25
50
75
100
Fig. 4.2. Functional continuity of nitrogen mineralization (based on lifetime mg N per individual) for diverse assemblages of rhabditid and cephalobid nematodes adapted to temperature conditions in California during spring (March–May) and summer (June–September), respectively. (From Ferris, 2010, with permission.)

96 Chapter 4
with production systems that rely heavily on ecological processes. Shennan (2008) encapsulated the issues in this way: (i) in real farming systems, multiple variables interact in site-specific and farmer-specific ways; (ii) the outcomes of complex biotic interactions can be unpredictable and idio-syncratic; (iii) crop-specific and site-specific knowledge, together with an understanding of general system behaviour, is required to manage the whole system; and (iv) manage-ment complexity and perceived higher risks (relative to the continued use of chemical inputs) are a significant barrier to the wider adoption of ecological agriculture. It was also noted that discipline-based resear chers are not well equipped to cope with this com-plexity, as they study only a few variables and try to control others in their attempts to understand the mechanisms driving eco-logical interactions.
Given the difficulties involved in managing ecologically based systems of agriculture, there is a need to consider how growers can assimilate the knowl-edge that is generated by research and use it to improve their farming systems. The traditional approach to agricultural exten-sion has been to develop management rec-ommendations based on mechanistic research and then extend them to farmers in different growing regions. Shennan (2008) argued that this research/extension model was no longer applicable and should be replaced by an interactive learning model involv ing farmers and researchers. This process would accommodate knowl-edge held by both parties and should, therefore, result in two outcomes: far-mers would increase their understanding of ecological processes so they could better adapt management approaches to suit their own situation, while researchers would become more aware of the multiple varia-bles that were interacting within a real farming system and could begin to con-sider how they might be respond ing to management. The new model would be accompanied by an increase in field-based adaptive research, with an emphasis on monitoring performance as adaptations were made.
Implications for Biological Control
The first section of this chapter highlights the fact that food security will be one of this cen-tury’s key global challenges. More food must be produced from existing resources without damaging the environment, and this will largely be achieved through a process of sustainable intensification. Those involved in agriculture will continue to innovate, but proven tech-nologies associated with conservation agri-culture and site-specific crop management will form the basis of future farming systems. Thus, in the foreseeable future, farmers in many countries face the challenge of introducing prac-tices such as reduced or zero tillage, cover cropping, residue retention, crop rotation and site-specific management into crop produc-tion systems where such practices are not yet used widely. Given the complexity of farming systems, together with the natural predisposi-tion of farmers to resist change, and the fact that many gov ernments stifle inno vation by subsi-dizing agriculture, this will not be an easy task. Nevertheless, on-farm research sites must be established to demonstrate that farming sys-tems can be modified, and agronomists and extension personnel will need to work with farmers to develop and then fine-tune the new systems. Nematologists must be involved in this process, because the task of reducing losses from nematode pests, and the problems involved in manipulating the free-living nema-tode community to improve nutrient cycling and regulatory processes, are inextricably linked to the development of crop and soil manage-ment systems that improve soil health, increase productivity and enhance sustainability.
Once farmers begin to use variable- rate-application equipment and other methods to optimize nutrient inputs, and crop moisture stress is reduced by minimizing evaporative losses, increasing the soil’s water-holding capacity and improving irrigation manage-ment, nematologists will have to address the issue of whether plant-parasitic nematodes are still causing economic losses. Stress asso-ciated with inadequate water or nutrient uptake exacerbates damage caused by nema-todes (Barker and Olthof, 1976; McSorley and Phillips, 1993), and so it is likely that problems caused by nematodes will become

Global Food Security and Sustainable Agriculture 97
less severe when these stress factors are ame-liorated or removed. Thus, estimates of the severity of losses caused by nematodes (see Box 3.4) may no longer be relevant, as they were obtai ned in farming systems that in many cases are markedly different to those operating today. Crop loss estimates must, therefore, be redetermined under conditions where crops are grown in a more sustainable manner, and water and nutrients are managed using the best available technologies. The critical ques-tion to be answered is whether the optimization of crop management results in situations where damage thresholds increase to a point where plant-parasitic nematodes become a rela tively minor constraint to crop production. All available evidence suggests that n ematodes will cause fewer problems when environ mental stresses are minimized, opening up opportunities to manage them using strategies that focus on improving soil and plant health rather than eliminating the pest.
From an ecological perspective, the main benefit from introducing some or all of the practices associated with conservation agri-culture will be to enhance levels of soil organic matter, particularly in surface layers. Given the role of soil organic matter and its associ-ated biota in improving soil moisture relations and in storing and cycling nutrients, this improvement will have major flow-on effects to the crop loss/damage threshold issue dis-cussed in the previous paragraph. However, it will also affect the natural processes that regu-late populations of nematodes and other soil-borne pathogens. Organic matter-mediated disease suppression is a widely recognized phenomenon (Stone et al., 2004), and so levels of suppressiveness should increase when soil is no longer tilled and growers begin to see org-anic matter as a valuable resource rather than something that interferes with farm opera-tions. The challenge facing nematologists is to understand how the quantity, quality and tim-ing of organic inputs, and how they are man-aged, influence the regulatory processes that stabilize populations of plant-parasitic nema-todes. There are many questions to be answered:
• What level of soil organic carbon is required to achieve useful levels of suppr essiveness?
• How does this vary with soil type and climate?
• Are particular forms or fractions of soil org anic matter associated with suppressiveness?
• What practices must be implemented to maintain the continuity of regulatory services?
• What suppressive agents are involved and does their relative importance vary with crop, soil type and environment?
• What easily measured parameters can be used as indicators of suppressiveness?
• What is the impact of potentially disrup-tive treatments (e.g. tillage, nutrient inputs, pesticides) on suppressiveness?
• Are particular soil properties (e.g. clay con-tent) associated with suppressiveness?
• What is the role of environmental factors such as moisture and temperature?
• Can organic inputs be manipulated to achieve higher or more constant levels of suppression?
These issues are discussed later in this book, but it will be apparent from the discussion in Chapter 9 that we have taken no more than a few small steps towards understanding how organic inputs influence natural regulatory processes in managed ecosystems. Organic amendments, for example, are often used as a nematode management tool, but outcomes are essentially unpredictable due to our lack of knowledge of the chemical and biological processes associated with the decomposition of organic matter.
Complexity is a theme that runs through-out this book. Biological complexity is inevita-ble when dealing with terrestrial ecosystems, as all six kingdoms of life (Bacteria, Archaea, Protista, Plantae, Fungi and Animalia) occur in soil and there is incredible diversity within each king-dom. Since it is simply impossible for one per-son to be familiar with the taxonomic and ecological attributes of all these organisms, soil biologists tend to specialize. Thus, if science is to ever come to grips with the complexity of the soil biota, interdisciplinary cooperation must occur, and biologists working with soil must have a broad understanding of soil ecology.
When the complexity associated with modern farming systems is added, it should

98 Chapter 4
be apparent that biological control of nema-todes cannot be considered in isolation from the many other economic, environmental, productivity and sustainability issues that affect the way crops are grown. It is for this reason that integrated soil biology man-agement, rather than biological control, is emphasized throughout this book. Biological control will only become a component of nematode management programmes if the interactions required to achieve it operate within farming systems that are both profit-able and sustainable. Thus, the first step in establishing effective methods of biologic- al control is to work towards developing farming systems that provide a better biotic and abiotic environment for growing plants.
Once those systems are in place, the stresses associated with poor soil health should be minimized, while the mechanisms regula-ting nematode populations should start to function as a result of interactions between plants, crop residues, the nematode commu-nity and the environment. In many situa-tions, no further steps will be necessary, other than the ongoing process of steward-ship, as nematodes will no longer be pests of major economic concern. However, there will also be situations where a particularly virulent nematode pest is attacking a crop, and in those cases, the level of nematode control may have to be increased by fine-tuning the new farming system or introduc-ing other management tactics.

This chapter is from the book:
9781780643595.pdf
ISBN: 9781780643595

v
Contents
Contributors viiPreface xAcknowledgements xi
1 Introduction to Biosecurity Surveillance: Quantitative Approaches 1Frith Jarrad
Part I Concepts for Biosecurity Surveillance
2 Biosecurity Surveillance in Agriculture and Environment: a Review 9Megan Quinlan, Mark Stanaway and Kerrie Mengersen
3 Getting the Story Straight: Laying the Foundations for Statistical Evaluation of the Performance of Surveillance 43Samantha Low-Choy
4 Hierarchical Models for Evaluating Surveillance Strategies: Diversity Within a Common Modular Structure 75Samantha Low-Choy
5 Th e Relationship Between Biosecurity Surveillance and Risk Analysis 109Alan MacLeod
6 Designing Surveillance for Emergency Response 123Zoé van Havre and Peter Whittle
Part II Information for Biosecurity Surveillance
7 Th e Role of Surveillance in Evaluating and Comparing International Quarantine Systems 137Murthy Mittinty, Peter Whittle, Mark Burgman and Kerrie Mengersen
8 Estimating Detection Rates and Probabilities 151Cindy E. Hauser, Georgia E. Garrard and Joslin L. Moore

vi Contents
9 Ad hoc Solutions to Estimating Pathway Non-compliance Rates Using Imperfect and Incomplete Information 167Andrew P. Robinson, Matthew Chisholm, Robert Mudford and Robert Maillardet
10 Surveillance for Soilborne Microbial Biocontrol Agents and Plant Pathogens 181Peter Whittle, Ingvar Sundh and Stephen Neate
11 Design of a Surveillance System for Non-indigenous Species on Barrow Island: Plants Case Study 203Justine Murray, Peter Whittle, Frith Jarrad, Susan Barrett, Richard Stoklosa and Kerrie Mengersen
12 Towards Reliable Mapping of Biosecurity Risk: Incorporating Uncertainty and Decision Makers’ Risk Aversion 217Denys Yemshanov, Frank H. Koch, Mark Ducey and Robert A. Haack
13 Detection Survey Design for Decision Making During Biosecurity Incursions 238John M. Kean, Graham M. Burnip and Amin Pathan
Part III Statistical Modelling Methods for Designing Biosecurity Surveillance
14 Inference and Prediction with Individual-based Stochastic Models of Epidemics 253Gavin Gibson and Christopher A. Gilligan
15 Evidence of Absence for Invasive Species: Roles for Hierarchical Bayesian Approaches in Regulation 265Mark Stanaway
16 Using Bayesian Networks to Model Surveillance in Complex Plant and Animal Health Systems 278Sandra Johnson, Kerrie Mengersen, Michael Ormsby and Peter Whittle
17 Statistical Emulators of Simulation Models to Inform Surveillance and Response to New Biological Invasions 296Michael Renton and David Savage
18 Animal, Vegetable, or … ? A Case Study in Using Animal-health Monitoring Design Tools to Solve a Plant-health Surveillance Problem 313Susan Hester, Evan Sergeant, Andrew P. Robinson and Graham Schultz
19 Agent-based Bayesian Spread Model Applied to Red Imported Fire Ants in Brisbane 334Jonathan M. Keith and Daniel Spring
Appendix: Common Statistical Distributions Used in Statistical Modelling and Analysis for Biosecurity Surveillance 348Jessie Roberts, Samantha Low-Choy, Frith Jarrad and Kerrie Mengersen
Index 363

© CAB International 2015. Biosecurity Surveillance:Quantitative Approaches (eds F. Jarrad et al.) 9
Biosecurity Surveillance in Agriculture and Environment: a Review
Megan Quinlan,1* Mark Stanaway2 and Kerrie Mengersen2
1Centre for Environmental Policy, Imperial College London, UK; 2Queensland University of Technology, Brisbane, Australia
2
2.1 Introduction: the Concept of Biosecurity
Th e term biosecurity has many defi nitions. It is frequently perceived as a new, more coordinated approach, generally led by a particular governmental authority or network of authorities, to understand and manage natural and human-caused threats to a range of biological resources. Th e approach includes an ‘increasing reliance on systematic risk analysis’ (FAO, 2007) and integration of existing sectoral capacities, which consequentially highlights any gaps in authority or coverage of risk management measures. Th e holistic, almost organic nature of the concept (for which the specifi c objective or desired outcome may not always be clear) is balanced against a pragmatic insistence on cost-eff ective, effi cient steps towards protection of valued resources.
In keeping with the theme of this book, the focus of this chapter will be on biosecurity and biosecurity surveillance among plants, animals and ecosystems. In this sense, the term biosecurity includes: (i) the protection of countries against alien (non-endemic or non-native) plant, animal or marine pests (Waage and Mumford, 2008); (ii) measures to contain or reduce existing disease (Defra, 2005); and (iii) food safety, sometimes known as food defence
(Zmorzynska and Hunger, 2008). In this context of agricultural and environmental biosecurity, defi nitions vary in detail but are similar in intent at international, regional, national and local scales. Defi nitions and commentaries from various sources are shown in Table 2.1.
However, we commence the chapter with a broader review of the defi nition of biosecurity and biosecurity surveillance to clarify the usage of the term. Th e term has also been employed to mean a framework for evaluation of introductions of living organisms, including defence against bio-logical weapons and bioterrorism (O’Toole and Inglesby, 2003; Normann, 2010). Th e term appeared in publications about the growing bioterrorist threat around 1995 (Zmorzynska and Hunger, 2008). Its use in that context then expanded rapidly after the 2001 incident of bioterrorism of anthrax in postal letters. A 2006 report, ‘Globalization, Biosecurity, and the Future of the Life Sciences’ (National Research Council, 2006), defi nes biosecurity as ‘security against the inadvertent, inappropriate, or intentional malicious or malevolent use of potentially dangerous biological agents or bio-technology, including the development, production, stockpiling, or use of biological weapons, as well as natural outbreaks of newly emergent and epidemic diseases’.

10 Megan Quinlan et al.
Table 2.1. Biosecurity defi nitions and commentaries relevant to agriculture and environment.
Organization or country Defi nition/commentary Reference
Food and Agriculture Organization of the United Nations (FAO)
Biosecurity is a strategic and integrated approach that encompasses the policy and regulatory frameworks (including instruments and activities) that analyse and manage risks in the sectors of food safety, animal life and health, and plant life and health, including associated environmental risk. Biosecurity covers the introduction of plant pests, animal pests and diseases, and zoonoses, the introduction and release of genetically modifi ed organisms (GMOs) and their products, and the introduction and management of invasive alien species and genotypes. Biosecurity is defi ned as a holistic concept of direct relevance to the sustainability of agriculture, food safety, and the protection of the environment, including biodiversity.
FAO (2005)
FAO paper on biosecurity and forests
…‘harm’ is the damage done by something that might have been prevented through biosecurity, whereas ‘risk’ is the chance of that harm occurring.
Cock (2003)
FAO paper on farm biosecurity
Biosecurity plans require the adoption of a set of attitudes and behaviours that reduce risk in activities involving … production and marketing. A comprehensive, detailed, practical and easily understood plan is most effective.
FAO (2011) (on poultry)
Windhoek Declaration on an aquatic biosecurity framework for southern Africa
… biosecurity … safeguards animal health, protects biodiversity, promotes environmental sustainability and enhances food safety. The livelihoods of many people depend on fi sheries and aquaculture, including some of the most vulnerable in the region.
Windhoek Declaration (2009)
Australia Environmental biosecurity is the protection of the environment and social amenity from the negative effects associated with invasive species: including weeds, pests and diseases. It occurs across the entire biosecurity continuum: pre-border preparedness, border protection and post-border management and control.
Australian Government, Department of Sustainability, Environment, Water, Population and Communities (2013)
New Zealand … the exclusion, eradication or effect management of risks posed by pests and diseases to the economy, environment and human health.
New Zealand Government, Ministry for Primary Industries (undated)
Canada (dairy cattle) Farm-level biosecurity is a series of management practices designed to minimize or prevent and control: (i) the introduction of infectious disease agents onto a farm; (ii) spread within a farm production operation; and (iii) export of these disease agents beyond the farm that may have an adverse effect on the economy, environment and human health.
CFIA (2013)
Canada (beef cattle) Those practices that prevent or mitigate disease from entering, spreading within or being released from operations that may contain livestock.
CFIA (2012)

Biosecurity Surveillance in Agriculture and Environment 11
Th e term is further convoluted through translation: for example, in Chinese, French, German and Russian, the terms biosecurity and biosafety translate into the same word. Th is is despite the fact that, in English, ‘biosafety’ is frequently linked with labora-tory safety and biocontainment when research involves hazardous materials (e.g. pathogens), or to frameworks for evaluation of genetically modifi ed organisms (GMO). Either as biosafety or biosecurity, this usage aligns with the World Health Organization (WHO) defi nition as the ‘protection, control and accountability for valuable biological materials within laboratories in order to pre-vent their unauthorized access, loss, theft, misuse, diversion or intentional release’ (Secretariat of the Biological Weapons Con-vention, 2011). One commentary suggests that including the plant and animal health issues under the rubric of biosecurity would link these too closely to the mentality of national security measures and make activities less transparent (Zmorzynska and Hunger, 2008). Th ese defi nitions focusing on threats to security through biological means are not explored in depth in this chapter.
Even when narrowed down to the agricultural and environmental usage of biosecurity, major diff erences in under-
standing of the term do arise. As a result of the broad and changing usage of this term, there is controversy over what is ‘in’ and ‘out’ of the defi nition of biosecurity. Arguments exist about whether the concept is ‘animal and plant biosecurity’ or simply ‘biosecurity’ (see Box 2.1). Of course, the nature of, and positions on, this question, typically depend on the discipline base of the proponents, as discussed throughout this chapter.
Moreover, the intent of biosecurity seems always to be interdisciplinary or intersectoral, aimed at balancing multiple objectives and based on a more holistic approach to protecting and using the biological resources of the place under consideration. Some defi nitions consider biological resources in terms of entire ecosystems, populations of one species, individual organisms and down to the genetic level. Many of the defi nitions of biosecurity instead implicitly refer to actions or practices of monitoring or surveillance or control measures, or on the risk and risk management or mitigation of the threats. In this instance, sometimes the pathway or mechanism for the threat to biosecurity is highlighted.
Frequently, factors that are not strictly biological are covered by the defi nitions,
Organization or country Defi nition/commentary Reference
Bhutan Biosecurity shall contribute to achieving Gross National Happiness by ensuring Bhutanese people, the biological resources, plants and animals are protected from the harmful effects of pests and diseases, invasive alien species, genetically modifi ed organisms, toxic chemicals and food additives.
Frampton (2010)
Tasmania Australia … the protection of industries, the environment and public well-being, health, amenity and safety from the negative impacts of pests, diseases and weeds.
Government of Tasmania (2007)
Victoria Australia … the protection of the economy, the environment, social amenity or human health from negative impacts associated with the entry, establishment or spread of animal or plant pests and disease, or invasive plant and animal species.
State Government of Victoria, Department of Primary Industries (2010)
Great Britain Non-native Species Secretariat (GB NNSS)
Biosecurity means taking steps to make sure that good hygiene practices are in place to reduce and minimize the risk of spreading invasive non-native species.
GB NNSS (2011)

12 Megan Quinlan et al.
such as economic and social issues. Th is approach was taken up by smaller nations, in particular, where limits in resources demand an effi cient and coordinated public sector. Early examples of biosecurity initiatives from the 1990s include Norway (see Sandlund et al., 1996; Håstein et al., 2008), New Zealand (Froud et al., 2008; MAF Biosecurity New Zealand, 2009) and Belize (Government of Belize, 2000; FAO, 2008; Outhwaite, 2010), all relatively small nations.
Spatial aspects of the defi nitions vary (e.g. farm level, country level, etc.) or are not defi ned. Few pin down a time scale for the concept. Th e emphasis seems to be on an ‘approach’, ‘strategy’ and ‘attitude’ as much as on the actions to be taken, as laid out in Table 2.1. Given the multisectoral nature of the concept, biosecurity cannot be defi ned in specifi c terms as a state of health and well-being, as one might defi ne clean air or potable water. Th erefore, many of the defi nitions of biosecurity instead implicitly refer to actions or practices of monitoring or surveillance or control measures, themselves.
Certainly, a common understanding of surveillance of biosecurity is hampered by the broad uses and wide variation of meanings for biosecurity. We consider, then, the concept of surveillance in the traditional sectors for animal and plant health.
2.2 Plant and Animal Health Surveillance
2.2.1 Historic authorities and approaches for plant and animal health surveillance
In the context of animal biosecurity, the major source of guidance is the World Organisation for Animal Health or OIE (formerly the Organization International des Epizooties). Th e OIE is the inter-governmental organization for improving animal health worldwide (OIE, 2013). Created in 1924, the OIE remains the primary body for global coordination, with a total of 178 member countries in 2013. It was also subsequently recognized as a reference organization, with all of its
Box 2.1. Is biosecurity about plant and animal health?
Arguments exist about whether the concept is ‘animal and plant biosecurity’ or simply ‘biosecurity’. In most cases when a biosecurity approach is adopted, plant and animal health will persist as distinct sectors, at both legislative and operational levels (FAO, 2007). Economically, animals are comparatively higher value investments per head but plants can impact equally on food security. Biological differences include the comparatively larger number of plant pests, the modes and states of transport or pathways for entry of the pests, the biosecurity treatments and the timeframe required for response to an outbreak. Historically, animal biosecurity is more established and more cohesive. Furthermore, under the existing system for animal health, for the large part, surveillance is aimed at detection of ‘notifi able diseases’ of animals, which is a predetermined list of fewer than 50 well-defi ned diseases or syndromes that may occur in livestock or poultry (OIE, 2013). This leaves the health of many animals (essentially all non-domesticated ones) outside the vision of surveillance (Convention on Biological Diversity (CBD) Secretariat, 2001a). In further recognition of the importance of the historic sectors for animal and plant health, the FAO Biosecurity Toolkit (FAO, 2007) emphasizes the concept of biosecurity as one of integration rather than harmonization of sectors. This means that biosecurity surveillance encompasses the existing approaches to surveillance, plus a more coordinated and comprehensive monitoring of organisms, which might not traditionally be covered by the national authorities for plant or animal health. The new approach, which addresses gaps in these historic sectors but also emphasizes a more coordinated strategic approach, has suggested to many that a new term and, in some cases, a new governmental entity with new authorities, is required to face today’s threats to biological resources. This now clearly includes genetic resources, resources of individual organisms and populations, as well as ecological systems.

Biosecurity Surveillance in Agriculture and Environment 13
standards being recognized by the World Trade Organization (WTO) through the Agreement on the Application of Sanitary and Phytosanitary Measures (SPS). In the context of plant biosecurity, guidance, primarily in the form of standards, is developed through the International Plant Protection Convention (IPPC) and its 179 contracting parties. Th e IPPC is an international agreement on plant health, deposited with the Food and Agriculture Organization of the United Nations (FAO) and operating under its administrative structure, now over 60 years old. Th e aim of the treaty is to prevent the transboundary spread of exotic pests of plants and plant products, in order to preserve plant resources and facilitate safe trade (IPPC, 2012a).
As with animal health (OIE, 2013), plant health guidance is implemented on the
national level by the appropriate authority in the national governments (i.e. the National Plant Protection Organizations), although surveillance programmes may also be regional or subregional, or (less frequently) global (IPPC, 2012b).
In plant health, surveillance is further clarifi ed in the defi nitions in Table 2.2, which, taken as a whole, identify who does the surveillance, what is being monitored, the time period and how data will be recorded. In plant health, as in animal health, surveillance is a critical component of determination of the health status of the country (i.e. pest status – present or absent). Offi cial programmes are linked to inter-national recognition of the health status (e.g. for animal diseases), which directly aff ects the opportunities for trade. Surveillance can also be used to orient and inform control programmes or ensure the
Table 2.2. Defi nitions from the International Plant Protection Convention (IPPC) relating to surveillance. (From International Standards for Phytosanitary Measures (ISPM) 5; FAO, 2012.)
Term Defi nition References
Surveillance An offi cial process which collects and records data on pest occurrence or absence by survey, monitoring or other procedures
CEPM (1996)
Monitoring An offi cial ongoing process to verify phytosanitary situations
CEPM (1996)
Monitoring survey Ongoing survey to verify the characteristics of a pest population
FAO (1996)
Survey An offi cial procedure conducted over a defi ned period of time to determine the characteristics of a pest population or to determine which species occur in an area
FAO (1990) (revised CEPM, 1996)
Delimiting survey Survey conducted to establish the boundaries of an area considered to be infested by or free from a pest
FAO (1990)
Detection survey Survey conducted in an area to determine if pests are present
FAO (1990) (revised FAO, 1996)
Occurrence The presence in an area of a pest offi cially recognized to be indigenous or introduced and not offi cially reported to have been eradicated (formerly ‘occur’)
FAO (1990) (revised FAO, 1996; ISPM 17; FAO, 2002)
Pest record A document providing information concerning the presence or absence of a specifi c pest at a particular location at a certain time, within an area (usually a country) under described circumstances
CEPM (1997)
Pest status (in an area)
Presence or absence, at the present time, of a pest in an area, including where appropriate its distribution, as offi cially determined using expert judgement on the basis of current and historical pest records and other information
CEPM (1997) (revised ICPM, 1998)

14 Megan Quinlan et al.
effi cacy of risk management (preventative or control) measures, as noted in Box 2.2.
Th ese defi nitions are detailed and precise and establish the various aspects of surveillance, which is a combination of targeted surveys and ongoing monitoring to: (i) detect new introductions or incursions of pests; (ii) delimit any occurrences which are being contained; (iii) provide offi cial judgement of the pest status; and (iv) be the basis for records. Th ese records, in turn, aff ect decisions regarding the risk from international trade. Th e need to set parameters of time and space is included, without indicating the appropriate values.
While most of the surveillance actions as defi ned in Table 2.2 are conducted by national authorities, regional and inter-national entities and programmes are crucial to successful surveillance. Figure 2.1 showing Cuba’s national surveillance system in plant health (taken from IPPC Secretariat, 2012), illustrates the range of inputs into a surveillance system more graphically. For example, pest alerts are a critical component of the overall surveillance programme. Both the European and Mediterranean Plant Protection Organization (EPPO) and the North American Plant Protection Organization (NAPPO), both Regional Plant Protection Organizations under the IPPC, provide early warning systems (including an
Alert List, a monthly bulletin of resources and news, and a list of invasive alien plants) to facilitate the identifi cation of potential pest risks (MacLeod, 2010).
For animal health, FAO carries out the Emergency Prevention Scheme (EMPRES) to address prevention and early warning across the entire food chain, including animal health, plant protection and food safety (FAO, 2013). On the regional level, the European Food Safety Authority (EFSA) was established by the European Union (EU) in response to the food crises in the 1990s such as bovine spongiform encephalopathy (BSE) and dioxin in food products (Deluyka and Silano, 2012).
In earlier studies, regional and global initiatives were considered critical, because national-level surveillance and advance alert systems have often been weak (Convention on Biological Diversity (CBD) Secretariat, 2001b), despite the available international guidelines. Historically there has been a lack of conclusive or com prehensive information about pest status (presence or absence) and inadequate data management systems. Emergency actions, coming before an organism is offi cially recognized (e.g. nationally as a quarantine pest or inter-nationally as a notifi able disease), were not always supported by legal authority and political will has had a signifi cant infl uence
Box 2.2. The importance of surveillance in biosecurity programmes.
Surveillance is considered one of the primary activities in any biosecurity programme. Three steps in a biosecurity programme have been proposed (adapted from Cock, 2003) as:
• Problem formulation: identifi cation of objectives, time frames and spatial boundaries; identifi cation and assessment of risks; agreement on roles and responsibilities; agreement on methodologies for each of the three steps; identifi cation of decision points and indicators of success; development of contingency plans to establish fi nancial, human and infrastructural needs and access.
• Surveillance: biological monitoring of the targeted threat; general monitoring for unanticipated changes, such as development of invasiveness or contagiousness over time; system monitoring to ensure that the procedures for detecting a threat are functioning correctly and fulfi lling the purpose (the latter point may be considered part of management).
• Management: implementation of the chosen response activities, such as for containment or eradication; evaluation of success over time and, in the event of failure, actions to redress or mitigate the situation. This relies on post-invasion surveillance to continually inform the management.

Biosecurity Surveillance in Agriculture and Environment 15
on stopping trade (Convention on Biological Diversity (CBD) Secretariat, 2001a).
2.2.2 Recent enhancements in plant and animal health surveillance
Th e IPPC Secretariat discovered the importance of the factors shown in Fig. 2.2, which infl uence national pest surveillance, in a recent survey of implementation of International Standards for Phytosanitary Measures (ISPM) 6 (IPPC Secretariat, 2012). Th e infl uence of such factors will be magnifi ed in a biosecurity programme in most cases, unless the programme is established under new authorities with additional fi nancial and human resources (the two highest priority factors identifi ed in plant health surveillance).
Concurrent with the development of the concept of biosecurity, several organizations have been working to enhance the use of risk analysis and management along with the closely linked surveillance in plant and
animal health sectors. Th is has taken place through the global leadership of the OIE and IPPC, as well as FAO and numerous regional entities such as the InterAmerican Institute for Cooperation in Agriculture (IICA). It has also been pursued by many of the national authorities. Some progress has been made through regular funding avenues, and other advancement has arisen from special funding opportunities such as projects or technical programmes.
One example of advances from a national initiative is a phytosanitary risk-based rating for individual countries, developed by the United States Department of Agriculture/Animal and Plant Health Inspection Service/Plant Protection and Quarantine (USDA/APHIS/PPQ) Center for Plant Health Science and Technology’s Plant Epidemiology and Risk Analysis Laboratory (CPHST PERAL) (USDA/APHIS, 2010).
A regional project to enhance pest risk analysis (PRA), nicknamed PRATIQUE and funded under the EU Framework Programme
Monitoring system
Technology transfer
Diagnostic systems
List of quarantine pests and regulated
non-quarantine pests
Compilation and analysis of information
Control programmes and survey plans
Pest alerts
Training of technicians and
producers
• Records• Reports• Containment and
control actions
Implementation according to area risks
Fig. 2.1. The Republic of Cuba’s Phytosanitary Surveillance System [Sistema de Vigilancia Fitosanitaria en la República de Cuba] (as reported in IPPC Secretariat, 2012).
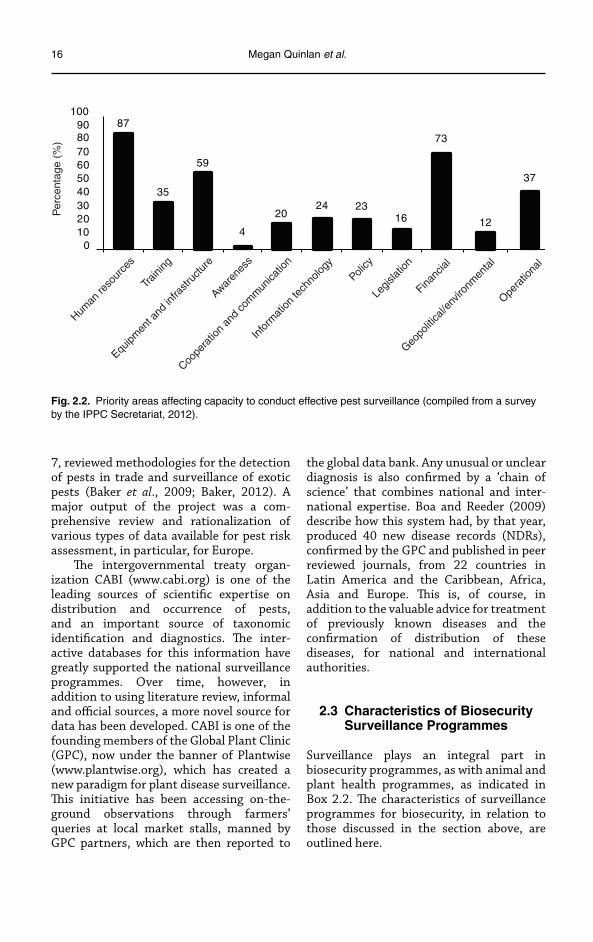
16 Megan Quinlan et al.
7, reviewed methodologies for the detection of pests in trade and surveillance of exotic pests (Baker et al., 2009; Baker, 2012). A major output of the project was a com-prehensive review and rationalization of various types of data available for pest risk assessment, in particular, for Europe.
Th e intergovernmental treaty organ-ization CABI (www.cabi.org) is one of the leading sources of scientifi c expertise on distribution and occurrence of pests, and an important source of taxonomic identifi cation and diagnostics. Th e inter-active databases for this information have greatly supported the national surveillance programmes. Over time, however, in addition to using literature review, informal and offi cial sources, a more novel source for data has been developed. CABI is one of the founding members of the Global Plant Clinic (GPC), now under the banner of Plantwise (www.plantwise.org), which has created a new paradigm for plant disease surveillance. Th is initiative has been accessing on-the-ground observations through farmers’ queries at local market stalls, manned by GPC partners, which are then reported to
the global data bank. Any unusual or unclear diagnosis is also confi rmed by a ‘chain of science’ that combines national and inter-national expertise. Boa and Reeder (2009) describe how this system had, by that year, produced 40 new disease records (NDRs), confi rmed by the GPC and published in peer reviewed journals, from 22 countries in Latin America and the Caribbean, Africa, Asia and Europe. Th is is, of course, in addition to the valuable advice for treat ment of previously known diseases and the confi rmation of distribution of these diseases, for national and international authorities.
2.3 Characteristics of Biosecurity Surveillance Programmes
Surveillance plays an integral part in biosecurity programmes, as with animal and plant health programmes, as indicated in Box 2.2. Th e characteristics of surveillance programmes for biosecurity, in relation to those discussed in the section above, are outlined here.
100908070605040302010
0
87
35
59
4
2024 23
16
73
12
37
Per
cent
age
(%)
Human
reso
urce
s
Traini
ng
Equipm
ent a
nd in
frastr
uctu
re
Awaren
ess
Coope
ratio
n an
d co
mm
unica
tion
Infor
mat
ion te
chno
logy
Policy
Legis
lation
Financ
ial
Geopo
litica
l/env
ironm
enta
l
Opera
tiona
l
Fig. 2.2. Priority areas affecting capacity to conduct effective pest surveillance (compiled from a survey by the IPPC Secretariat, 2012).

Biosecurity Surveillance in Agriculture and Environment 17
2.3.1 Integration of sectors
Challenges to surveillance, specifi cally the detection, identifi cation and monitoring of animal, plant and even human diseases, were reviewed by a high-level Foresight programme in the UK to consider the likely and possibly enhanced scenarios for 2015 and 2030 (Offi ce of Science and Innovation, 2006). Improvements in technology were considered key to addressing the increasing threats in each fi eld. Limited resources demand coordination to achieve any possible synergies (Barker et al., 2006), similar to the biosecurity approach. In the same programme, Quinlan et al. (2006) concluded from studies in the UK, sub-Saharan Africa and China, that most of the challenges would require integrated responses, with sensitivities to culture and governance.
Some important areas for integration include standardizing approaches to data collection and analysis, when cross com-parisons are possible. A framework for risk assessment and estimates of impact of any type of regulated non-native species (mammal, fi sh, insect, etc.), for example, was designed in the UK to facilitate decisions on priorities and feasibility for management (Baker et al., 2007).
Th is approach was presented in a case study of the then newly formed Finnish Food Safety Authority (EVIRA) by FAO (2007), again emphasizing the need for integration, not harmonization. EVIRA reportedly maintained the key sectors as separate departments and accessed cross-cutting expertise, such as risk assessment and communication, from departments external to theirs, but in the same Ministry. Other relevant Ministries provided policy input directly to EVIRA on a case-by-case basis.
In the process of integration, however, one must guard against restructuring without purpose and must support the transition over time. Th e Norwegian Food Safety Authority (2004) report on institutional changes to the food safety noted that: ‘In the aftermath of the fi rst wave of inspiration, one has identifi ed a sense of personal loss.’
2.3.2 Broader participation
Public awareness contributes to monitor-ing eff orts and has been harnessed more systematically under the biosecurity approach (Convention on Biological Diversity (CBD), 2012).
Th ere is a growing body of literature on biosecurity surveillance as a distinct activity, within the broader domain of biosecurity (Froud et al., 2008). For example, New Zealand defi nes biosecurity surveillance to be ‘the collection, collation, analysis, interpretation and timely dissemination of information on the presence, distribution of prevalence or risk organisms and the plants or animals that they aff ect’ (Acosta and White, 2011). Th is defi nition itself has been slightly modifi ed by the New Zealand Ministry for Primary Industries to be ‘an activity that occurs inside the border that is not part of an NPMS [National Pest Management Strategy]’ (as reported by Prime Consulting International Ltd, 2002) and now comprises four subcategories of surveillance:
• Passive surveillance: the detection of exotic species through haphazard, unplanned and unsolicited observations by the general public, farmers, orchard-ists, gardeners, veterinarians, plant pathologists and others.
• Enhanced passive surveillance: used in situations where there is a requirement to improve the sensitivity of passive surveillance processes through the removal of barriers to the more detailed examination of situations in which particular pests might be present.
• Active surveillance: a planned process targeted to fi nd and identify a particular new pest.
• Sentinel surveillance: uses targeted groups of the population to monitor for a specifi c pest or disease.
Examples are provided for each of these subcategories. Passive surveillance is illustrated by a person, working in the offi ce of an industrial site, noticing strange caterpillars and sending them to an entomologist for identifi cation. An example

18 Megan Quinlan et al.
of enhanced passive surveillance is the reimbursement of laboratory fees and the payment of a sum to veterinarians submitting material from cattle with clinical signs that could possibly be associated with BSE, or the use of publicity campaigns to encourage target groups to fi nd and notify authorities of the discovery of any exotic species. Active surveillance is illustrated by an active surveillance programme for fruit fl ies that might use pheromones in traps to attract the target species. Th e example for sentinel surveillance is bluetongue virus surveillance in New Zealand, which involves the regular testing of blood samples of cattle from sentinel herds.
In addition to governmental support of public participation in surveillance, par-ticipation from interest groups may enhance biosecurity. Th e International Union for the Conservation of Nature (IUCN) has an Invasive Species Specialist Group (ISSG), which comprises almost 200 members from over 40 countries and ‘aims to reduce threats to natural ecosystems and the native species they contain by increasing awareness of invasive alien species, and of ways to prevent, control or eradicate them’ (www.issg.org). Th e IUCN provided expert analysis and advice for marine invasive species biosecurity plans in a cooperative agreement with the US Environmental Protection Agency (US EPA) (Waugh, 2009) and has worked with other governments in many instances.
2.3.3 Additional drivers and objectives
Outbreaks of plant and animal pests occur for a variety of reasons. In the case of animal biosecurity, some of these include human-assisted movement of pests and pathogens, range extension of vectors and new vectors (Waage and Mumford, 2008), whether intentional or by accident.
Th ese drivers provide the motivation for biosecurity surveillance. Th e aim of the activities undertaken as part of biosecurity surveillance, and the corresponding benefi ts of these activities to the industry and
community, depend on the actual pro-grammes undertaken and the scale of the operation. Th is is illustrated in Table 2.3.
From the animal health and plant health sectors, the concept of surveillance is to look for signs of diseases or pests (versus to determine the level of health or well-being, per se, as one might when working for conservation of biodiversity). In that context, health, then, might be considered high with the absence of detections of diseases or pests, although proving a negative status of no disease is always harder than proving the presence of a disease.
It is possible that some of the objectives for a good biosecurity programme are not easy to articulate, as they may evolve and appear as part of the process of discovery in the new paradigm of cooperation.
2.3.4 Cultural shifts towards collaboration and synergy
Cook et al. (2010) discuss adaptive governance as needed for invasive species which lie outside the historic division of animal and plant health. Some entire categories of disease and pests have passed through the metaphorical ‘net’ even when potentially covered by a public authority. Th is was the case with multiuse woody species and new sources of forage introduced in the 1980s, shrimp disease and diseases introduced through fi sh stock (Murray and Peeler, 2005), serious aquatic weeds in the fi rst decade of 2000, and several severe tree pests over the past decade (Brasier, 2005). Although some of these were addressed by existing authorities, the responses were reactive and of limited impact.
A major obstacle is the lack of information about new threats to bio-security. Even as a threat is identifi ed, the probabilities surrounding its occurrence and possible economic consequences make the decision process diffi cult and seemingly indefensible. Cook et al. (2010) make the bold statement that: ‘In the face of uncertainty and ignorance, eff ective risk management requires that institutions change their behavior in response to new

Biosecurity Surveillance in Agriculture and Environment 19
Table 2.3. Aims and benefi ts of biosecurity and biosecurity surveillance.
Organization/country Aims and benefi ts of biosecurity surveillance Reference
Victorian Department of Primary Industries
..it ‘develops policy, standards, delivery systems and services that reduces the threat of invasive plants and animals to agriculture and the natural environment, protects animals and plants from pests and diseases, enhances food safety, ensures minimal and effective chemical use, protects the welfare of animals and preserves and expands market access for Victoria’s primary industries’.
State Government of Victoria, Department of Primary Industries (2010)
Western AustraliaDAF
Benefi ts of biosecurity:
• minimization of the risk of exotic diseases and agricultural pests;• eradication of diseases;• minimization of costs to producers by keeping pests, diseases and
weed out of the State;• increased access to markets by ensuring that produce is as free as
possible from pests and chemicals; and• customer confi dence in clean, safe products.
Government of Western Australia, Department of Agriculture and Food (2010)
New Zealand Post-border surveillance is undertaken for a variety of reasons, some of the most important being:
• to give evidence that a pest or disease is absent from a country, region or defi ned area, thus enabling access to particular export markets;
• to detect new pests and diseases early enough to enable cost-effective management;
• to establish the boundaries of a known pest or disease incursion; and
• to monitor the progress of existing containment or eradication programmes.
MAF Biosecurity New Zealand (2009)
Canada (animals)
Looking beyond the direct economics of disease reduction, the benefi ts of implementing on-farm biosecurity practices are signifi cant. For producers, they include:
• improving animal health and welfare;• keeping out new diseases;• cutting the cost of disease prevention and treatment;• reducing the use of medication, such as antibiotics, with an
associated reduction in the risk of emergence of resistant pathogens;
• producing safe, wholesome, and high-quality products;• increasing consumer and buyer confi dence;• protecting human health;• minimizing the potential for farm income losses;• enhancing the value of the herd; and• maintaining and accessing new markets for genetics.A Biosecurity Plan provides overall benefi ts to the dairy industry in
that it:• decreases economic losses from some diseases that cannot be
treated or controlled using vaccinations or other management strategies (e.g. mastitis, Johne’s disease);
• helps to prevent the introduction of foreign diseases;• controls the spread of infection from region to region and farm to
farm;• facilitates early recognition of emerging disease threats;• prevents zoonoses;• produces safe wholesome milk and meat;• negotiates more favourable global trade policies; and• maximizes genetic export markets by the prevention of disease.
CFIA (2013)

20 Megan Quinlan et al.
understandings about how the world operates.’ Th ey argue that rather than the pre- to post-border continuum, biosecurity must rely on active networking across all nodes of data collection, analysis and policy formulation and risk management.
Th e shift towards biosecurity may require additional expertise and resources to support a consultative and iterative approach, such as for increased com muni-cations. Greater agility and responsive ness, as well as the willingness to incorporate new information, is part of the changes needed (Cook et al., 2010). Th e hallmark of a good biosecurity programme is the ability to understand, ‘live with’ and, at all oppor-tunities, address the uncertainty and lack of information typical of these topical areas and previously lost in legislative gaps, or left unaddressed due to resource limitations.
Th ese cross-sectoral interactions provide greater opportunity for replicating success ful strategies or methodologies in one sector, to another. For risks to aquaculture resources, Murray and Peeler (2005) created a framework combining risk-analysis methods and virulence theory with historical examples (mainly from salmonid pro duction) to identify key disease-emergence risk factors. Th ey proposed treating hatcheries and slaughterhouses and other points of possible cross contagion, with strict biosafety-type procedures for pre vention of disease emergence.
2.3.5 Systematic analysis of risks and risk management
We have already touched on the inherent need for systematic analysis as a cornerstone to biosecurity, and the following sections elaborate this theme.
Th e lack of ongoing surveillance of wild populations of animals is considered a serious weakness to the early alert of new human diseases, because so many new epidemics arise from zoonoses (Offi ce of Science and Innovation, 2006). Th is study in future synergies between human, animal and plant surveillance names three principles for improvement:
• making better use of existing data;• focusing monitoring better; and• ensuring that the mandates and re -
sources of key organizations match the need.
2.4 Biosecurity Surveillance Activities
Agricultural and environmental biosecurity surveillance programmes include both legislative and collaborative programmes operating at multinational, regional, national and local levels. Th e growing importance of biosecurity both conceptually and operationally has meant that it is now not only a priority of government agencies, but also a political priority. Th is is refl ected in the appointment of Ministers for Biosecurity (e.g. New Zealand, Australia, Bhutan, the Gambia), the emergence of national bio-security strategies (New Zealand, Australia) and the development of biosecurity legislation (e.g. New Zealand, Fiji, Samoa) (Frampton, 2010). Many countries have national legislative and agency programmes for biosecurity surveillance. In the context of plants, examples include USDA/APHIS (USDA/APHIS, 2013), Biosecurity Australia (Biosecurity Australia, 2007), the New Zealand Ministry for Primary Industries (New Zealand Government, Ministry for Primary Industries, undated), the National Biosecurity Commission and Biosecurity Policy of the Kingdom of Bhutan (Frampton, 2010) and so on.
Th e scale of operation of agricultural and environmental bio security surveillance programmes may be defi ned by the area where a disease or pest outbreak has been contained, or conversely, an area free from the outbreak, or it may be defi ned by the area of importance to the stakeholders, such as protected areas, national parks or areas of high biodiversity (hot spots) or genetic centres of origin.
A number of research organizations and a wide range of individual researchers have focused on these issues. Two such research groups include the Australian Centre of Excellence for Risk Analysis

Biosecurity Surveillance in Agriculture and Environment 21
(ACERA; www.acera.unimelb.edu.au) and the UK-based Food and Environment Research Agency (FERA; www.fera.defra.gov.uk), for merly Central Science Laboratory (CSL).
FERA’s key areas of statistical capability include uncertainty, modelling and risk assessment. Th e types of activities listed by FERA include: (i) wildlife rabies contingency modelling for use in an outbreak; (ii) modelling potential badger management strategies for the reduction of bovine tuberculosis in cattle herds in England, Wales and Northern Ireland; (iii) a computer simulation study to evaluate resistance-delaying control strategies with novel anthelmintic products on UK sheep farms; and (iv) modelling European foul brood in the honeybee.
In addition to a comprehensive set of reports that contribute substantially to knowledge and practice of statistical modelling, design, and risk and uncertainty in environmental biosecurity, ACERA also has a focus on the elicitation of expert information and the incorporation of this information into risk assessment (Burgman, 2005; Low Choy et al., 2009).
Large national programmes that address agriculture and environmental biosecurity have also been established. An example is the Australian Cooperative Research Centre (CRC) on National Plant Biosecurity (NPB) which was established in 2005 and renewed in 2012. Th e CRC comprises around 25 entities drawn from government, research organizations, universities and industry groups. Th e original CRC produced a number of web-based applications, three of which are: (i) the Plant Biosecurity Toolbox, which provides detailed diagnostic infor mation (biology, taxonomy, detection, identifi cation) about exotic pests and diseases; (ii) the Pests and Diseases Image Library (PaDIL) which provides high-quality image and information tools to facilitate research and management in biosecurity and biodiversity; and (iii) the Remote Microscope Network (RMN) (Th ompson et al., 2011) system, which links fi eld offi cers with national and international experts to speed up the identifi cation of potential biosecurity threats. Th e renewed
CRC has four main programmes focusing on: (i) tools, technologies and strategies for early warning of new and emerging plant pest threats; (ii) monitoring and surveillance for eff ective detection and response; (iii) safeguarding international trade and managing estab lished pests; and (iv) working with community, government and industry to safeguard Australia for a secure future.
A similar CRC was created in Australia to address animal biosecurity. Th e three programmes of the CRC were Technologies to Enhance Detection, Ecology of Emerging Infectious Diseases, and Advanced Sur-veillance Systems. Th e key highlights of the Advanced Surveillance Systems programme included: (i) the development of an internet-based epidemiological calculator for estimating disease prevalence from pooled prevalence (www.ausvet.com.au); (ii) a bovine syndromic surveillance system (www.ausvet.com.au); (iii) a new sugar ‘lure’ for mosquitoes; (iv) software that analyses disease surveillance data to provide an estimation of a country’s confi dence in freedom from disease (www.ausvet.com.au); and (v) an electronic system for linking livestock movements to property data using the National Livestock Identifi cation System (NLIS).
2.5 Statistical Issues and Approaches in Biosecurity Surveillance
Th is book focuses on statistical issues and corresponding statistical approaches to biosecurity surveillance. In this chapter we provide an overview of some of these issues as a prelude to the more detailed discussions that follow.
Many of the key statistical issues can be described under three broad headings:
• Modelling: building models to describe and predict pest introductions, spread and outbreaks.
• Design: designing surveillance pro-grammes, determining necessary survey eff ort, optimal allocation of resources in surveillance and response.

22 Megan Quinlan et al.
• Risk and uncertainty: characterizing risk and uncertainty in these model-based descriptions and predictions.
A range of approaches have been used to underpin the statistical models suggested for agricultural and environmental bio-security surveillance. Th ese range from control charting techniques (Fox, 2006) to hierarchical models (Stanaway et al., 2011) and systems models (Mengersen et al., 2012).
Control charts can be used to monitor processes such as counts of pests or pest presence/absence, or related measures of interest such as time to detection. Th ey provide signal or alert systems if the process exceeds a predetermined threshold or exhibits non-random patterns. Potential reasons for the signal can then be investigated. Th e broader range of quality monitoring techniques can also be used to determine the capability of a surveillance system to meet specifi ed requirements. An example of their use is for syndromic surveillance and anomaly detection (Fox, 2006).
Hierarchical models allow the explicit description of observation-level and process-level characteristics of pest introduction, spread or outbreak. An example of this is a Bayesian model for surveillance of spiralling whitefl y in Australia (Stanaway et al., 2011), in which surveillance and ecological information are used to estimate invasion extent and model parameters for invading plant pests spread by multiple dispersal modes, in particular by people. Th e model explicitly incorporates uncertainty in the observation process by allowing for local natural spread and population growth within spatial units.
Systems models typically take a broader perspective of the biosecurity surveillance process. A Bayesian network (BN) is a form of systems model that has been increasingly widely used in biosecurity. A BN is a type of graphical model that describes the factors that impact on or are associated with a response of interest (such as absence of a pest), and their (often complex) interactions. Th e model is then quantifi ed, often using
information drawn from a range of sources including observations, literature, expert judgement, and so on. Th e quantifi ed model then allows an assessment of the overall probability of the outcome (e.g. probability of pest freedom), identifi cation of major factors contributing to the outcome and scenario (‘what if ’) assessment (Johnson and Mengersen, 2012). BNs are currently being used for pest risk management in the Beyond Compliance project, an international project based in South-east Asia (Mengersen et al., 2012).
Th ere have been a variety of approaches to biosecurity surveillance design. Th ese include designs constructed to meet specifi c constraints (Barrett et al., 2009; Hester et al., 2012), simulation-based approaches (Potts et al., 2012) and model-based designs.
Constraint-based surveillance designs, also sometimes known as risk-based designs, ensure conformance to specifi c requirements such as a cost threshold or a guaranteed power to detect a species if it is present. An example of such a design for detecting the introduction of exotic plant and animal pests on Barrow Island in Australia is provided in Chapter 11, this volume. Software such as EpiTools (Sergeant, 2009) can also be used for this purpose, as demonstrated in the design of a surveillance system for citrus canker in the Northern Territory of Australia (Hester et al., 2012). Th is tool can also be used for animal surveillance designs, for example to estimate disease prevalence or demonstrate freedom from diseases in animal herds (Sergeant, 2009).
Simulation-based approaches can provide a way of evaluating the potential outcomes of a proposed surveillance design, such as the predicted risk of non-detection, pest spread or outbreaks. Th e simulation models are also for evaluating the impact of diff erent design assumptions. Th e effi cacy of this approach has been evaluated for the citrus canker surveillance problem mentioned in the previous paragraph.
Many of the approaches described above are discussed in more detail in subsequent chapters of this book. For specifi city here,
Biosecurity Surveillance in Agriculture and Environment 23
we focus on a review of a range of statistical modelling approaches to agricultural and environmental biosecurity surveillance.
2.6 Statistical Modelling Approaches
2.6.1 Statistical requirements
Biosecurity aims to manage the risks of invading arthropod and disease pests by carrying out pre-border, border and post-border control activities. Mitigation of risks is a bioeconomic management issue and the strategic decision-making process has benefi ted from modelling both the probabilities and the consequences of pest invasions (Myers et al., 1998; Cook, 2005; Waage and Mumford, 2008; Carrasco et al., 2010a,b; Epanchin-Niell and Hastings, 2010). Ideally, risks are managed before pests breach the border but once an incursion has occurred, the task becomes one of eradication, minimizing spread or reducing the consequences in invaded areas. From a tactical point of view, post-border management of incursions requires spatial inference to manage pests at an operational level. Post-border surveillance provides the data used to infer the likely extent of invading pests over time so that regulators can confi dently manage movement pathways and pest control strategies.
Post-border surveillance activities that feature in plant biosecurity risk management include early detection, area freedom and response surveillance (McMaugh, 2005). Early detection surveillance aims to detect pests in an area before they become too widespread to eradicate (Hulme, 2006). Th ese programmes target surveillance at areas with a predetermined high probability of a pest being present (Wotton and Hewitt, 2004; Stark et al., 2006; Hadorn and Stark, 2008). Managers are interested in how to best deploy early detection surveillance over space and time, while balancing the cost of surveillance against the expected benefi t of timely eradication or control (Myers et al., 1998; Prattley et al., 2007).
Once an exotic pest is detected, the major economic threat facing producers is
the suspension of access to international and domestic markets until the extent of the incursion can be demonstrated. Area freedom surveillance aims to provide suffi cient evidence to satisfy the importing markets that the probability of moving the pest through trade from particular areas is low (Aluja and Mangan, 2008; Plant Health Australia, 2010). Guidelines for establishing areas of low pest prevalence have recognized that area freedom is not a necessary requirement for market access negotiations (IPPC, 2008; Lloyd et al., 2010). However, they have rarely been implemented due to concerns over ecological (and operational) uncertainty within quarantine systems (Aluja and Mangan, 2008).
Delimiting extent is not only necessary for maintaining trade but is also needed for managing eradication or long-term con-tainment programmes (Cacho et al., 2010; Carrasco et al., 2010c). Ongoing surveillance provides information about the extent of pests over time so that movement restrictions and control measures can be regulated most eff ectively. Each of these applications requires the spatial extent of the pest to be reliably estimated over time (Cacho et al., 2010). While inference on the probability of pest extent provides the foundation for decision making, the spatial statistics for analysing the dynamic extent of invaders are generally not available to the agencies that manage incursions.
Th e initial design of any biosecurity investigation needs to consider the spatial units used for decision making, data collection and ecological modelling (Graham et al., 2004). In continuous space, a bounding polygon can be constructed around a population. For incursions, where non-con tiguous satellite populations are com-mon, some meaningful ecological or management resolution is needed to defi ne the functional boundaries (Burgman and Fox, 2003). More commonly, species distribution models seek to assign a value for presence or absence to discrete cells. Th ese cells may be arranged on a continuous regular grid (Argaez et al., 2005; Royle et al., 2007) or may consist of an irregular patch-work (Gumpertz et al., 2000).

24 Megan Quinlan et al.
At fi ne resolutions, the eff ective extent of an invading plant pest is restricted to those individual hosts that are capable of sustaining the pest throughout its life cycle. Hosts may be logically arranged for the purposes of analysis into fi elds, farms or other landholdings. Alternatively, arbitrary areas may be related to pest habitat based on the density of hosts. Environmental constraints, such as weather conditions and soil types that operate at broader scales may also be used to restrict the area at risk. As host landscapes are all fragmented on some scale (With, 2002), it may be necessary to break the spatial domain down into discontinuous habitat patches for a particular analysis (Leung et al., 2004; Moilanen, 2004). Statistics that estimate the extent of an incursion need to accommodate the choice of spatial scale on two fronts. First, the model outputs need to be at a spatial resolution that is useful for making management decisions. Secondly, models that include invasion ecology must be at a resolution that can adequately represent the dynamics of spread over time. Th e choice of a geographic model is therefore integral to the modelling process and the parameterization of these models.
Ultimately, the managers of invading pests seek to map the probable spatial extent of a pest at the current time (or at some time in the future) based on all of the infor mation available. Th ese maps can: (i) defi ne con-tainment lines for pest control (Plant Health Australia, 2010); (ii) help negotiate access to markets for produce from areas considered free of pests (Jorgensen et al., 2004; Martin et al., 2007; Lloyd et al., 2010); and (iii) be used to deploy surveillance resources to maximize the information required to make decisions (Prattley et al., 2007; Barrett et al., 2009; Davidovitch et al., 2009). Biosecurity programmes generally seek to simplify the population char-acteristics of an incursion into the presence or absence of pests over space and time. Even low populations of a pest represent a threat to the future management of an incursion. As the location of each organism comprising the invasion is not known, the process of delimiting the extent becomes
one of estimating the hidden or latent extent at a particular time (Clark, 2005). Typically, visual inspection of hosts backed up by diagnostic tests provides the data, which are used to demonstrate that areas are pest free. However, these data are far from complete. Th e sites or areas to which observations of presence or absence are attributed may only be partially examined and even at a single plant scale, pests may be overlooked if the symptoms are not apparent to the observer (Bulman et al., 1999; Fitzpatrick et al., 2009; Gambley et al., 2009). In order to infer the probability of pest absence for an area, an observation process must be modelled to accommodate potential false absence records that apply to the spatial unit of interest (Kery, 2002; Tyre et al., 2003; Meats and Clift, 2005).
If a pest is present in an area, false absence records are, to a large extent, dependent on the density of the pest population in that area (Royle and Dorazio, 2006; Kery et al., 2006; Cacho et al., 2010). Observation models alone can only be used to provide evidence against presence at a particular population intensity. It is the loss of power for observations to detect pests at low levels that challenges the delimiting of pest extent (Delaney and Leung, 2010). To infer pest absence in an area, additional information about a pest’s likely intensity must be introduced into the analysis. Information about pest intensity needs to be derived from the particular reproductive and spread characteristics of a pest. Statistically, this is expressed by the in -trinsic spatial and temporal correlation within a pest population (Wintle and Bardos, 2006). Dynamical models for the invasion process can mathematically specify spread mech anisms (and parameter uncertainty) to allow structured ecological information to be incorporated into the statistical analysis (Gibson et al., 2006; Hooten et al., 2007).
Inference on the geographic distribution of an invading pest over time is operationally impossible without combining information from observations and the ecology of the pest. Observational data collected by surveillance for diff erent pests could have

Biosecurity Surveillance in Agriculture and Environment 25
quite diff erent interpretations for manage-ment depending on the reproduction and dispersal dynamics of the organisms. Similarly, while the distribution of a pest is governed by its intrinsic ecology or epidemiology, quite diverse incursion scenarios could unfold, given any particular introduction event. It is the role of biosecurity surveillance to tie the process of invasion to the landscape so that appropriate management decisions can be made. Quantitative modelling of surveillance data and invasion dynamics provide a way forward to assimilate this information and embed it into biosecurity decision making.
2.6.2 Pest observation models
Statistical interpretation of biosecurity sur-veillance requires an observation model that describes the imperfect signal that an observer receives about the true pest population when visiting a site. Traditionally, surveillance focuses on the visual inspection of hosts or sampling of material, but similar models can be applied to other signal detection data such as background passive surveillance (Cacho et al., 2010), trapping (Barclay and Hargrove, 2005; Meats and Clift, 2005) and remote sensing (Wang, 2009). In most plant health surveillance systems, false positives are unlikely and so observation of the pest (and subsequent diagnostic confi rmation) is considered suffi cient evidence that it is truly present. Th erefore the primary goal of observation models in plant biosecurity applications is to analyse evidence for pest absence at a site.
Biosecurity surveillance data typically consist of observational outcomes, generally presence/absence, attributed to a geographic area that is usually referred to as a site. Th e spatial defi nition of a site is somewhat arbitrary, where the area may consist of a single plant, a fi eld, a farm or some other functional management area. A site may be subdivided into counted units that are assumed to be independent and identically distributed so that standard statistical models can be applied. Th e spatial defi nition of a site is integral to the construction of the
observation model (MacKenzie, 2005). Th e analyst must be mindful of the relationship between the outcome recorded, the latent state inferred and the eff ect of spatial aggregation of information within the model components.
Th e probability that a pest is observed within a site can be considered a function of the search intensity (e.g. plants inspected, time spent, area covered) and the expression of the pest within the sampling frame (Kery, 2002). Consider a pest that is present on a particular number of plants at a site and is perfectly observed. If the proportion of plants inspected from the area is relatively small, the probability of not detecting the pest may be adequately modelled by the binomial distribution. Under the assumption that the plants selected are exchangeable, this model can be used in the frequentist form to arrive at a confi dence level for a predetermined prevalence (Cannon and Roe, 1982). If the proportion of plants inspected is large, the observation model may instead be based on a hypergeometric distribution (Cameron and Baldock, 1998; Hanson et al., 2003). Where the measure of search intensity is the proportion of the area surveyed, or search time, a Poisson distribution provides a further option. Th ese basic statistical functions for modelling count data from observations can be implemented in frequentist analyses or they can be used to provide the likelihood component of a Bayesian approach (Hanson et al., 2003; Johnson et al., 2004).
Imperfect examination of those units that constitute the measure of search intensity is commonly referred to in the epidemiology literature as test sensitivity (Cannon, 2001; Bohning and Greiner, 2006; Gambley et al., 2009) and in ecological studies as detectability (Wintle et al., 2005; Royle, 2008). Overestimation of detectability will result in underestimates of pest distribution that can severely compromise population management decisions (Myers et al., 1998; Wintle et al., 2004). Th e simplest approach to imperfect detection is to use a point estimate of detectability to reduce the search intensity in the observation model (Martin et al., 2007).

26 Megan Quinlan et al.
Detectability on an infested unit may be infl uenced by a number of factors, for instance, observability due to tree archi-tecture (Gambley et al., 2009), terrains (Hauser and McCarthy, 2009) or diff erences in observer experience (Gambley et al., 2009; Christy et al., 2010). Variation in individual pest behaviour may also result in mixtures of detectability (Royle, 2006; Christy et al., 2010), as can spatial clustering on units within the site (Gschlossl and Czado, 2008). Where there is epistemic uncertainty surrounding the detectability parameter, or detectability is expected to vary between units, the data can be treated as being overdispersed (Potts and Elith, 2006). Th e beta-binomial distribution is one analytically tractable form for estimating detectability in a Bayesian framework that has led to its widespread use (Clark, 2003; Gelman et al., 2004; Th ebaud et al., 2006; Hooten et al., 2007). Data from overdispersed Poisson processes may likewise be modelled using a negative-binomial distribution (Royle, 2004; Gschlossl and Czado, 2008).
Another class of models for dealing with overdispersion in presence/absence analyses are the zero-infl ated binomial and zero-infl ated Poisson models (Hall, 2000; Branscum et al., 2004; Wintle et al., 2004; Martin et al., 2007). For pest count data in a binomial setting, the models consider the outcomes of the observation process to be either zero or binomial depending on the pest status. Royle (2006) recommends caution when using zero-infl ated models to infer population sizes at low densities. Th erefore, despite their simplicity, these models may have limited value in estimating pest absence for biosecurity applications. Most biosecurity surveillance programmes are limited to the collection of presence/absence data, suggesting that logistic regression models to predict the status of sites are given some additional covariate data such as host status or environmental favourability (Kery, 2002; Gelman et al., 2004).
In a Bayesian setting, the foundation observation models discussed so far provide the likelihood function for analysis. Uncertainty in detectability can be defi ned
by specifying a prior distribution on the hyperparameters for overdispersed models or for random eff ects and parameters in logistic regression. Priors may be derived from plausible values provided by experts, or from existing empirical evidence (Hooten et al., 2007).
In addition to uncertainty about detectability, it is also necessary to consider the potential expression of the pest in the context of the invasion process. A major source of variation in detectability will be the size of the population within the observation unit (Royle, 2006; Harwood et al., 2009). As an area is invaded, both the number of infested units and the probability of detection on individual units will increase. At the margins of the range, pest expression is expected to be poor and therefore models will lack inferential power (Barrett et al., 2009). Th e evidence for absence used for mapping extents is therefore sensitive to the way in which the observation model processes the pest signal at low population levels.
Pest observation outcomes recorded at some point in space and time are generally interpreted as applying to some spatio-temporal vicinity (Yoccoz et al., 2001). Observations taken at a site at one time are expected to refl ect the true status at times in the recent past and future. Temporal discounting of surveillance data has been examined for herd-based sampling in veterinary epidemiology given continued exposure to infection (Schlosser and Ebel, 2001). In a similar way, observations in one area are expected to contain information about nearby or connected areas.
Autocorrelation of the pest status in space and time is a function of the invasion ecology of the organism. It is recognized that the assumptions required of simple inferential probability models are usually violated in the face of spatial autocorrelation (Legendre, 1993; Wintle and Bardos, 2006). To delimit extent, the observation process must be modelled in relation to internal processes within the observation unit, but this must also be supported by the external processes that give rise to interdependencies with other units. In the following section,

Biosecurity Surveillance in Agriculture and Environment 27
invasion process models are introduced to defi ne some ecological processes that give rise to spatial and temporal correlation.
2.6.3 Invasion process models
General reviews on invasion ecology can be found in Mack et al. (2000), Puth and Post (2005), Liebhold and Tobin (2008), Simberloff (2009) and With (2002). Th e spatial realization of an invasion process over time is the result of the birth, dispersal and death of many individual organisms. As the extent of an invasion evolves as a dynamic process, considerable heterogeneity and spatial dependence is displayed in the distribution patterns (Hastings et al., 2005). Spatial correlation can be due to similar underlying environments as well as being intrinsic to the dispersal process itself (Wintle and Bardos, 2006). Th e probability of a pest being present in a particular area can be modelled as a function of the dispersal-mediated connections with infested sites and the time over which those connections exist (Jerde and Lewis, 2007).
Invasion processes can be broken down in diff erent conceptual ways, depending on the components of interest to particular applications (Simberloff , 2009). Component processes of interest can include introduction (entry), colonization, establishment and spread (Mack et al., 2000; With, 2002; Hennessey, 2004; Lockwood et al., 2005; Hulme, 2006; Drake and Lodge, 2006). For brevity, we lump the fi rst three processes under the heading of colonization and then look at dispersal. In this simplifi ed framework, colonization deals with the internal processes within a defi ned area while dispersal deals with the exchange of organisms between areas.
In simplest terms, colonization is the process of a defi ned area going from uninfested to infested. As any infested area poses a biosecurity risk, estimating colonization events is fundamental to the spatial management of invasive pests. Much work has focused on colonization across national borders (Drake and Lodge, 2006; Holmes et al., 2009; Simberloff , 2009). Th e
IPPC adopts the terminology of endangered areas to identify a region that favours the establishment of a pest of concern, while establishment is defi ned as the perpetuation of a pest in an area for the foreseeable future (FAO, 2012). Here we consider the colonization process as applying to any area of interest for which the pest status is sought. Th e process encompasses the intro-duction of the pest into the area, followed by successful reproduction and leading to permanent establishment. Considerable work has gone into identifying the intrinsic biological characteristics of successful invaders (Johnson et al., 2006). However, the most reliable indicators of invasion success across taxa appear to be extrinsic factors such as climate/environment similarity and the number of pest propagules introduced (Jarvis and Baker, 2001a; Rouget and Richardson, 2003; Hayes and Barry, 2008).
Habitat suitability, in particular the availability of suitable host plants and climatic requirements, has a major impact on the probability that an area will be colonized. Climate matching has proved to be one of the most useful estimators for the ultimate distribution of an invading organism (Sutherst and Maywald, 1985) but comes with some caveats. Biogeographic predictive models based on environmental covariates in the native range of a pest can lead to erroneous estimates of fi nal extent, either due to genetic diff erences in the invading population or due to diff erent relationships between the pest and unidentifi ed covariates (Fitzpatrick et al., 2007). It also needs to be recognized that the destination areas encompass both spatial and temporal environmental variation (Jarvis and Baker, 2001b; Simberloff , 2009).
Th e exposure of an area to the risk of pest introduction is commonly referred to as propagule pressure (Leung et al., 2004; Lockwood et al., 2005; Carrasco et al., 2010b). A propagule is a group of one or more organisms that enters an area at a particular time, while the propagule pressure is the total exposure of an area to these over some period of time (Simberloff ,

28 Megan Quinlan et al.
2009). Exposure assessments for environ-mental pollutants have used epidemiological risk characterization techniques at a sophisticated level (Nieuwenhuijsen et al., 2006) but these are yet to be investigated rigorously with respect to colonization in invasions (Stohlgren and Schnase, 2006). Of interest to biosecurity are estimates of the probability that an area is free of a pest at some time. One approach is to implement discrete time models for the number of propagules arriving at a destination and surviving. Jerde and Lewis (2007) adopt a Poisson model for the survivors as the sum of movements from all pathways into the destination and use a geometric distribution to estimate the waiting time for a colonization event in discrete time. A similar approach was used by Leung et al. (2004).
Th e fate of organisms between entry and establishment is one of the great unknowns of invasion biology (Puth and Post, 2005), and is perhaps the most diffi cult process to parameterize. Early stages of the colonization processes are poorly under-stood, most notably because they are rarely observed and there is little empirical evidence on processes that lead to establishment (Simberloff , 2009). A handful of studies have attempted to quantify the number of propagules being moved along pathways (Stanaway et al., 2001; McCullough et al., 2006; Lee and Chown, 2009), however, these are diffi cult to relate to the establishment of populations in new areas.
Successful establishment is based upon the fates and reproductive success of what is generally a small founding population (Kawasaki et al., 2006). Th erefore, stochasticity plays a central role in under-standing and modelling the colonization process. In particular, there is potential for initially low rates of population increase and spread, known as Allee eff ects, that can cause local extinction after the introduction (Hastings, 1996; Foley, 2000; Keitt et al., 2001; Dennis, 2002; Drake and Lodge, 2006). While Allee eff ects may contribute signifi cantly to the success and expression of the colonization process, prohibitively intensive collection of data from populations at low densities may be needed to quantify
this eff ect (Kramer et al., 2009). In order to defi ne the hierarchical link between observations and pest status, models of colonization need to represent the population states within the area over time. Given that it is diffi cult to collect empirical information on the colonization phase, much of the burden for providing prior ecological knowledge falls upon dispersal models.
Invasive pests can spread by a number of natural dispersal mechanisms, including along drainage lines, wind-assisted fl ights (Reynolds and Reynolds, 2009) or active fl ight (Guichard et al., 2010). Additional human-mediated dispersal pathways may also exist on nursery stock (Smith et al., 2007), produce (Areal et al., 2008) or simply as incidental hitchhikers (Ward et al., 2006). Spatial connectivity processes for natural dispersal and human-mediated dispersal underpin biosecurity management problems (Diggle, 2006).
Several spatial frameworks have been used to provide the scaff olding for modelling invasions and pest dispersal. On continuous space and time, the classic deterministic reaction–diff usion models of Skellam (1951), based on random movements of individuals, formed the basis of invasion research for decades. Integro-diff erence equations (IDE) off er a discretized methodology for implementing invasive dispersal with the fl exibility of diff erent dispersal kernels (Neubert and Parker, 2004). Dispersal kernels model the probability of movement between two areas as a function of Euclidean distance. While Gaussian kernels are commonly used (Havel et al., 2002; Wikle and Hooten, 2006; Chapman et al., 2007), other distributions used for dispersal kernels include Laplace (Lewis and Pacala, 2000; Neubert and Caswell, 2000), Cauchy (Mayer and Atzeni, 1993), exponential (Havel et al., 2002) and negative exponential (Chapman et al., 2007). Dispersal kernels with exponentially bounded tails lead to asymptotically constant rates of spread through continuous space, while others, for example the Cauchy distribution, can lead to accelerating rates of spread (Kot et al., 2004). One of the

Biosecurity Surveillance in Agriculture and Environment 29
drawbacks of IDEs is that they are deterministic and provide for a continuous distribution of organisms rather than a discrete distribution of individuals. Incorporating stochasticity on discrete individuals can slow the rate of spread (Kot et al., 2004) so that even fat-tailed kernels can lead to asymptotic rates of spread (Clark et al., 2001, 2003).
While continuous space models can have attractive mathematical properties, their application to heterogeneous environ-ments can be problematic. As biosecurity programmes frequently deal with spread through geographically fragmented host landscapes, another option is to look at the transfer rates of propagules between discrete areas. Connectivity models provide a more tractable framework for working with discrete patches that may exchange propagules (Urban and Keitt, 2001). Rates of exchange may again be modelled as a function of distances to known infested sites using the same dispersal kernels as for continuous landscapes. Gravity models to predict the colonization rates of lakes by zebra mussels have been one successful application of this approach (Bossenbroek et al., 2001). Similar approaches on lattices that defi ne connectivity as bond strengths between neighbouring areas are commonly used in epidemiology (Sander et al., 2002; Dybiec et al., 2004, 2005; Otten et al., 2004; Shirley and Rushton, 2005; Gibson et al., 2006; Zhou et al., 2006). As these models deal with the links between individual ecological units of interest, they off er readily interpretable statistics for the management of spread between areas (Urban and Keitt, 2001; Shirley and Rushton, 2005).
Incursions typically spread through adjacent areas at both fi ne and coarse scales (Scherm et al., 2006). Most invasive species arrive in countries due to the activity of people and continue to travel on similar human-mediated pathways after arrival as well as by natural dispersal. Invasion processes can be highly stochastic with the colonization of satellite sites outside of the contiguously infested area, a major driver of the overall spread (Lewis and Pacala, 2000; Neubert and Caswell, 2000). Empirical
evidence for the dispersal distances of individuals is diffi cult to collect but can be used to estimate dispersal kernels (Kareiva, 1983; Hawkes, 2009). Where long-distance movement is a prime contributor to invasions, uncertainty about rates of spread can prohibit meaningful inference about distribution (Clark et al., 2003).
Plant biosecurity surveillance is de -ployed and evaluated according to some (generally informal) underlying mechanistic model of pest ecology (Plant Health Australia, 2010). While mechanistic models may be formulated diff erently, the spatial realization of these models may be similar (Wikle, 2003). What is more important for managing high-priority plant pests is that the model can be translated into operational use for the appropriate management units, whether they are countries, districts, farms, blocks within a farm, trees within a block or a continuous landscape of wild hosts. Pest spread across a landscape of plant host material requires critical examination as a spatial model (With, 2002). Whether it is for early detection, incursion management or to justify pest-free areas, these ecological models provide the dynamic context for interpreting surveillance data.
2.6.4 Statistical models
Statistical approaches to inferring extent commonly rely on generalized linear models to relate species distribution to environ-mental covariate data, however, such models ignore the intrinsic spatial correlation that is a feature of where individuals are found (Latimer et al., 2006; Wintle and Bardos, 2006; Dormann, 2007a; Hoeting, 2009; Beale et al., 2010). Auto-models provide an extension to regression models to allow the spatial covariance between sites within a neighbourhood to be admitted to the analysis (Besag, 1972, 1974). Th is auto -covariance term may be based on Gaussian, binomial or Bernoulli distributions.
In the broader class of auto-models, conditional autoregressive (CAR) models have been increasingly used for disease mapping applications (Lawson, 2009),

30 Megan Quinlan et al.
particularly as the algorithms to implement these models within Markov chain Monte Carlo (MCMC) software are freely available (Th omas et al., 2004). For the analysis of presence/absence data, autologistic models have become a mainstay of species distribution problems (Augustin et al., 1996; Huff er and Wu, 1998; Hoeting et al., 2000) although their performance under con-ditions of strong spatial association has been questioned (Dormann, 2007b; Carl and Kuhn, 2007). It is uncertain over what range of scenarios a predominantly spatial model can implicitly incorporate the temporal processes of invasions. Spatio-temporal extensions to the autologistic model have been applied to pest outbreaks under the assumption that the spatial and temporal components of the autocovariance are separable (Zhu et al., 2008). As dynamic processes in space and time may not be separable, explicitly modelled space–time processes must be developed for greater power of inference and interpretation of management strategies (Wikle and Royle, 1999). One of the main limitations of spatio-temporal auto-models for biosecurity applications is their inability to accommodate the dynamic nature of a pest invasion as it unfolds.
Wikle (2003) introduced reaction–diff usion equations for pest spread and reproduction into a hierarchical Bayesian framework to estimate arrival times of invading house fi nches. Th is and related studies (Wikle and Hooten, 2006; Hooten et al., 2007; Hooten and Wikle, 2008), used integro-diff erence equations with spatially varying diff usion coeffi cients to structure the spatial transition of populations in discrete time steps. As the parameter of interest was the spatially varying rate of spread, these authors specifi ed a log-normally distributed population process, but with the population set to zero according to some reasonable boundary conditions. While the hierarchical Bayesian modelling framework they developed marked a major advance in the analysis of invasion data, further extension of their models is required to focus the inference on the estimation of pest boundaries.
To delimit pest extent in a Bayesian model, inference on the pest status of each area of interest from the surveillance data requires some underlying invasion process. Gibson et al. (2006) describe a percolation model to estimate the disease infection times of plants on a lattice by considering the diff erence in colonization times between neighbouring plants to be exponentially distributed. A feature of biosecurity data is that often thousands of spatially referenced data points are collected but when detection probabilities are low, the information available to distinguish parameters can lead to poor convergence properties for highly parameterized models (Webster et al., 2008). Furthermore, incorporating the space–time information contained in these points into MCMC models becomes computationally prohibitive. Banerjee et al. (2008) and Latimer et al. (2009) propose predictive process models that may overcome some computational hurdles by modelling invasion processes at a manageable number of points in space and time.
Th e dimensional complexity of space–time models makes evaluation com-putationally intensive and requires research to determine workable incursion manage-ment scenarios. Some level of spatial and temporal model aggregation is required to partition the system into computationally (operationally) manageable components for which conditional probabilities of absence can be determined.
Quantitative analysis of biosecurity surveillance data faces some signifi cant hurdles for interpreting the distribution of invading species. Ecological complexity must be captured by process model such that they adequately portray uncertainty over space and time. On the other hand, assimilation of information from large data sets into high-dimensional models also imposes computational challenges for estimating extent and other parameters. Biosecurity managers need to make pest management decisions based on information from expert ecological opinion and from large spatio-temporal surveillance data sets. Moreover, decisions are often required urgently in the face of uncertainty. Th e

Biosecurity Surveillance in Agriculture and Environment 31
adoption of quantitative techniques will only occur when they directly support the management aims of biosecurity agencies within their operational decision-making environments.
2.7 Discussion
We opened this chapter with a discussion of two issues that impact on the future of biosecurity surveillance: (i) the defi nition of the term itself; and (ii) the activities that the term encompasses.
As indicated in the Introduction, the defi nitions of biosecurity, and even of biosecurity surveillance, are quite broad and the scope of these terms is evolving and expanding. While plant and animal health practitioners relate well to the term as familiar within their respective frameworks, they may drop the ‘plant and animal’ preface when discussing biosecurity, thereby recognizing it as diff erent from simply a combination of the previously existing two sectors. Biosecurity-related decision making depends critically on reliable evidence. A key source of such evidence is through surveillance. Th is requires not only careful design and implementation of surveillance schemes, but also appropriate statistical modelling and analysis of the surveillance outputs. Th is chapter has presented an overview of these approaches. Most of them are focused on the evaluation of risk, that is, the synthesis of the probabilities and consequences of pest entry, establishment and spread.
Eff ective analysis of surveillance data requires careful attention to the development of appropriate statistical models at both the design and the analysis stages of the surveillance activity. At the design stage, a geographic model can describe the spatial and temporal scales and units required for decision making, data collection and ecological modelling, as well as the potential area of pest risk, the hosts and pathways of the pest, and other key considerations. Th e geographic model must be complemented by an observation model that describes the presence/absence data obtained, or to be
obtained, in the surveillance study. Th is needs to take into account the survey and sampling design, the population char-acteristics of the pest, its potential pattern of incursion, the probability of missing the pest if it is present, and so on. Since the observation model can only provide evidence about presence at a particular population density, it must in turn be complemented by a spread or invasion model that describes the pest’s likely spatial and temporal intensity.
Th ese geographic models, observation models and invasion models are themselves comprised of sub-models that describe important components of the problem. For example, an observation model requires sub-models for pest detectability and for the status of the pest over space and time. Similarly, an invasion model requires sub-models that describe the spatial process of pest dispersal, which may include one or more deterministic reaction–diff usion rep re sentations, continuous space–time repre sentations, connectivity or gravity rep resent ations, or fully Bayesian stochastic representations. Th ese sub-models require careful choices of parameters and associated statistical distributions, which in turn inform the statistical analysis of the surveillance data. For example, the sub-model of pest detectability determines the manner in which overdispersion is dealt with in the resultant data, while space–time correlations will determine the method for temporal discounting of the surveillance data.
Not only must decisions be made about the form of the geographic, observation and invasion models and sub-models, but the statistical representations of the model components must also be carefully considered. A number of relevant statistical models have been described in this chapter, including generalized linear models and spatial autoregressive models to infer extent, reaction–diff usion and diff erence equations for pest spread and reproduction, and percolation models to infer pest status at an area of interest. Th ese models can be cast in deterministic, frequentist or Bayesian stoch-astic frameworks, or a combination of both.

32 Megan Quinlan et al.
Th e geographic, observation and invasion models are not independent. Components of one model are necessarily linked to components in the other models. For example, the sub-model that describes space–time correlations in the geographic model is strongly linked to the description of the dynamic processes of pest spread of space and time required in the invasion process model. Similarly, the geographic model will inform the component processes of entry, colonization, establishment and spread considered in the invasion model, as well as the habitat suitability sub-models that underpin these processes. Th e spatial and temporal scales determined in the surveillance design phase impacts on all of the models and the resultant analyses.
Th ere are many diffi culties in con-structing and employing these types of surveillance models. Th ese include: (i) the availability of required information in a timely manner; (ii) the decision making required to decide on the appropriate biological and statistical descriptions of the model components and processes; (iii) the computational imple ment ation of the statistical analyses; and (iv) the practical interpretation of the analytic results. It is important that these diffi culties are seen as an opportunity for improvement of the methods and tools used for biosecurity, rather than as an unassailable obstacle in evidence-based biosecurity decision making. Moreover, the development of these models can be viewed as an avenue for creating closer links between the various sectors and corresponding organizations involved in biosecurity. It is hoped that the summary provided in this chapter, along with the statistical issues and methods described in other chapters of this book, motivates further consideration and uptake of these approaches, as appropriate.
In this chapter we have reviewed the various defi nitions and characteristics of biosecurity surveillance and its place in the broader picture of plant and animal biosecurity. It is evident that while the general intent of biosecurity surveillance is consistent, there are diff erences among international, national and regional
organizations with respect to the particular defi nitions of biosecurity surveillance and the corresponding activities undertaken under its auspices. Th is is natural given the diff erent focal areas of these organizations and the environments in which they operate. However, as illustrated in this chapter, it has the potential to induce confusion and misalignment among stakeholders. Th is chapter thus serves the purpose of providing both a review and a clarifi cation of bio-security surveillance, to assist in creating a more consistent understanding of this fi eld.
Th is shared understanding of the defi nition of biosecurity surveillance leads naturally to an agreed understanding of the activities that it encompasses. Th is depends on a combination of intrinsic and extrinsic factors. Intrinsic factors include the organizational and operational aspects of biosecurity surveillance itself. Maintaining fl exibility and longevity in biosecurity sur-veillance programmes is a constant balancing act, since both are essential to eff ective surveillance. Moreover, sharing of infor-mation, including data and results, across organizations and programmes will become an increasingly important feature of future surveillance, particularly in light of globalization, climate change and new data sources. Th ese extrinsic factors also include population growth and trends, industrial-ization and new pathways such as the internet. Th ese will all infl uence how bio-security surveillance is conducted in the future.
Importantly, a key extrinsic factor is the placement of biosecurity surveillance in the broader biosecurity regime. For example, we have found that biosecurity goes much farther than the combination of animal and plant health, to provide more holistic coverage of biological threats, addressing naturally occurring, and accidental and intentional man-made threats to bio-diversity, health, food and even public safety. It is therefore important to identify the role that surveillance plays in the context of the other dimensions of this broader regime, in order to appreciate its value, optimize resources and improve outputs and outcomes.

Biosecurity Surveillance in Agriculture and Environment 33
Th ese current and future challenges in biosecurity surveillance, and the current diff erences in biosecurity defi nitions and activities identifi ed in this chapter, motivate the argument for a unifying epidemiological framework and a harmonization of approaches to biosecurity surveillance. Th is has the potential to lead to a more proactive than reactive approach to the fi eld of agricultural and environmental biosecurity in general (Waage and Mumford, 2008).
We close this chapter with the remark that one of the defi ning features of the body of eff ort in biosecurity surveillance reviewed here is collaboration. Not only is this collaboration required between geographic areas, but it is also needed between govern-ments, producers, processors, communities and other stakeholders. Th is is explicitly stated in the 2010–2013 Biosecurity Strategy developed by the state of Victoria in Australia which is ‘encapsulated in a vision of collaboration between government, industry and community to manage the state’s biosecurity risk profi le’ (State Government of Victoria, Department of Primary Industries, 2010). Th is strategy document states one of the primary drivers for biosecurity to be a scientifi c, regulatory and political priority: ‘No one entity, no matter how well resourced or prepared, can eff ectively act alone in responding to biosecurity threats’ (State Government of Victoria, Department of Primary Industries, 2010).
References
Acosta, H. and White, P. (2011) Atlas of Biosecurity Surveillance. 2011–May. Ministry of Agriculture and Forestry, Wellington, New Zealand.
Aluja, M. and Mangan, R.L. (2008) Fruit fl y (Diptera: Tephritidae) host status determination: critical conceptual, methodological and regulatory considerations. Annual Review of Entomology 53, 473–502.
Areal, F.J., Touza, J., MacLeod, A., Dehnen-Schmutz, K., Perrings, C., Palmieri, M.G. and Spence, N.J. (2008) Integrating drivers infl uencing the detection of plant pests carried in the international cut fl ower trade. Journal of Environmental Management 89, 300–307.
Argaez, J.A., Christen, J.A., Nakamura, M. and Soberon, J. (2005) Prediction of potential areas of species distributions based on presence-only data. Environmental and Ecological Statistics 12, 27–44.
Augustin, N.H., Mugglestone, M.A. and Buckland, S.T. (1996) An autologistic model for the spatial distribution of wildlife. Journal of Applied Ecology 33, 339–347.
Australian Government, Department of Sustainability, Environment, Water, Population and Communities (2013) Conservation of Australia’s Biodiversity: Invasive Species. Available at: www.environment.gov.au/biodiversity/invasive/index.html (accessed 15 March 2013).
Baker, R.H.A. (2012) An introduction to the PRATIQUE research project. Bulletin OEPP/EPPO Bulletin 42, 1–2.
Baker, R.H.A., Black, R., Copp, G.H., Haysom, K.A., Hulme, P.E., Thomas, M.B., Brown, A., Brown, M., Cannon, R.J.C., Ellis, J., Ellis, M., Ferris, R., Glaves, P., Gozlan, R.E., Holt, J., Howe, L., Knight, J.D., MacLeod, A., Moore, N.P., Mumford, J.D., Murphy, S.T., Parrott, D., Sansford, C.E., Smith, G.C., St-Hilaire, S. and Ward, N.L. (2007) The UK risk assessment scheme for all non-native species. In: Rabitsch, W., Essl, F. and Klingenstein, F. (eds) Biological Invasions: from Ecology to Conservation. Neobiota 7, 46–57.
Baker, R.H.A., Battisti, A., Bremmer, J., Kenis, M., Mumford, J., Petter, F., Schrader, G., Bacher, S., De Barro, P., Hulme, P.E., Karadjova, O., Lansink, A.O., Pruvost, O., Pyšek, P., Roques, A., Baranchikov, Y. and Sun, J.-H. (2009) PRATIQUE: a research project to enhance pest risk analysis techniques in the European Union. Bulletin OEPP/EPPO Bulletin 39(1), 87–93.
Banerjee, S., Gelfand, A.E., Finley, A.O. and Sang, H. (2008) Gaussian predictive process models for large spatial data sets. Journal of the Royal Statistical Society: Series B (Statistical Methodology) 70, 825–848.
Barclay, H.J. and Hargrove, J.W. (2005) Probability models to facilitate a declaration of pest-free status, with special reference to tsetse (Diptera: Glossinidae). Bulletin of Entomological Research 95, 1–11.
Barker, I., Brownlie, J., Peckham, C., Pickett, J., Stewart, W., Waage, J., Wilson, P. and Woolhouse, M. (2006) Foresight. Infectious Diseases: Preparing for the Future. A Vision of Future Detection, Identifi cation and Monitoring Systems. Offi ce of Science and Innovation, London.

34 Megan Quinlan et al.
Barrett, S., Whittle, P. and Mengersen, K. (2009) Biosecurity threats: the design of surveillance systems, based on power and risk. Environ-mental and Ecological Statistics 17(4), 503–519.
Beale, C.M., Lennon, J.J., Yearsley, J.M., Brewer, M.J. and Elston, D.A. (2010) Regression analysis of spatial data. Ecology Letters 13, 246–264.
Besag, J.E. (1972) Nearest-neighbour systems and the auto-logistic model for binary data. Journal of the Royal Statistical Society: Series B (Statistical Methodology) 34, 75–83.
Besag, J. (1974) Spatial interaction and the statistical analysis of lattice systems. Journal of the Royal Statistical Society: Series B (Statistical Methodology) 36, 192–236.
Biosecurity Australia (2007) Annual Report 2006–07. Australian Government Department of Agriculture, Fisheries and Forestry, Canberra.
Boa, E. and Reeder, R. (2009) Plant Disease Vigilance: New Disease Records from the Global Plant Clinic, 2nd edn, March 2009. CAB International, Rothamsted Research and Food and Environment Research Agency (Fera), Wallingford, UK.
Bohning, D. and Greiner, M. (2006) Modeling cumulative evidence for freedom from disease with applications to BSE surveillance trials. Journal of Agricultural Biological and Environmental Statistics 11, 280–295.
Bossenbroek, J.M., Kraft, C.E. and Nekola, J.C. (2001) Prediction of long-distance dispersal using gravity models: zebra mussel invasion of inland lakes. Ecological Applications 11, 1778–1788.
Branscum, A.J., Gardner, I.A. and Johnson, W.O. (2004) Bayesian modeling of animal- and herd-level prevalences. Preventive Veterinary Medicine 66, 101–112.
Brasier, C. (2005) Preventing invasive pathogens: defi ciencies in the system. The Plantsman (Royal Horticultural Society magazine) March, 54–57.
Bulman, L., Kimberley, M. and Gadgil, P. (1999) Estimation of the effi ciency of pest detection surveys. New Zealand Journal of Forestry Science 29, 102–115.
Burgman, M. (2005) Risks and Decisions for Conservation and Environmental Management. Cambridge University Press, Cambridge.
Burgman, M.A. and Fox, J.C. (2003) Bias in species range estimates from minimum convex polygons: implications for conservation and options for improved planning. Animal Conservation 6, 19–28.
Cacho, O.J., Spring, D., Hester, S. and MacNally, R. (2010) Allocating surveillance effort in the
management of invasive species: a spatially-explicit model. Environmental Modelling and Software 25, 444–454.
Cameron, A.R. and Baldock, F.C. (1998) A new probability formula for surveys to substantiate freedom from disease. Preventive Veterinary Medicine 34, 1–17.
Canadian Food Inspection Agency (CFIA) (2012) Biosecurity, a national standard and Canada’s beef cattle industry. In: Canadian Beef Cattle On-farm Biosecurity Standard. CFIA, Ottawa, Canada. Available at: www.inspection.gc.ca/animals/terrestrial-animals/biosecurity/standards-and-principles/bovine-biosecurity-standard/eng/1347287842131/1347292248382?chap=2 (accessed 3 June 2013).
Canadian Food Inspection Agency (CFIA) (2013) Biosecurity for Canadian Dairy Farms: National Standard. CFIA, Ottawa, Canada. Available at: www.inspection.gc.ca/animals/terrestr ial-animals/biosecurity/standards-and-principles/national-standard/eng/1359657658068/1359658301822#biosec (accessed 3 June 2013).
Cannon, R.M. (2001) Sense and sensitivity – designing surveys based on an imperfect test. Preventive Veterinary Medicine 49, 141–163.
Cannon, T. and Roe, R. (1982) Livestock Disease Surveys: a Field Manual for Veterinarians. Bureau of Rural Science, Department of Primary Industries. Australian Government Publishing Service, Canberra.
Carl, G. and Kuhn, I. (2007) Analyzing spatial autocorrelation in species distributions using Gaussian and logit models. Ecological Modelling 207, 159–170.
Carrasco, L.R., Baker, R., MacLeod, A., Knight, J.D. and Mumford, J.D. (2010a) Optimal and robust control of invasive alien species spreading in homogeneous landscapes. Journal of the Royal Society Interface 7, 529–540.
Carrasco, L.R., Mumford, J.D., MacLeod, A., Knight, J.D. and Baker, R.H.A. (2010b) Comprehensive bioeconomic modelling of multiple harmful non-indigenous species. Ecological Economics 69, 1303–1312.
Carrasco, L.R., Harwood, T.D., Toepfer, S., MacLeod, A., Levay, N., Kiss, J., Baker, R.H.A., Mumford, J.D. and Knight, J.D. (2010c) Dispersal kernels of the invasive alien western corn rootworm and the effectiveness of buffer zones in eradication programmes in Europe. Annals of Applied Biology 156, 63–77.
Chapman, D.S., Dytham, C. and Oxford, G.S. (2007) Modelling population redistribution in a leaf beetle: an evaluation of alternative dispersal functions. Journal of Animal Ecology 76, 36–44.

Biosecurity Surveillance in Agriculture and Environment 35
Christy, M.T., Adams, A.A.Y., Rodda, G.H., Savidge, J.A. and Tyrrell, C.L. (2010) Modelling detection probabilities to evaluate management and control tools for an invasive species. Journal of Applied Ecology 47, 106–113.
Clark, J.S. (2003) Uncertainty and variability in demography and population growth: a hierarchical approach. Ecology 84, 1370–1381.
Clark, J.S. (2005) Why environmental scientists are becoming Bayesians. Ecology Letters 8, 2–14.
Clark, J.S., Lewis, M. and Horvath, L. (2001) Invasion by extremes: population spread with variation in dispersal and reproduction. American Naturalist 157, 537–554.
Clark, J.S., Lewis, M., McLachlan, J.S. and HilleRisLambers, J. (2003) Estimating popu-lation spread: what can we forecast and how well? Ecology 84, 1979–1988.
Cock, M.J.W. (2003) Biosecurity and forests: an introduction – with particular emphasis on forest pests. Food and Agriculture Organization of the United Nations (FAO) Forest Health and Biosecurity Working Paper FBS/2E. FAO, Rome.
Committee of Experts on Phytosanitary Measures (CEPM) (1996) Report of the Third Meeting of the Food and Agriculture Organization of the United Nations (FAO) Committee of Experts on Phytosanitary Measures, 1996. FAO, Rome.
Committee of Experts on Phytosanitary Measures (CEPM) (1997) Report of the Fourth Meeting of the Food and Agriculture Organization of the United Nations (FAO) Committee of Experts on Phytosanitary Measures, 1997. FAO, Rome.
Convention on Biological Diversity (CBD) (2012) Standards, guidance and relevant activities of the organizations that support parties and other governments to address the risks associated with the introduction of alien species as pets, aquarium and terrarium species and as live bait and live food. UNEP/CBD/COP/11/INF/33. Eleventh Meeting of Conference of the Parties to the Convention on Biological Diversity, Hyderabad, India, 8–19 October 2012. United Nations Environment Programme/CBD, Montreal, Canada.
Convention on Biological Diversity (CBD) Secretariat (2001a) Review of the effi ciency and effi cacy of existing legal instruments applicable to invasive alien species. UNEP/CBD/SBSTTA/6/INF/5. Sixth Meeting of the Subsidiary Body on Scientifi c, Technical and Technological Advice (SBSTTA), Montreal, 12–16 March 2001. Later published as CBD Technical Series No. 2. United Nations Environment Programme/CBD, Montreal, Canada.
Convention on Biological Diversity (CBD) Secretariat (2001b) Comprehensive review of
activities for the prevention, early detection, eradication and control of invasive alien species. UNEP/CBD/SNSTTA/6/INF/3. Sixth Meeting of the Subsidiary Body on Scientifi c, Technical and Technological Advice (SBSTTA), Montreal, 12–16 March 2001. Available at: www.cbd.int/doc/?meeting=sbstta-06 (accessed 10 June 2014).
Cook, D. (2005) The ‘paradox of thrips’: identifying a critical level of investment in pest exclusion activities in Western Australia. Australian Agribusiness Review 13, Paper 11.
Cook, D.C., Liu, S., Murphy, B. and Lonsdale, W.M. (2010) Adaptive approaches to biosecurity governance. Risk Analysis 30(9), 1303–1314.
Davidovitch, L., Stoklosa, R., Majer, J., Nietrzeba, A., Whittle, P., Mengersen, K. and Ben-Haim, Y. (2009) Info-gap theory and robust design of surveillance for invasive species: the case study of Barrow Island. Journal of Environmental Management 90, 2785–2793.
Delaney, D.G. and Leung, B. (2010) An empirical probability model of detecting species at low densities. Ecological Applications 20, 1162–1172.
Deluyka, H. and Silano, V. (2012) Editorial: the fi rst ten years of activity of EFSA, a success story. EFSA Journal 10(10) (special issue), 1–6.
Dennis, B. (2002) Allee effects in stochastic populations. Oikos 96, 389–401.
Department for Environment, Food and Rural Affairs (Defra) (2005) Biosecurity guidance to prevent the spread of animal diseases. Defra, London.
Diggle, P.J. (2006) Spatio-temporal point processes, partial likelihood, foot and mouth disease. Statistical Methods in Medical Research 15, 325–336.
Dormann, C.F. (2007a) Assessing the validity of autologistic regression. Ecological Modelling 207, 234–242.
Dormann, C.F. (2007b) Effects of incorporating spatial autocorrelation into the analysis of species distribution data. Global Ecology and Biogeography 16, 129–138.
Drake, J.M. and Lodge, D.M. (2006) Allee effects, propagule pressure and the probability of establishment: risk analysis for biological invasions. Biological Invasions 8, 365–375.
Dybiec, B., Kleczkowski, A. and Gilligan, C.A. (2004) Controlling disease spread on networks with incomplete knowledge. Physical Review E 70, 0066145-1-5.
Dybiec, B., Kleczkowski, A. and Gilligan, C.A. (2005) Optimising control of disease spread on networks. Acta Physica Polonica B 36, 1509–1526.

36 Megan Quinlan et al.
Epanchin-Niell, R.S. and Hastings, A. (2010) Controlling established invaders: integrating economics and spread dynamics to determine optimal management. Ecology Letters 13, 528– 541.
Fitzpatrick, M.C., Weltzin, J.F., Sanders, N.J. and Dunn, R.R. (2007) The biogeography of prediction error: why does the introduced range of the fi re ant over-predict its native range? Global Ecology and Biogeography 16, 24–33.
Fitzpatrick, M.C., Preisser, E.L., Ellison, A.M. and Elkinton, J.S. (2009) Observer bias and the detection of low-density populations. Ecological Applications 19, 1673–1679.
Foley, P. (2000) Problems in extinction model selection and parameter estimation. Environ-mental Management 26, S55–S73.
Food and Agriculture Organization of the United Nations (FAO) (1990) FAO glossary of phytosanitary terms. FAO Plant Protection Bulletin 38(1), 5–23.
Food and Agriculture Organization of the United Nations (FAO) (1996) ISPM 5: Glossary of Phytosanitary Terms. FAO, Rome.
Food and Agriculture Organization of the United Nations (FAO) (2002) ISPM 17: Pest Reporting. FAO, Rome.
Food and Agriculture Organization of the United Nations (FAO) (2005) Biosecurity for Agriculture and Food Production. The Strategic Framework for FAO 2000–2015, FAO Medium Term Plan 2006–2011. FAO, Rome. Available at: www.fao.org/biosecurity/ (accessed 15 March 2013).
Food and Agriculture Organization of the United Nations (FAO) (2007) FAO Biosecurity Toolkit. FAO, Rome.
Food and Agriculture Organization of the United Nations (FAO) (2008) Upgrading Belize’s Legal Framework for Biosecurity. FAO, Rome.
Food and Agriculture Organization of the United Nations (FAO) (2011) Farm biosecurity: less diseases, better performance and higher profi ts. FAOAIDEnews, Situation update 81, 13 October. Emergency Centre for Transboundary Animal Diseases, FAO, Rome.
Food and Agriculture Organization of the United Nations (FAO) (2012) ISPM 5: Glossary of Phytosanitary Terms. FAO, Rome.
Food and Agriculture Organization of the United Nations (FAO) (2013) EMPRES: Prevention and Early Warning. Available at: www.fao.org/foodchain/empres-prevention-and-ear ly-warning/en/ (accessed 15 March 2013).
Fox, D. (2006) Statistical methods for biosecurity monitoring and surveillance. Australian Centre of Excellence for Risk Analysis (ACERA) report
06/05. ACERA, University of Melbourne, Melbourne, Australia.
Frampton, E.R. (2010) Agricultural biotechnologies in developing countries: principles and concepts of biosecurity. Paper presented at the Food and Agriculture Organization of the United Nations (FAO) International Technical Conference ‘Biological Technologies in Developing Countries: Options and Opportunities in Crops, Forestry, Livestock, Fisheries and Agro-industry to Face the Challenges of Food Insecurity and Climate Change (ABCD-10)’, Guadalajara, Mexico, 1–4 March 2010. Available at: www.fao.org/fileadmin/templates/abdc/documents/frampton.pdf (accessed 15 March 2013).
Froud, K.J., Popay, I.A. and Zydenbos, S.M. (eds) (2008) Surveillance for Biosecurity: Pre-Border to Pest Management. New Zealand Plant Protection Society, Christchurch, New Zealand.
Gambley, C.F., Miles, A.K., Ramsden, M., Doogan, V., Thomas, J.E., Parmenter, K. and Whittle, P.J.L. (2009) The distribution and spread of citrus canker in Emerald, Australia. Australasian Plant Pathology 38, 547–557.
GB Non-native Species Secretariat (NNSS) (2011) Biosecurity. Available at: https://secure.fera.defra.gov.uk/nonnativespecies/index.cfm?sectionid=58 (accessed 19 June 2013).
Gelman, A., Carlin, J., Stern, H. and Rubin, D. (2004) Bayesian Data Analysis, 2nd edn. Chapman and Hall, Boca Raton, Florida.
Gibson, G.J., Otten, W., Filipe, J.A.N., Cook, A., Marion, G. and Gilligan, C.A. (2006) Bayesian estimation for percolation models of disease spread in plant populations. Statistics and Computing 16, 391–402.
Government of Belize (2000) Belize Agricultural Health Authority Act. In: Substantive Laws of Belize Revised Edition 2000. Government Printer, Belmopan, Belize, Chapter 211.
Government of Tasmania (2007) Tasmanian Bio-security Policy: Ensuring Tasmania’s Biosecurity Future. Tasmanian Biosecurity Committee, Department of Primary Industries and Water, Government of Tasmania, Devon port, Australia.
Government of Western Australia, Department of Agriculture and Food (2010) Agriculture Biosecurity in Western Australia. Available at: www.agric.wa.gov.au/PC_93118.html?s=0 (accessed 15 March 2013).
Graham, A.J., Atkinson, P.M. and Danson, F.M. (2004) Spatial analysis for epidemiology. Acta Tropica 91, 219–225.
Gschlossl, S. and Czado, C. (2008) Modelling count data with overdispersion and spatial effects. Statistical Papers, 49, 531–552.

Biosecurity Surveillance in Agriculture and Environment 37
Guichard, S., Kriticos, D.J., Leriche, A., Worner, S.P., Kean, J.M. and Suckling, D.M. (2010) Evidence of active or passive downwind dispersal in mark–release–recapture of moths. Entomologia Experimentalis et Applicata 134, 160–169.
Gumpertz, M.L., Wu, C. and Pye, J.M. (2000) Logistic regression for southern pine beetle outbreaks with spatial and temporal auto-correlation. Forest Science 46, 95–107.
Hadorn, D.C. and Stark, K.D.C. (2008) Evaluation and optimization of surveillance systems for rare and emerging infectious diseases. Veterinary Research 39, 12.
Hall, D.B. (2000) Zero-infl ated Poisson and binomial regression with random effects: a case study. Biometrics 56, 1030–1039.
Hanson, T.E., Johnson, W.O., Gardner, I.A. and Georgiadis, M.P. (2003) Determining the infection status of a herd. Journal of Agricultural Biological and Environmental Statistics 8, 469–485.
Harwood, T.D., Xu, X., Pautasso, M., Jeger, M.J. and Shaw, M.W. (2009) Epidemiological risk assessment using linked network and grid based modelling: Phytophthora ramorum and Phytophthora kernoviae in the UK. Ecological Modelling 220, 3353–3361.
Håstein, T., Binde, M., Hine, M., Johnsen, S., Lillehaug, A., Olesen, N.J., Purvis, N., Scarfe, A.D. and Wright B. (2008) National biosecurity approaches, plans and programmes in response to diseases in farmed aquatic animals: evolution, effectiveness and the way forward. Revue Scientifi que et Technique de l’Offi ce International des Epizooties 27(1), 125–145.
Hastings, A. (1996) Models of spatial spread: a synthesis. Biological Conservation 78, 143–148.
Hastings, A., Cuddington, K., Davies, K.F., Dugaw, C.J., Elmendorf, S., Freestone, A., Harrison, S., Holland, M., Lambrinos, J., Malvadkar, U., Melbourne, B.A., Moore, K., Taylor, C. and Thomson, D. (2005) The spatial spread of invasions: new developments in theory and evidence. Ecology Letters 8, 91–101.
Hauser, C.E. and McCarthy, M.A. (2009) Streamlining ‘search and destroy’: cost-effective surveillance for invasive species management. Ecology Letters 12, 683–692.
Havel, J.E., Shurin, J.B. and Jones, J.R. (2002) Estimating dispersal from patterns of spread: spatial and local control of lake invasions. Ecology 83, 3306–3318.
Hawkes, C. (2009) Linking movement behaviour, dispersal and population processes: is individual variation a key? Journal of Animal Ecology 78, 894–906.
Hayes, K.R. and Barry, S.C. (2008) Are there any consistent predictors of invasion success? Biological Invasions 10, 483–506.
Hennessey, M.K. (2004) Quarantine pathway pest risk analysis at the APHIS Plant Epidemiology and Risk Analysis Laboratory. Weed Technology 18, 1484–1485.
Hester, S., Sergeant, E., Herbert, K. and Robinson, A. (2012) Post-border surveillance techniques: review, synthesis and deployment. Australian Centre of Excellence for Risk Analysis (ACERA) report 1004. ACERA, University of Melbourne, Melbourne, Australia.
Hoeting, J.A. (2009) The importance of accounting for spatial and temporal correlation in analyses of ecological data. Ecological Applications 19, 574–577.
Hoeting, J.A., Leecaster, M. and Bowden, D. (2000) An improved model for spatially correlated binary responses. Journal of Agricultural Biological and Environmental Statistics 5, 102–114.
Holmes, T.P., Aukema, J.E., Von Holle, B., Liebhold, A. and Sills, E. (2009) Economic impacts of invasive species in forests past, present and future. In: Ostfeld, R.S. and Schlesinger, W.H. (eds) The Year in Ecology and Conservation Biology, 2009. Annals of the New York Academy of Sciences, volume 1162. Blackwell Publishing, Oxford, pp. 18–38.
Hooten, M.B. and Wikle, C.K. (2008) A hierarchical Bayesian non-linear spatio-temporal model for the spread of invasive species with application to the Eurasian collared-dove. Environmental and Ecological Statistics 15, 59–70.
Hooten, M., Wikle, C., Dorazio, R. and Royle, J. (2007) Hierarchical spatio-temporal matrix models for characterizing invasions. Biometrics 63, 558–567.
Huffer, F.W. and Wu, H.L. (1998) Markov chain Monte Carlo for autologistic regression models with application to the distribution of plant species. Biometrics 54, 509–524.
Hulme, P.E. (2006) Beyond control: wider implications for the management of biological invasions. Journal of Applied Ecology 43, 835–847.
Interim Commission on Phytosanitary Measures (ICPM) (1998) Report of the fi rst meeting of the Interim Commission on Phytosanitary Measures, 1998. Food and Agriculture Organization of the United Nations, Rome.
International Plant Protection Convention (IPPC) (2008) Establishment of Areas of Low Pest Prevalence for Fruit Flies (Tephritidae). Technical report. Food and Agriculture Organization of the United Nations, Rome.

38 Megan Quinlan et al.
International Plant Protection Convention (IPPC) (2012a) International Plant Protection Con-vention. Flyer, March 2012. Food and Agriculture Organization of the United Nations, Rome.
International Plant Protection Convention (IPPC) (2012b) Report of the fi rst meeting of the IPPC Capacity Development Committee, Rome, Italy, 3–7 December 2012. IPPC, Rome.
International Plant Protection Convention (IPPC) Secretariat (2012) Baseline Review of the Implementation of ISPM 6. Implementation Review and Support System (IRSS), IPPC, Rome.
Jarvis, C.H. and Baker, R.H.A. (2001a) Risk assessment for nonindigenous pests: 1. Mapping the outputs of phenology models to assess the likelihood of establishment. Diversity and Distributions 7, 223–235.
Jarvis, C.H. and Baker, R.H.A. (2001b) Risk assessment for nonindigenous pests: 2. Accounting for interyear climate variability. Diversity and Distributions 7, 237–248.
Jerde, C.L. and Lewis, M.A. (2007) Waiting for invasions: a framework for the arrival of non-indigenous species. American Naturalist 170, 1–9.
Johnson, S. and Mengersen, K. (2012) Integrated Bayesian network framework for modelling complex ecological issues. Integrated Environ-mental Assessment and Management 8, 480–490.
Johnson, W.O., Su, C.L., Gardner, I.A. and Christensen, R. (2004) Sample size calculations for surveys to substantiate freedom of populations from infectious agents. Biometrics 60, 165–171.
Johnson, D.M., Liebhold, A.M., Tobin, P.C. and Bjornstad, O.N. (2006) Allee effects and pulsed invasion by the gypsy moth. Nature 444, 361–363.
Jorgensen, K., Cannon, R. and Peterson, R. (2004) Pest free area guidelines: a case study: Tully banana black Sigatoka. Technical report. Plant Health Australia Ltd and Australian Government Department of Agriculture, Fisheries and Forestry, Canberra.
Kareiva, P. (1983) Local movement in herbivorous insects: applying a passive diffusion model to mark-recapture fi eld experiments. Oecologia 57, 322–327.
Kawasaki, K., Takasu, F., Caswell, H. and Shigesada, N. (2006) How does stochasticity in colonization accelerate the speed of invasion in a cellular automaton model? Ecological Research 21, 334–345.
Keitt, T.H., Lewis, M.A. and Holt, R.D. (2001) Allee effects, invasion pinning and species’ borders. American Naturalist 157, 203–216.
Kery, M. (2002) Inferring the absence of a species – a case study of snakes. Journal of Wildlife Management 66, 330–338.
Kery, M., Spillmann, J.H., Truong, C. and Holderegger, R. (2006) How biased are estimates of extinction probability in revisitation studies? Journal of Ecology 94, 980–986.
Kot, M., Medlock, J., Reluga, T. and Walton, D.B. (2004) Stochasticity, invasions and branching random walks. Theoretical Population Biology 66, 175–184.
Kramer, A.M., Dennis, B., Liebhold, A.M. and Drake, J.M. (2009) The evidence for Allee effects. Population Ecology 51, 341–354.
Latimer, A.M., Wu, S.S., Gelfand, A.E. and Silander, J.A. (2006) Building statistical models to analyze species distributions. Ecological Applications 16, 33–50.
Latimer, A.M., Banerjee, S., Sang, H., Mosher, E.S. and Silander, J.A. (2009) Hierarchical models facilitate spatial analysis of large data sets: a case study on invasive plant species in the northeastern United States. Ecology Letters 12, 144–154.
Lawson, A.B. (2009) Bayesian Disease Mapping: Hierarchical Modeling in Spatial Epidemiology. Chapman and Hall, Boca Raton, Florida.
Lee, J.E. and Chown, S.L. (2009) Breaching the dispersal barrier to invasion: quantifi cation and management. Ecological Applications 19, 1944–1959.
Legendre, P. (1993) Spatial autocorrelation – trouble or new paradigm. Ecology 74, 1659–1673.
Leung, B., Drake, J.M. and Lodge, D.M. (2004) Predicting invasions: propagule pressure and the gravity of Allee effects. Ecology 85, 1651–1660.
Lewis, M.A. and Pacala, S. (2000) Modeling and analysis of stochastic invasion processes. Journal of Mathematical Biology 41, 387–429.
Liebhold, A.M. and Tobin, P.C. (2008) Population ecology of insect invasions and their management. Annual Review of Entomology 53, 387–408.
Lloyd, A.C., Hamacek, E.L., Kopittke, R.A., Peek, T., Wyatt, P.M., Neale, C.J., Eelkema, M. and Gu, H. (2010) Area-wide management of fruit fl ies (Diptera: Tephritidae) in the Central Burnett district of Queensland, Australia. Crop Protection 29, 462–469.
Lockwood, J.L., Cassey, P. and Blackburn, T. (2005) The role of propagule pressure in explaining species invasions. Trends in Ecology and Evolution 20, 223–228.

Biosecurity Surveillance in Agriculture and Environment 39
Low Choy, S., O’Leary, R. and Mengersen, K. (2009) Elicitation by design in ecology: using expert opinion to inform priors for Bayesian statistical models. Ecology 90, 265–277.
Mack, R.N., Simberloff, D., Lonsdale, W.M., Evans, H., Clout, M. and Bazzaz, F.A. (2000) Biotic invasions: causes, epidemiology, global con-sequences and control. Ecological Applications 10, 689–710.
MacKenzie, D.I. (2005) What are the issues with presence-absence data for wildlife managers? Journal of Wildlife Management 69, 849–860.
MacLeod, A. (2010) Plant health alert systems. An overview of scientifi c examples and perspectives from a national, EU and EPPO scale. Paper presented at the Joint AESAN/EFSA Workshop ‘Science Supporting Risk Surveillance of Imports’, Seville, Spain, 10 February 2010. Available at: www.efsa.europa.eu/en/events/documents/corporate100210-p04.pdf (acces-sed 27 August 2013).
Martin, P., Cameron, A. and Greiner, M. (2007) Demonstrating freedom from disease using multiple complex data sources. 1: A new methodology based on scenario trees. Preventive Veterinary Medicine 79(2–4), 71–97.
Mayer, D.G. and Atzeni, M.G. (1993) Estimation of dispersal distances for Cochliomyia hominivorax (Diptera, Calliphoridae). Environmental Entomology 22, 368–374.
McCullough, D.G., Work, T.T., Cavey, J.F., Liebhold, A.M. and Marshall, D. (2006) Interceptions of nonindigenous plant pests at US ports of entry and border crossings over a 17-year period. Biological Invasions 8, 611–630.
McMaugh, T. (2005) Guidelines for Surveillance for Plant Pests in Asia and the Pacifi c. Australian Centre for International Agricultural Research (ACIAR) Monograph No. 119, 192 pp. ACIAR, Canberra.
Meats, A. and Clift, A.D. (2005) Zero catch criteria for declaring eradication of tephritid fruit fl ies: the probabilities. Australian Journal of Experimental Agriculture 45, 1335–1340.
Mengersen, K., Quinlan, M.M., Whittle, P.J.L., Knight, J.D., Mumford, J.D., Wan Ismail, W.N., Tahir, H., Holt, J., Leach, A.W., Johnson, S., Sivapragasam, A., Lum, K.Y., Sue, M.J., Othman, Y., Jumaiyah, L., Tu, D.M., Anh, N.T., Pradyabumrung, T., Salyapongse, C., Marasigan, L.Q., Palacpac, M.B., Dulce, L., Panganiban, G.G.F., Soriano, T.L., Carandang, E. and Hermawan (2012) Beyond compliance: project on an integrated systems approach for pest risk management in South East Asia. Bulletin OEPP/EPPO Bulletin 42, 109–116.
Ministry of Agriculture and Forestry (MAF) Biosecurity New Zealand (2009) Economic costs of pests to New Zealand. MAF Biosecurity New Zealand Technical Paper No. 2009/31. MAF, Wellington, New Zealand.
Moilanen, A. (2004) SPOMSIM: software for stochastic patch occupancy models of metapopulation dynamics. Ecological Modelling 179, 533–550.
Murray, A.G. and Peeler E.J. (2005) A framework for understanding the potential for emerging diseases in aquaculture. Preventive Veterinary Medicine 67, 223–235.
Myers, J.H., Savoie, A. and van Randen, E. (1998) Eradication and pest management. Annual Review of Entomology 43, 471–491.
National Research Council (2006) Globalization, Biosecurity, and the Future of the Life Sciences. National Academies Press, Washington, DC.
Neubert, M.G. and Caswell, H. (2000) Demography and dispersal: calculation and sensitivity analysis of invasion speed for structured populations. Ecology 81, 1613–1628.
Neubert, M.G. and Parker, I.M. (2004) Projecting rates of spread for invasive species. Risk Analysis 24, 817–831.
New Zealand Government, Ministry for Primary Industries (undated) New Zealand. It’s Our Place to Protect. Available at: www.biosecurity.govt.nz/ (accessed 19 June 2013).
Nieuwenhuijsen, M., Paustenbach, D. and Duarte-Davidson, R. (2006) New developments in exposure assessment: the impact on the practice of health risk assessment and epidemiological studies. Environment International 32, 996–1009.
Normann, B.D. (2010) Issues in biosecurity and biosafety. International Journal of Antimicrobial Agents 36(suppl. 1), S66–S69.
Norwegian Food Safety Authority (2004) Reforming Food Safety Administration in Norway. Presentation to Food and Agriculture Organization of the United Nations (FAO), 1 February 2005. Mattilsynet, Brumundal, Norway. Available at: ftp.fao.org/es/esn/food/meetings/norway_pres.pdf (accessed 27 August 2013).
Offi ce of Science and Innovation (2006) Executive summary. In: Foresight. Infectious Diseases: Preparing for the Future. Offi ce of Science and Innovation, London.
OIE (2013) The ‘One Health’ Concept: the OIE Approach. Bulletin No. 2013–1. World Organisation for Animal Health (OIE), Paris, France.
O’Toole, T. and Inglesby, T.V. (2003) Toward biosecurity. Biosecurity and Bioterrorism: Bio-defense Strategy, Practice and Science 1, 1–3.

40 Megan Quinlan et al.
Otten, W., Bailey, D.J. and Gilligan, C.A. (2004) Empirical evidence of spatial thresholds to control invasion of fungal parasites and saprotrophs. New Phytologist 163, 125–132.
Outhwaite, O. (2010) Implementing biosecurity in Belize: stakeholder experiences. Paper presented at Seminar III: Implementing Biosecurity: Communication, Surveillance, Enforcement; The Socio-Politics of Biosecurity: Science, Policy and Practice, Birkbeck University of London, November 2010. Available at: www.bbk.ac.uk/environment/biosecurity/downloads/seminar3_outhwaite.pdf (accessed 3 June 2013).
Plant Health Australia (2010) PLANTPLAN: Australian emergency plant pest response plan, version 1. Technical report. Plant Health Australia, Canberra.
Potts, J.M. and Elith, J. (2006) Comparing species abundance models. Ecological Modelling 199, 153–163.
Potts, J., Cox, M., Christian, R. and Burgman, M. (2012) Model based search strategies for plant diseases: a case study using citrus canker (Xanthomonos citri). Australian Centre of Excellence for Risk Analysis (ACERA) report 1006b. ACERA, University of Melbourne, Melbourne, Australia.
Prattley, D.J., Morris, R.S., Stevenson, M.A. and Thornton, R. (2007) Application of portfolio theory to risk-based allocation of surveillance resources in animal populations. Preventive Veterinary Medicine 81, 56–69.
Prime Consulting International Ltd (2002) Review of New Zealand’s Biosecurity Surveillance Systems. Amended version, August 2002. Prime Consulting International, Waikanae, New Zealand.
Puth, L.M. and Post, D.M. (2005) Studying invasion: have we missed the boat? Ecology Letters 8, 715–721.
Quinlan, M.M., Phiri, N., Zhang, F. and Wang, X. (2006) D4.1: The infl uence of culture and governance on the detection, identifi cation and monitoring of plant disease. A comparative assessment of the United Kingdom, China and sub-Saharan Africa. In: Foresight. Infectious Diseases: Preparing for the Future. Offi ce of Science and Innovation, London.
Reynolds, A.M. and Reynolds, D.R. (2009) Aphid aerial density profi les are consistent with turbulent advection amplifying fl ight behaviours: abandoning the epithet ‘passive’. Proceedings of the Royal Society B: Biological Sciences 276, 137–143.
Rouget, M. and Richardson, D.M. (2003) Inferring process from pattern in plant invasions: a
semimechanistic model incorporating propagule pressure and environmental factors. American Naturalist 162, 713–724.
Royle, J.A. (2004) N-mixture models for estimating population size from spatially replicated counts. Biometrics 60, 108–115.
Royle, J.A. (2006) Site occupancy models with heterogeneous detection probabilities. Bio-metrics 62, 97–102.
Royle, J.A. (2008) Hierarchical modeling of cluster size in wildlife surveys. Journal of Agricultural Biological and Environmental Statistics 13, 23–36.
Royle, J.A. and Dorazio, R.M. (2006) Hierarchical models of animal abundance and occurrence. Journal of Agricultural Biological and Environmental Statistics 11, 249–263.
Royle, J.A., Kry, M., Gautier, R. and Schmid, H. (2007) Hierarchical spatial models of abundance and occurrence from imperfect survey data. Ecological Monographs 77, 465–481.
Sander, L.M., Warren, C.P., Sokolov, I.M., Simon, C. and Koopman, J. (2002) Percolation on heterogeneous networks as a model for epidemics. Mathematical Biosciences 180, 293–305.
Sandlund, O.T., Schei, P.J. and Viken A. (eds) (1996) The Trondheim Conferences on Biodiversity. Proceedings of the Norway/UN Conference on Alien Species, 1–5 July 1996. Directorate for Nature Management/Norwegian Institute for Nature Research, Trondheim, Norway.
Scherm, H., Ngugi, H.K. and Ojiambo, P.S. (2006) Trends in theoretical plant epidemiology. European Journal of Plant Pathology 115, 61–73.
Schlosser, W. and Ebel, E. (2001) Use of a Markov-chain Monte Carlo model to evaluate the time value of historical testing information in animal populations. Preventive Veterinary Medicine 48, 167–175.
Secretariat of the Biological Weapons Convention (2011) Biosafety and biosecurity. Background paper. Implementation and Support Unit, United Nations Offi ce for Disarmament Affairs, Geneva, Switzerland.
Sergeant, E.S.G. (2009) EpiTools Epidemiological Calculators. Available at: http://epitools.ausvet.com.au (accessed 3 June 2013).
Shirley, M.D.F. and Rushton, S.P. (2005) Where diseases and networks collide: lessons to be learnt from a study of the 2001 foot-and-mouth disease epidemic. Epidemiology and Infection 133, 1023–1032.
Simberloff, D. (2009) The role of propagule pressure in biological invasions. Annual Review of Ecology Evolution and Systematics 40, 81–102.

Biosecurity Surveillance in Agriculture and Environment 41
Skellam, J. (1951) Random dispersal in theoretical populations. Biometrika 38, 196–218.
Smith, R.M., Baker, R.H.A., Malumphy, C.P., Hockland, S., Hammon, R.P., Ostoja-Starzewski, J.C. and Collins, D.W. (2007) Recent non-native invertebrate plant pest establishments in Great Britain: origins, pathways and trends. Agricultural and Forest Entomology 9, 307–326.
Stanaway, M.A., Zalucki, M.P., Gillespie, P.S., Rodriguez, C.M. and Maynard, G.V. (2001) Pest risk assessment of insects in sea cargo containers. Australian Journal of Entomology 40, 180–192.
Stanaway, M., Reeves, R. and Mengersen, K. (2011) Hierarchical Bayesian modelling of plant pest invasions with human-mediated dispersal. Ecological Modelling 222, 3531–3540.
Stark, K.D.C., Regula, G., Hernandez, J., Knopf, L., Fuchs, K., Morris, R.S. and Davies, P. (2006) Concepts for risk-based surveillance in the fi eld of veterinary medicine and veterinary public health: review of current approaches. BMC Health Services Research 6, 1–8.
State Government of Victoria, Department of Primary Industries (2010) Biosecurity. Available at: www.dpi.vic.gov.au/agriculture/about-agriculture/biosecurity (accessed 15 March, 2013).
Stohlgren, T.J. and Schnase, J.L. (2006) Risk analysis for biological hazards: what we need to know about invasive species. Risk Analysis 26, 163–173.
Sutherst, R.W. and Maywald, G.F. (1985) A computerised system for matching climates in ecology. Agriculture, Ecosystems and Environment 13, 281–299.
Thebaud, G., Sauvion, N., Chadoeuf, J., Dufi ls, A. and Labonne, G. (2006) Identifying risk factors for European stone fruit yellows from a survey. Phytopathology 96, 890–899.
Thomas, A., Best, N., Lunn, D., Arnold, R. and Spiegelhalter, D. (2004) GeoBUGS User Manual, Version 1.2, September 2004. Available at: www.mrc- bsu.cam.ac.uk/bugs/winbugs/geobugs12manual.pdf (accessed 24 April 2007).
Thompson, M., Lyons, A., Kumarisinghe, L., Peck, D.R., Kong, G., Shattuck, S and La Salle, J. (2011) Remote microscopy: a success story in Australia and New Zealand plant biosecurity. Australian Journal of Entomology 50, 1–6.
Tyre, A.J., Tenhumberg, B., Field, S.A., Niejalke, D., Parris, K. and Possingham, H.P. (2003) Improving precision and reducing bias in biological surveys: estimating false-negative error rates. Ecological Applications 13, 1790–1801.
United States Department of Agriculture (USDA)/Animal and Plant Health Inspection Service (APHIS) (2010) Trade issues and risk analysis. Hot Topics, July 2010. Center for Plant Health Science and Technology, USDA/APHIS, Raleigh, North Carolina.
United States Department of Agriculture (USDA)/Animal and Plant Health Inspection Service (APHIS) (2013) Plant Health: Trade Issues and Risk Analysis. Center for Plant Health Science and Technology (CPHST). Available at: www.aphis.usda.gov/plant_health/ (accessed 15 March 2013).
Urban, D. and Keitt, T. (2001) Landscape connectivity: a graph-theoretic perspective. Ecology 82, 1205–1218.
Waage, J.K. and Mumford, J.D. (2008) Agricultural biosecurity. Philosophical Transactions of the Royal Society B: Biological Sciences 363, 863–876.
Wang, G.M. (2009) Signal extraction from long-term ecological data using Bayesian and non-Bayesian state-space models. Ecological Informatics 4, 69–75.
Ward, D.F., Beggs, J.R., Clout, M.N., Harris, R.J. and O’Connor, S. (2006) The diversity and origin of exotic ants arriving in New Zealand via human-mediated dispersal. Diversity and Distributions 12, 601–609.
Waugh, J.D. (2009) Neighborhood Watch: Early Detection and Rapid Response to Biological Invasion along US Trade Pathways. International Union for Conservation of Nature (IUCN), Gland, Switzerland.
Webster, R.A., Pollock, K.H. and Simons, T.R. (2008) Bayesian spatial modeling of data from avian point count surveys. Journal of Agricultural Biological and Environmental Statistics 13, 121–139.
Wikle, C.K. (2003) Hierarchical Bayesian models for predicting the spread of ecological processes. Ecology 84, 1382–1394.
Wikle, C. and Hooten, M. (2006) Hierarchical Bayesian spatio-temporal models for population spread. In: Clark, J. and Gelfand, A.E. (eds) Applications of Computational Statistics in the Environmental Sciences: Hierarchical Bayes and MCMC Methods. Oxford University Press, Oxford, pp. 145–169.
Wikle, C.K. and Royle, J.A. (1999) Space-time dynamic design of environmental monitoring networks. Journal of Agricultural Biological and Environmental Statistics 4, 489–507.
Windhoek Declaration (2009) Windhoek Declaration on an Aquatic Biosecurity Framework for Southern Africa. Available at: www.oie.int/doc/ged/D11114.PDF (accessed 18 June 2013).

42 Megan Quinlan et al.
Wintle, B.A. and Bardos, D.C. (2006) Modeling species–habitat relationships with spatially autocorrelated observation data. Ecological Applications 16, 1945–1958.
Wintle, B.A., McCarthy, M.A., Parris, K.M. and Burgman, M.A. (2004) Precision and bias of methods for estimating point survey detection probabilities. Ecological Applications 14, 703–712.
Wintle, B.A., Kavanagh, R.P., McCarthy, M.A. and Burgman, M.A. (2005) Estimating and dealing with detectability in occupancy surveys for forest owls and arboreal marsupials. Journal of Wildlife Management 69, 905–917.
With, K.A. (2002) The landscape ecology of invasive spread. Conservation Biology 16, 1192–1203.
Wotton, D.M. and Hewitt, C.L. (2004) Marine biosecurity post-border management: develop-
ing incursion response systems for New Zealand. New Zealand Journal of Marine and Freshwater Research 38, 553–559.
Yoccoz, N.G., Nichols, J.D. and Boulinier, T. (2001) Monitoring of biological diversity in space and time. Trends in Ecology and Evolution 16, 446–453.
Zhou, T., Fu, Z.Q. and Wang, B.H. (2006) Epidemic dynamics on complex networks. Progress in Natural Science 16, 452–457.
Zhu, J., Zheng, Y., Carroll, A.L. and Aukema, B.H. (2008) Autologistic regression analysis of spatial-temporal binary data via Monte Carlo maximum likelihood. Journal of Agricultural Biological and Environmental Statistics 13, 84–98.
Zmorzynska, A. and Hunger, I. (2008) Restricting the role of biosecurity. Bulletin of the Atomic Scientist, 19 December.

This chapter is from the book:
9781780641645.pdf
ISBN: 9781780641645

v
Contents
Contributors viiForeword xi
1 Introduction 1 Jeff rey S. Dukes and Lewis H. Ziska
Part I - The Dimensions of the Problem: Background and Science
2 Communicating the Dynamic Complexities of Climate and Ecology: Species Invasion and Resource Changes 9
John Peter Th ompson and Lewis H. Ziska
3 Climate Change and Plant Pathogen Invasions 22 Karen A. Garrett, Sara Th omas-Sharma, Greg A. Forbes and John Hernandez Nopsa
4 Analysis of Invasive Insects: Links to Climate Change 45 Andrew Paul Gutierrez and Luigi Ponti
5 Climate Change, Plant Traits and Invasion in Natural and Agricultural Ecosystems 62
Dana M. Blumenthal and Julie A. Kray
Part II - Case Studies
6 Non-native Species in Antarctic Terrestrial Environments: Th e Impacts of Climate Change and Human Activity 81
Kevin A. Hughes and Peter Convey
7 Synergies between Climate Change and Species Invasions: Evidence from Marine Systems 101
Cascade J.B. Sorte
8 Ragweed in Eastern Europe 117 László Makra, István Matyasovszky and Áron József Deák
9 Climate Change and Alien Species in South Africa 129 Ulrike M. Irlich, David M. Richardson, Sarah J. Davies and Steven L. Chown
v

vi Contents
10 Climate Change and ‘Alien Species in National Parks’: Revisited 148 Th omas J. Stohlgren, Jessica R. Resnik and Glenn E. Plumb
11 Invasive Plants in a Rapidly Changing Climate: An Australian Perspective 169
Bruce L. Webber, Rieks D. van Klinken and John K. Scott
12 Invasive Species of China and Th eir Responses to Climate Change 198 Bo Li, Shujuan Wei, Hui Li, Qiang Yang and Meng Lu
Part III - Management: Detection and Prevention
13 Identifying Invasive Species in Real Time: Early Detection and Distribution Mapping System (EDDMapS) and Other Mapping Tools 219
Rebekah D. Wallace and Charles T. Bargeron
14 Global Identifi cation of Invasive Species: Th e CABI Invasive Species Compendium as a Resource 232
Hilda Diaz-Soltero and Peter R. Scott
15 Th e Biogeography of Invasive Plants – Projecting Range Shifts with Climate Change 240
Bethany A. Bradley
16 Identifying Climate Change as a Factor in the Establishment and Persistence of Invasive Weeds in Agricultural Crops 253
Antonio DiTommaso, Qin Zhong and David R. Clements
17 Assessing and Managing the Impact of Climate Change on Invasive Species: Th e PBDM Approach 271
Andrew Paul Gutierrez and Luigi Ponti
Part IV - Management: Control and Adaptation
18 Climate, CO2 and Invasive Weed Management 293 Lewis H. Ziska
19 Early Detection and Rapid Response: A Cost-eff ective Strategy for Minimizing the Establishment and Spread of New and Emerging Invasive Plants by Global Trade, Travel and Climate Change 305
Randy G. Westbrooks, Steven T. Manning and John D. Waugh
20 Adapting to Invasions in a Changing World: Invasive Species as an Economic Resource 326
Matthew A. Barnes, Andrew M. Deines, Rachel M. Gentile and Laura E. Grieneisen
Index 345

232 © CAB International 2014. Invasive Species and Global Climate Change (eds L.H. Ziska and J.S. Dukes)
Global Identifi cation of Invasive Species: The CABI Invasive Species Compendium as a Resource
Hilda Diaz-Soltero1 and Peter R. Scott2
1USDA, Offi ce of the Secretary, Washington, DC, USA; 2CAB International, Wallingford, UK
14
Abstract
Th e number, spread and impact of invasive species in the latter half of the 20th century has been without historical precedent. Now, as human activity causes a precipitous rise in greenhouse gas emissions (e.g. CO2), there is growing concern that climate change may also be a signifi cant, long-term driver enhancing invasive species introduction and spread. New and more powerful tools that facilitate linking invasive species and climate change are required to identify and manage these consequences. One such tool, which exploits a wide range of traditional and social media, is the Invasive Species Compendium, or ISC. Th e ISC is a scientifi c, web-based encyclopedia that compiles the latest information on the invasive species that have the most negative impacts on the environment, the economy and/or animal or human health. Th e information in the ISC, updated weekly with the latest scientifi c fi ndings, can be used; to infer future climate change impacts on an invasive species; to understand the potential environmental and/or economic impacts of the species, and to identify ways to control and manage the species in question. Th is chapter discusses the value and effi cacy of the ISC, with a particular emphasis on its application in a globally warmed future.
Introduction
As climate change and rising CO2 levels impose additional risks regarding the introduction and spread of invasive species (Mooney and Hobbs, 2000), new and eff ective management methods are needed. Chief among these is the strategy of detection and prevention, i.e. to keep track of invasives through visual recognition and assess their potential for environmental or economic harm. Th e introduction and demography of invasive species is tied to global trade (Hulme, 2009), with con-sequences for ecology and agriculture (Pimentel et al., 2005; Ziska et al., 2011). To manage invasive species, a comprehensive means to identify, track and, if possible, eliminate them is needed. It is from this perspective that the global Invasive Species Compendium (ISC) was developed. Pre-viously, knowledge about a given invasive species was often sporadic, specifi c to a given region, and not integrated spatially or temporally. Increasing international trade, in combination with changes in climate, lend urgency to the need for an integrated, publically accessible, continuously updated invasive species resource at no cost to the user. Such a resource may be especially relevant to developing countries that may lack technical information on invasive

The Invasive Species Compendium as a Resource 233
species management or in countries/regions where trade and climate are undergoing rapid changes. To develop such a resource, the global ISC was initiated as a means to provide scientifi c information on invasive species that was widely accessible, region specifi c and temporally accurate.
The Invasive Species Compendium: An Overview
Th e ISC is a multimedia encyclopedia that includes information regarding several thousand invasive species (available at http://www.cabi.org/isc/). Th e ISC is, at present, the most extensive and author-itative compilation on all taxa of invasive species. It includes, globally, known invasive organisms across all ecosystems – aquatic, marine or terrestrial – that cause the most harm. Since its release in 2012, the tool has been updated weekly and is available on an open-access basis.
Th e ISC was developed by a consortium of organizations from 12 countries that contributed fi nancially to its development. Th e eff ort to develop the ISC was led by CAB International (CABI) in association with the US Department of Agriculture (USDA). Th ey are partnered by expert organizations including the European and Mediterranean Plant Protection Organization (EPPO) and the World Organisation for Animal Health (OIE). CABI, an international, non-profi t, science-based, knowledge organization, has a mission to provide information and apply scientifi c expertise to solve problems in agriculture and the environment (CABI, 2012).
Th e objective of the ISC eff ort was to provide an international resource with respect to invasive species. In that regard, the ISC covers the identifi cation, biology, distribution, impact and management of thousands of invasive species. Invasive species of all taxa are covered, including plants, fungi, bacteria, viruses and animals. Subcategories of animals are further dis-tinguished into insects, nematodes, molluscs and vertebrates.
Th e impacts of these organisms on natural ecosystems and on biodiversity are considered, as well as their impacts on systems managed for agriculture, agro-forestry, aquaculture and animal health. Economic impacts are documented, as well as potential adaptive uses (see Chapter 20, this volume). While an underlying goal is to ingrate global know ledge, a geographic information system (GIS) is also used to display distributions of invasive species at the country, state and province levels. Th e ISC also includes information the invasive species’ pathways and vectors, as well as available methods regarding control and management. Extensive reference materials are included, including images, library documents (including peer-reviewed journal articles), conference papers and reports, bibliographic abstracts and a glossary of technical terms, as well as comprehensive links to relevant identifi cation keys and image libraries. As of June 2013, there were over 1682 full invasive species data sheets and over 7291 abbreviated data sheets in the ISC.
Data Sources for the ISC
Th e content for the ISC data sheets is derived globally from thousands of expert scientists. Th e ISC’s veracity derives from their expertise, from corroboration through peer review and through rigorous editing for quality control.
Additional content is derived from existing compilations of knowledge on invasive species, including expert organ-izations such as the Inter-American Biodiversity Information Network, the currently inactive Global Invasive Species Programme and the Smithsonian National Museum of Natural History. Content is presented dynamically in the ISC through an advanced web-based platform combining databases, text and images. GIS, taxonomic relationships and data suitable for decision-support tools, such as risk analysis data, are also provided by the ISC in an interactive framework.

234 H. Diaz-Soltero and P.R. Scott
Any user accessing the ISC can also link to information both within the ISC and with other local or remote knowledge bases. Th e content is updated weekly, and the ISC will be maintained, enhanced and updated regularly into the foreseeable future.
Management and Financing of the ISC
Th e ISC Consortium, a group of supporting organizations (Table 14.1), provides the strategic direction and scientifi c leadership for the ISC project, as well as fi nancial
resources. Th e Consortium’s goal is to provide a ubiquitous resource that: (i) is easily acces-sed; (ii) is relevant at diff erent biogeographical scales; (iii) is biologically accurate; and (iv) provides control and management options for invasive species. Because such a resource must be temporally relevant, the ISC continues to be updated regularly as new information becomes available.
A primary goal of the ISC is accessibility. It should be widely available to an extensive group of stakeholders. To make the ISC free to its users, development costs are shared among Consortium Members. At present, the budget for the development and
Table 14.1. Consortium members of the Invasive Species Compendium.
Australia, Group Membership
Cooperative Research Centre for National Plant Biodiversity, CRCNPB Grains Research and Development Corporation, GRDC Horticulture Australia Limited, HAL Invasive Animals Cooperative Research Centre, IACRC Australian Centre for International Agricultural Research (ACIAR)Canadian Food Inspection Agency; Forest Service; and International Development AgencyCaribbean Island Countries (sponsored by European Union DGDEV)France, Ministry of the EnvironmentForum for Agricultural Research in Africa (sponsored by DFID)India, Ministry of AgricultureMalaysian Agricultural Research and Development InstituteMexico National Health, Safety and Quality Service for Agri-Food, SENASICA Comisión Nacional para el Conocimiento y Uso de la Biodiversidad, CONABIOMonsanto CorporationNetherlands Ministry of Economic Affairs, Agriculture and InnovationSecretariat of the Pacifi c Community (SPC)Swiss Agency for Development and CooperationSyngenta Crop ProtectionUK Department for Environment Food and Rural Affairs, DEFRA Department for International Development (DFID)/CABI/FARAUS Agency for International Development (USAID)US Department of Agriculture: Agricultural Research Service (ARS); Animal and Plant Health Inspection Service (APHIS); Foreign Agricultural Service (FAS); Forest Service (USFS); Invasive Species Coordination Program; Natural Resources Conservation Service (NRCS); Rural Development (RD)US Department of Commerce, NOAA’s National Ocean Service (NOS)US Department of the Interior, U.S. Fish and Wildlife Service (FWS)
Note: New Members are expected from Latin America, Asia, Australasia, Europe and North America. Any country, non-governmental organization, private company or industry can become a member; most members are in the environment or agriculture arena, and work on invasive species issues. Participation is voluntary and by invitation.

The Invasive Species Compendium as a Resource 235
maintenance of the ISC is US$4.75 million over an 8-year period until 2016. Contributions from more than 29 Members of the Development Consortium, based in 12 countries, have amounted to more than US$4.75 million to date. Of this, US$3 million covered the phase of develop-ment and release of the defi nitive ISC. Th e remaining US$1.75 million covers the task of updating, maintenance and enhancement. Additional funds are sought continuously, to include emerging invasive species and to enhance the current information base. Such funds are also critical in extending the period of updating, maintenance and enhancement beyond 2016.
New Consortium Members are asked to make a one-time contribution of US$175,000 (US$130,000 for developing country organizations), paid over 1 or 2 years. Each new Member makes an essential contribution towards the development target. No distinction is made regarding when a member joins the Consortium.
Organizations that join the Consortium benefi t in several ways. Participants have the opportunity to leverage the contributions of all the other Members and to receive the benefi ts of a multi-million dollar develop-ment based on global expertise. Membership allows participants to ensure that their own priorities are duly considered in the ISC’s
development, ongoing maintenance and enhancement. Membership presents a visible token of participation and leadership in a project that is positioned to reduce the economic and environmental impact of invasive species globally. Members have an opportunity to discuss and infl uence common interests in an international forum of like-minded representatives of public and private sector organizations and develop-ment assistance agencies.
Development of the ISC
Th e development of the ISC has taken place in phases. Th e fi rst phase was completed after 18 months in 2008 and delivered an alpha version covering work to document 1000 invasive species. Th is was made available to the development Consortium Members for use and feedback. During the second phase, information on 500 more species was added, with enhanced develop-ment of the IT platform and with the development of advanced search tools. Th e beta version, with extended content and enhanced functionality, was released in October 2010. A revised beta version was released to the public in June 2011, with the fi nal, defi nitive version in April of 2012 (see Table 14.2; CABI, 2012).
Table 14.2. Features of the Invasive Species Compendium.
The April 2012 version of the ISC includes:
Fu ll data sheets on more than 1500 invasive species and related topics prepared by 1000 specialists from throughout the world, peer-reviewed and edited by CABI. A single data sheet for an invasive species includes:
Identity: including names, taxonomy, description Images Distribution: including global and regional maps Bio logy and Ecology: including habitat, host species, genetics, physiology, environmental
requirements, epidemiology, vectors, natural enemies Impact: including economic, environmental, cultural Ma nagement: including diagnosis, detection and control (regulatory, genetic, cultural, chemical,
biological) Gaps in knowledge/research needs References: linked to abstracts and, where available, to full text Additional data sheets on a further 7000 species 4000 images More than 75,000 abstracts of the published literature on invasive species (added to weekly) Full text of more than 1085 relevant published documents (added to weekly) Powerful search and browse facilities

236 H. Diaz-Soltero and P.R. Scott
Th e third phase of the ISC relates to sustainability. Specifi cally, the ISC will be updated continually, both in regard to information and also to accessibility and use. Th is process will involve the input and participation of Consortium Members, as well as feedback from users. At present, the business plan covers these additional costs until 2016, with the intention of indefi nite continuation.
How can the ISC be improved for the future? Proposed actions for Stage 4 of the ISC include: better GIS tools for assessing the impact of climate change on invasive species biology; training people to use the ISC; linking population decline or the extinction of native, threatened species to specifi c invasive species and documenting it in the ISC; expanding information on biological mechanisms that enhance invasive species establishment; developing new scientifi c tools for extinction vulnerability (population and habitat viability analysis and meta-model analysis); establishing and extending the capacity of the ISC to communicate and exchange data with national invasive species databanks/inventories; enhancing/updating infor mation on the biological control of invasives (updated global database on biological control); and augmenting the number of invasive species with full data sheets.
Use and Access
Open access, free at the point of use, was proposed and agreed at the ISC Inception Workshop in 2006. Th e costs of ISC maintenance are covered by the ISC Consortium contributions.
Th e ISC is freely available for use as a global knowledge base to address practical issues concerning the impact of thousands of invasive species – on the environment, on biodiversity and on agriculture, forestry and fi sheries, and on animal health. In June 2012, the Compendium content was licensed under a Creative Commons Attribution-NonCommercial-NoDerivs 2.0 UK: England and Wales Licence. It spans the boundary between invasive species’ impacts on food
security (through the productive use of land and water) and concurrent impacts on the environment and biodiversity.
Th e ISC has intrinsic value for preventing the introduction of invasive species (including providing data for tools with predictive capability) by providing timely access to information on potential intro-ductory pathways, as well as the management and containment of established invasive species. In addition, it has utility in extension, training, public awareness and research and development, and may provide a scientifi c tool for policy decisions. Th e ISC is especially valuable in the local production of educational materials – for example, public information notices and training techniques specifi c for a given bio-geographical region. All information, text and photographs in the ISC can be down-loaded to prepare educational materials specifi c to local needs.
Application of the ISC for the Detection and Prevention of Invasive Species with Climate
Change
Anthropogenic increases in atmospheric carbon dioxide, and the resultant increases in climatic variation, are among the most challenging issues in global biology (IPCC, 2007).
Th ese changes have a number of implications for the biology of invasive species. For example, increased carbon dioxide could favour weedy invasive species such as cheatgrass, exacerbating the environ-mental damage from large, cheatgrass-fuelled fi res in some regions (Ziska et al., 2005). Although additional data are needed, initial studies have suggested that, on average, invasive species may show a stronger response to both recent and projected changes in carbon dioxide relative to native plant species (Song et al., 2009). Climate change, particularly warmer temperatures, could also result in shifts of invasive species’ ranges, sometimes leading to net expansions or contractions (Parmesan, 1996; Bradley et al., 2009).

The Invasive Species Compendium as a Resource 237
Clearly, there is a need to have tools that can assist in predicting the behaviour of invasive species under diff erent climate change scenarios. Th e ISC can provide a fi rst assessment. Here are some examples on how the ISC can be used for purposes related to climate change.
Assessing the future range of an invasive species
Th e ISC contains information on the preferred climate for a species: temperature, rainfall, soils (of a plant species), etc. Th ese data are contained in tables in the Biology and Ecology section of the ISC’s Invasive Species data sheets. Th e optimal climate data relative to optimal growth and fecundity of an invasive species can be exported via text or table formats, enabling them to be used for specifi c and sophisticated climate models. Th e ISC can also export distribution data to a Google map using a KML (Keyhole Markup Language; a map fi le format that can display distribution data) download tool. Layering freely available present-day climate data under the distribution of a species could be used to explore, using maximum entropy or other techniques, the range change of the species predicted by future-climate-change models.
What are the invasives in my country?
Th e ISC can make a list of the invasive species present (those that have a full data sheet) for any country. For some countries, the information can be obtained at the state or province level. Th is can serve as a starting point for land managers, scientists and others to examine the regional threats posed by invasive species for their area. Such an assessment may also identify adjoining invasives that could potentially migrate in response to climate change (McDonald et al., 2009).
Assessing the threat of new invasives
A list of known invasive species can be requested from other geographically close
countries; or, alternatively, from countries with similar climate and/or soils. Cross-comparisons can be made in order to elucidate new threats or to assess the economic or environmental vulnerability of a given country or region to proximate invasive species. Th e ISC can then provide a list of invasive species that may present a risk. Th e GIS capability of the ISC can be used to do this task. As a result, any country can prepare prevention actions and early detection and rapid response (EDRR) programmes as management tools to cope with new invasive threats.
Th is assessment can be a two-step process. Th e ISC search capability can be deployed to compile a list of invasive species in country X that are not in country Y at present. Extrapolating the ISC data using the ISC search capability can be used with other resources such as WorldClim (www.worldclim.org) climate projection models to investigate the invasive species of a country (country X) with a climate that is the same as or similar to that predicted for another country (Y) some time in the future. Th ose species identifi ed as present in X but not in Y could then be prioritized in national invasive species prevention and management pro-grammes in country Y; programmes which could also be informed by other data in the ISC such as those relating to known pathways of introduction.
Analysing pathways for invasive species’ introductions with climate change
Th e ISC will have a data sheet for over 50 pathways used by invasive species. For a particular proposed climate change scenario, pathways that might be used by an invasive species to enter a country can be identifi ed, and as a result, management strategies to mitigate or prevent introductions can be developed and implemented.
Analysing invasive species by habitat under climate change
In the near future, over 45 habitat data sheets will be included in the ISC, providing

238 H. Diaz-Soltero and P.R. Scott
lists of associated invasive species and collating information on the specifi c risks, threats and management challenges in -vasive species pose to each of those habitats. Th e name of the habitats in the ISC is contained in the ‘Advanced Search Help’. Some of the habitats included are agricultural lands, forests, grasslands, roadsides, man-groves, salt marshes, lakes, streams, coral reefs, etc. For example, if we are interested in knowing the invasive species that are found in the habitat called ‘terrestrial-managed, forests’, we can query the ISC to list those invasive species associated with such a habitat.
If there is particular concern about the range expansion of an invasive species habitat under climate change, the ISC can also help. In our example, we might wish to pursue how invasive species within the habitat, ‘terrestrial-managed, forests’, might be impacted for a given IPCC scenario. Th e ISC can be queried for a list of invasives in that specifi c habitat throughout the world. Th e list can then be refi ned by the specifi c climate parameters (e.g. change in minimum temperature) that are projected for the climate model in question. Identifi cation of the invasive species associated with that habitat will also generate a list of species in neighbouring countries or regions with strong trade links. Th at way, in conjunction with other techniques described above, an estimated list of all of the potential invaders within that habitat and the range that habitat might occupy between regions or countries, can be examined.
Summary
Anthropogenic carbon dioxide and associ-ated changes in global climate will infl uence the distribution and biology of invasive species. Given the economic and environ-mental damage infl icted by invasives, it is imperative that management tools that can track, discern and help to prevent the establishment of invasive species become a global priority. In this regard, the Invasive Species Compendium (ISC), by initiating and maintaining a comprehensive scientifi c
database of current and potential threats, associated movements and biological and ecological characteristics, will provide a freely available, unique, easily accessible, worldwide resource to assist with the detection and management of invasive species on a global basis.
Acknowledgements
Th e authors acknowledge the collaboration and information on the ISC provided by Lucinda Charles, Gareth Richards and Elizabeth Dodsworth of CABI.
References
Bradley, B.A., Wilcove, D.S. and Oppenheimer, M. (2009) Climate change and plant invasions: restoration opportunities ahead? Global Change Biology 15, 1511–1521.
CABI (2012) Invasive Species Compendium. CAB International, Wallingford, UK (http://www.cabi.org/isc/, accessed 27 January 2014).
Hulme, P.E. (2009) Trade, transport and trouble: managing invasive species pathways in an era of globalization. Journal of Applied Ecology 46, 10–18.
IPCC (Intergovernmental Panel on Climate Change) (2007) Climate Change 2007: Impacts, Adaptation and Vulnerability. IPCC Secretariat, Geneva, Switzerland.
McDonald, A., Riha, S., DiTommaso, A. and DeGaetano, A. (2009) Climate change and the geography of weed damage: analysis of US maize systems suggests the potential for signifi cant range transformations. Agriculture, Ecosystems and Environment 130, 131–140.
Mooney, H.A. and Hobbs, R.J. (2000) Invasive Species in a Changing World. Island Press, Washington, DC, 457 pp.
Parmesan, C. (1996) Climate and species range. Nature 382, 765–766.
Pimentel, D., Zuniga, R. and Morrison, D. (2005) Update on the environmental and economic costs associated with alien-invasive species in the United States. Ecological Economics 52, 273–288.
Song, L., Wu, J., Li, C., Li, F., Peng, S. and Chen, B. (2009) Different responses of invasive and native species to elevated CO2 concentration. Acta Oecologia 35, 128–133.
Ziska, L.H., Reeves, J.B. III and Blank, R. (2005) The impact of recent increases in atmospheric

The Invasive Species Compendium as a Resource 239
CO2 on biomass production and vegetative retention of cheatgrass (Bromus tectorum): implications for fi re disturbance. Global Change Biology 11, 1325–1332.
Ziska, L.H., Blumenthal, D.M., Runion, G.B., Hunt, E.R. Jr and Diaz-Soltero, H. (2011) Invasive species and climate change: an agronomic perspective. Climatic Change 105, 13–42.
This chapter is from the book:
Climate Change Impact and Adaptation inAgricultural Systems
Author(s): Fuhrer, J., Gregory, P.J.
Published by: CABI
ISBN: 9781780642895
© CAB International 2014. Climate Change Impact and Adaptation in Agricultural Systems 7(eds J. Fuhrer & P.J. Gregory)
Climate Projections for 2050
Markku Rummukainen Centre for Environmental and Climate Research, Lund University, Sweden
11.1 Introduction
In order to assess the implications of climate change in terms of impacts and adaptation needs, projections of the future climate are needed. Climate models are the primary means of such simulations. Th e results are often coined ‘climate scenarios’ but should really be called projections, as they are built on alternative scenarios of future land-use changes and greenhouse gas emissions. Th e basis for climate projections is discussed in this chapter, together with a selection of general results that are of key relevance for agriculture, which stem from state-of-the-art climate projections. Th is chapter provides the background for the subsequent chapters in this book, and discusses climate pro-jections for the next few decades. While the focus is on the period until 2050, it should be noted that climate change will very likely continue well beyond the middle of the 21st century. Indeed, the long-term prospects are about not only a changed climate but also a climate that is changing over time, i.e. it is about con tinuous change over a long time. Th e same is thus also true for our knowledge requirements regarding climate change impacts, as well as the motivation and need for climate change adaptation; however, these may take form.
1.2 Basis for Climate Change Projections
1.2.1 General
While we observe and experience our contemporary climate and intrinsically may
expect its past behaviour to also give us a good picture of things to come, future conditions are innately unknown to us. Th is is especially true for the consequences of the use of fossil fuels and land-use change, which in creasingly adds greenhouse gases to the atmosphere, not least carbon dioxide but also methane, nitrous oxide, etc. Th ere are emissions that aff ect the tropospheric ozone, which has an eff ect on the climate, in addition to impacts on health and vegetation. Human activities also aff ect the amount of sulfate particles and soot in the atmosphere, which further compounds our impact on the climate. Land-use change, in addition to aff ecting carbon sources and sinks, aff ects the physical properties of the land surface, which further adds to the forces that the climate now responds to on global, regional and local scales (Pitman et al., 2011).
Th at we force the climate and that the climate responds is certain (IPCC, 2007). Climate change projections for the future have, however, uncertainties. Th is should not be confused with the view that they are left wanting; evaluation of climate models suggests that they perform well in many respects, and as they are based on physical principles, their results do have considerable credibility.
Model shortcomings are one source of uncertainty. Scenario uncertainty con-cerning underlying future emissions and land-use pathways is another. In addition, the climate system exhibits internal variability that arises from the complex interplay between the atmosphere, the ocean and the other climate system com-ponents. Th e relative importance of these

8 M. Rummukainen
sources of uncertainty is well established (e.g. Hawkins and Sutton, 2009).
Climate projection uncertainty is smaller at the global scale compared to the regional scale – and even more so, compared to the local scale. Th is is due largely to the ubiquitous internal variability that can simultaneously aff ect diff erent regions in contrasting ways but which is largely cancelled out in the global mean. Th e relative importance of internal variability for climate projection uncertainty declines over time, as the forced climate change signals become greater. At the same time, the uncertainty linked to the emissions and land-use change scenarios grows. Th e uncertainty attributed to climate models has a more constant presence compared to the other two factors. Th ese sources of uncertainty are discussed below.
1.2.2 Climate-forcing scenarios: fossil fuels and land-use change
Underlying climate model projections, i.e. forward-looking simulations of the evolution of the climate system, are scenarios of climate-forcing factors. In terms of the climate over the next few decades and beyond, this concerns anthropogenic emis-sions of greenhouse gases, particles and their precursors and the indirect greenhouse gases (see above), as well as land-use change. While today’s energy systems, consumption pat-terns, food and fi bre production do lock us on to a path of continued climate change in the short and medium term, the longer-term situation is less certain. Th us, scenario assumptions of emissions and land-use change are an important part of uncertainty in climate projections.
Knowledge of both the underlying climate-forcing scenario (emissions, land-use change) and of the climate model (cf. ‘climate sensitivity’, see below) is paramount when considering a specifi c climate change projection; for example, in terms of tem-perature change. Climate models, emis sions and land-use scenarios have evolved over time. Early on, more or less idealized scenarios were used, which were followed by
more versatile ones. Over the past 10 years or so, most global and regional climate pro-jections have been based on the IPCC Special Report on Emissions Scenarios (SRES; Nakićenović and Swart, 2000), which span a range of possible future emissions pathways. Th e most recent climate projections are based on the RCP scenarios (representative concentration pathway; Moss et al., 2010). Th ese are coined RCP2.6, RCP4.5, RCP6.0 and RCP8.5. Th e SRES and the RCP scenarios are set up in diff erent ways. Th e former provides greenhouse gas emission and land-use change pathways, based on under-lying assumptions regarding socio-economic drivers such as population and economic and technical development. Th e atmospheric concentrations of green house gases are then derived from the emissions scenarios, for use in climate models. Th e RCP scenarios provide radiative forcing/greenhouse gas concentration scenarios for the 21st century. Th e number attached to each scenario designates the radiative forcing in W m–2 by 2100. Th ere is an accompanying eff ort with RCPs for the generation of corresponding greenhouse gas emissions, land use and socio-economic developments.
Th ere is no one-to-one comparability of the RCPs and the SRES, but they span much of the same range of alternative future climate forcing. Th e RCPs, however, also include a scenario (RCP2.6) that corresponds to considerably lower emissions than any of the SRES scenarios, and as such is aligned with a considerable mitigation eff ort. Still, neither the SRES nor the RCPs are recom-mendations for policy, or forecasts. Th ere are no probabilities affi xed to them.
Overall, when interpreting climate model results, information is needed about the underlying emissions and land-use scenarios, as climate change projections largely scale with the emissions scenario. How much so depends, however, on the climate models themselves.
1.2.3 Climate sensitivity
Alongside assumptions regarding the emis-sions pathways and future land-use change, a

Climate Projections for 2050 9
second key uncertainty in climate change projections is the sensitivity of the climate system. Simply put, this is a measure of how much the climate changes when it is forced.1 Climate sensitivity is the net measure of the direct eff ect of the forcing and the feedback that arises within the climate system. An example of key feedback is that a warmer atmosphere can hold more moisture; as water vapour is a greenhouse gas, this en -hances the initial warming. Possible changes in clouds are another key feedback. Th e sign of the overall climate sensitivity is robustly known (positive, i.e. feedback enhances the change due to some initiating factor, such as emis sions), but its magnitude is generally only known within a range of values. Th e range of climate sensitivity in climate models overlaps with the body of estimates based on historical and con temporary climate vari-ations, which pro vides confi dence in the models and their results.
1.2.4 Climate models
Climate models are sophisticated simulation models that build on the physical, chemical and biological understanding of the climate system, written in computer code. Th ere are today quite a few global and regional climate models in the world, con stantly under further development, evalu ation and in use in research. Th e majority of climate models have interacting components for the atmosphere, the ocean and the land surface, but there are also models with interactive carbon cycle and vegetation com ponents, as well as some with yet additional climate system com ponents. Th e latter are today known as ‘Earth System Models’. In the case of models that do not carry a vegetation component, relevant properties are pre-scribed.
While climate models do exhibit various biases, they also perform well in many respects (Randall et al., 2007), including the overall global and regional climate char-acteristics and the reproduction of observed changes over time.
Global climate models are fundamental when considering the response of the
climate system to forcing. Solving the equations in climate models requires, how-ever, extensive computational power, not least as simulations span from decades to centuries and often need to be repeated with several variations. Th is constrains the resolution of the models. Even today, many global climate models have a resolution (‘grid size’) of a few hundred kilometres. Th is is insuffi cient for resolving variable landforms and other physiographical details that have a signifi cant eff ect on the near-surface climate in many regions. Global model results are therefore applied to regions by various downscaling techniques (Rummukainen, 2010) such as statistical models and regional climate models. Th e latter is also known as dynamic downscaling.
Th e global climate modelling community has a long tradition of organizing co -ordinated simulation experiments that span many climate models and diff erent sets of simulations. Many of the results in the Fourth Assessment Report of the IPCC (Inter governmental Panel on Climate Change; Meehl et al., 2007) came from the so-called CMIP3 coordinated study, which was followed by CMIP5 (Taylor et al., 2012). Coordinated regional climate model studies are fewer but have, during the past few years, emerged for several regions, not least Europe (Christensen and Christensen, 2007; Kjellström et al., 2013), the Americas (Menendez et al., 2010; Mearns et al., 2012) and Africa (Paeth et al., 2011). Coordinated studies of course provide more information for the characterization of model-related uncertainties, either by co-consideration of all results or by allowing a specifi c scenario to be tested in a wider context, including how it compares with other scenarios.
Advanced climate models are based on fundamental physical laws. Th is enables their use in projections of the future beyond the observed period. Th ere are limitations on model resolution, as mentioned above, meaning that small-scale processes that cannot be resolved have to be parameterized (i.e. represented with approximate descrip-tions). For example, cloud formation can-not be simulated explicitly in climate models as it ultimately involves very detailed

10 M. Rummukainen
mechanisms. Rather, it may be para-meterized in terms of relevant large-scale ambient conditions in the models. Para-meterization is, however, also based on the physical understanding of the involved processes.
Parameterizations are formulated in somewhat diff erent ways in diff erent climate models. Th is explains why climate models as a whole exhibit a range of climate sensitivities. Th is range overlaps obser-vational estimates.
1.2.5 Internal variability
Finally, the climate system is non-linear. Th is manifests itself in ubiquitous internal variability within the climate system, resulting in inter-annual variability and also variability at the decadal scale. Th e global mean temperature, for example, exhibits some inter-annual variability in concert with the large-scale interaction between the ocean and the atmosphere in the Pacifi c, known as El Niño–Southern Oscillation (ENSO). ENSO also has various strong regional signals around the world of anomalous warmth and coolness, as well as unusually wet and dry conditions. Diff erent variability patterns characterize yet other world regions, including the Arctic and North Atlantic Oscillations (AO, NAO; Th ompson and Wallace, 1998), the Pacifi c-North American Pattern (PNA), as well as the more regular monsoon circulations.
Th e presence of signifi cant regional-scale climate variability implies that, to begin with, while climate change is indisputably discernible at the large scale, it still may remain within regional-scale variability, meaning that it may be more diffi cult to identify conclusively at this scale. Th e same applies to climate projections and, con-sequently, the emergence of statistically signifi cant change occurs later in many regions than in the global mean (Giorgi and Bi, 2009; Kjellström et al., 2013). Mahlstein et al. (2012) fi nd, for example, that statistically signifi cant regional precipitation changes emerge only once global mean warming climbs above 1.4°C, which is
roughly a doubling of the warming until the beginning of the 2000s. Th ere is not, however, an absence of ongoing regional changes before clear signals emerge; rather, regional climates undergo transitions that may manifest themselves earlier as changes in, for example, the likelihood of extreme events (Stott et al., 2004; Jaeger et al., 2008), before the mean climate shows a signifi cant response.
1.3 Projections
1.3.1 Temperature
Temperature change is a fundamental char-acteristic of climate change (‘global warming’ is often used synonymously with the present-day ‘climate change’). Th e observed global mean change since the pre-industrial era is large compared to variability over comparable timescales, and now amounts to c.0.8–0.9°C. To keep the global mean temperature rise under 2°C has been agreed as the international target under the UN Framework Convention on Climate Change (UNFCCC). However, the present evolution of emissions is not aligned with emissions pathways that might provide a likely chance of meeting the two-degree goal (e.g. Peters et al., 2013), suggesting that global warming may well come to exceed this UNFCCC target. Th e majority of climate change projections to date build on scenarios that do not include specifi c new climate policy measures and, consequently, result in a larger warming than the two-degree goal. Th e IPCC (2007) Fourth Assessment Report contained projected global warming results that ranged from around 1°C to more than 6°C for the period between the late 20th century and the late 21st century, with con-sideration of diff erent emissions scenarios, climate models and information on climate change impacts on the carbon cycle. When additionally considering the observed warm-ing since the pre-industrial until the late 20th century, the same projected change in temperature increases to c.1.5–7°C.
Th e climate system response to forcing is not uniform. While the overall pattern due
Climate Projections for 2050 11
to emissions is one of warming, some regions will warm more (or less) than others, and thus more (or less) than the global mean change (see Plate 1). For example, a 2°C global mean warming would imply tempera-ture increases larger than 2°C over land regions.
Changes in the average temperature emerge over time in a relatively gradual manner. Changes in variability, and not least in extremes, can, however, manifest them-selves in more complicated ways. Intuitively, and what is also evident in climate pro-jections, is that warm extremes become more commonplace, whereas cold extremes less so (e.g. Zwiers et al., 2011; Orlowski and Seneviratne, 2012; Rum mukainen, 2012). It is also characteristic that in areas in which there is a reduction in seasonal snow cover, such as the high northern latitudes, the reduction of cold extremes exceeds the wintertime mean temperature change. Cor-respondingly, in the relatively dry subtropical areas that experience increasing dryness, changes in warm extremes exceed the average regional temperature change (e.g. Kharin et al., 2013).
As extremes manifest themselves in a more or less sporadic fashion, changes in them are more diffi cult to pinpoint than those of climate means (Trenberth, 2012). Extremes can also change in terms of their return period or likelihood of occurrence, magnitude, geographical distribution, and so on. When posing the question of whether extreme events will change in ways that impact a specifi c sector or region, the vulnerability of the activity or the location needs to be specifi ed. Th e use of indices may be helpful (Sillman and Roeckner, 2008; Zhang et al., 2011).
1.3.2 Precipitation
Global precipitation increases with global warming. Results suggest that the increase in the global mean of precipitation is around 2% for each 1°C rise in temperature. Th e projected changes are non-uniform over the
globe, as evident from Plate 1 (see also, for example, Solomon et al., 2009). Regional changes are often larger or smaller than the global mean change. Th ere is a distinct large-scale pattern that is coined ‘wet gets wetter’ and ‘dry gets drier’ (cf. Held and Soden, 2006). Although there are exceptions to this, it by and large summarizes the big picture well. Consequently, precipitation is projected to increase at high and middle latitudes, decrease in the subtropical regions and increase in parts of the tropics. In the transition zones between these divergent patterns, the projected change is very small or of insignifi cant magnitude. Th e exact location of the transition regions varies to some extent between models and pro-jections. Th us, in the aff ected regions, while some projections may suggest an increase, others can show a decrease.
A general increase in the occurrence of heavy precipitation is, however, a typical result both for regions in which precipitation on average increases and for regions in which precipitation on average decreases. Th ere are many measures for extreme precipitation. For example, such heavy precipitation events that at the end of the 20th century had a return period of 20 years are projected to become 1-in-15- to 1-in-10-year events by around 2050 across most of the global land area (IPCC, 2012); that is, with a rate of increase that is twice or more the rate of the global mean precipitation increase (Kharin et al., 2013). Th e un -certainty due to climate model quality is larger for the tropics than for many other regions. Climate projections tend to exhibit large increases in extreme precipitation compared to changes in average precipitation (Rummukainen, 2012; Kharin et al., 2013; Sillman et al., 2013).
Precipitation is a basic measure of hydrological conditions, but does not wholly describe issues relating to water availability; information is also needed on evapo-transpiration, soil moisture, drought risks, runoff , etc. For example, there are studies that indicate an increasing risk of drought in subtropical regions in the Americas, southern Europe, northern and southern

12 M. Rummukainen
Africa, South-east Asia and Australia (Dai, 2011; IPCC, 2012; Orlowsky and Seneviratne, 2012).
1.3.3 Other aspects
Temperature and precipitation are two fundamental aspects of the climate we experience. Th ere are also a variety of other variables and processes that intimately aff ect us, such as cloudiness, soil moisture, evapotranspiration, snow, glaciers and sea ice, wind and sea level. Characterization of the climate also involves the consideration of sequences of events and phenomena such as, for example, drought, fl ooding, storms and heatwaves. Likewise, character-ization of the climate concerns, in addition to average conditions, also variability patterns and extremes (IPCC, 2007, 2012; Rum mukainen, 2012). While climate projections can provide information on all of these aspects, a com prehensive account is beyond this chapter. Also, which aspects are pertin ent to consider depends on the question in hand: for example, the kind of climate impact or region of interest. Seasonality related to agriculture, for example, follows temperature in Europe, while it follows the succession of wet and dry periods in Africa.
1.4 Regional Patterns of Change
Global climate model projections also pro-vide information on regional-scale climate. Plate 1 gives a fi rst impression of regional patterns of projected temperature and precipitation change, relative to the overall global mean warming amount.
However, the detail in global climate model projections is constrained by model resolution, which in most cases corresponds to a few hundreds of kilometres (Masson and Knutti, 2011; Räisänen and Ylhäisi, 2011). Information on the quality of the models in simulating large-scale variability
is important for regions in which such variability plays a signifi cant role in shaping the regional climate (e.g. van Haren et al., 2013). Complementary regional-scale cli-mate projections are carried out with downscaling, either by means of regional climate models (Rummukainen, 2010) or statistical downscaling (Maraun et al., 2010). Downscaling attempts to capture better the infl uence of variable orography and land–sea distribution on the regional climate than what is feasible to achieve with global models. Consequently, for many climate change impact studies, downscaled climate projections can be a better starting point than the direct results of global climate projections.
For example, Kjellström et al. (2013) analysed results from 21 recent regional climate models for Europe. Even though these had been forced by diff erent global models, the projections gave very similar patterns of change for both temperature and precipitation (see Plate 2). Th e largest wintertime changes occur in the north-east and the largest summertime ones in the south. Precipitation tends to increase in the north and decrease in the south. However, there are also models that show small to insignifi cant changes in large parts of Europe, and models that suggest a general wetting. Th ese fi ndings largely confi rm earlier regional projection results for Europe (e.g. Christensen and Christensen, 2007; Déqué et al., 2012).
A similar analysis for Africa is shown in Plate 3. In North Africa, warming is greater in the summer than in the winter. Th ere is a similar feature in the south of Africa. Warming for most of the models here ranges from around 1°C or slightly less to somewhat above 2°C. Th e range of precipitation changes projected by regional climate models (RCMs) is similar to the European case (Plate 2), in the sense that it spans from a general drying to a general wetting. Th e RCM median result suggests drying in both the north and the south of Africa, and either an increase or no change in between these areas.

Climate Projections for 2050 13
1.5 Circulation Patterns and Regional Changes
Internal variability is a ubiquitous aspect of the climate system. Its specifi c regional manifestations can often be analysed in terms of circulation patterns or ‘large-scale variability modes’. For example, diff erent phases of ENSO lead to signifi cant regional temperature and precipitation anomalies in many parts of the world. Inter-annual variability in the North Atlantic, Europe and the Arctic region occurs in concert with the North Atlantic Oscillation and the Arctic Oscillation, and manifests itself as, not least, inter-annual variability in general cold-season weather. In monsoon regions, such as South-east Asia and Western Africa, the seasonally changing temperature con-trast between the land and the sea generates a distinct variability of regional precipitation. Under climate change, however, some of the characteristics of circulation patterns may change. Th is would imply regional climate change that further deviates from the global mean, in addition to the general larger warming over land than over sea, etc. (cf. Plate 1).
While individual models may project various changes in circulation patterns as a result of climate change, global climate projections to date do not collectively suggest major shifts in ENSO, NAO and some of the other comparable modes (IPCC, 2007). Precipitation associated with mon-soons is projected to increase in general, as well as the overall global area that is aff ected by monsoons (Hsu et al., 2012), due to higher sea surface temperature and atmospheric water vapour content resulting from global warming.
More recently, it has been postulated that the retreat of sea ice in the Arctic region may aff ect atmospheric circulation and promote the occurrence of more persistent weather patterns, such as extreme winters and summers at the high and mid-latitudes of the northern hemisphere (Francis and Vavrus, 2012; Liu et al., 2012). Climate models suggest that such a link may exist and play some role during the 21st century (Yang and Christensen, 2012). Th e expected
continued reduction of the Arctic sea ice cover may counteract the eff ect of the overall warming on the occurrence of cold winter months in Europe and concurrent mild winters across North America. Th is does not mean an expectation of more cold winters in Europe, however, but rather that cold winters will still occur even when overall warming proceeds.
Overall, regional-scale climate in many parts of the world is shaped not only by global-scale constraints but also by the action of circulation patterns; the latter often warrant special attention in the analysis of regional climate change pro-jections (Deser et al., 2012).
1.6 Discussion and Conclusion
Climate change is of global and regional concern. In addition to general warming, changes are expected in precipitation patterns and other aspects, both on average and in terms of variability and extreme events. Changes that well exceed climate variability far back in time, and certainly over the history of modern society, are to be expected. Th is underlines the need for knowledge on how the future can unfold, in order to anticipate the impacts and to be able to prepare for them. Climate projections off er a means to do this.
A pertinent question for analyses and impact assessments is ‘which climate model and projection to choose’. Unfortunately, there is no specifi c answer. Rather, one needs to recognize the sources of uncertainty and, as much as possible, look at many projections from many climate models, based on diff erent emissions scenarios. In the case of it being prohibitive to account for large sets of scenarios, the evaluation of climate models may provide guidance for choosing a smaller set of models and pro-jections. For example, one could perhaps exclude models which exhibit larger biases in variables that are especially crucial for the impact study in hand. For the early part of the 21st century, projections are relatively similar across many emissions scenarios; and one could consider focusing on one or at

14 M. Rummukainen
most a few emissions scenarios. In any case, consideration of the results from more than one model and/or projection is always recommended. While use of a subset of models and projections does not necessarily suffi ce for quantifi cation of scenario uncertainty, it can still provide a useful reminder that scenarios and projections are possible unfolding futures that are subject to uncertainty, rather than defi nitive fore-casts.
Climate projection results are often similar when it comes to the direction of the projected changes, be these of increase, decrease or no evident change. Th e size of projected change, however, varies more. Th is is due in part to diff erences in climate sensitivity, i.e. in the response to a given forcing represented in models (in other words, in the underlying process descrip-tions). Some of the variation across models can be attributed to the simulated internal variability. Nevertheless, the magnitude of change characteristically increases with fossil fuel emissions and land-use change, and thus also over time as long as these remain unabated.
One way to condense information from multiple models and projections is to consider multi-models (ensembles). Analysis of multi-model means helps to highlight results that are consistent across the models, although this occurs at the expense of sup-pressing outliers. For example, the latitude zones that border the higher latitude regions with a projected consistent pre cipitation increase, and the subtropical regions with a projected consistent pre cipitation decrease, have a ‘no change’ appearance, while specifi c projections may exhibit either increases or decreases. Outliers may need to be considered for impact assessments, as they may represent extreme responses and thus give at least a partial idea of ‘best case’ and ‘worst case’ scenarios. Th us, multi-model mean results need to be amended with con-sideration of either some individual pro-jections, or the model spread. Th e pursuit of probabilistic projection analysis of global and regional projections is a more refi ned method addressing the same problem (e.g. Déqué and Somot, 2010; Alessandri et al., 2011).
In the end, of course, the intended use of climate projections, such as in agricultural impact assessment, needs to guide the considerations. High-resolution information may be preferred, in which case downscaled information, be it from statistical or dynamical approaches, is probably needed. Th e assessment and impact model at hand may pose constraints on whether individual projections or ensemble-based results can be used. Nevertheless, proper consideration of climate projections necessarily requires insights into their basis and underlying scenario assumptions.
Note
1 The defi nition of climate sensitivity refers to the long-term (equilibrium) global mean temperature rise for a doubling of the atmospheric carbon dioxide content. A specifi c climate scenario may feature an increase in the atmospheric carbon dioxide concentration that is either smaller or larger than a doubling. The value of the climate sensitivity should thus not be confused with a specifi c climate change/global warming scenario. Another concept is the ‘transient climate response’, which refers to the warming that manifests itself around the time when the atmospheric carbon dioxide concentration doubles. The climate sensitivity is larger than the transient climate response, which is due to the slow progression of warming signals to spread in the ocean.
References
Alessandri, A., Borrelli, A., Navarra, A., Arribas, A., Déqué, M., Rogel, P., et al. (2011) Evaluation of probabilistic quality and value of the ENSEMBLES multimodel seasonal forecasts: comparison with DEMETER. Monthly Weather Review 139, 581–607.
Christensen, J.H.C. and Christensen, O.B.C. (2007) A summary of the PRUDENCE model projections of changes in European climate by the end of this century. Climatic Change 81, 7–30.
Dai, A. (2011) Drought under global warming: a review. Wiley Interdisciplinary Reviews: Climate Change 2, 45–65.
Déqué, M. and Somot, S. (2010) Weighted frequency distributions express modelling un -

Climate Projections for 2050 15
certainties in the ENSEMBLES regional climate experiments. Climate Research 44, 195–209.
Déqué, M., Somot, S., Sanchez-Gomez, E., Goodess, C.M., Jacob, D., Lenderink, G., et al. (2012) The spread amongst ENSEMBLES regional scenarios: regional climate models, driving general circulation models and inter-annual variability. Climate Dynamics 38, 951–964.
Deser, C., Phillips, A., Bourdette, V. and Teng, H. (2012) Uncertainty in climate change projections: the role of internal variability. Climate Dynamics 38, 527–546.
Francis, J.A. and Vavrus, S.J. (2012) Evidence linking Arctic amplifi cation to extreme weather in mid-latitudes. Geophysical Research Letters 39, L06801.
Giorgi, F. and Bi, X. (2009) Time of emergence (TOE) of GHG-forced precipitation change hot-spots. Geophysical Research Letters 36, L06709.
Hawkins, E. and Sutton, R. (2009) The potential to narrow uncertainty in regional climate pre-dictions. Bulletin of the American Meteorological Society 90, 1095–1107.
Held, I.M. and Soden, B.J. (2006) Robust responses of the hydrological cycle to global warming. Journal of Climate 19, 5686–5699.
Hsu, P.-C., Li, T., Luo, J.-J., Murakami, H., Kitoh, A. and Zhao, M. (2012) Increase of global monsoon area and precipitation under global warming: a robust signal? Geophysical Research Letters 39, L06701.
IPCC (2007) Climate Change 2007: The Physical Science Basis. Contribution of Working Group I to the Fourth Assessment Report of the Intergovernmental Panel on Climate Change. Solomon, S., Qin, D. Manning, M., Chen, Z., Marquis, M., Averyt, K.B., et al. (eds). Cambridge University Press, Cambridge, UK, and New York.
IPCC (2012) Managing the Risks of Extreme Events and Disasters to Advance Climate Change Adaptation. A Special Report of Working Groups I and II of the Intergovernmental Panel on Climate Change. Field, C.B., Barros, V., Stocker, T.F., Qin, Q., Dokken, D.J., Ebi, K.L., et al. (eds). Cambridge University Press, Cambridge, UK, and New York.
Jaeger, C.C., Krause, J., Haas, A., Klein, R. and Hasselmann, K. (2008) A method for computing the fraction of attributable risk related to climate damages. Risk Analysis 28, 815–823.
Kharin, V.V., Zwiers, F.W., Zhang, X. and Wehner, M. (2013) Changes in temperature and precipitation extremes in the CMIP5 ensemble. Climatic Change 119, 345–357.
Kjellström, E., Theijll, P., Rummukainen, M., Christensen, J.H., Boberg, F., Christensen,
O.B., et al. (2013) Emerging regional climate change signals for Europe under varying large-scale circulation conditions. Climate Research 56, 103–119.
Liu, J., Curry, J.A., Wang, H., Song, M. and Horton, R.M. (2012) Impact of declining Arctic sea ice on winter snowfall. Proceedings of the National Academy of Sciences 109, 4074–4079.
Mahlstein, I., Portmann, W., Daniel, J.S., Solomon, S. and Knutti, R. (2012) Perceptible changes in regional precipitation in a future climate. Geophysical Research Letters 39, L05701.
Maraun, D., Wetterhall, F., Ireson, A.M., Chandler, R.E., Kendon, E.J., Widmann, M., et al. (2010) Precipitation downscaling under climate change: recent developments to bridge the gap between dynamical models and the end user. Reviews of Geophysics 48, RG3003.
Masson, D. and Knutti, R. (2011) Spatial-scale dependence of climate model performance in the CMIP3 ensemble. Journal of Climate 24, 2680–2692.
Mearns, L.O., Arritt, R., Biner, S., Bukovsky, M.S., McGinnis, S., Sain, S., et al. (2012) The North American Regional Climate Change Assess-ment Program: overview of phase I results. Bulletin of the American Meteorological Society 93, 1337–1362.
Meehl, G.A., Stocker, T.F., Collins, W.D., Friedlingstein, P., Gaye, A.T., Gregory, J.M., et al. (2007) Global climate projections. In: Solomon, S., Qin, D., Manning, M., Chen, Z., Marquis, M., Averyt, K.B., et al. (eds) Climate Change 2007: The Physical Science Basis. Contribution of Working Group I to the Fourth Assessment Report of the Intergovernmental Panel on Climate Change. Cambridge University Press, Cambridge, UK, and New York, pp. 747–845.
Menendez, C.G., de Castro, M., Sorensson, A., Boulanger, J. and participating CLARIS model-ling groups (2010) CLARIS Project: towards climate downscaling in South America. Meteorologische Zeitschrift 19, 357–362.
Moss, R.H., Edmonds, J.A., Hibbard, K.A., Manning, M.R., Rose, S.K., van Vuuren, D.P., et al. (2010) The next generation of scenarios for climate change research and assessment. Nature 463, 747–756.
Nakićenović, N. and Swart, R. (eds) (2000) Special Report on Emissions Scenarios. A Special Report of Working Group III of the Inter-governmental Panel on Climate Change. Cambridge University Press, Cambridge, UK, and New York.
Orlowsky, B. and Seneviratne, S.I. (2012) Global changes in extreme events: regional and

16 M. Rummukainen
seasonal dimension. Climatic Change 110, 669–696.
Paeth, H., Hall, M.H.J., Gaertner, M.A., Alonso, M.D., Moumouni, S., Polcher, J., et al. (2011) Progress in regional downscaling of West African precipitation. Atmospheric Science Letters 12, 75–82.
Peters, G.P., Andrew, R.M., Boden, T., Canadell, J.G., Ciais, P., Le Quéré, C., et al. (2013) The challenge to keep global warming below 2ºC. Nature Climate Change 3, 4–6.
Pitman, A.J., Arneth, A. and Ganzeveld, L. (2011) Regionalizing global climate models. Inter-national Journal of Climatology 32, 321–337.
Räisänen, J. and Ylhäisi, J.S. (2011) How much should climate model output be smoothed in space? Journal of Climate 24, 867–880.
Randall, D.A., Wood, R.A., Bony, S., Colman, R., Fichefet, T., Fyfe, J., et al. (2007) Climate models and their evaluation. In: Solomon, S., Qin, D., Manning, M., Chen, Z., Marquis, M., Averyt, K.B., et al. (eds) Climate Change 2007: The Physical Science Basis. Contribution of Working Group I to the Fourth Assessment Report of the Intergovernmental Panel on Climate Change. Cambridge University Press, Cambridge, UK, and New York, pp. 589–662.
Rummukainen, M. (2010) State-of-the-art with regional climate models. Wiley Interdisciplinary Reviews: Climate Change 1, 82–96.
Rummukainen, M. (2012) Changes in climate and weather extremes in the 21st century. Wiley Interdisciplinary Reviews: Climate Change 3, 115–129.
Sillman, J. and Roeckner, E. (2008) Indices for extreme events in projections for anthro-pogenic climate change. Climatic Change 86, 83–104.
Sillman, J., Kharin, V.V., Zwiers, F.W., Zhang, X. and Bronaugh, D. (2013) Climate extremes indices in the CMIP5 multimodel ensemble: Part
2. Future climate projections. Journal of Geo-physical Research: Atmospheres 118, 2473–2493.
Solomon, S., Plattner, G.-K., Knutti, R. and Friedlingstein, P. (2009) Irreversible climate change due to carbon dioxide emissions. Pro-ceedings of the National Academy of Sciences 106, 1704–1709.
Stott, P.A., Stone, D.A. and Allen, M.R. (2004) Human contribution to the European heatwave of 2003. Nature 432, 610–614.
Taylor, K.E., Stouffer, R.J. and Meehl, G.A. (2012) An overview of CMIP5 and the experiment design. Bulletin of the American Meteorological Society 93, 485–498.
Thompson, D.W. and Wallace, J.M. (1998) The Arctic Oscillation signature in the wintertime geopotential height and temperature fi elds. Geophysical Research Letters 25, 1297–1300.
Trenberth, K. (2012) Framing the way to relate climate extremes to climate change. Climatic Change 115, 283–290.
van Haren, R., van Oldenborgh, G.J., Lenderink, G., Collins, M. and Hazeleger, W. (2013) SST and circulation trend biases cause an under-estimation of European precipitation trends. Climate Dynamics 40, 1–20.
Yang, S. and Christensen, J.H. (2012) Arctic sea ice reduction and European cold winters in CMIP5 climate change experiments. Geophysical Research Letters 39, L20707.
Zhang, X., Alexander, L., Hegerl, G.C., Jones, P., Klein Tank, A., Peterson, T.C., et al. (2011) Indices for monitoring changes in extremes based on daily temperature and precipitation data. Wiley Interdisciplinary Reviews: Climate Change 2, 851–870.
Zwiers, F.W., Zhang, X. and Feng, Y. (2011) Anthropogenic infl uence on long return period daily temperature extremes at regional scales. Journal of Climate 24, 881–992.