13th Economic Trends Survey of the Architects’ Council … · 13th Economic Trends Survey of the...
26
January 2015 ACE Secretariat www.ace-cae.eu 13 th Economic Trends Survey – January 2015 ACE Secretariat www.ace-cae.eu January 2015 13 th Economic Trends Survey of the Architects’ Council of Europe
Transcript of 13th Economic Trends Survey of the Architects’ Council … · 13th Economic Trends Survey of the...

January 2015 ACE Secretariat www.ace-cae.eu
13th Economic Trends Survey – January 2015
ACE Secretariat www.ace-cae.eu
January 2015
13th Economic Trends Survey of the Architects’ Council of Europe

January 2015 ACE Secretariat www.ace-cae.eu
13th Economic Trends Survey – January 2015
ACE Secretariat www.ace-cae.eu
Breakdown of responses
3341 architects responded to the questionnaire. Warning: Some of these answers were not included in the overall results due to the fact that they were not sufficiently representative in relation to the number of architects (see countries highlighted in grey).
COUNTRY ANSWERS France 1464 Belgium 399 Spain 365 Italy 192 Greece 169 Germany 127 Romania 112 Portugal 83 Slovenia 80 Sweden 68 Turkey 63 Ireland 36 United Kingdom 35 Denmark 29 Norway 21 Bulgaria 18 Switzerland 16 Austria 11 Finland 11 Slovakia 9 Luxembourg 8 Netherlands 7 Lithuania 5 Malta 5 Croatia 3 Czech Republic 2 Estonia 1 Latvia 1 Serbia 1

January 2015 ACE Secretariat www.ace-cae.eu
13th Economic Trends Survey – January 2015
ACE Secretariat www.ace-cae.eu
Profile of respondents
All sizes of architectural practice are well
represented.
40.9%
17.7%
19.3%
8.4%
6.3% 7.3%
Number of people in the company or practice where respondents work
1 person
2 people
3 to 5 people
6 to 10 people
11 to 30 people
30 or more people

January 2015 ACE Secretariat www.ace-cae.eu
13th Economic Trends Survey – January 2015
ACE Secretariat www.ace-cae.eu
For the first time since the survey was created, the number of respondents
who judge the situation for architectural practice
satisfactory, good or very good exceeds those
judging the situation as bad or very bad.
15.5%
32.7% 34.0%
14.3%
3.2% 0.3%
Current situation for architectural practice in Europe
Very bad Bad Satisfactory Good very good No opinion
Very Bad - Bad Satisfactory- Good- Very
Good April 2009 52,70% 46,30% January 2010 58,40% 45,00% January 2011 53,70% 43,90% January 2012 51,40% 47,80% January 2013 62,60% 36,63% January 2014 54,60% 44,60% January 2015 48,20% 51,50%

January 2015 ACE Secretariat www.ace-cae.eu
13th Economic Trends Survey – January 2015
ACE Secretariat www.ace-cae.eu
0.00%
10.00%
20.00%
30.00%
40.00%
50.00%
60.00%
70.00%
Apr
il 20
09
Janu
ary
2010
Janu
ary
2011
Janu
ary
2012
Janu
ary
2013
Janu
ary
2014
Janu
ary
2015
Current situation for architectural practice (business) in Europe
Very Bad - Bad
Satisfactory- Good- Very Good

January 2015 ACE Secretariat www.ace-cae.eu
13th Economic Trends Survey – January 2015
ACE Secretariat www.ace-cae.eu
The breakdown by country reveals that the appraisal
of the situation varies greatly from one country
to another. The architectural market is all
but homogeneous.
As in previous surveys, countries from Northern
Europe, headed by Norway and Finland, are
clearly more confident and satisfied than the rest of
Europe.
Persons judging the architectural market in their country to be satisfactory, good or very good
0
20
40
60
80
100
120
Nor
way
Finl
and
Sw
eden
Sw
itzer
land
Mal
ta
Luxe
mbo
urg
Den
mar
k
Aus
tria
Turk
ey
Bel
gium
Lith
uani
a
Slo
vaki
a
Rom
ania
Irlan
de
Bul
garia
Fran
ce
Slo
veni
a
Por
tuga
l
Spa
in
Gre
ece
Very Good
Good
Satisfactory

January 2015 ACE Secretariat www.ace-cae.eu
13th Economic Trends Survey – January 2015
ACE Secretariat www.ace-cae.eu
Difficulties persist in Southern and Central
Europe, where a majority of respondents judged the
situation bad or very bad in 13 countries.
The lowest satisfaction
rates are observed in Greece, Spain and
Portugal where almost 100% of respondents are dissatisfied with the state
of the architectural market in their respective country.
Persons judging the architectural market in their country to be bad or very bad
0
20
40
60
80
100
120
Gre
ece
Spa
in
Por
tuga
l
Slo
veni
a
Fran
ce
Bul
garia
Irlan
de
Rom
ania
Slo
vaki
a
Lith
uani
a
Bel
gium
Turk
ey
Aus
tria
Den
mar
k
Luxe
mbo
urg
Mal
ta
Sw
itzer
land
Sw
eden
Finl
and
Nor
way
Bad
Very Bad

January 2015 ACE Secretariat www.ace-cae.eu
13th Economic Trends Survey – January 2015
ACE Secretariat www.ace-cae.eu
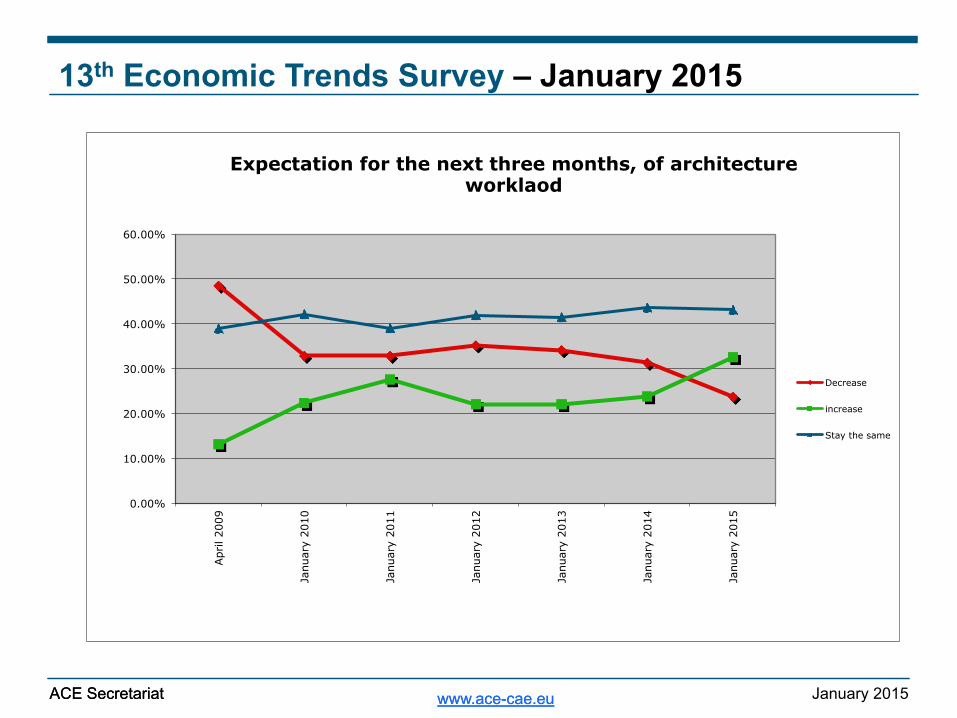
Workload forecasts for the next three months show encouraging
trends: compared with the previous survey, the number of
respondents expecting increased workloads rose from 23,8% to
32,5%.
At the same time, those expecting a decrease in their workload felt
from 31,3% to 23,7%.
For the first time, more respondents are expecting an
increase rather than an increase in their workload.
A majority still expect no change
(43,1%).
7.1%
16.6%
43.1%
26.0%
6.5% 0.7%
Expectation, for the next three months, of architectural workload
Decrease significantly Decrease a little
Stay the same
Increase a little
Increase significantly No opinion
Decrease Increase Stay the same April 2009 48,47% 13,09% 38,90% January 2010 32,80% 22,40% 42,10% January 2011 32,80% 27,60% 39,00% January 2012 35,20% 22,10% 42,00% January 2013 34,10% 22,10% 41,50% January 2014 31,30% 23,80% 43,60% January 2015 23,70% 32,50% 43,10%
January 2015 ACE Secretariat www.ace-cae.eu
13th Economic Trends Survey – January 2015
ACE Secretariat www.ace-cae.eu
0.00%
10.00%
20.00%
30.00%
40.00%
50.00%
60.00% Apr
il 20
09
Janu
ary
2010
Janu
ary
2011
Janu
ary
2012
Janu
ary
2013
Janu
ary
2014
Janu
ary
2015
Expectation for the next three months, of architecture worklaod
Decrease
increase
Stay the same

January 2015 ACE Secretariat www.ace-cae.eu
13th Economic Trends Survey – January 2015
ACE Secretariat www.ace-cae.eu
This result indicates that almost 1 in 2 offices has seen a decrease in staff numbers since the start of
the downturn.
However, since January 2013, the number of respondents reporting
an increase in staff number is slowly growing, rising from 15% in
2013 to 23,7% this year.
17.9%
25.0%
30.9%
15.4%
8.3%
2.5%
Change in staff numbers since September 2008
Decrease significantly Decrease a little
Stay the same
Increase a little
Increase significantly No opinion
Decrease increase Stay the same April 2009 37,18% 6,85% 60,40% January 2010 40,90% 15,20% 41,50% January 2011 42,30% 14,00% 42,00% January 2012 42,40% 16,50% 37,30% January 2013 45,30% 15,10% 35,60% January 2014 45,70% 22,40% 29,50% January 2015 42,90% 23,70% 30,90%

January 2015 ACE Secretariat www.ace-cae.eu
13th Economic Trends Survey – January 2015
ACE Secretariat www.ace-cae.eu
0.00%
10.00%
20.00%
30.00%
40.00%
50.00%
60.00%
70.00%
Apr
il 20
09
Janu
ary
2010
Janu
ary
2011
Janu
ary
2012
Janu
ary
2013
Janu
ary
2014
Janu
ary
2015
Change in staff numbers since September 2008
Decrease
increase
Stay the same

January 2015 ACE Secretariat www.ace-cae.eu
13th Economic Trends Survey – January 2015
ACE Secretariat www.ace-cae.eu
As in the previous surveys, a large majority of respondents did not expect any change in staff numbers for next three
months (67,5%).
However, positive trends are observed: the number of
respondents expecting an increase in staff number over
the next three months has been progressively rising since 2012.
They now exceed those expecting a decrease in their
staff number (respectively 18% and 12,8%).
4.0%
8.8%
67.5%
17.0%
1.0% 1.7%
Expectation, re: staff numbers for the next three months
Decrease significantly Decrease a little
Stay the same
Increase a little
Increase significantly No opinion
Decrease Increase Stay the same April 2009 32,35% 6,15% 64,80% January 2010 17,00% 13,20% 68,90% January 2011 15,00% 17,80% 64,80% January 2012 16,20% 10,10% 72,50% January 2013 20,80% 12,60% 62,50% January 2014 21,30% 15,20% 62,10% January 2015 12,80% 18,00% 67,50%

January 2015 ACE Secretariat www.ace-cae.eu
13th Economic Trends Survey – January 2015
ACE Secretariat www.ace-cae.eu
0.00%
10.00%
20.00%
30.00%
40.00%
50.00%
60.00%
70.00%
80.00%
April 2009 January 2010 January 2011 January 2012 January 2013 January 2014 January 2015
Expectation re: staff numbers for the next three months
Decrease
increase
Stay the same

January 2015 ACE Secretariat www.ace-cae.eu
13th Economic Trends Survey – January 2015
ACE Secretariat www.ace-cae.eu
Compared with the previous surveys, the number of
respondents expecting a decrease in workload for private housing continues to decline (26,7% in
January 2015 as compared with 33% in January 2014).
At the same time, those expecting
an increase in this area continue to rise. They are now exceeding those
expecting a decrease (27,5% compared with 26,7%).
Readers are reminded that private
housing accounts for 44% of the market for architects in Europe.
6.5%
20.2%
37.6%
24.9%
2.7% 8.2%
Expected change in workload over next 3 months - Private housing
Decrease significantly Decrease a little Stay the same Increase a little Increase significantly No opinion
Decrease Increase Stay the same April 2009 67,04% 10,44% 22,80% January 2010 47,30% 15,70% 29,80% January 2011 34,00% 26,20% 32,60% January 2012 35,10% 20,10% 38,40% January 2013 43,00% 16,10% 34,80% January 2014 33,10% 24,30% 37,50% January 2015 26,70% 27,50% 37,60%

January 2015 ACE Secretariat www.ace-cae.eu
13th Economic Trends Survey – January 2015
ACE Secretariat www.ace-cae.eu
0.00%
10.00%
20.00%
30.00%
40.00%
50.00%
60.00%
70.00%
80.00%
Apr
il 20
09
Janu
ary
2010
Janu
ary
2011
Janu
ary
2012
Janu
ary
2013
Janu
ary
2014
Janu
ary
2015
Expected change in workload over next three months - Private Housing
Decrease
increase
Stay the same

January 2015 ACE Secretariat www.ace-cae.eu
13th Economic Trends Survey – January 2015
ACE Secretariat www.ace-cae.eu
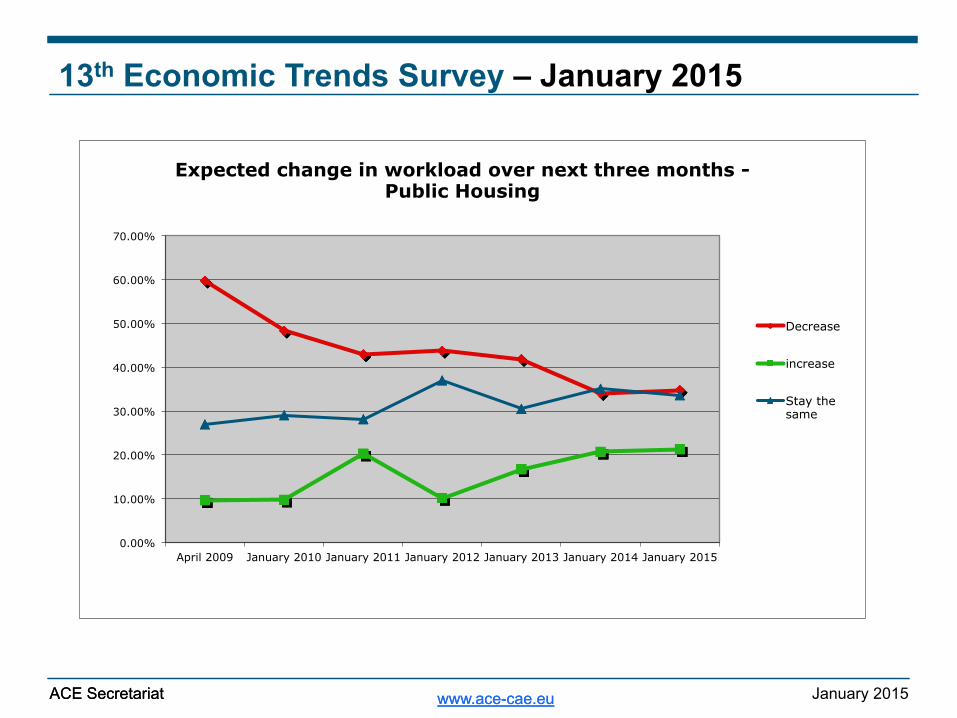
In the area of public housing, workload forecasts remain stable: around one third of
respondents expects a decrease, whereas one fifth
expects an increase, and one third no change.
Readers are reminded that public housing accounts for 6%
of the architects’ market in Europe.
12.5%
22.4%
33.7%
17.2%
4.1% 10.1%
Expected change in workload over next 3 months - Public housing
Decrease significantly Decrease a little
Stay the same
Increase a little
Increase significantly No opinion
Decrease Increase Stay the same April 2009 59,78% 9,73% 27,00% January 2010 48,30% 9,80% 29,10% January 2011 43,00% 20,30% 28,20% January 2012 43,80% 10,20% 37,00% January 2013 41,90% 16,80% 30,60% January 2014 34,10% 20,70% 35,10% January 2015 34,80% 21,30% 33,70%
January 2015 ACE Secretariat www.ace-cae.eu
13th Economic Trends Survey – January 2015
ACE Secretariat www.ace-cae.eu
0.00%
10.00%
20.00%
30.00%
40.00%
50.00%
60.00%
70.00%
April 2009 January 2010 January 2011 January 2012 January 2013 January 2014 January 2015
Expected change in workload over next three months - Public Housing
Decrease
increase
Stay the same

January 2015 ACE Secretariat www.ace-cae.eu
13th Economic Trends Survey – January 2015
ACE Secretariat www.ace-cae.eu
The number of respondents expecting a decrease of
workload in this area seems to have stabilised around
36%.
Those expecting workload to increase have been
steadily growing since 2012, doubling to 21,4% in
January 2015.
Readers are reminded that commercial projects
account for 23% of the architects’ market for in
Europe.
11.3%
25.4%
35.1%
17.2%
4.2% 6.7%
Expected change in workload over next 3 months - Commercial (offices, shops,
industrial buildings, etc)
Decrease significantly Decrease a little
Stay the same
Increase a little
Increase significantly No opinion
Decrease Increase Stay the same April 2009 76,19% 5,18% 15,30% January 2010 57,80% 9,50% 25,60% January 2011 40,10% 20,60% 33,70% January 2012 50,80% 10,20% 30,10% January 2013 49,40% 13,30% 28,10% January 2014 35,70% 14,10% 41,40% January 2015 36,70% 21,40% 35,10%

January 2015 ACE Secretariat www.ace-cae.eu
13th Economic Trends Survey – January 2015
ACE Secretariat www.ace-cae.eu
0.00%
10.00%
20.00%
30.00%
40.00%
50.00%
60.00%
70.00%
80.00% Apr
il 20
09
Janu
ary
2010
Janu
ary
2011
Janu
ary
2012
Janu
ary
2013
Janu
ary
2014
Janu
ary
2015
Expected change in workload over next three months - Commercial
Decrease
Increase
Stay the same

January 2015 ACE Secretariat www.ace-cae.eu
13th Economic Trends Survey – January 2015
ACE Secretariat www.ace-cae.eu
A majority of respondents still
expects no change in workload forecasts for other private
projects (40,6%).
Around twice as many respondents expect a decrease as an increase in their workload in this area (respectively 34,1%
and 17,7%).
Readers are reminded that other private projects account for 7% of
the architects’ market in Europe
16.5%
17.6%
40.6%
16.7%
1.0% 7.7%
Expected change in workload over next 3 months - Other private (leisure, private
schools, medical facilities, etc)
Decreased significantly Decrease a little
Stay the same
Increase a little
Increase significantly No opinion
Decrease Increase Stay the same April 2009 62,07% 3,12% 23,00% January 2010 48,50% 11,40% 30,00% January 2011 35,40% 13,90% 36,80% January 2012 40,50% 10,30% 40,30% January 2013 42,90% 10,00% 34,70% January 2014 30,30% 13,30% 45,50% January 2015 34,10% 17,70% 40,60%

January 2015 ACE Secretariat www.ace-cae.eu
13th Economic Trends Survey – January 2015
ACE Secretariat www.ace-cae.eu
0.00%
10.00%
20.00%
30.00%
40.00%
50.00%
60.00%
70.00% Apr
il 20
09
Janu
ary
2010
Janu
ary
2011
Janu
ary
2012
Janu
ary
2013
Janu
ary
2014
Janu
ary
2015
Expected change in workload over next three months - Other Private
Decrease
Increase
Stay the same

January 2015 ACE Secretariat www.ace-cae.eu
13th Economic Trends Survey – January 2015
ACE Secretariat www.ace-cae.eu
Even if the majority of
respondents still expects a decrease in this area, the trend
seems to have stabilised (around 35%).
In parallel, the number of
respondents expecting an increase in workload in this area has been steadily growing since
2012 – from 14,9% in January 2012 to 22,6% in January 2015.
17.2%
17.5%
32.3%
18.9%
3.6% 10.5%
Expected change in workload over next 3 months - Other public (schools, hospitals, museums, prison, etc)
Decrease significantly Decrease a little Stay the same Increase a little Increase significantly No opinion
Decrease Increase Stay the same April 2009 42,18% 14,58% 30,30% January 2010 41,40% 16,30% 29,80% January 2011 38,10% 20,10% 31,70% January 2012 44,30% 14,90% 31,00% January 2013 46,50% 17,10% 25,50% January 2014 34,20% 17,30% 39,70% January 2015 34,70% 22,60% 32,30%

January 2015 ACE Secretariat www.ace-cae.eu
13th Economic Trends Survey – January 2015
ACE Secretariat www.ace-cae.eu
0.00%
5.00%
10.00%
15.00%
20.00%
25.00%
30.00%
35.00%
40.00%
45.00%
50.00%
Apr
il 20
09
Janu
ary
2010
Janu
ary
2011
Janu
ary
2012
Janu
ary
2013
Janu
ary
2014
Janu
ary
2015
Expected change in workload over next three months - Other Public
Decrease
Increase
Stay the same

January 2015 ACE Secretariat www.ace-cae.eu
13th Economic Trends Survey – January 2015
ACE Secretariat www.ace-cae.eu
While a majority expects a similar workload for these
other tasks (35,9%), approximately the same number of respondents expects an increase as
those expecting a decrease (around one quarter).
4.9%
20.9%
35.9%
23.2%
3.5% 11.7%
Expected change in workload over next 3 months - Other (consultancy, energy audits, feasibility studies, etc)
Decrease significantly
Decrease a little
Stay the same
Increase a little
Increase significantly
No opinion
Decrease Increase Stay the same April 2009 47,38% 16,51% 26,80% January 2010 31,60% 28,20% 28,50% January 2011 26,00% 36,10% 27,10% January 2012 23,90% 31,30% 35,90% January 2013 23,30% 31,40% 35,20% January 2014 21,30% 28,50% 41,40% January 2015 25,80% 26,70% 35,90%

January 2015 ACE Secretariat www.ace-cae.eu
13th Economic Trends Survey – January 2015
ACE Secretariat www.ace-cae.eu
0.00%
5.00%
10.00%
15.00%
20.00%
25.00%
30.00%
35.00%
40.00%
45.00%
50.00%
April 2009 January 2010 January 2011 January 2012 January 2013 January 2014 January 2015
Expected change in workload over next three months - Other
Decrease
Increase
Stay the same

January 2015 ACE Secretariat www.ace-cae.eu
13th Economic Trends Survey – January 2015
ACE Secretariat www.ace-cae.eu
CONCLUSIONS
§ The results of the 13th economic trends survey confirm the positive trends observed in previous surveys: the architectural market is gradually recovering, and the general mood among the profession is improving.
§ For the first time in the history of the survey, more respondents are expecting an increase than a decrease in their workload for the next three months. Upward trends in workloads are reported in all segments of the market.
§ This reflects positively on short-term staffing forecasts. While the huge majority does not plan any change in the next three months, it is interesting to note that the number of respondents expecting an increase oin their staff now exceeds those expecting a decrease.
§ However, the analysis by country reveals that the European architectural market is all but homogeneous. Countries from Northern Europe remain more confident and satisfied than the rest of Europe. Difficulties persist in particular in Southern and Central Europe.