
13th Annual Report 2018-19 - ptcfinancial.com
208
Enabling the World for Green Energy Preferred Financial Partner in financing Infrastructure Projects 13 th Annual Report 2018-19
Transcript of 13th Annual Report 2018-19 - ptcfinancial.com

Enabling the World for Green Energy
Preferred Financial Partner in financing Infrastructure Projects
13th Annual Report2018-19


1
Contents
Page No.
Notice of the 13th Annual General Meeting 3
Directors’ Report 12
Report on Corporate Governance 19
Management Discussion and Analysis Report 35
Standalone Financial Statements 71
Consolidated Financial Statements 137

2
Reference Information
Registered Office : PTC India Financial Services Limited 7thFloor, Telephone Exchange Building8 Bhikaji Cama PlaceNew Delhi - 110 066Tel : (011) 26737300, Fax : (011) 26737373
CIN : L65999DL2006PLC153373
Company Secretary : Mr. Vishal Goyal
Statutory Auditors : Deloitte Haskins and Sells
Internal Auditors : Grant Thornton India LLP
Shares are listed on : National Stock Exchange of India Limited (NSE)BSE Limited (BSE)
Depository : National Securities Depository LimitedCentral Depository Services Limited
Registrar and Share Transfer Agent(for Equity and Bonds)
: Karvy Fintech Private LimitedKarvy Selenium Tower B Plot 31-32, GachibowliFinancial District, NanakramgudaHyderabad – 500 032Tel : (040) 67162222, Fax : (040) 23001153
Bankers : Allahabad BankAndhra BankAxis BankBank of IndiaBank of MaharashtraBNP ParibasCanara BankCentral Bank of IndiaCorporation BankDena BankFederal BankHDFC BankIDBI Bank LtdICICI Bank LtdIndusInd BankOriental Bank of CommercePunjab National BankState Bank of IndiaSyndicate BankThe Jammu & Kashmir BankUnion Bank of IndiaVijaya BankYes Bank
Debenture Trustee : IDBI Trusteeship Services Limited Asian Building, Ground Floor 17 R. Kamani Marg, Ballard Estate Mumbai- 400001 Tel : (022) 40807000, Fax : (022) 66311776
Website : www.ptcfinancial.com
E-mail : [email protected]@ptcfinancial.com

3
NOTICE OF 13th ANNUAL GENERAL MEETING
NOTICE is hereby given that the 13th (thirteenth) Annual General Meeting (AGM) of the Members of PTC India Financial Services Ltd. (the Company) will be held on Monday, 30th day of September, 2019 at 10:30 A.M. at Dr. SRKVS Auditorium (Dr.Sarvepalli Radhakrishnan Auditorium), Kendriya Vidyalaya No. 2, APS Colony, Gurgaon Road Delhi Cantt, New Delhi- 110010, to transact the following business:
ORDINARY BUSINESS
1. To receive, consider and adopt the (a) Audited Standalone Financial Statements of the Company for the financial year ended 31st March, 2019, together with Board’s Report, and report of Auditor’s thereon and (b) Audited Consolidated Financial Statements of the Company for the financial year ended 31st March, 2019 and report of Auditor’s thereon.
2. To consider declaration of dividend for the Financial Year 2018-19
To consider and if thought fit, to pass with or without modification (s), the following resolution for dividend for the financial year 2018-19 as an Ordinary Resolution:
“RESOLVED THAT pursuant to the provisions of Section 123 of the
Companies Act, 2013 and other applicable provisions of the Companies Act, 2013 and rules framed thereunder (including any statutory modification(s) or re-enactment thereof for the time being in force), dividend at the rate of 8% (Re.0.80 per equity share of Rs.10/- each) be and is hereby declared for the financial year 2018-19, out of the profits of the Company on the 64,22,83,335 equity shares of Rs. 10/- each fully paid up to be paid as per the ownership as on closing hours of 23rd September, 2019.”
3. To re-appoint Shri Naveen Kumar (DIN : 00279627) who retires by rotation at this AGM and being eligible offers himself for re-appointment.
To consider and if thought fit, to pass with or without modification (s), the following resolution as an Ordinary Resolution:
“RESOLVED THAT Shri Naveen Kumar (DIN : 00279627) who retires by rotation and who is eligible for re-appointment as per his existing terms be and is hereby re-appointed.”
4. To appoint M/s. MSKA & Associates, Chartered Accountants as Statutory Auditors and to fix their remuneration
To appoint auditors of the company to hold office from the conclusion of this AGM until the conclusion of 18th AGM and to fix their remuneration, and if thought fit, to pass, with or without modification(s) the following resolution as a Special Resolution:
“RESOLVED THAT pursuant to the provisions of Section 139,141 and all other applicable provisions of the Companies Act, 2013 and rules framed thereunder (including any statutory modification(s) or re-enactment thereof for the time being in force) and pursuant to the recommendation made by the Audit Committee and Board of Directors, the appointment of M/s. MSKA & Associates, Chartered Accountants (ICAI Registration no. 105047W, Floor 3, Enterprise Centre, Nehru Road, Near Domestic Airport, Ville Parle (E), Mumbai - 400099, India
PTC India Financial Services LimitedCIN: L65999DL2006PLC153373
Registered Office: 7th Floor, Telephone Exchange Building, 8 Bhikaji Cama Place New Delhi – 110 066
Tel: +91 11 26737300 / 26737400 Fax: 26737373 Website: www.ptcfinancial.com E–mail: [email protected]
as the Statutory Auditor of the Company for a period of 5 (five) years from financial year 2019-20 be and is hereby approved in place of retiring auditors M/s Deloitte Haskins & Sells (ICAI Regn. No. 015125N) and M/s. MSKA & Associates, Chartered Accountants shall hold office from the conclusion of this Annual General Meeting till the conclusion of the 18th Annual General Meeting of the Company and on such remuneration as mentioned in the explanatory statement and any amendment in the terms of its appointment including remuneration as may be determined by the Board of Directors or the Audit Committee of the Company as the case may be.
RESOLVED FURTHER THAT the Board of Directors/ Audit Committee of the Company be and is hereby authorized to do all acts and take all such steps as may be necessary, proper or expedient to give effect to this resolution.”
SPECIAL BUSINESS:
5. To appoint Dr. Pawan Singh (DIN : 00044987) as Managing Director & CEO of the Company
To consider and if deemed fit, to pass with or without modification(s), the following resolution as an Ordinary Resolution:
“RESOLVED THAT pursuant to the provisions of Section 196, 197, 203 and any other applicable provisions of the Companies Act, 2013 and the rules made thereunder (including any statutory modification(s) or re-enactment thereof for the time being in force), read with Schedule V to the Companies Act, 2013, the consent of the members be and is hereby accorded to the appointment of Dr. Pawan Singh (DIN: 00044987) as Managing Director & CEO for a period of 5 years w.e.f. 03rd October, 2018 or upto the age of superannuation which ever is earlier on such remuneration as mentioned in the explanatory statement of this notice who was appointed by the Board of Directors upon recommendation of the Nomination & Remuneration Committee on 03rd October 2018 and his powers, responsibilities and terms of appointment as Managing Director & CEO shall be decided by the Board or a Committee duly constituted by the Board from time to time. The Nomination and Remuneration Committee of the Company shall be authorized to decide/ modify the total remuneration and perquisites and decide, periodical increments/ Performance Related Pay etc. and settle all issues relating to remuneration of Dr. Pawan Singh.
RESOLVED FURTHER THAT the abovementioned remuneration including any increase therein, benefits, amenities and perquisites may be paid as minimum remuneration for any financial year in case of absence or inadequacy of profits for such year, subject to the provisions prescribed under Section 197 read with Schedule V to the Companies Act, 2013 and rules framed thereunder and any other applicable provisions of the Act or any statutory modification or re-enactment thereof.
RESOLVED FURTHER THAT the Board of Directors be and are hereby authorized to take necessary action(s) in this regard including settling of any question regarding his re-appointment and authorized to do all such acts, deeds and things as may be necessary, expedient and desirable for the purpose of giving effect to this resolution.”
6. To re-appoint Mrs. Pravin Tripathi (DIN: 06913463) as an Independent Director of the Company
4
To consider and, if thought fit, to pass, with or without modification(s), the resolution for confirmation of the re-appointment of Mrs. Pravin Tripathi (DIN: 06913463) as a non-executive Independent Director of the Company as a Special Resolution:
“RESOLVED THAT pursuant to the provisions of Sections 149, 150 and 152 read with Schedule IV and all other applicable provisions of the Companies Act, 2013 and Companies (Appointment and Qualification of Directors) Rules, 2014 (including any statutory modification(s) or re-enactment thereof for the time being in force) and Regulation 25 and all other applicable regulations of the Securities and Exchange Board of India (Listing Obligations and Disclosure Requirements) Regulation, 2015, Mrs. Pravin Tripathi (DIN: 06913463) Independent Director of the Company who has given a declaration of independence under section 149(6) of the Companies Act, 2013 along with the rules framed thereunder and Regulation 16(1)(b) of SEBI Listing Regulations in respect of whom the Company has received a notice in writing under Section 160 of the Companies Act, 2013 from a member proposing his candidature for the office of Independent Director, be and is hereby re-appointed as an Independent Director of the Company to hold office for a second term of 3 (three) consecutive years commencing from 15th October, 2018 i.e. upto 14th October, 2021 and whose office shall not be liable to retire by rotation.
RESOLVED FURTHER THAT any Director or Company Secretary of the Company be and is hereby authorized to do all such acts, deeds and things as may be necessary, expedient and desirable for the purpose of giving effect to this resolution.”
7. To appoint Dr. Nagesh Singh (DIN: 08550944) as an Independent Director of the Company
To consider and, if thought fit, to pass, with or without modification(s), the resolution for appointment Dr. Nagesh Singh (DIN: 08550944) as a non-executive Independent Director of the Company as an Ordinary Resolution:
“RESOLVED THAT pursuant to the provisions of Sections 149, 150 and 152 read with Schedule IV and all other applicable provisions of the Companies Act, 2013 and Companies (Appointment and Qualification of Directors) Rules, 2014 (including any statutory modification(s) or re-enactment thereof for the time being in force) and regulation 25 of the Securities and Exchange Board of India (Listing Obligations and Disclosure Requirements) Regulation, 2015, Dr. Nagesh Singh (DIN: 08550944) Director of the Company who has given a declaration of independence under section 149(6) of the Companies Act, 2013 in respect of whom the Company has received a notice in writing under Section 160 of the Companies Act, 2013 from a member proposing his candidature for the office of Director, be and is hereby appointed as an Independent Director of the Company to hold office for a term of 3 (three) consecutive years commencing from 30th August, 2019 i.e. upto 29th August, 2022 and whose office shall not be liable to retire by rotation.
RESOLVED FURTHER THAT any Director or Company Secretary of the Company be and is hereby authorized to do all such acts, deeds and things as may be necessary, expedient and desirable for the purpose of giving effect to this resolution.”
By Order of the Board of Directors,For PTC India Financial Services Limited
Sd/-(Vishal Goyal)
Company Secretary M.No. A19124Place: New Delhi Address: 7th Floor, Telephone Exchange Building,Date: 30th August, 2019 8 Bhikaji Cama Place,New Delhi-110066
Notes:
1. The statement pursuant to section 102(1) of the Companies Act, 2013 with respect to the Special Business set out in the Notice ss Annexed.
2. A Member entitled to attend and vote at the AGM is entitled to appoint a proxy/proxies to attend and vote on a poll instead of himself/herself and a proxy/proxies need not be a Member of the Company. The instrument appointing a proxy in order to be effective should, however, be deposited at the registered office of the Company not less than 48 hours before the commencement of the Meeting. a proxy form i.e. MGT–11 for the Meeting is enclosed.
3. A person can act as proxy on behalf of Members not exceeding fifty (50) and holding in the aggregate not more than ten percent (10%) of the total share capital of the Company carrying voting rights. A member holding more than ten percent (10%) of the total share capital of the Company carrying voting rights may appoint a single person as proxy and such person shall not act as a proxy for any other person or shareholder.
4. Any member who is entitled to vote on any resolution may make requisition to the Company in writing at least three days before the commencement of AGM and such member can inspect the proxies during the period beginning twenty four hours before the time fixed for the commencement of the meeting and ending with conclusion of the meeting.
5. Corporate members intending to send their authorized representatives to attend the AGM are requested to send the Company a certified copy of the Board Resolution to the Company, authorizing their representative to attend and vote on their behalf at the meeting.
6. The Register of Directors and Key Managerial Personnel and their shareholding, maintained u/s 170 of the Companies Act, 2013 and Register of contracts or arrangements in which directors are interested, maintained u/s 189 of the Companies Act, 2013 will be available for inspection by the members at the AGM.
7. Relevant documents referred to in the accompanying notice and the explanatory statement are open for inspection at the registered office of the Company on all working days, except Saturdays and Sundays, between 11:00 a.m. and 1:00 p.m. upto the date of AGM.
8. Additional information, pursuant to Regulation 36 of SEBI (Listing Obligations and Disclosure Requirements) Regulations, 2015, in respect of the Directors seeking appointment and re-appointment at the AGM is furnished as annexure to the notice and forms part of the notice. The Directors have furnished consent/declarations for their appointment/re-appointment as required under the Companies Act, 2013 and the rules thereunder.
9. The Register of Members and Share Transfer Books of the Company will be closed from 24th September, 2019 to 30th September, 2019 (both days inclusive) for determining the names of members eligible for dividend on Equity Shares, if declared at the meeting.
10. The Securities and Exchange Board of India (SEBI) has mandated the submission of Permanent Account Number (PAN) for participating in the securities market. Members holding shares in electronic form are, therefore, requested to submit their PAN to their Depository Participants with whom they are maintaining their demat accounts. Members holding shares in physical form can submit their PAN to the Company or Share Transfer Agent. SEBI has also mandated that for registration of transfer of securities, the transferee(s) as well as transferor(s) shall furnish a copy of their PAN card to the Company /RTA for registration of transfer of securities.
11. If the Final Dividend on equity shares as recommended by the Board of Directors, if declared at the meeting, payment of such dividend will be made within 30 days from the date of declaration.

5
i) To all Beneficial Owners in respect of shares held in dematerialized form as per the data made available by National Securities Depository Limited (NSDL) and the Central Depository Services Limited (CDSL) as of the close of business hours on 23rd September, 2019.
ii) To all members in respect of shares held in physical form after giving effect to valid transfers in respect of transfer requests lodged with the Company on or before the close of business hours on 23rd September, 2019.
12. The Shareholders/ Proxies/ Authorized Representatives are requested to produce at the Registration Counter(s) the attendance slip duly completed and signed, for admission to the meeting hall.
13. Members/ proxies should bring their copy of the Annual Report for reference at the meeting.
14. Members who hold shares in dematerialized form are requested to write their Client ID and DP ID and those who hold shares in the physical form are requested to write their folio number in the attendance slip for attending the meeting to facilitate identification of membership at the meeting.
15. In case of joint holders attending the meeting, the Member whose name appears as the first holder in the order of names as per the Register of Members of the Company will be entitled to vote.
16. Members desirous of making a nomination in respect of their shareholding in the company, as permitted under Section 72 of the Companies Act, 2013, are requested to write to Karvy Finetch Pvt. Ltd. (formerly known as Karvy Computershare Pvt. Ltd.), Registrar & Transfer Agent of the Company in the nomination form (i.e. Form No. SH. 13). In case, shares held in dematerilised form, the nomination has to be lodged with the respective depository participant. The nomination form can be downloaded from the Company’s website www.ptcfinancial.com.
17. The communication address of our Registrar and Share Transfer Agent (RTA) is M/s. Karvy Finetch Private Limited, Karvy Selenium Tower B, Plot 31-32, Gachibowli, Financial District, Nanakramguda, Hyderabad – 500 008.
18. Members are requested to notify immediately any change of address and change in bank details etc.:
i) to their DP in respect of Shares held in dematerialized fromii) to RTA i.e. M/s.Karvy Finetch Pvt. Ltd. (formerly known as Karvy
Computershare Pvt. Ltd.)in respect of their physical shares, if any, quoting their folio number.
19. Members holding shares in physical form are requested to consider converting their holding to dematerialized form to eliminate all risks associated with physical shares.
20. For Electronic Clearing System (ECS) facility for crediting dividend directly to your designated bank accounts, shareholders are requested to give their mandate in the form enclosed.
21. Members may also note that the Notice of 13th AGM and PFS Annual Report 2018-2019 will be available on the Company’s website www.ptcfinancial.com.
22. None of the Directors/KMPs of the Company is in anyways related to each other.
23. Members are requested to send all correspondence concerning registration of transmissions, sub-division, consolidation of shares or any other shares related matter and/or change in address and bank account, to Company’s Registrar, Karvy Fintech Pvt. Ltd , Karvy Selenium Tower B, Plot 31-32, Gachibowli, Financial District, Nanakramguda, Hyderabad – 500 032.
24. Members who hold shares in physical form in multiple folios in identical names or joint holding in the same order of names are requested to send the share certificates to the Company or Share Transfer Agent, for consolidation into a single folio.
25. Members desirous of getting any information on any item(s) of business of this Meeting are requested to address their queries to the Company at the registered office atleast 10 days prior to the date of the meeting, so that the information required can be made readily available at the meeting.
26. The Company is not providing video conferencing facility for this meeting but the voting at the meeting shall be conducted through polling and polling papers will be made available in the meeting. Further, the members attending the meeting who have not already caste their voting by e-voting will be able to exercise their voting at the meeting. Moreover, the members who have caste vote through e-voting may attend the meeting but they are not eligible to vote in the meeting.
27. Members who wish to claim dividends, which remain unpaid, are requested to correspond with our Registrar and Share Transfer Agent (RTA) i.e. Karvy Fintech Pvt. Ltd. Members are requested to note that dividend not en-cashed/ claimed within seven years will be transferred to Investor Education and Protection Fund of Government of India. In view of this, members are requested to send all un-cashed dividend warrants pertaining to respective years to Company/ RTA for revalidation and en-cash them before due date.
28. In compliance with the provisions of Section 108 of the Companies Act, 2013 read with the Companies (Management and Administration) Rules, 2014 as substituted by the Companies (Management and Administration) Amendment Rules, 2015 and in terms of Regulation 44 of SEBI (Listing Obligations and Disclosure Requirements) Regulations, 2015 the Company is pleased to provide the facility to Members to exercise their right to vote by electronic means at the 13th AGM of the Company and the businesses as contained in this notice may be transacted through e-voting. The Company has entered into an arrangement with Karvy Fintech Private Limited for facilitating e-voting for AGM.
29. (a) This Notice is being sent to all the members whose name appears as on 23rd August, 2019 (closing hours) in the Register of members or beneficial owner as received from Karvy Fintech Private Limited (RTA).
(b) The voting rights of shareholders shall be in proportion to their shares of the paid up equity share capital of the Company as on 23rd September, 2019 being cut-off date. Members are eligible to cast vote through remote e-voting or voting in the AGM only if they are holding shares as on that date.
30. The Ministry of Corporate Affairs has undertaken a ‘Green Initiative in Corporate Governance’ and allowed companies to share documents with its shareholders through electronic mode. Members are requested to support this green initiative by registering/uploading their email addresses, in respect of shares held in dematerialized form with their respective Depository Participant and in respect of shares held in physical form with the Company’s Registrar and Share Transfer Agents.
31. The Annual Report 2018-2019, the Notice of 13th AGM and instructions for e-voting, along with the Attendance Slip and Proxy form, are being sent by electronic mode to all members whose e-mail address are registered with the Company/ Depository Participant(s), unless a member has requested for a physical copy of the documents. For members who have not registered their email addresses, physical copies of the documents are being sent by the permitted mode.
32. Non-Resident members are requested to inform RTA, immediately of:
(a) Change in their residential status on return to India for permanent settlement.

6
(b) Particulars of their bank account maintained in India with complete name branch, account type, account number and address of the bank with pin code number, if not furnished earlier.
(c ) In terms of notification issued by Securities and Exchange Board of India (SEBI), equity shares if the Company are under compulsory demat trading by all investors. Members are therefore, advised to dematerialize their shareholding to avoid inconvenience in trading in shares of the Company.
33. Subject to receipt of requisite number of votes, the resolutions shall be deemed to be passed on the date of the Meeting i.e. 30th September, 2019.
34. A route map to reach the venue of the AGM, including prominent landmark for easy location, attached along with the notice.
35. Voting through Ballot Paper
Members who have not exercised the option of Remote E-voting shall be entitled to participate and vote at the venue of the AGM on the date of AGM. The voting at the venue of the AGM shall be done through the Ballot Papers and Members attending the AGM shall be able to exercise their voting right at the meeting through Ballot Papers. After the agenda items have been discussed, the Chairman will instruct the scrutinizer to initiate the process of voting on the all resolutions through Ballot Papers. The Ballot Paper/s will be issued to the Shareholders/Proxy holders/ Authorised Representatives present at the AGM. The shareholder may exercise their right of vote by tick marking as (√) against ‘FOR’ and ‘AGAINST’ as his/her choice may be, on the agenda item in the Ballot Paper and drop the same in the Ballot Box(es) kept at the meeting hall for this purpose.
In such an event, votes cast under Poll taken together with the votes cast through remote e-voting shall be counted for the purpose of passing of resolution(s).
The Scrutinizer shall after the conclusion of voting at the General Meeting, will first count the votes cast at the meeting and thereafter unblock the votes cast through remote e-voting in the presence of at least two witnesses not in the employment of the Company and shall make, not later than 48 hours of the conclusion of the AGM, a consolidated Scrutinizer’s Report of the total votes cast in favour or against, if any, to the Chairman or a person authorised by him in writing who shall countersign the same and declare the result of the voting forthwith.
The results declared, alongwith the report of the Scrutinizer Report shall be placed on the website of the Company www.ptcfinancial.com under the section ‘Investor Service- Corporate Announcement’ and on the website of Karvy immediately after the declaration of result by the Chairman or a person authorised by him in writing. The Results shall also be immediately forwarded to the Stock Exchanges where the shares of the Company are listed. A member may participate in the AGM even after exercising his right to vote through remote e-voting but shall not be allowed to vote again at the AGM.
Subject to receipt of requisite number of votes, the resolutions shall be deemed to be passed on the date of the Meeting i.e. 30th September, 2019
PROCEDURE AND INSTRUCTIONS FOR E-VOTING
Members may cast their votes through electronic means by using an electronic voting system from a place other than the venue of AGM (Remote E-voting) in the manner provided below during the e-voting period as mentioned below:
The procedure and instructions for e-voting are as under:
i) Open your web browser during the voting period and navigate to ‘https://evoting.karvy.com’
ii) Enter the login credentials (i.e., user-id & password) mentioned on Attendance Slip/ Email forwarded through the electronic notice or physical copies sent by courier along with Annual Report and Notice calling the AGM.
User – ID For Members holding shares in Demat Form:- a) For NSDL :- 8 Character DP ID followed by 8
Digits Client ID
b) For CDSL :- 16 digits beneficiary ID
c) For Members holding shares in Physical Form:- Event no. followed by Folio Number registered
with the company
Password Your Unique password is printed on the E-voting Form / via email forwarded through the electronic notice
Captcha Enter the Verification code i.e., please enter the alphabets and numbers in the exact way as they are displayed for security reasons.
iii) Please contact toll free No. 1-800-34-54-001 for any further clarifications.
iv) The remote e-voting period commences on 27th September, 2019 (9:00 am) and ends on 29th September, 2019 (5:00 pm). During this period, members of the Company, holding shares either in physical form or in dematerialized form, as on the cut-off date of 23rd September, 2019, may cast their vote by remote e-voting. The remote e-voting module shall be disabled by Karvy for voting thereafter. Once the vote on a resolution is cast by the member, the member shall not be allowed to change it subsequently.
v) After entering these details appropriately, click on “LOGIN”.
vi) Members holding shares in Demat/Physical form will now reach Password Change menu wherein they are required to mandatorily change their login password in the new password field. The new password has to be minimum eight characters consisting of at least one upper case (A-Z).one lower case (a-z), one numeric value (0-9) and a special character. Kindly note that this password can be used by the Demat holders for voting for resolution of any other Company on which they are eligible to vote, provided that Company opts for e-voting through M/s. Karvy Fintech Private Limited e-Voting platform. System will prompt you to change your password and update any contact details like mobile number, e-mail ID etc. on 1st login. You may also enter the Secret Question and answer of your choice to retrieve your password in case you forget it. It is strongly recommended not to share your password with any other person and take utmost care to keep your password confidential.
vii) You need to login again with the new credentials.
viii) On successful login, system will prompt to select the ’Event’ i.e., ‘PTC India Financial Services Ltd.’.
ix) If you are holding shares in Demat form and had logged on to “https://evoting.karvy.com” and casted your vote earlier for any company, then your existing login id and password are to be used.
x) On the voting page, you will see Resolution Description and against the same the option ‘FOR/AGAINST/ABSTAIN’ for voting. Enter the number of shares (which represents number of votes) under ‘FOR/AGAINST/ABSTAIN’ or alternatively you may partially enter any number in ‘FOR’ and partially in ‘AGAINST’, but the total number in ‘FOR/AGAINST’ taken together should not exceed your total shareholding. If the shareholder do not want to cast the vote, select ‘ABSTAIN’
xi) After selecting the resolution to vote, click on “SUBMIT”. A confirmation box will be displayed .If you wish to confirm your vote, click on “OK”, else to change your vote, click on “CANCEL “and accordingly modify your vote.

7
xii) Once you ‘CONFIRM’ your vote on the resolution, you will not be allowed to modify your vote.
xiii) Corporate/Institutional Members (corporate /Fls/Flls/Trust/Mutual Funds/Banks, etc) are required to send scan (PDF format) of the relevant Board resolution to the Scrutinizer through e-mail with a copy to [email protected]. The file scanned image of the Board Resolution should be in the naming format “Corporate Name_ Event no.”.
xiv) If you are already registered with Karvy Fintech Private Limited for e-voting then you can use your existing user ID and password for casting your vote. You can also update your mobile number and e-mail id in the user profile details of the folio which may be used for sending future communication(s)
xv) Shri Ashish Kapoor (Membership No. F-8002) Prop. M/s. Ashish Kapoor & Associates, Company Secretaries has been appointed as the Scrutinizer to scrutinize the e-voting process in a fair and transparent manner. The scrutinizer shall forward the consolidated report of total votes cast in favour or against through remote e-voting and voting at the venue of the AGM immediately. The Chairman shall within 48 hours of conclusion of AGM declare the result and such result along with the scrutinizer shall be displayed on the website of the Company and on the website of the agency.
xvi) The Results declared along with Scrutinizer’s Report(s) will be available on the website of the Company (www.ptcfinancial.com) and on Service Provider’s website (https://evoting.karvy.com) within two (2) days of passing of the resolutions and communication of the same to the BSE Limited and the National Stock Exchange of India Limited.
xvii) The Scrutinizer shall, immediately after the conclusion of voting at the Annual General Meeting, first count the votes cast at the meeting, thereafter unblock the votes cast through remote e-voting in the presence of at least two persons not in the employment of the Company.
xviii) At the venue of AGM, voting shall be done through ballot paper and the members attending the AGM, who have not casted their votes by Remote e-voting shall be entitled to cast their votes through ballot paper.
xix) A member may participate in the AGM even after exercising his right to vote through Remote E-voting but shall not be allowed to vote again at the venue of the AGM. If a member casts votes through Remote e-voting and also at the AGM, then voting done through Remote E-voting shall prevail and voting done at the AGM shall be treated as invalid.
xx) Any person who becomes a member of the Company after dispatch of the Notice of the AGM and holding shares on the cut-off date i.e. 23rd August, 2019 may obtain the User ID and password as mentioned below:
a. If the mobile number of the member is registered against Folio No./ DPID Client ID, the member may send SMS : MYEPWD E-Voting Even Number+ Folio No. or DPID Client ID to 921993399.
b. If e-mail address or mobile number of the member is registered against folio no. DP ID, Client ID then on the home page of https://evoting.karvy.com, the member may click “Forgot Password” and enter folio no. or DP ID, Client ID and PAN to generate a password.

8
Item No. 4
The members of the Company is hereby apprised that the tenure of the existing auditors has been expired and is not eligible for re-appointment pursuant to provsions of mandatory rotation of auditors.
The Audit Committee has considered the qualifications and experience of the proposed auditors and has recommended their appointment. The Board of Directors has also considered the matter and recommends for passing the Special Resolution appointing M/s. MSKA & Associates, Chartered Accountants, (Firm’s Registration No. 105047W) as statutory auditors in place of the retiring auditors M/s. Deloittee Haskins and Sells, Chartered Accountants, (Regn. No. 015125N). Consent of the proposed auditors together with the certificate that the appointment, if made, shall be in accordance with the conditions specified in Rule 4 of the Companies (Audit and Auditors) Rules, 2014 has been received.
Following disclosure as per the Reg 36(5) of the Listing Regulations, 2015:
S. No.
Particulars
1 Proposed fees payable to the statutory auditor(s) along with terms of appointment and any material change in the fee payable to such auditor from that paid to the outgoing auditor along with the rationale for such change.
Rs. 25 lakhs plus out of pocket expenses and the applicable taxes and as may be determined by the Audit Committee.
2 Basis of recommendation for appointment including the details in relation to and credentials of the statutory auditor(s) proposed to be appointed.
MSKA & Associates is the affiliated firm of BDO India, BDO India LLP is the India member firm of BDO International having presence in 162 countries and meeting the eligbility criteria and the lowest financial proposal.
None of the Directors / Key Managerial Personnel of the Company / their relatives are, in any way, concerned or interested, financially or otherwise, in the resolution set out at item No. 4 of the Notice.
Item no. 5
Based on the recommendation of the Nomination and Remuneration Committee, the Board of Directors of the Company in their meeting held on 3rd October, 2018 has appointed Dr. Pawan Singh as Managing Director & CEO of the Company for a period of 5 years w.e.f. 03rd October, 2018 or upto the date of superannuation whichever is earlier.
Presently, the Annual cost to the company (CTC) of Dr. Pawan Singh is fixed at Rs. 73.58 lacs. Further, he was also entitled for Performance Related Pay of upto 40% of fixed CTC. In addition to this, he is also entitled to PF, Gratuity, other perquisites, yearly increment, vehicle facility and other benefits which are admissible to a MD & CEO level functionary in line with the Remuneration Policy of the Company as amended from time to time The remuneration of Dr. Pawan Singh and the perquisites has been provided in this Annual Report. The remuneration is also proposed to be ratified by the members besides his appointment. The total remuneration shall be subject to the applicable provisions relating to remuneration as specified under the Companies Act, 2013.
The Board or a duly constituted Committee of the Board of the Company shall be authorized to take decisions related to the remuneration, perquisites as per terms of appointment and periodical increments/performance related pay, etc of Dr. Pawan Singh and also to settle all issues relating to his appointment and remuneration. Dr. Pawan Singh does not have any shareholding in the Company.
Brief resume of Dr. Pawan Singh
Dr. Pawan Singh is Managing Director & CEO of the Company. He was member of the IRAS and holds MBA and Ph.D in management and has more than 35 year of experience in infrastructure and infrastructure finance. He has handled high/Board level responsibilities over 13 year. He has been responsible for turnaround of power companies from loss making to dividend paying companies. Dr. Pawan Singh was the Director (Finance) of the Company since February 2012.
A brief profile of Dr. Pawan Singh is also annexed to the Notice in accordance with the SEBI (Listing Regulations), 2015 and Secretarial Standard. The Company has received a notice in writing as per Section 160 of the Companies Act, 2013, signifying intention to propose Dr. Pawan Singh as Managing Director & CEO on the Board of the Company.
The above appointment of Dr. Pawan Singh, being liable to retire by rotation in terms of Section 152 of Companies Act, 2013 requires approval of the Members in the General Meeting.
Dr. Pawan Singh has confirmed that he is not disqualified from being appointed as Director under Section 164 of Companies Act, 2013 and given his consent to act as Director.
No other Director/KMP or any relative of any of the Directors of the Company or the relatives of any key managerial personnel is, in anyway, concerned or interested in appointment of Dr. Pawan Singh except him. The Board recommends the resolution for approval of the shareholders.
The Board recommends the resolutions set out at the Item No. 5 of the Notice for your approval
Item no. 6
Mrs. Pravin Tripathi was appointed as Independent Director of the Company w.e.f. 15th October, 2015 for a period of 3 years and her tenure was completed on 14th October, 2018 In terms of requirement of corporate governance norms of SEBI Listing Regulations of having requisite number of independent directors and based upon the recommendation of Nomination & Remuneration Committee, the Board of Directors of the Company in their meeting held on 03rd October, 2018 has re-appointed Mrs. Pravin Tripathi (DIN: 06913463) as an Independent Director for a period of three year w.e.f. 15th October, 2018.
Further, the Company has received a notice in writing from a member under Section 160 of the Act proposing the candidature of Mrs. Pravin Tripathi for the office of Director of the Company. Mrs. Pravin Tripathi is not disqualified from being appointed as a Director in terms of Section 164 of the Act and has given her consent to act as a Director.
The Board, based on the performance evaluation and recommendation of Nomination and remuneration Committee considers that given her background, experience, and contribution, the continued association of Mrs. Pravin Tripathi (DIN: 06913463) would be beneficial to the Company and it is desirable to continue to avail her service as Independent Director.
Annexure to the Notice
EXPLANATORY STATEMENT PURSUANT TO SECTION 102 OF THE COMPANIES ACT, 2013

9
The Company has received a declaration from Mrs. Pravin Tripathi that she meets the criteria of independence as prescribed both under sub-section (6) of Section 149 of the Act and under Securities and Exchange Board of India (Listing Obligations And Disclosure Requirements) Regulations, 2015 (“LODR”).
In the opinion of the Board, Mrs. Pravin Tripathi fulfills the conditions specified in the Act and the SEBI Listing Regulations.
Brief resume of Mrs. Pravin Tripathi
Mrs. Tripathi has worked at various senior positions in Govt. of India. She is a B.A. (Hons.) and Master in English from Punjab University and also IA&AS of 1973 Batch (retired). Mrs. Tripathi was appointed as member of Competition Appellate Tribunal and also worked as member of Airport Economic Regulatory Authority Appellate Tribunal. She has also worked as Deputy Comptroller & Auditor General of India.
A profile of Mrs. Pravin Tripathi is also annexed to the Notice in accordance with the LODR and Secretarial Standard.
The resolution seeks approval of the shareholders in terms of provisions of Section 149, 150, 152, Schedule IV of the Companies Act, 2013 read with Companies (Appointment and Qualification of Directors) Rules, 2014, for the re-appointment of Mrs. Pravin Tripathi as Independent Director for the tenure as mentioned in the resolutions mentioned in this notice. Her office of directorship shall not be liable to retire by rotation. The terms and conditions of appointment shall be open for inspection by the shareholders at the registered office of the Company during normal business hours on any working day excluding Saturday & Sunday.
No other Director/KMP or any relative of any of the Directors of the Company or the relatives of any key managerial personnel is, in anyway, concerned or interested in appointment of Mrs. Pravin Tripathi except her. The Board recommends the resolution for approval of the shareholders.
The Board considers that her continued association would be of immense benefit to the Company and it is desirable to continue to avail services of Mrs. Pravin Tripathi as an Independent Director. Accordingly, the Board recommends the resolution in relation of appointment of Mrs. Pravin Tripathi as an Independent Director, for the approval of members of the Company as an Special Resolution.
Item no. 7
Dr. Nagesh Singh (DIN: 08550944) was appointed as Independent Director of the Company w.e.f. 30th August, 2019 for a period of 3 years In terms of requirement of corporate governance norms of SEBI Listing Regulations of having requisite number of independent directors and based upon the recommendation of Nomination & Remuneration Committee, the Board of Directors of the Company appointed Dr. Nagesh Singh (DIN: 08550944) as an Independent Director for a period of three years w.e.f. 30th August 2019 to 29th August, 2022.
Further, the Company has received a notice in writing from a member under Section 160 of the Act proposing the candidature of Dr. Nagesh Singh for the
office of Director of the Company. Dr. Nagesh Singh is not disqualified from being appointed as a Director in terms of Section 164 of the Act and has given her consent to act as a Director.
The Company has received a declaration from Dr. Nagesh Singh that he meets the criteria of independence as prescribed both under sub-section (6) of Section 149 of the Act and under Securities and Exchange Board of India (Listing Obligations And Disclosure Requirements) Regulations, 2015 (“LODR”).
In the opinion of the Board, Dr. Nagesh Singh fulfills the conditions specified in the Act and the SEBI Listing Regulations.
Brief resume of Dr. Nagesh Singh
Dr. Nagesh Singh joined the Indian Economic Services 1982. During his career, he had worked in Planning Commission, Department of Industrial Policy and Promotion, Ministry of Social Justice and Empowerment, Ministry of Human Resources Development and Ministry of Rural Development. In Planning Commission he worked in the Project Appraisal and Management Division for over 20 years. This division appraises all public sector investment proposals for final approval by the Government. He also handled Sarv Shiksha Abhiyaan in the Ministry of Human Resources Development from 2012-2013. He was also associated with ‘Make in India’ initiative of the government in the Department of Industrial Policy and Promotion. Dr. Singh retired as Additional Secretary from Goverment of India in January 2018.
A profile of Dr. Nagesh Singh is also annexed to the Notice in accordance with the LODR and Secretarial Standard.
The resolution seeks approval of the shareholders in terms of provisions of Section 149, 150, 152, Schedule IV of the Companies Act, 2013 read with Companies (Appointment and Qualification of Directors) Rules, 2014, for the re-appointment of Dr. Nagesh Singh as Independent Director for the tenure as mentioned in the resolutions mentioned in this notice. His office of directorship shall not be liable to retire by rotation. The terms and conditions of appointment shall be open for inspection by the shareholders at the registered office of the Company during normal business hours on any working day excluding Saturday & Sunday.
No other Director/KMP or any relative of any of the Directors of the Company or the relatives of any key managerial personnel is, in anyway, concerned or interested in appointment of Dr. Nagesh Singh except him. The Board recommends the resolution for approval of the shareholders.
Accordingly, the Board recommends the resolution in relation of appointment of Dr. Nagesh Singh as an Independent Director, for the approval of members of the Company as an Ordinary Resolution.
By Order of the Board of Directors,For PTC India Financial Services Limited
(Vishal Goyal)Company Secretary
Place: New DelhiDate: 30th August, 2019

10
Annexure – A
Brief Profile of Directors seeking Appointment/Re–appointment at the 13th Annual General Meeting in pursuant to Regulation 36 of the SEBI (Listing Obligations and Disclosure Requirements) Regulations, 2015 and Secretarial Standards, is set forth as below:–
Name Dr. Pawan Singh Mrs. Pravin Tripathi Dr. Nagesh Singh
Date of birth 19th October, 1961 23rd October, 1949 1st January, 1958
Age 58 69 61
DIN No. 00044987 06913463 08550944
Date of appointment/ re–appointment
03rd October, 2018 15th October, 2018 30th August, 2019
Qualification IRAS of 1986 Batch (Retd.), MBA and Ph.D. in management
IA&AS of 1973 Batch (retired), B.A. (Hons.) and Master in English from Punjab university.
Indian Economic Service, 1982 Batch (retired)
Details of remuneration sought to be paid
Details are mentioned in the explanatory statement.
Sitting Fees mentioned in the explanatory statement.
Sitting Fees mentioned in the explanatory statement.
Nationality Indian Indian Indian
Experience Dr. Pawan Singh is Managing Director & CEO of the Company. He was member of the IRAS and holds MBA and Ph.D in management and has more than 35 year of experience in infrastructure and infrastructure finance. He has handled high/Board level responsibilities over 13 year. He has been responsible for turnaround of power companies from loss making to dividend paying companies. Dr. Pawan Singh was the Director (Finance) of the Company since February 2012.
Mrs. Tripathi has worked at various senior positions in Govt. of India. She is a B.A. (Hons.) and Master in English from Punjab university and also IA&AS of 1973 Batch (retired). Mrs. Tripathi was appointed as member of Competition Appellate Tribunal and also worked as member of Airport Economic Regulatory Authority Appellate Tribunal. She has also worked as Deputy Comptroller & Auditor General of India.
Dr. Nagesh Singh joined the Indian Economic Services 1982. During his career, he had worked in Planning Commission, Department of Industrial Policy and Promotion, Ministry of Social Justice and Empowerment, Ministry of Human Resources Development and Ministry of Rural Development. In Planning Commission he worked in the Project Appraisal and Management Division for over 20 years. This division appraises all public sector investment proposals for final approval by the Government. He also handled Sarv Shiksha Abhiyaan in the Ministry of Human Resources Development from 2012-2013. He was also associated with ‘Make in India’ initiative of the government in the Department of Industrial Policy and Promotion. Dr. Singh retired as Additional Secretary from Goverment of India in January 2018.
Expertise in specific functional areas Power & Finance Sector Accounts and Audit Service– Government of India
Indian Economic Service, 1982 Batch (retired)
Date of first appointment on the Board of the Company
01st February, 2012 15th October, 2015 30th August, 2019
Terms and conditions of appointment or re–appointment along with details of remuneration sought to be paid
Managing Director and CEO
Independent Director Independent Director
Last drawn remuneration, if applicable
Details are mentioned in the Annual Report
Not Applicable Not Applicable
No. of Board meetings attended during the year 2018–19
11 11 NA

11
Other Companies in which he/she is a Director excluding Directorship in Private and Companies under Section 8 of the Companies Act, 2013*
PTC Energy Limited 1. Minda Industries Limited2. JBM Auto Limited3. PTC Energy Limited4. DSP Trustee Private Limited5. Terracis Technologies Limited
(Formerly Known as IL&FS Technologies Limited)
6. Jay Bharat Maruti Limited
Nil
Chairperson/Membership of Committee(s) of Board of Directors viz. Audit Committee and Stakeholders Relationship Committee of other Listed Companies in which he/she is Director*
Nil 1. Minda Industries Limited2. JBM Auto Limited
Nil
Number of Shares held in the Company
Nil Nil Nil
Relationship with other directors, Manager, key managerial personnel of the Company
Not related to any Directors and Key Managerial Personnel of the Company
Not related to any Directors and Key Managerial Personnel of the Company
Not related to any Directors and Key Managerial Personnel of the Company
* Based on disclosures received from the Directors.

12
Dear Shareholders,
On behalf of the Board of Directors, it is our pleasure to present the 13th (thirteenth) Annual Report together with the Audited Financial Statements of PTC India Financial Services Limited (“the Company” or “PFS”) for the financial year ended 31st March, 2019.
1. Financial Performance
The summarized standalone results of your Company are given in the table below.
( in millions)
FY2018–19 FY2017–18Total Income 13,365.12 11,851.56
Profit/(loss) before Finance Charges, Depreciation & Tax (EBITDA) 12,280.38 5,378.33
Finance Charges 9,443.11 6,850.01
Depreciation and Amortization 27.27 32.59
Provision for Income Tax 968.57 (501.92)
Net Profit/(Loss) After Tax 1,841.43 (1,002.35)
Other Comprehensive Income (Net of Tax) (336.12) (1,206.89)
Total Comprehensive Profit /(Loss) for the year 1,505.31 (2,209.24)
The financials for the FY 2018-19 has been prepared as per Ind AS and previous year financials has also been recast. There are two main changes in accounting due to adoption of Ind AS. First, the accounting of fee income/ expense which are required to be recognize over the tenure of the loan instead of upfront and second provision on loans are required to be calculated as per expected credit loss model instead of provision calculated as per RBI prudential norms.
In FY 2018–19 the total income has been increased by 12.77% from Rs. 11,851.56 million in year 2017–18 to Rs. 13,365.12 million. In FY 2018–19 our borrowings cost has been increased, in line with market trend, by 37.85% to Rs. 9,443.11 million as compared to Rs. 6,850.01 million during FY2017–18. The other expenses increased by 46.22% to Rs. 326.84 million during FY2018–19 as compared to Rs. 223.52 million in FY2017–18, the significant increase is due to increase in amount spend on CSR activities which has increased to Rs 91.64 million during the FY 2018–19 from Rs. 8.09 million in FY 2017–18. Other income increased by 244.33% to Rs. 20.97 million during FY2018–19 compared to Rs. 6.09 million in FY2017–18. There is improvement in portfolio quality of the company and accordingly provision for Impairment on Financial Instruments has been decreased to Rs. 605.83 million in FY 2018–19 from Rs. 6,097.15 million in FY 2017–18. Provision for diminution of equity investments is Rs. 320.39 million in FY2018–19.
The year 2018–19 was challenging year due to liquidity issues for NBFCs in general and increase in borrowing cost across the industry due to which the operational performance for the year has been affected with increased cost of borrowing. Inspite the inherent challenges in the industry with detoriation in portfolio quality across the country, our company is been able to perform by maintaining the adequate liquidity as well as continuous improvement of portfolio quality with reduction in NPA / Stress assets.
During FY 2018–19, PFS explored innovate ways of alternate finance and become first NBFC to avail Partial Credit Enhancement (PCE) facility from State Bank of India which would support to raise bonds upto Rs.20,000
PTC India Financial Services LimitedBOARD’S REPORT OF THE BOARD OF DIRECTORS
million. The PCE facility would help the company to have better credit rating and thereby open new doors of having long term finance at lower cost.
During the FY 2018–19, with the focused efforts of the management PFS
Gross NPA has reduced from Rs. 8,383.79 million to Rs.8,046.80 million and net NPA from Rs. 5,192.66 million to Rs. 4,032.23 million as on 31st March, 2019 Gross NPA as a % to gross advances is 6.04% and Net NPA as a % to net advances is 3.12% as compared to 6.54% and 4.16% respectively for FY2017–18. PFS has resolved stress/ NPA loan accounts amounting to Rs. 4,962 million. The company is focusing its stuck money in stress assets to income generating assets and our efforts may result in better profitability in coming quarters. Most of the NPA accounts belong to Thermal and Large Hydro project whereas the company is shifting its focus on other areas including renewable energy as a result of which the company exposure to thermal has been reduced to 14% as on 31st March, 2019 in comparison to 17% as at the beginning of the year.
The profit before tax (PBT) for FY 2018–19 stood at Rs. 2,810.00 million compared to loss of Rs. 1,504.27 million during FY2017–18. The profit after tax (PAT) for FY 2018–19 stood at Rs. 1,841.43 million against a loss of Rs. 1,002.35 million.
In FY 2018–19 inspite of challenging environment, PFS not only addressed the liquidity issues efficiently but also reported growth in its portfolio growth of 4%. The company continued to focus of new areas of sustainable finance with better yields and explored upcoming areas like Electrical Vehicle Charging stations, projects under Namami Gange, HAM road projects etc. and committed to contribute for environment friendly projects. During FY 2018–19 PFS sanctioned new loans of Rs. 51,239 million and made disbursement of Rs.40,852 million to various Infrastructure projects. During FY 2018–19, PFS sanctioned Rs 23,994 million to Solar projects, Rs. 4,504 million to wind projects, Rs. 22,741 million to other projects including road, transmission, distribution and corporate loan.
For ensuring robust quality of portfolio, PFS continues to strengthen credit appraisal process and risk management function, PFS has further strengthened the project monitoring function and implemented early warning signal framework for early identification of stress in assisted projects, and, a special team has been set up to deal with and find resolution of stressed assets.
2. Summary of Operations and State of Company’s Affairs
The debt assistance sanctioned during FY2018–19 stands at Rs. 51,239 million and disbursement at Rs. 40,852 million as compared to Rs 82,500 million and Rs. 51,032 million during 2017–18.
The gross portfolio stood at Rs. 142,370 million as at 31st March 2019 as
compared to R 143,120 million as at the end of FY2017–18. The fund based portfolio stood at ` 133,210 million as at 31st March 2019 as compared to Rs. 128,164 million as at 31st March 2018 and the letter of comfort stood at Rs. 9,156 million as at 31st March 2019 as against Rs. 14,959 million as at 31st March 2018. The equity investments made by the Company aggregated to another Rs. 2,469 million as at the year end. The cumulative gross aggregate debt assistance sanctioned by the Company as at 31st March 2019 aggregated to Rs. 374,512 million and net of cancellations/loan closure, the cumulative debt sanctioned aggregated to Rs. 215,116 million.
The financial assistance sanctioned by PFS would help in capacity addition of about 45,000 MW of power projects, majority of which are renewable / environmental friendly projects. PFS is constantly working with new as well as existing developers and is focused towards diversifying its portfolio to upcoming areas like Electrical Vehicle Charging stations, projects under

13
Namami Gange etc.. As at 31st March 2019, the renewable portfolio comprises the highest proportion in the outstanding loan book at around 59%, thermal projects constitute about 14%. PFS will continue to focus on reduction of its thermal exposure and in FY 2019–20 its exposure is expected to be in single digit. PFS is also having exposure of 2% in hydro sector and 25% in other infra sectors as at March 31, 2019 and more diversification would be seen to upcoming sectors in coming year.
The power sector is witnessing stress particularly in case of thermal projects. Several thermal projects in the country (both operational and under construction) are facing challenges related to fuel price and availability, power tariff, time and cost overruns alongwith equity infusion by promoters specially in case of under construction projects. PFS has also faced challenges in respect of such projects. As at 31st March 2019, the non–performing loans portfolio stood at Rs. 8,047 million, one thermal power project having aggregate loan outstanding of Rs. 3,284 million is under corrective action plan (SDR/OSDR) and projects having aggregate loan outstanding of Rs. 4,092 million faced delays in commencement of commercial operations and have been classified as Standard Restructured Assets. The Company continues to regularly monitor the progress and operations of the assisted projects through its comprehensive project monitoring mechanism. The company is having Rs 110,087 million of projects which are operational and commissioned and consisting 82.64% of its total loan outstanding: projects of Rs. 66,079 million is having more than one year satisfactory conduct post their respective commissioning.
3. Net Owned Funds and Earnings Per Share (EPS)
The Net Owned Funds of the Company aggregated to Rs. 19,319.50 million as at 31st March 2019 and the total capital funds aggregated to Rs. 20,665.51 million as at that date. The percentage of aggregate risk weighted assets on balance sheet and risk adjusted value of off balance sheet items to net owned funds is 21.92% as at 31st March 2019.
EPS of the Company for the year ended 31.03.2019 stands at Rs. 2.87 per share in comparison to Rs. (1.56) per share for the year ended 31.03.2018. In FY 2018–19 there is turnaround in the financial performance of the company and the company reported PAT of Rs 1,841.43 million as against loss of Rs. 1,002.35 million in FY 2017–18. The trend in upward performance is expected to improve further with expected resolution of some stress / NPA assets in coming year, with innovative structure of finance to upcoming areas and also with exploring alternative sources of long term finance at lower cost.
4. Reserves
Out of the profits earned during the financial year 2018–19, the Company has transferred an amount of Rs. 368.29 million to Statutory Reserve in accordance with the requirements of Section 45–IC of the Reserve Bank of India Act, 1934.
5. Dividend
Based on Company’s performance, the Board of Directors are pleased to recommend for your consideration and approval, a dividend at the rate of 8% (which is higher than earlier recommendation of 2% in last year) i.e. Rs. 0.80/– per equity share of Rs. 10/– for the FY 2018–2019. The dividend on equity shares, if approved by the members at ensuing Annual General Meeting, would involve the cash outflow of Rs. 619.45 million including dividend distribution tax amounting to Rs. 105.62 million.
The dividend will be paid to the members whose names appear in the Register of Members as on a record date and in respect of shares held in dematerialized form whose names are furnished by National Securities Depositories Limited and Central Depository (India) Limited as beneficial owners as on record date.
6. Fixed Deposits/Public Deposits
Your Company has not accepted any deposits during the year from public in terms of provisions of Companies Act, 2013. Further, at the end of the year, there were no unclaimed, unpaid or overdue deposits.
7. Capital adequacy ratio
The Capital Adequacy Ratio as on 31st March 2019 stood at 21.92% compared to 21.19% as on 31st March, 2018. No adverse material changes affecting the financial position of the Company have occurred during the financial year.
8. Material changes and commitments, if any, affecting the financial position of the Company
There have been no material changes and commitments affecting the financial position of the Company which have occurred between the end of the financial year of the Company to which the financial statements relates (i.e. 31st March, 2019) and the date of the report. No adverse Material changes affecting the financial position of the Company have occurred during the Financial Year.
9. Particulars of loans, guarantees and investments under Section 186
The particulars of loans, guarantees and investments have been disclosed in the financial statements.
10. Share Capital/ Finance
During the period under review, no change has taken place with reagrd to capital structure of the Company. The paid up share capital of the Company as at 31st March 2019 aggregates to Rs. 6,422.83 million comprising of 642,283,335 equity shares of Rs. 10/– each fully paid up. PTC India Limited holds 64.99% of the paid up share capital of the Company as at 31st March 2019. The equity shares of the Company are listed on the National Stock Exchange of India Limited (NSE) and BSE Limited (BSE).
11. Extract of Annual Return
As provided under section 92(3) of the Companies Act, 2013 and rule 12(1) of the Companies (Management and Administration) Rules, 2014, extract of annual return is given in Annexure – I in the prescribed Form MGT–9, which forms part of this report.
12. Directors and Key Managerial Personnel
In accordance with provisions of the Companies Act, 2013 and Articles of Association of the Company, Shri Naveen Kumar (Whole Time Director) shall retire by rotation at the ensuing Annual General Meeting and being eligible offfers himself for re–appointment.
Details of changes in the composition of Board and appointment/re-appointment during the period under review have been specifically mentioned in the report on the Corporate Governance which is annexed with this report.
13. Dividend Distribution Policy
As per regulation 43A of SEBI (Listing Obligations and Disclosure Requirements) Regulations, 2015, the top 500 listed companies shall formulate a dividend distribution policy. Accordingly, the policy was adopted to set out the parameters and circumstances that will be taken in to account by the Board while determining the distribution of dividend to its shareholder. The policy is enclosed as Annexure—II to the Board Report and is also available on Company’s website, at :
http://www.ptcfinancial.com/upload/pdf/Dividend%20Distribution%20Policy–PFS.pdf
14
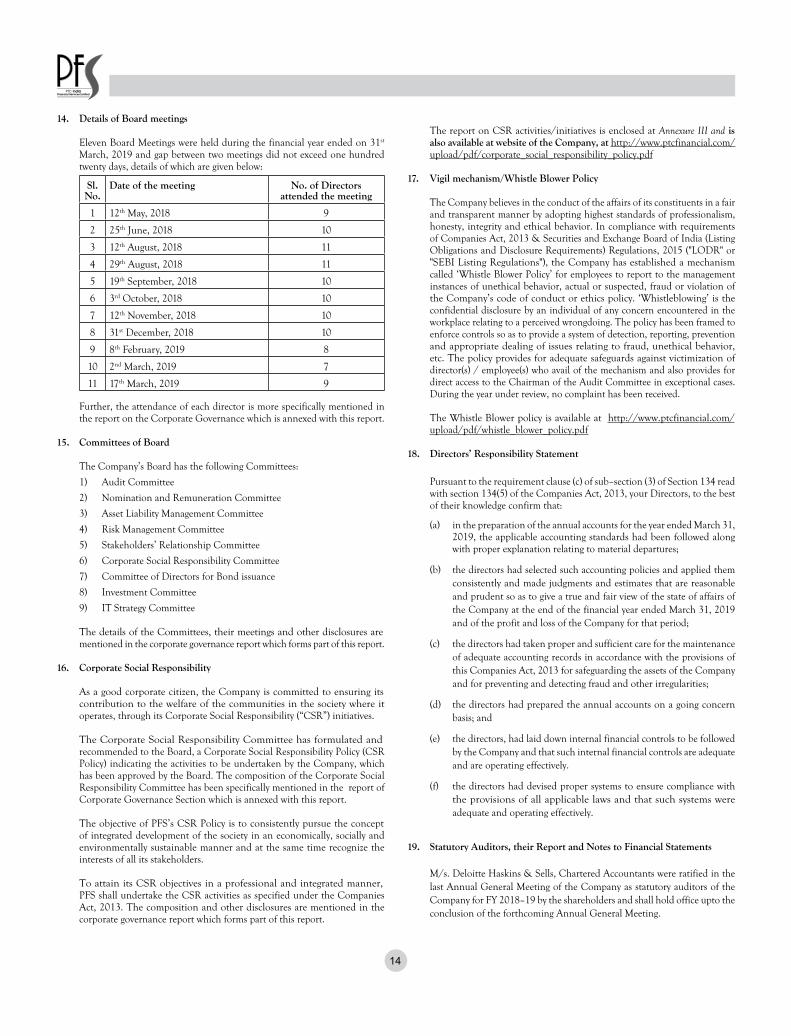
14. Details of Board meetings
Eleven Board Meetings were held during the financial year ended on 31st March, 2019 and gap between two meetings did not exceed one hundred twenty days, details of which are given below:
Sl. No.
Date of the meeting No. of Directors attended the meeting
1 12th May, 2018 9
2 25th June, 2018 10
3 12th August, 2018 11
4 29th August, 2018 11
5 19th September, 2018 10
6 3rd October, 2018 10
7 12th November, 2018 10
8 31st December, 2018 10
9 8th February, 2019 8
10 2nd March, 2019 7
11 17th March, 2019 9 Further, the attendance of each director is more specifically mentioned in
the report on the Corporate Governance which is annexed with this report.
15. Committees of Board
The Company’s Board has the following Committees:
1) Audit Committee
2) Nomination and Remuneration Committee
3) Asset Liability Management Committee
4) Risk Management Committee
5) Stakeholders’ Relationship Committee
6) Corporate Social Responsibility Committee
7) Committee of Directors for Bond issuance
8) Investment Committee
9) IT Strategy Committee
The details of the Committees, their meetings and other disclosures are mentioned in the corporate governance report which forms part of this report.
16. Corporate Social Responsibility As a good corporate citizen, the Company is committed to ensuring its
contribution to the welfare of the communities in the society where it operates, through its Corporate Social Responsibility (“CSR”) initiatives.
The Corporate Social Responsibility Committee has formulated and
recommended to the Board, a Corporate Social Responsibility Policy (CSR Policy) indicating the activities to be undertaken by the Company, which has been approved by the Board. The composition of the Corporate Social Responsibility Committee has been specifically mentioned in the report of Corporate Governance Section which is annexed with this report.
The objective of PFS’s CSR Policy is to consistently pursue the concept of integrated development of the society in an economically, socially and environmentally sustainable manner and at the same time recognize the interests of all its stakeholders.
To attain its CSR objectives in a professional and integrated manner, PFS shall undertake the CSR activities as specified under the Companies Act, 2013. The composition and other disclosures are mentioned in the corporate governance report which forms part of this report.
The report on CSR activities/initiatives is enclosed at Annexure III and is also available at website of the Company, at http://www.ptcfinancial.com/upload/pdf/corporate_social_responsibility_policy.pdf
17. Vigil mechanism/Whistle Blower Policy
The Company believes in the conduct of the affairs of its constituents in a fair and transparent manner by adopting highest standards of professionalism, honesty, integrity and ethical behavior. In compliance with requirements of Companies Act, 2013 & Securities and Exchange Board of India (Listing Obligations and Disclosure Requirements) Regulations, 2015 ("LODR" or "SEBI Listing Regulations"), the Company has established a mechanism called ‘Whistle Blower Policy’ for employees to report to the management instances of unethical behavior, actual or suspected, fraud or violation of the Company’s code of conduct or ethics policy. ‘Whistleblowing’ is the confidential disclosure by an individual of any concern encountered in the workplace relating to a perceived wrongdoing. The policy has been framed to enforce controls so as to provide a system of detection, reporting, prevention and appropriate dealing of issues relating to fraud, unethical behavior, etc. The policy provides for adequate safeguards against victimization of director(s) / employee(s) who avail of the mechanism and also provides for direct access to the Chairman of the Audit Committee in exceptional cases. During the year under review, no complaint has been received.
The Whistle Blower policy is available at http://www.ptcfinancial.com/
upload/pdf/whistle_blower_policy.pdf
18. Directors’ Responsibility Statement
Pursuant to the requirement clause (c) of sub–section (3) of Section 134 read with section 134(5) of the Companies Act, 2013, your Directors, to the best of their knowledge confirm that:
(a) in the preparation of the annual accounts for the year ended March 31, 2019, the applicable accounting standards had been followed along with proper explanation relating to material departures;
(b) the directors had selected such accounting policies and applied them consistently and made judgments and estimates that are reasonable and prudent so as to give a true and fair view of the state of affairs of the Company at the end of the financial year ended March 31, 2019 and of the profit and loss of the Company for that period;
(c) the directors had taken proper and sufficient care for the maintenance of adequate accounting records in accordance with the provisions of this Companies Act, 2013 for safeguarding the assets of the Company and for preventing and detecting fraud and other irregularities;
(d) the directors had prepared the annual accounts on a going concern basis; and
(e) the directors, had laid down internal financial controls to be followed by the Company and that such internal financial controls are adequate and are operating effectively.
(f) the directors had devised proper systems to ensure compliance with the provisions of all applicable laws and that such systems were adequate and operating effectively.
19. Statutory Auditors, their Report and Notes to Financial Statements
M/s. Deloitte Haskins & Sells, Chartered Accountants were ratified in the last Annual General Meeting of the Company as statutory auditors of the Company for FY 2018–19 by the shareholders and shall hold office upto the conclusion of the forthcoming Annual General Meeting.

15
The auditors have audited the Accounts of the Company for the year ended 31st March 2019. Audited Financial Statements (both standalone and consolidated) comprising Balance Sheet as at 31st March, 2019, the Statement of Profit and Loss (including Other Comprehensive Income), the Cash Flow Statement and the Statement of Changes in Equity for the year ended and a summary of significant accounting policies & other explanatory information together with Auditor’s Report thereon are annexed to this report. The Auditors’ Report does not contain any qualification, reservation or adverse mark.
Further, the auditors of the Company while performing their duties as such has not found any fraud which was required to be reported to the Board of Director or Central Government.
M/s Deloitte Haskins & Sells was appointed as Statutory Auditors for the FY 2009–10 for the first time and since then they were re–appointed as statutory auditor till current FY i.e. 2018–19. As per section 139(2) of the Companies, Act 2013, company has to rotate their statutory auditors once their auditor served the office as an auditors for a period of 10 years. M/s. Deloitte Haskins & Sells has been completed 10 years as auditor, therefore, the Board of Directors has recommended the appointment of M/s. MSKA & Associates Chartered Accountants as Statutory Auditors of the Company for a period of 5 (five) years w.e.f. FY 2019–20 to shareholders in the ensuing annual general meeting.
20. Secretarial audit
Pursuant to provisions of Section 204 of Companies Act, 2013 and rules mentioned thereto, the Board of Directors of the Company appointed M/s. Agarwal S. and Associates, Practicing Company Secretary, to conduct the Secretarial Audit of records and documents of the Company. The Secretarial Audit Report is enclosed as Annexure IV. The observations set out in Secretarial Audit report and its reply of the same is as under:–
Observation by Secretarial Auditor Reply by the Company
During the period under review, the Company has complied with the provisions of the Acts, Rules, Regulations, Guidelines, Standards, etc. mentioned above subject to the following observations.
1. The composition of the Board of the Company was not in compliance as per proviso to Regulation 17 (1) (b) of Securities and Exchange Board of India (Listing Obligations and Disclosure Requirements) Regulations, 2015 for the period from 01st April 2018 to 18th September 2018.
We further report that the Board of Directors of the Company shall be duly constituted in terms of Regulation 17 (1) (b) of the Securities and Exchange Board of India (Listing Obligations & Disclosure Requirements) Regulations, 2015 i.e. atleast half of the Board of Directors should comprise of Independent Directors as on 31st March 2019. The Company was also compliant in terms of provisions under Section 149 (4) of the Companies Act, 2013 as out of 9 Board of Directors there were 4 Independent Directors on the Board of Company. The changes in the composition of the Board of Directors that took place during the period under review were carried out in compliance with the provisions of the Act.
The same was complied on 18th September, 2018 on superannuation of Dr. Ashok Haldia (then MD&CEO). It is also to be mentioned that no penalty was imposed by SEBI/ Stock Exchanges in this regard.
21. Related party transactions
During the financial year 2018–2019, the Company has not entered into any other related party transactions which attracts the provision of Section 188 of the Companies Act, 2013 and SEBI Listing Regulations. The details of transactions entered into with the related parties is given in note no. 40 of the audited accounts of the Company. During the year, the Company had not entered into any contract/ arrangement/ transaction with related parties which could be considered material in accordance with the policy of the Company on materiality of related party transactions. The Policy on Materiality of Related Party Transactions and Dealing with Related Party Transactions as approved by the Board is available on the Company’s website at the link:
http://ptcfinancial.com/statutory_policies/20150629_Policy_materiality_of_Related_Party_Transactions.pdf
Further, all the transactions are made in the ordinary course of business and on arm’s length basis.
Information on transactions with related parties pursuant to section 134(3)(h) of the Act read with rule 8(2) of the Companies (Accounts) Rules, 2014 are given in Annexure – V in Form AOC–2 and the same forms part of this report.
22. Human Resources
Your Company treats its “human resources” as one of its most important assets. Your Company continuously invests in attraction, retention and development of talent on an ongoing basis. A holistic assessment of manpower needs led to fresh recruitment at various level. A number of individual employee specific, group of employee specific and organizational wise programs that provide focused people attention are currently underway. Your Company’s thrust is on the development of talent internally through job enlargement, rotation and development.
Your Company thrust on development of all levels of the employee has helped your organization achieve employee’s loyalty and attachment to the Company. There is a huge opportunity for all of us to learn, practice and perform. Though the expectation from the employees are realistic, each employee get to work on challenging assignments, and a chance to learn, innovate and perform. Handholding, guidance & mentoring has a special place for a young team and organization. Sharing of knowledge and learning from the experience of seniors has helped us grow steadily.
Your Company focus on human resource development is at all levels of organization including non–executive and support staff. The human resource development is critical to implementation of organizational strategy and to make organization humble and responsive to the customers need. Employees are encouraged to participate and be part of the organizational growth and development strategy. Lateral entry at different levels keeps the organization vibrant.
23. Industrial Relations
Your Company has always maintained healthy, cordial and harmonious industrial relations at all levels. Despite of competition, the enthusiastic efforts of the employees have enabled the Company to grow at a steady pace.
24. Risk Management Policy
PFS has put in place a comprehensive policy framework for management of risks, which includes the followings:–
• Risk Management Policy: – The Risk Management Framework of PFS encompasses credit risk, market risk, as well as operational risk management. The Risk Management Policy, evolved under the guidance of Risk Management Committee and duly approved by Board of Directors, is refined periodically based on emerging market trends and own experience. The Risk Management Committee is headed by Independent Director.

16
• Asset Liability Management Policy :– The objectives of Asset Liability Management Policy are to align market risk management with overall strategic objectives, articulate current interest rate view and determine pricing, mix and maturity profile of assets and liabilities. The asset liability management policy involves preparation and analysis of liquidity gap reports and ensuring preventive and corrective measures. It also addresses the interest rate risk by providing for duration gap analysis and control by providing limits to the gaps.
• Interest Rate Policy: – Interest rate policy provides for risk based pricing of the debt financing by the Company. It provides the basis of pricing the debt and the manner in which it can be structured to manage credit risk, interest rate risk and liquidity risk, while remaining competitive.
• Operational Risk Management Policy: – The operational risk management policy recognizes the need to understand the operational risks in general and those in specific activities of the Company. Operational risk management is not understood as a process of eliminating such risk but as a systematic approach to manage such risk. It seeks to standardize the process of identifying new risks and designing appropriate controls for these risks, minimize losses and customer dissatisfaction due to possible failure in processes.
25. Employees’ Stock Option Scheme
The Shareholders’ approval was obtained at the Annual General Meeting held on 27th October 2008 for introduction of Employee Stock Option Plan at PTC India Financial Services Limited. All the ESOPs made under the Employees’ Stock Option Scheme–2008, have been surrendered and as on date no claim is outstanding.
26. Declaration given by independent directors
Mrs. Pravin Tripathi, Shri Kamlesh Shivji Vikamsey, Shri Santosh Balachandran Nayar and Shri Harbans Lal Bajaj were the Independent Directors on the Board of your Company as on 31st March, 2019. In the opinion of the Board and based upon the declaration furnished by the Independent Directors, fulfills the conditions specified in section 149 of the Companies Act, 2013 and the rules made thereunder and Regulation 16(1)(b) of SEBI Listing Regulations. In terms of Regulation 25(8 & 9) of SEBI Listing Regulations, they have confirmed that they are not aware of any circumstance or situation which exists or may be reasonably anticipated that could impair or impact their ability to discharge their duties. Based on the declarations received from the Independent Directors, the Board of Directors has confirmed that they meet the criteria of independence as mentioned under Regulation 16(1)(b) of the SEBI Listing Regulations and that they are independent of the management.
27. Company’s policy on appointment and remuneration of Senior Management and KMPs
As per the requirements of the Companies Act 2013, the Board of Directors
of your Company has constituted a ‘Nomination and Remuneration Committee’. The Committee’s role is to be supported by a policy "Nomination and Remuneration & Board Diversity"
The Policy of the Company on Nomination and Remuneration & Board Diversity is attached herewith and marked as Annexure – VI.
28. Formal Annual Evaluation
The Board of Directors has carried out an annual evaluation of its own performance, Board Committees and individual Directors pursuant to the provisions of the Companies Act, 2013 and the corporate governance requirements as prescribed by SEBI Listing Regulations.
The Company pays performance linked remuneration to its WTDs/MD.
It is ensured that the remuneration is determined in a way that there exists a fine balance between fixed and incentive pay. On the basis of Policy for Performance Evaluation of Independent Directors, a process of evaluation is being followed by the Board for its own performance and that of its Committees and individual Directors.
The performance of the Board was evaluated by the Board after seeking inputs from all the Directors on the basis of the criteria such as the Board composition and structure, effectiveness of Board processes, information and functioning, etc. The performance of the Committees was evaluated by the Board after seeking inputs from the Committee members on the basis of the criteria such as the composition of Committees, effectiveness of Committee meetings, etc. The Board are viewed the performance of the individual Directors on the basis of the criteria such as the contribution of the individual Director to the Board and committee meetings like preparedness on the issues to be discussed, meaningful and constructive contribution and inputs in meetings, etc. In addition, the Chairman was also evaluated on the key aspects of his role.
In a separate meeting of Independent Directors, performance of Non–Independent Directors, performance of the Board as a whole and performance of the Chairman was evaluated, taking into account the views of Executive Directors and Non–Executive Directors.
29. Disclosure under the Sexual Harassment of Women at the work place (Prevention, Prohibition and Redressal) Act, 2013
A Committee has been constituted to look into grievance/complaints of sexual harassment lodged by employees as per Sexual Harassment of Women at Workplace (Prevention, Prohibition and Redressal) Act, 2013. Further, no complaints were received during the year and no complaint is pending on 31st March, 2019.
30. Internal financial controls and Internal Auditor The internal financial controls with reference to the Financial Statements
are commensurate with the size and nature of business of the Company.
The Company has an Internal Control System, commensurate with the size, scale and complexity of its operations. The scope and authority of the Internal Audit function is defined by the Audit Committee. The Company has appointed M/s Grant Thornton India LLP as Internal Auditors of the Company. To maintain its objectivity and independence, the Internal Auditor reports to the Audit Committee. The Audit Committee has the responsibility for establishing the audit objectives and determines the nature, timing and extent of audit procedures as well as the locations where the work needs to be carried out.
The Internal Auditor monitors and evaluates the efficacy & adequacy of internal financial controls & internal control system in the Company that has been put in place to mitigate the risks faced by the organization and thereby achieves its business objective. Broadly the objectives of the project assigned are:–• Review the adequacy and effectiveness of the transaction controls;• Review the operation of the Control Supervisory Mechanisms;• Recommend improvements in processes management;• Review the compliance with operating systems, accounting procedures
and policies
The internal control and compliance is an on–going process. Based on the findings and report of internal auditor, process owners undertake corrective action that may be required in their respective areas for further strengthening the controls and control environment. Significant audit observations and corrective actions thereon are presented to the Audit Committee. The internal auditors also independently carry out the design evaluation and testing of controls related to requirements of Internal Financial Controls. The evaluation of design effectiveness and testing of controls for various business activities, processes and sub processes was carried out and found satisfactory.

17
31. Cost Auditors
Cost Audit is not applicable to the Company.
32. Details of Holding, Subsidiaries, Associates and Joint Ventures
Your Company continues to be the subsidiary of PTC India Limited (PTC). Further, the Company has two associate companies namely M/s. R.S. India Wind Energy Private Limited and M/s. Varam Bio Energy Private Limited. The statement of performance and financial position of each of the associate companies is given in Form AOC–1 as Annexure – VII.
The Policy for determining material subsidiaries as approved may be accessed on the Company’s website following link:
link:http://www.ptcfinancial.com/upload/pdf/20150629_Policy_on_determining_Material_Subsidiaries.pdf
33. Corporate Governance Report
The Company is committed to maintain the highest standards of corporate governance and adhere to the corporate governance requirements set out by Securities and Exchange Board of India (‘SEBI’). A separate report on Corporate Governance along with Certificate from M/s. Deloitte Haskins and Sell, Statutory Auditors on compliance with the conditions of Corporate Governance as stipulated under SEBI Listing Regulations is provided as part of this Annual Report.
34. Management Discussion and Analysis
The Management Discussion and Analysis comprising an overview of the financial results, operations / performance and the future prospects of the Company form part of this Annual Report.
35. Business Responsibility Report
Pursuant to the Regulation 34(2)(f) of the SEBI Listing Regulations, the Business Responsibility Report describing the initiatives taken by the Company from an environmental, social and governance perspective in the format as specified by the SEBI is given as Annexure– VIII.
36. Particulars of Employees
A. The information pertaining to the remuneration and other details as required under Section 197 of Companies Act, 2013 read with rule 5(1) of the Companies (Appointment and Remuneration of Managerial Personnel) Rules, 2014 are given below:
a. The ratio of the remuneration of each director to the median remuneration of the employees of the company for the financial year 2018–19; (Rs in millions)
Name of Director
Director’s Remuneration
Median Remuneration
of employees
Ratio
Dr. Ashok Haldia*
9.89 19.26 5.13 times
Dr Pawan Singh
8.50 19.26 4.41 times
Naveen Kumar#
6.55 19.26 3.40 times
* Has superannuated on 18.09.2018
# Joined PFS on 25.09.2017 during the FY 2017–18,
b. The percentage increase in remuneration of each director, Chief Financial Officer, Chief Executive Officer, Company Secretary or Manager, if any, in the financial year;
Name % age Increase
Dr. Ashok Haldia* 5.66%
Dr Pawan Singh 12.12%
Naveen Kumar# 113.63%
Sanjay Rustagi 10.76%
Vishal Goyal 9.17%
* Has superannuated on 18.09.2018
# Joined PFS on 25.09.2017 during the FY 2017–18,
c. The median remuneration of the employees has increased to Rs.19.26 lakhs during FY2018–19 from Rs.16.27 lakhs during FY 2017–18.
d. 47 permanent employees are on the rolls of company as at 31st March 2019;
e. The average remuneration increased to Rs 25.41 lakhs in FY 2018–19 from Rs. 20.40 lakhs in FY 2017–18.
f. The average remuneration of Key Managerial Personnel increased to Rs.67.99 lakhs in FY2018–19 from Rs. 66.68 lakhs in FY2017–18. This is due to mid–year joining of Shri Naveen Kumar on 25th September, 2017.
g. As per Rule 5(2) of the Companies (Appointment and Remuneration of Managerial Personnel) Rules, 2014, statement of particulars of employees is annexed as Annexure– IX.
B. Particulars of Top 10 employees in terms of remuneration
Sl. No.
Name & Designation
Nature of Employement
Remuneration Received (amount in Rs)
Qualification and Experience
Date of Commencement of Employment in the Company
Age Last Employment % of Quantity of shares
held in the Company
If relative of any director or manager, name of such director
or manager
1 Dr Ashok Haldia* Fixed Term 98,86,460 M.Com. Ph D, CA, CS, ICWA/ 39 years
13.08.2008 62 yrs 7 months
The Secretary in The Institute of Chartered Accountants of India
Nil NA
2 Dr Pawan Singh Fixed Term 85,01,536 MBA, Ph D/ 36 years
01.02.2012 57 yrs 6 months
Dir–F in PTC India Financial Services Limited
Nil NA
3 Vijay Singh Bisht Regular 67,91,278 BE & MBA/ 34 years
01.08.2008 56 years 1 month
DGM in PFC Nil NA
4 Naveen Kumar Fixed Term 65,46,212 BSc (Engg); MBA; LLB/ 38 years
25.09.2017 59 years 9
months
Executive Director (Projects) in Power Finance Corporation Limited
Nil NA

18
5 Sitesh Kumar Sinha
Regular 62,10,131 B.E & PGDBM/ 21 years
22.03.2011 43 years 3
months
“Design Engineer in Lahmeyer International (India) Pvt Ltd
Nil NA
6 Sanjay Rustagi Regular 45,52,490 B.Com (Hons.), CA & CWA/20 years 7 months
24.06.2016 44 yrs 6 months
AVP in GE Capital Services India
Nil NA
7 Vishal Goyal Regular 45,08,878 CS, LLB & MBA/ 15 years
01.08.2008 38 yrs 8 months
Co Secy cum Fin Manager in International Print–O–Pac Ltd
Nil NA
8 Devesh Singh Regular 42,77,516 B.Com, Dip in Business Finance & MBA/ 14 years
03.10.2011 40 years 2 months
Manager in PTC India Ltd. Nil NA
9 Shray Shikhar Regular 37,12,297 BE & MBA/ 14 years
15.10.2015 38 years 11 months
Senior Associate, Sembcorp Green Infra Ltd
Nil NA
10 Rohit Gupta Regular 35,24,436 B.Com & MBA/ 12 years
01.04.2010 34 years 4 months
Junior Manager– PTC India Ltd
Nil NA
* Superannuated on 18.09.2018
C. No employees who was in receipt of remuneration of not less than one crore and two lakh rupees if employed throughout the year or eight lakh and fifty thousand per month in case employed for part of the year.
D. It is affirmed that:–
E. I. The remuneration is as per the remuneration policy of the
Company; andII. There was no employee in the Company who was in receipt
of the remuneration more than that of its managing director/ whole time director and holds by himself or though his/ her relatives not less than two percent of equity shares.
37. Details of conservation of energy, technology absorption
Since PFS is engaged in business of investment and lending activities, particulars relating to conservation of energy and technology absorption are not applicable to it.
38. Foreign Exchange earnings & outgo
The Company has incurred expenditure of Rs. 277.09 million (previous year Rs. 267.18 million) in foreign exchange during the financial year ended 31st March 2019.
39. Significant and material orders
There were no significant or material orders passed by Regulators or Courts or Tribunals which impacts the going concern status and Company’s future operations.
40. Transfer of Amounts to Investor Education and Protection Fund (IEPF)
Pursuant to the provisions of the Investor Education and Protection Fund (Accounting, Audit, Transfer and Refund) Rules, 2016, the Company has already filed the necessary form and uploaded the details of unpaid and unclaimed amounts lying with the Company, as on the date of last AGM (i.e. 20th September, 2018), with the Ministry of Corporate Affairs.
41. General
Your Directors state that no disclosure or reporting in respect of the following items as there were no transactions on these items during the year under review:
• Issue of equity shares with differential rights as to dividend, voting or otherwise;
• Issue of shares (including sweat equity shares) to employees of the Company under any scheme; and
• Neither Managing Director nor the Whole time Directors of the Company receive any remuneration or commission from any of other Company.
• No change in the nature of the business of the Company happened during the financial year under review.
42. Compliance with Applicable Secretarial Standards
During the period under review, the Company has complied with the provisions of the SS–1(Secretarial Standard on meeting of the Board of Directors) & SS–2 (Secretarial Standard on General Meeting) issued by the Institute of Company Secretaries of India and approved by the Central Government under Section 118 of the Companies Act, 2013.
43. Acknowledgement
The Board of Directors acknowledge with deep appreciation the cooperation received from its Directors, Ministry of Power (MoP), Ministry of Finance (MoF), Reserve Bank of India (RBI), Securities and Exchange Board of India (SEBI), National Stock Exchange of India Limited (NSE), BSE Limited (BSE), PTC India Limited (PTC) and other stakeholders, International Finance Corporation (IFC), DEG, FMO and OeEB, various Banks/FIs, Consortium partners and Officials of the Company.
The Board also acknowledge with deep appreciation the cooperation received from its Directors who retire as Director during the year.
The Board also conveys its gratitude to the shareholders, credit rating agencies for the continued trust and confidence reposed by them in the Company. Your Directors would also like to convey their gratitude to the clients and customers for their unwavering trust and support.
The Company is also thankful to the Statutory Auditor, Internal Auditor and Secretarial Auditor for their constructive suggestions and co–operation.
We would also like to place on record our appreciation for the untiring efforts and contributions made by the employees to ensure all round performance of your Company.
For and on behalf of the Board PTC India Financial Services Limited
Sd/–Deepak Amitabh
Date: 1st August, 2019 ChairmanPlace: New Delhi DIN: 01061535
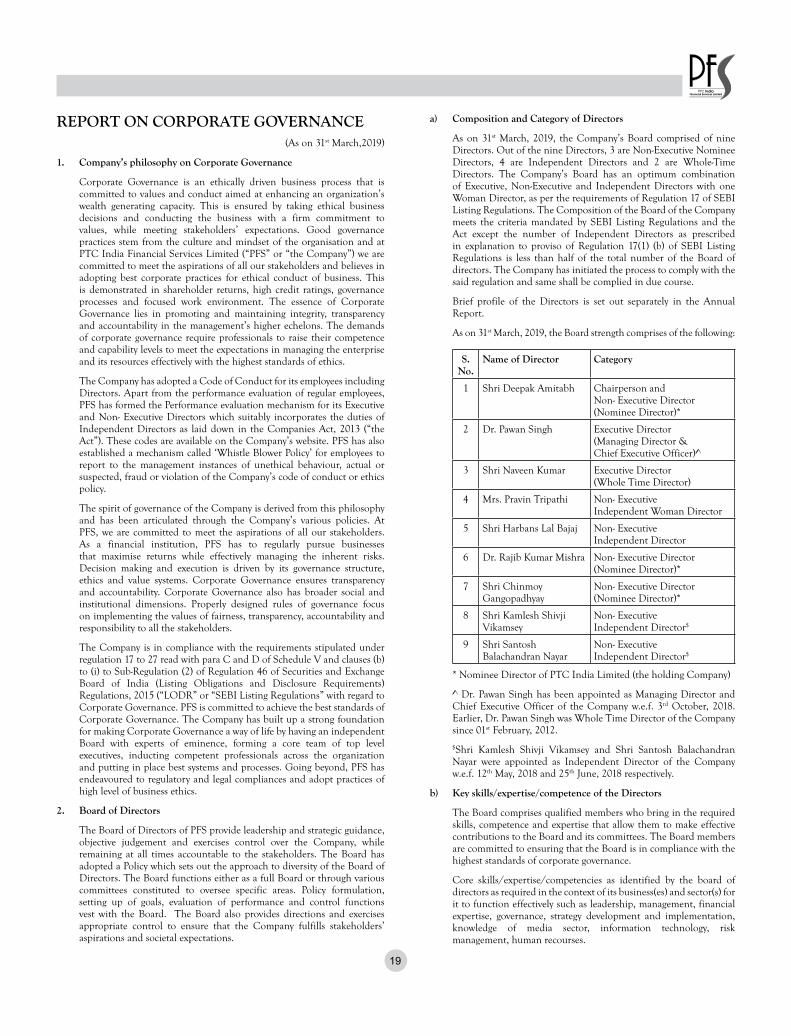
19
REPORT ON CORPORATE GOVERNANCE(As on 31st March,2019)
1. Company’s philosophy on Corporate Governance
Corporate Governance is an ethically driven business process that is committed to values and conduct aimed at enhancing an organization’s wealth generating capacity. This is ensured by taking ethical business decisions and conducting the business with a firm commitment to values, while meeting stakeholders’ expectations. Good governance practices stem from the culture and mindset of the organisation and at PTC India Financial Services Limited (“PFS” or “the Company”) we are committed to meet the aspirations of all our stakeholders and believes in adopting best corporate practices for ethical conduct of business. This is demonstrated in shareholder returns, high credit ratings, governance processes and focused work environment. The essence of Corporate Governance lies in promoting and maintaining integrity, transparency and accountability in the management’s higher echelons. The demands of corporate governance require professionals to raise their competence and capability levels to meet the expectations in managing the enterprise and its resources effectively with the highest standards of ethics.
The Company has adopted a Code of Conduct for its employees including Directors. Apart from the performance evaluation of regular employees, PFS has formed the Performance evaluation mechanism for its Executive and Non- Executive Directors which suitably incorporates the duties of Independent Directors as laid down in the Companies Act, 2013 (“the Act”). These codes are available on the Company’s website. PFS has also established a mechanism called ‘Whistle Blower Policy’ for employees to report to the management instances of unethical behaviour, actual or suspected, fraud or violation of the Company’s code of conduct or ethics policy.
The spirit of governance of the Company is derived from this philosophy and has been articulated through the Company’s various policies. At PFS, we are committed to meet the aspirations of all our stakeholders. As a financial institution, PFS has to regularly pursue businesses that maximise returns while effectively managing the inherent risks. Decision making and execution is driven by its governance structure, ethics and value systems. Corporate Governance ensures transparency and accountability. Corporate Governance also has broader social and institutional dimensions. Properly designed rules of governance focus on implementing the values of fairness, transparency, accountability and responsibility to all the stakeholders.
The Company is in compliance with the requirements stipulated under regulation 17 to 27 read with para C and D of Schedule V and clauses (b) to (i) to Sub-Regulation (2) of Regulation 46 of Securities and Exchange Board of India (Listing Obligations and Disclosure Requirements) Regulations, 2015 (“LODR” or “SEBI Listing Regulations” with regard to Corporate Governance. PFS is committed to achieve the best standards of Corporate Governance. The Company has built up a strong foundation for making Corporate Governance a way of life by having an independent Board with experts of eminence, forming a core team of top level executives, inducting competent professionals across the organization and putting in place best systems and processes. Going beyond, PFS has endeavoured to regulatory and legal compliances and adopt practices of high level of business ethics.
2. Board of Directors
The Board of Directors of PFS provide leadership and strategic guidance, objective judgement and exercises control over the Company, while remaining at all times accountable to the stakeholders. The Board has adopted a Policy which sets out the approach to diversity of the Board of Directors. The Board functions either as a full Board or through various committees constituted to oversee specific areas. Policy formulation, setting up of goals, evaluation of performance and control functions vest with the Board. The Board also provides directions and exercises appropriate control to ensure that the Company fulfills stakeholders’ aspirations and societal expectations.
a) Composition and Category of Directors
As on 31st March, 2019, the Company’s Board comprised of nine Directors. Out of the nine Directors, 3 are Non-Executive Nominee Directors, 4 are Independent Directors and 2 are Whole-Time Directors. The Company’s Board has an optimum combination of Executive, Non-Executive and Independent Directors with one Woman Director, as per the requirements of Regulation 17 of SEBI Listing Regulations. The Composition of the Board of the Company meets the criteria mandated by SEBI Listing Regulations and the Act except the number of Independent Directors as prescribed in explanation to proviso of Regulation 17(1) (b) of SEBI Listing Regulations is less than half of the total number of the Board of directors. The Company has initiated the process to comply with the said regulation and same shall be complied in due course.
Brief profile of the Directors is set out separately in the Annual Report.
As on 31st March, 2019, the Board strength comprises of the following:
S. No.
Name of Director Category
1 Shri Deepak Amitabh Chairperson and Non- Executive Director (Nominee Director)*
2 Dr. Pawan Singh Executive Director (Managing Director & Chief Executive Officer)^
3 Shri Naveen Kumar Executive Director (Whole Time Director)
4 Mrs. Pravin Tripathi Non- Executive Independent Woman Director
5 Shri Harbans Lal Bajaj Non- Executive Independent Director
6 Dr. Rajib Kumar Mishra Non- Executive Director (Nominee Director)*
7 Shri Chinmoy Gangopadhyay
Non- Executive Director (Nominee Director)*
8 Shri Kamlesh Shivji Vikamsey
Non- Executive Independent Director$
9 Shri Santosh Balachandran Nayar
Non- Executive Independent Director$
* Nominee Director of PTC India Limited (the holding Company)
^ Dr. Pawan Singh has been appointed as Managing Director and Chief Executive Officer of the Company w.e.f. 3rd October, 2018. Earlier, Dr. Pawan Singh was Whole Time Director of the Company since 01st February, 2012.
$Shri Kamlesh Shivji Vikamsey and Shri Santosh Balachandran Nayar were appointed as Independent Director of the Company w.e.f. 12th May, 2018 and 25th June, 2018 respectively.
b) Key skills/expertise/competence of the Directors
The Board comprises qualified members who bring in the required skills, competence and expertise that allow them to make effective contributions to the Board and its committees. The Board members are committed to ensuring that the Board is in compliance with the highest standards of corporate governance.
Core skills/expertise/competencies as identified by the board of directors as required in the context of its business(es) and sector(s) for it to function effectively such as leadership, management, financial expertise, governance, strategy development and implementation, knowledge of media sector, information technology, risk management, human recourses.

20
c) Practicing Company Secretary Certificate as to none of the Directors are being debarred / disqualified
Shri Ashish Kapoor of M/s. Ashish Kapoor & Associates, Practicing Company Secretary, has issued a certificate as required under SEBI Listing Regulations, confirming that none of the Directors on the Board of the Company has been debarred or disqualified from being appointed or continuing as Director of Companies by Securities and Exchange Board of India/ Ministry of Corporate Affairs or any such statutory authority. The certificate is enclosed to the Annual Report.
d) Appointment of Directors
Directors are appointed or re-appointed with the approval of the shareholders and shall remain in office in accordance with the provisions of the law and terms and conditions of appointment as approved by the Board of Directors or shareholders, as the case may be. The Company has issued letter of appointment to all the Independent Directors and the terms and conditions of their appointment have been disclosed on the Company’s website www.ptcfinancial.com.
e) Reasons for the resignation of an Independent Director (ID)
During the period under review, Shri Harun Rasid Khan had resigned as Independent Director of the Company w.e.f. 30th January, 2019 due to his pre-occupations and likely future engagements. There is no other reason other than the aforesaid reason provided in his resignation.
f) Board Meetings
The Board meets at least once in every quarter to discuss and decide on, inter-alia, business strategies/policies and review the financial performance of the Company.
There were eleven (11) Meetings of the Board of Directors held during the financial year ended 31st March, 2019 i.e. on 12th May, 2018, 25th June, 2018, 12th August, 2018, 29th August, 2018, 19th September, 2018, 3rd October, 2018, 12th November, 2018, 31st December, 2018, 8th February, 2019, 2nd March, 2019 and 17th March, 2019. The maximum interval between any two meetings was within the maximum allowed gap of 120 days.
g) Attendance of Directors and Directors’ Directorships/Committee memberships
Relevant details of the Board of Directors and their Directorship(s)/ Committee Membership(s)/Chairmanship(s), as on March 31, 2019 and attendance of Directors at Board Meetings and at Annual General Meeting held during FY 18-19 are provided below:
S. No.
Name of the Director Designation No. of meetings
held
No. of meetings attended
Name of other listed entities in which Director holds Directorships in other Companies# and category of Directorship
Attendance at the last Annual General Meeting
Chairman/ Membership (Audit
and Stakeholder Relationship Committee)
No. of Chair-
manships#
No. of Member
ships#
1 Shri Deepak Amitabh Chairperson, Non- Executive and Nominee Director
11 11 PTC India Ltd. Yes - -
2 Dr. Pawan Singh Managing Director & CEO
11 11 - Yes - 1
3 Shri Naveen Kumar Director (Operations) 11 11 - Yes - -
4 Mrs. Pravin Tripathi Independent Director 11 11 Minda Industries Ltd JBM Auto Ltd
Yes 1 5
5 Shri Harbans Lal Bajaj Independent Director 11 11 - - - -
6 Dr. Rajib Kumar Mishra Non- Executive Nominee Director
11 11 PTC India Limited Yes - -
7 Shri Chinmoy Gangopadhyay
Non- Executive Nominee Director
11 9 PTC India Limited Power Finance Corporation Limited
- - 3
8 Shri Harun Rasid Khan* Independent Director 8 8 Bandhan Bank Ltd - - -
9 Shri Kamlesh Shivji Vikamsey^
Independent Director 10 10 Navneet Education Ltd
Tribhovandas Bhimji Zaveri Ltd
GIC Housing Finance Ltd
Man Infra construction Ltd
Apcotex Industries Ltd
- 5 3

21
S. No.
Name of the Director Designation No. of meetings
held
No. of meetings attended
Name of other listed entities in which Director holds Directorships in other Companies# and category of Directorship
Attendance at the last Annual General Meeting
Chairman/ Membership (Audit
and Stakeholder Relationship Committee)
No. of Chair-
manships#
No. of Member
ships#
10 Shri Santosh Balachandran Nayar&
Independent Director 9 8 - - - -
11 Dr. Ashok Haldia$ MD & CEO 4 4 - - - -
# Excluding Directorship, Membership and Chairmanship in PFS.
*ceased w.ef. 30th Jan., 2019;
^ appointed w.e.f 12th May, 2018
& appointed w.e.f. 25th June, 2018
$ ceased w.e.f. 18th September, 2018
Notes:
None of the Directors are members in more than 10 (ten) committees excluding private limited companies, foreign companies and companies under Section 8 of the Companies Act, 2013 or act as Chairperson of more than 5 (five) committees across all listed entities in which he/she is a Director. For the purpose of determination of limit, chairpersonship and membership of the Audit Committee and the Stakeholders’ Relationship Committee alone has been considered and companies including private limited companies, foreign companies and companies under Section 8 of the Companies Act, 2013 have not been considered.
h) None of the Directors of the Company are in any way related to each other.
i) Detail of shareholding of Non- Executive Directors and their relatives in the Company as on 31st March, 2019 are as under:
S. No. Name of the Director No. of Shares
1 Shri Deepak Amitabh 3,500
2 Shri Chinmoy Gangopadhyay 3,500
As on March 31, 2019 except Shri Deepak Amitabh and Shri Chinmoy Gangopadhyay none of the Non – Executive Directors holds any shares/ convertible instruments of the Company.
j) Independent Directors
Mrs. Pravin Tripathi, Shri Kamlesh Shivji Vikamsey, Shri Santosh Balachandran Nayar and Shri Harbans Lal Bajaj were the Independent Directors on the Board of your Company as on 31st March, 2019. In the opinion of the Board and based upon the declaration furnished by the Independent Directors, fulfills the conditions specified in section 149 of the Companies Act, 2013 and the rules made thereunder and Regulation 16(1)(b) of SEBI Listing Regulations. In terms of Regulation 25(8 & 9) of SEBI Listing Regulations, they have confirmed that they are not aware of any circumstance or situation which exists or may be reasonably anticipated that could impair or impact their ability to discharge their duties. Based on the declarations received from the Independent Directors, the Board of Directors has confirmed that they meet the criteria of independence as mentioned under Regulation 16(1)(b) of the SEBI Listing Regulations and that they are independent of the management.
k) Familiarisation programme for independent directors
The Company has familiarisation programme for Independent Directors. Web link to the program is given below:
h t tp : //www.pt c f inanc i a l . com/up load/pd f/2015062_FAMILIARISATION_PROGRAMME_MODULE.pdf.
All independent directors inducted into the Board attended an orientation program organised by the Company from time to time. Further, at the time of the appointment of an Independent Director, the Company issues a formal letter of appointment outlining his / her role, function, duties and responsibilities. The terms and conditions of appointment of Independent Directors is available on the Company’s website www.ptcfinancial.com.
l) Meetings of Independent Directors
As stipulated by the Code of Independent Directors under the Companies Act, 2013 and the SEBI Listing Regulations, two separate meetings of the Independent Directors of the Company were held on 12th August, 2018 and 17th March, 2019 respectively during the Financial Year 2018 - 19 without the attendance of non-independent directors and members of management to:
i. review the performance of non-independent directors and the Board as a whole;
ii. review the performance of the Chairperson of the Company, taking into account the views of executive directors and non-executive directors;
iii. assess the quality, quantity and timeliness of flow of information between the Company management and the Board that is necessary for the Board to effectively and reasonably perform their duties.
m) Availability of information to Board Members
The required information, including information as enumerated in regulation 17(7) read with Part A of Schedule II of the SEBI Listing Regulations is made available to the Board of Directors, for discussion and consideration at the Board Meetings. Such information is submitted either as part of the agenda papers in advance of the respective Meetings or by way of presentations and discussions during the Meetings.
n) Board Evaluation
The Board of Directors has carried out an annual evaluation of its own performance, Board Committees and individual Directors pursuant to the provisions of the Companies Act, 2013 and the corporate governance requirements as prescribed by SEBI Listing Regulations.
The Company pays performance linked remuneration to its

22
Whole Time Directors/Managing Director. It is ensured that the remuneration is determined in a way that there exists a fine balance between fixed and incentive pay. On the basis of Policy for Performance Evaluation of Independent Directors, a process of evaluation is being followed by the Board for its own performance and that of its Committees and individual Directors. The performance evaluation process and related tools are reviewed by the “Nomination & Remuneration Committee” on need basis, and the Committee may periodically seek independent external advice in relation to the process. The Committee may amend the Policy, if required, to ascertain its appropriateness as per the needs of the Company. The Policy may be amended by passing a resolution at a meeting of the Nomination & Remuneration Committee.
The performance of the Board was evaluated by the Board after seeking inputs from all the Directors on the basis of the criteria such as the Board composition and structure, effectiveness of Board processes, information and functioning, etc. The performance of the Committees was evaluated by the Board after seeking inputs from the Committee members on the basis of the criteria such as the composition of Committees, effectiveness of Committee meetings, etc. The Board and the Nomination and Remuneration Committee reviewed the performance of the individual Directors on the basis of the criteria such as the contribution of the individual Director to the Board and committee meetings like preparedness on the issues to be discussed, meaningful and constructive contribution and inputs in meetings, etc. In addition, the Chairman was also evaluated on the key aspects of his role.
In a separate meeting of Independent Directors, performance of Non-Independent Directors, performance of the Board as a whole and performance of the Chairman was evaluated, taking into account the views of Executive Directors and Non-Executive Directors. The same was discussed in the Board meeting that followed the meeting of the Independent Directors, at which the performance of the Board, its Committees and individual Directors was also discussed. Performance evaluation of Independent Directors was done by the entire Board, excluding the Independent Director being evaluated.
o) The Board annually reviews compliance reports of all laws applicable to the Company, prepared by the Company.
p) Code of Conduct
In compliance with the SEBI Listing Regulations and the Companies Act, 2013, a code of conduct for Board Members and Senior Officials is in place. It is a comprehensive code applicable to all Directors and Members of Senior Management of the Company. It is in alignment with Company’s vision and values to achieve the Mission and Objectives and aims at enhancing ethical and transparent process in managing the affairs of the Company. A copy of the Code is available on the website of the Company i.e. www.ptcfinancial.com.
Based on affirmation received from Board members and Senior Management Personnel, declaration regarding compliance of Code of Conduct made by the Managing Director and CEO is given below:
Declaration
All the Board members and Senior Management Personnel have affirmed compliance of Code of Conduct for financial year ended on 31st March, 2019.
The declaration by the Managing Director & Chief Executive Officer of the Company, under the Schedule V of the SEBI Listing Regulations, 2015, affirming compliance with the Code of Conduct by all the Board members and senior managerial personnel for the year ended March 31, 2019 is published herewith and forming part of this report.
q) Code for Prevention of Insider Trading
In terms of Securities and Exchange Board of India (Prohibition of Insider Trading) Regulations, 2015, the Company has formulated a comprehensive Code for Prevention of Insider Trading to preserve the confidentiality and to prevent misuse of unpublished price sensitive information. Every Director, officer and designated employee of the Company has a duty to safeguard the confidentiality of all such information obtained in the course of his or her work at the Company and not to misuse his or her position or information regarding the Company to gain personal benefit or to provide benefit to any third party. The code lays down guidelines and procedures to be followed and disclosures to be made while dealing with the shares of the Company and the consequences of non-compliance. In line with the requirement of Code for Prevention of Insider Trading, trading window was closed from time to time, whenever some price sensitive information was submitted to the Board and other Committees of Directors. Notice of closure of trading window was issued to all the employees well in advance, restraining all the employees and their relatives not to deal in the shares of the Company when the window is closed.
The code has been intimated to Stock Exchanges where the shares of the Company are listed and has also been duly published on the website of the Company (www.ptcfinancial.com) as prescribed by SEBI.
r) Committees of the Board of Directors
The Board functions either as a full Board or through various Committees constituted to oversee specific areas. The Board of Directors and its Committees meet at regular intervals.
As on 31st March, 2019, the Board had nine (9) committees:
1) Audit Committee
2) Nomination and Remuneration Committee
3) Stakeholders’ Relationship Committee
4) Asset Liability Management Committee
5) Risk Management Committee
6) Corporate Social Responsibility Committee
7) Committee of Directors for Bond issuance
8) Investment Committee
9) IT Strategy Committee
3. Audit Committee
The constitution, role and terms of reference of the Audit Committee of Directors of the Company are in conformity with the provisions of Section 177 of the Companies Act, 2013 and Regulation 18 of SEBI Listing Regulations, with all members being financially literate and most having accounting or related financial management expertise.
Terms of Reference
The broad terms of reference of Audit Committee are as follows:
a) Oversight of the Company’s financial reporting process and the disclosure of its financial information to ensure that the financial statement is correct, sufficient and credible;
b) Recommendation for appointment, remuneration and terms of appointment of auditors of the Company;
c) Approval of payment to statutory auditors for any other services rendered by the statutory auditors;
d) Reviewing, with the management, the annual financial statements and auditor’s report thereon before submission to the board for approval, with particular reference to:

23
I. Matters required to be included in the Director’s Responsibility Statement to be included in the Board’s report in terms of clause (c) of sub-section 3 of section 134 of the Companies Act, 2013;
II. Changes, if any, in accounting policies and practices and reasons for the same;
III. Major accounting entries involving estimates based on the exercise of judgment by management;
IV. Significant adjustments made in the financial statements arising out of audit findings;
V. Compliance with listing and other legal requirements relating to financial statements;
VI. Disclosure of any related party transactions;
VII. Modified opinions in the draft audit report;
e) Reviewing, with the management, the quarterly financial statements before submission to the board for approval;
f) Reviewing, with the management, the statement of uses / application of funds raised through an issue (public issue, rights issue, preferential issue, etc.), the statement of funds utilized for purposes other than those stated in the offer document / prospectus / notice and the report submitted by the monitoring agency monitoring the utilisation of proceeds of a public or rights issue, and making appropriate recommendations to the Board to take up steps in this matter;
g) Reviewing and monitoring the auditor’s independence and performance, and effectiveness of audit process;
h) Approval or any subsequent modification of transactions of the Company with related parties;
i) Scrutiny of inter-corporate loans and investments;
j) Valuation of undertakings or assets of the Company, wherever it is necessary;
k) Evaluation of internal financial controls and risk management systems;
l) Reviewing, with the management, performance of statutory and internal auditors, adequacy of the internal control systems;
m) Reviewing the adequacy of internal audit function, if any, including the structure of the internal audit department, staffing and seniority of the official heading the department, reporting structure coverage and frequency of internal audit;
n) Discussion with internal auditors of any significant findings and follow up there on;
o) Reviewing the findings of any internal investigations by the internal auditors into matters where there is suspected fraud or irregularity or a failure of internal control systems of a material nature and reporting the matter to the Board;
p) Discussion with statutory auditors before the audit commences, about the nature and scope of audit as well as post-audit discussion to ascertain any area of concern;
q) To look into the reasons for substantial defaults in the payment to the depositors, debenture holders, shareholders (in case of non-payment of declared dividends) and creditors;
r) To review the functioning of the Whistle Blower mechanism;
s) Approval of appointment of CFO (i.e., the whole-time Finance Director or any other person heading the finance function or discharging that function) after assessing the qualifications, experience and background, etc. of the candidate;
t) Carrying out any other function as is mentioned in the terms of reference of the Audit Committee.
u) Reviewing the utilization of loans/advances from/ investment by the holding Company in the subsidiary exceeding rupees 100 crore or 10% of the asset size of the subsidiary, whichever is lower including existing loans/advances/investments existing as on the date of coming into force of this provision.
The Audit Committee shall mandatorily review the following information:
a) Management discussion and analysis of financial condition and results of operations;
b) Statement of significant related party transactions (as defined by the Audit Committee), submitted by management;
c) Management letters / letters of internal control weaknesses issued by the statutory auditors;
d) Internal audit reports relating to internal control weaknesses; and
e) The appointment, removal and terms of remuneration of the Chief internal auditor shall be subject to review by the Audit Committee.
f) Statement of deviations:
a. quarterly statement of deviation (s) including report of monitoring agency, if applicable, submitted to stock exchange (s) in terms of Regulation 32 (1).
b. annual statement of funds utilized for purposes other than those stated in the offer document/prospectus/notice in terms of Regulation 32 (7).
Presently, the Committee is chaired by Shri Kamlesh Shivji Vikasmey, Non-Executive Independent Director. The composition of Audit Committee during the financial year ended 31st March, 2019 and meeting attended by the members are as follows:
Sr. No.
Name of Member Designation Status No. of meetings
held
No. of meetings attended
1 Shri Kamlesh Shivji Vikamsey*
Independent Director
Chairperson 4 4
2 Mrs. Pravin Tripathi^
Independent Director
Member 6 6
3 Mr. Harbans Lal Bajaj
Independent Director
Member 6 6
4 Shri Chinmoy Gangopadhyay*
Nominee Director
Member 4 2
5 Mr. Harun Rasid Khan$
Independent Director
Member 5 5
* Appointed as the members of the Audit Committee w.e.f. 12th August, 2018 and Chairperson of the Audit Committee w.e.f . 12th November, 2018.
^ Chairperson of the Audit Committee till the commencement of 52nd Audit Committee Meeting dated 12th November, 2018.
$Ceased to be the member of the Audit Committee w.e.f. 30th January, 2019
The Meetings of the Audit Committee are also attended by the Managing Director & Chief Executive Officer (CEO), Director (Finance), Director (Operations), Chief Financial Officer (CFO), Internal Auditors and Statutory Auditors as special invitees as required. The Company Secretary acts as Secretary to the Committee. The Minutes of each Audit Committee are placed in the next Meeting of the Board.

24
During the financial year ended 31st March 2019, 6 (Six) meetings of Audit Committee were held on 12th May, 2018, 30th May, 2018, 29th August, 2018, 12th November, 2018, 31st December, 2018 and 8th February, 2019. The required quorum was present for all the meetings. The maximum interval between any two meetings was within the maximum allowed gap of 120 days.
The Chairperson of the Audit Committee was present at the last Annual General Meeting held on 20th September, 2018 to answer the queries of the shareholders.
4. Nomination and Remuneration Committee
The Board originally constituted Nomination cum Remuneration Committee on 5th August, 2008 and subsequently renamed it to its present name on 30th April, 2014. It has been constituted for the purpose of ensuring ‘fit and proper’ status of proposed/ existing Directors of the Company in terms of RBI guidelines, Companies Act, 2013 and SEBI Listing Regulations, 2015.
The broad terms of reference of the nomination and remuneration committee are as under:
• formulation of the criteria for determining qualifications, positive attributes and independence of a director and recommend to the board of directors a policy relating to, the remuneration of the directors, key managerial personnel and other employees;
• formulation of criteria for evaluation of performance of independent directors and the board of directors;
• devising a policy on diversity of board of directors;
• identifying persons who are qualified to become directors and who may be appointed in senior management in accordance with the criteria laid down, and recommend to the board of directors their appointment and removal.
• whether to extend or continue the term of appointment of the independent director, on the basis of the report of performance evaluation of independent directors.
• Recommend to the Board, all remuneration, in whatever form, payable to senior management.
The Composition of Nomination and Remuneration Committee during the financial year ended 31st March, 2019 and meeting attended by the members are as follows:
Sr. No.
Name of Committee Member
Designation Status No. of meetings
held
No. of meetings attended
1 Shri Santosh Balachandran Nayar*
Independent Director
Chairperson 4 4
2 Mrs. Pravin Tripathi
Independent Director
Member 8 8
3 Shri Harbans Lal Bajaj
Independent Director
Member 8 8
4 Shri Chinmoy Gangopadhyay
Nominee Director
Member 8 7
5 Dr. Rajib Kumar Mishra
Nominee Director
Member 8 8
6 Shri Kamlesh Shivji Vikamsey^
Independent Director
Member 4 4
*Appointed as the member and Chairperson of the Nomination & Remuneration Committee w.e.f. 12th August, 2018.
^Appointed as the member of the Nomination & Remuneration Committee w.e.f. 12th August, 2018
Mr. Vishal Goyal, Company Secretary acts as the Secretary to the Committee. The Committee meets as per the requirement.
During the financial year ended 31st March, 2019, eight (8) meetings of Nomination and Remuneration Committee were held on 12th May, 2018, 1st June, 2018, 25th June, 2018, 26th July, 2018, 12th September, 2018, 3rd October, 2018, 1st November, 2018 and 17th March, 2019 .
Performance Evaluation Criteria for all the Directors
The performance evaluation criteria for all directors (including Independent Directors) are determined by the Nomination and Remuneration committee. An indicative list of factors that may be evaluated include participation and contribution by a director, commitment, effective deployment of knowledge and expertise, effective management of relationship with stakeholders, integrity and maintenance of confidentiality and independence of behavior and judgement.
5. Remuneration of Directors
The Chairman is not paid any remuneration by the Company and the remuneration of Whole Time Directors (WTD) is fixed component. Notice period of MD and WTDs is 3 (three) months.
The non-executive Directors in PFS are entitled/ paid sitting fee of an amount of Rs. 40,000/- per Board and Committee meeting(s) during the financial year ended 31st March, 2019 as resolved by the Board of Directors in their meeting held on 31st January, 2015.
Scope and terms of reference
The scope and terms of reference of the Nomination and Remuneration Committee are in line with the listing agreement, provisions of the Companies Act, 2013 and any guidelines / circulars issued by the Reserve Bank of India and include determining on behalf of the Board and the shareholders of the Company, the Company’s policy on specific remuneration packages for executive directors including pension rights and any compensation payment.
The remuneration paid to Managing Director & CEO and Whole- Time Directors during the financial year ended 31st March, 2019 is as under:
A. Executive Directors
Sr. no.
Director Designation Remuneration (figures in Rs.
million)- FY 2018-19
1. Dr. Pawan Singh* MD & CEO 8.77
2. Shri Naveen Kumar Whole- Time Director 6.80
3. Dr. Ashok Haldia$ Whole- Time Director 9.89
*Appointed as MD & CEO w.e.f 3rd October, 2018
$Ceased to be Director w.e.f. 18th September, 2018.
Presently, the Company does not have a scheme for grant of stock options to any director. The CTC structure of Company including for management is mix of fixed and performance linked. As per the contract entered into with the executive directors, there is a notice period of 3 months and there is no severance fee to be paid to the directors. No sitting fee has been paid to the Executive Directors during the financial year ended 31st March, 2019.
B. Details of payments made towards sitting fee to the Non- Executive Directors for Board/Committee Meetings during FY 2018-2019
The Independent directors and Non- Executive Directors are paid remuneration by way of sitting fees for each meeting of the Board and Committee of directors attended by them.
The Independent Directors do not have any pecuniary relationship or transactions with the Company. The Nomination and

25
Remuneration Policy of the Company which is given as Annexure – VI to the Board’s Report and is also disclosed on the website of the Company http://www.ptcfinancial.com/upload/pdf/nomination_and_remuneratin_board_diversity_policy.pdf.
The details of payments made to non-executive directors during the financial year ended 31st March 2019 are as under:
S. No.
Name of Director Sitting Fee (excluding
TDS) (Rs. In
millions)
Conveyance (excluding
TDS) (Rs. In
million)
1 Shri. Deepak Amitabh* 0.72 -
2 Dr. Rajib Kumar Mishra* 0.96 -
3 Shri. Chinmoy Gangopadhyay^ 0.84 0.024
4 Mrs. Pravin Tripathi 1.36 0.036
5 Shri. Harbans Lal Bajaj 1.16 0.026
6 Shri. Harun Rasid Khan 0.8 0.01
7 Shri. Kamlesh Shivji Vikamsey 0.96 0.004
8 Shri Santosh Balachandran Nayar
0.68 0.006
*Sitting Fee has been paid to PTC India Limited (holding company)
^ Sitting Fee has been paid to Power Finance Corporation Limited
6. Stakeholders’ Relationship Committee
The Stakeholders Relationship Committee of the Board consider and resolve the grievances of the security holders of the Company including complaints related to transfer of shares, non-receipt of annual report, and non-receipt of declared dividends.
The composition of the Committee during the financial year ended March 31, 2019 and meetings attended by the members are as follows is as follows:
Sl. No.
Name of Member
Designation Status No. of meetings
held
No. of meetings attended
1 Mrs. Pravin Tripathi
Independent Director
Chairperson - -
2 Dr. Rajib Kumar Mishra
Nominee Director
Member - -
3 Shri Kamlesh Shivji Vikamsey*
Independent Director
Member - -
4 Dr. Ashok Haldia#
Whole- Time Director
Member - -
* Appointed as member of the Stakeholders’ Relationship Committee w.e.f. 12th August, 2018
# Ceased to be member of the Stakeholders’ Relationship Committee w.e.f. 18th September, 2018
During the financial year ended 31st March, 2019, no meetings of Stakeholder Relationship was held.
The Committee is headed by Mrs. Pravin Tripathi, Non – Executive Director of the Company.
Mr. Vishal Goyal, Company Secretary designated and act as the Compliance Officer of the Committee.
Terms of Reference
The Committee looks into redressing of investors complaint like delay in transfer of shares, demat, remat, non- receipt of declared dividends, non- receipt of Annual Reports etc. and such other related work as may be assigned by the Board from time to time. The Committee oversees the performance of Registrar and Share Transfer Agent of the Company and recommends measures for overall improvement in the quality of investor services.
Investor Complaints received and resolved during the year
Status of Complaints from investors for the financial year ended 31st March, 2019
Sl. No.
Type of Investor
No. of complaints
pending at the beginning of
the year
No. of Complaints
received during year
No. of Complaints pending as
at the end of year
1. Equity shareholders
- 20 -
2. Bondholders - 717 -
All the complaints have been resolved to the satisfaction of the shareholders/bondholders.
Other Committees
A. Asset Liability Management Committee
The Asset Liability Management Committee (ALCO) was originally constituted pursuant to Board resolution dated 30th March, 2009. It has been constituted for the purpose of performing functions as required under the Asset Liability Management Policy of the Company.
Composition and Meetings
The composition of Asset Liability Management Committee during the financial year ended 31st March, 2019 and meeting attended by members are as follows:
Sl. No.
Name of Member
Designation Status No. of meetings
held
No. of meetings attended
1 Shri Chinmoy Gangopadhyay*
Non- Executive Nominee Director
Chairperson 2 2
2 Dr. Pawan Singh
Managing Director & CEO
Member 3 3
3 Shri Naveen Kumar*
Whole- Time Director
Member 2 2
4 Mr. Deepak Amitabh^
Non-Executive - Nominee Director,
Member 1 1
5 Dr. Ashok Haldia$
Whole- Time Director
Member - -
6 Mrs. Pravin Tripathi@
Independent Director
Member - -
* Appointed as the member of the Asset Liability Committee w.e.f. 12th November, 2018
^ Ceased to be the member of the Asset Liability Committee w.e.f. 12th November, 2018
$ Ceased to be the member of the Asset Liability Committee w.e.f. 18th September, 2018

26
@ Ceased to be the member of the Asset Liability Committee w.e.f. 12th August, 2018
Number of Committee Meetings held during the Financial Year
During the year financial ended 31st March, 2019, 3 (three) meetings of Asset Liability Management Committee was held on 12th October, 2018, 27th December, 2018 and 5th February, 2019.
Scope, Terms and References
The scope of Asset Liability Management Committee includes market risk management and it shall specifically focus on interest rate risk, foreign exchange risk and liquidity risk.
B. Risk Management Committee
The Risk Management Committee was constituted by Board on 7th July, 2009. It has been constituted under Risk Management Policy of the Company for the purpose of reviewing risk management in relation to various risks, namely, market risk, credit risk and operational risk.
Composition
The composition of Risk Management Committee during the financial year ended 31st March, 2019 and meeting attended by the members are as follows:
Sl. No.
Name of Director
Designation Status No. of meetings
held
No of meetings attended
1 Shri Santosh Balachandran Nayar*
Independent Director
Chairperson 2 2
2 Dr. Rajib K. Mishra
Nominee Director
Member 2 2
3 Dr. Pawan Singh
MD & CEO Member 2 2
4 Shri Naveen Kumar*
Whole-Time Director
Member 2 2
5 Shri Harun Rasid Khan$
Independent Director
Member 1 1
6 Mr. Harbans Lal Bajaj%
Independent Director
Member - -
7 Dr. Ashok Haldia@
Whole-Time Director
Member - -
*Appointed as the member of the Risk Management Committee w.e.f 12th August, 2018
$ Appointed as the member of the Risk Management Committee w.e.f 12th August, 2018 and ceased to be the member w.e.f. 30th January, 2019
% Ceased to be the member of the Risk Management Committee w.e.f. 12th August, 2018
@ Ceased to be the member of the Risk Management Committee w.e.f. 18th September, 2018
Number of Committee Meetings held during the Financial Year
During the financial year ended 31st March 2019, 2(two) meetings of Risk Management Committee were held on 17th October, 2018 and 05th February, 2019 respectively.
C. Corporate Social Responsibility Committee
The Corporate Social Responsibility Committee was constituted pursuant to Board resolution dated 30th April, 2014.
Composition
The composition of Corporate Social Responsibility Committee during the financial year ended 31st March, 2019 and meeting attended by the members are as follows:
Sl. No.
Name of Director
Designation Status No. of meetings
held
No of meetings attended
1 Shri Deepak Amitabh
Non- Executive Nominee Director
Chairman 4 4
2 Mrs. Pravin Tripathi
Independent Director
Member 4 4
3 Dr. Pawan Singh*
Managing Director & CEO
Member 2 2
3 Dr. Ashok Haldia#
Managing Director & CEO
Member 2 2
4 Shri Harun R. Khan^
Independent Director
Member 2 2
*Appointed as member of the Corporate Social Responsibility Committee w.e.f. 8th February, 2019.
#Ceased to be member of the Corporate Social Responsibility Committee w.e.f 18th September, 2018.
^Appointed as the member of the Corporate Social Responsibility Committee w.e.f. 12th May, 2018 and ceased to be member w.e.f 30th January, 2019.
Number of Committee Meetings held during the Financial Year
During the financial year ended 31st March, 2019, 4 (four) meetings of Corporate Social Responsibility Committee were held on 13th July, 2018, 29th August, 2018, 2nd March, 2019 and 30th March, 2019.
The Board in its meeting held on 27th March, 2015 has approved the Corporate Social Responsibility policy of the Company and the same has been disclosed on the website of the Company i.e. www.ptcfinancial.com.
D. Committee of Directors for Issuance of Bonds
The Committee of Directors for issuance of Bonds was originally constituted by Board on 21st August, 2009. It has been constituted for taking the necessary decision related to raising the fund through Bond and other similar purpose of considering and determining the terms and conditions of issuance and allotments of secured non-convertible debentures.
Composition
The composition of Committee of Directors for Issuance of Bonds during the financial year ended 31st March, 2019 and meeting attended by the members are as follows:
Sl. No.
Name of Director
Designation Status No. of meetings
held
No of meetings attended
1 Shri Deepak Amitabh*
Non- Executive Nominee Director
Member - -
2 Dr. Pawan Singh
Managing Director & CEO
Member - -
3 Shri Naveen Kumar^
Whole Time Director
Member - -
4 Mrs. Pravin Tripathi^
Independent Director
Member - -
5 Dr. Ashok Haldia$
Managing Director & CEO
Member - -

27
*Ceased to be the member of the Committee w.e.f. 12th November, 2018.
^ Appointed as the members of the Committee w.e.f. 12th November, 2018 respectively.
$Ceased to be the member of the Committee w.e.f. 18th September, 2018
Number of Committee Meetings held during the Financial Year
During the financial year ended 31st March, 2019, no meetings of Committee of Directors for issuance of Bonds was held.
E. Investment Committee (for sanction of financial assistance up to Rs. 100 crores)
The Investment Committee was originally constituted by Board on 21st August, 2009. It has been constituted for the purpose of considering and sanctioning debt financing or equity participation or both taken together to a single Company up to Rs. 100 crores, subject to an overall limit by Rs.500 crores in a financial year.
Composition
The composition of Investment Committee during the financial year ended 31st March, 2019 and meeting attended by the members are as follows:
Sl. No.
Name of the Director
Designation Status No. of meetings
held
No. of meetings attended
1 Dr. Rajib K. Mishra^
Non- Executive Nominee Director
Member - -
2 Shri Chinmoy Gangopadhyay^
Non- Executive Nominee Director
Member - -
3 Mrs. Pravin Tripathi
Independent Director
Member - -
4 Dr. Pawan Singh Managing Director & CEO
Member - -
5 Shri Naveen Kumar
Whole- Time Director
Member - -
6 Shri Deepak Amitabh$
Non- Executive Nominee Director
Member - -
7 Dr. Ashok Haldia@
Whole- Time Director
Member - -
^Appointed as the member of the Investment Committee w.e.f.12th November, 2018
$ Ceased to be the member of the Investment Committee w.e.f. 12th November, 2018
@Ceased to be the member of the Investment Committee w.e.f. 18th September, 2018
Number of Committee Meetings held during the Financial Year
During the financial year ended 31st March, 2019, no meeting of Investment Committee was held.
F. IT Strategy Committee
The IT Strategy Committee was constituted by Board on 25th June, 2018 in accordance with the RBI issued Master Direction – Information Technology Framework for the NBFC Sector on 8th June, 2017.
Composition
The composition of IT Strategy Committee during the financial year ended 31st March, 2019 and meeting attended by the members are as follows:
Sl. No.
Name of the Director
Designation Status No. of meetings
held
No. of meetings attended
1 Shri Kamlesh Shivji Vikamsey
Independent Director
Chairperson 2 2
2 Dr. Pawan Singh*
Managing Director & CEO
Member 1 1
3 Shri Naveen Kumar
Whole Time Director
Member 2 2
4 $Shri Harun R. Khan
Independent Director
Member 2 2
5 Dr. Ashok Haldia^
Whole- Time Director
Member - -
*Appointed as the member of IT Strategy Committee w.e.f. 3rd October, 2018
$ Ceased to be the member of the IT Strategy Committee w.e.f. 30th January, 2019
^Appointed as member of the IT Strategy Committee w.e.f. 12th August, 2018 and ceased to be member w.e.f 18th September, 2018.
Number of Committee Meetings held during the Financial Year
During the financial year ended 31st March 2019, 2(two) meetings of the IT Strategy Committee were held on 10th August, 2018 and 20th December, 2018 respectively.
7. General Body Meeting (s)
a) Details of last three Annual General Meetings (AGM) are as under
Year ended
AGM Date Day Time Location Special Resolution
31st March, 2018
12th AGM
20th September, 2018
Thursday 10 : 30 A.M.
Dr. SRKV Auditorium, Kendriya Vidyalaya No.2, APS Colony, Gurgaon Road, Delhi Cantt., New Delhi-110010
One
31st
March, 2017
11th AGM
25th September, 2017
Monday 11 : 00 A.M.
Dr. SRKV Auditorium, Kendriya Vidyalaya No.2, APS Colony, Gurgaon Road, Delhi Cantt., New Delhi-110010
Three
31st
March, 2016
10th
AGM28th
September, 2016
Wednesday 10:30 A.M.
Dr. SRKV Auditorium, Kendriya Vidyalaya No.2, APS Colony, Gurgaon Road, Delhi Cantt., New Delhi-110010
None
No Extra-Ordinary General Meeting(s) were held during last three years.
b) Special Resolutions passed last year through Postal Ballot – details of voting pattern
During the year ended 31st March, 2019, no Special Resolutions were passed through Postal Ballot.
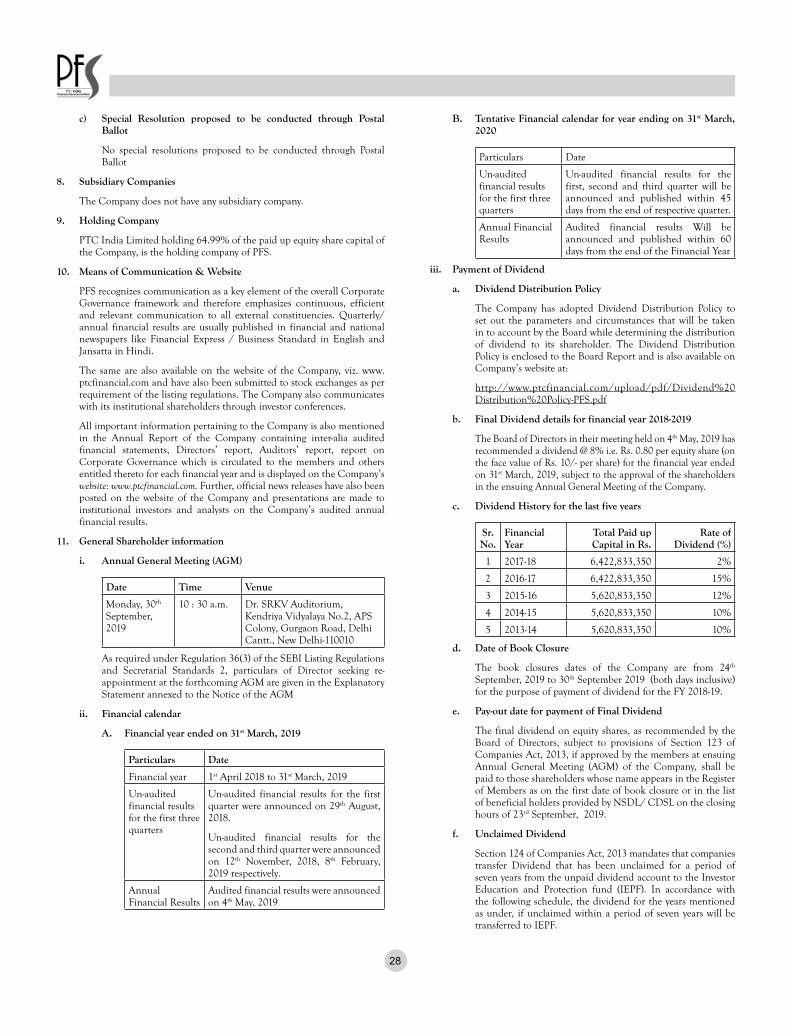
28
c) Special Resolution proposed to be conducted through Postal Ballot
No special resolutions proposed to be conducted through Postal Ballot
8. Subsidiary Companies
The Company does not have any subsidiary company.
9. Holding Company
PTC India Limited holding 64.99% of the paid up equity share capital of the Company, is the holding company of PFS.
10. Means of Communication & Website
PFS recognizes communication as a key element of the overall Corporate Governance framework and therefore emphasizes continuous, efficient and relevant communication to all external constituencies. Quarterly/annual financial results are usually published in financial and national newspapers like Financial Express / Business Standard in English and Jansatta in Hindi.
The same are also available on the website of the Company, viz. www.ptcfinancial.com and have also been submitted to stock exchanges as per requirement of the listing regulations. The Company also communicates with its institutional shareholders through investor conferences.
All important information pertaining to the Company is also mentioned in the Annual Report of the Company containing inter-alia audited financial statements, Directors’ report, Auditors’ report, report on Corporate Governance which is circulated to the members and others entitled thereto for each financial year and is displayed on the Company’s website: www.ptcfinancial.com. Further, official news releases have also been posted on the website of the Company and presentations are made to institutional investors and analysts on the Company’s audited annual financial results.
11. General Shareholder information
i. Annual General Meeting (AGM)
Date Time Venue
Monday, 30th September, 2019
10 : 30 a.m. Dr. SRKV Auditorium, Kendriya Vidyalaya No.2, APS Colony, Gurgaon Road, Delhi Cantt., New Delhi-110010
As required under Regulation 36(3) of the SEBI Listing Regulations and Secretarial Standards 2, particulars of Director seeking re-appointment at the forthcoming AGM are given in the Explanatory Statement annexed to the Notice of the AGM
ii. Financial calendar
A. Financial year ended on 31st March, 2019
Particulars Date
Financial year 1st April 2018 to 31st March, 2019
Un-audited financial results for the first three quarters
Un-audited financial results for the first quarter were announced on 29th August, 2018.
Un-audited financial results for the second and third quarter were announced on 12th November, 2018, 8th February, 2019 respectively.
Annual Financial Results
Audited financial results were announced on 4th May, 2019
B. Tentative Financial calendar for year ending on 31st March, 2020
Particulars Date
Un-audited financial results for the first three quarters
Un-audited financial results for the first, second and third quarter will be announced and published within 45 days from the end of respective quarter.
Annual Financial Results
Audited financial results Will be announced and published within 60 days from the end of the Financial Year
iii. Payment of Dividend
a. Dividend Distribution Policy
The Company has adopted Dividend Distribution Policy to set out the parameters and circumstances that will be taken in to account by the Board while determining the distribution of dividend to its shareholder. The Dividend Distribution Policy is enclosed to the Board Report and is also available on Company’s website at:
http://www.ptcfinancial.com/upload/pdf/Dividend%20Distribution%20Policy-PFS.pdf
b. Final Dividend details for financial year 2018-2019
The Board of Directors in their meeting held on 4th May, 2019 has recommended a dividend @ 8% i.e. Rs. 0.80 per equity share (on the face value of Rs. 10/- per share) for the financial year ended on 31st March, 2019, subject to the approval of the shareholders in the ensuing Annual General Meeting of the Company.
c. Dividend History for the last five years
Sr. No.
Financial Year
Total Paid up Capital in Rs.
Rate of Dividend (%)
1 2017-18 6,422,833,350 2%
2 2016-17 6,422,833,350 15%
3 2015-16 5,620,833,350 12%
4 2014-15 5,620,833,350 10%
5 2013-14 5,620,833,350 10%
d. Date of Book Closure
The book closures dates of the Company are from 24th September, 2019 to 30th September 2019 (both days inclusive) for the purpose of payment of dividend for the FY 2018-19.
e. Pay-out date for payment of Final Dividend
The final dividend on equity shares, as recommended by the Board of Directors, subject to provisions of Section 123 of Companies Act, 2013, if approved by the members at ensuing Annual General Meeting (AGM) of the Company, shall be paid to those shareholders whose name appears in the Register of Members as on the first date of book closure or in the list of beneficial holders provided by NSDL/ CDSL on the closing hours of 23rd September, 2019.
f. Unclaimed Dividend
Section 124 of Companies Act, 2013 mandates that companies transfer Dividend that has been unclaimed for a period of seven years from the unpaid dividend account to the Investor Education and Protection fund (IEPF). In accordance with the following schedule, the dividend for the years mentioned as under, if unclaimed within a period of seven years will be transferred to IEPF.
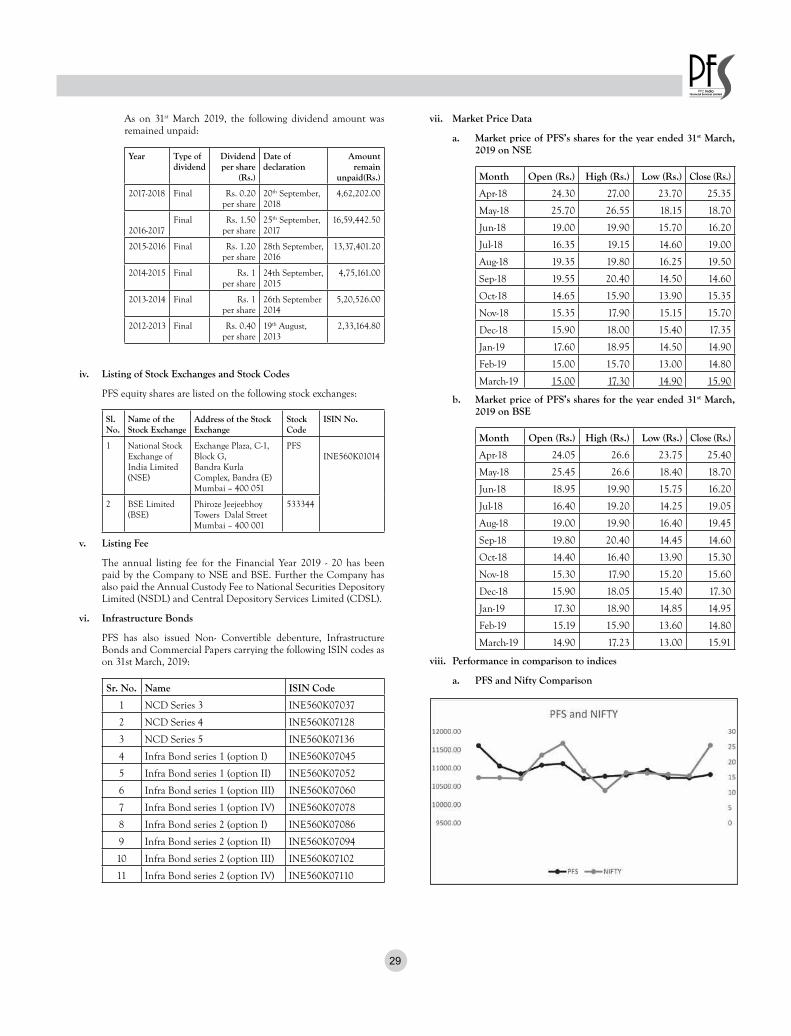
29
As on 31st March 2019, the following dividend amount was remained unpaid:
Year Type of dividend
Dividend per share
(Rs.)
Date of declaration
Amount remain
unpaid(Rs.)
2017-2018 Final Rs. 0.20 per share
20th September, 2018
4,62,202.00
2016-2017
Final Rs. 1.50 per share
25th September, 2017
16,59,442.50
2015-2016 Final Rs. 1.20 per share
28th September, 2016
13,37,401.20
2014-2015 Final Rs. 1 per share
24th September, 2015
4,75,161.00
2013-2014 Final Rs. 1 per share
26th September 2014
5,20,526.00
2012-2013 Final Rs. 0.40 per share
19th August, 2013
2,33,164.80
iv. Listing of Stock Exchanges and Stock Codes
PFS equity shares are listed on the following stock exchanges:
Sl. No.
Name of the Stock Exchange
Address of the Stock Exchange
Stock Code
ISIN No.
1 National Stock Exchange of India Limited (NSE)
Exchange Plaza, C-1, Block G, Bandra Kurla Complex, Bandra (E) Mumbai – 400 051
PFSINE560K01014
2 BSE Limited(BSE)
Phiroze Jeejeebhoy Towers Dalal Street Mumbai – 400 001
533344
v. Listing Fee
The annual listing fee for the Financial Year 2019 - 20 has been paid by the Company to NSE and BSE. Further the Company has also paid the Annual Custody Fee to National Securities Depository Limited (NSDL) and Central Depository Services Limited (CDSL).
vi. Infrastructure Bonds
PFS has also issued Non- Convertible debenture, Infrastructure Bonds and Commercial Papers carrying the following ISIN codes as on 31st March, 2019:
Sr. No. Name ISIN Code
1 NCD Series 3 INE560K07037
2 NCD Series 4 INE560K07128
3 NCD Series 5 INE560K07136
4 Infra Bond series 1 (option I) INE560K07045
5 Infra Bond series 1 (option II) INE560K07052
6 Infra Bond series 1 (option III) INE560K07060
7 Infra Bond series 1 (option IV) INE560K07078
8 Infra Bond series 2 (option I) INE560K07086
9 Infra Bond series 2 (option II) INE560K07094
10 Infra Bond series 2 (option III) INE560K07102
11 Infra Bond series 2 (option IV) INE560K07110
vii. Market Price Data
a. Market price of PFS’s shares for the year ended 31st March, 2019 on NSE
Month Open (Rs.) High (Rs.) Low (Rs.) Close (Rs.)
Apr-18 24.30 27.00 23.70 25.35
May-18 25.70 26.55 18.15 18.70
Jun-18 19.00 19.90 15.70 16.20
Jul-18 16.35 19.15 14.60 19.00
Aug-18 19.35 19.80 16.25 19.50
Sep-18 19.55 20.40 14.50 14.60
Oct-18 14.65 15.90 13.90 15.35
Nov-18 15.35 17.90 15.15 15.70
Dec-18 15.90 18.00 15.40 17.35
Jan-19 17.60 18.95 14.50 14.90
Feb-19 15.00 15.70 13.00 14.80
March-19 15.00 17.30 14.90 15.90
b. Market price of PFS’s shares for the year ended 31st March, 2019 on BSE
Month Open (Rs.) High (Rs.) Low (Rs.) Close (Rs.)
Apr-18 24.05 26.6 23.75 25.40
May-18 25.45 26.6 18.40 18.70
Jun-18 18.95 19.90 15.75 16.20
Jul-18 16.40 19.20 14.25 19.05
Aug-18 19.00 19.90 16.40 19.45
Sep-18 19.80 20.40 14.45 14.60
Oct-18 14.40 16.40 13.90 15.30
Nov-18 15.30 17.90 15.20 15.60
Dec-18 15.90 18.05 15.40 17.30
Jan-19 17.30 18.90 14.85 14.95
Feb-19 15.19 15.90 13.60 14.80
March-19 14.90 17.23 13.00 15.91
viii. Performance in comparison to indices
a. PFS and Nifty Comparison

30
b. PFS and SENSEX Comparison
ix. Registrar and Transfer Agents
For Equity and Infrastructure Bonds
Name Karvy Fintech Private Limited (earlier known as Karvy Computershare Private Limited)
Registered Office Address
Karvy House, 46, Avenue 4, Street No. 1, Banjara Hills, Hyderabad 500034, India, Tel: +91 40 23312454
Communication Address
Karvy Fintech Private Limited (earlier known as Karvy Computershare Private Limited)Karvy Selenium, Tower-B, Plot 31-32,Gachibowli Financial District, Nanakramguda, Hyderabad-500 032 Tel: +91 40 67162222, Fax: +91 40 23001153, Toll Free No : 1800-345-4001
E-mail [email protected]
Website www.karvyfintech.com
x. Share Transfer System
The shares under physical segment are transferred through M/s Karvy Fintech Private Limited, Registrar and Share Transfer Agent.
It receives the shares to be transferred along with the transfer deed from transferee, verifies it, and prepares the Memorandum of Transfer etc. A Share Transfer Committee has also been constituted to take note and approve the transfer of shares of the Company.
Further pursuant to Regulation 40(9) of SEBI Listing Regulations, 2015, certificate on half yearly basis confirming the due compliance of share transfer formalities by the Company from Practicing Company Secretary have been submitted to Stock Exchanges within stipulated time.
Reconciliation of Share Capital Audit Report for the Quarter ended 31st March, 2019, confirming that the total issued/paid-up capital is in agreement with the total number of shares in physical form and the total number of dematerialized shares held with NSDL and CDSL as on 31st March, 2019, was obtained from practicing company secretary and submitted to the stock exchanges with in stipulated time.
xi. Distribution of shareholding
Distribution by size
Distribution Schedule - Consolidated as on 31-03-2019
Category (Amount)
No. of Cases
% of Cases Total Shares Amount % of Amount
20001- 30000 4,626 3.540839 12,114,364 121,143,640 1.886140
5001- 10000 18,624 14.255207 16,023,412 160,234,120 2.494758
40001- 50000 2,125 1.626520 10,191,677 101,916,770 1.586788
50001- 100000 3,299 2.525125 24,683,911 246,839,110 3.843150
100001& Above 2,579 1.974022 536,876,829 5,368,768,290 83.588784
10001- 20000 11,369 8.702075 18,131,253 181,312,530 2.822937
30001- 40000 2,378 1.820172 8,668,733 86,687,330 1.349674
1-5000 85,647 65.556040 15,593,156 155,931,560 2.427769
Total 130,647 100.00 642,283,335 6,422,833,350 100.00
Nominal Value of each Share is Rs.10/-
Distribution by Category
S. No
Description No. of Cases
Total Shares % Equity
1 MUTUAL FUNDS 1 23,334 0.00
2 FOREIGN PORTFOLIO - CORP 24 10,370,100 1.61
3 TRUSTS 9 29,471 0.00
4 RESIDENT INDIVIDUALS 124,065 159,111,809 24.77
5 PROMOTERS 1 4,17,450,001 64.99
6 INSURANCE COMPANIES 2 14,682,595 2.29
7 NON RESIDENT INDIANS 1,541 8,796,551 1.37
8 CLEARING MEMBERS 108 784,792 0.12
9 BANKS 3 1,035,822 0.16
10 NON RESIDENT INDIAN NON REPATRIABLE
561 1,889,076 0.29
11 BODIES CORPORATES 874 18,971,295 2.95
12 NBFC 13 439,555 0.07
13 H U F 3,445 8,698,934 1.35
Total: 130,647 6,42,283,335 100.00
Graphical Representation of Shareholding Pattern of the company on the basis of distribution by category as on 31st March, 2019
i. Dematerialization of shares
Through Karvy Fintech Private Limited (earlier known as Karvy Computershare Private Limited), Registrar and Share Transfer Agent, the Company has established connectivity with both National Securities Depository Limited (NSDL) and Central Depository Services Limited (CDSL). The ISIN allotted to our shares under the Depository System is INE560K01014.

31
As on 31st March, 2019, 99.99% of our shares were held in dematerialized form and the rest in physical form. Details of shares held in dematerialised and physical mode as on 31st March, 2019 are as under:
Category Number of % of total equityShareholders Shares
Dematerialised mode• NSDL 72,456 5,74,083,021 89.38• CDSL 51,136 68,167,732 10.61Total 123,592 6,42,250,753 99.99Physical 7,055 32,582 0.01Grand Total 130,647 642,283,335 100.00
ii. Shares Liquidity
The trading volumes at the Stock Exchanges, during the financial year 2018-19, are given below:
Months National Stock Exchange of India Limited
BSE Limited
Number of Shares Traded
Number of Shares Traded
April, 2018 18,395,915 3,249,004May, 2018 26,541,918 5,607,395June, 2018 16,599,685 3,311,468July, 2018 17,026,934 2,601,869August, 2018 19,535,713 3,024,169September, 2018 15,883,914 2,680,562October, 2018 12,272,302 2,031,026November, 2018 13,880,861 2,366,089December, 2018 11,262,456 1,808,887January, 2019 12,188,300 1,761,183February, 2019 8,727,756 1,341,758March, 2019 13,401,527 1,622,885
iii. Outstanding GDRs or ADRs or Warrants or any convertible instruments, conversion date and likely impact on equity
The Company has not issued any GDRs, ADRs, Warrants or any convertible instruments.
iv. Commodity price risk or Foreign Exchange risk and hedging activities
The Company has managed the foreign exchange risk with appropriate hedging activities in accordance with policies of the Company. The aim of the Company’s approach to manage currency risk is to leave the Company with no material residual risk. The Company uses forward exchange contract to hedge against its foreign currency exposures relating to firm commitment. Foreign exchange transactions are fully covered with strict limits placed on the amount of uncovered exposure, if any, at any point in time. There are no materially uncovered exchange rate risks. The Company does not enter into any derivative instruments for trading or speculative purposes.
v. Address and Details for correspondence
Mr. Vishal Goyal Company Secretary and Compliance Officer PTC India Financial Services Limited 7th Floor, Telephone Exchange Building 8, Bhikaji Cama Place, New Delhi – 110066 Tel. : +91 11- 26737300 Fax: + 91 11- 26737373 Email: [email protected] Website: www.ptcfinancial.com
vi. Credit Ratings
List of credit ratings obtained along with revisions during the FY 18-19
S. No. Rating Agency Rating Outlook
1. CRISIL - CRISIL A+ CRISIL A1+
Stable
2. ICRA - ICRA A+ ICRA A1+
Stable
3. CARE - CARE A+ CARE A1+
Stable
4. Brickwork BWR AA Stable
12. Corporate Identity Number
Corporate Identity Number (CIN) of the Company, allotted by the Ministry of Corporate Affairs, Government of India is L65999DL2006PLC153373.
13. CEO and CFO Certification
The certificate required under Regulation 17(8) of the SEBI (Listing Obligation and Disclosure Requirements) Regulations, 2015, duly signed by Managing Director & CEO and CFO was placed before the Board. The same is annexed as Annexure X to this annual report.
14. Compliance Certificate on Corporate Governance
In terms of Regulation 34 of the SEBI (Listing Obligation and Disclosure Requirements) Regulations, 2015, the Certificate on Corporate Governance issued by Statutory Auditors is annexed to this report.
15. Other Disclosures
A. Materially Significant Related Party Transactions
All transactions entered into by the Company during the financial year with the related parties are in compliance with the applicable provisions of the Companies Act, 2013 and SEBI (LODR) Regulations, 2015 and do not have potential conflicts with the interest of the Company. Further, the details of related party transactions are presented in Note number 29 forming part of the financial statements. The policy for determining Materially Significant Related Party Transactions is disclosed on website of the Company at the link:
https://www.ptcfinancial.com/upload/pdf/20150629_Policy_materiality_of_Related_Party_Transactions.pdf
B. Details of non-compliance by the Company, penalties and strictures imposed on the Company by the Stock Exchanges or SEBI or any statutory authority during last three years
There were no instances of non-compliance on any matter related to the capital markets during the last three years. There were no penalties imposed or strictures passed against the Company by the statutory authorities on any matter related to capital markets, during the last three years.
C. Vigil Mechanism/Whistle Blower Policy
The Company’s Whistle Blower policy is an inbuilt system of Grievance Redressal which deals with grievances of employees. Under this system grievances of the employees are redressed effectively. The Company affirms that no personnel have been denied access to the audit committee. The policy on vigil mechanism is attached with this report as Annexure XI.
D. Details of Compliance with Mandatory requirements and adoption of the Non – Mandatory Requirements
During the year, the Company has complied with all applicable mandatory corporate governance requirements prescribed under regulation 72 of SEBI Listing Regulations.

32
E. Policy on determining Material Subsidiary
The Company has adopted a policy on material subsidiaries .The policy for determining ‘material’ subsidiaries is disclosed on website of the Company at the link: http://www.ptcfinancial.com/upload/pdf/20150629_Policy_on_determining_Material_Subsidiaries.pdf. However, the Company is not having any subsidiary company.
F. Related Party Transaction Policy
In line with requirement of the Companies Act, 2013 and Listing Regulations, the Company has formulated a Related Party Transaction Policy. This policy is also available at Company’s website at: :-http://www.ptcfinancial.com/upload/pdf/20150629_Policy_materiality_of_Related_Party_Transactions.pdf
G. Accounting treatment in the preparation of the Financial Statements
The financial statements of the Company have been prepared in accordance with the Generally Accepted Accounting Principles in India (Indian GAAP) to comply with the applicable Indian Accounting Standards specified under Section 133 of the Companies Act, 2013.
16. Non- Compliance of any requirement of Corporate Governance report with reasons thereof
As per the requirements of Regulation 17 of SEBI Listing Regulations, the Composition of the Board of the Company meets the criteria mandated by SEBI Listing Regulations and the Companies Act, 2013 except the number of Independent Directors as prescribed in explanation to proviso of Regulation 17(1)(b) of SEBI Listing Regulations is less than half of the total number of the Board of directors. The vacancy of the Independent Directors has arrived due to their cessation and the Company has initiated the process to comply with the said regulation and same shall be complied in due course.
1. Details of utilization of funds raised through preferential allotment or qualified institutions placement
During the period under review, Company has not raised any funds through preferential allotment or qualified institutions placement.
2. Whether the Board has where the board had not accepted any recommendation of any Committee of the board which is mandatorily required, in the relevant financial year, the same to be disclosed along with reasons thereof: Not Applicable
3. Detail of total fees paid by the Company along with subsidiaries to the Statutory Auditors and their network firms
The details of total fees for all services incurred by the Company and its subsidiaries, on a consolidated basis, to the statutory auditor and all entities in the network firm/network entity of which the statutory auditor is a part, are as follows:
Particulars Amount in Rs. In millions
Services as statutory auditors (incl. quarterly limited reviews)
4.03
Tax audit 0.28Other matters (certification and reporting) 1.73Re-imbursement of out of pocket expenses 0.01 Total 6.05
4. Related Party Disclosure
The details of related party disclosures with respect to loans/advances/investments at the year end and maximum outstanding amount thereof during the year, as required under Part A of Schedule V of the Listing Regulations have been mentioned in the of the Standalone Financial Statements for the financial year ended on March 31, 2019.
Disclosure of transactions of the Company with any person or entity belonging to the promoter/promoter group which hold(s) 10% or more shareholding in the Company is annexed herewith and forming part of this report.
5. Disclosures in relation to Sexual Harassment of Women at Workplace (Prevention, Prohibition and Redressal) Act, 2013:
An Internal Complaints Committee has been constituted to look into grievance/complaints of sexual harassment lodged by employees as per Sexual Harassment of Women at Workplace (Prevention, Prohibition and Redressal) Act, 2013. Further, no complaints were received during the year and no complaint is pending on 31st March, 2019.
a. Number of complaints filed during the financial year- NIL
b. Number of complaints disposed of during the financial year-NIL
c. Number of complaints pending as on end of the financial year- NIL
17. Discretionary Requirements
The status of discretionary requirements as per Regulation 27(1) of SEBI Listing Regulations, 2015 is as follows:-
A. The Board: The Board is headed by a non-executive Chairperson. However, no expenditure are claimed by Chairperson for reimbursement.
B. Shareholder Rights: The quarterly/half-yearly/annual financial results of the Company are published in leading newspapers as mentioned under the heading “Means of Communication” of the Corporate Governance Report and also displayed on the website of the Company. The annual financial statements are separately circulated to the shareholders.
C. Modified Opinion (s) in audit report: The audit report on the financial statements have been issued with an unmodified audit opinion.
D. Separate post of Chairman and CEO: Shri Deepak Amitabh is the Chairman of the Company and Dr. Pawan Singh is the Managing Director and CEO of the Company. The Company has complied with the requirement of having separate persons to the post of Chairman and Managing Director & CEO.
E. Reporting of Internal Auditor: The Internal Auditor reports directly to the Audit Committee.
18. DISCLOSURES WITH RESPECT TO DEMAT SUSPENSE ACCOUNT/ UNCLAIMED SUSPENSE ACCOUNT
S. No.
Particulars No. of Shares
1 Aggregate number of Shareholders and the outstanding shares in the suspense account lying at beginning of the year
1000 shares held by 1
shareholder
2 Number of Shareholders who approached issuer for transfer of shares from suspense account during the year
-
3 Number of shareholders to whom shares were transferred from suspense account during the year
-
4 Aggregate number of shareholders and the outstanding shares in the suspense account lying at the end of the year
1000 shares held by 1
shareholder
The voting rights on these shares shall remain frozen till the rightful owner of such shares claims the share.
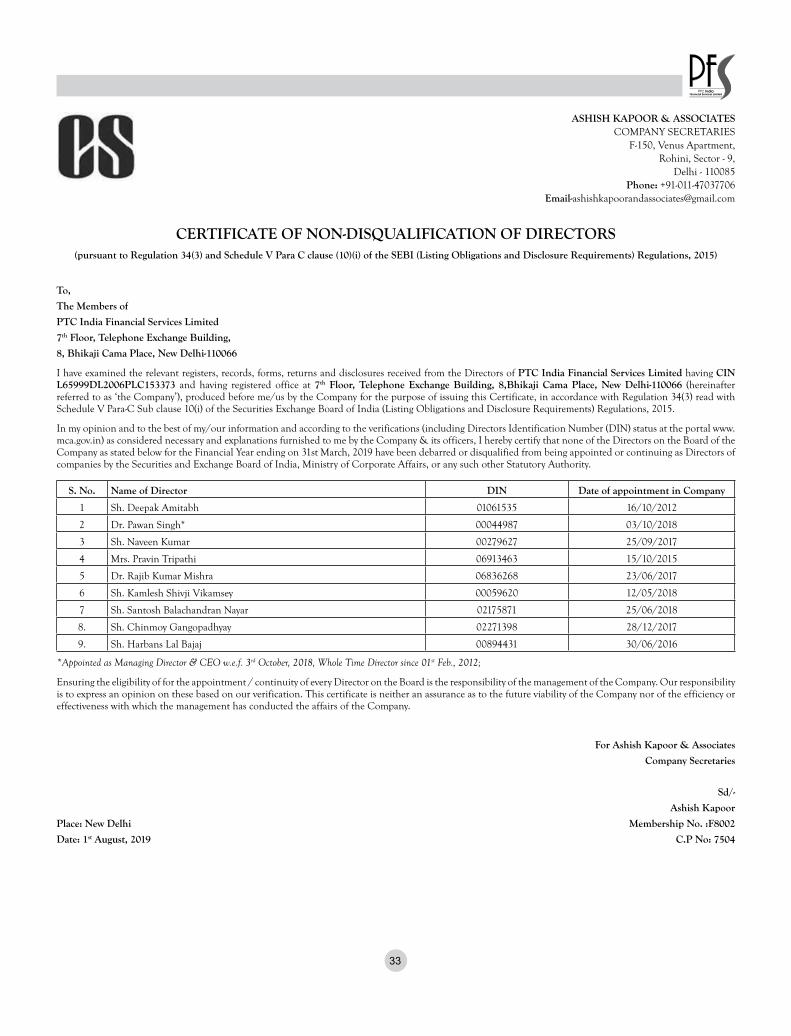
33
CERTIFICATE OF NON-DISQUALIFICATION OF DIRECTORS(pursuant to Regulation 34(3) and Schedule V Para C clause (10)(i) of the SEBI (Listing Obligations and Disclosure Requirements) Regulations, 2015)
To,
The Members of
PTC India Financial Services Limited
7th Floor, Telephone Exchange Building,
8, Bhikaji Cama Place, New Delhi-110066
I have examined the relevant registers, records, forms, returns and disclosures received from the Directors of PTC India Financial Services Limited having CIN L65999DL2006PLC153373 and having registered office at 7th Floor, Telephone Exchange Building, 8,Bhikaji Cama Place, New Delhi-110066 (hereinafter referred to as ‘the Company’), produced before me/us by the Company for the purpose of issuing this Certificate, in accordance with Regulation 34(3) read with Schedule V Para-C Sub clause 10(i) of the Securities Exchange Board of India (Listing Obligations and Disclosure Requirements) Regulations, 2015.
In my opinion and to the best of my/our information and according to the verifications (including Directors Identification Number (DIN) status at the portal www.mca.gov.in) as considered necessary and explanations furnished to me by the Company & its officers, I hereby certify that none of the Directors on the Board of the Company as stated below for the Financial Year ending on 31st March, 2019 have been debarred or disqualified from being appointed or continuing as Directors of companies by the Securities and Exchange Board of India, Ministry of Corporate Affairs, or any such other Statutory Authority.
S. No. Name of Director DIN Date of appointment in Company
1 Sh. Deepak Amitabh 01061535 16/10/2012
2 Dr. Pawan Singh* 00044987 03/10/2018
3 Sh. Naveen Kumar 00279627 25/09/2017
4 Mrs. Pravin Tripathi 06913463 15/10/2015
5 Dr. Rajib Kumar Mishra 06836268 23/06/2017
6 Sh. Kamlesh Shivji Vikamsey 00059620 12/05/2018
7 Sh. Santosh Balachandran Nayar 02175871 25/06/2018
8. Sh. Chinmoy Gangopadhyay 02271398 28/12/2017
9. Sh. Harbans Lal Bajaj 00894431 30/06/2016
*Appointed as Managing Director & CEO w.e.f. 3rd October, 2018, Whole Time Director since 01st Feb., 2012;
Ensuring the eligibility of for the appointment / continuity of every Director on the Board is the responsibility of the management of the Company. Our responsibility is to express an opinion on these based on our verification. This certificate is neither an assurance as to the future viability of the Company nor of the efficiency or effectiveness with which the management has conducted the affairs of the Company.
For Ashish Kapoor & Associates
Company Secretaries
Sd/-
Ashish Kapoor
Place: New Delhi Membership No. :F8002
Date: 1st August, 2019 C.P No: 7504
ASHISH KAPOOR & ASSOCIATESCOMPANY SECRETARIES
F-150, Venus Apartment,Rohini, Sector - 9,
Delhi - 110085Phone: +91-011-47037706

34
TO THE MEMBERS OF PTC INDIA FINANCIAL SERVICES LIMITED
INDEPENDENT AUDITOR’S CERTIFICATE ON CORPORATE GOVERNANCE
1. This certificate is issued in accordance with the terms of our engagement letter dated October 15, 2018.
2. We, Deloitte Haskins & Sells, Chartered Accountants, the Statutory Auditors of PTC India Financial Services Limited (“the Company”), have examined the compliance of conditions of Corporate Governance by the Company, for the year ended on March 31, 2019, as stipulated in regulations 17 to 27 and clauses (b) to (i) of regulation 46(2) and para C and D of Schedule V of the SEBI (Listing Obligations and Disclosure Requirements) Regulations, 2015 (the Listing Regulations).
Managements’ Responsibility
3. The compliance of conditions of Corporate Governance is the responsibility of the Management. This responsibility includes the design, implementation and maintenance of internal control and procedures to ensure the compliance with the conditions of the Corporate Governance stipulated in Listing Regulations.
Auditor’s Responsibility
4. Our responsibility is limited to examining the procedures and implementation thereof, adopted by the Company for ensuring compliance with the conditions of the Corporate Governance. It is neither an audit nor an expression of opinion on the financial statements of the Company.
5. We have examined the books of account and other relevant records and documents maintained by the Company for the purposes of providing reasonable assurance on the compliance with Corporate Governance requirements by the Company.
6. We have carried out an examination of the relevant records of the Company in accordance with the Guidance Note on Certification of Corporate Governance issued by the Institute of the Chartered Accountants of India (the ICAI), the Standards on Auditing specified under Section 143(10) of the Companies Act 2013, in so far as applicable for the purpose of this certificate and as per the Guidance Note on Reports or Certificates for Special Purposes issued by the ICAI which requires that we comply with the ethical requirements of the Code of Ethics issued by the ICAI.
7. We have complied with the relevant applicable requirements of the Standard on Quality Control (SQC) 1, Quality Control for Firms that Perform Audits and Reviews of Historical Financial Information, and Other Assurance and Related Services Engagements.
Qualified Opinion
8. Based on our examination of the relevant records and according to the information and explanations provided to us and the representations provided by the Management, we certify that except for the requirement of at least half of the board of directors consisting of independent directors not being met by the Company during the period April 1, 2018 to September 18, 2018, as stated in proviso of Regulation 17(1)(b) of the Listing Regulations, the Company has complied with the conditions of Corporate Governance as stipulated in regulations 17 to 27 and clauses (b) to (i) of regulation 46(2) and para C and D of Schedule V of the Listing Regulations during the year ended March 31, 2019.
9. We state that such compliance is neither an assurance as to the future viability of the Company nor the efficiency or effectiveness with which the Management has conducted the affairs of the Company.
For DELOITTE HASKINS & SELLSChartered Accountants
(Firm Registration No.015125N)
Sd/-Jitendra Agarwal
Place: Gurugram PartnerDate: 28th August, 2019 (Membership No. 87104)
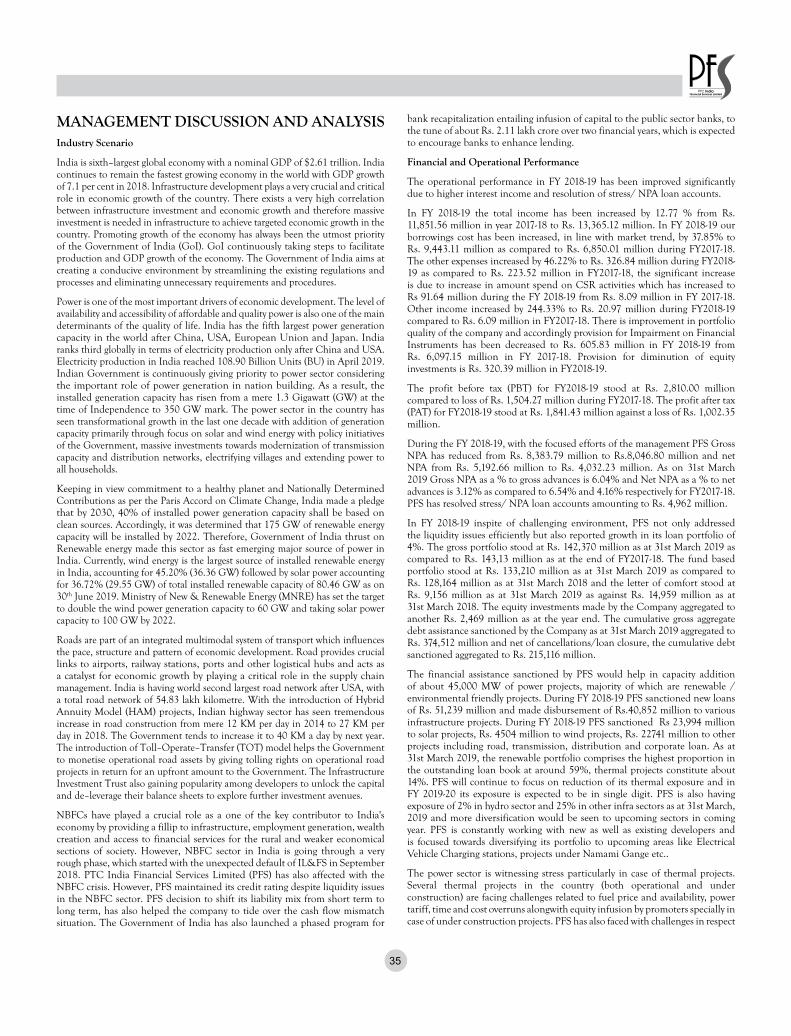
35
MANAGEMENT DISCUSSION AND ANALYSISIndustry Scenario
India is sixth–largest global economy with a nominal GDP of $2.61 trillion. India continues to remain the fastest growing economy in the world with GDP growth of 7.1 per cent in 2018. Infrastructure development plays a very crucial and critical role in economic growth of the country. There exists a very high correlation between infrastructure investment and economic growth and therefore massive investment is needed in infrastructure to achieve targeted economic growth in the country. Promoting growth of the economy has always been the utmost priority of the Government of India (GoI). GoI continuously taking steps to facilitate production and GDP growth of the economy. The Government of India aims at creating a conducive environment by streamlining the existing regulations and processes and eliminating unnecessary requirements and procedures.
Power is one of the most important drivers of economic development. The level of availability and accessibility of affordable and quality power is also one of the main determinants of the quality of life. India has the fifth largest power generation capacity in the world after China, USA, European Union and Japan. India ranks third globally in terms of electricity production only after China and USA. Electricity production in India reached 108.90 Billion Units (BU) in April 2019. Indian Government is continuously giving priority to power sector considering the important role of power generation in nation building. As a result, the installed generation capacity has risen from a mere 1.3 Gigawatt (GW) at the time of Independence to 350 GW mark. The power sector in the country has seen transformational growth in the last one decade with addition of generation capacity primarily through focus on solar and wind energy with policy initiatives of the Government, massive investments towards modernization of transmission capacity and distribution networks, electrifying villages and extending power to all households.
Keeping in view commitment to a healthy planet and Nationally Determined Contributions as per the Paris Accord on Climate Change, India made a pledge that by 2030, 40% of installed power generation capacity shall be based on clean sources. Accordingly, it was determined that 175 GW of renewable energy capacity will be installed by 2022. Therefore, Government of India thrust on Renewable energy made this sector as fast emerging major source of power in India. Currently, wind energy is the largest source of installed renewable energy in India, accounting for 45.20% (36.36 GW) followed by solar power accounting for 36.72% (29.55 GW) of total installed renewable capacity of 80.46 GW as on 30th June 2019. Ministry of New & Renewable Energy (MNRE) has set the target to double the wind power generation capacity to 60 GW and taking solar power capacity to 100 GW by 2022.
Roads are part of an integrated multimodal system of transport which influences the pace, structure and pattern of economic development. Road provides crucial links to airports, railway stations, ports and other logistical hubs and acts as a catalyst for economic growth by playing a critical role in the supply chain management. India is having world second largest road network after USA, with a total road network of 54.83 lakh kilometre. With the introduction of Hybrid Annuity Model (HAM) projects, Indian highway sector has seen tremendous increase in road construction from mere 12 KM per day in 2014 to 27 KM per day in 2018. The Government tends to increase it to 40 KM a day by next year. The introduction of Toll–Operate–Transfer (TOT) model helps the Government to monetise operational road assets by giving tolling rights on operational road projects in return for an upfront amount to the Government. The Infrastructure Investment Trust also gaining popularity among developers to unlock the capital and de–leverage their balance sheets to explore further investment avenues.
NBFCs have played a crucial role as a one of the key contributor to India's economy by providing a fillip to infrastructure, employment generation, wealth creation and access to financial services for the rural and weaker economical sections of society. However, NBFC sector in India is going through a very rough phase, which started with the unexpected default of IL&FS in September 2018. PTC India Financial Services Limited (PFS) has also affected with the NBFC crisis. However, PFS maintained its credit rating despite liquidity issues in the NBFC sector. PFS decision to shift its liability mix from short term to long term, has also helped the company to tide over the cash flow mismatch situation. The Government of India has also launched a phased program for
bank recapitalization entailing infusion of capital to the public sector banks, to the tune of about Rs. 2.11 lakh crore over two financial years, which is expected to encourage banks to enhance lending.
Financial and Operational Performance
The operational performance in FY 2018-19 has been improved significantly due to higher interest income and resolution of stress/ NPA loan accounts.
In FY 2018-19 the total income has been increased by 12.77 % from Rs. 11,851.56 million in year 2017-18 to Rs. 13,365.12 million. In FY 2018-19 our borrowings cost has been increased, in line with market trend, by 37.85% to Rs. 9,443.11 million as compared to Rs. 6,850.01 million during FY2017-18. The other expenses increased by 46.22% to Rs. 326.84 million during FY2018-19 as compared to Rs. 223.52 million in FY2017-18, the significant increase is due to increase in amount spend on CSR activities which has increased to Rs 91.64 million during the FY 2018-19 from Rs. 8.09 million in FY 2017-18. Other income increased by 244.33% to Rs. 20.97 million during FY2018-19 compared to Rs. 6.09 million in FY2017-18. There is improvement in portfolio quality of the company and accordingly provision for Impairment on Financial Instruments has been decreased to Rs. 605.83 million in FY 2018-19 from Rs. 6,097.15 million in FY 2017-18. Provision for diminution of equity investments is Rs. 320.39 million in FY2018-19.
The profit before tax (PBT) for FY2018-19 stood at Rs. 2,810.00 million compared to loss of Rs. 1,504.27 million during FY2017-18. The profit after tax (PAT) for FY2018-19 stood at Rs. 1,841.43 million against a loss of Rs. 1,002.35 million.
During the FY 2018-19, with the focused efforts of the management PFS Gross NPA has reduced from Rs. 8,383.79 million to Rs.8,046.80 million and net NPA from Rs. 5,192.66 million to Rs. 4,032.23 million. As on 31st March 2019 Gross NPA as a % to gross advances is 6.04% and Net NPA as a % to net advances is 3.12% as compared to 6.54% and 4.16% respectively for FY2017-18. PFS has resolved stress/ NPA loan accounts amounting to Rs. 4,962 million.
In FY 2018-19 inspite of challenging environment, PFS not only addressed the liquidity issues efficiently but also reported growth in its loan portfolio of 4%. The gross portfolio stood at Rs. 142,370 million as at 31st March 2019 as compared to Rs. 143,13 million as at the end of FY2017-18. The fund based portfolio stood at Rs. 133,210 million as at 31st March 2019 as compared to Rs. 128,164 million as at 31st March 2018 and the letter of comfort stood at Rs. 9,156 million as at 31st March 2019 as against Rs. 14,959 million as at 31st March 2018. The equity investments made by the Company aggregated to another Rs. 2,469 million as at the year end. The cumulative gross aggregate debt assistance sanctioned by the Company as at 31st March 2019 aggregated to Rs. 374,512 million and net of cancellations/loan closure, the cumulative debt sanctioned aggregated to Rs. 215,116 million.
The financial assistance sanctioned by PFS would help in capacity addition of about 45,000 MW of power projects, majority of which are renewable / environmental friendly projects. During FY 2018-19 PFS sanctioned new loans of Rs. 51,239 million and made disbursement of Rs.40,852 million to various infrastructure projects. During FY 2018-19 PFS sanctioned Rs 23,994 million to solar projects, Rs. 4504 million to wind projects, Rs. 22741 million to other projects including road, transmission, distribution and corporate loan. As at 31st March 2019, the renewable portfolio comprises the highest proportion in the outstanding loan book at around 59%, thermal projects constitute about 14%. PFS will continue to focus on reduction of its thermal exposure and in FY 2019-20 its exposure is expected to be in single digit. PFS is also having exposure of 2% in hydro sector and 25% in other infra sectors as at 31st March, 2019 and more diversification would be seen to upcoming sectors in coming year. PFS is constantly working with new as well as existing developers and is focused towards diversifying its portfolio to upcoming areas like Electrical Vehicle Charging stations, projects under Namami Gange etc..
The power sector is witnessing stress particularly in case of thermal projects. Several thermal projects in the country (both operational and under construction) are facing challenges related to fuel price and availability, power tariff, time and cost overruns alongwith equity infusion by promoters specially in case of under construction projects. PFS has also faced with challenges in respect

36
of such projects. As at 31st March 2019, the non-performing loans portfolio stood at Rs. 8,047 million, one thermal power project having aggregate loan outstanding of Rs. 3,284 million is under corrective action plan (SDR/OSDR) and projects having aggregate loan outstanding of Rs. 2,071 million faced delays in commencement of commercial operations and have been classified as Standard Restructured Assets. The Company continues to regularly monitor the progress and operations of the assisted projects through its comprehensive project monitoring mechanism. The company is having Rs. 110,087 million of projects which are operation and commissioned and consisting 82.64% of its total loan outstanding: projects of Rs. 66,079 million is having more than one year satisfactory conduct post their respective commissioning.
The Company has complied with all the norms prescribed by the Reserve Bank of India including the Fair Practices, AML/CFT & Know Your Customer (KYC) guidelines and also all mandatory accounting standards notified by the Central Government under the Companies (Accounting Standards) Rules, 2006.
Risk Management:
PFS’s risk management framework is based on clear understanding of various risks, disciplined risk assessment and measurement procedures and continuous monitoring.
The Board of Directors of PFS has oversight of all risk assumed by PFS with specific committees of the board constituted to facilitate focussed risk management. There is adequate representation of independent directors on each of these committees. The proceedings and decisions of these Committees are reported to the Board. The policies approved by the Board of Directors or Committees of the Board from time to time constitute the governing framework within which business activities are undertaken.
The hallmark of PFS’s Risk Management function is that it is independent of the business sourcing unit with the convergence only at MD level.
The key risks that PFS is exposed to in the course of business are Credit Risk, Market Risk, Liquidity Risk and Operational Risk. These risks not only have a bearing on PFS’s financial strength and operations but also its reputation.
Credit Risk:
PFS’s core business is lending, which exposes it to various types of credit risk especially failure in repayments and increase in non-performing loans. PFS measures, monitors and manages credit risk at an individual borrower level and at the portfolio level. In the last few years, PFS has strengthened its credit risk management framework by adopting Early Warning Signal Framework (EWS Framework) and introducing sector specific credit risk grading framework.
Further, PFS rigorously adhers to RBI mandated prudential norms on provisioning of stressed assets and has adopted stringent approach in taking aggressive provisioning thereby preserving the shareholder value. During the year, PFS has worked on the resolution of the stressed assets portfolio and has significantly reduced the quantum of stress assets.
Market Risk:
Liquidity Risk is the risk that PFS may not be able to meet its short term financial obligation due to an asset liability mismatch or interest rate fluctuation.
PFS’s framework for liquidity and interest rate risk management is spelt out in its Asset Liability Management Policy that is implemented, monitored and periodically reviewed by ALCO. ALCO provides guidance for management of liquidity of PFS and the management of interest rate risk within the broad parameters laid down by the Board of Directors/RMC.
Operational Risk:
There is a risk of loss resulting from inadequate or failed internal processes, people or systems or from external events. This could include fraud or other misconduct by employees or outsiders, unauthorised transactions by employees and third parties, misreporting or non-reporting with respect to statutory, legal or regulatory reporting and disclosure obligations, operational errors including clerical and record keeping and system failures.
PFS had Operational Risk Management Policy that covers the system of internal controls, systems and procedures to monitor transactions, key back-up procedures and undertakes regular contingency planning.
Policy for Investment of Surplus Funds
The policy of investment of surplus funds i.e. treasury policy provides the framework for managing investment of surplus funds. Realizing that the purpose of mobilization of resources in the Company is to finance equity as well as loans to power sector projects, the prime focus is to deploy surplus funds with a view to ensure that the capital is not eroded and that surplus funds earn optimal returns.
Apart from these policies there are various guidelines to help understand and mitigate different kinds of other risks. These include Operational Policy, Business Continuity Policy and the like.
Monitoring Mechanism
To monitor the status of funded projects, a robust monitoring mechanism has been put in place. The projects are monitored by a separate monitoring team. Further, a detailed status report on investments and debt assisted project is presented periodically in the Audit Committee/ Board of Directors meeting of PFS. Further, through early warning signal system, critical parameters related to financial, technical, regulatory, management and other aspects of the projects are continuously monitored. A status report on both debt and equity projects is also presented to the Board of Directors of PFS periodically (at least quarterly) to ensure that directors are kept informed about the developments in the projects especially about any areas of concerns.
The power sector is witnessing stress and several projects in the country (both operational and under construction) are facing challenges and portfolio of PFS is also affected due to stress in sector. The Company is continuously engaged in resolution of such loans and is working proactively with the consortium members. Regular lenders’ meetings are conducted, detailed feedback obtained from lenders’ independent engineers and financial advisors to see that project development activities may be continued unhindered. Discussions are held with promoters’ and other stakeholders to work out a financially viable solution. The Company also engages consultants / professional agencies for working out effective solution / resolution for such cases.
Outlook
India is the fastest–growing trillion–dollar economy in the world after USA, China, Japan, Germany and United Kingdom. As per the IMF projection, India is poised to become the fifth–largest economy overtaking the United Kingdom by 2019. India is projected to grow at faster pace at 7.3 percent in 2019 and 7.5 percent in 2020 supported by the continued recovery of investment and robust consumption amid a more expansionary stance of monetary policy and some expected impetus from fiscal policy as per International Monetary Fund (IMF). India continues to be the fastest growing emerging market economies in the world, driven by key structural reforms and further reduction in external vulnerabilities. Government of India has retained its focus on fiscal consolidation and implementing structural reforms for further growth in Infrastructure sector in general.
The Government of India recent move to allow Public Private Partnership in sectors like water sanitation, railways and other sector has opened more avenues to Private sector. The mix of Public Private Participation model is continuously increasing, thereby increasing confidence, support and investment in infrastructure sector. India infrastructure sector is looking towards paradigm shift as some of the timely completion of projects as against the general phenomenon of delay in completion of projects due to delay in obtaining approval and clearances, lack of co–ordination between various departments resultant delay in project completion.
Power will remain as one of the most important components of infrastructure, crucial for economic growth and welfare of the country. The total installed capacity in the country crossed the 357 GW mark with installed capacity of renewable energy of 80.46 MW as at 30th June 2019. The renewable power sector saw moderated capacity addition during FY–19 after recording highest capacity additions in solar and wind installed capacity during FY–18 due to imposition

37
of safeguard duty, continuously decreasing tariff, cap of tariff caps and lack of clarity on the classification of solar modules, inverters and EPC contracts, for the purpose of GST and consolidation in solar power sector. However, with the formation of new Government and clarity emerged on safeguard duty, it is expected that the renewable sector will achieve its target capacity of 175GW by 2022.
In addition to renewable power sector, other areas such as power transmission, roads and highways, ports, airports etc. are also witnessing action. Infrastructure sector plays a very crucial role in economic development and possesses the potential for propelling overall development of the country. The sector continues to enjoy focus from Government both in terms of policy related initiatives and development of infrastructure in the country. New projects are being undertaken and government is poised to ensure all round development of the infrastructure sector of the country.
With the introduction of innovative project implementation mode like Hybrid Annuity Model (HAM), revised concession agreement, Enhanced Inter–Ministerial coordination, digitizing the entire process of land acquisition through Web Portal to expedite land acquisition, promotion of Infrastructure Investment Trust to unlock equity capital and de–leverage the balance sheet of developers has helped the Government to increase the pace of highway construction in India. Road corridor project Bharatmala, Pradhan Mantri Gram Sadak Yojana, port–linked industrialization plan Sagarmala and UDAN will help improving transport infrastructure and bring fresh investment in the sector.
PFS believes that recent announcement made during Budget by finance minister to provide a one–time partial credit guarantee to PSBs to buy high–rated pooled assets of financially sound NBFCs and allow Foreign Institutional and Portfolio Investors to invest in debt securities offered by non–banking financial companies (NBFC) will help to boost the investors’ confidence in NBFC sector and will also
help NBFCs, which have been going through a liquidity crisis, to raise funds.
The power and infrastructure sector is witnessing stress and several projects in the country (both operational and under construction) are facing challenges. The Company is continuously engaged in resolution of such loans and working proactively with the consortium of lending member banks/FIs of respective projects. Regular lenders’ meetings are conducted, detailed feedback obtained from lenders’ independent engineers and financial advisors to see that project development activities may be continued unhindered. Discussions are held with promoters’ and other stakeholders to work out a financially viable solution. The Company also engages consultants / professional agencies for working out effective solution / resolution for such cases.
The Company continues to partner with credible players in the industry who can help all the stakeholders to benefit mutually PFS believes that the infrastructure development and renewable energy area offers good potential and Company continues to evaluate these business proposals in these areas.
PFS also believes that public private partnership in infrastructure development offers good potential and company continues to evaluate these business proposals in these areas. PFS views that the growth momentum will increase with the formation of stable government at the center and expects that the balance growth momentum with the change in sectoral macro economic environment. The debt commitments and disbursements have been moderated during the year and it is expected to continue considering the on going liquidity issues with the Banking/NBFC sector.
Cautionary Note
Certain statements in the “Management Discussion and analysis” section may be forward looking and are stated as required by applicable laws and regulations. Many factors may affect the actual results, which could be different from what the Management envisages in terms of future performance and outlook.

38
Annexure– 1
Form No. MGT–9EXTRACT OF ANNUAL RETURN
as on the financial year ended on 31st March, 2019of
PTC INDIA FINANCIAL SERVICES LIMITED
[Pursuant to Section 92(1) of the Companies Act, 2013 and rule 12(1) of the Companies(Management and Administration) Rules, 2014]
I. REGISTRATION AND OTHER DETAILS
I CIN L65999DL2006PLC153373
ii Registration Date (incorporation date) 08/09/2006
iii Name of the Company PTC India Financial Services Ltd.
iv Category / Sub–Category of the Company NBFC ND–SI
v Address of the Registered Office and contact details Registered Office: 7th Floor, Telephone Exchange Building, 8 Bhikaji Cama Place, New Delhi – 110 066, India
Contact details: Board: +91 11 26737300 / 26737400 Fax: 26737373 / 26737374, Website: www. ptcfinancial.com, E–mail: [email protected]
vi Whether listed company Yes
vii Name, Address and contact details of Registrar & Transfer Agents (RTA), if any
Karvy Fintech Private Limited Karvy Selenium Tower B, Plot 31–32, Gachibowli, Financial District, Nanakramguda, Hyderabad – 500 032 Fax: +91 40 23001152, Toll Free No : 1800–345–4001E–mail: [email protected]: www.karvycomputershare.com
II. PRINCIPAL BUSINESS ACTIVITIES OF THE COMPANY
All the business activities contributing 10 % or more of the total turnover of the company shall be stated:–
Sl. No. Name and Description of main products / services NIC Code of the
Product/ service% to total turnover
of the company
1. The Company provide total financial services to the entities in energy value chain, which inter–alia includes investing in equity and/or extending debt to power projects in generation, transmission, distribution; fuel sources, fuel related infrastructure like gas pipelines, LNG terminals, ports, equipment manufacturers and EPC contractors etc. The Company also provides non–fund based financial services adding value to green field and brown field projects at various stages of growth and development.
651 100%
III. PARTICULARS OF HOLDING, SUBSIDIARY AND ASSOCIATE COMPANIES
S.No.
Name And Address of the Company CIN/GLN Holding/ Subsidiary/Associate
% of sharesheld
ApplicableSection
1. PTC India Limited2nd Floor, NBCC Tower, 15, Bhikaji Cama Place, New Delhi – 110066
L40105DL1999PLC099328 Holding 64.99 2(46)
3 Varam Bio Energy Pvt. Limited B–32, Steel & Mines Complex,Srinagar Colony, Hyderabad
U40108TG2002PTC038381 Associate 26 2(6)
4 R S India Wind Energy Pvt. LimitedG.L. Business Center, Old GurgaonRoad, Dundahera, Haryana
U40101HR2006PTC049781 Associate 37 2(6)

39
IV. SHARE HOLDING PATTERN (EQUITY SHARE CAPITAL BREAKUP AS PERCENTAGE OF TOTAL EQUITY)
(i) Category–wise Share Holding
CATEGORY CODE
CATEGORY OF SHAREHOLDER NO. OF SHARES HELD AT THE BEGINNING OF THE YEAR 31/03/2018
NO. OF SHARES HELD AT THE END OF THE YEAR 30/03/2019
% CHANGE DURING
THE YEAR
DEMAT PHYSICAL TOTAL % OF TOTAL
SHARES
DEMAT PHYSICAL TOTAL % OF TOTAL
SHARES
(I) (II) (III) (IV) (V) (VI) (VII) (VIII) (IX) (X) (XI)
(A) PROMOTER AND PROMOTER GROUP
(1) INDIAN
(a) Individual /HUF 0 0 0 0.00 0 0 0 0.00 –64.99
(b) Central Government/State Government(s) 0 0 0 0.00 0 0 0 0.00 0.00
(c) Bodies Corporate 417450001 0 417450001 64.99 417450001 0 417450001 64.99 64.99
(d) Financial Institutions / Banks 0 0 0 0.00 0 0 0 0.00 0.00
(e) Others 0 0 0 0.00 0 0 0 0.00 0.00
Sub–Total A(1) : 417450001 0 417450001 64.99 417450001 0 417450001 64.99 0.00
(2) FOREIGN
(a) Individuals (NRIs/Foreign Individuals) 0 0 0 0.00 0 0 0 0.00 0.00
(b) Bodies Corporate 0 0 0 0.00 0 0 0 0.00 0.00
(c) Institutions 0 0 0 0.00 0 0 0 0.00 0.00
(d) Qualified Foreign Investor 0 0 0 0.00 0 0 0 0.00 0.00
(e) Others 0 0 0 0.00 0 0 0 0.00 0.00
Sub–Total A(2) : 0 0 0 0.00 0 0 0 0.00 0.00
Total A=A(1)+A(2) 417450001 0 417450001 64.99 417450001 0 417450001 64.99 0.00
(B) PUBLIC SHAREHOLDING
(1) INSTITUTIONS
(a) Mutual Funds /UTI 929840 0 929840 0.14 23334 0 23334 0.00 0.14
(b) Financial Institutions /Banks 747580 0 747580 0.12 1035822 0 1035822 0.16 –0.04
(c) Central Government / State Government(s) 0 0 0 0.00 0 0 0 0.00 0.00
(d) Venture Capital Funds 0 0 0 0.00 0 0 0 0.00 0.00
(e) Insurance Companies 14682595 0 14682595 2.29 14682595 0 14682595 2.29 0.00
(f) Foreign Institutional Investors 16936723 0 16936723 2.64 10370100 0 10370100 1.61 1.02
(g) Foreign Venture Capital Investors 0 0 0 0.00 0 0 0 0.00 0.00
(h) Qualified Foreign Investor 0 0 0 0.00 0 0 0 0.00 0.00
(i) Others 0 0 0 0.00 0 0 0 0.00 0.00
Sub–Total B(1) : 33296738 0 33296738 5.18 26111851 0 26111851 4.07 1.12
(2) NON–INSTITUTIONS
(a) Bodies Corporate 22388473 0 22388473 3.49 19410850 0 19410850 3.02 0.46
(b) Individuals
(i) Individuals holding nominal share capital upto Rs.2 lakh
113379493 35395 113414888 17.66 117959267 32582 117991849 18.37 –0.71
(ii) Individuals holding nominal share capital in excess of Rs.2 lakh
43851518 0 43851518 6.83 49818894 0 49818894 7.76 –0.93
(c) Others
CLEARING MEMBERS 1209252 0 1209252 0.19 784792 0 784792 0.12 0.07
NON RESIDENT INDIANS 8770355 0 8770355 1.37 8796551 0 8796551 1.37 0.00
NRI NON–REPATRIATION 1873639 0 1873639 0.29 1889076 0 1889076 0.29 0.00
TRUSTS 28471 0 28471 0.00 29471 0 29471 0.00 0.00
(d) Qualified Foreign Investor 0 0 0 0.00 0 0 0 0.00 0.00
Sub–Total B(2) : 191501201 35395 191536596 29.82 198688901 32582 198721483 30.94 –1.12
Total B=B(1)+B(2): 224797939 35395 224833334 35.01 224800752 32582 224833334 35.01 0.00
Total (A+B) : 642247940 35395 642283335 100.00 642250753 32582 642283335 100.00 0.00
(C) Shares held by custodians, against which
Depository Receipts have been issued
(1) Promoter and Promoter Group
(2) Public 0 0 0 0.00 0 0 0 0.00 0.00
GRAND TOTAL (A+B+C) : 642247940 35395 642283335 100.00 642250753 32582 642283335 100.00

40
(ii) Shareholding of Promoters
SNo.
Shareholder’sName
Shareholding at the beginningof the year
Shareholding at the end of theyear
% change in shareholding during
the year
No. ofShares
% ofTotal Shares
of the company
%of SharesPledged /
encumberedto totalshares
No. ofShares
% ofTotal Shares
of the company
% of SharesPledged /
encumberedto totalshares
1. PTC India Limited 417450001 64.99 0 417450001 64.99 0 0
(iii) Change in Promoters’ Shareholding: During the period under review, there has been no change in the Promoter Shareholding.
(iv) Shareholding Pattern of top ten Shareholders from 01/04/2018 – 31/03/2019 (other than Directors, Promoters and Holders of GDRs and ADRs):
SHAREHOLDING PATTERN OF TOP 10 SHAREHOLDERS BETWEEN 31/03/2018 AND 30/03/2019
Sl no
Folio/
Dpid–Clientid
Category
Type
Shareholding at the begginning of the Year
Date
Increase/
Decrease in share holding
Reason
Cumulative Shareholding during the Year
Name of the Share Holder
No of Shares % of total shares of the
company
No of Shares
% of total shares of the
company
1
AABCP7947F PBC Opening Balance
PTC INDIA LIMITED 417450001 64.99 31/03/2018 417450001 64.99
Closing Balance
30/03/2019 417450001 64.99
2
AAACL0582H INS Opening Balance
LIFE INSURANCE CORPORATION OF INDIA
13682595 2.13 31/03/2018 13682595 2.13
Closing Balance
30/03/2019 13682595 2.13
3
AACCD1578M FPI Opening Balance
DIMENSIONAL EMERGING MARKETS VALUE FUND
2660009 0.41 31/03/2018 2660009 0.41
Closing Balance
30/03/2019 2660009 0.41
4
AACCD1644G FPI Opening Balance
EMERGING MARKETS CORE EQUITY PORTFOLIO (THE PORTFO
2419812 0.38 31/03/2018 2419812 0.38
Sale 04/01/2019 –97446 Transfer 2322366 0.36
Closing Balance
30/03/2019 2322366 0.36
5
AAHTS0174J FPI Opening Balance
STATE STREET EMERGING MARKETS SMALL CAP ACTIVE NON
1791084 0.28 31/03/2018 1791084 0.28
Sale 03/08/2018 –84657 Transfer 1706427 0.27
Sale 10/08/2018 –495149 Transfer 1211278 0.19
Sale 17/08/2018 –208594 Transfer 1002684 0.16
Sale 14/09/2018 –475370 Transfer 527314 0.08
Sale 21/09/2018 –527314 Transfer 0 0.00
Closing Balance
30/03/2019 0 0.00
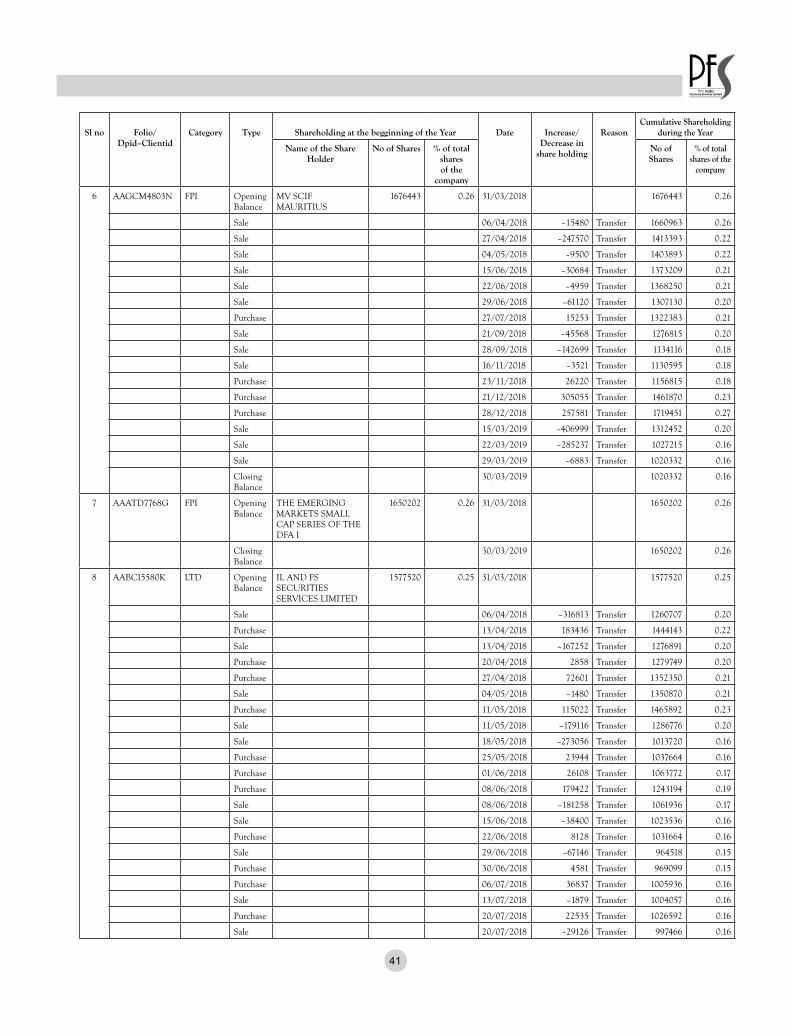
41
Sl no
Folio/
Dpid–Clientid
Category
Type
Shareholding at the begginning of the Year
Date
Increase/
Decrease in share holding
Reason
Cumulative Shareholding during the Year
Name of the Share Holder
No of Shares % of total shares of the
company
No of Shares
% of total shares of the
company
6
AAGCM4803N FPI Opening Balance
MV SCIF MAURITIUS
1676443 0.26 31/03/2018 1676443 0.26
Sale 06/04/2018 –15480 Transfer 1660963 0.26
Sale 27/04/2018 –247570 Transfer 1413393 0.22
Sale 04/05/2018 –9500 Transfer 1403893 0.22
Sale 15/06/2018 –30684 Transfer 1373209 0.21
Sale 22/06/2018 –4959 Transfer 1368250 0.21
Sale 29/06/2018 –61120 Transfer 1307130 0.20
Purchase 27/07/2018 15253 Transfer 1322383 0.21
Sale 21/09/2018 –45568 Transfer 1276815 0.20
Sale 28/09/2018 –142699 Transfer 1134116 0.18
Sale 16/11/2018 –3521 Transfer 1130595 0.18
Purchase 23/11/2018 26220 Transfer 1156815 0.18
Purchase 21/12/2018 305055 Transfer 1461870 0.23
Purchase 28/12/2018 257581 Transfer 1719451 0.27
Sale 15/03/2019 –406999 Transfer 1312452 0.20
Sale 22/03/2019 –285237 Transfer 1027215 0.16
Sale 29/03/2019 –6883 Transfer 1020332 0.16
Closing Balance
30/03/2019 1020332 0.16
7
AAATD7768G FPI Opening Balance
THE EMERGING MARKETS SMALL CAP SERIES OF THE DFA I
1650202 0.26 31/03/2018 1650202 0.26
Closing Balance
30/03/2019 1650202 0.26
8
AABCI5580K LTD Opening Balance
IL AND FS SECURITIES SERVICES LIMITED
1577520 0.25 31/03/2018 1577520 0.25
Sale 06/04/2018 –316813 Transfer 1260707 0.20
Purchase 13/04/2018 183436 Transfer 1444143 0.22
Sale 13/04/2018 –167252 Transfer 1276891 0.20
Purchase 20/04/2018 2858 Transfer 1279749 0.20
Purchase 27/04/2018 72601 Transfer 1352350 0.21
Sale 04/05/2018 –1480 Transfer 1350870 0.21
Purchase 11/05/2018 115022 Transfer 1465892 0.23
Sale 11/05/2018 –179116 Transfer 1286776 0.20
Sale 18/05/2018 –273056 Transfer 1013720 0.16
Purchase 25/05/2018 23944 Transfer 1037664 0.16
Purchase 01/06/2018 26108 Transfer 1063772 0.17
Purchase 08/06/2018 179422 Transfer 1243194 0.19
Sale 08/06/2018 –181258 Transfer 1061936 0.17
Sale 15/06/2018 –38400 Transfer 1023536 0.16
Purchase 22/06/2018 8128 Transfer 1031664 0.16
Sale 29/06/2018 –67146 Transfer 964518 0.15
Purchase 30/06/2018 4581 Transfer 969099 0.15
Purchase 06/07/2018 36837 Transfer 1005936 0.16
Sale 13/07/2018 –1879 Transfer 1004057 0.16
Purchase 20/07/2018 22535 Transfer 1026592 0.16
Sale 20/07/2018 –29126 Transfer 997466 0.16

42
Sl no
Folio/
Dpid–Clientid
Category
Type
Shareholding at the begginning of the Year
Date
Increase/
Decrease in share holding
Reason
Cumulative Shareholding during the Year
Name of the Share Holder
No of Shares % of total shares of the
company
No of Shares
% of total shares of the
company
Purchase 27/07/2018 98820 Transfer 1096286 0.17
Purchase 03/08/2018 91883 Transfer 1188169 0.18
Sale 03/08/2018 –87866 Transfer 1100303 0.17
Sale 10/08/2018 –52397 Transfer 1047906 0.16
Sale 17/08/2018 –2470 Transfer 1045436 0.16
Purchase 24/08/2018 4876 Transfer 1050312 0.16
Sale 24/08/2018 –49042 Transfer 1001270 0.16
Sale 31/08/2018 –22435 Transfer 978835 0.15
Purchase 07/09/2018 311352 Transfer 1290187 0.20
Sale 07/09/2018 –331347 Transfer 958840 0.15
Sale 14/09/2018 –14563 Transfer 944277 0.15
Sale 21/09/2018 –8835 Transfer 935442 0.15
Purchase 28/09/2018 11614 Transfer 947056 0.15
Sale 29/09/2018 –10030 Transfer 937026 0.15
Purchase 05/10/2018 244169 Transfer 1181195 0.18
Purchase 12/10/2018 20639 Transfer 1201834 0.19
Sale 12/10/2018 –3873 Transfer 1197961 0.19
Sale 19/10/2018 –215012 Transfer 982949 0.15
Sale 26/10/2018 –63795 Transfer 919154 0.14
Purchase 02/11/2018 9216 Transfer 928370 0.14
Purchase 09/11/2018 10290 Transfer 938660 0.15
Sale 09/11/2018 –18765 Transfer 919895 0.14
Sale 16/11/2018 –2070 Transfer 917825 0.14
Sale 23/11/2018 –9772 Transfer 908053 0.14
Purchase 30/11/2018 17741 Transfer 925794 0.14
Sale 07/12/2018 –47702 Transfer 878092 0.14
Sale 14/12/2018 –92453 Transfer 785639 0.12
Sale 21/12/2018 –19545 Transfer 766094 0.12
Purchase 28/12/2018 76758 Transfer 842852 0.13
Sale 31/12/2018 –41628 Transfer 801224 0.12
Purchase 04/01/2019 20235 Transfer 821459 0.13
Purchase 11/01/2019 81378 Transfer 902837 0.14
Sale 11/01/2019 –23144 Transfer 879693 0.14
Purchase 18/01/2019 134965 Transfer 1014658 0.16
Purchase 25/01/2019 121288 Transfer 1135946 0.18
Sale 01/02/2019 –83641 Transfer 1052305 0.16
Purchase 08/02/2019 27317 Transfer 1079622 0.17
Purchase 15/02/2019 908 Transfer 1080530 0.17
Sale 22/02/2019 –3563 Transfer 1076967 0.17
Sale 01/03/2019 –1387 Transfer 1075580 0.17
Sale 08/03/2019 –45926 Transfer 1029654 0.16
Sale 15/03/2019 –60209 Transfer 969445 0.15
Sale 22/03/2019 –120831 Transfer 848614 0.13
Sale 29/03/2019 –39349 Transfer 809265 0.13
Sale 30/03/2019 –6250 Transfer 803015 0.13
Closing Balance
30/03/2019 803015 0.13

43
Sl no
Folio/
Dpid–Clientid
Category
Type
Shareholding at the begginning of the Year
Date
Increase/
Decrease in share holding
Reason
Cumulative Shareholding during the Year
Name of the Share Holder
No of Shares % of total shares of the
company
No of Shares
% of total shares of the
company
9
AAACG4267G LTD Opening Balance
GLOBE CAPITAL MARKET LIMITED
1090516 0.17 31/03/2018 1090516 0.17
Sale 06/04/2018 –19672 Transfer 1070844 0.17
Sale 13/04/2018 –56914 Transfer 1013930 0.16
Purchase 20/04/2018 16650 Transfer 1030580 0.16
Sale 20/04/2018 –4118 Transfer 1026462 0.16
Purchase 27/04/2018 4255 Transfer 1030717 0.16
Sale 27/04/2018 –300 Transfer 1030417 0.16
Purchase 04/05/2018 131888 Transfer 1162305 0.18
Sale 04/05/2018 –86080 Transfer 1076225 0.17
Sale 11/05/2018 –14945 Transfer 1061280 0.17
Purchase 18/05/2018 42756 Transfer 1104036 0.17
Sale 18/05/2018 –17749 Transfer 1086287 0.17
Purchase 25/05/2018 74004 Transfer 1160291 0.18
Sale 25/05/2018 –8200 Transfer 1152091 0.18
Purchase 01/06/2018 65025 Transfer 1217116 0.19
Sale 01/06/2018 –6891 Transfer 1210225 0.19
Purchase 08/06/2018 23319 Transfer 1233544 0.19
Sale 08/06/2018 –181358 Transfer 1052186 0.16
Purchase 15/06/2018 4436 Transfer 1056622 0.16
Sale 15/06/2018 –350 Transfer 1056272 0.16
Purchase 22/06/2018 201816 Transfer 1258088 0.20
Sale 22/06/2018 –238749 Transfer 1019339 0.16
Purchase 29/06/2018 54466 Transfer 1073805 0.17
Sale 29/06/2018 –400 Transfer 1073405 0.17
Sale 30/06/2018 –6623 Transfer 1066782 0.17
Purchase 06/07/2018 70409 Transfer 1137191 0.18
Sale 06/07/2018 –78566 Transfer 1058625 0.16
Sale 13/07/2018 –28455 Transfer 1030170 0.16
Sale 20/07/2018 –17924 Transfer 1012246 0.16
Sale 27/07/2018 –620 Transfer 1011626 0.16
Purchase 03/08/2018 83865 Transfer 1095491 0.17
Sale 03/08/2018 –82900 Transfer 1012591 0.16
Purchase 10/08/2018 18116 Transfer 1030707 0.16
Sale 10/08/2018 –7596 Transfer 1023111 0.16
Purchase 17/08/2018 6900 Transfer 1030011 0.16
Sale 17/08/2018 –7166 Transfer 1022845 0.16
Purchase 24/08/2018 3186 Transfer 1026031 0.16
Sale 24/08/2018 –185149 Transfer 840882 0.13
Sale 31/08/2018 –5818 Transfer 835064 0.13
Purchase 07/09/2018 283463 Transfer 1118527 0.17
Sale 07/09/2018 –313277 Transfer 805250 0.13
Purchase 14/09/2018 3775 Transfer 809025 0.13
Sale 14/09/2018 –2490 Transfer 806535 0.13
Purchase 21/09/2018 800 Transfer 807335 0.13
Sale 21/09/2018 –6291 Transfer 801044 0.12
Purchase 28/09/2018 13066 Transfer 814110 0.13
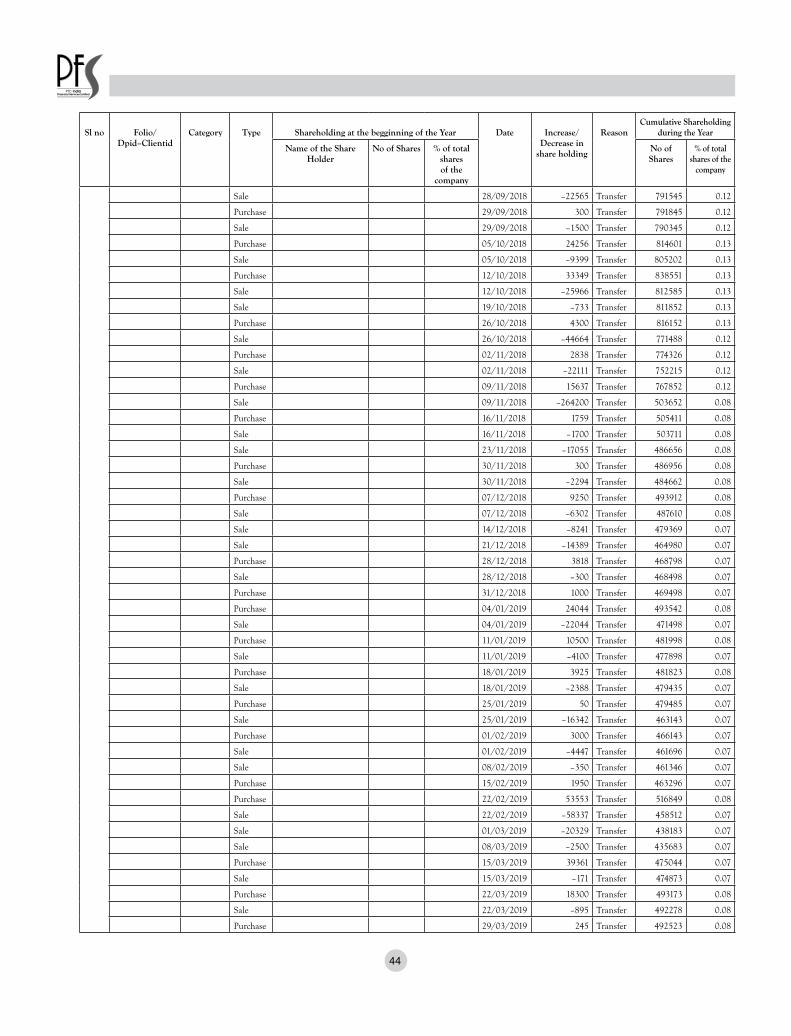
44
Sl no
Folio/
Dpid–Clientid
Category
Type
Shareholding at the begginning of the Year
Date
Increase/
Decrease in share holding
Reason
Cumulative Shareholding during the Year
Name of the Share Holder
No of Shares % of total shares of the
company
No of Shares
% of total shares of the
company
Sale 28/09/2018 –22565 Transfer 791545 0.12
Purchase 29/09/2018 300 Transfer 791845 0.12
Sale 29/09/2018 –1500 Transfer 790345 0.12
Purchase 05/10/2018 24256 Transfer 814601 0.13
Sale 05/10/2018 –9399 Transfer 805202 0.13
Purchase 12/10/2018 33349 Transfer 838551 0.13
Sale 12/10/2018 –25966 Transfer 812585 0.13
Sale 19/10/2018 –733 Transfer 811852 0.13
Purchase 26/10/2018 4300 Transfer 816152 0.13
Sale 26/10/2018 –44664 Transfer 771488 0.12
Purchase 02/11/2018 2838 Transfer 774326 0.12
Sale 02/11/2018 –22111 Transfer 752215 0.12
Purchase 09/11/2018 15637 Transfer 767852 0.12
Sale 09/11/2018 –264200 Transfer 503652 0.08
Purchase 16/11/2018 1759 Transfer 505411 0.08
Sale 16/11/2018 –1700 Transfer 503711 0.08
Sale 23/11/2018 –17055 Transfer 486656 0.08
Purchase 30/11/2018 300 Transfer 486956 0.08
Sale 30/11/2018 –2294 Transfer 484662 0.08
Purchase 07/12/2018 9250 Transfer 493912 0.08
Sale 07/12/2018 –6302 Transfer 487610 0.08
Sale 14/12/2018 –8241 Transfer 479369 0.07
Sale 21/12/2018 –14389 Transfer 464980 0.07
Purchase 28/12/2018 3818 Transfer 468798 0.07
Sale 28/12/2018 –300 Transfer 468498 0.07
Purchase 31/12/2018 1000 Transfer 469498 0.07
Purchase 04/01/2019 24044 Transfer 493542 0.08
Sale 04/01/2019 –22044 Transfer 471498 0.07
Purchase 11/01/2019 10500 Transfer 481998 0.08
Sale 11/01/2019 –4100 Transfer 477898 0.07
Purchase 18/01/2019 3925 Transfer 481823 0.08
Sale 18/01/2019 –2388 Transfer 479435 0.07
Purchase 25/01/2019 50 Transfer 479485 0.07
Sale 25/01/2019 –16342 Transfer 463143 0.07
Purchase 01/02/2019 3000 Transfer 466143 0.07
Sale 01/02/2019 –4447 Transfer 461696 0.07
Sale 08/02/2019 –350 Transfer 461346 0.07
Purchase 15/02/2019 1950 Transfer 463296 0.07
Purchase 22/02/2019 53553 Transfer 516849 0.08
Sale 22/02/2019 –58337 Transfer 458512 0.07
Sale 01/03/2019 –20329 Transfer 438183 0.07
Sale 08/03/2019 –2500 Transfer 435683 0.07
Purchase 15/03/2019 39361 Transfer 475044 0.07
Sale 15/03/2019 –171 Transfer 474873 0.07
Purchase 22/03/2019 18300 Transfer 493173 0.08
Sale 22/03/2019 –895 Transfer 492278 0.08
Purchase 29/03/2019 245 Transfer 492523 0.08
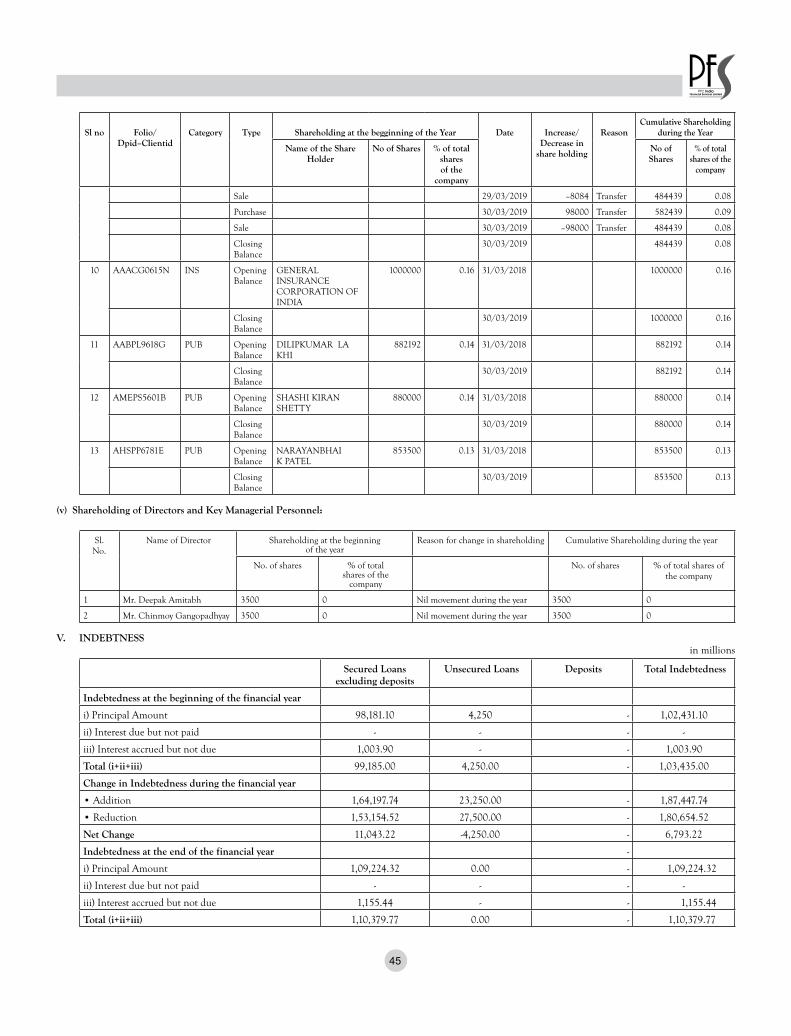
45
Sl no
Folio/
Dpid–Clientid
Category
Type
Shareholding at the begginning of the Year
Date
Increase/
Decrease in share holding
Reason
Cumulative Shareholding during the Year
Name of the Share Holder
No of Shares % of total shares of the
company
No of Shares
% of total shares of the
company
Sale 29/03/2019 –8084 Transfer 484439 0.08
Purchase 30/03/2019 98000 Transfer 582439 0.09
Sale 30/03/2019 –98000 Transfer 484439 0.08
Closing Balance
30/03/2019 484439 0.08
10
AAACG0615N INS Opening Balance
GENERAL INSURANCE CORPORATION OF INDIA
1000000 0.16 31/03/2018 1000000 0.16
Closing Balance
30/03/2019 1000000 0.16
11
AABPL9618G PUB Opening Balance
DILIPKUMAR LAKHI
882192 0.14 31/03/2018 882192 0.14
Closing Balance
30/03/2019 882192 0.14
12
AMEPS5601B PUB Opening Balance
SHASHI KIRAN SHETTY
880000 0.14 31/03/2018 880000 0.14
Closing Balance
30/03/2019 880000 0.14
13
AHSPP6781E PUB Opening Balance
NARAYANBHAI K PATEL
853500 0.13 31/03/2018 853500 0.13
Closing Balance
30/03/2019 853500 0.13
(v) Shareholding of Directors and Key Managerial Personnel:
Sl.No.
Name of Director Shareholding at the beginningof the year
Reason for change in shareholding Cumulative Shareholding during the year
No. of shares % of totalshares of the
company
No. of shares % of total shares ofthe company
1 Mr. Deepak Amitabh 3500 0 Nil movement during the year 3500 0
2 Mr. Chinmoy Gangopadhyay 3500 0 Nil movement during the year 3500 0
V. INDEBTNESS in millions
Secured Loans excluding deposits
Unsecured Loans Deposits Total Indebtedness
Indebtedness at the beginning of the financial year
i) Principal Amount 98,181.10 4,250 - 1,02,431.10
ii) Interest due but not paid - - - -
iii) Interest accrued but not due 1,003.90 - - 1,003.90
Total (i+ii+iii) 99,185.00 4,250.00 - 1,03,435.00
Change in Indebtedness during the financial year
• Addition 1,64,197.74 23,250.00 - 1,87,447.74
• Reduction 1,53,154.52 27,500.00 - 1,80,654.52
Net Change 11,043.22 -4,250.00 - 6,793.22
Indebtedness at the end of the financial year -
i) Principal Amount 1,09,224.32 0.00 - 1,09,224.32
ii) Interest due but not paid - - - -
iii) Interest accrued but not due 1,155.44 - - 1,155.44
Total (i+ii+iii) 1,10,379.77 0.00 - 1,10,379.77

46
VI. REMUNERATION OF DIRECTORS AND KEY MANAGERIAL PERSONNEL
A. Remuneration to Managing Director, Whole–time Directors and/or Manager:(in millions)
Sl. No. Particulars of Remuneration Name of MD/WTD/Manager Total Amount(in Rs.)
Dr. Ashok Haldia(MD & CEO)
Dr. Pawan Singh (Whole Time Director) &
CFO from 25th January, 2018
Shri Naveen Kumar(Whole Time Director)
1 Gross salary
a. Salary as per provisions contained in section 17(1) of the Income – tax Act, 1961
7.80 7.96 5.92 21.68
b. Value of perquisites u/s 17(2) of the Income – tax Act, 1961
0.27 0.26 0.27 0.80
c. Profits in lieu of salary under section 17(3) of the Income–tax Act, 1961
---------- ---------- ---------- ----------
2 Stock Option ---------- ---------- ---------- ----------
3 Sweat Equity ---------- ---------- ---------- ----------
4 Commission ---------- ---------- ---------- ----------
– as % of profit ---------- ---------- ---------- ----------
– others, specify… ---------- ---------- ---------- ----------
5 Others, Reimbursement of expenses 0.26 0.12 0.25 0.63
Total (A) 8.33 8.34 6.44 23.11
Ceiling as per the Act (@ 10% of profits calculated under Section 198 of the Companies Act, 2013)
B. Remuneration to other Directors for the FY 2018–2019
S.No. Name of Director Sitting Fee (excluding TDS) (in millions)
Conveyance (excluding TDS) (in millions.)
1 Shri. Deepak Amitabh* 0.72 -
2 Dr. Rajib Kumar Mishra* 0.96 -
3 Shri. Chinmoy Gangopadhyay^ 0.84 0.024
4 Mrs. Pravin Tripathi 1.36 0.036
5 Shri. Harbans Lal Bajaj 1.16 0.026
6 Shri. Harun Rasid Khan 0.8 0.01
7 Shri. Kamlesh Shivji Vikamsey 0.96 0.004
8 Shri Santosh Balachandran Nayar 0.68 0.006
* Sitting Fee has been paid to PTC India Limited (the holding company) ^ Sitting Fee has been paid to Power Finance Corporation Limited
C. Remuneration to Key Managerial Personnel other than MD/Manager/WTD
Sl. No. Particulars of Remuneration Key Managerial Personnel CEO Company Secretary (Rs. in Million) CFO (Rs. in Million)1 Gross salary
Explained above 3.96 4.01a. Salary as per provisions contained in section 17(1) of the Income – tax Act, 1961
b. Value of perquisites u/s 17(2) of the Income – tax Act, 1961 ------- 0.32 0.35
c. Profits in lieu of salary under section 17(3) of the Income–tax Act, 1961 ------- -------
2 Stock Option ------- ------- -------3 Sweat Equity ------- ------- -------
4
Commission ------- ------- -------– as % of profit ------- ------- -------– others, specify… ------- ------- -------
5 Others, Reimbursement of expenses ------- ------- ------- Total ------- 4.28 4.36

47
Annexure– II
POLICY ON DIVIDEND DISTRIBUTION
1. Introduction
The Securities Exchange Board of India (“SEBI”) on July 8, 2016 inserted Regulation 43A in SEBI (Listing Obligations and Disclosure Requirements) Regulations, 2015, which requires top five hundred listed companies (based on market capitalization of every financial year) to formulate a Dividend Distribution Policy which shall be disclosed in their annual reports and on their websites.
PTC India Financial Services Limited (“PFS” or “Company”) being one of the top five hundred listed companies as per the market capitalization as on the last day of the immediately preceding financial year, frames this policy to comply with the requirements of the SEBI (Listing Obligations and Disclosure Requirements) Regulations, 2015.
2. Objectives & Scope
This Policy lays downs the broad framework which will act as guiding principles for the purpose of declaring or recommending any dividend during or for any financial year by the Company.
The Policy aims at balancing the twin objectives of the growth of the Company and Shareholders’ value.
Through this Policy, the Company endeavours to bring a fair, transparent and consistent approach to its dividend pay–out plans. The Policy has been framed broadly in line with the provisions of the Companies Act, 2013 and also taking into consideration guidelines issued by SEBI/ RBI/and other regulations, to the extent applicable.
The Policy is a general declaration of intention and the actual declaration of dividend will require corporate action at the time a decision is taken, depending on the precise circumstances at that point of time.
In addition, payment of any such dividend will be subject to any restriction under applicable laws and regulation, the Articles of Association, available cash flows and capital requirements.
The Policy, however, is not an alternative to the decision of the Board for recommending dividend, which is made every year after taking into consideration all relevant circumstances enumerated hereunder or other factors as may be considered by the Board of Directors from time to time.
3. Definitions
1.1. “Act” shall mean the Companies Act, 2013 including the Rules made thereunder, as amended from time to time.
1.2. “Applicable Laws” shall mean the Companies Act, 2013 and Rules made thereunder, the Securities and Exchange Board of India (Listing Obligations and Disclosure Requirements) Regulations, 2015; as amended from time to time and such other act, rules or regulations which provides for the distribution of dividend.
1.3. “Company” shall mean PTC India Financial Services Limited
1.4. “Board” or “Board of Directors” shall mean Board of Directors of the Company.
1.5. “Dividend” shall mean Dividend as defined under Companies Act, 2013 and shall include interim dividend.
1.6. “Policy or this Policy” shall mean the Dividend Distribution Policy.
1.7. “SEBI Regulations” shall mean the Securities and Exchange Board of India (Listing Obligations and Disclosure Requirements) Regulations, 2015 together with the circulars issued thereunder, including any statutory modification(s) or re–enactment(s) thereof for the time being in force.
1.8. “RBI Regulations” means Reserve Bank of India Act, 1934 and various circulars, guidelines issued by Reserve Bank of India from time to time.
4. Relevant Statutory Provisions of the Companies Act, 2013 and Companies (Declaration and Payment of Dividend) Rules 2014 relating to Dividend
1.1 Dividend shall be declared or paid by company for any financial year:
i) Out of the current year profit after providing depreciation. ii) Out of the previous years profit remaining undistributed and after providing for depreciation.iii) Out of both the above.
1.2 No Dividend shall be declared or paid by company from its reserves other than free reserves.
1.3 The Company may, before the declaration of any dividend in any financial year, transfer such percentage of its profits for that financial year as it may consider appropriate to the reserves of the company.

48
1.4 Company shall declare dividend after carried over previous losses and depreciation not provided, if any, in previous year or years are set off against profit of the company for the current year.
1.5 In case of losses or inadequate profits in any financial year, the Company can declare dividend out of the profits earned by it in previous years and transferred to the reserves subject to the following conditions:–
i. The rate of dividend declared shall not exceed the average of the rates at which dividend was declared by it in the three years immediately preceding that year:
Provided that the above condition shall not apply in case the Company has not declared any dividend in each of the three preceding financial year.
ii. The total amount to be drawn from such accumulated profits shall not exceed one–tenth of the sum of its paid–up share capital and free reserves as appearing in the latest audited financial statement.
iii. The amount so drawn shall first be utilised to set off the losses incurred in the financial year in which dividend is declared before any dividend in respect of equity shares is declared.
The balance of reserves after such withdrawal shall not fall below fifteen per cent of company’s paid up share capital as appearing in the latest audited financial statement
5. Circumstances under which the shareholders may or may not expect dividend: The decision regarding dividend pay–out is a crucial decision as it determines the amount of profit to be distributed among shareholders of the Company and the amount of profit to be retained in business.
The Board will consider the factors mentioned under Clause 5 below and before determination of any dividend payout analyse the prospective opportunities and threats, viability of the option of dividend payout or retention etc. If the Board proposes that it is financially prudent not to recommend dividend, it may recommend no dividend, in that case, reason(s) thereof and information on utilization of the undistributed profit, if any, shall be disclosed to the shareholders in the Annual Report of the Company.
1. Parameters for declaration of Dividend
The Board of Directors will consider the following parameters for determining the quantum of dividend: 1.1 Financial Parameters
l Net profit after tax;l Transfer of Statutory Reserve as per Reserve Bank of India Act, 1934l Working Capital requirements;l Capital expenditure requirements and alternative use of cash;l Outstanding borrowingsl Available cash and cash flow requirement to meet any unforeseen events & contingencies/ group’s capital requirementsl Dividend received by the company. l Net worth of the companyl Dividend yieldl Dividend payout ratio.l In case the dividend is paid out of the reserves, the balance of reserves after such withdrawal shall not fall below 25% of company’s paid up share
capital as appearing in the latest audited financial statement.
1.2 Developments in internal and external environment.
l Opportunities available for growth/expansion/ modernisation l Past Dividend Trendsl Expectations of shareholdersl Prudential requirementsl Capital Marketsl Industry Conditionsl Customers and suppliers concentration and their financial healthl Market Capitalizationl Statutory Provisions and Guidelines;l Policies of the Government (centre and state)l Dividend Pay–out ratios of companies in same industries i.e. Peer Group Comparisonl Economic Environment
1.3 Any other factor as the Board may deem fit
6. Utilization of retained earnings
The Company is engaged into financing the infrastructure sector and the retained earnings are deployed in the long–term infrastructure loan assets. The Board may retain its earnings in order to make better use of the available funds and increase the value of the stakeholders in the long run. The profit being retained in the business shall be continued to be deployed in its operations, expansion plans, investment plans etc. The Company stands committed to deliver sustainable value to all its stakeholders.

49
7. Provision with regard to various classes of shares
The holders of the equity shares of the Company, as on the record date, will be entitled to receive dividends. Since the Company has issued only one class of equity shares with equal voting rights, all the members of the Company shall be entitled to receive the same amount of dividend per share. The Policy shall be suitably revisited at the time of issue of any new class of shares depending upon the nature and guidelines thereof.
8. Timing of Dividend
1.1 Interim dividends, as and when decided by the Board, will be declared after considering the interim financial statements for the period for which interim dividends are declared along with factors mentioned in clause 4 & 5 above. Interim financial statements will be prepared considering working expenses, depreciation and anticipated losses, if any, for the full year.
1.2 Final dividends as and when approved at the Annual General Meeting (AGM) of the shareholders will be based on the recommendations of the Board based on review of audited financial statements for the year, factors mentioned in clause 4 & 5 above and considering interim dividend, if any, declared during the year.
1.3 In case no final dividend is declared, interim dividend, if any, will be regarded as final dividend in AGM.
9. Exclusions
This policy shall not cover the following l Capitalizing of profits by way of bonus issue of fully or partly securities l Declaration of dividend on preference shares (as and when issued), since the same will be governed by terms of issue of such shares l Buyback of shares
10. Amendment(s):
l The Board will change/amend this Policy from time to time at its sole discretion and/or pursuant to any amendments made in the Companies Act, 2013 or any other Statutory Regulations.
l In case of any clarification(s), circular(s) etc. issued by the relevant authorities, not being inconsistent with the provisions laid down under this Policy, then this Policy shall be read along with such clarification(s), circular(s) so issued, from the effective date as laid down under such clarification(s), circular(s) etc. In case of any conflict in the Policy and regulatory provisions then regulatory provisions shall prevail.
11. Disclosures: The Company shall disclose this Policy in its Annual Reports &website.
EFFECTIVE DATE The Policy shall become effective from the date of its adoption by the Board.

50
Annexure– IIIREPORT ON CSR ACTIVITIES/ INITIATIVES
[Pursuant to Section 135 of the Act & Rules made thereunder]
1. A brief outline of the company’s CSR policy, including overview of the projects or programs proposed to be undertaken and reference to the web–link to the CSR Policy and projects or programs.
2. Corporate Social Responsibility (CSR) is a long–standing commitment at PFS. The CSR Policy of PFS sets the framework guiding the CSR activities of the Company. It outlines the governance structure, operating framework, monitoring mechanism, and CSR activities that would be undertaken. The PFS CSR Committee is the governing body of CSR activities and ensures compliance with the CSR Policy.
The CSR Policy was approved in March 2015, and subsequently was put up on the Company’s website. Web–link to the Company’s CSR Policy: http://www.ptcfinancial.com/upload/pdf/corporate_social_responsibility_policy.pdf
3. The composition of the CSR Committee 1) Sh. Deepak Amitabh2) Mrs. Pravin Tripathi3) Dr. Pawan Singh *4) Mr. Harun Rashid Khan #5) Dr Ashok Haldia ##
# ceased to be member w.e.f. 30th January, 2019## ceased to be member w.e.f. 18th September, 2018* appointed Member w.e.f. 8th February, 2019
4. The functions of the Committee are given below:
a) formulate and recommend to the Board, a CSR Policy which shall indicate the CSR activities to be undertaken by the company as specified in Schedule VII of the Act;
b) recommend the amount of expenditure to be incurred on the CSR activities referred to in clause (a);c) monitor the CSR Policy of the company from time to time.
5. Average Net Profit of the company for last 3 financial years : The average net profit of the Company for the last three financial years calculated as specified by the Companies Act, 2013 was Rs. 4756.67 million
6. Prescribed CSR expenditure (2% of amount) for FY 2018–19 – Rs 95.13 million as per provisions of the Companies Act 2013.
7. Details of CSR activities/projects undertaken during the year: a) Total amount to be spent for the FY 2018–19 was Rs 95.13 million as per the provisions of the Companies Act 2013.b) Amount spent in FY 2018–19 – Rs 91.64 millionc) Manner in which the CSR amount spent during FY 2018–19 is detailed below:
1 2 3 4 5 6 7 8
Sr. No
CSR project/activity identified
Sector in which the Project is covered
Projects/Programs1. Local area/others–2. specify the state /district (Name of the District/s,
State/s where project/programme was undertaken
Amount outlay (budget) project/ programme wiseRs (in Million)
Amount spent on the project/ programmeSub–heads:1.Direct expenditure on project/ programme,2.Overheads:Rs (in Million)
Cumulative spend up to the reporting period
Amount spent:Direct/ through implementing agency*
1. Contribution towards PM Relief Fund
Contribution towards PM Relief Fund
Relief and welfare of the flood affected in Kerala
20.00 20.00 20.00 Paid to PM National Relief Fund
2. Contribution towards Mobile Health Clinic project
Promoting Healthcare including preventive healthcare
Project undertaken in Delhi NCR
40.50 40.50 40.50 Paid to PTC Foundation Trust as implementing agency
3. Skill Development in Solar Power projects
Promoting employment enhancing skills (skill development) in solar power.
Program organized close to Bhadla Solar Park in Jodhpur district of Rajasthan
1.30 1.30 1.31 Paid to National Power Training Institute
4. Waste to Energy Project Promoting Swachh Bharat abhiyan
Project undertaken in Delhi 11.80 11.80 11.80 Paid to PTC Foundation Trust as implementing agency
5. Sanitation of Bhikaji Cama Place
Promoting swachha bharat and sanitation
Project undertaken in Bhkaji Cama Place, Delhi
4.10 4.10 4.11 Paid to PTC Foundation Trust as implementing agency
6. Digitisation of SOS Children’s Village
Promoting education and vocational education among underprivileged children
Project to be undertaken in various locations in the country
12.60 12.60 12.60 Paid to PTC Foundation Trust as implementing agency
7. Salary paid to regular CSR staff & employees
Salary 1.30 1.30 1.31
Total CSR Expenses 91.60 91.60 91.64 *Give details of implementing Agency.

51
8. The amount spent in FY 2018–19 was Rs. 91.64 million and was lower than 2% of average net profits of the last three financial years and the unspent amount from previous financial year.
9. The Committee aimed that the CSR endeavored to be carried out meaningfully ensuring active compliance with the letter and spirit of the law and ethical standards furthering social good in which professional management of CSR functions plays a vital part. The plans to be prepared should be in the best interest of society on sustainable basis.
10. The CSR Committee hereby confirms that the implementation and monitoring of CSR activities is in compliance with the CSR objectives and the CSR Policy of the company.
Sd/– Sd/– Dr. Pawan Singh Shri Deepak Amitabh Managing Director & CEO Chairman of CSR Committee

52
Annexure– IV
Form MR – 3
SECRETARIAL AUDIT REPORT
For the financial year ended 31stMarch, 2019{Pursuant to Section 204(1) of the Companies Act, 2013 and
Rule 9 of the Companies (Appointment and Remuneration of Managerial Personnel) Rules, 2014 and Regulation 24A of the Securities and Exchange Board of India (Listing Obligations & Disclosure requirements)
Regulations, 2015}
ToThe Members,PTC India Financial Services Limited.
We have conducted the Secretarial Audit of the compliance of applicable statutory provisions and the adherence to good corporate practices by PTC India Financial Services Limited (hereinafter called PFS/the Company). Secretarial Audit was conducted in a manner that provided us a reasonable basis for evaluating the corporate conducts/statutory compliances and expressing our opinion thereon.
Based on our verification of the PFS’s books, papers, minute books, forms and returns filed and other records maintained by the company and also the information provided by the Company, its officers, agents and authorized representatives during the conduct of secretarial audit, we hereby report that in our opinion, the Company has, during the audit period covering the financial period ended on 31st March, 2019 complied with the statutory provisions listed hereunder and also that the Company has proper Board– processes and Compliance–mechanism in place to the extent, in the manner and subject to the reporting made hereinafter:
We have examined the books, papers, minute books, forms and returns filed and other records maintained by PFS(“the Company”) for the financial year ended on 31st March, 2019 according to the provisions of:
(i) The Companies Act, 2013 (the Act) and the rules made thereunder;(ii) The Securities Contracts (Regulation) Act, 1956 (‘SCRA’) and the rules made thereunder;(iii) The Depositories Act, 1996 and the Regulations and Bye–laws framed thereunder;(iv) Foreign Exchange Management Act, 1999 and the rules and regulations made thereunder to the extent of Foreign Direct Investment, Overseas Direct Invest-
ment and External Commercial Borrowings;(v) The following Regulations and Guidelines prescribed under the Securities and Exchange Board of India Act, 1992 (‘SEBI Act’):–(a) The Securities and Exchange Board of India (Substantial Acquisition of Shares and Takeovers) Regulation, 2011;(b) The Securities and Exchange Board of India (Prohibition of Insider Trading) Regulations, 2015;(c) The Securities and Exchange Board of India (Issue of Capital and Disclosure Requirements) Regulations, 2009;Not Applicable(d) The Securities and Exchange Board of India (Employee Stock Option Scheme and Employee Stock Purchase Scheme) Guidelines, 1999;Not Applicable(e) The Securities and Exchange Board of India (Issue and Listing of Debt Securities) Regulations, 2008;(f) The Securities and Exchange Board of India (Registrars to an Issue and Share Transfer Agents) Regulations, 1993 regarding the Companies Act and dealing
with client;(g) The Securities and Exchange Board of India (Delisting of Equity Shares) Regulations, 2009; Not Applicable(h) The Securities and Exchange Board of India (Buyback of Securities) Regulations, 1998; Not Applicable(vi) The Reserve Bank of India Act,1934 and Regulation framed thereunder for Non–Banking Financial Companies(vii) Prevention of Money Laundering Act, 2002.
We have also examined compliance with the applicable clauses of the following:
(a) Secretarial Standards issued by the Institute of Company Secretaries of India –Generally complied with.
(b) The Listing Agreement with National Stock Exchange of India Limited and BSE Limited and Securities and Exchange Board of India (Listing Obliga-tions and Disclosure Requirements) Regulations, 2015.
During the period under review, the Company has complied with the provisions of the Acts, Rules, Regulations, Guidelines, Standards, etc. mentioned above subject to the following observations.
1. The composition of the Board of the Company was not in compliance as per proviso to Regulation 17 (1) (b) of Securities and Exchange Board of India (Listing Obligations and Disclosure Requirements) Regulations, 2015 for the period from 01st April 2018 to 18th September 2018.
We further report that the Board of Directors of the Company shall be duly constituted in terms of Regulation 17 (1) (b) of the Securities and Exchange Board of India (Listing Obligations & Disclosure Requirements) Regulations, 2015 i.e. atleast half of the Board of Directors should comprise of Independent Directors as on 31st March 2019. The Company was also compliant in terms of provisions under Section 149 (4) of the Companies Act, 2013 as out of 9 Board of Directors there were 4 Independent Directors on the Board of Company. The changes in the composition of the Board of Directors that took place during the period under review were carried out in compliance with the provisions of the Act.
Generally, adequate notice is given to all directors to schedule the Board Meetings, agenda and detailed notes on agenda were sent at least seven days in advance, and a system exists for seeking and obtaining further information and clarifications on the agenda items before the meeting and for meaningful participation at the meeting.

53
Majority decision is carried through while the dissenting members’ views are captured and recorded as part of the minutes, if any.
We further report that there are adequate systems and processes in the Company commensurate with the size and operations of the company to monitor and ensure compliance with applicable laws, rules, regulations and guidelines.
We further report that during the audit period, there were no specific events/actions having a major bearing on the Company’s affairs in pursuance of the above referred laws.
For Agarwal S. & Associates,Company Secretaries,
ICSI Unique Code: P2003DE049100
CS Sachin AgarwalPartner
Place: New Delhi FCS No.: 5774Date: July 09, 2019 CP No.: 5910This report is to be read with our letter of even date which is annexed as “Annexure A” and forms an integral part of this report.
“Annexure A” To,The Members,PTC India Financial Services Limited.
Our report of even date is to be read along with this letter.
1. Maintenance of secretarial records is the responsibility of the management of the Company. Our Responsibility is to express an opinion on these secretarial records, based on our inspection of records produced before us for Audit.
2. We have followed the audit practices and processes as were appropriate to obtain reasonable assurance about the correctness of the contents of the secretarial records. The verification was done on test basis to ensure that correct facts are reflected in secretarial records. We believe that the processes and practices, we followed provide a reasonable basis for our opinion.
3. We have not verified the correctness and appropriateness of financial records and Books of Accounts of the Company and our report is not covering observa-tions/ comments/ weaknesses already pointed out by the other Auditors.
4. Wherever required, we have obtained the Management representation about the compliance of laws, rules and regulation and happening of events etc.
5. The Compliance of the provisions of corporate and other applicable laws, rules, regulations, standards is the responsibility of management. Our examination was limited to the verification of procedures on test basis and to give our opinion whether Company has proper Board–processes and Compliance–mechanism in place or not.
6. The Secretarial Audit Report is neither an assurance as to future viability of the Company nor of the efficacy or effectiveness with which the management has conducted the affairs of the Company.
For Agarwal S. & Associates,Company Secretaries,
ICSI Unique Code: P2003DE049100
Sd/–CS Sachin Agarwal
Partner
Place: New Delhi FCS No.: 5774Date: July 09, 2019 CP No.: 5910

54
Annexure– VForm No. AOC–2
(Pursuant to clause (h) of sub–section (3) of section 134 of the Companies Act, 2013 and Rule 8(2) of the Companies (Accounts) Rules, 2014)
Form for disclosure of particulars of contracts / arrangements entered into by the company with related parties referred to in sub–section (1) of section 188 of the Companies Act, 2013 including certain arm’s length transactions under third proviso thereto:
1. Details of contracts or arrangements or transactions not at arm’s length basis:
PTC India Financial Services Limited (“the Company”) has not entered into any contract /arrangement/transaction with its related parties which is not in ordinary course of business or at arm’s length during financial year 2017–18. The Company has laid down policies and processes/procedures so as to ensure compliance to the subject section in the Companies Act, 2013 (“the Act”) and the corresponding Rules.
Name(s) of the related party and nature of relationship : N.A.
Nature of contracts/arrangements/transactions : N.A.
Duration of the contracts / arrangements/transactions : N.A.
Salient terms of the contracts or arrangements or transactions including the value, if any : N.A.
Justification for entering into such contracts or arrangements or transactions : N.A.
Date(s) of approval by the Board : N.A.
Amount paid as advances, if any: : N.A.
Date on which the special resolution was passed in general meeting as required under first proviso tosection 188 : N.A.
2. Details of material contracts or arrangement or transactions at arm’s length basis:
Name(s) of the related party and nature of relationship : N.A.
Nature of contracts/arrangements/transactions : N.A.
Duration of the contracts / arrangements/transactions : N.A.
Salient terms of the contracts or arrangements or transactions including the value, if any : N.A.
Date(s) of approval by the Board : N.A.
Amount paid as advances, if any: : N.A.
For and on behalf of the Board PTC India Financial Services Limited
Sd/–Dr. Pawan Singh
Date : 1st August, 2019 Managing Director & CEOPlace: New Delhi DIN : 00044987

55
Annexure –VI
“NOMINATION AND REMUNERATION & BOARD DIVERSITY POLICY”
Legal Framework
As per the requirements of Companies Act 2013, the Board of Directors of PTC India Financial Services Limited (“Company”) has constituted a Nomination and Remuneration Committee. The Committee’s role is to be supported by a policy for nomination of Directors and Senior Management Personnel including Key Managerial Personnel as also for remuneration of Directors, Key Managerial Personnel (KMP), Senior Management Personnel and other Employees. Further, a policy on Board Diversity is also to be adopted.
Definitions
For the purpose of this Policy:
• ‘Act’ shall mean the Companies Act, 2013;• ‘Board’ shall mean the Board of Directors of PTC India Financial Services Limited (PFS);• ‘Committee’ shall mean the Nomination and Remuneration committee of the Company, constituted and re constituted by the Board from time to time;• ‘Company’ shall mean PTC India Financial Services Limited (PFS);• ‘Directors’ shall mean the directors of the Company;• ‘Independent Director’ shall mean a director referred to in Section 149 (6) of the Companies Act, 2013 and under the Listing Agreement with the Stock
Exchanges;• ‘Other employees’ means, all the employees other than the Directors, KMPs and the Senior Management Personnel.‘• “Key Managerial Personnel” or KMP means key managerial personnel as defined under the Companies Act, 2013 & includes:–
i. Managing Director, or Chief Executive Officer or Manager and in their absence, a Whole–Time Director; ii. Company Secretary; and iii. Chief Financial Officeriv. Such other officer as may be prescribed
• ‘Senior Management Personnel’ means personnel of the company who are members of its core management team excluding Board of Directors, and comprises of all members of management who are in the grade that is one level below the WTD
• ‘Nomination & Remuneration Committee’ means “Nomination & Remuneration Committee” constituted by the Board of Directors of the Company from time to time under the provisions of the Companies Act 2013 and the Listing Agreement with the Stock Exchanges.
OBJECTIVE & PURPOSE
The Nomination & Remuneration Committee and this Policy shall be in compliance with Section 178 of the Companies Act, 2013 read with applicable rules thereto and Clause 49 of the Listing Agreement. The objective and purpose of the Committee would be as follows:
• To guide and assist the Board in laying down criteria and terms and conditions with regard to identifying persons who are qualified to become Directors (Whole–time and Independent) and persons who may be appointed in Senior Management and Key Managerial positions and to determine their remuneration through a remuneration policy.
• The Company has a adopted a remuneration policy which provides for Performance Related Pay (PRP), a reward linked directly to efforts, performance, dedication and achievement relating to the Company’s operations. Apart from the PRP, the annual increases in remuneration have a component of Merit Increase, which is also linked to performance of an individual.
This policy provides the Committee with an overall framework for governance of the remuneration policy of the Company.
• To retain, motivate and promote talent and to ensure long term sustainability for retention of talented managerial persons and create competitive advantage for the Company.
• To guide and assist the Board in laying down ESOP Compensation policy in terms of SEBI Guidelines, as and when decided.
• To guide and assist the Board in clarifying any matter relating to remuneration.
CONSTITUTION
• The Board has determined the membership of the Nomination and Remuneration Committee (hereinafter “the Committee”).
• The Committee shall elect its Chairman who will be an Independent Director.
NOMINATION & REMOVAL CRITERIA
1 Appointment criteria and qualifications:
1.1 The Committee shall identify and ascertain the criteria like integrity, expertise and experience and qualifications for appointment to the positions of Director, KMP and Senior Management.

56
1.2 A potential candidate being considered for appointment to a position should possess adequate qualification, expertise and experience for the position. The Committee shall review qualifications, expertise and experience commensurate to the requirement for the positions. The Committee will insist on the highest standards of ethical and moral qualities to be possessed by such persons as are considered eligible for the positions.
1.3 The Committee shall determine the suitability of appointment of a person to the Board of Directors of the Company by ascertaining whether the fit and proper criteria is met by the candidate in the opinion of the Committee.
1.4 The Committee may recommend appropriate induction & training programme for any or all of the appointees.1.5 The Company shall normally not appoint or continue the employment of any person as Whole Time Director, KMP or Senior Management Personnel
who has attained the superannuation age as per the policy of the Company. 1.6 The Committee shall make recommendations to the Board concerning any matters relating to the continuation in office of any director at any time
including the suspension or termination of service of a director subject to the provisions of law and the respective service contract.1.7 The Committee shall recommend any necessary changes in the Policy to the Board, from time to time.1.8 The Company should ensure that the person so appointed as Director/ Independent Director, KMP, Senior Management Personnel shall not be
disqualified under the Companies Act, 2013, rules made there under, Listing Agreement or any other enactment for the time being in force.1.9 The Director/ Independent Director/Senior Management Personnel/KMP shall be appointed as per the procedure laid down under the provisions of
the Companies Act, 2013, rules made there under, Listing Agreement or any other enactment for the time being in force.1.10 The company shall familiarize the independent directors with the company, including their roles, rights, responsibilities in the company, nature of the
industry in which the company operates, business model of the company, etc., through various programs.
2 Term / Tenure
2.1 MD & CEO or Managing Director/Whole–time Director (WTD): The Company shall appoint or re–appoint any person as its MD & CEO or WTD for a term not exceeding five years at a time subject to the age of
superannuation. No re–appointment shall be made earlier than one year before the expiry of term of the Director appointed.2.2 Independent Director shall hold office in accordance with the Company’s Policy and subject to the Act.2.3 The Term/Tenure of the Senior Management Personnel/KMP shall be as per the Company’s prevailing policy.
2. Removal
Due to reasons for any disqualification mentioned in the Companies Act, 2013 and rules made there under or under any other applicable Act, rules and regulations, the Committee may recommend to the Board with reasons to be recorded in writing, removal of a director, KMP or senior management personnel, subject to the provisions and compliance of the Act, rules and regulations.
3. Retirement / Superannuation
The director, senior management personnel or KMP shall retire / superannuate as per the applicable provisions of the Companies Act, 2013 along with the rules made there under and the prevailing policy of the Company. The Board will have the discretion to retain the director, senior management personnel or KMP in the same position / remuneration or otherwise even after attaining the retirement age, for the benefit of the Company.
4. Diversity on the Board of the Company
The Company aims to enhance the effectiveness of the Board by diversifying its composition and to obtain the benefit out of such diversity in better and improved decision making. In order to ensure that the Company’s boardroom has appropriate balance of skills, experience and diversity of perspectives that are imperative for the execution of its business strategy, the Company shall consider a number of factors, including but not limited to skills, industry experience, background, race and gender.
The Policy shall conform to the following two principles for achieving diversity on the Board:
• Decisions pertaining to recruitment, promotion and remuneration of the directors will be based on their performance and competence; and• For embracing diversity and being inclusive, best practices to ensure fairness and equality shall be adopted and there shall be zero tolerance for unlawful
discrimination and harassment of any sort whatsoever. In order to ensure a balanced composition of executive, non–executive and independent directors on the Board, the Company shall consider candidates from
a wide variety of backgrounds, without discrimination, and based on the following factors:
Ø Gender– The Company shall not discriminate on the basis of gender in the matter of appointment of directors on the Board. The Company encourages the appointment of women at senior executive levels to achieve a balanced representation on the Board. As per the provisions of the Companies Act, 2013, the Company shall at all times have at least one woman director on the Board. Any vacancy of the woman director shall be filled within a period of six months.
Ø Ethnicity – The Company shall promote having a boardroom comprising of people from all ethnic backgrounds so that the directors may efficiently contribute their thorough knowledge, sources and understanding for the benefit of Company’s business;
Ø Physical disability – The Company shall not discriminate on the basis of any immaterial physical disability of a candidate for appointment on the Company’s Board, if he/she is able to efficiently discharge the assigned duties.
Ø Educational qualification– The Directors of the Company shall have a mix of finance, engineering, legal and management background, so that they collectively provide the Company with considerable experience in a range of activities including varied industries, education, policy and investment.

57
3 Remuneration
The level and composition of remuneration to be paid to the MD & CEO, Whole–Time Director(s), KMPs, Senior Management Personnel and other employees shall be reasonable and sufficient to attract, retain and motivate directors, KMPs, Senior Management and other employees of the company. The relationship of remuneration to performance should be clear and should encourage meeting of appropriate performance benchmarks. The remuneration should also involve a balance between fixed and incentive / performance related pay reflecting achievement of short and long–term performance objectives appropriate to the working of the company and meeting its goals.
i. MD & CEO/ WTD
Besides the above Criteria, the Remuneration/ Compensation/ Commission / PRP / Bonus etc. to be paid to MD & CEO/ WTD shall be governed as per provisions of the Companies Act, 2013 and rules made thereunder or any other enactment for the time being in force as also by Company policy.
ii. Non–Executive Directors/ Independent Directors
The Non–Executive / Independent Directors may receive sitting fees for attending meetings of Board or Committee thereof. Provided that the amount of fees shall be such as determined by the Board of Directors from time to time.
iii. Senior Management Personnel / KMPs
The Remuneration to be paid to Senior Management Personnel / KMPs shall be based on the remuneration policy of the Company and the experience, qualification and expertise of the related personnel and shall be decided by the MD & CEO (for KMPs other than those who are at the WTD / Board level) of the Company as per the internal process in consonance with the limits, if any, prescribed under the Companies Act, 2013 and rules made thereunder or any other enactment for the time being in force.
iv. Other Employees
The power to decide structure of remuneration for other employees has been designed in the Remuneration policy and implementation of the same is to be ensured by MD & CEO of the Company or any other personnel that the MD & CEO may deem fit to delegate.
DISCLOSURE OF THIS POLICY
This Nomination & Remuneration policy shall be disclosed in the Board’s report as required under the Companies Act, 2013 and in the Listing Agreement.
REVIEW
The Committee may assess the adequacy of this Policy and make any necessary or desirable amendments from time to time to ensure it remains consistent with the Board’s objectives, current laws and best practices.

58
Annexure – VIIForm No. AOC–1
(Pursuant to first proviso to sub–section (3) of section 129 read with rule 5 of Companies (Accounts) Rules, 2014)
Statement containing salient features of the financial statement of subsidiaries/ associate companies/ joint venture
Part A Subsidiaries(Information in respect of each subsidiary to be presented with amounts in Rs.)
1 Name of the subsidiary N.A.
2 The date since when subsidiary was acquired N.A.
3 Reporting period for the subsidiary concerned, if different from the holding company’s reporting period N.A.
4 Reporting currency and Exchange rate as on the last date of the relevant financial year in the case of foreign subsidiaries.
N.A.
5 Share capital N.A.
6 Reserves and surplus N.A.
7 Total assets N.A.
8 Total Liabilities N.A.
9 Investments N.A.
10 Turnover N.A.
11 Profit before taxation N.A.
12 Provision for taxation N.A.
13 Profit after taxation N.A.
14 Proposed Dividend N.A.
15 Extent of shareholding (in percentage) N.A.
Notes: The following information shall be furnished at the end of the statement:1. Names of subsidiaries which are yet to commence operations– N.A.2. Names of subsidiaries which have been liquidated or sold during the year – N.A
Part B Associates and Joint VenturesStatement pursuant to Section 129 (3) of the Companies Act, 2013 related to Associate Companies and Joint Ventures
Name of Associates or Joint Ventures R.S. India Wind Energy Private Limited (Rs. In lakhs)
Varam Bio Energy Private Limited (Rs. In lakhs)
1 Latest audited Balance Sheet Date 31st March, 2014 31st March, 2016
2 Date on which the Associate or Joint Venture was associated or acquired 22nd March, 2008 31st January, 2008
3
Shares of Associate or Joint Ventures held by the company on the year end
No. 6,11,21,415 43,90,000
Amount of Investment in Associates or Joint Venture 6,112.14 439.00
Extent of Holding (in percentage) 37% 26%
4 Description of how there is significant influence Note A Note A
5 Reason why the associate/joint venture is not consolidated Note B Note B
6 Net worth attributable to shareholding as per latest audited Balance Sheet Rs. 4,737 Nil (Note C)
7 Profit or Loss for the year
i. Considered in Consolidation Nil Nil
ii. Not Considered in Consolidation Nil Nil
Note A : There is significant influence due to holding more than 20% share capital.Note B: The audited accounts were not made available by associate.Note C: The Company has fully provided for diminution in investment held in associates and the Company does not have any further obligations over and above
the amount invested.1. Names of associates or joint ventures which are yet to commence operations: N.A.2. Names of associates or joint ventures which have been liquidated or sold during the year:N.A.
For and on behalf of the Board PTC India Financial Services Limited
Sd/–Dr. Pawan Singh
Date : 1st August, 2019 Managing Director & CEOPlace : New Delhi DIN : 00044987

59
Annexure– VIIIBUSINESS RESPONSIBILITY REPORT
Regulation 34(2)(f) of SEBI (Listing Obligations and Disclosure Requirements) Regulations 2015
PTC India Financial Services Limited (PFS) Business Responsibility Report 2018–2019 includes our responses to questions on our practices and performance on key principles defined by Regulation 34 (2)(f) of SEBI (Listing Obligations and Disclosure Requirements) Regulations 2015, covering topics across environment, governance, and stakeholder relationships.
SECTION A: GENERAL INFORMATION ABOUT THE COMPANY
1 Corporate Identity Number (CIN) of the Company L65999DL2006PLC153373
2 Name of the Company PTC India Financial Services Limited (hereinafter referred to as ‘Company’/ PFS)
3 Registered Office 7th Floor, Telephone Exchange Building, 8, Bhikaji Cama Place, New Delhi–110066
4 Website www.ptcfinancial.com
5 E–mail id [email protected]
6 Financial Year Reported April 1, 2018 to March 31, 2019
7 Sector that the Company is Activity code wise PTC India Financial Services Limited (PFS) is a Non–banking Finance Company (NBFC) classified as Infrastructure Finance Company (IFC) by the Reserve Bank of India. The Company is incorporated to provide finance and financial services to the infrastructure/ non infrastructure projects.
8 List three key products that Company manufactures (as Per Balance Sheet)
PFS is into lending business and not manufacturing.
9 Total Number of Locations where business activity is undertaken by the Company
One (1)
10 Markets served by the Company – Local/State/National/International/
National
SECTION B: FINANCIAL DETAILS OF THE COMPANY
1 Paid up Capital (INR’ lakhs) 64,228.33
2 Total Turnover (INR’ lakhs) 133,651.22
3 Total Profit after taxes (INR’ lakhs) 18,414.26
4 Total Spending on Corporate Social Responsibility (CSR) as percentage of profit after tax (%)
Rs 916.41 lakhs was spend during the FY 2018–19 against the obligation of Rs. 951.33 lakhs (2% of average profit of last three year) PFS spent 96.32% of the obligation.
5 List of activities in which expenditure in 4 above has been incurred
The CSR activities in which the expenditure has been incurred have been listed below:
• PFS has partnered with HLFPPT to run three mobile health clinics (MHC’s) for three years in its effort to promote health care including preventive health care;
• PFS has partnered with Indian Green Services, a reputed NGO to implement a decentral-ized waste to energy project in Delhi;
• PFS has made contribution of INR 2 crores towards PM relief fund;
• PFS has partnered with a global NGO, SOS Children’s Village for Digitisation of their village homes; 136 desktop computers along with internet and other supporting infra-structure will be donated as part of the Project; PTC India Foundation Trust is the moni-toring and implementing organization;
• PFS organized a 28 day skill development programme for the underprivileged youth in Bhadla, a remote location at Jodhpur, Rajasthan. The underprivileged youth were trained to set up and maintain solar panels on roof tops as well as in the solar park. This train-ing was conducted in partnership with NTPI (National Power Training Institute) in FY 2017018. However, part payment for the project was released in FY 2018–19.
• PFS partnered with its parent company PTC India in the cleanliness drive in Bhikaji Cama Place under the Swachch Bharat Abhiyan.
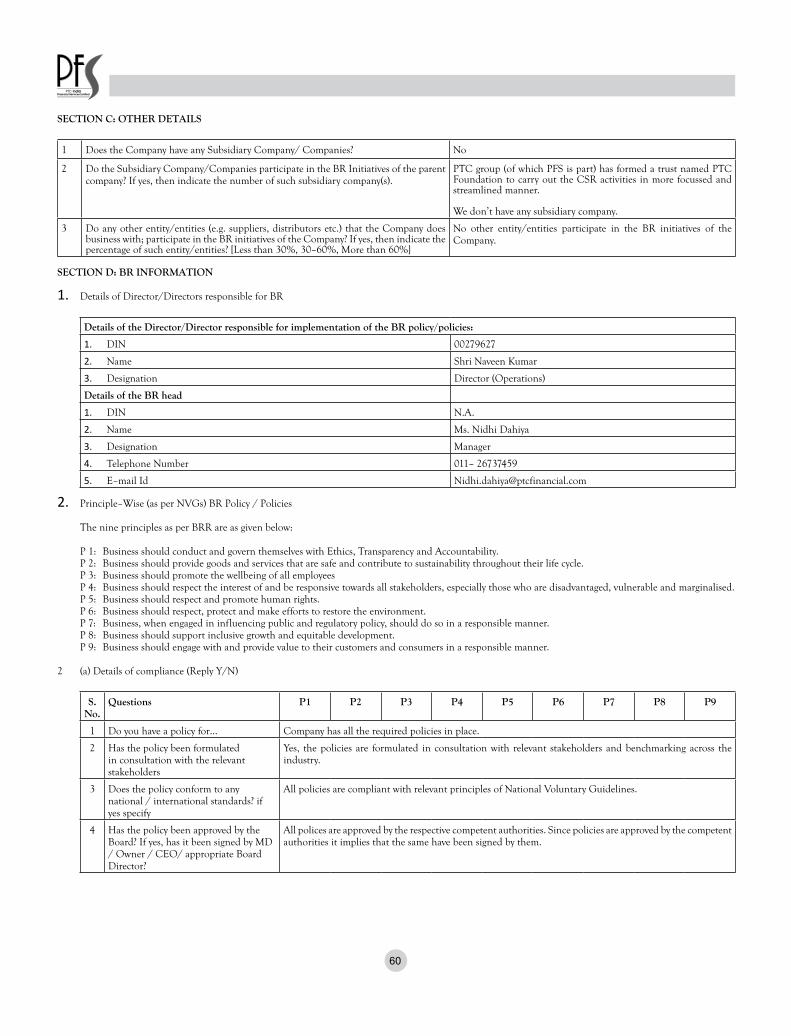
60
SECTION C: OTHER DETAILS
1 Does the Company have any Subsidiary Company/ Companies? No
2 Do the Subsidiary Company/Companies participate in the BR Initiatives of the parent company? If yes, then indicate the number of such subsidiary company(s).
PTC group (of which PFS is part) has formed a trust named PTC Foundation to carry out the CSR activities in more focussed and streamlined manner.
We don’t have any subsidiary company.
3 Do any other entity/entities (e.g. suppliers, distributors etc.) that the Company does business with; participate in the BR initiatives of the Company? If yes, then indicate the percentage of such entity/entities? [Less than 30%, 30–60%, More than 60%]
No other entity/entities participate in the BR initiatives of the Company.
SECTION D: BR INFORMATION
1. Details of Director/Directors responsible for BR
Details of the Director/Director responsible for implementation of the BR policy/policies:
1. DIN 00279627
2. Name Shri Naveen Kumar
3. Designation Director (Operations)
Details of the BR head
1. DIN N.A.
2. Name Ms. Nidhi Dahiya
3. Designation Manager
4. Telephone Number 011– 26737459
5. E–mail Id [email protected]
2. Principle–Wise (as per NVGs) BR Policy / Policies
The nine principles as per BRR are as given below:
P 1: Business should conduct and govern themselves with Ethics, Transparency and Accountability.P 2: Business should provide goods and services that are safe and contribute to sustainability throughout their life cycle.P 3: Business should promote the wellbeing of all employeesP 4: Business should respect the interest of and be responsive towards all stakeholders, especially those who are disadvantaged, vulnerable and marginalised.P 5: Business should respect and promote human rights.P 6: Business should respect, protect and make efforts to restore the environment.P 7: Business, when engaged in influencing public and regulatory policy, should do so in a responsible manner.P 8: Business should support inclusive growth and equitable development.P 9: Business should engage with and provide value to their customers and consumers in a responsible manner.
2 (a) Details of compliance (Reply Y/N)
S. No.
Questions P1 P2 P3 P4 P5 P6 P7 P8 P9
1 Do you have a policy for… Company has all the required policies in place.
2 Has the policy been formulated in consultation with the relevant stakeholders
Yes, the policies are formulated in consultation with relevant stakeholders and benchmarking across the industry.
3 Does the policy conform to any national / international standards? if yes specify
All policies are compliant with relevant principles of National Voluntary Guidelines.
4 Has the policy been approved by the Board? If yes, has it been signed by MD / Owner / CEO/ appropriate Board Director?
All polices are approved by the respective competent authorities. Since policies are approved by the competent authorities it implies that the same have been signed by them.

61
5 Does the Company have a specified committee of the Board / Director / official to oversee the implementation of the policy?
The Board of Directors of the Company along with the Audit Committee, Corporate Social Responsibility Committee, Nomination & Remuneration Committee, Stakeholders Grievance Committee are responsible for overall effective implementation & monitoring of the BR policies adopted on respective principles.
Further, each policy has also been mapped with the respective departments, who are responsible for its implementation & monitoring on the ground and submit necessary report to the Board of Directors.
6 Indicate the link for the policy to be viewed online?
Code of Conduct, Whistle Blower Policy and CSR Policy can be accessed at
https://www.ptcfinancial.com/cms/showpage/page/codes–policies
Other policies are internal policies of the Company and are not available on the website of the Company. However, the same are available on the intranet for PFS employees.
The details of grievance redressal mechanism available for customers and for third party complaints are also available at our website along with above stated policies. Refer the below link: https://www.ptcfinancial.com/cms/showpage/page/grievances–redressal–mechanism
7 Has the policy been formally communicated to all the relevant internal and external stakeholders?
The policies posted on the Company’s website are available for all stakeholders. For internal stakeholders, appropriate means of communication like intranet, mail communication etc. is available.
8. Does the Company have in house structure to implement the policy/ policies
Yes, time to time on need basis, committee is formed to review the policies and implement the same.
9. Does the company have a grievance redressal mechanism related to the policy / policies to address stakeholders’ grievances related to the policy/ policies
Yes
10. Has the company carried out independent audit / evaluation of the working of this policy by an internal or external agency?
The Board/Committee of the Board reviews the policies at periodic intervals on need basis.
2 (b). If answer to S.No.1 against any principle is “No”, please explain why: (Tick Upto 2 Options– NA)
S. No.
Questions P1 P2 P3 P4 P5 P6 P7 P8 P9
1 The Company has not understood the Principles
2 The Company is not at a stage where it finds itself in a position to formulate and implement the policies on specified principles
3 The Company does not have financial or manpower resources available for the task
4 It is planned to be done within next 6 months
5 It is planned to be done within next 1 Year
6. Any other reason (please specify)
3. Governance related to BR
Indicate the frequency with which the Board of Directors, Committee of Directors or CEO to access the BR performance of the Company. Within 3 months, 3 months – 6 months, annually more than 1 year.
Yes, annually. We have constituted a corporate social responsibility (CSR) committee of the Board which oversees our CSR strategy and progress. For more details on the frequency of the committee’s meeting, refer to the ‘Corporate social responsibility committee’ sub– section in the Corporate Governance Report, and the ‘Corporate Governance’ section in the Board’s Report, which are part of this Annual Report.
Does the Company publish a BR or sustainability report? What is the hyperlink for viewing this report? How frequently it is published?
In the past as well, PFS has published its Sustainability report for financial year 2015–16 in accordance with GRI G4 reporting guidelines. The 2015–16 Sustainability Report can be accessed at https://www.ptcfinan-cial.com/cms/showpage/page/sustainability

62
SECTION E: PRINCIPLE WISE PERFORMANCE
Principle No.
Description Response
P–1 Business should conduct and govern themselves with Ethics, Transparency and Accountability.
1.1 Does the policy relating to ethics, bribery and corruption cover only the Company? Yes / No. Does it extend the group / joint ventures/ suppliers/ contractors/ NGOs/ others?
The Company has adopted the Code of Business Conduct and Ethics, governing conduct of the business of the Company in an ethical manner. Polices of the Company are aligned with those of the parent company i.e. ‘PTC India Limited’. It applies to the Directors, Key Managerial Personnel and Senior Management of the Company. The Company obtains an annual confirmation affirming compliance with the Code from the Directors, Key Managerial Personnel and Senior Management every year.
The Company has in place:• Whistle Blower Policy: It provides an avenue for Directors and employees to inform
about any wrongdoing in the Company and reassurance that they will be protected from victimization for whistle blowing.
• Code of Conduct for Prevention of Insider Trading: It prevents insider trading and protect price sensitive information.
Further, PFS does not have any joint venture /suppliers/ contractors etc.
1.2 How many stakeholder complaints have been received in the past financial year and what percentage was satisfactorily resolved by the management? If so provide the details thereof in about 50 words or so.
The details of the complaints of the investor are provided in the report on corporate governance. All complaints received during the year were dealt by the competent authority.
P–2 Business should provide goods and services that are safe and contribute to sustainability throughout their life cycle
2.1 List upto 3 of your products whose design has incorporated social or environmental concerns, risks and / or opportunities.
PFS is a NBFC engaged in lending primarily in infrastructure and power sector with a view on sustainable lending and has established an ESMS (environmental and social management system) which assesses E&S risks associated with projects financed by PFS and stipulates conditions to mitigate adverse impacts.
To further reduce carbon footprint from our operations, PFS on its balance sheet has commissioned a wind project of 6 MW in the state of Karnataka. PPA for the project has been signed with Karnataka Discom for 25 years. The energy generated by the wind project exceeds the electric energy consumption at our Delhi office, thus offsetting the emissions from our operations/services.
Additionally, our CSR initiatives listed under section B of this report creates positive social and environmental impact.
2.2 For each such product, provide the following details in respect of resource use (energy, raw material etc.) per unit of product (optional):
a. Reduction during the sourcing / production/ distribution achieved since the previous year throughout the value chain.
b. Reduction during usage by consumers (energy, water) has been achieved since the previous year?
Not applicable directly, as PFS in not engaged in manufacturing business and only human resource is engaged by PFS to carry out its operations.
Though, as part of sustainable lending PFS encourages its borrowers to follow IFC performance standards to ensure environmental and social sustainability which deals with the aspects of resource efficiency and conservation. Hence, indirectly contributing to resource conservation.
We have also adopted several direct measures to reduce carbon footprint from our office operations. Some of the initiatives include:
• Implementing established energy reduction measures, such as air –conditioning and lighting controls in the buildings we occupy.
• Installing energy efficient LED lighting in our office, replacing all other light.• Ensuring all lights, computers and other equipment are powered off when not in
use during extended periods of time, including at night and at weekends
2.3 Does the Company have procedures in place for sustainable sourcing (including transportation)?a. If yes, what percentage of your inputs was sourced
sustainably? Also provide details thereof, in about 50 words or so.
Not applicable.
2.4 Has the Company taken any steps to procure goods and services from local and small producers, including communities surrounding their place of work?
a. If yes, what steps have been taken to improve their capacity and capability of local and small vendors?
Not applicable.
2.5 Does the company have a mechanism to recycle products and waste? If yes what is the percentage of recycling of products and waste (separately as <5%, 5–10%, >10%). Also provide details thereof, in about 50 words or so.
Not applicable as PFS is not into product manufacturing, thus recycling is not applicable to us.
E–waste generated from our operations is handed over to CPCB (Central Pollution Control Board) certified vendors.

63
P–3 Business should promote the well–being of all employees
3.1 Please indicate the total number of employees 47 permanent employees as on 31st March, 2019.
3.2 1. Please indicate the total of employees hired on temporary / contractual / casual basis.
Total 15 personnel (two are on direct contract of the company) have been hired by PFS on contractual basis.
3.3 2. Please indicate the number of permanent women employees
Eight (8)
3.4 3. Please indicate the number of permanent employees with disabilities
One (1)
3.5 4. Do you have an employee association that is recognised by management?
Yes, there is an employee welfare association by the name of ERA (Employees Recreation Association) which is recognized by PFS. It plans recreational activities which fosters team spirit and encourages organizational belongingness.
3.6 What percentage of your permanent employees is members of this recognized employee association?
100%; all permanent employees are members of this association.
3.7 Please indicate the number of complaints relating to child labour, forced labour, involuntary labour, sexual harassment in the last financial year and pending as on the end of the financial year:
Nil
S. No.
Category No. of complaints filed during the
financial year
No. of complaints pending as on end of
the financial year
1. Child labour / forced labour / involuntary labour
Nil Nil
2. Sexual Harassment Nil Nil
3. Discriminatory employment Nil Nil
3.8 What percentage of your under mentioned employees were given safety & skill upgradation training in the last year?
• Permanent employees • Permanent women employees• Casual/ Temporary / Contractual Employees• Employees with disabilities
S. No.
Category (who were provided skill upgradation training)
No. of employees to whom training has been imparted
1. Permanent employees 47/47; 100%
2. Permanent women employees 8 women were provided training in FY 2018–19; hence 100%.
3. Casual/ Temporary/ Contractual Employees
13/15; 86%(Persons under contract of services have also been provided training).
4. Employees with disabilities 1; 100%
P– 4 Business should respect the interest of and be responsive towards all stakeholders, especially those who are disadvantaged, vulnerable and marginalised
4.1 Has the Company mapped its internal and external stakeholders?
Yes, stakeholders of the company have been mapped through a formal process of consultation.
Key stakeholders identified by PFS are:
• Internal stakeholders (Employees)• External Stakeholders (Borrowers, Lenders, Shareholders, government and regulatory
body, community, portfolio companies and PTC India (parent company).
4.2 Out of the above, has the company identified the disadvantaged, vulnerable & marginalized stakeholders?
PFS has a sexual harassment policy in place. Moreover, there is a whistle blower policy whereby an employee with any grievance can raise the issue with the top management fearlessly. Further, as part of the CSR initiative, we engage with the disadvantaged, vulnerable & marginalized stakeholders
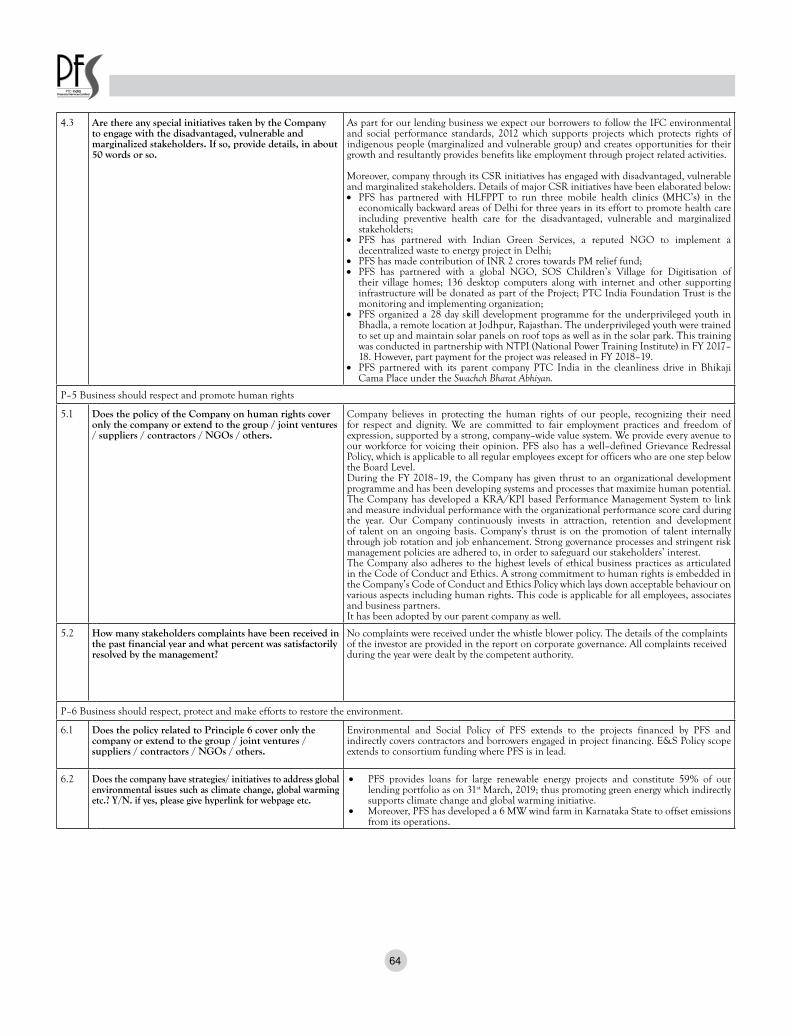
64
4.3 Are there any special initiatives taken by the Company to engage with the disadvantaged, vulnerable and marginalized stakeholders. If so, provide details, in about 50 words or so.
As part for our lending business we expect our borrowers to follow the IFC environmental and social performance standards, 2012 which supports projects which protects rights of indigenous people (marginalized and vulnerable group) and creates opportunities for their growth and resultantly provides benefits like employment through project related activities.
Moreover, company through its CSR initiatives has engaged with disadvantaged, vulnerable and marginalized stakeholders. Details of major CSR initiatives have been elaborated below: • PFS has partnered with HLFPPT to run three mobile health clinics (MHC’s) in the
economically backward areas of Delhi for three years in its effort to promote health care including preventive health care for the disadvantaged, vulnerable and marginalized stakeholders;
• PFS has partnered with Indian Green Services, a reputed NGO to implement a decentralized waste to energy project in Delhi;
• PFS has made contribution of INR 2 crores towards PM relief fund;• PFS has partnered with a global NGO, SOS Children’s Village for Digitisation of
their village homes; 136 desktop computers along with internet and other supporting infrastructure will be donated as part of the Project; PTC India Foundation Trust is the monitoring and implementing organization;
• PFS organized a 28 day skill development programme for the underprivileged youth in Bhadla, a remote location at Jodhpur, Rajasthan. The underprivileged youth were trained to set up and maintain solar panels on roof tops as well as in the solar park. This training was conducted in partnership with NTPI (National Power Training Institute) in FY 2017–18. However, part payment for the project was released in FY 2018–19.
• PFS partnered with its parent company PTC India in the cleanliness drive in Bhikaji Cama Place under the Swachch Bharat Abhiyan.
P–5 Business should respect and promote human rights
5.1 Does the policy of the Company on human rights cover only the company or extend to the group / joint ventures / suppliers / contractors / NGOs / others.
Company believes in protecting the human rights of our people, recognizing their need for respect and dignity. We are committed to fair employment practices and freedom of expression, supported by a strong, company–wide value system. We provide every avenue to our workforce for voicing their opinion. PFS also has a well–defined Grievance Redressal Policy, which is applicable to all regular employees except for officers who are one step below the Board Level. During the FY 2018–19, the Company has given thrust to an organizational development programme and has been developing systems and processes that maximize human potential. The Company has developed a KRA/KPI based Performance Management System to link and measure individual performance with the organizational performance score card during the year. Our Company continuously invests in attraction, retention and development of talent on an ongoing basis. Company’s thrust is on the promotion of talent internally through job rotation and job enhancement. Strong governance processes and stringent risk management policies are adhered to, in order to safeguard our stakeholders’ interest.The Company also adheres to the highest levels of ethical business practices as articulated in the Code of Conduct and Ethics. A strong commitment to human rights is embedded in the Company’s Code of Conduct and Ethics Policy which lays down acceptable behaviour on various aspects including human rights. This code is applicable for all employees, associates and business partners. It has been adopted by our parent company as well.
5.2 How many stakeholders complaints have been received in the past financial year and what percent was satisfactorily resolved by the management?
No complaints were received under the whistle blower policy. The details of the complaints of the investor are provided in the report on corporate governance. All complaints received during the year were dealt by the competent authority.
P–6 Business should respect, protect and make efforts to restore the environment.
6.1 Does the policy related to Principle 6 cover only the company or extend to the group / joint ventures / suppliers / contractors / NGOs / others.
Environmental and Social Policy of PFS extends to the projects financed by PFS and indirectly covers contractors and borrowers engaged in project financing. E&S Policy scope extends to consortium funding where PFS is in lead.
6.2 Does the company have strategies/ initiatives to address global environmental issues such as climate change, global warming etc.? Y/N. if yes, please give hyperlink for webpage etc.
• PFS provides loans for large renewable energy projects and constitute 59% of our lending portfolio as on 31st March, 2019; thus promoting green energy which indirectly supports climate change and global warming initiative.
• Moreover, PFS has developed a 6 MW wind farm in Karnataka State to offset emissions from its operations.

65
6.3 Does the company identify and assess potential environmental risks
To promote sustainable lending and to ensure compliance with our environmental and social management systems, PFS either internally or with the help of third party conducts environmental and social due diligence to assess environmental and social risks associated with the projects financed by PFS.In line with our established ESMS, the due diligence scope includes verification of relevant environmental and social aspects of the project in line within the reference framework (including the current operations and the future planned additions/ expansions). It includes but not be limited to the following aspects: • Environmental impact management;• Social impact management;• Health and safety management;• Human resources management (including human rights and labour standards); and• Community engagement.
6.4 Does the company have any project related to clean development mechanism? If so, provide details hereof, in about 50 words or so. Also if yes, whether any environmental compliance report is filed?
PFS is into lending business and we finance renewable energy projects which are based on clean and green fuel.PFS has a single 6 MW wind power project in Karnataka state and no environmental compliance report is required to be filled for ‘white’ category project as per CPCB revised categorization.
6.5 Has the company undertaken any other initiatives on–clean technology, energy efficiency and renewable energy, etc. Y/N. if yes, please give hyperlink for web page, etc.
• PFS disposes of its e–waste through CPCB certified vendor. • To promote renewable energy, as on 31st March, 2019 PFS’s renewable portfolio is 59%
of the total portfolio. • Moreover, PFS has developed a 6 MW wind farm in Karnataka State which got
commissioned in May, 2010.
6.6 Are the emission / waste generated by the Company within the permissible limits given by CPCB/ SPCB for the financial year being reported?
Not applicable.
6.7 Number of show cause / legal notices received from CPCB / SPCB which are pending (i.e. not resolved to satisfaction) as on end of the financial year.
None.
P– 7 Business, when engaged in influencing public and regulatory policy, should do so in a responsible manner.
7.1 Is your company a member of any trade and chamber or association? if yes, name only those major ones that your business deals with.
No
7.2 Have you advocated/lobbied through above associations for the advancement or improvement of public good? Yes / No; if yes specify the broad areas (drop box: governance and administration, economic reforms, inclusive development policies, energy security, water, food security, sustainable business principles, others)
No
P–8 Business should support inclusive growth and equitable development.
8.1 Does the company have specified programmes / initiatives / projects in pursuit of the policy related to Principle 8? if yes details thereof.
PFS has established and implemented robust environmental and social management systems (ESMS) which is applicable to our lending business (core business). As part of the sustainable lending and as committed in our Environmental and Social (E&S) policy, PFS provides lending for projects which strive to minimize, mitigate or compensate adverse impacts on workers, affected communities and the environment. E&S Policy also states, that PFS would support lending to projects where affected communities are engaged on project related issues that could potentially affect them. We also support the principles of inclusive growth and equitable development through the CSR initiatives taken by PFS as well as through our core business as elaborated above. Details of CSR activities have been already elaborated in above sections.
8.2 Are the programmes / projects undertaken through in house team / own foundation / external NGO/ government structure/ any other organisation?
We directly do not engage in any such activities, however as stated in above column we support lending for projects which through its operations promotes aspects of inclusive growth and equitable development. CSR initiatives have been undertaken through PTC foundation/ by PFS itself and also through government institutes. Details of CSR activities have been presented in above sections.
8.3 Have you done any impact assessment of your initiative? The key objective of our ESMS, is to identify and assess the environmental and social impacts in the project’s area of influence and as part of the project appraisal process, PFS conducts environmental and social due diligence for the projects to assess the impacts of the project. Subsequently, to minimize the adverse impacts of the project an environmental and social action plan (ESAP) is prepared to improve the E&S performance of the company/project.Apart from this, the approved projects are monitored on annual/ once in two years frequency based on the project categorization.It should be noted that more than 50% of our portfolio as of 31st March, 2019 was in renewable sector. Pursuant to the solar training extended to 20 number persons in Jodhpur, Rajasthan, 4 persons got immediate placement while for others opportunities shall arise in future. PFS also has plans to conduct formal impact assessment studies for its CSR initiatives in future.

66
8.4 What is your company’s direct contribution to community development projects– Amount in INR and details of the projects undertaken?
The details have been already captured under section B and Section E (sub section 4.3) of the report. Please refer for details.
8.5 Have you taken steps to ensure that this community development initiative is successfully adopted by the community? Please explain in 50 words or so.
Prior to undertaking an initiative, PFS engages with the community to assess the need and ensure that the activity/ initiatives benefit the community. Formal impact assessment studies would be conducted in future to assess the success of the programme, once the project is implemented.
P–9 Business should engage with and provide value to their customers and consumers in a responsible manner
9.1 What percentage of customer complaints/consumer cases are pending as on the end of the financial year.
Nil
9.2 Does the company display product information on the product label, over and above what is mandated as per local laws? Yes/No/N.A/Remarks (additional information)
Not Applicable
9.3 Is there any case filed by any stakeholder against the company regarding unfair trade practices, irresponsible advertising and / or anti–competitive behaviour during the last five years and pending as on the end of financial year. If so, provide the details thereof, in about 50 words.
Nil
9.4 Did your company carry out any consumer survey / consumer satisfaction trends?
Yes. PFS conducts customers/ borrowers / developers meet to discuss customer satisfaction, their feedback on our services, products and new offerings from time to time.Moreover, feedback was sought from the stakeholders through e–mails.
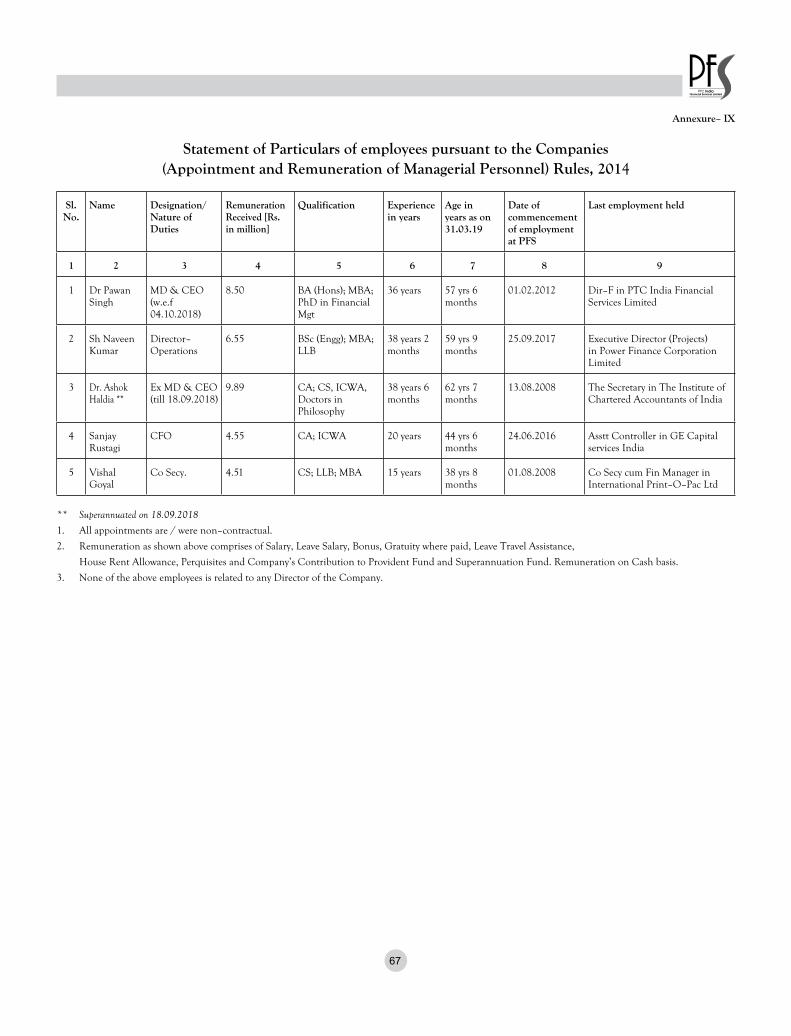
67
Annexure– IX
Statement of Particulars of employees pursuant to the Companies (Appointment and Remuneration of Managerial Personnel) Rules, 2014
Sl. No.
Name Designation/ Nature of Duties
Remuneration Received [Rs. in million]
Qualification Experience in years
Age in years as on 31.03.19
Date of commencement of employment at PFS
Last employment held
1 2 3 4 5 6 7 8 9
1 Dr Pawan Singh
MD & CEO (w.e.f 04.10.2018)
8.50 BA (Hons); MBA; PhD in Financial Mgt
36 years 57 yrs 6 months
01.02.2012 Dir–F in PTC India Financial Services Limited
2 Sh Naveen Kumar
Director–Operations
6.55 BSc (Engg); MBA; LLB
38 years 2 months
59 yrs 9 months
25.09.2017 Executive Director (Projects) in Power Finance Corporation Limited
3 Dr. Ashok Haldia **
Ex MD & CEO (till 18.09.2018)
9.89 CA; CS, ICWA, Doctors in Philosophy
38 years 6 months
62 yrs 7 months
13.08.2008 The Secretary in The Institute of Chartered Accountants of India
4 Sanjay Rustagi
CFO 4.55 CA; ICWA 20 years 44 yrs 6 months
24.06.2016 Asstt Controller in GE Capitalservices India
5 Vishal Goyal
Co Secy. 4.51 CS; LLB; MBA 15 years 38 yrs 8 months
01.08.2008 Co Secy cum Fin Manager in International Print–O–Pac Ltd
** Superannuated on 18.09.2018
1. All appointments are / were non–contractual.
2. Remuneration as shown above comprises of Salary, Leave Salary, Bonus, Gratuity where paid, Leave Travel Assistance,
House Rent Allowance, Perquisites and Company’s Contribution to Provident Fund and Superannuation Fund. Remuneration on Cash basis.
3. None of the above employees is related to any Director of the Company.

68
Annexure– X
CEO and CFO Certificate to the Board
(Under Regulation 17(8) of Securities and Exchange Board of India (Listing Obligations and Disclosure Requirements) Regulations, 2015)
Date : 4th May, 2019
We Certify to the Board that:–
A. We have reviewed financial statements and the cash flow statement for the year ended March 31, 2019 and that to the best of their knowledge and belief:
(1) these statements do not contain any materially untrue statement or omit any material fact or contain statements that might be misleading;
(2) these statements together present a true and fair view of Company’s affairs and are in compliance with existing accounting standards, applicable laws and regulations.
B. There are, to the best of our knowledge and belief, no transactions entered into by the Company during the year which are fraudulent, illegal or violative of the Company’s code of conduct.
C. We accept responsibility for establishing and maintaining internal controls for financial reporting and that we have evaluated the effectiveness of internal control systems of the listed entity pertaining to financial reporting and we have disclosed to the auditors and the audit committee, deficiencies in the design or operation of such internal controls, if any, of which we are aware and the steps we have taken or propose to take to rectify these deficiencies.
D. We have indicated to the auditors and the Audit Committee:–
(1) significant changes in internal control over financial reporting during the year;
(2) significant changes in accounting policies during the year and that the same have been disclosed in the notes to the financial statements; and
(3) instances of significant fraud of which we have become aware and the involvement therein, if any, of the management or an employee having a significant role in the listed entity’s internal control system over financial reporting.
Sd/– Sd/– Dr. Pawan Singh Sanjay RustagiPlace : New Delhi MD & CEO CFO
69
Annexure– XIWhistleblower Policy
1.0 Background
The Company believes in the conduct of the affairs of its constituents in a fair and transparent manner by adopting highest standards of professionalism, honesty, integrity and ethical behavior.
Clause 49 of the Listing Agreement between listed companies and the Stock Exchanges, inter alia, provides for a non–mandatory requirement for all listed companies to establish a mechanism called ‘Whistle Blower Policy’ for employees to report to the management instances of unethical behaviour, actual or suspected, fraud or violation of the Company’s code of conduct or ethics policy.
‘Whistleblowing’ is the confidential disclosure by an individual of any concern encountered in the workplace relating to a perceived wrongdoing. The Whistleblower’s role is that of a reporting party with reliable information. Protected Disclosure will be appropriately dealt by Audit Committee, as the
case may be.
The terms such as ‘Company’, ‘Audit Committee’ and ‘Board of Directors’ refer to the relevant Company, Committee or Board of the Group Company adopting the policy, unless specified. The definitions of some key terms used in this Policy are mentioned below:
A. “Audit Committee” means the Committee constituted by the Board of Directors of the Company in accordance with the Companies Act and read with Clause 49 of the Listing Agreement with the Stock Exchange.
B. “Employee” means every employee of the Company, including the whole time Directors of the Company.C. “Protected Disclosure” means any communication made in good faith that discloses or demonstrates information that may evidence unethical or
improper activity.D. “Whistleblower” means any Employee making a Protected Disclosure under this Policy.E “Ombudsperson” or “Nodal Officer” for the purpose of receiving all complaints under this Policy and ensuring appropriate action.
2.0 Policy Objective
The policy has been framed to enforce controls so as to provide a system of detection, reporting, prevention and appropriate dealing of issues relating to fraud, unethical behavior etc. The policy aims to ensure that:–
A. Management is aware of its responsibility for the detection and prevention of fraud, misappropriations, and other inappropriate conduct. The Management is to ensure that procedures and systems exist in the Corporation which minimize the incidence of, and opportunity for fraud and irregularities.
B. Any fraud / unethical issue that are detected or suspected must be reported immediately to the designated authority for the purpose of co–ordination of preliminary investigation.
C. To encourage all employees to feel confident in raising concerns and to question and act upon concerns about practice.D. To ensure that an employee receives a response to his concerns and that the employee is aware of how to pursue them if he/she is not satisfied.
3.0 Types of Concern
A. Forgery or alteration of any document or account belonging to the Company.B. Sexual or physical abuseC. Willful suppression of facts/ deception in matters of appointments, placements, tender committee recommendations, entity and project appraisal,
submission of reports, etc. as a result of which a wrongful gain(s) is made to one and /or wrongful loss(s) is caused to the others.D. Utilizing Company assets/ funds/ services for personal purposes other than those which have specifically provided for personal purposes.E. Authorizing or receiving payments for goods not supplied or services not rendered.F. Destruction, disposition, removal of records or any other assets of the Corporation with an ulterior motive to manipulate and misrepresent the facts so
as to create suspicion/ suppression/ cheating as a result of which objective assessment/ decision would not be arrived at.G. Impropriety in the handling or reporting of money or financial transactions.
H. Profiteering as a result of insider knowledge of company activities.
I. Disclosing confidential and proprietary information to outside parties.
J. Accepting or seeking anything of material value from contractors, vendors, lenders, borrowers and persons providing services/ materials to the company in contravention of Company’s Conduct, Discipline and Appeal Rules.
K. Conduct which is an offence or a breach of law.
L. Other unethical conduct like gross misconduct, general malpractices etc
The Competent Authority will not tolerate any harassment or victimization (including informal pressures) and will take appropriate action.

70
4.0 Confidentiality
All concerns will be treated in confidence and every effort will be made not to reveal the Whistleblower’s identity. At the appropriate time, however, the Whistleblower might need to come forward as a witness.
Please note that:A. An employee must believe the disclosure of information is in the interest of the Company / its stakeholders / public.B. Staff must not act maliciously or make false allegations.C. Staff must not seek any personal gain.
5.0 Voicing Concerns
5.1 This essentially means that boards expect their internal audit functions to identify issues before they become a major problem for the company.5.2 They expect internal auditors to take appropriate actions to mitigate them and provide assurance that they pose no immediate or serious danger.5.3 The Ombudsperson / Nodal officer shall be nominated by the Chairman of the Audit Committee. The Company may adopt either of the following two
alternatives for addressing the whistleblower issues:
I. Alternative–1
1. Whistleblower should give the detailed report/complaint to the Ombudsperson / Nodal officer.2. Report/Complaint would then be screened by the Nodal officer who would forward the report/complaint to the Chairman of Audit Committee.
Report/Complaint would finally be reviewed by the Chairman of Audit Committee.3. All complaints would be recorded regardless of the context it held.4. Nodal officer would apprise the Audit committee on regular intervals about all the complaints received.5. If the whistleblower believes that there is a conflict of interest between the Nodal Officer/Ombudsman and the whistle blower, he/she may send
his protected disclosure directly to the Chairman, Audit Committee.6. The report shall first be forwarded to the Chairman of Audit Committee by the ombudsperson. On submission of report, the Audit Committee
Chairman may discuss the matter with Ombudsperson who shall on advice of the Chairman, may refer the matter before the Audit Committee and/ or Board (the option to forward it to Audit Committee or Board shall be suggested by the Audit Committee Chairman) with his / her recommendations. The Audit Committee and/ or the Board shall decide on the matter.
II. Alternative–2
1. A “Whistle Blower Committee” may be constituted consisting of senior officials to conduct an investigation in the matters of protected disclosure received by company.
2. A report shall be prepared after completion of investigation and shall be submitted along with recommendations to the Managing Director for action, after providing reasonable opportunity of being heard to all associated individuals.
3. It is further proposed that the protected disclosures be addressed to the ombudsperson / nodal officer nominated.4. The protected disclosure against the ombudsperson / nodal officer should be addressed to the Managing Director & CEO of the Company5. The Protected Disclosure against the Managing Director & CEO should be addressed to the Chairman of the Audit Committee.6. All complaints would be recorded regardless of the context it held.
5.4 In case the disclosure made by the whistleblower found to be malafide, frivolous, baseless then the disclosure would not be entertained. Details of the complaints would be recorded & maintained for a term of 5 years or even extended period (for specific complaints) as may be decided by Chairman of Audit Committee.
5.5 Detailed written record of the protected disclosure will include
a. findings of Ombudsperson / Nodal officer’s;
b. The recommendations of the Ombudsperson whether disciplinary / other action(s).
Note: PFS has adopted Alternative–1 provided in the policy and Company Secretary had been appointed as Nodal Officer.

71
Report on the Audit of the Standalone Financial Statements
Opinion
We have audited the accompanying standalone financial statements of PTC India Financial Services Limited (“the Company”), which comprise the Balance Sheet as at March 31, 2019, the Statement of Profit and Loss (including Other Comprehensive Income), the Cash Flow Statement and the Statement of Changes in Equity for the year then ended, and a summary of significant accounting policies and other explanatory information (herein referred to as “the standalone financial statements”).
In our opinion and to the best of our information and according to the explanations given to us, the aforesaid standalone financial statements give the information required by the Companies Act, 2013 (“the Act”) in the manner so required and give a true and fair view in conformity with the Indian Accounting Standards prescribed under section 133 of the Act read with the Companies (Indian Accounting Standards) Rules, 2015, as amended, (“Ind AS”) and other accounting principles generally accepted in India, of the state of affairs of the Company as at March 31, 2019, and its profit, total comprehensive income, its cash flows and changes in equity for the year ended on that date.
Basis for Opinion
We conducted our audit of the standalone financial statements in accordance with the Standards on Auditing specified under section 143(10) of the Act
(SAs). Our responsibilities under those Standards are further described in the Auditor’s Responsibility for the Audit of the standalone financial statements section of our report. We are independent of the Company in accordance with the Code of Ethics issued by the Institute of Chartered Accountants of India (ICAI) together with the ethical requirements that are relevant to our audit of the standalone financial statements under the provisions of the Act and the Rules made thereunder, and we have fulfilled our other ethical responsibilities in accordance with these requirements and the ICAI’s Code of Ethics. We believe that the audit evidence obtained by us is sufficient and appropriate to provide a basis for our audit opinion on the standalone financial statements.
Key Audit Matters
Key audit matters are those matters that, in our professional judgment, were of most significance in our audit of the standalone financial statements of the current period. These matters were addressed in the context of our audit of the standalone financial statements as a whole, and in forming our opinion thereon, and we do not provide a separate opinion on these matters. We have determined the matters described below to be the key audit matters to be communicated in our report.
INDEPENDENT AUDITOR’S REPORTTo The Members of
PTC India Financial Services Limited
Sr. No. Key Audit Matter Auditor’s Response
1. Impairment of loans to customers
Allowance for impairment losses on loans to customers involves significant judgement by management to determine the timing and amount of the asset to be impaired.
Refer Notes 1B (k), 2 (i) and 7 to the standalone financial statements.
Principal Audit Procedures
We assessed the appropriateness of the Company’s impairment review and provisioning policy by comparing with the RBI prudential norms and applicable accounting standards ;
Our audit approach consisted testing of the design and operating effectiveness of the internal controls and substantive testing:
• We evaluated and tested the design and operating effectiveness of the relevant controls over the impairment assessments and impairment allowance computations for loans and advances to customers.
• We tested the management assumptions, estimates and judgements, which could give rise to material misstatement:
a. The completeness and timing of recognition of loss events;
b. The measurement of provisions for individual instances of loans which is dependent on the valuation of security provided and the collaterals against each loan, the timing of cash flows and realisations;
c. We discussed with management and scrutinised the appropriateness of those key assumptions applied in management’s impairment assessment, and compared them with available external evidence where necessary.
d. The measurement of modelled provisions, which is dependent upon key assumptions relating to probability of default, loss given default and expected future recoveries;
e. Performed procedures to obtain comfort on the accuracy of the impairment calcula-tion process through recalculation of the provision charge based on inputs;
f. Assessed accuracy and completeness of disclosures made as required by relevant ac-counting standards.

72
Sr. No. Key Audit Matter Auditor’s Response
2. Expected Credit Losses (ECL) model
As described in the notes to the standalone financial statements, the impairment losses have been deter-mined in accordance with Ind AS 109 Financial In-struments requiring considerable judgment and inter-pretation in its implementation, which also involved significant judgement by management in measuring the expected credit losses. Key areas of judgment in-cluded:
a. Determining the criteria for a significant increase in credit risk (`SICR’)
b. Techniques used to determine the Probability of Default (PD) and Loss Given Default (`LGD’)
c. Assumptions used in the expected credit loss model such as the financial condition of the counterparty, expected future cash flows etc.
Refer Notes 1B (k), 2 (ii), 7 and 45A.2 to the standalone financial statements.
Principal Audit Procedures
We assessed the appropriateness of the Company’s policy on Expected Credit Loss recognition on financial instruments with reference to the applicable accounting standards and prudential norms laid down by RBI.
Our audit approach consisted testing of the design and operating effectiveness of the internal controls and substantive testing:
• We evaluated and tested the design and tested the operating effectiveness of Company’s controls over the data used to determine the impairment reserve, internal credit quality assessments, external credit ratings and methodology followed for computation of ECL.
• For Expected Credit Losses computed by the management, we performed the following procedures:
a. Assessed the reasonableness of assumptions and judgement made by management on model adoption and parameters selection;
b. Examined the key data inputs (valuation of collateral, the timing of cash flows and realisations) to the ECL model on a sample basis to assess their accuracy and com-pleteness;
c. Evaluated and tested on sample basis the appropriateness of staging including deter-mination of significant increase in credit risk.
d. Assessed the Company’s methodology for ECL provisioning, Classification and Measurement with the assistance of our internal experts;
e. Assessed accuracy and completeness of disclosures made as required by relevant ac-counting standards.
3. Revenue Recognition
Revenue recognition- Interest income on stressed loans involves significant management estimates and assumptions in determining both timing and expected realisation from them.
Refer Notes 1B (a), 2 (iv) and 23 to the standalone financial statements.
Principal Audit Procedures
Assessed the appropriateness of the Company’s revenue recognition policy by comparing with applicable accounting standards and prudential norms laid down by RBI.
Our audit approach consisted testing of the design and operating effectiveness of the internal controls and substantive testing:
• Evaluated and tested the design of internal controls relating to revenue recognition on stressed loans and advances.
• Tested the operating effectiveness of the Company’s controls through combination of procedures involving enquiry and observation, reperformance and inspection of evi-dence in respect of operations of these controls.
• Evaluated and tested the management estimates and assumption used while accruing the income on stressed loans and advances.
• Performed recalculation of interest accrual and tested input data, such as principal amounts, contractual interest rates etc. through substantive testing and tracing to source documents. We also took cognizance of the events arose subsequent to the end of the financial year from them.
• Ensured compliance with RBI regulation on revenue recognition for each case.
4. Evaluation of uncertain tax positions for Income taxes
The Company has material uncertain tax positions relating to matters under litigation for Income taxes. These matters involve significant management judgement to determine the possible outcome of disputes.
Refer Notes 1B (p), 2 (iii) and 34 to the standalone financial statements.
Principal Audit Procedures
We obtained details of completed income tax assessments during the year ended March 31, 2019 from the management. We involved our internal experts to challenge the management’s underlying assumptions in estimating the tax provisions and the possible outcome of the disputes. Our internal experts also considered legal precedence and other rulings in evaluating management’s position on these uncertain tax positions relating to Income taxes.
Additionally we considered the effect of new information in respect of uncertain tax positions to evaluate whether any change was required to management’s position on these uncertainties.

73
Information Other than the Financial Statements and Auditor’s Report Thereon
The Company’s Board of Directors is responsible for the preparation of the other information. The other information comprises the information included in the Company’s Directors’ report, Report on Corporate Governance and Management discussion and analysis report, but does not include the standalone financial statements and our auditor’s report thereon. The Directors’ report, Report on Corporate Governance and Management discussion and analysis report is expected to be made available to us after the date of this auditor’s report.
Our opinion on the standalone financial statements does not cover the other information and will not express any form of assurance conclusion thereon.
In connection with our audit of the standalone financial statements, our responsibility is to read the other information identified above when it becomes available and, in doing so, consider whether the other information is materially inconsistent with the standalone financial statements or our knowledge obtained during the course of our audit or otherwise appears to be materially misstated.
When we read the Directors’ report, Report on Corporate Governance and Management discussion and analysis report, if we conclude that there is a material misstatement therein, we are required to communicate the matter to those charged with governance as required under SA 720 ‘The Auditor’s responsibilities Relating to Other Information’.
Management’s Responsibility for the Standalone Financial Statements The Company’s Board of Directors is responsible for the matters stated in section 134(5) of the Act with respect to the preparation of these standalone financial statements that give a true and fair view of the financial position, financial performance including other comprehensive income, cash flows and changes in equity of the Company in accordance with the Ind AS and other accounting principles generally accepted in India. This responsibility also includes maintenance of adequate accounting records in accordance with the provisions of the Act for safeguarding the assets of the Company and for preventing and detecting frauds and other irregularities; selection and application of appropriate accounting policies; making judgments and estimates that are reasonable and prudent; and design, implementation and maintenance of adequate internal financial controls, that were operating effectively for ensuring the accuracy and completeness of the accounting records, relevant to the preparation and presentation of the standalone financial statement that give a true and fair view and are free from material misstatement, whether due to fraud or error.
In preparing the financial statements, management is responsible for assessing the Company’s ability to continue as a going concern, disclosing, as applicable, matters related to going concern and using the going concern basis of accounting unless management either intends to liquidate the Company or to cease operations, or has no realistic alternative but to do so.
Those Board of Directors are also responsible for overseeing the Company’s financial reporting process.
Auditor’s Responsibility for the Audit of the Standalone Financial Statements
Our objectives are to obtain reasonable assurance about whether the standalone financial statements as a whole are free from material misstatement, whether due to fraud or error, and to issue an auditor’s report that includes our opinion. Reasonable assurance is a high level of assurance, but is not a guarantee that an audit conducted in accordance with SAs will always detect a material misstatement when it exists. Misstatements can arise from fraud or error and are considered material if, individually or in the aggregate, they could reasonably be expected to influence the economic decisions of users taken on the basis of these standalone financial statements.
As part of an audit in accordance with SAs, we exercise professional judgment and maintain professional skepticism throughout the audit. We also:
• Identify and assess the risks of material misstatement of the standalone fi-
nancial statements, whether due to fraud or error, design and perform au-dit procedures responsive to those risks, and obtain audit evidence that is sufficient and appropriate to provide a basis for our opinion. The risk of not detecting a material misstatement resulting from fraud is higher than for one resulting from error, as fraud may involve collusion, forgery, inten-tional omissions, misrepresentations, or the override of internal control.
• Obtain an understanding of internal financial control relevant to the au-dit in order to design audit procedures that are appropriate in the circum-stances. Under section 143(3)(i) of the Act, we are also responsible for expressing our opinion on whether the Company has adequate internal financial controls system in place and the operating effectiveness of such controls.
• Evaluate the appropriateness of accounting policies used and the rea-sonableness of accounting estimates and related disclosures made by the management.
• Conclude on the appropriateness of management’s use of the going concern basis of accounting and, based on the audit evidence obtained, whether a material uncertainty exists related to events or conditions that may cast significant doubt on the Company’s ability to continue as a going concern. If we conclude that a material uncertainty exists, we are required to draw attention in our auditor’s report to the related disclo-sures in the standalone financial statements or, if such disclosures are inadequate, to modify our opinion. Our conclusions are based on the audit evidence obtained up to the date of our auditor’s report. However, future events or conditions may cause the Company to cease to continue as a going concern.
• Evaluate the overall presentation, structure and content of the standalone financial statements, including the disclosures, and whether the stand-alone financial statements represent the underlying transactions and events in a manner that achieves fair presentation.
Materiality is the magnitude of misstatements in the financial statements that, individually or in aggregate, makes it probable that the economic decisions of a reasonably knowledgeable user of the standalone financial statements may be influenced. We consider quantitative materiality and qualitative factors in (i) planning the scope of our audit work and in evaluating the results of our work; and (ii) to evaluate the effect of any identified misstatements in the financial statements.
We communicate with those charged with governance regarding, among other matters, the planned scope and timing of the audit and significant audit findings, including any significant deficiencies in internal control that we identify during our audit.
We also provide those charged with governance with a statement that we have complied with relevant ethical requirements regarding independence, and to communicate with them all relationships and other matters that may reasonably be thought to bear on our independence, and where applicable, related safeguards.
From the matters communicated with those charged with governance, we determine those matters that were of most significance in the audit of the standalone financial statements of the current period and are therefore the key audit matters. We describe these matters in our auditor’s report unless law or regulation precludes public disclosure about the matter or when, in extremely rare circumstances, we determine that a matter should not be communicated in our report because the adverse consequences of doing so would reasonably be expected to outweigh the public interest benefits of such communication.
Other Matters
The comparative financial information of the Company for the year ended March 31, 2018 and the related transition date opening balance sheet as at April 1, 2017 included in these standalone financial statements, have been prepared after adjusting previously issued standalone financial statements prepared in accordance with the Companies (Accounting Standards) Rules, 2006 to comply with Ind AS. Adjustments made to the previously issued standalone financial statements to comply with Ind AS have been audited by us.
74
Report on Other Legal and Regulatory Requirements
1. As required by Section 143(3) of the Act, based on our audit we report that:
a) We have sought and obtained all the information and explanations which to the best of our knowledge and belief were necessary for the purposes of our audit.
b) In our opinion, proper books of account as required by law have been kept by the Company so far as it appears from our examination of those books.
c) The Balance Sheet, the Statement of Profit and Loss (including Other Comprehensive Income), the Cash Flow Statement and Statement of Changes in Equity dealt with by this Report are in agreement with the relevant books of account.
d) In our opinion, the aforesaid standalone financial statements comply with the Ind AS specified under Section 133 of the Act.
e) On the basis of the written representations received from the direc-tors as on March 31, 2019 taken on record by the Board of Direc-tors, none of the directors is disqualified as on March 31, 2019 from being appointed as a director in terms of Section 164(2) of the Act.
f) With respect to the adequacy of the internal financial controls over financial reporting of the Company and the operating effective-ness of such controls, refer to our separate Report in “Annexure A”. Our report expresses an unmodified opinion on the adequacy and operating effectiveness of the Company’s internal financial con-trols over financial reporting.
g) With respect to the other matters to be included in the Auditor’s Report in accordance with the requirements of section 197(16) of the Act, as amended:
In our opinion and to the best of our information and according to the explanations given to us, the remuneration paid by the
Company to its directors during the year is in accordance with the provisions of section 197 of the Act.
h) With respect to the other matters to be included in the Auditor’s Report in accordance with Rule 11 of the Companies (Audit and Auditors) Rules, 2014, as amended in our opinion and to the best of our information and according to the explanations given to us:
i. The Company has disclosed the impact of pending litiga-tions on its financial position in its standalone financial statements- Refer to note 34 of the standalone financial statements.
ii. The Company has made provision, as required under the applicable law or accounting standards, for material fore-seeable losses, if any, on long-term contracts includ-ing derivative contracts- Refer to note 49 of the standalone financial statements.
iii. There has been no delay in transferring amounts, required to be transferred, to the Investor Education and Protection Fund by the Company- Refer to note 50 of the standalone financial statements.
2. As required by the Companies (Auditor’s Report) Order, 2016 (“the Or-der”) issued by the Central Government in terms of Section 143(11) of the Act, we give in “Annexure B” a statement on the matters specified in paragraphs 3 and 4 of the Order.
For Deloitte Haskins & SellsChartered Accountants
(Firm’s Registration No. 015125N)
Jitendra AgarwalGurugram, (Partner)May 4, 2019 (Membership No. 87104)
75
Report on the Internal Financial Controls Over Financial Reporting under Clause (i) of Sub-section 3 of Section 143 of the Companies Act, 2013 (“the Act”)
We have audited the internal financial controls over financial reporting of PTC INDIA FINANCIAL SERVICES LIMITED (“the Company”) as of March 31, 2019 in conjunction with our audit of the standalone financial statements of the Company for the year ended on that date.
Management’s Responsibility for Internal Financial Controls
The Company’s management is responsible for establishing and maintaining internal financial controls based on “the internal control over financial reporting criteria established by the Company considering the essential components of internal control stated in the Guidance Note on Audit of Internal Financial Controls Over Financial Reporting issued by the Institute of Chartered Accountants of India”. These responsibilities include the design, implementation and maintenance of adequate internal financial controls that were operating effectively for ensuring the orderly and efficient conduct of its business, including adherence to respective company’s policies, the safeguarding of its assets, the prevention and detection of frauds and errors, the accuracy and completeness of the accounting records, and the timely preparation of reliable financial information, as required under the Companies Act, 2013.
Auditor’s Responsibility
Our responsibility is to express an opinion on the Company’s internal financial controls over financial reporting of the Company based on our audit. We conducted our audit in accordance with the Guidance Note on Audit of Internal Financial Controls Over Financial Reporting (the “Guidance Note”) issued by the Institute of Chartered Accountants of India and the Standards on Auditing prescribed under Section 143(10) of the Companies Act, 2013, to the extent applicable to an audit of internal financial controls. Those Standards and the Guidance Note require that we comply with ethical requirements and plan and perform the audit to obtain reasonable assurance about whether adequate internal financial controls over financial reporting was established and maintained and if such controls operated effectively in all material respects.
Our audit involves performing procedures to obtain audit evidence about the adequacy of the internal financial controls system over financial reporting and their operating effectiveness. Our audit of internal financial controls over financial reporting included obtaining an understanding of internal financial controls over financial reporting, assessing the risk that a material weakness exists, and testing and evaluating the design and operating effectiveness of internal control based on the assessed risk. The procedures selected depend on the auditor’s judgement, including the assessment of the risks of material misstatement of the standalone financial statements, whether due to fraud or error.
We believe that the audit evidence we have obtained is sufficient and appropriate to provide a basis for our audit opinion on the Company’s internal financial controls system over financial reporting.
Meaning of Internal Financial Controls Over Financial Reporting
A company’s internal financial control over financial reporting is a process designed to provide reasonable assurance regarding the reliability of financial reporting and the preparation of standalone financial statements for external purposes in accordance with generally accepted accounting principles. A company’s internal financial control over financial reporting includes those policies and procedures that (1) pertain to the maintenance of records that, in reasonable detail, accurately and fairly reflect the transactions and dispositions of the assets of the company; (2) provide reasonable assurance that transactions are recorded as necessary to permit preparation of standalone financial statements in accordance with generally accepted accounting principles, and that receipts and expenditures of the company are being made only in accordance with authorisations of management and directors of the company; and (3) provide reasonable assurance regarding prevention or timely detection of unauthorised acquisition, use, or disposition of the company’s assets that could have a material effect on the standalone financial statements.
Inherent Limitations of Internal Financial Controls Over Financial Reporting
Because of the inherent limitations of internal financial controls over financial reporting, including the possibility of collusion or improper management override of controls, material misstatements due to error or fraud may occur and not be detected. Also, projections of any evaluation of the internal financial controls over financial reporting to future periods are subject to the risk that the internal financial control over financial reporting may become inadequate because of changes in conditions, or that the degree of compliance with the policies or procedures may deteriorate.
Opinion
In our opinion, to the best of our information and according to the explanations given to us, the Company has, in all material respects, an adequate internal financial controls system over financial reporting and such internal financial controls over financial reporting were operating effectively as at March 31, 2019, based on “the criteria for internal financial control over financial reporting established by the Company considering the essential components of internal control stated in the Guidance Note on Audit of Internal Financial Controls Over Financial Reporting issued by the Institute of Chartered Accountants of India”.
For Deloitte Haskins & SellsChartered Accountants
(Firm’s Registration No. 015125N)
Jitendra AgarwalGURUGRAM, (Partner)May 4, 2019 (Membership No. 87104)
ANNEXURE “A” TO THE INDEPENDENT AUDITOR’S REPORT (Referred to in paragraph 1 (f) under ‘Report on Other Legal and Regulatory Requirements’ of our report of even date)

76
ANNEXURE “B” TO THE AUDITOR’S REPORT(Referred to in paragraph 2 under ‘Report on Legal and Regulatory Requirements’ section of our report of even date)
(i) In respect of its fixed assets:
(a) The Company has maintained proper records showing full particulars, including quantitative details and situation of the fixed assets.
(b) The fixed assets were physically verified during the year by the Management in accordance with a regular programme of verification which, in our opinion, provides for physical verification of all the fixed assets at reasonable intervals. According to the information and explanations given to us, no material discrepancies were noticed on such verification.
(c) According to the information and explanations given to us and the records examined by us and based on the examination of the registered convey-ance deed provided to us, we report that, the title deed, comprising an immovable property of building which is freehold, is held in the name of the Company as at the balance sheet date. In respect of immovable property of building that has been taken on lease and leasehold improvements thereon disclosed as fixed asset in the financial statements, the lease agreements are in the name of the Company, where the Company is the lessee in the agreement.
(ii) The Company does not have any inventory and hence reporting under clause (ii) of the Order is not applicable.
(iii) According to the information and explanations given to us, the Company has granted secured loan to a company covered in the Register maintained under Section 189 of the Companies Act, 2013, in respect of which:
(a) The terms and conditions of the grant of such loan are, in our opinion, prima facie, not prejudicial to the Company’s interest.
(b) The schedule of repayment of principal and payment of interest has been stipulated and repayments or receipts of principle amounts and interest have been regular as per stipulations.
(c) There is no overdue amount remaining outstanding at the year end.
(iv) In our opinion and according to the information and explanations given to us, the Company has complied with the provisions of Sections 185 and 186 of the Companies Act, 2013 in respect of grant of loans, making investments and providing guarantees and securities, as applicable. The Company being a non-banking financial company, nothing contained in section 186, except sub-section (1), shall apply.
(v) According to the information and explanations given to us, the Company has not accepted any deposit from the public during the year within the meaning of Section 73 to 76 or any other relevant provisions of the Act and hence reporting under clause (v) of the Order is not applicable.
(vi) Having regard to the nature of the Company’s business / activities, reporting under clause (vi) of the Order is not applicable.
(vii) According to the information and explanations given to us in respect of statutory dues:
(a) The Company has generally been regular in depositing undisputed statutory dues, including Provident Fund, Employees’ State Insurance, Income-tax, Goods and Services Tax, Cess and other material statutory dues applicable to it with the appropriate authorities. We are informed that the Company’s operations did not give rise to any dues on account of Custom duty.
(b) There were no undisputed amounts payable in respect of Provident Fund, Employees’ State Insurance, Income-tax, Goods and Services Tax, Cess and other material statutory dues in arrears as at March 31, 2019 for a period of more than six months from the date they became payable.
(c) There were no disputed dues in respect of Sales Tax, Service Tax and Value Added Tax which have not been deposited. Details of dues of Income Tax which have not been deposited as on March 31, 2019 on account of disputes are given below:
Name of Statute Nature of the Dues Forum where dispute is pending
Period to which the amount relates
Amount involved (Rs. in lakhs)*
Amount unpaid(Rs. in lakhs)
Income-tax Act 1961 Income Tax Income Tax Appellate Authority
2011-2014 2087.76 168.86
Upto Commissioner (Appeals)
2013-2014, 2015-2017 954.96 754.07
* Amount as per demand orders including interest and penalty wherever indicated in the order.
(viii) In our opinion and according to the information and explanations given to us, the Company has not defaulted in the repayment of dues to bank, financial institutions and debenture holders. The Company has not taken any loans or borrowings from Government.
(viii) In our opinion and according to the information and explanations given to us, the term loans (including debt instruments) have been applied by the Company for the purposes for which they were obtained. The Company has not raised any money by way of initial public offer or further public offer.
(ix) To the best of our knowledge and according to the information and explanations given to us, no fraud by the Company and no material fraud on the Company by its officers or employees has been noticed or reported during the year.
(x) In our opinion and according to the information and explanations given to us, the Company has paid managerial remuneration in accordance with the requisite approvals mandated by the provisions of section 197 read with Schedule V to the Companies Act, 2013.
(xi) The Company is not a Nidhi Company and hence reporting under clause (xii) of the Order is not applicable.
77
(xii) In our opinion and according to the information and explanations given to us the Company is in compliance with Section 177 and 188 and of the Compa-nies Act, 2013, where applicable, for all transactions with the related parties and the details of related party transactions have been disclosed in the financial statements as required by the applicable accounting standards.
(xiii) During the year the Company has not made any preferential allotment or private placement of shares or fully or partly convertible debentures and hence reporting under clause (xiv) of CARO 2016 is not applicable to the Company.
(xiv) In our opinion and according to the information and explanations given to us, during the year the Company has not entered into any non-cash transac-tions with its directors or directors of its holding or associate companies or persons connected with them and hence provisions of section 192 of the Companies Act, 2013 are not applicable.
(xv) The Company is required to be registered under section 45-IA of the Reserve Bank of India Act, 1934 and it has obtained the registration.
For Deloitte Haskins & SellsChartered Accountants
(Firm’s Registration No. 015125N)
Jitendra AgarwalGurugram, (Partner)May 04, 2019 (Membership No. 87104)

78
PTC India Financial Services LimitedStandalone Balance Sheet as at March 31, 2019
(All amounts in Lakha of r unless otherwise stated)
Particulars Notesno.
As at March 31, 2019
As at March 31, 2018
As at April 1, 2017
A ASSETS1 Financial assets
a. Cash and cash equivalents 3 3,223.49 5,329.99 2,963.85 b. Bank balances other than (a) above 4 668.24 492.70 587.94 c. Derivative financial instruments 5 1,997.22 2,500.68 2,711.18 d. Trade receivables 6 861.14 565.71 567.22 e. Loans 7 1,264,445.23 1,180,634.10 1,019,206.13 f. Investments 8 9,586.99 6,301.25 11,428.36 g. Other financial assets 9 52.47 174.80 70.15
1,280,834.78 1,195,999.23 1,037,534.83 2 Non-financial Assets
a. Current tax assets (Net) 10 17,028.65 4,121.31 2,124.34 b. Deferred tax assets (Net) 11 18,637.67 28,238.85 10,142.77 c. Property, Plant and Equipment 12 1,227.22 1,402.88 1,434.69 d. Capital work-in-progress 13 - 5.74 5.74 e. Other Intangible assets 14 4.05 16.69 64.30 f. Other non-financial assets 15 1,579.72 1,729.53 632.47
38,477.31 35,515.00 14,404.31 TOTAL ASSETS 1,319,312.09 1,231,514.23 1,051,939.14
B LIABILITIES AND EQUITYLIABILITIES
3 Financial liabilitiesa. Derivative financial instruments 5 23.00 758.22 906.54 b. Trade Payables
(i) total outstanding dues to micro and small enterprises 13.75 13.82 21.70 (ii) total outstanding dues of creditors other than micro and small enterprises
308.79 514.12 398.56
c. Debt securities 16 53,229.44 98,048.93 141,268.18 d. Borrowings (Other than debt securities) 17 1,038,603.79 924,837.20 669,256.28 e. Other financial liabilities 18 19,943.24 12,842.04 13,167.94
1,112,122.01 1,037,014.33 825,019.20 4 Non-Financial Liabilities
a. Provisions 19 348.54 310.81 229.75 b. Other non-financial liabilities 20 186.41 254.02 62.78
534.95 564.83 292.53 5 EQUITY
a. Equity share capital 21 64,228.33 64,228.33 64,228.33 b. Other equity 22 142,426.80 129,706.74 162,399.08
206,655.13 193,935.07 226,627.41 TOTAL LIABILITIES and EQUITY 1,319,312.09 1,231,514.23 1,051,939.14
See accompanying notes forming part of the financial statements 1-53
In terms of our report attachedFor Deloitte Haskins & Sells For and on behalf of the Board of DirectorsChartered Accountants
Sd/- Sd/- Sd/-Jitendra Agarwal Dr. Pawan Singh Naveen KumarPartner Managing Director and CEO Whole-time Director DIN: 00044987 DIN: 00279627
Sd/- Sd/- Vishal Goyal Sanjay Rustagi Company Secretary Chief Financial Officer
Place : Gurugram Place: New DelhiDate : May 4, 2019 Date : May 4, 2019

79
In terms of our report attachedFor Deloitte Haskins & Sells For and on behalf of the Board of DirectorsChartered Accountants
Sd/- Sd/- Sd/-Jitendra Agarwal Dr. Pawan Singh Naveen KumarPartner Managing Director and CEO Whole-time Director DIN: 00044987 DIN: 00279627
Sd/- Sd/- Vishal Goyal Sanjay Rustagi Company Secretary Chief Financial Officer
Place : Gurugram Place: New DelhiDate : May 4, 2019 Date : May 4, 2019
PTC India Financial Services LimitedStandalone Statement of Profit and Loss for the year ended March 31, 2019
(All amounts in Lakha of r unless otherwise stated)
Particulars Notesno.
For the year ended March 31, 2019
For the year ended March 31, 2018
1 Revenuea. Revenue from operations
(i) Interest income 23 128,517.08 112,545.12 (ii) Fee and commission income 24 3,474.71 5,150.59 (iii) Net gain on fair value changes 25 1,042.59 346.88 (iv) Sale of power 407.19 412.09
b. Other income 26 209.65 60.88 Total revenue (a+b) 133,651.22 118,515.56
2 Expensesa. Finance costs 27 94,431.06 68,500.08 b. Fees and commission expense 28 116.47 51.93 c. Impairment on financial instruments 29 6,058.25 60,971.48 d. Employees benefit expenses 30 1,404.39 1,473.73 e. Depreciation and amortisation expense 31 272.65 325.87 f. Other expenses 32 3,268.44 2,235.16
Total expenses (a+b+c+d+e+f) 105,551.26 133,558.25 3 Profit before tax (1-2) 28,099.96 (15,042.69)4 Tax expense
a. Current tax 33 - 13,068.38 b. Deferred tax charge/(benefits) 33 9,685.70 (18,087.62)Total tax expense 9,685.70 (5,019.24)
5 Profit for the year (3-4) 18,414.26 (10,023.45)6 Other comprehensive income, net of tax
Items that will not be reclassified to profit or lossa. Remeasurement loss on defined benefit plans (3.97) (24.46) Income tax relating to remeasurement loss on defined benefit plans 1.39 8.46 b. Equity instruments through other comprehensive income (3,203.87) (12,052.93) Income tax relating to FVTOCI to equity investments - -
(3,206.45) (12,068.93)Items that will be reclassified to profit or lossa. Change in cash flow hedge reserve (237.90) - Income tax relating to cash flow hedge reserve 83.13 -
(154.77) - Other comprehensive profit for the year (3,361.22) (12,068.93)
7 Total comprehensive profit for the year (5+6) 15,053.04 (22,092.38)Earnings per equity share:Basic and diluted 46 2.87 (1.56)
See accompanying notes forming part of the financial statements 1-53

80
Particulars For the year ended 31 March 2019
For the year ended 31 March 2018
A CASH FLOWS FROM OPERATING ACTIVITIESProfit after tax 18,414.26 (10,023.45)Adjustments for:Depreciation and amortisation expense 272.65 325.87 Impairment on financial instruments 6,058.25 60,971.48 Gain on sale of property, plant and equipment (4.93) (0.03)Finance costs 94,431.06 68,500.08 Net gain on fair value changes (1,042.59) (346.88)Tax expense 9,685.70 (5,019.24)Operating profit before working capital changes 127,814.40 114,407.83 Changes in working capitalAdjustments for (increase) / decrease in operating assets:Loan financing (96,307.35) (229,325.72)Other loans (22.82) 0.44 Other financial assets 122.33 (104.65)Other non- financial assets 149.90 (67.75)Trade receivables (373.11) 1.51 Adjustments for increase / (decrease) in operating liabilities:Other financial liabilities 5,410.20 (373.25)Provisions 33.76 56.60 Trade payables (205.40) 107.68 Other non- financial liabilities (67.61) 191.24 Cash flow from operating activities post working capital changes 36,554.30 (115,106.07)Income- tax paid (12,907.34) (15,065.35)Net cash flow from operating activities (A) 23,646.96 (130,171.42)
B CASH FLOWS FROM INVESTING ACTIVITIESCapital expenditure on property, plant and equipment, including capital advances (81.79) (1,277.62)Proceeds from sale of property, plant and equipment 9.46 6.19 Purchase of intangible assets (1.44) (4.30)Proceeds from sale of investments/ redemption of security receipts 48.86 - Net cash used in investing activities (B) (24.91) (1,275.73)
C CASH FLOWS FROM FINANCING ACTIVITIESProceeds from borrowings 407,434.65 268,199.76 Repayment of borrowings (293,963.81) (11,694.13)Repayment of debt securities (45,456.36) (43,543.04)Finance costs (92,194.41) (67,553.73)Dividend paid (1,284.57) (9,634.25)Tax on dividend (264.05) (1,961.32)Net cash flow from financing activities (C) (25,728.55) 133,813.29 Increase in cash and cash equivalents (A+B+C) (2,106.50) 2,366.14 Cash and cash equivalents at the beginning of the year 5,329.99 2,963.85 Cash and cash equivalents at the end of the year 3,223.49 5,329.99
See accompanying notes forming part of the financial statements 1-53
PTC India Financial Services LimitedStandalone Statement of Cash Flow as at March 31, 2019
(All amounts in Lakha of r unless otherwise stated)
In terms of our report attachedFor Deloitte Haskins & Sells For and on behalf of the Board of DirectorsChartered Accountants
Sd/- Sd/- Sd/-Jitendra Agarwal Dr. Pawan Singh Naveen KumarPartner Managing Director and CEO Whole-time Director DIN: 00044987 DIN: 00279627
Sd/- Sd/- Vishal Goyal Sanjay Rustagi Company Secretary Chief Financial Officer
Place : Gurugram Place: New DelhiDate : May 4, 2019 Date : May 4, 2019

81
PTC India Financial Services LimitedStandalone Statement of changes in equity as at March 31, 2019
(All amounts in Lakha of r unless otherwise stated)
B Other Equity:Reserves and Surplus Total
Securities Premium Reserve
Statutory Reserve
Special Reserve
Equity instruments
through other comprehensive
income
Cash flow hedge reserve
Foreign currency monetary items
translation difference
account
Retained Earnings
As at April 1, 2017 61,280.57 28,685.59 23,337.48 (2,884.17) - (2,744.82) 54,724.43 162,399.08 Add: Profit for the year - - - - - - (10,023.45) (10,023.45)Add [Less]: Other Comprehensive income - - - (12,052.93) - - (16.00) (12,068.93)Total Comprehensive Income - - - (12,052.93) - - (10,039.45) (22,092.38)Transfer from [to] Reserve - 494.09 6,362.30 - - - (6,856.39) - Transactions with owners in their capacity as owners:
Dividends - - - - - - (9,634.25) (9,634.25)Corporate dividend tax on dividend - - - - - - (1,961.32) (1,961.32)
Effect of foreign exchange rate variations during the year
- - - - - 191.10 - 191.10
Amortisation for the year - - - - - 804.51 - 804.51 As at March 31, 2018 61,280.57 29,179.68 29,699.78 (14,937.10) - (1,749.21) 26,233.02 129,706.74 As at April 1, 2018 61,280.57 29,179.68 29,699.78 (14,937.10) - (1,749.21) 26,233.02 129,706.74 Add: Profit for the year - - - - - - 18,414.26 18,414.26 Add [Less]: Other Comprehensive income
- - - (3,203.87) (154.77) - (2.58) (3,361.22)
Total Comprehensive Income - - - (3,203.87) (154.77) - 18,411.68 15,053.04 Transfer from [to] Reserve - 3,682.85 - - - - (3,682.85) - Transactions with owners in their capacity as owners:
Dividends - - - - - - (1,284.57) (1,284.57)Corporate dividend tax on dividend - - - - - - (264.05) (264.05)
Effect of foreign exchange rate variations during the year
- - - - - (2,451.19) - (2,451.19)
Amortisation for the year - - - - - 1,666.83 - 1,666.83 As at March 31, 2019 61,280.57 32,862.53 29,699.78 (18,140.97) (154.77) (2,533.57) 39,413.23 142,426.80
See accompanying notes forming part of the financial statements 1-53
A Equity Share Capital:
No. of Shares Amount
Equity Shares of Rs. 10 each, Issued, Subscribed and Fully Paid-up:
As at April 1, 2017 642,283,335 64,228.33
Issued during the year - -
As at March 31, 2018 642,283,335 64,228.33
Issued during the year - -
As at March 31, 2019 642,283,335 64,228.33
In terms of our report attachedFor Deloitte Haskins & Sells For and on behalf of the Board of DirectorsChartered Accountants
Sd/- Sd/- Sd/-Jitendra Agarwal Dr. Pawan Singh Naveen KumarPartner Managing Director and CEO Whole-time Director DIN: 00044987 DIN: 00279627
Sd/- Sd/- Vishal Goyal Sanjay Rustagi Company Secretary Chief Financial Officer
Place : Gurugram Place: New DelhiDate : May 4, 2019 Date : May 4, 2019

82
PTC India Financial Services LimitedNotes to the standalone financial statements for the year ended March 31, 2019
1. Company overview
PTC India Financial Services Limited (“PFS”) (“the Company”) a registered Non-banking finance company (NBFC) with Reserve Bank of India (RBI) and has been awarded the Infrastructure Finance Company (IFC) status by RBI. PFS is set up with an objective to provide total financing solutions to the energy value chain which includes investing in equity or extending debt to Road infrastructure projects, power projects in generation, transmission, distribution, fuel resources and fuel related infrastructure.
The Company’s registered office and principal place of business is situated at 7th Floor, Telephone Exchange Building, 8 Bhikaji Cama Place, New Delhi - 110066. The shares of the Company are listed on the National Stock Exchange of India Limited and the Bombay Stock Exchange.
The financial statements for the year ended March 31, 2019 are approved by Board of Directors of the Company on May 04, 2019
1A. Basis of preparation and presentation
i. Statement of compliance
These financial statements (“the Financial Statements”) are prepared in accordance with the Indian Accounting Standards (‘Ind AS’) as notified by Ministry of Corporate Affairs (‘MCA’) under Section 133 of the Companies Act, 2013 (‘Act’) read with the Companies (Indian Accounting Standards) Rules, 2015, as amended and other relevant provisions of the Act. The Company has uniformly applied the accounting policies for the periods presented in this financial statements.
ii. Accounting convention
The financial statements have been prepared on the historical cost basis except for certain financial instruments that are measured at fair values at the end of each reporting period, as explained in the accounting policies below. Historical cost is generally based on the fair value of the consideration given in exchange for goods and services.
iii. Going concern
The board of directors have considered the financial position of the Company at March 31, 2019 and the projected cash flows and financial perfor-mance of the Company for at least twelve months from the date of approval of these financial statements as well as planned cost and cash improve-ment actions, and believe that the plan for sustained profitability remains on course.
The board of directors have taken actions to ensure that appropriate long-term cash resources are in place at the date of signing the accounts to fund the Company’s operations.
iv. Use of estimates and judgements
The preparation of financial statements in conformity with Ind AS requires management to make judgements, estimates and assumptions that af-fect the application of accounting policies and the reported amount of assets, liabilities, income, expenses and disclosures of contingent liabilities at the date of these financial statements and the reported amount of revenues and expenses for the years presented. Actual results may differ from the estimates.
Estimates and underlying assumptions are reviewed at each balance sheet date. Revisions to accounting estimates are recognised in the period in which the estimates are revised and future periods affected.
In particular, information about significant areas of estimation uncertainty and critical judgements in applying accounting policies that have the most significant effect on the amounts recognised in the financial statements are included in the note 2 of the financial statements.
1B. Significant Accounting Policies
The financial statements have been prepared using the significant accounting policies and measurement bases summarised as below. These policies are applied consistently for all the periods presented in the financial statements, except where the Company has applied certain accounting policies and exemp-tions upon transition to Ind AS.
a) Revenue recognition
Interest and processing fee income on loans
Interest and processing fee income is recorded on accrual basis using the effective interest rate (EIR) method in accordance with Ind AS 109. Additional interest/overdue interest/penal charges, if any, are recognised only when it is reasonable certain that the ultimate collection will be made.
Commission income
Income from business correspondent services is recognised as and when the services are rendered as per agreed terms and conditions of the contract.
Dividend income
Dividend income is recognised at the time when the right to receive is established by the reporting date.
Sale of power
Revenue from power supply is accounted on accrual basis.

83
Miscellaneous income
All other income is recognized on an accrual basis, when there is no uncertainty in the ultimate realization/collection.
b) Leasing
The Company as a lessee
At the inception of each lease, the lease arrangement is classified as either a finance lease or an operating lease, based on the substance of the lease arrangement.
Finance leases
Assets leased by the Company in its capacity as lessee where substantially all the risks and rewards of ownership vest in the Company are classified as finance leases. A finance lease is recognized as an asset and a liability at the commencement of the lease, at the lower of the fair value of the asset and the present value of the minimum lease payments.
Minimum lease payments made under finance leases are apportioned between finance charges and reduction of the lease liability. The Finance expense is allocated to each period during the lease term so as to produce a constant periodic rate of interest on the remaining balance of the liability.
A leased asset is depreciated over the useful life of the asset. However, if there is no reasonable certainty that the Company will obtain ownership by the end of the lease term, the asset is depreciated over the shorter of the estimated useful life of the asset and the lease term.
Operating leases
Leases in which the lessor does not transfer substantially all the risks and rewards of ownership of an asset to the lessee are classified as operating leases. Lease rental are charged to statement of profit and loss.
c) Foreign currencies
Functional and presentation currency
Items included in the financial statement of the Company are measured using the currency of the primary economic environment in which the entity operates (‘the functional currency’). The financial statements have been prepared and presented in Indian Rupees (INR), which is the Company’s functional and presentation currency.
Transactions and balances
Foreign currency transactions are translated into the functional currency, by applying the exchange rates on the foreign currency amounts at the date of the transaction. Foreign currency monetary items outstanding at the balance sheet date are converted to functional currency using the closing rate. Non-monetary items denominated in a foreign currency which are carried at historical cost are reported using the exchange rate at the date of the transaction.
Exchange differences arising on monetary items on settlement, or restatement as at reporting date, at rates different from those at which they were initially recorded, are recognized in the Statement of Profit and Loss in the year in which they arise.
Transition to Ind AS
The Company has elected to exercise the option for accounting for exchange differences arising from translation of long-term foreign currency monetary items recognised in the financial statements for the period ending immediately before the beginning of the first Ind AS financial reporting period as per the previous GAAP.
d) Borrowing costs
Borrowing costs directly attributable to the’ acquisition, construction or production of qualifying assets, which are assets that necessarily take a substantial period of time to get ready for their intended use or sale, are added to the cost of those assets, until such time as the assets are substantially ready for their intended use or sale.
All other borrowing costs are recognised in profit or loss in the period in which they are incurred.
e) Employee benefits
Short-term employee benefits
Short-term employee benefits including salaries, short term compensated absences (such as a paid annual leave) where the absences are expected to occur within twelve months after the end of the period in which the employees render the related service, profit sharing and bonuses payable within twelve months after the end of the period in which the employees render the related services and non-monetary benefits for current employees are estimated and measured on an undiscounted basis.
Other long-term employee benefit obligations
Liabilities for leave encashment and compensated absences which are not expected to be settled wholly within the operating cycle after the end of the period in which the employees render the related service are measured at the present value of the estimated future cash outflows which is expected to be paid using the projected unit credit method. The benefits are discounted using the market yields at the end of the reporting period on Government bonds that have terms approximating to the terms of the related obligation. Re-measurements as a result of experience adjustments and changes in actuarial assumptions are recognised in profit or loss.
Post-employment benefit plans are classified into defined contribution plans and defined benefits plans as under:

84
Defined contribution plans
The Company has a defined contribution plans namely provident fund, pension fund and employees state insurance scheme. The contribution made by the Company in respect of these plans are charged to the Statement of Profit and Loss.
Defined benefit plans
The Company has an obligation towards gratuity and post medical retirement benefit, a defined benefit retirement plan covering eligible employees. Where in the employee will receive on retirement is defined by reference to employee’s length of service and last drawn salary. Under the defined benefit plans, the amount that an employee will receive on retirement is defined by reference to the employee’s length of service and final salary. The legal obligation for any benefits remains with the Company, even if plan assets for funding the defined benefit plan have been set aside. The liability recognised in the statement of financial position for defined benefit plans is the present value of the Defined Benefit Obligation (DBO) at the reporting date less the fair value of plan assets, if any. Management estimates the DBO annually with the assistance of independent actuaries. Actuarial gains/losses resulting from re-measurements of the liability/asset are included in other comprehensive income.
Other long-term employee benefits
The Company also provides the benefit of compensated absences to its employees which are in the nature of long-term employee benefit plan. Liability in respect of compensated absences becoming due and expected to availed after one year from the Balance Sheet date is estimated in the basis of an actuarial valuation performed by an independent actuary using the projected unit credit method as on the reporting date. Actuarial gains and losses arising from past experience and changes in actuarial assumptions are charged to Statement of Profit and Loss in the year in which such gains or losses are determined.
f) Taxation
Tax expense recognized in Statement of Profit and Loss comprises the sum of deferred tax and current tax except to the extent it recognized in other comprehensive income or directly in equity.
Current tax comprises the tax payable or receivable on taxable income or loss for the year and any adjustment to the tax payable or receivable in respect of previous years. Current tax is computed in accordance with relevant tax regulations. The amount of current tax payable or receivable is the best estimate of the tax amount expected to be paid or received after considering uncertainty related to income taxes, if any. Current income tax relating to items recognised outside profit or loss is recognised outside profit or loss (either in other comprehensive income or in equity).
Current tax assets and liabilities are offset only if there is a legally enforceable right to set off the recognised amounts, and it is intended to realise the asset and settle the liability on a net basis or simultaneously.
Minimum alternate tax (‘MAT’) credit entitlement is recognised as an asset only when and to the extent there is convincing evidence that normal income tax will be paid during the specified period. In the year in which MAT credit becomes eligible to be recognised as an asset, the said asset is created by way of a credit to the Statement of Profit and Loss and shown as MAT credit entitlement. This is reviewed at each balance sheet date and the carrying amount of MAT credit entitlement is written down to the extent it is not reasonably certain that normal income tax will be paid during the specified period.
Deferred tax is recognised in respect of temporary differences between carrying amount of assets and liabilities for financial reporting purposes and corresponding amount used for taxation purposes. Deferred tax assets are recognised on unused tax loss, unused tax credits and deductible temporary differences to the extent it is probable that the future taxable profits will be available against which they can be used. This is assessed based on the Company’s forecast of future operating results, adjusted for significant non-taxable income and expenses and specific limits on the use of any unused tax loss. Unrecognised deferred tax assets are re-assessed at each reporting date and are recognised to the extent that it has become probable that future taxable profits will allow the deferred tax asset to be recovered.
Deferred tax assets and liabilities are measured at the tax rates that are expected to apply in the year when the asset is realised or the liability is settled, based on tax rates (and tax laws) that have been enacted or substantively enacted at the reporting date. The measurement of deferred tax reflects the tax consequences that would follow from the manner in which the Company expects, at the reporting date to recover or settle the carrying amount of its assets and liabilities. Deferred tax assets and liabilities are offset only if there is a legally enforceable right to set off the recognised amounts, and it is intended to realise the asset and settle the liability on a net basis or simultaneously. Deferred tax relating to items recognised outside statement of profit and loss is recognised outside statement of profit or loss (either in other comprehensive income or in equity).
Current and deferred tax for the year
Current and deferred tax are recognised in profit or loss, except when they relate to items that are recognised in other comprehensive income or directly in equity, in which case, the current and deferred tax are also recognised in other comprehensive income or directly in equity respectively
g) Property, plant and equipment
Recognition and initial measurement
Property, plant and equipment are stated at their cost of acquisition. The cost comprises purchase price, borrowing cost if capitalization criteria are met and directly attributable cost of bringing the asset to its working condition for the intended use. Any trade discount and rebates are deducted in arriving at the purchase price. Subsequent costs are included in the asset’s carrying amount or recognised as a separate asset, as appropriate, only when it is probable that future economic benefits associated with the item will flow to the Company. All other repair and maintenance costs are recognised in statement of profit or loss as incurred.
Subsequent costs are included in the asset’s carrying amount or recognised as a separate asset, as appropriate, only when it is probable that future economic benefits associated with the item will flow to the Company and the cost of the item can be measured reliably. All other repair and maintenance costs are recognised in statement of profit or loss as incurred.
85
Subsequent measurement (depreciation method, useful lives and residual value) Property, plant and equipment are subsequently measured at cost less accumulated depreciation and impairment losses. Depreciation on property, plant and equipment is provided on the written-down method over the useful life of the assets as prescribed under Part ‘C’ of Schedule II of the Companies Act, 2013.
Depreciation is calculated on pro rata basis from the date on which the asset is ready for use or till the date the asset is sold or disposed. Asset costing less than Rs. 5,000 each are fully depreciated in the year of capitalisation.
The residual values, useful lives and method of depreciation are reviewed at the end of each financial year.
De-recognition
An item of property, plant and equipment and any significant part initially recognised is derecognised upon disposal or when no future economic benefits are expected from its use or disposal. Any gain or loss arising on de-recognition of the asset (calculated as the difference between the net disposal proceeds and the carrying amount of the asset) is recognized in the statement of profit and loss, when the asset is derecognised.
h) Intangible assets
Recognition and initial measurement
Intangible assets are stated at their cost of acquisition. The cost comprises purchase price including any import duties and other taxes (other than those subsequently recoverable from taxation authorities), borrowing cost if capitalization criteria are met and directly attributable cost of bringing the asset to its working condition for the intended use.
Subsequent measurement (amortisation method, useful lives and residual value)
Intangible assets are amortised over a period of 3 years from the date when the assets are available for use. The estimated useful life (amortisation period) of the intangible assets is arrived basis the expected pattern of consumption of economic benefits and is reviewed at the end of each financial year and the amortisation period is revised to reflect the changed pattern, if any.
i) Impairment of tangible and intangible assets
At each reporting date, the Company assesses whether there is any indication that an asset may be impaired. If any such indication exists, the Company estimates the recoverable amount of the asset. Recoverable amount is higher of an asset’s net selling price and its value in use. If such recoverable amount of the asset or the recoverable amount of the cash generating unit to which the asset belongs is less than its carrying amount, the carrying amount is reduced to its recoverable amount. The reduction is treated as an impairment loss and is recognised in the Statement of Profit and Loss. If at the reporting date there is an indication that if a previously assessed impairment loss no longer exists, the recoverable amount is reassessed and the asset is reflected at the recoverable amount.
Financial instruments
A Financial instrument is any contract that gives rise to a financial asset of one entity and a financial liability or equity instrument of another entity.
Initial recognition and measurement
Financial assets and financial liabilities are recognised when the Company becomes a party to the contractual provisions of the financial instrument and are measured initially at fair value adjusted for transaction costs.
j) Non-derivative financial assets
Classification of financial assets
Classification of financial assets depends on the nature and purpose of the financial assets and is determined at the time of initial recognition
The Company classifies its financial assets in the following measurement categories:
• those to be measured subsequently at fair value (either through other comprehensive income, or through profit or loss), and
• those measured at amortised cost
The classification depends on the entity’s business model for managing the financial assets and the contractual terms of the cash flows.
A financial asset that meets the following two conditions is measured at amortised cost unless the asset is designated at fair value through profit or loss under the fair value option:
• Business model test : the objective of the Company’s business model is to hold the financial asset to collect the contractual cash flows.
• Cash flow characteristic test : the contractual term of the financial asset give rise on specified dates to cash flows that are solely payments of principal and interest (SPPI on the principal amount outstanding.
A financial asset that meets the following two conditions is measured at fair value through other comprehensive income unless the asset is designated at fair value through profit or loss under the fair value option:
• business model test : the financial asset is held within a business model whose objective is achieved by both collecting cash flows and selling financial assets.
• cash flow characteristic test : the contractual term of the financial asset gives rise on specified dates to cash flows that are solely payments of principal and interest (SPPI on the principal amount outstanding.

86
All other financial assets are measured at fair value through profit or loss.
Subsequent measurement
i. Financial assets carried at amortised cost – a financial asset is measured at the amortised cost if both the following conditions are met:
• The asset is held within a business model whose objective is to hold assets for collecting contractual cash flows, and
• Contractual terms of the asset give rise on specified dates to cash flows that are solely payments of principal and interest (SPPI) on the principal amount outstanding.
After initial measurement, such financial assets are subsequently measured at amortised cost using the effective interest rate (EIR) method. Amortised cost is calculated by taking into account any discount or premium on acquisition and fees or costs that are an integral part of the EIR. The EIR amortisation is included in interest income in the Statement of Profit and Loss.
ii. Investments in equity instruments – Investments in equity instruments are measured at fair value through other comprehensive income (FVOCI). Dividends on such investments are recognised in profit or loss unless the dividend clearly represents a recovery of part of the cost of the investment.
iii. Investments security receipts – Investments in security receipts are measured at fair value through profit and loss (FVTPL).
iv. Equity investment in associates- Investments representing equity interest in associates are carried at cost less any provision for impairment. Investments are reviewed for impairment if events or changes in circumstances indicate that the carrying amount may not be recoverable
v. Trade receivables- Trade receivables are recognised initially at fair value and subsequently measured at amortised cost less provision for impair-ment.
vi. Cash and cash equivalents- In the cash flow statement, cash and cash equivalents includes cash in hand, cheques and drafts in hand, balances with bank and deposits held at call with financial institutions, short-term highly liquid investments with original maturities of three months or less that are readily convertible to known amounts of cash and which are subject to an insignificant risk of changes in value.
All other financial assets are measured at fair value through profit or loss.
k) Impairment of financial assets
Loan assets
The Company follows a ‘three-stage’ model for impairment based on changes in credit quality since initial recognition as summarised below:
• Stage 1 includes loan assets that have not had a significant increase in credit risk since initial recognition or that have low credit risk at the reporting date.
• Stage 2 includes loan assets that have had a significant increase in credit risk since initial recognition but that do not have objective evidence of impairment.
• Stage 3 includes loan assets that have objective evidence of impairment at the reporting date.
The Expected Credit Loss (ECL) is measured at 12-month ECL for Stage 1 loan assets and at lifetime ECL for Stage 2 and Stage 3 loan assets. ECL is the product of the Probability of Default, Exposure at Default and Loss Given Default, defined as follows:
Probability of Default (PD) - The PD represents the likelihood of a borrower defaulting on its financial obligation (as per “Definition of default and credit-impaired” above), either over the next 12 months (12 months PD), or over the remaining lifetime (Lifetime PD) of the obligation.
Loss Given Default (LGD) – LGD represents the Company’s expectation of the extent of loss on a defaulted exposure. LGD varies by type of counterparty, type and preference of claim and availability of collateral or other credit support.
Exposure at Default (EAD) – EAD is based on the amounts the Company expects to be owed at the time of default. For a revolving commitment, the Company includes the current drawn balance plus any further amount that is expected to be drawn up to the current contractual limit by the time of default, should it occur.
Forward-looking economic information (including management overlay) is included in determining the 12-month and lifetime PD, EAD and LGD. The assumptions underlying the expected credit loss are monitored and reviewed on an ongoing basis.
The Company considers various factors while considering the recoverability of credit impaired advances. These include nature and value of assets, different resolution channels, interest of potential buyers etc. Considering the typical nature of advances given by the Company, there is significant uncertainty and variability in timing of resolution of these advances. In reference to RBI’s prudential norms, the Company does not recognize interest income on these advances on a conservative basis, and the provisioning is considered using current estimate of realization which are based on valuation of security/ collateral as at current date.
Trade receivables
In respect of trade receivables, the Company applies the simplified approach of Ind AS 109, which requires measurement of loss allowance at an amount equal to lifetime expected credit losses. Lifetime expected credit losses are the expected credit losses that result from all possible default events over the expected life of trade receivables.
Other financial assets
In respect of its other financial assets, the Company assesses if the credit risk on those financial assets has increased significantly since initial
87
recognition. If the credit risk has not increased significantly since initial recognition, the Company measures the loss allowance at an amount equal to 12-month expected credit losses, else at an amount equal to the lifetime expected credit losses.
When making this assessment, the Company uses the change in the risk of a default occurring over the expected life of the financial asset. To make that assessment, the Company compares the risk of a default occurring on the financial asset as at the balance sheet date with the risk of a default occurring on the financial asset as at the date of initial recognition and considers reasonable and supportable information, that is available without undue cost or effort, that is indicative of significant increases in credit risk since initial recognition. The Company assumes that the credit risk on a financial asset has not increased significantly since initial recognition if the financial asset is determined to have low credit risk at the balance sheet date.
Write-offs
Financial assets are written off either partially or in their entirety to the extent that there is no realistic prospect of recovery. Any subsequent recoveries are credited to impairment on financial instrument on statement of profit and loss.
De-recognition of financial assets
Financial assets (or where applicable, a part of financial asset or part of a group of similar financial assets) are derecognised (i.e. removed from the Company’s balance sheet) when the contractual rights to receive the cash flows from the financial asset have expired, or when the financial asset and substantially all the risks and rewards are transferred. Further, if the Company has not retained control, it shall also derecognise the financial asset and recognise separately as assets or liabilities any rights and obligations created or retained in the transfer.
l) Non-derivative financial liabilities and equity instruments
Equity instruments
An equity instrument is any contract that evidences a residual interest in the assets of an entity after deducting all of its liabilities.
Financial liabilities
Subsequent measurement
Financial liabilities that are not held-for-trading and are not designated as at FVTPL are measured at amortised cost at the end of subsequent accounting periods. The carrying amounts of financial liabilities that are subsequently measured at amortised cost are determined based on the effective interest method. Interest expense that is not capitalised as part of costs of an asset is included in the ‘Finance costs’ Line item.
The effective interest method is a method of calculating the amortised cost of a financial liability and of allocating interest expense over the relevant period. The effective interest rate is the rate that exactly discounts estimated future cash payments (including all fees and points paid or received that form an integral part of the effective interest rate, transaction costs and other premiums or discounts) through the expected life of the financial liability.
All financial liabilities are subsequently measured at amortised cost using the effective interest method or at FVTPL.
De-recognition of financial liabilities
A financial liability is de-recognised when the obligation under the liability is discharged or cancelled or expires. When an existing financial liability is replaced by another from the same lender on substantially different terms, or the terms of an existing liability are substantially modified, such an exchange or modification is treated as the de-recognition of the original liability and the recognition of a new liability. The difference in the respective carrying amounts is recognised in the Statement of Profit and Loss.
m) Derivative financial instruments
The Company enters into foreign exchange forward contracts and certain other derivative financial instruments to manage its exposure to foreign exchange risks. Further details of derivative financial instruments are disclosed in note 5.
Derivatives are initially recognised at fair value at the date the derivative contracts are entered into and are subsequently re-measured to their fair value at the end of each reporting period. Derivatives are carried as financial assets when the fair value is positive and as financial liabilities when the fair value is negative. The resulting gain or loss is recognised in profit or loss immediately unless the derivative is designated and effective as a hedging instrument which is recognised in other comprehensive income (net of tax) and presented as a separate component of equity which is later reclassified to profit or loss when the hedge item affects profit or loss.
n) Hedge Accounting
Initial and subsequent measurement
The Company uses derivative financial instruments to hedge its foreign currency risks and interest rate risks respectively. Such derivative financial instruments are initially recognised at fair value on the date on which a derivative contract is entered into and are subsequently re-measured at fair value. Derivatives are carried as financial assets when the fair value is positive and as financial liabilities when the fair value is negative.
Any gains or losses arising from changes in the fair value of derivatives are taken directly to profit or loss, except for the effective portion of cash flow hedges, which is recognised in OCI and later reclassified to profit or loss when the hedge item affects profit or loss. For the purpose of hedge accounting, hedges are classified as cash flow hedges where Company hedges its exposure to variability in cash flows that is attributable to foreign currency risk and interest rate risk associated with recognised liabilities in the financial statements.
At the inception of a hedge relationship, the Company formally designates and documents the hedge relationship to which the Company wishes to apply hedge accounting and the risk management objective and strategy for undertaking the hedge. The documentation includes the Company’s risk management objective and strategy for undertaking hedge, the hedging/ economic relationship, the hedged item or transaction, the nature of the risk

88
being hedged, hedge ratio and how the entity will assess the effectiveness of changes in the hedging instrument’s fair value in offsetting the exposure to changes in the hedged item’s cash flows attributable to the hedged risk. Such hedges are expected to be highly effective in achieving offsetting changes in cash flows and are assessed on an ongoing basis to determine that they continue to be highly effective throughout the financial reporting periods for which they are designated.
Accounting for cash flow hedges
The effective portion of the gain or loss on the hedging instrument is recognised in OCI in the cash flow hedge reserve, while any ineffective portion is recognised immediately in the statement of profit and loss.
The Company uses swaps as to hedge its exposure to foreign currency risk and interest rate risk in respect of certain financial liabilities. The ineffective portion relating to such hedging instruments is recognised in other income or expenses. Amounts recognised as OCI are transferred to profit or loss when the hedged transaction affects profit or loss, such as when the hedged financial income or financial expense is recognised. If the hedging instrument expires or is sold, terminated or exercised, or if its designation as a hedge is revoked, or when the hedge no longer meets the criteria for hedge accounting, any cumulative gain or loss previously recognised in OCI remains separately in equity until the expected future cash flows occur.
o) Offsetting of financial instruments
Financial assets and financial liabilities are offset and the net amount is reported in the balance sheet if there is a currently enforceable legal right to offset the recognised amounts and there is an intention to settle on a net basis, to realise the assets and settle the liabilities simultaneously.
p) Provisions, contingent assets and contingent liabilities
Provisions are recognized only when there is a present obligation, as a result of past events, and when a reliable estimate of the amount of obligation can be made at the reporting date. These estimates are reviewed at each reporting date and adjusted to reflect the current best estimates. Provisions are discounted to their present values, where the time value of money is material.
Contingent liability is disclosed for:
• Possible obligations which will be confirmed only by future events not wholly within the control of the Company or
• Present obligations arising from past events where it is not probable that an outflow of resources will be required to settle the obligation or a reliable estimate of the amount of the obligation cannot be made.
Contingent assets are neither recognised nor disclosed except when realisation of income is virtually certain, related asset is disclosed.
q) Earnings per share
Basic earnings per share is computed by dividing the profit after tax by the weighted average number of equity shares outstanding during the year/period.
Diluted earnings per share is computed by dividing the profit after tax as adjusted for dividend, interest and other charges to expense or income relating to the dilutive potential equity shares, by the weighted average number of equity shares considered for deriving basic earnings per share and the weighted average number of equity shares which could have been issued on the conversion of all dilutive potential equity shares.
r) Segment reporting
The Company identifies segment basis the internal organization and management structure. The operating segments are the segments for which separate financial information is available and for which operating profit/loss amounts are regularly reviewed by the CODM (‘chief operating decision maker’) in deciding how to allocate resources and in assessing performance. The accounting policies adopted for segment reporting are in line with the accounting policies of the Company. Segment revenue, segment expenses, segment assets and segment liabilities have been identified to segments on the basis of their relationship with the operating activities of the segment.
s) Investments in Associates
The Company records the investments in Associates at cost less impairment loss, if any.
After initial recognition, the Company determines whether there is any objective evidence of impairment as a result of one or more events that occurred after the initial recognition of investment in Associates and that event (or events) has an impact on the estimated future cash flows of the Associates that can be reliably estimated. If there exists such an objective evidence of impairment, then impairment loss is recognized with respect to the Company’s investment in Associates.
2. Significant management judgement in applying accounting policies and estimation uncertainty
The preparation of the Company’s financial statements requires management to make judgements, estimates and assumptions that affect the reported amounts of revenues, expenses, assets and liabilities, and the related disclosures. Actual results may differ from these estimates.
Significant management judgements
i. Evaluation of indicators for impairment of loans – The evaluation of applicability of indicators of impairment of assets requires management assess-ment of several external and internal factors which could result in deterioration of recoverable amount of the assets.
ii. Expected credit loss model (‘ECL’) – The measurement of expected credit loss allowance for financial assets measured at amortised cost requires use of complex models and significant assumptions about future economic conditions and credit behaviour (e.g. likelihood of customers defaulting and resulting losses). The Company makes significant judgements with regard to the following while assessing expected credit loss:

89
• Determining criteria for significant increase in credit risk;
• Establishing the number and relative weightings of forward-looking scenarios for each type of product/market and the associated ECL; and
• Establishing groups of similar financial assets for the purposes of measuring ECL.
iii. Contingent liabilities – At each balance sheet date basis the management judgment, changes in facts and legal aspects, the Company assesses the requirement of provisions against the outstanding contingent liabilities. However, the actual future outcome may be different from this judgement.
iv. Revenue recognition- Interest income on stressed loans involves management estimates and assumptions in determining both timing and expected realisation from them.
v. Recognition of deferred tax assets – The extent to which deferred tax assets can be recognized is based on an assessment of the probability of the future taxable income against which the deferred tax assets can be utilized.
vi. Fair value measurements – Management applies valuation techniques to determine the fair value of financial instruments (where active market quotes are not available). This involves developing estimates and assumptions consistent with how market participants would price the instrument.
vii. Business model assessment - The Company determines the business model at a level that reflects how groups of financial assets are managed together to achieve a particular business objective. This assessment includes judgement reflecting all relevant evidence including how the performance of the assets is evaluated and their performance measured, the risks that affect the performance of the assets and how these are managed and how the managers of the assets are compensated. The Company monitors financial assets measured at amortised cost that are derecognised prior to their maturity to understand the reason for their disposal and whether the reasons are consistent with the objective of the business for which the asset was held. Monitoring is part of the Company’s continuous assessment of whether the business model for which the remaining financial assets are held continues to be appropriate and if it is not appropriate whether there has been a change in business model and so a prospective change to the classification of those assets.
2A. Standards issued but not yet effective
Ind AS 116 ‘Leases’
On March 30, 2019, Ministry of Corporate Affairs (‘MCA’) has clarified that Ind AS 116 is effective for annual periods beginning on or after April 1, 2019 and it replaces Ind AS 17 Leases, including appendices thereto. Ind AS 116 sets out the principles for the recognition, measurement, presentation and disclosure of leases and requires lessees to account for all leases under a single on-balance sheet model similar to the accounting for finance leases under Ind AS 17. The standard includes two recognition exemptions for lessees - leases of ‘low-value’ assets and short-term leases (i.e., leases with a lease term of 12 months or less). At the commencement date of a lease, a lessee will recognise a liability to make lease payments (i.e., the lease liability) and an asset representing the right to use the underlying asset during the lease term (i.e., the right-of-use asset). Lessees will be required to separately recognise the interest expense on the lease liability and the depreciation expense on the right-of-use asset. The Company is evaluating the requirements of the amendment and the effect on the financial statements is being evaluated.
Amendment to Ind AS 12, Income taxes
On March 30, 2019, Ministry of Corporate Affairs (“MCA”) has notified Appendix C to Ind-AS 12 Income taxes – “Uncertainty over Income Tax Treatments”. The amendment to Ind AS 12 requires the entities to consider recognition and measurement requirements when there is uncertainty over income tax treatments. In such a circumstance, an entity shall recognise and measure its current or deferred tax asset or liability accordingly. The effective date of amendment is April 1, 2019. Further, there has been amendments in relevant paragraphs in Ind-AS 12 “Income Taxes” which clarifies that an entity shall recognize the income tax consequences of dividends in profit or loss, other comprehensive income or equity according to where the entity originally recognized those past transactions or events in accordance with Ind-AS 109. The Company is evaluating the requirements of the amendments and their impact on the financial statements.
Amendment to Ind AS 19, Employee benefits
On March 30, 2019, Ministry of Corporate Affairs (“MCA”) has issued an amendment to Ind AS 19 which requires the entities to determine current service cost using actuarial assumptions and net interest using discount rate determined at the start of the annual reporting period. However, if an entity re-measures the net defined benefit liability (asset) as per the requirement of the standard, it shall determine current service cost and net interest for the remainder of the annual reporting period after the plan amendment, curtailment or settlement using the actuarial assumptions used to re-measure the net defined benefit liability (asset). The effective date of amendment is April 1, 2019. The Company is evaluating the requirements of the amendments and their impact on the financial statements.
Amendment to Ind AS 109, Financial instruments
On March 30, 2019, Ministry of Corporate Affairs (“MCA”) issued an amendment to Ind-AS 109 in respect of prepayment features with negative compensation, which amends the existing requirements in Ind-AS 109 regarding termination rights in order to allow measurement at amortized cost (or, depending on the business model, at fair value through other comprehensive income) even in the case of negative compensation payments. This amendment is effective for annual periods beginning on or after April 1, 2019. The Company is evaluating the requirements of the amendments and their impact on the financial statements.
Amendment to Ind AS 23, Borrowing costs
On March 30, 2019, Ministry of Corporate Affairs (“MCA”) issued an amendment to Ind-AS 23 “Borrowing Costs” clarifies that if any specific borrowing remains outstanding after the related asset is ready for its intended use or sale, that borrowing becomes part of the funds that an entity borrows generally when calculating the capitalization rate on general borrowings. This amendment is effective for annual periods beginning on or after April 1, 2019. The Company is evaluating the requirements of the amendments and their impact on the financial statements.

90
PTC India Financial Services LimitedNotes to the standalone financial statements for the year ended March 31, 2019
(All amounts in Lakha of r unless otherwuse stated)
3 Cash and cash equivalents As at March 31, 2019
As at March 31, 2018
As at April 1,2017
Cash on hand 0.03 - 0.06 Balances with banks: - in current accounts 2,608.97 4,703.68 2,256.07 - in deposit accounts 614.49 626.31 588.32 Cheques or drafts on hand - - 119.40
3,223.49 5,329.99 2,963.85
4 Other Bank balance As at March 31, 2019
As at March 31, 2018
As at April 1,2017
Balances with banks- - in earmarked accounts i. Unclaimed share application money lying in escrow account - 1.77 1.82 ii. Unclaimed interest on debentures 621.36 456.34 567.81 iii. Unclaimed dividend 46.88 34.59 18.31
668.24 492.70 587.94
5 Derivative financial instruments
The Company enters into derivatives for risk management purposes. The Company has various derivative (i.e. cross currency interest rate swaps, call spread and cap spread options) contract which are entered into as an economic hedge of the for foreign currency and interest rate risks of the Company. The Com-pany has designated cross currency swap contracts under cash flow hedge relationship. The table below shows the fair values of derivative financial instruments recorded as assets or liabilities together with their notional amounts. The notional amounts indicate the value of transactions outstanding at the year end and are not indicative of either the market risk or credit risk.
As at March 31, 2019 As at March 31, 2018 As at April 1, 2017
Notional amounts
Fair Value - Assets
Fair Value - Liabilities
Notional amounts
Fair Value - Assets
Fair Value - Liabilities
Notional amounts
Fair Value - Assets
Fair Value - Liabilities
Currency derivatives
- Currency and interest rate swaps
11,706.18 - 23.00 12,688.69 - 758.22 13,114.00 - 906.54
- Call spread option 25,440.49 1,782.20 - 29,773.54 2,103.13 - 35,756.87 2,432.08 -
- Cap spread option 215.02 - 397.55 - 279.10 -
Total derivatives 1,997.22 23.00 2,500.68 758.22 2,711.18 906.54
Included in above are derivatives held for hedging and risk management purposes as follows:
Cash flow hedging:
- Currency and interest rate swaps
11,706.18 - 23.00 12,688.69 - 758.22 13,114.00 - 906.54
Undesignated derivatives - 1,997.22 - - 2,500.68 - - 2,711.18 -
Total derivative financial instruments
1,997.22 23.00 2,500.68 758.22 2,711.18 906.54

91
5.1 Hedging activities and derivatives
The Company is exposed to foreign currency risks relating to its ongoing business operations. The primary risks managed using derivative instruments are foreign currency risk and interest rate risk. Currency and interest rate swap contract meets the hedge accounting criteria as per Ind AS 109 and has been ac-counted as cash flow hedge. The Company has designated this contract in cash flow hedge relationship from January 1, 2019.
(a) Disclosure of effects of hedge accounting on financial performance For the year ended March 31, 2019
Type of hedge and risks Change in the value of hedging instrument gain/ (loss)
Hedge ineffectiveness recognised in statement of profit or loss
Amount reclassified from cash flow hedging reserve to profit or loss
Line item affected in state-ment of profit and loss because of reclassification and hedge ineffectiveness
Cash flow hedgeForeign currency and interest rate risk(i) Currency and interest rate swap (401.50) 77.89 (163.60) Gain/ (loss) on fair value
changes and loss/ amortisa-tion of foreign currency transaction/ translation
Hedge effectiveness is determined at the inception of the hedge relationship, and through periodic prospective effectiveness assessment to ensure that an economic relationship exists between the hedged item and hedging instrument.
For derivative contracts, hedge effectiveness is measured using hypothetical derivative method. Ineffectiveness is measured by comparing the change in the fair value of the actual derivative i.e. currency and interest rate swap contracts designated as the hedging instrument and the change in the fair value of a hypothetical derivative representing the hedged item i.e. foreign currency loan. Hypothetical derivative matches the critical terms i.e. maturity date, currency and amount of foreign currency loan.
(b) Movements in cash flow hedging reserveParticulars Amount As at March 31, 2018 - Add: Changes in fair value of derivative contracts- gain/ (loss) (401.50)Less: Amount reclassified to profit or loss (163.60)Less: Deferred tax relating to above (net) (83.13)As at March 31, 2019 (154.77)
5.2 Derivatives not designated as hedging instruments
The Company uses currency and interest rate swaps and Call and Cap spread options to manage its interest rate risk and currency risk arising from USD denominated borrowings. The currency and interest rate call and cap spread options are not designated in a hedging relationship.
6 Trade receivables As at March 31, 2019
As at March 31, 2018
As at April 1,2017
Trade receivables Unsecured, considered good 447.81 565.71 567.22 Which have significant increase in credit risk 491.01 - -
938.82 565.71 567.22 Less: Allowance for impairment loss allowance 77.68 - -
861.14 565.71 567.22
(i) All amounts are short-term. The net carrying amount of trade receivables is considered a reasonable approximation of their fair value.
(ii) Age of receivables :
Particulars As at March 31, 2019
As at March 31, 2018
As at April 1,2017
Within the credit period - - - Up to 180 days past due 305.87 565.71 567.22 More than 180 days 555.27 - -
861.14 565.71 567.22
92
7 Loans As at March 31, 2019
As at March 31, 2018
As at April 1,2017
At amortised cost
(i) Term loans* 1,337,429.41 1,286,827.65 1,066,353.15
(ii) Loans to employees 39.92 17.10 17.54
Total - Gross 1,337,469.33 1,286,844.75 1,066,370.69
Less: Impairment loss allowance 73,024.10 106,210.65 47,164.56
Total - Net 1,264,445.23 1,180,634.10 1,019,206.13
(i) Secured by tangible assets (property, plant and equipment including land and building)** 1,277,449.89 1,244,340.48 1,066,369.53
(ii) Covered by bank and government guarantee 60,015.00 42,500.00 -
(iii) Unsecured 4.44 4.27 0.16
Total - Gross 1,337,469.33 1,286,844.75 1,066,369.69
Less: Impairment loss allowance 73,024.10 106,210.65 47,164.56
Total - Net 1,264,445.23 1,180,634.10 1,019,205.13
Loans in India***
(i) Public sector 199,623.01 143,194.32 93,915.71
(ii) Others 1,137,846.32 1,143,650.43 972,454.98
Total - Gross 1,337,469.33 1,286,844.75 1,066,370.69
Less: Impairment loss allowance 73,024.10 106,210.65 47,164.56
Total - Net 1,264,445.23 1,180,634.10 1,019,206.13
* Includes interest accrued ** Based on the net book value of the tangible assets provided as security. *** The Company does not hold any loans outside India The net carrying amount of loans is considered a reasonable approximation of their fair value. Refer note 45 A on credit risk
8 Investments As at March 31, 2019 As at March 31, 2018 As at April 1, 2017Fair
value through
state-ment of profit
and loss
At fair value
through other com-prehensive
income
At cost Total Fair value
through state-
ment of profit
and loss
At fair value
through other
compre-hensive income
At cost Total Fair value
through state-
ment of profit
and loss
At fair value
through other
compre-hensive income
At cost Total
Investments in India
Investment in equity instruments
(a) Investment in as-sociates
61,121,415 (March 31, 2018: 61,121,415; April 1, 2017: 61,121,415) equity shares of Rs. 10 held in R.S. India Wind Energy Private Limited
- - 6,112.14 6,112.14 - - 6,112.14 6,112.14 - - 6,112.14 6,112.14
4,390,000 (March 31, 2018:4,390,000; April 1, 2017: 4,390,000) equity shares of Rs.10 held in Varam Bio En-ergy Private Limited
- - 439.00 439.00 - - 439.00 439.00 - - 439.00 439.00

93
(b) Investment in other companies (Refer Note (i) below)
133,385,343 (March 31, 2018: 133,385,343; April 1, 2017: 133,385,343) equity shares of Rs. 10 held in East Coast Energy Private Limited
- - - - - 3,241.26 - 3,241.26 - 11,311.07 - 11,311.07
8,180,000 (31 March 2018: 9,740,000; 1 April 2017: 9,740,000) equity shares of Rs. 10 held in Adhunik Power and Natural Resources Limited
- - - - - 117.29 - 117.29 - 117.29 - 117.29
39,831,212 (March 31, 2018: 39,831,212; April 1, 2017: Nil) equity shares of Rs. 10 held in Athena Chattisgarh Power Limited
- - - - - - - - - - - -
Investment in optionally convertible debentures(a) Investment in as-sociates
90 (March 31, 2018: 90; April 1, 2017: 90) optionally convertible debentures of Rs. 10 held in Varam Bio En-ergy Private Limited
- - 428.58 428.58 - - 428.58 428.58 - - 428.58 428.58
Investment in security receipts
307,470 (March 31, 2018: 294,270; April 1, 2017: Nil) security receipts Rs.1000 each held in Edelweiss As-sets Reconstruction Co Ltd - Adhunik Power and Natural Resources Limited
3,043.68 - - 3,043.68 2,942.70 - - 2,942.70 - - - -
233,750 (March 31, 2018: Nil; April 1, 2017: Nil) security re-ceipts of Rs. 1000 each held in Phoenix ARC Pvt Ltd-Raigarh Cham-pa Rail Infrastructure Private Limited
1,753.13 - - 1,753.13 - - - - - - - -
552,500 (March 31, 2018: Nil; April 1, 2017: Nil) security receipts of Rs. 1000 each held in Phoenix ARC Pvt Ltd-Sispara Renewable Pvt Ltd
4,790.18 - - 4,790.18 - - - - - - - -
Total Investments (A) 9,586.99 - 6,979.72 16,566.71 2,942.70 3,358.55 6,979.72 13,280.97 - 11,428.36 6,979.72 18,408.08
Less: Allowance for Impairment Loss (B)
- - 6,979.72 6,979.72 - - 6,979.72 6,979.72 - - 6,979.72 6,979.72
Total Net C= (A)-(B) 9,586.99 - - 9,586.99 2,942.70 3,358.55 - 6,301.25 - 11,428.36 - 11,428.36

94
Note:
(i) Fair value at initial recognition of investment in other companies is as follows:
Particulars As at March 31, 2019
As at March 31, 2018
As at April 1, 2017
East Coast Energy Private Limited 13,338.53 13,338.53 13,338.53
Adhunik Power and Natural Resources Limited 819.32 974.00 974.00
Athena Chattisgarh Power Limited 3,983.12 3,983.12 -
18,140.97 18,295.65 14,312.53
(ii) Investments acquired through invocation of pledge shares (collaterals) has not been considered as an investment.
9 Other financial assets As at March 31, 2019
As at March 31, 2018
As at April 1,2017
Security deposits 52.47 49.68 64.78
Others - 125.12 5.37
52.47 174.80 70.15
10 Current tax assets (net) As at March 31, 2019
As at March 31, 2018
As at April 1,2017
Tax assetsAdvance income tax 91,479.72 78,572.38 63,507.04 Tax liabilitiesProvision for income tax 74,451.07 74,451.07 61,382.70
17,028.65 4,121.31 2,124.34
11 Deferred tax assets As at March 31, 2019
As at March 31, 2018
As at April 1,2017
Tax effect of items constituting deferred tax liabilitiesDifference between book balance and tax balance of property, plant and equip-ment and intangible assets 29.82 71.85 102.43
Foreign currency monetary items translation difference account 885.02 664.46 772.51 Special reserve under section 36(1)(viii) of Income-tax Act, 1961 10,378.29 10,278.50 8,076.64 Financial liabilities measured at amortised cost 412.07 270.50 289.30
11,705.20 11,285.31 9,240.88 Tax effect of items constituting deferred tax assetsProvision for employees benefits 121.79 107.58 79.51 Impairment on financial instruments 25,723.54 36,779.35 16,322.72 Accrued interest deductible on payment 38.60 47.79 57.34 Provision for diminution in value of unquoted non-current trade investments 99.84 98.88 994.44 Financial assets measured at amortised cost 2,177.66 2,490.56 1,929.64 Tax loss 2,098.31 - - Cash flow hedge reserve 83.13 - -
30,342.87 39,524.16 19,383.65 Deferred tax (assets) /liabilities (net) (18,637.67) (28,238.85) (10,142.77)

95
Deferred taxes arising from temporary differences for the year ended 31 March 2019 are summarized as follows:
Deferred tax assets/(liabilities) As at April 1, 2018
Recognized in profit or loss
Recognized in other comprehensive
income
As at March 31, 2019
Tax effect of items constituting deferred tax liabilities
Difference between book balance and tax balance of prop-erty, plant and equipment and intangible assets
71.85 (42.03) - 29.82
Foreign currency monetary items translation difference account
664.46 220.56 - 885.02
Special reserve under section 36(1)(viii) of Income-tax Act, 1961
10,278.50 99.79 - 10,378.29
Financial liabilities measured at amortised cost 270.50 141.57 - 412.07
11,285.31 419.89 - 11,705.20
Tax effect of items constituting deferred tax assets
Provision for employees benefits 107.58 12.82 1.39 121.79
Impairment on financial instruments 36,779.35 (11,055.81) - 25,723.54
Accrued interest deductible on payment 47.79 (9.19) - 38.60
Losses/ diminution in associates 98.88 0.96 - 99.84
Financial assets measured at amortised cost 2,490.56 (312.90) - 2,177.66
Tax loss - 2,098.31 - 2,098.31
Cash flow hedge reserve - - 83.13 83.13
39,524.16 (9,265.81) 84.52 30,342.87
Deferred tax (assets) /liabilities (net) (28,238.85) 9,685.70 (84.52) (18,637.67)
Deferred taxes arising from temporary differences for the year ended 31 March 2018 are summarized as follows:
Deferred tax assets/(liabilities) As at April 1, 2018
Recognized in profit or loss
Recognized in other comprehensive
income
As at March 31, 2018
Tax effect of items constituting deferred tax liabilities
Difference between book balance and tax balance of prop-erty, plant and equipment and intangible assets
102.43 (30.58) - 71.85
Foreign currency monetary items translation difference account
772.51 (108.05) - 664.46
Special reserve under section 36(1)(viii) of Income-tax Act, 1961
8,076.64 2,201.86 - 10,278.50
Financial liabilities measured at amortised cost 289.30 (18.80) - 270.50
9,240.88 2,044.43 - 11,285.31
Tax effect of items constituting deferred tax assets
Provision for employees benefits 79.51 19.61 8.46 107.58
Impairment on financial instruments 16,322.72 20,456.63 - 36,779.35
Accrued interest deductible on payment 57.34 (9.55) - 47.79
Losses/ diminution in associates 994.44 (895.56) - 98.88
Financial assets measured at amortised cost 1,929.64 560.92 - 2,490.56
19,383.65 20,132.05 8.46 39,524.16
Deferred tax (assets) /liabilities (net) (10,142.77) (18,087.62) (8.46) (28,238.85)
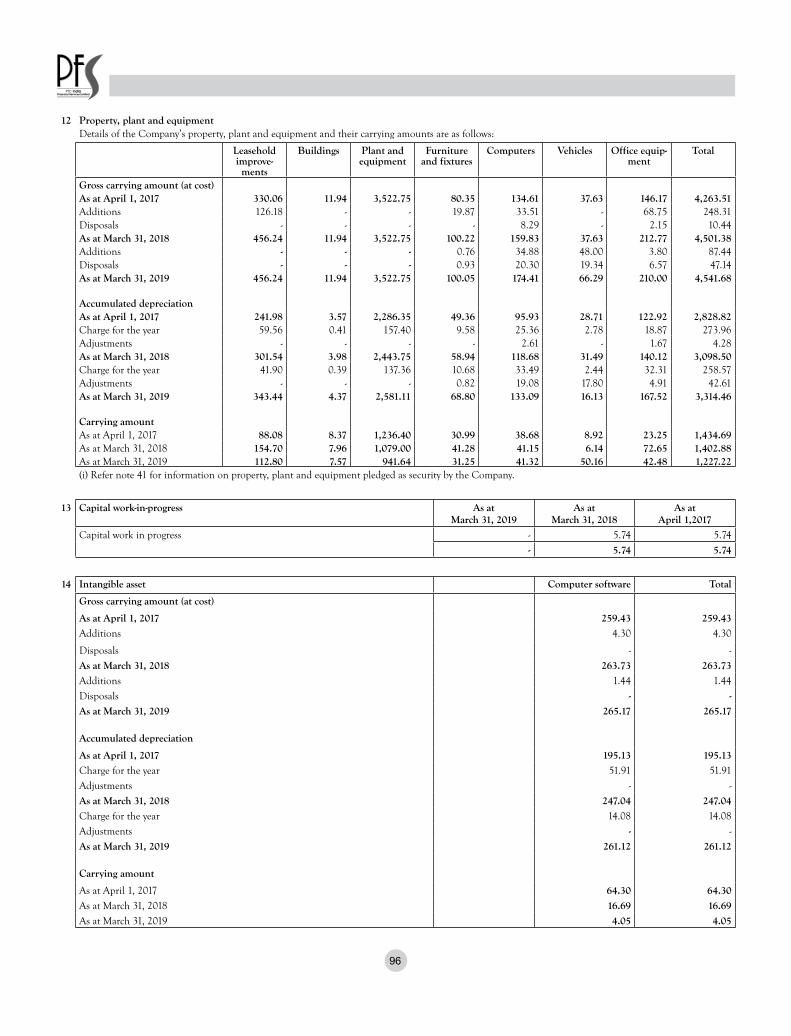
96
12 Property, plant and equipmentDetails of the Company’s property, plant and equipment and their carrying amounts are as follows:
Leasehold improve-
ments
Buildings Plant and equipment
Furniture and fixtures
Computers Vehicles Office equip-ment
Total
Gross carrying amount (at cost)As at April 1, 2017 330.06 11.94 3,522.75 80.35 134.61 37.63 146.17 4,263.51 Additions 126.18 - - 19.87 33.51 - 68.75 248.31 Disposals - - - - 8.29 - 2.15 10.44 As at March 31, 2018 456.24 11.94 3,522.75 100.22 159.83 37.63 212.77 4,501.38 Additions - - - 0.76 34.88 48.00 3.80 87.44 Disposals - - - 0.93 20.30 19.34 6.57 47.14 As at March 31, 2019 456.24 11.94 3,522.75 100.05 174.41 66.29 210.00 4,541.68
Accumulated depreciationAs at April 1, 2017 241.98 3.57 2,286.35 49.36 95.93 28.71 122.92 2,828.82 Charge for the year 59.56 0.41 157.40 9.58 25.36 2.78 18.87 273.96 Adjustments - - - - 2.61 - 1.67 4.28 As at March 31, 2018 301.54 3.98 2,443.75 58.94 118.68 31.49 140.12 3,098.50 Charge for the year 41.90 0.39 137.36 10.68 33.49 2.44 32.31 258.57 Adjustments - - - 0.82 19.08 17.80 4.91 42.61 As at March 31, 2019 343.44 4.37 2,581.11 68.80 133.09 16.13 167.52 3,314.46
Carrying amountAs at April 1, 2017 88.08 8.37 1,236.40 30.99 38.68 8.92 23.25 1,434.69 As at March 31, 2018 154.70 7.96 1,079.00 41.28 41.15 6.14 72.65 1,402.88 As at March 31, 2019 112.80 7.57 941.64 31.25 41.32 50.16 42.48 1,227.22 (i) Refer note 41 for information on property, plant and equipment pledged as security by the Company.
13 Capital work-in-progress As at March 31, 2019
As at March 31, 2018
As at April 1,2017
Capital work in progress - 5.74 5.74
- 5.74 5.74
14 Intangible asset Computer software Total
Gross carrying amount (at cost)
As at April 1, 2017 259.43 259.43 Additions 4.30 4.30
Disposals - -
As at March 31, 2018 263.73 263.73 Additions 1.44 1.44
Disposals - - As at March 31, 2019 265.17 265.17
Accumulated depreciation
As at April 1, 2017 195.13 195.13 Charge for the year 51.91 51.91
Adjustments - -
As at March 31, 2018 247.04 247.04 Charge for the year 14.08 14.08
Adjustments - -
As at March 31, 2019 261.12 261.12
Carrying amount
As at April 1, 2017 64.30 64.30 As at March 31, 2018 16.69 16.69 As at March 31, 2019 4.05 4.05

97
15 Other non-financial assets As at 31 March 2019
As at 31 March 2018
As at 1 April 2017
Capital advances 1,538.84 1538.75 509.44 Prepaid expenses 37.80 87.13 71.74 Balances with government authorities 3.08 94.91 5.42 Advance to employees - 8.74 5.70 Other receivables - - 40.17
1,579.72 1,729.53 632.47
16 Debt securities As at March 31, 2019
As at March 31, 2018
As at April 1,2017
At amortised cost
Unsecured
Commercial paper - 39,527.48 79,376.30
Secured
Infrastructure bonds (i) 14,085.66 14,960.53 16,914.19
Debentures (ii) 39,143.78 43,560.92 44,977.69
Total 53,229.44 98,048.93 141,268.18
Debt securities in India 20,081.72 61,982.22 105,282.57
Debt securities outside India 33,147.72 36,066.71 35,985.61
53,229.44 98,048.93 141,268.18
(i) Infrastructure bonds
52,295 (March 31, 2018: 55,197) privately placed 8.25%/8.30% secured redeemable non-convertible long-term infrastructure bonds of Rs 5,000 each (Infra Series 1) amounting to Rs 2,614.75 lakhs (March 31, 2018: Rs. 2,759.85 lakhs) allotted on March 31, 2011 redeemable at par in 5 to 10 years commenced from March 31, 2016 are secured by way of first charge on the receivables of the assets created from the proceeds of infrastructure bonds and other un-encumbered receivables of the Company to provide 100% security coverage. During the year, the company has repaid Rs 145.10 lakhs (March 31, 2018: Rs. 248.50 lakhs) under buyback scheme exercised by eligible holders of infrastructure bonds in financial year 2018-19 as per terms of Infra Series 1. 229,460 (March 31, 2018: 245,685) privately placed 8.93%/9.15% secured redeemable non-convertible long-term infrastructure bonds of Rs 5,000 each (Infra Series 2) amounting to Rs 11,473.00 lakhs (March 31, 2018: Rs. 12,284.25 lakhs) allotted on March 30, 2012 redeemable at par in 5 to 15 years commencing from March 30, 2017 are secured by way of first charge on the receivables of the assets created from the proceeds of infrastructure bonds and other receivables of the Company to provide the 100% security coverage. During the year, the company has repaid Rs. 811.25 lakhs (March 31, 2018: Rs. 1,794.55 lakhs) under buyback scheme exercised by eligible holders of infrastructure bonds in FY2018-19 as per terms of Infra Series 2.
(ii) Debentures
900 (March 31, 2018: 900) privately placed 10.50% secured redeemable non-convertible debentures of Rs. 666,667 (March 31, 2018: Rs. 833,333 each) (Series 3) amounting to Rs.6,000.00 lakhs (March 31, 2018: Rs.7,500.00 lakhs) were allotted on January 27, 2011 redeemable at par in six equal annual instalments commencing from January 26, 2018.
Series 3 debentures are secured by way of mortgage of immovable building and first charge by way of hypothecation of the receivables of the loan assets cre-ated from the proceeds of respective debentures. Further, the same have also been secured by pari-passu charge by way of hypothecation of the receivables of loan assets created by the Company out of its own sources which are not charged to any other lender of the Company to the extent of 125% of debentures.
2,135 (March 31, 2018: 2,135) privately placed 9.62% secured redeemable non-convertible debentures of Rs.1,000,000 each (Series 4) amounting to Rs.21,350.00 lakhs were allotted on June 03, 2015 redeemable at par in 3 tranches divided in 33% of face value on 28th May 2019, 33% of face value on 28th May 2021 and balance 34% of face value on 28th May 2025.
Series 4 debentures are secured by way of first charge by way of hypothecation of the specified receivables of the Company comprising asset cover of at least 110% of the amount of the Debentures
1,500 (March 31, 2018: 1,500) privately placed 9.80% secured redeemable non-convertible debentures of Rs.1,000,000 each (Series 5) amounting to Rs. 12,000.00 lakhs (March 31, 2018: Rs 15,000.00 lakhs)were allotted on June 16, 2015 redeemable at par in five equal annual instalments commencing from June 12, 2018
Series 5 debentures are secured by way of first ranking exclusive charge by way of hypothecation of the identified receivables of the Company comprising asset cover of at least 100% of the amount of the Debentures
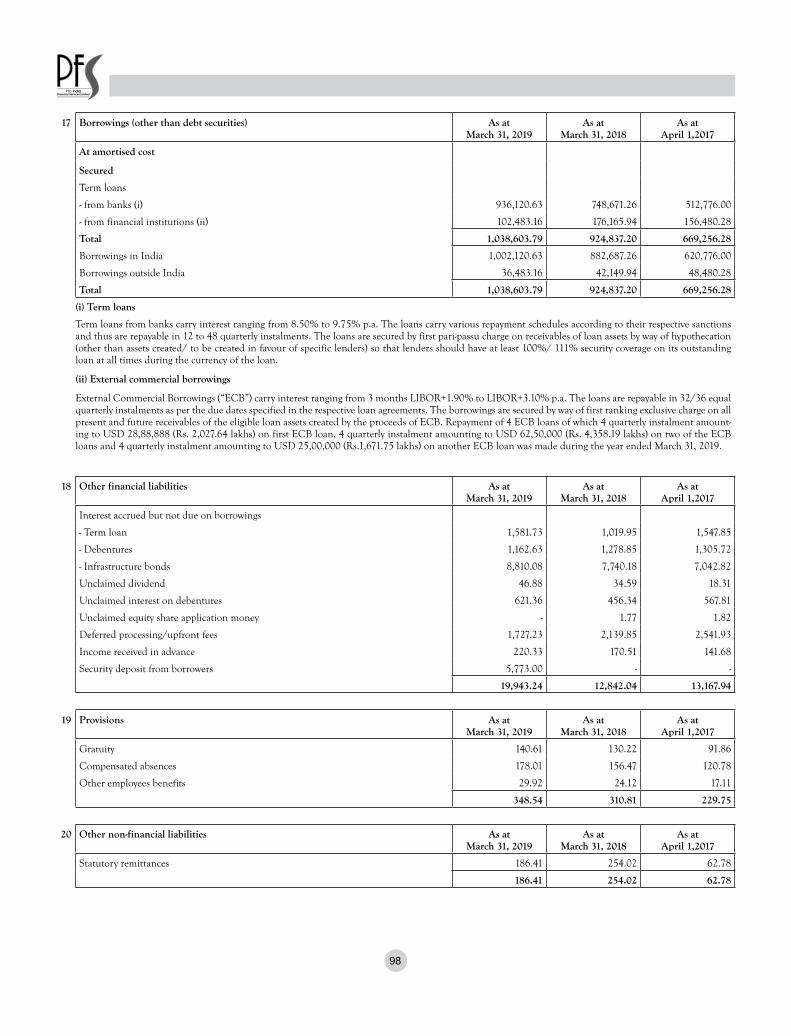
98
17 Borrowings (other than debt securities) As at March 31, 2019
As at March 31, 2018
As at April 1,2017
At amortised cost
Secured
Term loans
- from banks (i) 936,120.63 748,671.26 512,776.00
- from financial institutions (ii) 102,483.16 176,165.94 156,480.28
Total 1,038,603.79 924,837.20 669,256.28
Borrowings in India 1,002,120.63 882,687.26 620,776.00
Borrowings outside India 36,483.16 42,149.94 48,480.28
Total 1,038,603.79 924,837.20 669,256.28
(i) Term loans
Term loans from banks carry interest ranging from 8.50% to 9.75% p.a. The loans carry various repayment schedules according to their respective sanctions and thus are repayable in 12 to 48 quarterly instalments. The loans are secured by first pari-passu charge on receivables of loan assets by way of hypothecation (other than assets created/ to be created in favour of specific lenders) so that lenders should have at least 100%/ 111% security coverage on its outstanding loan at all times during the currency of the loan.
(ii) External commercial borrowings
External Commercial Borrowings (“ECB”) carry interest ranging from 3 months LIBOR+1.90% to LIBOR+3.10% p.a. The loans are repayable in 32/36 equal quarterly instalments as per the due dates specified in the respective loan agreements. The borrowings are secured by way of first ranking exclusive charge on all present and future receivables of the eligible loan assets created by the proceeds of ECB. Repayment of 4 ECB loans of which 4 quarterly instalment amount-ing to USD 28,88,888 (Rs. 2,027.64 lakhs) on first ECB loan, 4 quarterly instalment amounting to USD 62,50,000 (Rs. 4,358.19 lakhs) on two of the ECB loans and 4 quarterly instalment amounting to USD 25,00,000 (Rs.1,671.75 lakhs) on another ECB loan was made during the year ended March 31, 2019.
18 Other financial liabilities As at March 31, 2019
As at March 31, 2018
As at April 1,2017
Interest accrued but not due on borrowings
- Term loan 1,581.73 1,019.95 1,547.85
- Debentures 1,162.63 1,278.85 1,305.72
- Infrastructure bonds 8,810.08 7,740.18 7,042.82
Unclaimed dividend 46.88 34.59 18.31
Unclaimed interest on debentures 621.36 456.34 567.81
Unclaimed equity share application money - 1.77 1.82
Deferred processing/upfront fees 1,727.23 2,139.85 2,541.93
Income received in advance 220.33 170.51 141.68
Security deposit from borrowers 5,773.00 - -
19,943.24 12,842.04 13,167.94
19 Provisions As at March 31, 2019
As at March 31, 2018
As at April 1,2017
Gratuity 140.61 130.22 91.86
Compensated absences 178.01 156.47 120.78
Other employees benefits 29.92 24.12 17.11
348.54 310.81 229.75
20 Other non-financial liabilities As at March 31, 2019
As at March 31, 2018
As at April 1,2017
Statutory remittances 186.41 254.02 62.78
186.41 254.02 62.78
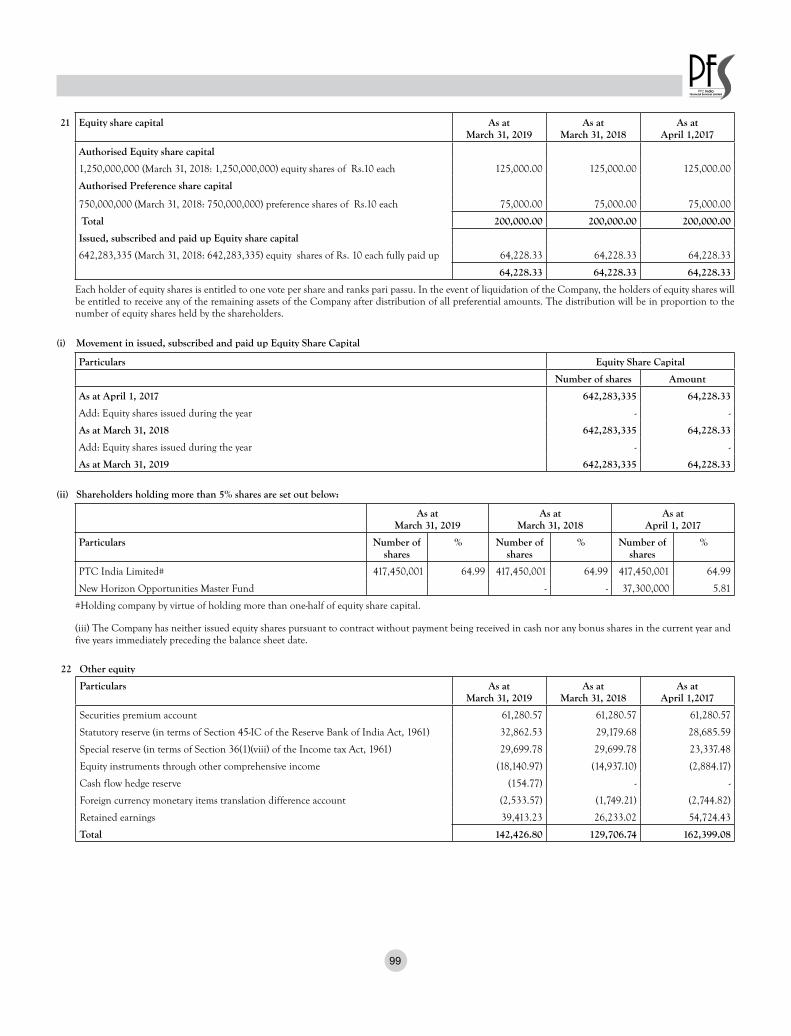
99
21 Equity share capital As at March 31, 2019
As at March 31, 2018
As at April 1,2017
Authorised Equity share capital
1,250,000,000 (March 31, 2018: 1,250,000,000) equity shares of Rs.10 each 125,000.00 125,000.00 125,000.00
Authorised Preference share capital
750,000,000 (March 31, 2018: 750,000,000) preference shares of Rs.10 each 75,000.00 75,000.00 75,000.00
Total 200,000.00 200,000.00 200,000.00
Issued, subscribed and paid up Equity share capital
642,283,335 (March 31, 2018: 642,283,335) equity shares of Rs. 10 each fully paid up 64,228.33 64,228.33 64,228.33
64,228.33 64,228.33 64,228.33
Each holder of equity shares is entitled to one vote per share and ranks pari passu. In the event of liquidation of the Company, the holders of equity shares will be entitled to receive any of the remaining assets of the Company after distribution of all preferential amounts. The distribution will be in proportion to the number of equity shares held by the shareholders.
(i) Movement in issued, subscribed and paid up Equity Share Capital
Particulars Equity Share Capital
Number of shares Amount
As at April 1, 2017 642,283,335 64,228.33
Add: Equity shares issued during the year - -
As at March 31, 2018 642,283,335 64,228.33
Add: Equity shares issued during the year - -
As at March 31, 2019 642,283,335 64,228.33
(ii) Shareholders holding more than 5% shares are set out below:
As at March 31, 2019
As at March 31, 2018
As at April 1, 2017
Particulars Number of shares
% Number of shares
% Number of shares
%
PTC India Limited# 417,450,001 64.99 417,450,001 64.99 417,450,001 64.99
New Horizon Opportunities Master Fund - - 37,300,000 5.81
#Holding company by virtue of holding more than one-half of equity share capital.
(iii) The Company has neither issued equity shares pursuant to contract without payment being received in cash nor any bonus shares in the current year and five years immediately preceding the balance sheet date.
22 Other equity
Particulars As at March 31, 2019
As at March 31, 2018
As at April 1,2017
Securities premium account 61,280.57 61,280.57 61,280.57
Statutory reserve (in terms of Section 45-IC of the Reserve Bank of India Act, 1961) 32,862.53 29,179.68 28,685.59
Special reserve (in terms of Section 36(1)(viii) of the Income tax Act, 1961) 29,699.78 29,699.78 23,337.48
Equity instruments through other comprehensive income (18,140.97) (14,937.10) (2,884.17)
Cash flow hedge reserve (154.77) - -
Foreign currency monetary items translation difference account (2,533.57) (1,749.21) (2,744.82)
Retained earnings 39,413.23 26,233.02 54,724.43
Total 142,426.80 129,706.74 162,399.08

100
(i) Securities premium account
Particulars For the year endedMarch 31, 2019
For the year endedMarch 31, 2018
Opening balance 61,280.57 61,280.57
Add: Amount received pursuant to issue of equity shares - -
Closing balance 61,280.57 61,280.57
Securities premium account is used to record the premium on issue of shares. The reserve is utilised in accordance with the provisions of the relevant statutes.
(ii) Statutory reserve (in terms of Section 45-IC of the Reserve Bank of India Act, 1961)
Particulars For the year endedMarch 31, 2019
For the year endedMarch 31, 2018
Opening balance 29,179.68 28,685.59
Add: Transferred from Retained earnings 3,682.85 494.09
Closing balance 32,862.53 29,179.68
This reserve is maintained in accordance with the provisions of Section 45-IC of the Reserve Bank of India Act, 1961.
(iii) Special reserve (in terms of Section 36(1)(viii) of the Income tax Act, 1961)
Particulars For the year endedMarch 31, 2019
For the year endedMarch 31, 2018
Opening balance 29,699.78 23,337.48
Add: Transferred from Retained Earnings - 6,362.30
Closing balance 29,699.78 29,699.78
This reserve is maintained in accordance with the provisions of Section 36(1)(viii) of the Income tax Act, 1961.
(iv) Equity instruments through other comprehensive income
Particulars For the year endedMarch 31, 2019
For the year endedMarch 31, 2018
Opening balance (14,937.10) (2,884.17)
Add: Change in fair value of FVOCI equity investments (3,203.87) (12,052.93)
Add/less: Tax impact - -
Closing balance (18,140.97) (14,937.10)
The Company has elected to recognise changes in fair value of equity investments in other comprehensive income. These changes are accumulated within the “Reserve for equity instruments through other comprehensive income”. The Company transfers amounts from this reserve to retained earnings when the relevant equity securities are derecognised.
(v) Cash flow hedge reserve
Particulars For the year endedMarch 31, 2019
For the year endedMarch 31, 2018
Opening balance - -
Add/(less): MTM of derivatives instruments (237.90) -
Add/less: Tax impact 83.13 -
Closing balance (154.77) -
The Company uses hedging instruments as part of its management of foreign currency risk and interest rate risk associated with its foreign currency borrowings. To the extent these hedges are effective; the change in fair value of the hedging instrument is recognised in the cash flow hedge reserve. Amounts recognised in the cash flow hedge reserve is reclassified to profit or loss when hedged item affects profit or loss.

101
(v) Foreign currency monetary items translation difference account
Particulars For the year endedMarch 31, 2019
For the year endedMarch 31, 2018
Opening balance (1,749.21) (2,744.82)
Add/(less): Effect of foreign exchange rate variations during the year (net) (2,451.19) 191.10
Add/less: Amortisation for the year 1,666.83 804.51
Closing balance (2,533.57) (1,749.21)
Foreign currency monetary items translation difference account comprises of the unamortised loss/gain on long term foreign currency monetary items (except derivative financial instruments), for which the Previous GAAP policy is carried forward.
(vi) Retained earnings
Particulars For the year endedMarch 31, 2019
For the year endedMarch 31, 2018
Opening balance 26,233.02 54,724.43
Add: Net profit for the year 18,414.26 (10,023.45)
Add: Remeasurement of post-employment benefit obligation, net of tax (2.58) (16.00)
Less: Transferred to statutory reserve u/s 45-IC of the Reserve Bank of India Act, 1934 (3,682.85) (494.09)
Less: Transferred to special reserve u/s 36(1)(vii) of the Income tax Act Act, 1961 - (6,362.30)
Less: Dividend on equity shares [Rs. 0.20 per equity share (March 31, 2017: Re. 1.50 per equity share] (1,284.57) (9,634.25)
Less: Tax on equity dividend (264.05) (1,961.32)
Closing balance 39,413.23 26,233.02
Distributions made and proposed
Particulars As at March 31, 2019
As at March 31, 2018
As at April 1,2017
Cash dividends on equity shares declared and paid:
Final dividend for the year ended March 31, 2018: Rs. 0.20 per share (March 31, 2017: Rs. 1.50 per share)
1,284.57 9,634.25 -
Dividend Distribution tax on final dividend 264.05 1,961.31 -
Particulars As at March 31, 2019
As at March 31, 2018
As at April 1,2017
Proposed dividend on Equity Shares:
Final dividend for the year ended March 31, 2019: Rs.0.80 per share (March 31, 2018: Rs. 0.20 per share)
5,138.28 1,284.57 -
Dividend Distribution tax on proposed dividend 1,056.20 264.05 -
23 Interest income Year ended March 31, 2019
Year ended March 31, 2018
Interest income from loan financing 128,433.77 112,493.55
Interest on fixed deposits 76.98 43.91
Interest income on other financial assets 6.33 7.66
128,517.08 112,545.12
24 Fee and commission Income Year ended March 31, 2019
Year ended March 31, 2018
Fee based income 3,474.71 5,150.59
3,474.71 5,150.59

102
25 Net gain on fair value changes Year ended March 31, 2019
Year ended March 31, 2018
Net gain /(loss) on financial instruments at fair value through profit or loss
- Gain on MTM of derivatives 1,042.59 346.88
1,042.59 346.88
Fair value changes
- Realised 110.54 (323.21)
- Unrealised 932.05 670.09
1,042.59 346.88
26 Other income Year ended March 31, 2019
Year ended March 31, 2018
Consultancy and other services 71.75 27.20
Profit on sale of property, plant and equipment 4.93 0.03
Interest on income tax refund 129.42 -
Miscellaneous Income 3.55 33.65
209.65 60.88
27 Finance costs (on financial liabilities measured at amortised cost) Year ended March 31, 2019
Year ended March 31, 2018
Interest expenses on:
Borrowings:
-On Loans from banks/ financial institutions 79,818.81 53,117.58
-On External commercial borrowings 2,770.89 2,721.09
Debt securities
-On Infra bonds 2,076.76 2,218.19
-On Debentures 4,130.61 4,524.48
-On Commercial paper 3,549.32 5,117.79
Other interest expenses:
- Delayed payment of income tax 0.97 0.68
- Interest expense on security deposits 47.99 -
Other Borrowing Costs:
- Loss/amortisation of foreign currency transaction/transalation 2,035.71 800.27
94,431.06 68,500.08
28 Fees and commission expense Year ended March 31, 2019
Year ended March 31, 2018
Other charges on term loans and other borrowings 116.47 51.93
116.47 51.93
29 Impairment on financial instruments Year ended March 31, 2019
Year ended March 31, 2018
Impairment loss on financial instruments based on category of financial instrument:
Loans* 5,391.36 60,971.48
Others 666.89 -
6,058.25 60,971.48
* Refer note 45 (A.4)

103
30 Employees benefit expense Year ended March 31, 2019
Year ended March 31, 2018
Salaries and other allowances 1,241.33 1,306.89
Contribution to provident fund 55.41 54.60
Staff welfare expense 107.65 112.24
1,404.39 1,473.73
31 Depreciation and amortisation expense Year ended March 31, 2019
Year ended March 31, 2018
Depreciation on tangible assets 258.57 273.96
Amortisation on intangible assets 14.08 51.91
272.65 325.87
32 Other expenses Year ended March 31, 2019
Year ended March 31, 2018
Rent 495.43 476.83
Repairs and maintenance
- Plant and equipment 104.52 89.43
- others 106.58 120.24
Insurance 36.96 10.58
Rates and taxes 68.07 68.73
Communication 25.90 23.96
Travelling and conveyance 90.13 63.00
Advertising and business development 57.56 67.71
Donation 0.45 0.25
Corporate Social Responsibility Expenses 916.41 80.90
Legal and professional 1,003.89 887.22
Auditor remuneration:* -
- For statutory audit 22.25 18.00
- For quarterly audit/limited review 18.00 13.50
- For tax audit 2.75 2.50
- For other certification and reporting 17.15 23.15
- For out of pocket expenses 0.49 0.95
Bank charges 1.62 1.34
Directors’ sitting fees 82.84 85.13
Miscellaneous expenses 217.44 201.74
3,268.44 2,235.16
* Includes Rs. 4.00 lakhs (March 31, 2018: Rs. 8.50 lakhs) relating to previous year.

104
33 Income tax expenseIncome tax expense recognised in Statement of profit and loss
Particulars Year ended March 31, 2019
Year ended March 31, 2019
Current tax
In respect of the current year - 13,068.38
- 13,068.38
Deferred tax charge/ (benefits)
In respect of the current year 9,685.70 (18,087.62)
9,685.70 (18,087.62)
The major components of tax expense and the reconciliation of the expected tax expense based on the domestic effective tax rate and the reported tax expense in statement of profit and loss, is as follows:-
Particulars Year ended March 31, 2019
Year ended March 31, 2018
Profit before tax 28,099.96 (15,042.69)
Domestic tax rate 34.944% 34.608%
Expected tax expense [A] 9,819.25 (5,205.97)
Adjustment for tax-exempt income/ non-deductible expenses 121.35 (849.17)
Reversal of deferred tax asset on diminution in value of investment - 895.56
Reversal during tax holiday period (12.99) 171.77
Adjustment for change in tax rate during the year (179.81) -
Others (62.10) (31.43)
Total adjustments [B] (133.55) 186.73
Actual tax expense [C=A+B] 9,685.70 (5,019.24)
Tax expense comprises:
Current tax expense - 13,068.38
Deferred tax credit 9,685.70 (18,087.62)
Tax expense recognized in profit or loss [D] 9,685.70 (5,019.24)
Income tax expense recognized in other comprehensive income
Particulars Year ended March 31, 2019
Year ended March 31, 2018
Income tax relating to cash flow hedge reserve 83.13 -
Income tax relating to remeasurement gains/(losses) on defined benefit plans 1.39 8.46
84.52 8.46
Bifurcation of the income tax recognised in other comprehensive income into:-
Items that will not be reclassified to profit or loss 1.39 8.46
Items that will be reclassified to profit or loss 83.13 -
84.52 8.46
34 Contingent liabilities and commitments
Particulars As at March 31, 2019
As at March 31, 2018
As at April 1,2017
a) In respect of following:
- Income tax matters 3,042.72 3,356.39 3,193.62
b) Commitments
- Loan financing 91,557.44 149,592.00 173,236.00
- Capital commitments 5,150.00 5,150.00 5,150.00
c) Guarantees furnished to bank - 2,500.00 2,500.00
The above matters are subject to legal proceedings in the ordinary course of business. The legal proceeding when ultimately concluded will not, in the opinion of the management, have a material effect on financial position of the Company. Amount above does not include the contingencies the likelihood of which is remote.

105
35 Disclosures required under Section 22 of the Micro, Small and Medium Enterprises Development Act, 2006*
Particulars As at March 31, 2019
As at March 31, 2018
As at April 1,2017
Principal amount remaining unpaid to any supplier as at the end of the accounting year/period.
13.75 13.82 21.70
Interest due thereon remaining unpaid to any supplier as at the end of the accounting year/period.
- - -
The amount of interest paid along with the amounts of the payment made to the sup-plier beyond the appointed day.
- - -
The amount of interest due and payable for the year/period. - - -
The amount of interest accrued and remaining unpaid at the end of the accounting year/period.
- - -
The amount of further interest due and payable even in the succeeding year, until such date when the interest dues as above are actually paid.
- - -
* No interest is payable on outstanding amount.
36 Change in liabilities arising from financing activities
Debt securities Borrowings (Other than debt securities)
Total
As at April 1, 2017 141,268.18 669,256.28 810,524.46
Cash flows:
Proceeds from debt securities/borrowings - 268,199.76 268,199.76
Repayment of debt securities/borrowings (43,543.04) (11,694.13) (55,237.17)
Non-cash:
Foreign currency fluctuation impact - (999.86) (999.86)
Impact of borrowings measured at amortised cost 323.79 75.15 398.94
As at March 31, 2018 98,048.93 924,837.20 1,022,886.13
Cash flows:
Proceeds from debt securities/borrowings - 407,434.65 407,434.65
Repayment of debt securities/borrowings (45,456.36) (293,963.81) (339,420.17)
Non-cash:
Foreign currency fluctuation impact - 743.86 743.86
Impact of borrowings measured at amortised cost 636.87 (448.11) 188.76
As at March 31, 2019 53,229.44 1,038,603.79 1,091,833.23
37 Disclosures under Ind AS 19 (Employee benefits)The details of various employee benefits provided to employees are as under:
Defined contribution plans
Particulars Year ended March 31, 2019
Year ended March 31, 2018
Provident fund 55.41 54.60
Defined benefit plans:The Company has following defined benefit plans for its employees
- Gratuity: The Company has a defined benefit gratuity plan. Every employee is entitled to gratuity as per the provisions of the Payment of Gratuity Act, 1972. The liability of Gratuity is recognized on the basis of actuarial valuation.
- Post-Retirement Medical Benefit: The Company operates post-employment medical benefits scheme. The liability is recognised on the basis of actuarial valuation.
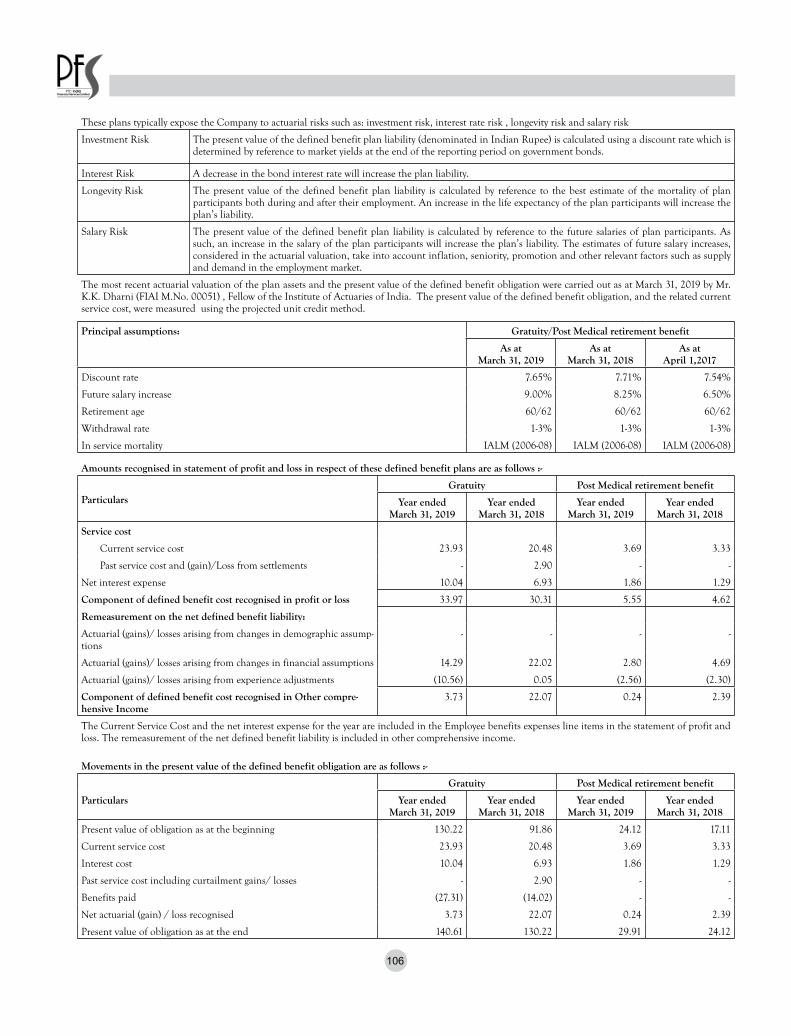
106
These plans typically expose the Company to actuarial risks such as: investment risk, interest rate risk , longevity risk and salary risk
Investment Risk The present value of the defined benefit plan liability (denominated in Indian Rupee) is calculated using a discount rate which is determined by reference to market yields at the end of the reporting period on government bonds.
Interest Risk A decrease in the bond interest rate will increase the plan liability.
Longevity Risk The present value of the defined benefit plan liability is calculated by reference to the best estimate of the mortality of plan participants both during and after their employment. An increase in the life expectancy of the plan participants will increase the plan’s liability.
Salary Risk The present value of the defined benefit plan liability is calculated by reference to the future salaries of plan participants. As such, an increase in the salary of the plan participants will increase the plan’s liability. The estimates of future salary increases, considered in the actuarial valuation, take into account inflation, seniority, promotion and other relevant factors such as supply and demand in the employment market.
The most recent actuarial valuation of the plan assets and the present value of the defined benefit obligation were carried out as at March 31, 2019 by Mr. K.K. Dharni (FIAI M.No. 00051) , Fellow of the Institute of Actuaries of India. The present value of the defined benefit obligation, and the related current service cost, were measured using the projected unit credit method.
Principal assumptions: Gratuity/Post Medical retirement benefit
As at March 31, 2019
As at March 31, 2018
As at April 1,2017
Discount rate 7.65% 7.71% 7.54%
Future salary increase 9.00% 8.25% 6.50%
Retirement age 60/62 60/62 60/62
Withdrawal rate 1-3% 1-3% 1-3%
In service mortality IALM (2006-08) IALM (2006-08) IALM (2006-08)
Amounts recognised in statement of profit and loss in respect of these defined benefit plans are as follows :-
ParticularsGratuity Post Medical retirement benefit
Year ended March 31, 2019
Year ended March 31, 2018
Year ended March 31, 2019
Year ended March 31, 2018
Service cost
Current service cost 23.93 20.48 3.69 3.33
Past service cost and (gain)/Loss from settlements - 2.90 - -
Net interest expense 10.04 6.93 1.86 1.29
Component of defined benefit cost recognised in profit or loss 33.97 30.31 5.55 4.62
Remeasurement on the net defined benefit liability:
Actuarial (gains)/ losses arising from changes in demographic assump-tions
- - - -
Actuarial (gains)/ losses arising from changes in financial assumptions 14.29 22.02 2.80 4.69
Actuarial (gains)/ losses arising from experience adjustments (10.56) 0.05 (2.56) (2.30)
Component of defined benefit cost recognised in Other compre-hensive Income
3.73 22.07 0.24 2.39
The Current Service Cost and the net interest expense for the year are included in the Employee benefits expenses line items in the statement of profit and loss. The remeasurement of the net defined benefit liability is included in other comprehensive income.
Movements in the present value of the defined benefit obligation are as follows :-
Gratuity Post Medical retirement benefit
Particulars Year ended March 31, 2019
Year ended March 31, 2018
Year ended March 31, 2019
Year ended March 31, 2018
Present value of obligation as at the beginning 130.22 91.86 24.12 17.11
Current service cost 23.93 20.48 3.69 3.33
Interest cost 10.04 6.93 1.86 1.29
Past service cost including curtailment gains/ losses - 2.90 - -
Benefits paid (27.31) (14.02) - -
Net actuarial (gain) / loss recognised 3.73 22.07 0.24 2.39
Present value of obligation as at the end 140.61 130.22 29.91 24.12

107
The reconciliation of the Company’s defined benefit obligations (DBO) and plan assets in respect of defined benefit plans to the amounts presented in the statement of balance sheet is presented below:
Gratuity
As at March 31, 2019
As at March 31, 2018
As at April 1,2017
Present Value of funded defined benefit obligation 140.61 130.22 91.86
Fair value of plan assets - - -
Net liability arising from defined benefit obligation 140.61 130.22 91.86
Post Medical retirement benefit
As at March 31, 2019
As at March 31, 2018
As at April 1,2017
Present Value of funded defined benefit obligation 29.91 24.12 17.11
Fair value of plan assets - - -
Net liability arising from defined benefit obligation 29.91 24.12 17.11
Significant actuarial assumptions for the determination of the defined obligation are discount rate, expected salary increase, mortality, etc. The sensitivity analysis below have been determined based on reasonable possible changes of the respective assumptions occurring at the end of the reporting period, while holding all other assumptions constant.
- If the discount rate is 0.5 basis points higher (lower), the defined benefit obligation would decrease by Rs. 15.84 lakhs (increase by Rs. 16.89 lakhs) [March 31, 2018: 12.82 lakhs (increase by Rs. 13.87 lakhs)].- If the expected salary growth increases (decreases) by 0.5 basis points, the defined benefit obligation would increase by Rs. 9.96 lakhs (decrease by Rs. 9.14 lakhs) [March 31, 2018: increase by Rs. 8.40 lakhs (decrease by Rs. 7.70 lakhs)].Sensitivities due to change in mortality rate and change in withdrawal rate are not material and hence impact of such change is not calculated.
Sensitivity Analysis
The sensitivity analysis presented above may not be representative of the actual change in the defined benefit obligation as it is unlikely that the change in assumptions would occur in isolation of one another as some of the assumptions may be correlated.Furthermore, in presenting the above sensitivity analysis, the present value of the defined benefit obligation has been calculated using the projected unit cred-it method at the end of reporting period, which is same as that applied in calculating the defined benefit obligation liability recognised in the balance sheet.There was no change in the methods and assumptions used in preparing the sensitivity analysis from prior years.
Other disclosures
Maturity profile of defined benefit obligation
Particulars As at March 31, 2019
As at March 31, 2018
As at April 1,2017
Average duration of the defined benefit obligation (in years)
Less than 1 year 2.01 16.02 1.98
Between 1-2 years 2.36 3.22 2.62
Between 2-5 years 44.01 35.65 5.15
Over 5 years 122.14 99.46 99.22
Total 170.52 154.35 108.97
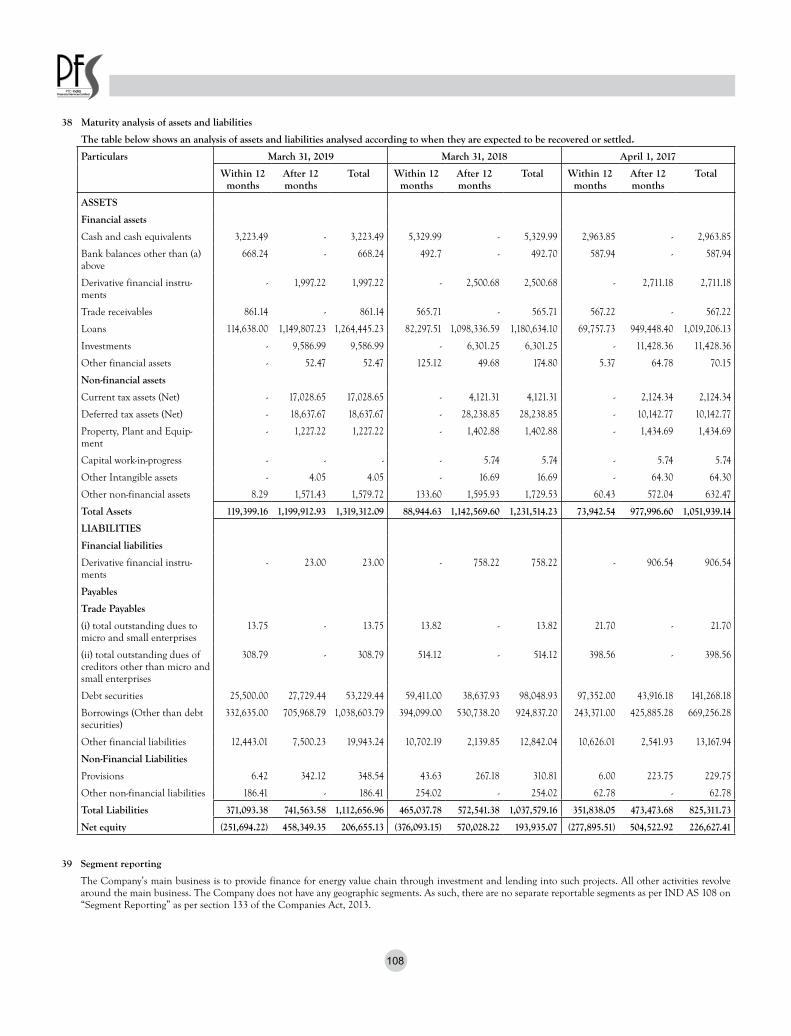
108
38 Maturity analysis of assets and liabilities
The table below shows an analysis of assets and liabilities analysed according to when they are expected to be recovered or settled.
Particulars March 31, 2019 March 31, 2018 April 1, 2017
Within 12 months
After 12 months
Total Within 12 months
After 12 months
Total Within 12 months
After 12 months
Total
ASSETS
Financial assets
Cash and cash equivalents 3,223.49 - 3,223.49 5,329.99 - 5,329.99 2,963.85 - 2,963.85
Bank balances other than (a) above
668.24 - 668.24 492.7 - 492.70 587.94 - 587.94
Derivative financial instru-ments
- 1,997.22 1,997.22 - 2,500.68 2,500.68 - 2,711.18 2,711.18
Trade receivables 861.14 - 861.14 565.71 - 565.71 567.22 - 567.22
Loans 114,638.00 1,149,807.23 1,264,445.23 82,297.51 1,098,336.59 1,180,634.10 69,757.73 949,448.40 1,019,206.13
Investments - 9,586.99 9,586.99 - 6,301.25 6,301.25 - 11,428.36 11,428.36
Other financial assets - 52.47 52.47 125.12 49.68 174.80 5.37 64.78 70.15
Non-financial assets
Current tax assets (Net) - 17,028.65 17,028.65 - 4,121.31 4,121.31 - 2,124.34 2,124.34
Deferred tax assets (Net) - 18,637.67 18,637.67 - 28,238.85 28,238.85 - 10,142.77 10,142.77
Property, Plant and Equip-ment
- 1,227.22 1,227.22 - 1,402.88 1,402.88 - 1,434.69 1,434.69
Capital work-in-progress - - - - 5.74 5.74 - 5.74 5.74
Other Intangible assets - 4.05 4.05 - 16.69 16.69 - 64.30 64.30
Other non-financial assets 8.29 1,571.43 1,579.72 133.60 1,595.93 1,729.53 60.43 572.04 632.47
Total Assets 119,399.16 1,199,912.93 1,319,312.09 88,944.63 1,142,569.60 1,231,514.23 73,942.54 977,996.60 1,051,939.14
LIABILITIES
Financial liabilities
Derivative financial instru-ments
- 23.00 23.00 - 758.22 758.22 - 906.54 906.54
Payables
Trade Payables
(i) total outstanding dues to micro and small enterprises
13.75 - 13.75 13.82 - 13.82 21.70 - 21.70
(ii) total outstanding dues of creditors other than micro and small enterprises
308.79 - 308.79 514.12 - 514.12 398.56 - 398.56
Debt securities 25,500.00 27,729.44 53,229.44 59,411.00 38,637.93 98,048.93 97,352.00 43,916.18 141,268.18
Borrowings (Other than debt securities)
332,635.00 705,968.79 1,038,603.79 394,099.00 530,738.20 924,837.20 243,371.00 425,885.28 669,256.28
Other financial liabilities 12,443.01 7,500.23 19,943.24 10,702.19 2,139.85 12,842.04 10,626.01 2,541.93 13,167.94
Non-Financial Liabilities
Provisions 6.42 342.12 348.54 43.63 267.18 310.81 6.00 223.75 229.75
Other non-financial liabilities 186.41 - 186.41 254.02 - 254.02 62.78 - 62.78
Total Liabilities 371,093.38 741,563.58 1,112,656.96 465,037.78 572,541.38 1,037,579.16 351,838.05 473,473.68 825,311.73
Net equity (251,694.22) 458,349.35 206,655.13 (376,093.15) 570,028.22 193,935.07 (277,895.51) 504,522.92 226,627.41
39 Segment reporting
The Company’s main business is to provide finance for energy value chain through investment and lending into such projects. All other activities revolve around the main business. The Company does not have any geographic segments. As such, there are no separate reportable segments as per IND AS 108 on “Segment Reporting” as per section 133 of the Companies Act, 2013.

109
40 Related party disclosures under Ind AS 24
Related party disclosuresName of related parties and their relationship:
Name of related party Nature of Relationship
PTC India Limited Holding company
PTC Energy Limited Fellow subsidiary company
R.S. India Wind Energy Private Limited Associate company
Varam Bio Energy Private Limited Associate company
PTC Foundation Trust to Holding Company
Key management personnel:
Shri Deepak Amitabh Chairman and Non Executive Director
Dr. Ashok Haldia Managing Director and CEO (Ceased to be MD & CEO w.e.f. from September 18, 2018)
Dr. Pawan Singh Director Finance (upto September 28, 2018) ;Managing Director and CEO (w.e.f. October 3, 2018)
Shri Naveen Kumar Whole Time Director
Mrs. Pravin Tripathi Independent Director
Shri H L Bajaj Independent Director
Dr. Rajib K. Mishra Nominee Director
Shri Chinmoy Gangopadhyay Nominee Director
Shri Kamlesh S. Vikamsey Independent Director
Shri Santosh B. Nayar Independent Director
Shri Harun Rasid Khan Independent Director (Ceased to be Independent Director w.e.f. from January 30, 2019)
Mr. Sanjay Rustagi Chief Financial Officer (w.e.f. October 3, 2018)
Mr. Vishal Goyal Company Secretary
Transactions with the key management personnel during the year:
Particulars Nature of transaction Year endedMarch 31, 2019
Year endedMarch 31, 2018
Dr. Ashok Haldia Remuneration
Short-term benefits 55.83 93.56
Post-employment benefits* 15.77 4.38
Other long-term benefits* 27.31 1.44
98.91 99.38
Dr. Pawan Singh Remuneration
Short-term benefits 87.68 75.83
Post-employment benefits 3.87 1.95
Other long-term benefits 5.92 2.84
97.47 80.62
Shri Naveen Kumar Remuneration
Short-term benefits 68.01 30.64
Post-employment benefits 1.25 0.59
Other long-term benefits 2.16 1.01
71.42 32.23
Non-Executive Independent Director Sitting fees 76.00 78.00
Reimbursement of expenses 1.04 1.32
77.04 79.32
* Includes payment on retirement in the current year.

110
Transactions with the related parties
Particulars Year endedMarch 31, 2019
Year endedMarch 31, 2018
With Holding company
Expenses reimbursed 60.91 46.19
Expenses paid 29.36 0.47
Director sitting fees 16.80 30.00
Dividend paid 834.90 6,261.75
With fellow subsidiary company
Interest income 647.31 716.62
Expenses paid 6.29 -
Expenses reimbursed 33.58 -
Loan repayment - 523.04
With Trust to Holding Company
Amount paid for CSR spend 689.60 71.54
Loans to fellow subsidiary company
PTC Energy Limited
Particulars Year endedMarch 31, 2019
Year endedMarch 31, 2018
Beginning of the year 6,668.69 7,192.13
Loan repayments received (523.03) (523.04)
Interest charged 647.31 716.62
Interest received (647.31) (717.02)
End of the year 6,145.66 6,668.69
Balance outstanding at the year end
Name of related party Nature As at March 31, 2019
As at March 31, 2018
As at April 1,2017
PTC India Limited Payables - - -
PTC Energy Limited Payables 32.51 - -
PTC Energy Limited Receivables- loan given 6,145.66 6,668.69 7,192.13
41 Details of assets pledged/ hypothecated as security:
The carrying amounts of assets pledged/ hypothecated as security for current and non-current borrowings are:
Particulars As at March 31, 2019
As at March 31, 2018
As at April 1,2017
Non-current assets
Property, plant and equipment 7.57 7.96 8.37
Loans 1,337,464.89 1,286,840.48 1,066,369.53
Trade receivables 861.14 565.71 567.22
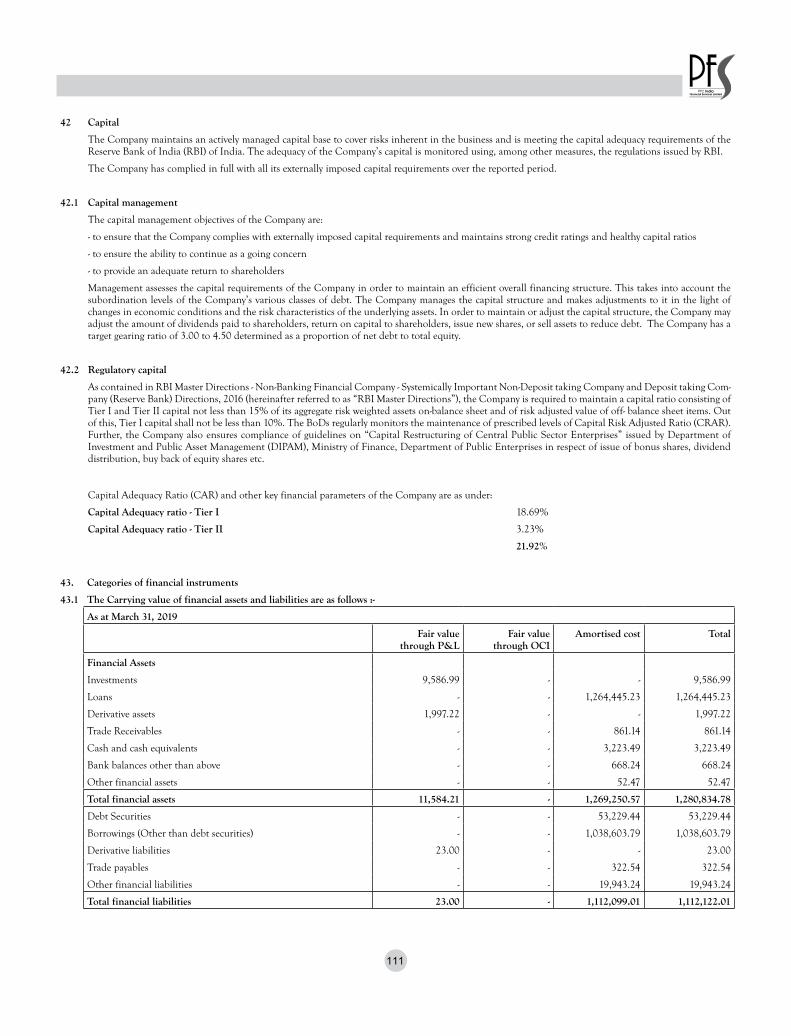
111
42 Capital
The Company maintains an actively managed capital base to cover risks inherent in the business and is meeting the capital adequacy requirements of the Reserve Bank of India (RBI) of India. The adequacy of the Company’s capital is monitored using, among other measures, the regulations issued by RBI.
The Company has complied in full with all its externally imposed capital requirements over the reported period.
42.1 Capital management
The capital management objectives of the Company are:
- to ensure that the Company complies with externally imposed capital requirements and maintains strong credit ratings and healthy capital ratios
- to ensure the ability to continue as a going concern
- to provide an adequate return to shareholders
Management assesses the capital requirements of the Company in order to maintain an efficient overall financing structure. This takes into account the subordination levels of the Company’s various classes of debt. The Company manages the capital structure and makes adjustments to it in the light of changes in economic conditions and the risk characteristics of the underlying assets. In order to maintain or adjust the capital structure, the Company may adjust the amount of dividends paid to shareholders, return on capital to shareholders, issue new shares, or sell assets to reduce debt. The Company has a target gearing ratio of 3.00 to 4.50 determined as a proportion of net debt to total equity.
42.2 Regulatory capital
As contained in RBI Master Directions - Non-Banking Financial Company - Systemically Important Non-Deposit taking Company and Deposit taking Com-pany (Reserve Bank) Directions, 2016 (hereinafter referred to as “RBI Master Directions”), the Company is required to maintain a capital ratio consisting of Tier I and Tier II capital not less than 15% of its aggregate risk weighted assets on-balance sheet and of risk adjusted value of off- balance sheet items. Out of this, Tier I capital shall not be less than 10%. The BoDs regularly monitors the maintenance of prescribed levels of Capital Risk Adjusted Ratio (CRAR). Further, the Company also ensures compliance of guidelines on “Capital Restructuring of Central Public Sector Enterprises” issued by Department of Investment and Public Asset Management (DIPAM), Ministry of Finance, Department of Public Enterprises in respect of issue of bonus shares, dividend distribution, buy back of equity shares etc.
Capital Adequacy Ratio (CAR) and other key financial parameters of the Company are as under:
Capital Adequacy ratio - Tier I 18.69%
Capital Adequacy ratio - Tier II 3.23%
21.92%
43. Categories of financial instruments
43.1 The Carrying value of financial assets and liabilities are as follows :-
As at March 31, 2019
Fair value through P&L
Fair value through OCI
Amortised cost Total
Financial Assets
Investments 9,586.99 - - 9,586.99
Loans - - 1,264,445.23 1,264,445.23
Derivative assets 1,997.22 - - 1,997.22
Trade Receivables - - 861.14 861.14
Cash and cash equivalents - - 3,223.49 3,223.49
Bank balances other than above - - 668.24 668.24
Other financial assets - - 52.47 52.47
Total financial assets 11,584.21 - 1,269,250.57 1,280,834.78
Debt Securities - - 53,229.44 53,229.44
Borrowings (Other than debt securities) - - 1,038,603.79 1,038,603.79
Derivative liabilities 23.00 - - 23.00
Trade payables - - 322.54 322.54
Other financial liabilities - - 19,943.24 19,943.24
Total financial liabilities 23.00 - 1,112,099.01 1,112,122.01

112
As at March 31, 2018
Fair value through P&L
Fair value through OCI
Amortised cost Total
Financial Assets
Investments 2,942.70 3,358.55 6,301.25
Loans - - 1,180,634.10 1,180,634.10
Derivative assets 2,500.68 - - 2,500.68
Trade Receivables - - 565.71 565.71
Cash and cash equivalents - - 5,329.99 5,329.99
Bank balances other than above - - 492.70 492.70
Other financial assets - - 174.80 174.80
Total financial assets 5,443.38 3,358.55 1,187,197.30 1,195,999.23
Debt Securities - - 98,048.93 98,048.93
Borrowings (Other than debt securities) - - 924,837.20 924,837.20
Derivative liabilities 758.22 - - 758.22
Trade payables - - 527.94 527.94
Other financial liabilities - - 12,842.04 12,842.04
Total financial liabilities 758.22 - 1,036,256.11 1,037,014.33
As at April 1, 2017
Fair value through P&L
Fair value through OCI
Amortised cost Total
Financial Assets
Investments in equity instruments - 11,428.36 - 11,428.36
Loans - - 1,019,206.13 1,019,206.13
Derivative assets 2,711.18 - - 2,711.18
Trade Receivables - - 567.22 567.22
Cash and bank balances - - 2,963.85 2,963.85
Bank balances other than above 587.94 587.94
Other financial assets - - 70.15 70.15
Total financial assets 2,711.18 11,428.36 1,023,395.29 1,037,534.83
Debt Securities - - 141,268.18 141,268.18
Borrowings (Other than debt securities) - - 669,256.28 669,256.28
Derivative liabilities 906.54 - - 906.54
Trade payables - - 420.26 420.26
Other financial liabilities - - 13,167.94 13,167.94
Total financial liabilities 906.54 - 824,112.66 825,019.20
44. Fair value measurement of financial assets and liabilities
Financial assets and financial liabilities measured at fair value in the Statement of Balance Sheet are grouped into three Levels of a fair value hierarchy. The three Levels are defined based on the observability of significant inputs to the measurement, as follows: • Level 1: quoted prices (unadjusted) in active markets for identical assets or liabilities • Level 2: inputs other than quoted prices included within Level 1 that are observable for the asset or liability, either directly or indirectly • Level 3: unobservable inputs for the asset or liability.
The following table shows the levels within the hierarchy of financial assets measured at fair value on a recurring basis at March 31, 2019:
Level 1 Level 2 Level 3 Total
Financial Assets carried at FVOCI - - - -
Security receipts - - 9,586.99 9,586.99
Derivative instruments (net) - 1,974.22 - 1,974.22

113
As at March 31, 2018
Level 1 Level 2 Level 3 Total
Financial Assets carried at FVOCI - - 3,358.55 3,358.55
Security receipts - - 2,942.70 2,942.70
Derivative instruments (net) - 1,742.46 - 1,742.46
As at March 31, 2017
Level 1 Level 2 Level 3 Total
Financial Assets carried at FVOCI - - 11,428.36 11,428.36
Derivative instruments (net) - 1,804.64 - 1,804.64
Fair value measurements using significant unobservable inputs (level 3)
The following table presents the changes in level 3 items for the periods ended March 31, 2019, March 31, 2018 and April 1, 2017:
Security receipts Unlisted equity securities
Total
As at April 1, 2017 - 11,428.36 11,428.36
Acquisitions 2,942.70 3,983.12 6,925.82
Gains/(losses) recognized in profit or loss - - -
Gains/(losses) recognized in other comprehensive income - (12,052.93) (12,052.93)
Disposal/acquisition - - -
As at March 31, 2018 2,942.70 3,358.55 6,301.25
Acquisitions 7259.68 7,259.68
Gains/(losses) recognized in profit or loss (589.52) - (589.52)
Gains/(losses) recognized in other comprehensive income - (3,203.87) (3,203.87)
Disposal/acquisition (25.87) (154.68) (180.55)
As at March 31, 2019 9,586.99 - 9,586.99
There are no financial liabilities measured at fair value on recurring basis. There were no transfers between the 3 levels in the reporting periods.
Fair value of the Company’s financial assets and financial liabilities that are not measured at fair value (but fair value disclosures are required)
Except as detailed out in the following table, the management considers that the carrying amounts of financial assets and financial liabilities recognised in the consolidated financial statements approximate their fair values.
Particulars As at March 31, 2019 As at March 31, 2018 As at April 1, 2017
Carrying amount Fair value Carrying amount Fair value Carrying amount Fair value
Financial Liabilities
Infrastructure Bonds 14,085.66 14087.75 14,960.52 15,381.30 16,914.18 21,023.09
Debentures 39,143.78 39268.41 43,560.92 43,446.11 44,977.69 42,372.35
Fair value hierarchy As at March 31, 2019
Level 1 Level 2 Level 3 Total
Financial Liabilities at amortised cost
Infrastructure Bonds - - 14,087.75 14,087.75
Debentures - - 39,268.41 39,268.41
Fair value hierarchy As at March 31, 2018
Level 1 Level 2 Level 3 Total
Financial Liabilities at amortised cost
Infrastructure Bonds - - 15,381.30 15,381.30
Debentures - - 43,446.11 43,446.11

114
Fair value hierarchy As at March 31, 2017
Level 1 Level 2 Level 3 Total
Financial Liabilities at amortised cost
Infrastructure Bonds - - 21,023.09 21,023.09
Debentures - - 42,372.35 42,372.35
The fair value of the financial assets and liabilities are included at the amount that would be received to sell an asset and paid to transfer a liability in an orderly transaction between market participants. The following methods and assumptions were used to estimate the fair values:-
-Valuation technique used to determine fair value
Specific valuation techniques used to value financial instruments, as described below:
a) Discounted cash flow method is used to fair value investments in unquoted equity instruments
b) Certain investments are valued with reference to sale price observable in the market.
c) The Company’s foreign currency and interest rate derivative contracts are not traded in active markets. Fair valuation of such instruments are provided by the dealer who are recognised banks and use widely acceptable techniques. The effects of non-observable inputs are not significant for foreign cur-rency forward contracts.
The Company performs valuations in consultation with third party valuation specialists for complex valuations. Valuation techniques are selected based on the characteristics of each instrument, with the overall objective of maximising the use of market-based information.
-Trade receivables, cash and cash equivalents, other bank balances, loans, other current financial assets, current borrowings, trade payables and other current financial liabilities: Approximate their carrying amounts largely due to the short-term maturities of these instruments.
-Management uses its best judgment in estimating the fair value of its financial instruments. However, there are inherent limitations in any estimation technique. Therefore, for substantially all financial instruments, the fair value estimates presented above are not necessarily indicative of all the amounts that the Company could have realized or paid in sale transactions as of respective dates. as such, the fair value of the financial instruments subsequent to the respective reporting dates may be different from the amounts reported at each year end.
45 Financial risk management
i) Risk Management
The Company’s activities expose it to market risk, liquidity risk and credit risk. This note explains the sources of risk which the entity is exposed to and how the entity manages the risk and the related impact in the financial statements.
Risk Exposure arising from Measurement Management
Credit risk Loan receivables, Cash and bank balances, trade receivables, derivative financial instruments, financial assets measured at amortised cost
Expected loss analysis Credit risk analysis, diversification of customers/asset base, credit limits and collateral.
Liquidity risk Borrowings and other liabilities Rolling cash flow forecasts
Availability of committed credit lines and borrowing facilities
Market risk - foreign exchange Recognised financial assets and liabilities not denominated in Indian rupee (INR)
Cash flow forecasting Derivative contracts/hedging
Market risk - interest rate Non-current borrowings at variable rates Sensitivity analysis Interest rate swaps
Market risk - security price Investments in equity securities Sensitivity analysis Portfolio diversification, exposure limits
The Board has the overall responsibility of risk management - there are two committees of the Board which take care of managing overall risk in the organiza-tion. In accordance with the RBI guidelines to enable NBFCs to adopt best practices and greater transparency in their operations, the Board of Directors of the Company has constituted a Risk Management Committee to review risk management in relation to various risks, namely, market risk, credit risk, and operational risk, and an Asset Liability Management Committee (ALCO).
A) Credit risk
Credit risk is the risk that a counterparty fails to discharge its obligation to the Company. The Company has established various internal risk management process to provide early identification of possible changes in the creditworthiness of counterparties, including regular collateral revisions. Counterparty lim-its are established by the use of a credit risk classification system, which assigns each counterparty a risk rating. Risk ratings are subject to regular revision. The credit quality review process aims to allow the Company to assess the potential loss as a result of the risks to which it is exposed and take corrective actions.
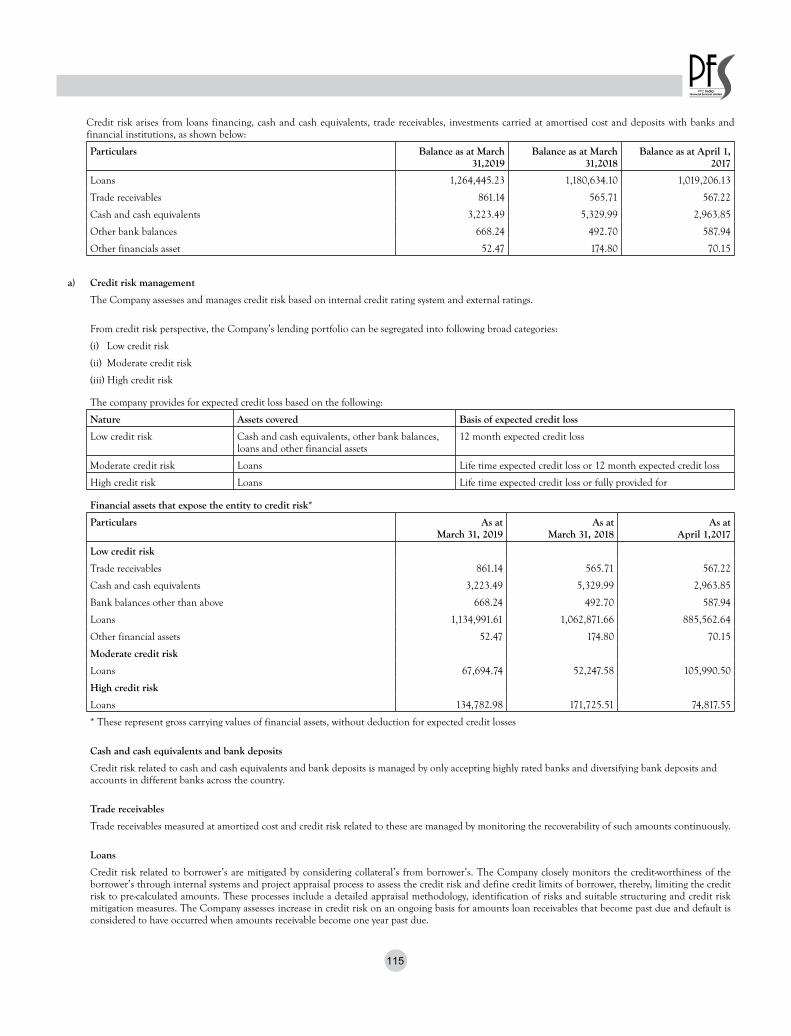
115
Credit risk arises from loans financing, cash and cash equivalents, trade receivables, investments carried at amortised cost and deposits with banks and financial institutions, as shown below:
Particulars Balance as at March 31,2019
Balance as at March 31,2018
Balance as at April 1, 2017
Loans 1,264,445.23 1,180,634.10 1,019,206.13
Trade receivables 861.14 565.71 567.22
Cash and cash equivalents 3,223.49 5,329.99 2,963.85
Other bank balances 668.24 492.70 587.94
Other financials asset 52.47 174.80 70.15
a) Credit risk management
The Company assesses and manages credit risk based on internal credit rating system and external ratings.
From credit risk perspective, the Company’s lending portfolio can be segregated into following broad categories:
(i) Low credit risk
(ii) Moderate credit risk
(iii) High credit risk
The company provides for expected credit loss based on the following:
Nature Assets covered Basis of expected credit loss
Low credit risk Cash and cash equivalents, other bank balances, loans and other financial assets
12 month expected credit loss
Moderate credit risk Loans Life time expected credit loss or 12 month expected credit loss
High credit risk Loans Life time expected credit loss or fully provided for
Financial assets that expose the entity to credit risk*
Particulars As at March 31, 2019
As at March 31, 2018
As at April 1,2017
Low credit risk
Trade receivables 861.14 565.71 567.22
Cash and cash equivalents 3,223.49 5,329.99 2,963.85
Bank balances other than above 668.24 492.70 587.94
Loans 1,134,991.61 1,062,871.66 885,562.64
Other financial assets 52.47 174.80 70.15
Moderate credit risk
Loans 67,694.74 52,247.58 105,990.50
High credit risk
Loans 134,782.98 171,725.51 74,817.55
* These represent gross carrying values of financial assets, without deduction for expected credit losses
Cash and cash equivalents and bank deposits
Credit risk related to cash and cash equivalents and bank deposits is managed by only accepting highly rated banks and diversifying bank deposits and accounts in different banks across the country.
Trade receivables
Trade receivables measured at amortized cost and credit risk related to these are managed by monitoring the recoverability of such amounts continuously.
Loans
Credit risk related to borrower’s are mitigated by considering collateral’s from borrower’s. The Company closely monitors the credit-worthiness of the borrower’s through internal systems and project appraisal process to assess the credit risk and define credit limits of borrower, thereby, limiting the credit risk to pre-calculated amounts. These processes include a detailed appraisal methodology, identification of risks and suitable structuring and credit risk mitigation measures. The Company assesses increase in credit risk on an ongoing basis for amounts loan receivables that become past due and default is considered to have occurred when amounts receivable become one year past due.

116
Other financial assets measured at amortized cost
Other financial assets measured at amortized cost includes security deposits and others. Credit risk related to these other financial assets is managed by monitoring the recoverability of such amounts continuously.
b) ii) Expected credit loss for loans
A.1 Credit risk measurement
The Company measures credit risk of its exposure using:
(a) Internal Rating: Internal ratings are based on board approved policy that guides credit analysis to place borrowers in watch list based on specific risk factors such as project progress schedule, promoter’s contribution, PPA status etc.
(b) External rating: PFS also captures external rating of their borrowers done by RBI approved rating agencies like ICRA, Care etc.
These two together helps the Company in better monitoring of its borrowers. The staging criteria for ECL computation is also driven by these two criteria. Staging of an account gets impacted by taking into consideration both internal rating and external rating.
A.2 Expected credit loss measurement
A.2.1 Significant increase in credit risk and credit impaired financial assets
The Company considers a financial instrument to have experienced a significant increase based on the staging crtieria, which is aligned with EWS frame-work.
As per EWS framework, loan accounts with rating OR1-OR6 may be classified as stage 1 and assets with rating OR7-OR10 may be classified as stage 2 accounts. However, if the loan account was rated OR7-OR10 during the sanction process then the loan account may be classified as stage 1 account as the risk prescription/credit quality has not changed since initial risk assessment.
A.2.2 Definition of default
The Company defines a financial instrument as in default, any borrower whose contractual payments are due for more than 90 days is termed as default, which is in line with RBI guidelines
A.2.3 Explanation of inputs, assumptions and estimation techniques
Probability of default (PD) computation model
Probability of Default is the likelihood that the borrower will not be able to meets its obligations as and when it falls due.
Transition Matrix Approach was used for estimation of PD. ICRA’s one-year transition matrix was used as the base probability of default matrix.
Stage 1: 12-month PDs were taken directly from one-year transition matrix and so, PIT conversion was not done, as it is already giving PIT PDs.
Stage 2: PD for second year onwards was estimated using Matrix Multiplication Approach. As a matter of following a best practice, it was decided to keep the PDs constant after 5th year.
Stage 3: As the accounts classified into stage 3 are non-performing assets so probability of default was assumed to be 100%.
Loss given default (LGD) computation model
Loss Given Default is the percentage of total exposure which the borrower would not be able to recover in case of default.
Workout LGD approach has been used for LGD estimation.
LGD= (Economic loss + Cost of Recovery)/EAD
Basis of calculating loss rates
First step involved in ECL computation is staging of the assets into three categories. Staging of the financial assets depend on the deterioration of the credit quality of the assets over its lifetime. Performing assets fall under Stage I, Underperforming assets fall under Stage II and Impaired assets(non-performing) fall under Stage III.
The following points were considered for stage wise classification of credit exposures:
1. Stage III exposures were exposures where actual default events have occurred i.e. all credit exposures classified as Doubtful or Sub-Standard, or where significant deterioration in credit quality was envisaged.
2. Stage II exposure were exposures which were not considered impaired asset but were classified as ‘Stressed Accounts’ or were flagged as High-Risk Category.
3. All other accounts not meeting the first two criteria were classified as Stage 1 accounts.
Quantitative and qualitative factors considered along with quantification i.r.t loss rates
Impact of specific risk factors was taken into account while staging of accounts and computation of PD. External credit rating was also used for staging criteria. The industry of the borrower was also considered for classification of the borrower. If a borrower belonged to an industry under stress, then the borrower was classified as stage 2 or 3 account.
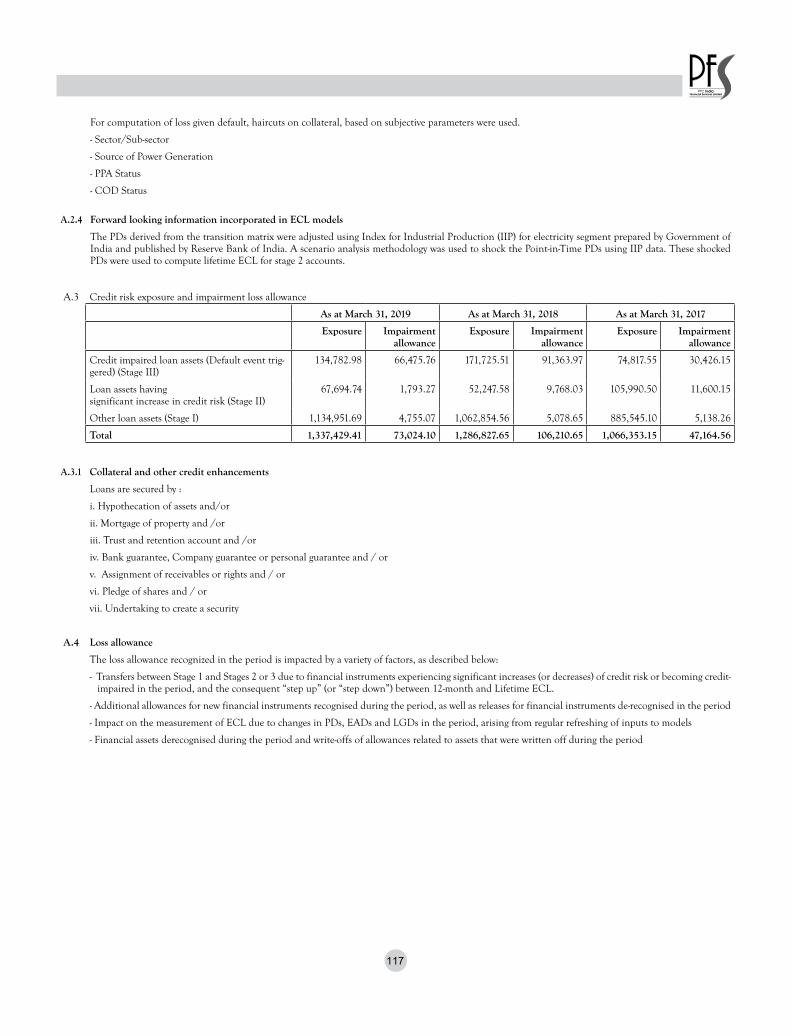
117
For computation of loss given default, haircuts on collateral, based on subjective parameters were used.
- Sector/Sub-sector
- Source of Power Generation
- PPA Status
- COD Status
A.2.4 Forward looking information incorporated in ECL models
The PDs derived from the transition matrix were adjusted using Index for Industrial Production (IIP) for electricity segment prepared by Government of India and published by Reserve Bank of India. A scenario analysis methodology was used to shock the Point-in-Time PDs using IIP data. These shocked PDs were used to compute lifetime ECL for stage 2 accounts.
A.3 Credit risk exposure and impairment loss allowance
As at March 31, 2019 As at March 31, 2018 As at March 31, 2017
Exposure Impairment allowance
Exposure Impairment allowance
Exposure Impairment allowance
Credit impaired loan assets (Default event trig-gered) (Stage III)
134,782.98 66,475.76 171,725.51 91,363.97 74,817.55 30,426.15
Loan assets having significant increase in credit risk (Stage II)
67,694.74 1,793.27 52,247.58 9,768.03 105,990.50 11,600.15
Other loan assets (Stage I) 1,134,951.69 4,755.07 1,062,854.56 5,078.65 885,545.10 5,138.26
Total 1,337,429.41 73,024.10 1,286,827.65 106,210.65 1,066,353.15 47,164.56
A.3.1 Collateral and other credit enhancements
Loans are secured by :
i. Hypothecation of assets and/or
ii. Mortgage of property and /or
iii. Trust and retention account and /or
iv. Bank guarantee, Company guarantee or personal guarantee and / or
v. Assignment of receivables or rights and / or
vi. Pledge of shares and / or
vii. Undertaking to create a security
A.4 Loss allowance
The loss allowance recognized in the period is impacted by a variety of factors, as described below:
- Transfers between Stage 1 and Stages 2 or 3 due to financial instruments experiencing significant increases (or decreases) of credit risk or becoming credit-impaired in the period, and the consequent “step up” (or “step down”) between 12-month and Lifetime ECL.
- Additional allowances for new financial instruments recognised during the period, as well as releases for financial instruments de-recognised in the period
- Impact on the measurement of ECL due to changes in PDs, EADs and LGDs in the period, arising from regular refreshing of inputs to models
- Financial assets derecognised during the period and write-offs of allowances related to assets that were written off during the period
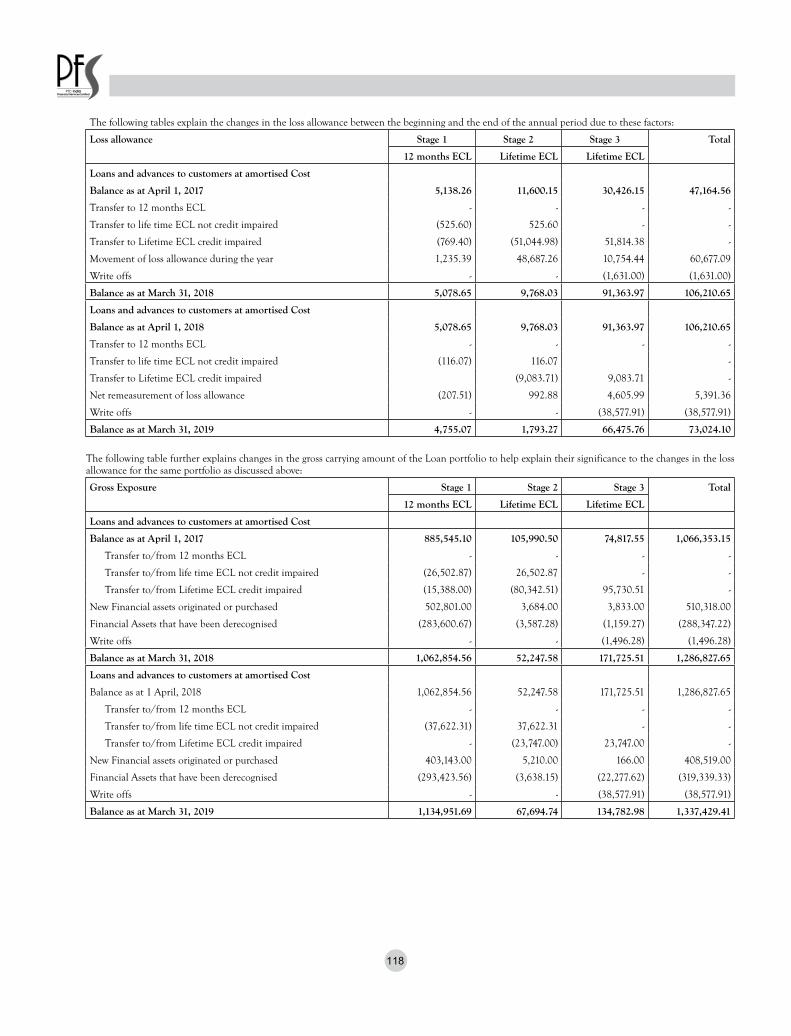
118
The following tables explain the changes in the loss allowance between the beginning and the end of the annual period due to these factors:
Loss allowance Stage 1 Stage 2 Stage 3 Total
12 months ECL Lifetime ECL Lifetime ECL
Loans and advances to customers at amortised Cost
Balance as at April 1, 2017 5,138.26 11,600.15 30,426.15 47,164.56
Transfer to 12 months ECL - - - -
Transfer to life time ECL not credit impaired (525.60) 525.60 - -
Transfer to Lifetime ECL credit impaired (769.40) (51,044.98) 51,814.38 -
Movement of loss allowance during the year 1,235.39 48,687.26 10,754.44 60,677.09
Write offs - - (1,631.00) (1,631.00)
Balance as at March 31, 2018 5,078.65 9,768.03 91,363.97 106,210.65
Loans and advances to customers at amortised Cost
Balance as at April 1, 2018 5,078.65 9,768.03 91,363.97 106,210.65
Transfer to 12 months ECL - - - -
Transfer to life time ECL not credit impaired (116.07) 116.07 -
Transfer to Lifetime ECL credit impaired (9,083.71) 9,083.71 -
Net remeasurement of loss allowance (207.51) 992.88 4,605.99 5,391.36
Write offs - - (38,577.91) (38,577.91)
Balance as at March 31, 2019 4,755.07 1,793.27 66,475.76 73,024.10
The following table further explains changes in the gross carrying amount of the Loan portfolio to help explain their significance to the changes in the loss allowance for the same portfolio as discussed above:
Gross Exposure Stage 1 Stage 2 Stage 3 Total
12 months ECL Lifetime ECL Lifetime ECL
Loans and advances to customers at amortised Cost
Balance as at April 1, 2017 885,545.10 105,990.50 74,817.55 1,066,353.15
Transfer to/from 12 months ECL - - - -
Transfer to/from life time ECL not credit impaired (26,502.87) 26,502.87 - -
Transfer to/from Lifetime ECL credit impaired (15,388.00) (80,342.51) 95,730.51 -
New Financial assets originated or purchased 502,801.00 3,684.00 3,833.00 510,318.00
Financial Assets that have been derecognised (283,600.67) (3,587.28) (1,159.27) (288,347.22)
Write offs - - (1,496.28) (1,496.28)
Balance as at March 31, 2018 1,062,854.56 52,247.58 171,725.51 1,286,827.65
Loans and advances to customers at amortised Cost
Balance as at 1 April, 2018 1,062,854.56 52,247.58 171,725.51 1,286,827.65
Transfer to/from 12 months ECL - - - -
Transfer to/from life time ECL not credit impaired (37,622.31) 37,622.31 - -
Transfer to/from Lifetime ECL credit impaired - (23,747.00) 23,747.00 -
New Financial assets originated or purchased 403,143.00 5,210.00 166.00 408,519.00
Financial Assets that have been derecognised (293,423.56) (3,638.15) (22,277.62) (319,339.33)
Write offs - - (38,577.91) (38,577.91)
Balance as at March 31, 2019 1,134,951.69 67,694.74 134,782.98 1,337,429.41

119
A.5 Concentration of credit risk
The Company monitors concentration of credit risk by type of industry in which the borrower operates, further bifurcated into type of borrower, whether state or private.
Industry As atMarch 31, 2019
As atMarch 31, 2018
As atApril 1, 2017
Gross carrying amount of loans
Concentration by industry
Thermal 187,493.47 222,574.81 243,729.05
Renewable energy 780,200.58 747,624.40 559,262.14
Hydro 23,215.81 29,569.71 29,049.85
Others 346,519.55 287,058.73 234,312.11
1,337,429.41 1,286,827.65 1,066,353.15
A.6 Write off policy
Financial assets are written off either partially or in their entirety to the extent that there is no realistic prospect of recovery. Any subsequent recoveries are credited to impairment on financial instrument on statement of profit and loss.
ii) Expected credit losses for financial assets other than loans and derivative financial instruments
Company provides for expected credit losses on financial assets other than loans by assessing individual financial instruments for expectation of any credit losses:
- For cash and cash equivalents and other bank balances - Since the Company deals with only high-rated banks and financial institutions, credit risk in respect of cash and cash equivalents, other bank balances and bank deposits is evaluated as very low.
- For loans comprising security deposits paid - Credit risk is considered low because the Company is in possession of the underlying asset.
- For other financial assets - Credit risk is evaluated based on Company’s knowledge of the credit worthiness of those parties and loss allowance is measured for 12 month expected credit losses upon initial recognition and provide for lifetime expected credit losses upon significant increase in credit risk. The Company does not have any expected loss based impairment recognised on such assets considering their low credit risk nature, though the reconciliation of expected credit loss for all sub categories of financial assets (other than loans) are disclosed below:
As at March 31, 2019 Estimated gross carrying amount at
default
Expected probability of default
Expected credit losses
Carrying amount net of impairment provision
Cash and cash equivalents 3,223.49 0% - 3,223.49
Other bank balance 668.24 0% - 668.24
Investments - 0% - -
Trade receivables 938.82 8% 77.68 861.14
Other financial assets 52.47 0% - 52.47
As at March 31, 2018 Estimated gross carrying amount at
default
Expected probability of default
Expected credit losses
Carrying amount net of impairment provision
Cash and cash equivalents 5,329.99 0% - 5,329.99
Other bank balance 492.70 0% - 492.70
Investments - 0% - -
Trade receivables 565.71 0% - 565.71
Other financial assets 174.80 0% - 174.80
As at April 1, 2017 Estimated gross carrying amount at
default
Expected probability of default
Expected credit losses
Carrying amount net of impairment provision
Cash and cash equivalents 2,963.85 0% - 2,963.85
Other bank balance 587.94 0% - 587.94
Investments - 0% - -
Trade receivables 567.22 0% - 567.22
Other financial assets 70.15 0% - 70.15

120
B) Liquidity risk
Prudent liquidity risk management implies maintaining sufficient cash and marketable securities and the availability of funding through an adequate amount of committed credit facilities to meet obligations when due. Management of the Company monitors forecast of liquidity position and cash and cash equivalents on the basis of expected cash flows. The Asset Liability Management Policy aims to align market risk management with overall strategic objectives, articulate current interest rate view and determine pricing, mix and maturity profile of assets and liabilities. The asset liability management policy involves preparation and analysis of liquidity gap reports and ensuring preventive and corrective measures. It also addresses the interest rate risk by providing for duration gap analysis and control by providing limits to the gaps.
The tables below analyse the financial assets and liabilities of the Company into relevant maturity groupings based on their contractual maturities for all non-derivative financial liabilities.
The amounts disclosed in the table are the contractual undiscounted cash flows. Balances due within 12 months equal their carrying balances as the impact of discounting is not significant
Maturities of financial assets
March 31, 2019 Less than 1 year 1-3 year 3-5 year More than 5 years Total
Trade receivables 861.14 - - - 861.14
Fixed Deposit with banks 674.49 - - - 674.49
Derivative assets - 1,997.22 - - 1,997.22
Loans 227,112.00 358,370.00 348,822.00 1,239,300.69 2,173,604.69
Other financial assets - - 52.47 - 52.47
Total 228,647.63 360,367.22 348,874.47 1,239,300.69 2,177,190.01
March 31, 2018 Less than 1 year 1-3 year 3-5 year More than 5 years Total
Trade receivables 565.71 - - - 565.71
Fixed Deposit with banks 698.31 - - - 698.31
Derivative assets - 2,500.68 - - 2,500.68
Loans 203,097.64 377,472.00 416,610.00 1,354,469.00 2,351,648.64
Other financial assets 125.12 - 49.68 - 174.80
Total 204,486.78 379,972.68 416,659.68 1,354,469.00 2,355,588.14
April 1, 2017 Less than 1 year 1-3 year 3-5 year More than 5 years Total
Trade receivables 567.22 - - - 567.22
Fixed Deposit with banks 643.32 - - - 643.32
Derivative assets - 2,711.18 - - 2,711.18
Loans 184,438.08 333,488.00 317,190.00 1,123,557.00 1,958,673.08
Other financial assets 70.15 - - - 70.15
Total 185,718.77 336,199.18 317,190.00 1,123,557.00 1,962,664.95
Maturities of financial liabilities
March 31, 2019 Less than 1 year 1-3 year 3-5 year More than 5 years Total
Borrowings 422,011.00 359,704.00 293,254.00 350,626.00 1,425,595.00
Derivative liabilities - - 23.00 - 23.00
Trade payables 322.54 - - - 322.54
Other financial liabilities 12,443.01 3,152.23 - 4,348.00 19,943.24
Total 434,776.55 362,856.23 293,277.00 354,974.00 1,445,883.78
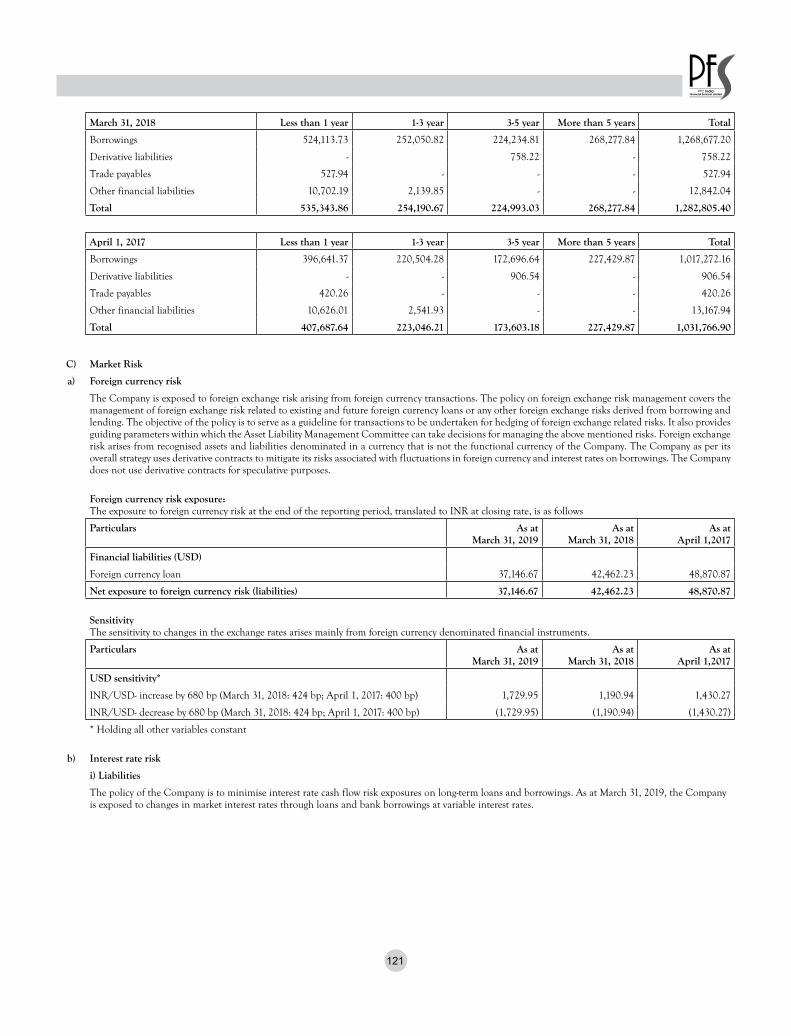
121
March 31, 2018 Less than 1 year 1-3 year 3-5 year More than 5 years Total
Borrowings 524,113.73 252,050.82 224,234.81 268,277.84 1,268,677.20
Derivative liabilities - 758.22 - 758.22
Trade payables 527.94 - - - 527.94
Other financial liabilities 10,702.19 2,139.85 - - 12,842.04
Total 535,343.86 254,190.67 224,993.03 268,277.84 1,282,805.40
April 1, 2017 Less than 1 year 1-3 year 3-5 year More than 5 years Total
Borrowings 396,641.37 220,504.28 172,696.64 227,429.87 1,017,272.16
Derivative liabilities - - 906.54 - 906.54
Trade payables 420.26 - - - 420.26
Other financial liabilities 10,626.01 2,541.93 - - 13,167.94
Total 407,687.64 223,046.21 173,603.18 227,429.87 1,031,766.90
C) Market Risk
a) Foreign currency risk
The Company is exposed to foreign exchange risk arising from foreign currency transactions. The policy on foreign exchange risk management covers the management of foreign exchange risk related to existing and future foreign currency loans or any other foreign exchange risks derived from borrowing and lending. The objective of the policy is to serve as a guideline for transactions to be undertaken for hedging of foreign exchange related risks. It also provides guiding parameters within which the Asset Liability Management Committee can take decisions for managing the above mentioned risks. Foreign exchange risk arises from recognised assets and liabilities denominated in a currency that is not the functional currency of the Company. The Company as per its overall strategy uses derivative contracts to mitigate its risks associated with fluctuations in foreign currency and interest rates on borrowings. The Company does not use derivative contracts for speculative purposes.
Foreign currency risk exposure:The exposure to foreign currency risk at the end of the reporting period, translated to INR at closing rate, is as follows
Particulars As at March 31, 2019
As at March 31, 2018
As at April 1,2017
Financial liabilities (USD)
Foreign currency loan 37,146.67 42,462.23 48,870.87
Net exposure to foreign currency risk (liabilities) 37,146.67 42,462.23 48,870.87
SensitivityThe sensitivity to changes in the exchange rates arises mainly from foreign currency denominated financial instruments.
Particulars As at March 31, 2019
As at March 31, 2018
As at April 1,2017
USD sensitivity*
INR/USD- increase by 680 bp (March 31, 2018: 424 bp; April 1, 2017: 400 bp) 1,729.95 1,190.94 1,430.27
INR/USD- decrease by 680 bp (March 31, 2018: 424 bp; April 1, 2017: 400 bp) (1,729.95) (1,190.94) (1,430.27)
* Holding all other variables constant
b) Interest rate risk
i) Liabilities
The policy of the Company is to minimise interest rate cash flow risk exposures on long-term loans and borrowings. As at March 31, 2019, the Company is exposed to changes in market interest rates through loans and bank borrowings at variable interest rates.

122
Interest rate risk exposure
Below is the overall exposure of the Company to interest rate risk:
Particulars As at March 31, 2019
As at March 31, 2018
As at April 1,2017
Variable rate borrowing 930,689.23 776,309.09 547,523.47
Fixed rate borrowing 161,144.00 246,577.04 263,000.98
Total borrowings 1,091,833.23 1,022,886.13 810,524.45
Sensitivity
Below is the sensitivity of profit or loss and equity changes in interest rates.
Particulars As at March 31, 2019
As at March 31, 2018
As at April 1,2017
Interest sensitivity*
Interest rates – increase by 100 basis points (March 31, 2018:100 bps; April 1, 2017:100 bps)
(9,306.89) (7,889.01) (5,615.47)
Interest rates – decrease by 100 basis points (March 31, 2018:100 bps; April 1, 2017:100 bps)
9,306.89 7,889.01 5,615.47
* Holding all other variables constant
ii) Assets
The Company’s fixed deposits are carried at amortised cost and are fixed rate deposits. They are therefore not subject to interest rate risk as defined in Ind AS 107, since neither the carrying amount nor the future cash flows will fluctuate because of a change in market interest rates.
Interest rate risk exposure
Below is the overall exposure of the loans:
Particulars As at 31 March, 2019
As at 31 March, 2018
As at 1 April, 2017
Variable rate loans 1,214,716.04 1,155,103.27 916,167.19
Fixed rate loans 122,713.37 131,724.38 150,185.96
Total loans 1,337,429.41 1,286,827.65 1,066,353.15
Sensitivity
Below is the sensitivity of profit or loss and equity changes in interest rates.
Particulars As at 31 March, 2019
As at 31 March, 2018
As at 1 April, 2017
Interest sensitivity*
Interest rates – increase by 100 basis points (March 31, 2018:100 bps; April 1, 2017:100 bps)
12,147.16 10,807.29 8,539.52
Interest rates – decrease by 100 basis points (March 31, 2018:100 bps; April 1, 2017:100 bps)
(12,147.16) (10,807.29) (8,539.52)
* Holding all other variables constant
c) Price risk
Exposure
The Company’s exposure to price risk arises from investments held and classified in the balance sheet at fair value through profit and loss. To manage the price risk arising from investments in equity securities, the Company diversifies its portfolio of assets.
Price sensitivity analysis
The sensitivity analysis below have been determined based on the exposure to equity price risk at the end of the reporting period.
If equity price have been 10% higher/ lower:
- Other comprehensive income for the year ended March 31, 2019 would increase / decrease by ₹Nil (for the year ended March 31, 2018: by ₹335.86 lakhs) as a result of the changes in fair value of equity investments measured at FVTOCI.

123
46 Earnings per share
Particulars Year ended March 31, 2019
Year ended March 31, 2018
a) Basic earnings per share (in ₹) 2.87 (1.56)
b) Diluted earnings per share (in ₹) 2.87 (1.56)
c) Reconciliations of earnings used in calculating earnings per share
Particulars Year ended March 31, 2019
Year ended March 31, 2018
Basic earnings per share
Profits attributable to the equity holders of the company used in calculating basic earnings per share 18,414.26 (10,023.45)
Diluted earnings per share
Profit attributable to the equity holders of the company:
Used in calculating basic earnings per share 18,414.26 (10,023.45)
Add interest saving on convertible bonds -
Profit attributable to the equity holders of the company used in calculating diluted earnings per share 18,414.26 (10,023.45)
d) Weighted average number of shares used as the denominator
Particulars Year ended March 31, 2019
Year ended March 31, 2018
Number of shares Number of shares
Weighted average number of equity shares used as the denominator in calculating basic earnings per share 642,283,335 642,283,335
Adjustments for calculation of diluted earnings per share: -
Weighted average number of equity shares and potential equity shares used as the denominator in calculating diluted earnings per share
642,283,335 642,283,335
47 Disclosure in respect of Leases
The Company has entered into operating lease arrangement for office premise. The lease is non-cancellable and is for a period of 5 years. The committed lease rentals in the future are:
Particulars As at 31 March, 2019
As at 31 March, 2018
As at 1 April, 2017
Future minimum lease payments
Not later than one year 536.55 450.68 -
Later than one year and not later than five years 1,615.01 1,879.91 -
Lease payments recognised in the Statement of Profit and Loss during the year 495.43 476.83 349.05
48 Expenditure on Corporate Social Responsibility
Particulars As at 31 March, 2019
As at 31 March, 2018
As at 1 April, 2017
(a) Gross amount required to be spent (including unspent amount of Rs. 2,247.11 lakhs till March 31, 2018)
3,198.11 2,328.26 1,448.80
(b) Amount spent:
(i) Construction/acquisition of any asset - - -
(ii) On purpose other than (i) above 916.41 81.15 -
49 The Company has made provision, as required under the applicable law or accounting standards, for material foreseeable losses, if any, on long-term con-tracts including derivative contracts.
50 There has been no delay in transferring amounts, required to be transferred, to the Investor Education and Protection Fund by the Company.

124
51 There were no disputed dues in respect of Excise Duty, Sales Tax, Service Tax, Customs Duty, Goods & Services Tax and Value Added Tax which have not been deposited. Details of dues of Income Tax which have not been deposited as on March 31, 2019 on account of disputes are given below:
Name of Statute Nature of Dues Forum where dispute is pending Period to which the amount relates
Amount in-volved*
Amount unpaid
Income-tax Act 1961 Income Tax Income Tax Appellate Authority 2011-2014 2,087.76 168.86
Upto Commissioner (Appeals) 2013-2014, 2015-2017 954.96 754.07
* Amount as per demand orders including interest and penalty wherever indicated in the order.
52 First time adoption of Ind AS
These financial statements, for the year ended 31 March 2019, are the first financial statements the Company has prepared in accordance with Ind AS. For periods up to and including the year ended 31 March 2018, the Company prepared its financial statements in accordance with accounting standards notified under section 133 of the Companies Act 2013, read together with paragraph 7 of the Companies (Accounts) Rules, 2014 (Indian GAAP or previ-ous GAAP).
Accordingly, the Company has prepared financial statements which comply with Ind AS applicable for periods ending on 31 March 2019, together with the comparative period data as at and for the year ended 31 March 2018, as described in the summary of significant accounting policies. In preparing these financial statements, the Company’s opening balance sheet was prepared as at 1 April 2017, the Company’s date of transition to Ind AS. This note explains the principal adjustments made by the Company in restating its Indian GAAP financial statements, including the balance sheet as at 1 April 2017 and the financial statements as at and for the year ended 31 March 2018.
A. Optional exemptions availed
Ind AS 101 allows first-time adopters certain exemptions from the retrospective application of certain requirements under Ind AS. The Company has applied the following exemptions:
(i) Deemed cost
Ind AS 101 permits a first-time adopter to elect to continue with the carrying value for all of its property, plant and equipment as recognised in the finan-cial statements as at the date of transition to Ind AS, measured as per the previous GAAP and use that as its deemed cost as at the date of transition. This exemption can also be used for intangible assets covered by Ind AS 38 Intangible Assets.Accordingly, the Company has elected to measure all of its property, plant and equipment and intangible assets at their previous GAAP carrying value.
(ii) Long-term foreign currency monetary items
Under previous GAAP, paragraph 46/46A of AS 11 “The Effects of Changes in Foreign Exchange Rates”, provided an alternative accounting treatment to com-panies with respect to exchange differences arising on restatement of long term foreign currency monetary items. Exchange difference on account of long term foreign currency liabilities could be accumulated in a foreign currency monetary item translation difference account, and amortised over the balance period of such long term liability. Ind AS 101 includes an optional exemption that allows a first-time adopter to continue the above accounting treatment in respect of the long-term foreign currency monetary items recognised in the financial statements for the period ending immediately before the beginning of the first Ind AS financial reporting period. The exemption under Ind AS 101 will not be available for long-term foreign currency monetary items recognised after transition date. Accordingly, the Company has elected to carry forward its policy to capitalise exchange differences on foreign currency monetary items that existed on transition date.
(iii) Designation of previously recognised financial instruments
Ind AS 101 allows an entity to designate investments in equity instruments at FVOCI on the basis of the facts and circumstances at the date of transition to Ind AS. The Company has elected to apply this exemption for its investment in equity investments.

125
B. Mandatory exceptions
(i) Estimates
An entity’s estimates in accordance with Ind ASs at the date of transition to Ind AS shall be consistent with estimates made for the same date in accordance with previous GAAP (after adjustments to reflect any difference in accounting policies), unless there is objective evidence that those estimates were in error.Ind AS estimates as at transition date are consistent with the estimates as at the same date made in conformity with previous GAAP.
(ii) Classification and measurement of financial assets
Ind AS 101 requires an entity to assess classification and measurement of financial assets on the basis of the facts and circumstances that exist at the date of transition to Ind AS.
C. Reconciliations between previous GAAP and Ind AS
Ind AS 101 requires an entity to reconcile equity, total comprehensive income and cash flows for prior periods. The following tables represent the recon-ciliations from previous GAAP to Ind AS.
52.1 Reconciliation of total equity as at March 31, 2018 and April 1, 2017
Note March 31, 2018 April 1, 2017
Total equity (shareholder’s funds) as per Previous GAAP 233,954.88 241,927.93
Adjustments:
Incremental provision on application of expected credit loss model (h) (54,991.84) (18,179.00)
Increase in borrowing cost pursuant to application of effective interest rate method (e) 588.07 835.84
Amortisation of processing fees on loans based on effective interest rate (b) (6,437.55) (5,574.89)
Incremental impact of fair valuation of derivatives (d) (393.97) (546.54)
Others (0.28) (0.50)
Tax effect on adjustments (i) 21,215.76 8,164.57
Total adjustments (40,019.81) (15,300.52)
Total equity as per Ind AS 193,935.07 226,627.41
52.2 Reconciliation of total comprehensive income for the year ended March 31, 2018
Note March 31, 2018
Profit after tax as per Previous GAAP 2,470.46
Adjustments:
Incremental provision on application of expected credit loss model (h) (36,812.84)
(Increase)/ Decrease in borrowing cost pursuant to application of effective interest rate method (e) (247.77)
Amortisation of processing fees on loans based on effective interest rate (b) (862.66)
Incremental impact of fair valuation of derivatives (d) 309.02
Investments measured at fair value through other comprehensive income (a) 12,052.93
Remeasurements of post-employment benefit obligations (g) 24.46
Others 0.22
Tax effect of above adjustments (i) 13,042.73
Total adjustments (12,493.91)
Profit after tax as per Ind AS (10,023.45)
Other comprehensive income (a), (g) (12,068.93)
Total comprehensive income as per Ind AS (22,092.38)
52.3 Reconciliation of cash flow statement for the year ended March 31, 2018
There were no significant reconciliation items between cash flows prepared under Indian GAAP and those prepared under Ind AS.
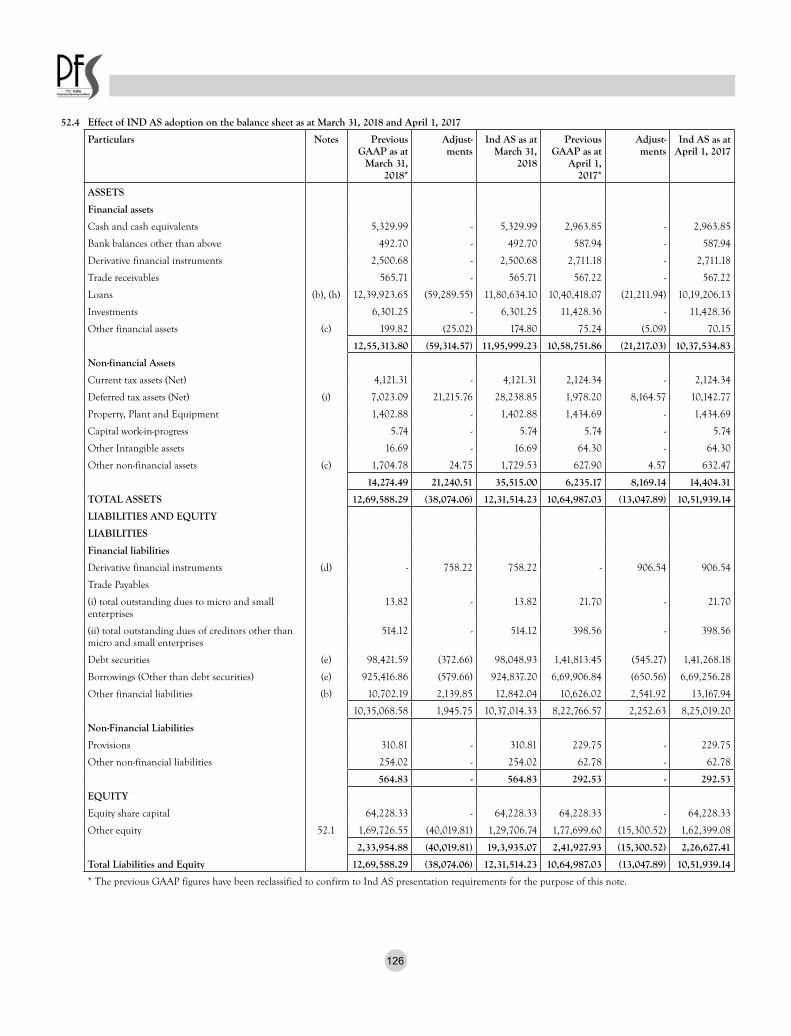
126
52.4 Effect of IND AS adoption on the balance sheet as at March 31, 2018 and April 1, 2017
Particulars Notes Previous GAAP as at
March 31, 2018*
Adjust-ments
Ind AS as at March 31,
2018
Previous GAAP as at
April 1, 2017*
Adjust-ments
Ind AS as at April 1, 2017
ASSETS
Financial assets
Cash and cash equivalents 5,329.99 - 5,329.99 2,963.85 - 2,963.85
Bank balances other than above 492.70 - 492.70 587.94 - 587.94
Derivative financial instruments 2,500.68 - 2,500.68 2,711.18 - 2,711.18
Trade receivables 565.71 - 565.71 567.22 - 567.22
Loans (b), (h) 12,39,923.65 (59,289.55) 11,80,634.10 10,40,418.07 (21,211.94) 10,19,206.13
Investments 6,301.25 - 6,301.25 11,428.36 - 11,428.36
Other financial assets (c) 199.82 (25.02) 174.80 75.24 (5.09) 70.15
12,55,313.80 (59,314.57) 11,95,999.23 10,58,751.86 (21,217.03) 10,37,534.83
Non-financial Assets
Current tax assets (Net) 4,121.31 - 4,121.31 2,124.34 - 2,124.34
Deferred tax assets (Net) (i) 7,023.09 21,215.76 28,238.85 1,978.20 8,164.57 10,142.77
Property, Plant and Equipment 1,402.88 - 1,402.88 1,434.69 - 1,434.69
Capital work-in-progress 5.74 - 5.74 5.74 - 5.74
Other Intangible assets 16.69 - 16.69 64.30 - 64.30
Other non-financial assets (c) 1,704.78 24.75 1,729.53 627.90 4.57 632.47
14,274.49 21,240.51 35,515.00 6,235.17 8,169.14 14,404.31
TOTAL ASSETS 12,69,588.29 (38,074.06) 12,31,514.23 10,64,987.03 (13,047.89) 10,51,939.14
LIABILITIES AND EQUITY
LIABILITIES
Financial liabilities
Derivative financial instruments (d) - 758.22 758.22 - 906.54 906.54
Trade Payables
(i) total outstanding dues to micro and small enterprises
13.82 - 13.82 21.70 - 21.70
(ii) total outstanding dues of creditors other than micro and small enterprises
514.12 - 514.12 398.56 - 398.56
Debt securities (e) 98,421.59 (372.66) 98,048.93 1,41,813.45 (545.27) 1,41,268.18
Borrowings (Other than debt securities) (e) 925,416.86 (579.66) 924,837.20 6,69,906.84 (650.56) 6,69,256.28
Other financial liabilities (b) 10,702.19 2,139.85 12,842.04 10,626.02 2,541.92 13,167.94
10,35,068.58 1,945.75 10,37,014.33 8,22,766.57 2,252.63 8,25,019.20
Non-Financial Liabilities
Provisions 310.81 - 310.81 229.75 - 229.75
Other non-financial liabilities 254.02 - 254.02 62.78 - 62.78
564.83 - 564.83 292.53 - 292.53
EQUITY
Equity share capital 64,228.33 - 64,228.33 64,228.33 - 64,228.33
Other equity 52.1 1,69,726.55 (40,019.81) 1,29,706.74 1,77,699.60 (15,300.52) 1,62,399.08
2,33,954.88 (40,019.81) 19,3,935.07 2,41,927.93 (15,300.52) 2,26,627.41
Total Liabilities and Equity 12,69,588.29 (38,074.06) 12,31,514.23 10,64,987.03 (13,047.89) 10,51,939.14
* The previous GAAP figures have been reclassified to confirm to Ind AS presentation requirements for the purpose of this note.
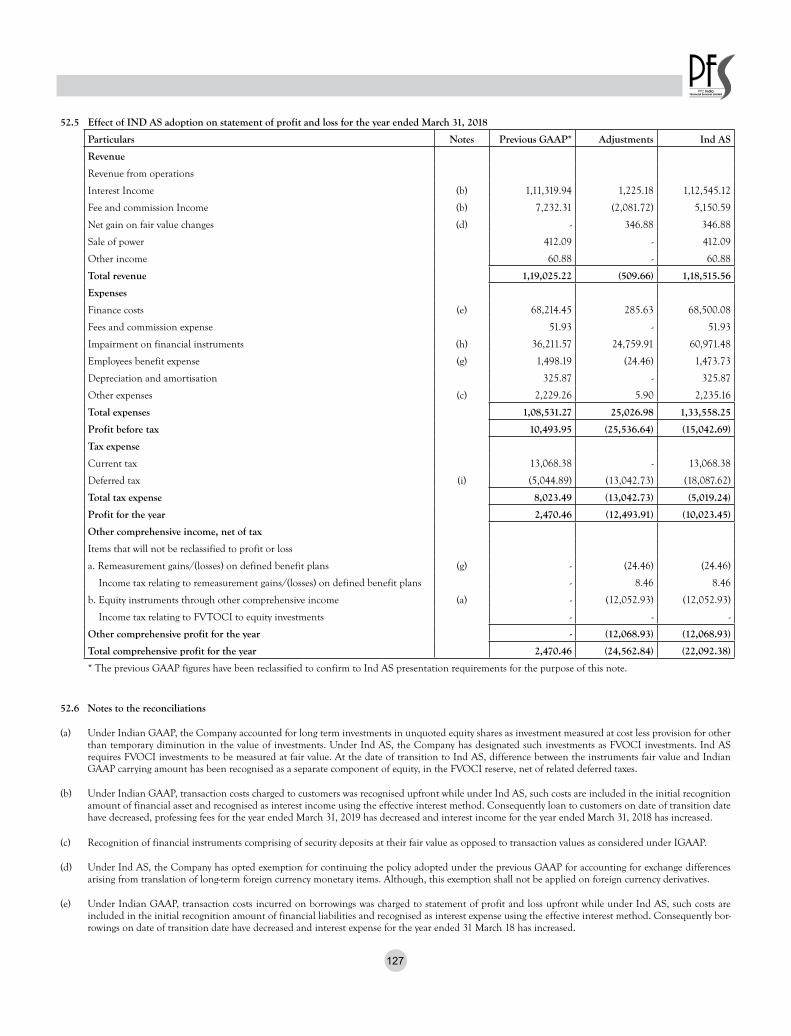
127
52.5 Effect of IND AS adoption on statement of profit and loss for the year ended March 31, 2018
Particulars Notes Previous GAAP* Adjustments Ind AS
Revenue
Revenue from operations
Interest Income (b) 1,11,319.94 1,225.18 1,12,545.12
Fee and commission Income (b) 7,232.31 (2,081.72) 5,150.59
Net gain on fair value changes (d) - 346.88 346.88
Sale of power 412.09 - 412.09
Other income 60.88 - 60.88
Total revenue 1,19,025.22 (509.66) 1,18,515.56
Expenses
Finance costs (e) 68,214.45 285.63 68,500.08
Fees and commission expense 51.93 - 51.93
Impairment on financial instruments (h) 36,211.57 24,759.91 60,971.48
Employees benefit expense (g) 1,498.19 (24.46) 1,473.73
Depreciation and amortisation 325.87 - 325.87
Other expenses (c) 2,229.26 5.90 2,235.16
Total expenses 1,08,531.27 25,026.98 1,33,558.25
Profit before tax 10,493.95 (25,536.64) (15,042.69)
Tax expense
Current tax 13,068.38 - 13,068.38
Deferred tax (i) (5,044.89) (13,042.73) (18,087.62)
Total tax expense 8,023.49 (13,042.73) (5,019.24)
Profit for the year 2,470.46 (12,493.91) (10,023.45)
Other comprehensive income, net of tax
Items that will not be reclassified to profit or loss
a. Remeasurement gains/(losses) on defined benefit plans (g) - (24.46) (24.46)
Income tax relating to remeasurement gains/(losses) on defined benefit plans - 8.46 8.46
b. Equity instruments through other comprehensive income (a) - (12,052.93) (12,052.93)
Income tax relating to FVTOCI to equity investments - - -
Other comprehensive profit for the year - (12,068.93) (12,068.93)
Total comprehensive profit for the year 2,470.46 (24,562.84) (22,092.38)
* The previous GAAP figures have been reclassified to confirm to Ind AS presentation requirements for the purpose of this note.
52.6 Notes to the reconciliations
(a) Under Indian GAAP, the Company accounted for long term investments in unquoted equity shares as investment measured at cost less provision for other than temporary diminution in the value of investments. Under Ind AS, the Company has designated such investments as FVOCI investments. Ind AS requires FVOCI investments to be measured at fair value. At the date of transition to Ind AS, difference between the instruments fair value and Indian GAAP carrying amount has been recognised as a separate component of equity, in the FVOCI reserve, net of related deferred taxes.
(b) Under Indian GAAP, transaction costs charged to customers was recognised upfront while under Ind AS, such costs are included in the initial recognition amount of financial asset and recognised as interest income using the effective interest method. Consequently loan to customers on date of transition date have decreased, professing fees for the year ended March 31, 2019 has decreased and interest income for the year ended March 31, 2018 has increased.
(c) Recognition of financial instruments comprising of security deposits at their fair value as opposed to transaction values as considered under IGAAP.
(d) Under Ind AS, the Company has opted exemption for continuing the policy adopted under the previous GAAP for accounting for exchange differences arising from translation of long-term foreign currency monetary items. Although, this exemption shall not be applied on foreign currency derivatives.
(e) Under Indian GAAP, transaction costs incurred on borrowings was charged to statement of profit and loss upfront while under Ind AS, such costs are included in the initial recognition amount of financial liabilities and recognised as interest expense using the effective interest method. Consequently bor-rowings on date of transition date have decreased and interest expense for the year ended 31 March 18 has increased.
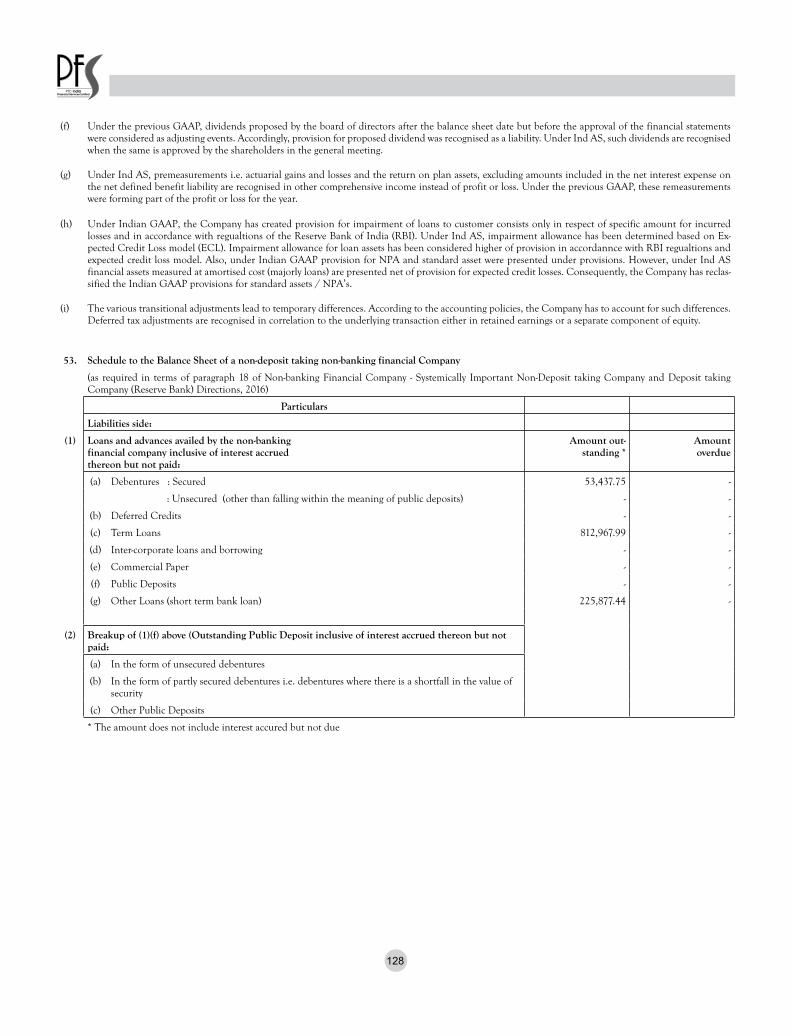
128
(f) Under the previous GAAP, dividends proposed by the board of directors after the balance sheet date but before the approval of the financial statements were considered as adjusting events. Accordingly, provision for proposed dividend was recognised as a liability. Under Ind AS, such dividends are recognised when the same is approved by the shareholders in the general meeting.
(g) Under Ind AS, premeasurements i.e. actuarial gains and losses and the return on plan assets, excluding amounts included in the net interest expense on the net defined benefit liability are recognised in other comprehensive income instead of profit or loss. Under the previous GAAP, these remeasurements were forming part of the profit or loss for the year.
(h) Under Indian GAAP, the Company has created provision for impairment of loans to customer consists only in respect of specific amount for incurred losses and in accordance with regualtions of the Reserve Bank of India (RBI). Under Ind AS, impairment allowance has been determined based on Ex-pected Credit Loss model (ECL). Impairment allowance for loan assets has been considered higher of provision in accordannce with RBI regualtions and expected credit loss model. Also, under Indian GAAP provision for NPA and standard asset were presented under provisions. However, under Ind AS financial assets measured at amortised cost (majorly loans) are presented net of provision for expected credit losses. Consequently, the Company has reclas-sified the Indian GAAP provisions for standard assets / NPA’s.
(i) The various transitional adjustments lead to temporary differences. According to the accounting policies, the Company has to account for such differences. Deferred tax adjustments are recognised in correlation to the underlying transaction either in retained earnings or a separate component of equity.
53. Schedule to the Balance Sheet of a non-deposit taking non-banking financial Company
(as required in terms of paragraph 18 of Non-banking Financial Company - Systemically Important Non-Deposit taking Company and Deposit taking Company (Reserve Bank) Directions, 2016)
Particulars
Liabilities side:
(1) Loans and advances availed by the non-banking financial company inclusive of interest accruedthereon but not paid:
Amount out- standing *
Amount overdue
(a) Debentures : Secured 53,437.75 -
: Unsecured (other than falling within the meaning of public deposits) - -
(b) Deferred Credits - -
(c) Term Loans 812,967.99 -
(d) Inter-corporate loans and borrowing - -
(e) Commercial Paper - -
(f) Public Deposits - -
(g) Other Loans (short term bank loan) 225,877.44 -
(2) Breakup of (1)(f) above (Outstanding Public Deposit inclusive of interest accrued thereon but not paid:
(a) In the form of unsecured debentures
(b) In the form of partly secured debentures i.e. debentures where there is a shortfall in the value of security
(c) Other Public Deposits
* The amount does not include interest accured but not due

129
Assets side: Amount out- standing
(3) Break-up of Loans and Advances including bills receivables [Other than those included in (4) below]:
(a) Secured ( net of provision of Rs. 39,654.74 lacs) 1,291,962.16
(b) Unsecured ( net of provision of Rs. 77.68 lacs) 2,534.38
(4) Break up of Leased Assets and stock on hire and other assets counting towards AFC activities
(i) Lease assets including lease rentals under sundry debtors:
(a) Financial lease -
(b) Operating lease -
(ii) Stock on hire including hire charges under sundry debtors:
(a) Assets on hire -
(b) Repossessed Assets -
(iii) Other loans counting towards AFC activities
(a) Loans where assets have been repossessed -
(b) Loans other than (a) above -
(5) Break-up of Investments:
Current Investments:
1. Quoted:
(i) Shares: (a) Equity -
(b) Preference -
(ii) Debentures and Bonds -
(iii) Units of mutual funds -
(iv) Government Securities -
(v) Others (please specify) -
2. Unquoted:
(i) Shares: (a) Equity -
(b) Preference -
(ii) Debentures and Bonds -
(iii) Units of mutual funds -
(iv) Government Securities -
(v) Others (please specify) -
Assets side: Amount out- standing
Long Term investments:
1. Quoted:
(i) Shares: (a) Equity -
(b) Preference -
(ii) Debentures and Bonds -
(iii) Units of mutual funds -
(iv) Government Securities -
(v) Others (please specify) -
2. Unquoted:
(i) Shares: (a) Equity (net of provisions) -
(b) Preference -
(ii) Debentures and Bonds (net of provisions) -
(iii) Units of mutual funds
(iv) Government Securities -
(v) Others (Security Receipts) (net of provisions) 9,586.99
Total 9,586.99

130
(6) Borrower group-wise classification of assets financed as in (3) and (4) above:
Category Amount net of provisions
Secured Unsecured Total
1. Related Parties
(a) Subsidiaries - - -
(b) Companies in the same group 6,145.66 - 6,145.66
(c) Other related parties - - -
2. Other than related parties 1,285,816.50 2,534.38 1,288,350.88
Total 1,291,962.16 2,534.38 1,294,496.54
(7) Investor group-wise classification of all investments (current and long term) in shares and securities (both quoted and unquoted)
Category Market Value / Break up or fair value or
NAV
Book value (net of provisions)
1. Related Parties
(a) Subsidiaries - -
(b) Companies in the same group - -
(c) Other related parties - -
2. Other than related parties - 9,586.99
Total - 9,586.99
(8) Other information
Particulars Amount
(i) Gross Non-Performing Assets
(a) Related parties 428.58
(b) Other than related parties 80,039.42
(ii) Net Non-Performing Assets
(a) Related parties -
(b) Other than related parties 40,321.65
(iii) Assets acquired in satisfaction of debt -
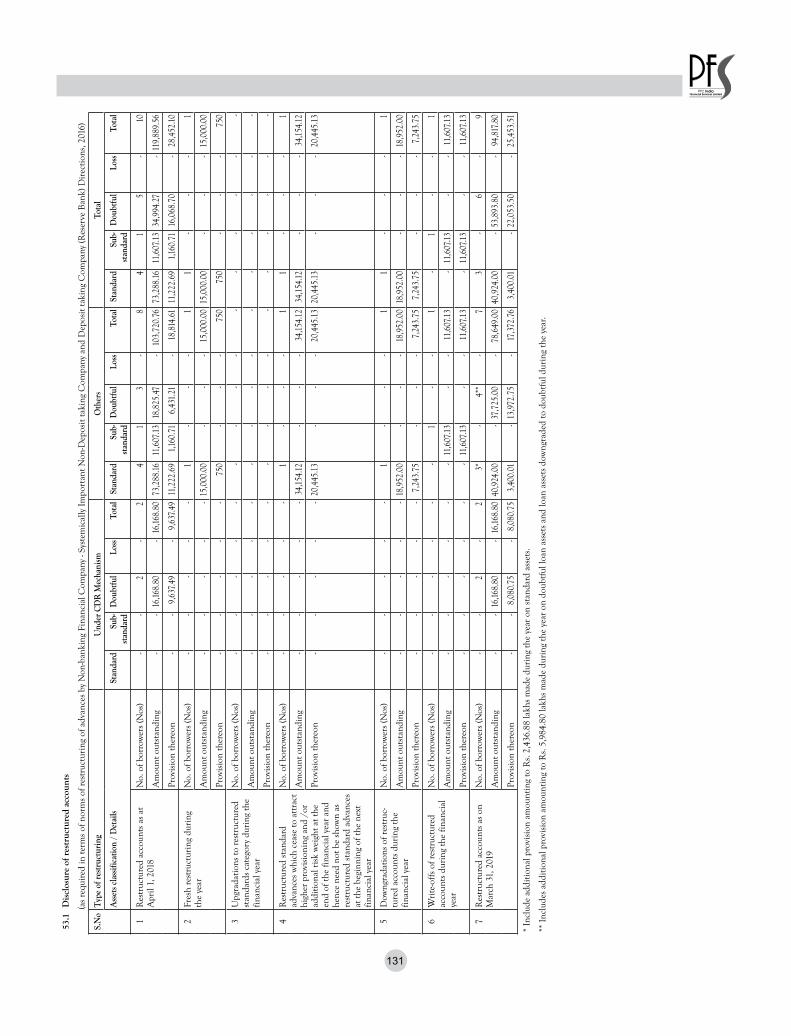
131
53.1
Dis
clos
ure
of r
estr
uctu
red
acco
unts
(as
requ
ired
in te
rms
of n
orm
s of
res
truc
turi
ng o
f adv
ance
s by
Non
-ban
king
Fin
anci
al C
ompa
ny -
Syst
emic
ally
Im
port
ant N
on-D
epos
it ta
king
Com
pany
and
Dep
osit
taki
ng C
ompa
ny (R
eser
ve B
ank)
Dir
ectio
ns, 2
016)
S.N
oTy
pe o
f res
truc
turi
ngU
nder
CD
R M
echa
nism
Oth
ers
Tota
l
Ass
ets c
lass
ifica
tion
/ D
etai
lsSt
anda
rdSu
b-st
anda
rdD
oubt
ful
Loss
Tota
lSt
anda
rdSu
b-st
anda
rdD
oubt
ful
Loss
Tota
lSt
anda
rdSu
b-st
anda
rdD
oubt
ful
Loss
Tota
l
1R
estr
uctu
red
acco
unts
as
at
Apr
il 1,
201
8N
o. o
f bor
row
ers
(Nos
)-
-2
-2
41
3-
84
15
-10
Am
ount
out
stan
ding
--
16,16
8.80
-16
,168.
8073
,288
.1611
,607
.13
18,8
25.4
7-
103,
720.
7673
,288
.1611
,607
.13
34,9
94.2
7-
119,
889.
56
Prov
isio
n th
ereo
n-
-9,
637.
49-
9,63
7.49
11,2
22.6
91,
160.
716,
431.
21-
18,8
14.6
111
,222
.69
1,16
0.71
16,0
68.7
0-
28,4
52.1
0
2Fr
esh
rest
ruct
urin
g du
ring
th
e ye
arN
o. o
f bor
row
ers
(Nos
)-
--
--
1-
--
11
--
-1
Am
ount
out
stan
ding
--
--
-15
,000
.00
--
-15
,000
.00
15,0
00.0
0-
--
15,0
00.0
0
Prov
isio
n th
ereo
n-
--
--
750
--
-75
075
0-
--
750
3U
pgra
datio
ns to
res
truc
ture
d st
anda
rds
cate
gory
dur
ing
the
finan
cial
yea
r
No.
of b
orro
wer
s (N
os)
--
--
--
--
--
--
--
-
Am
ount
out
stan
ding
--
--
--
--
--
--
--
-
Prov
isio
n th
ereo
n-
--
--
--
--
--
--
--
4R
estr
uctu
red
stan
dard
ad
vanc
es w
hich
cea
se to
att
ract
hi
gher
pro
visi
onin
g an
d /o
r ad
ditio
nal r
isk
wei
ght a
t the
en
d of
the
finan
cial
yea
r an
d he
nce
need
not
be
show
n as
re
stru
ctur
ed s
tand
ard
adva
nces
at
the
begi
nnin
g of
the
next
fin
anci
al y
ear
No.
of b
orro
wer
s (N
os)
--
--
-1
--
-1
1-
--
1
Am
ount
out
stan
ding
--
--
-34
,154
.12
--
-34
,154
.12
34,1
54.1
2-
--
34,1
54.1
2
Prov
isio
n th
ereo
n-
--
--
20,4
45.1
3-
--
20,4
45.1
320
,445
.13
--
-20
,445
.13
5D
owng
rada
tions
of r
estr
uc-
ture
d ac
coun
ts d
urin
g th
e fin
anci
al y
ear
No.
of b
orro
wer
s (N
os)
--
--
-1
--
-1
1-
--
1
Am
ount
out
stan
ding
--
--
-18
,952
.00
--
-18
,952
.00
18,9
52.0
0-
--
18,9
52.0
0
Prov
isio
n th
ereo
n-
--
--
7,24
3.75
--
-7,
243.
757,
243.
75-
--
7,24
3.75
6W
rite
-off
s of
res
truc
ture
d ac
coun
ts d
urin
g th
e fin
anci
al
year
No.
of b
orro
wer
s (N
os)
--
--
--
1-
-1
-1
--
1
Am
ount
out
stan
ding
--
--
--
11,6
07.1
3-
-11
,607
.13
-11
,607
.13
--
11,6
07.1
3
Prov
isio
n th
ereo
n-
--
--
-11
,607
.13
--
11,6
07.1
3-
11,6
07.1
3-
-11
,607
.13
7R
estr
uctu
red
acco
unts
as
on
Mar
ch 3
1, 2
019
No.
of b
orro
wer
s (N
os)
--
2-
23*
-4*
*-
73
-6
-9
Am
ount
out
stan
ding
--
16,16
8.80
-16
,168.
8040
,924
.00
-37
,725
.00
-78
,649
.00
40,9
24.0
0-
53,8
93.8
0-
94,8
17.8
0
Prov
isio
n th
ereo
n-
-8,
080.
75-
8,08
0.75
3,40
0.01
-13
,972
.75
-17
,372
.76
3,40
0.01
-22
,053
.50
-25
,453
.51
* In
clud
e ad
ditio
nal p
rovi
sion
am
ount
ing
to R
s. 2
,436
.88
lakh
s m
ade
duri
ng th
e ye
ar o
n st
anda
rd a
sset
s.
** I
nclu
des
addi
tiona
l pro
visi
on a
mou
ntin
g to
Rs.
5,9
84.8
0 la
khs
mad
e du
ring
the
year
on
doub
tful
loan
ass
ets
and
loan
ass
ets
dow
ngra
ded
to d
oubt
ful d
urin
g th
e ye
ar.

132
53.2 Disclosures required pursuant to Non-banking Financial Company - Systemically Important Non-Deposit taking Company and Deposit taking Com-pany (Reserve Bank) Directions, 2016
I. Capital
Particulars As at March 31, 2019
As at March 31, 2018
(i) CRAR (%) 21.92% 21.19%
(ii) CRAR - Tier I Capital (%) 18.69% 19.53%
(iii) CRAR - Tier II Capital (%) 3.23% 1.66%
(iv) Amount of subordinated debt raised as Tier-II capital
- -
(v) Amount raised by issue of Perpetual Debt Instruments
- -
II. Investments
Particulars As at March 31, 2019 As at March 31, 2018
1. Value of Investments
(i) Gross Value of Investments
(a) In India 35,296.87 28,218.07
(b) Outside India - -
(ii) Provisions for Depreciation
(a) In India 25,709.88 21,916.81
(b) Outside India - -
(iii) Net Value of Investments
(a) In India 9,586.99 6,301.26
(b) Outside India - -
2. Movement of provisions held towards depreciation on investments
(i) Opening balance 21,916.81 9,863.88
(ii) Add : Provisions made during the year 3,793.07 12,052.93
(iii) Less : Write-off / write-back of excess provisions during the year - -
(iv) Closing balance 25,709.88 21,916.81
III. (a) Forward rate agreement /interest rate swap
Particulars As at March 31, 2019 As at March 31, 2018
(i) The notional principal of swap agreements Nil Nil
(ii) Losses which would be incurred if counterparties failed to fulfill their obligations under the agreements
Nil Nil
(iii) Collateral required by the NBFC upon entering into swaps Nil Nil
(iv) Concentration of credit risk arising from the swaps Nil Nil
(v) The fair value of the swap book Nil Nil
(b) Exchange traded interest rate(IR) derivatives
The Company has not undertaken any Exchange Traded Interest Rate (IR) Derivatives during the year as well as in the previous year ended March 31, 2018.

133
IV. Disclosures on risk exposure in derivatives
(a ) Quantitative disclosures
Particulars Currency Derivatives Interest Rate Derivatives
(i) Derivatives (Notional Principal Amount)
For hedging 25,440.49 25,440.49
(ii) Marked to Market Positions [1]
Asset (+) 1,782.20 215.02
Liability (-) Nil Nil
(iii) Credit Exposure [2] Nil Nil
(iv) Unhedged Exposures 235.23 235.23
V. Disclosures relating to securitisation
The Company does not have any securitised assets as at March 31,2019 as well as in the previous year ended March 31, 2018.
VI. Details of financial assets sold to securitisation /reconstruction company for asset reconstruction
The Company has sold the following financial assets to securitisation /reconstruction company for asset reconstruction during the year ended March 31,2019
S.No Particulars Current Year Previous Year
(i) No. of accounts 2.00 1.00
(ii) Aggregate value (net of provisions) of accounts sold to SC / RC 7,801.00 3,375.83
(iii) Aggregate consideration 9,250.00 3,375.83
(iv) Additional consideration realized in respect of accounts transferred in earlier years - -
(v) Aggregate gain / loss over net book value 270.00 -
VII. Details of assignment transaction undertaken by applicable NBFCs
S.No Particulars Current Year Previous Year
(i) No. of accounts 3.00 1.00
(ii) Aggregate value (net of provisions) of accounts sold 45,000.00 5,000.00
(iii) Aggregate consideration 45,000.00 5,000.00
(iv) Additional consideration realized in respect of accounts transferred in earlier years - -
(v) Aggregate gain / loss over net book value - -
VIII. Details of non-performing financial assets purchased /sold
The Company has not puchased/sold any non-performing financial assets from other NBFCs in the current year as well as in the previous year.
IX. Asset Liability Management
Maturity pattern of certain items of assets and liabilities as at March 31,2019
Particulars Upto 30/31
days
Over 1 month to 2
months
Over 2 months to 3
months
Over 3 months to 6
months
Over 6 months to 1
year
Over 1year to 3 years
Over 3 years to 5
years
Over 5 years
Total
Liabilities
Borrowings from banks 20,000.00 20,000.00 35,839.85 58,265.09 190,485.95 183,605.83 204,995.48 288,928.43 1,002,120.63
Market Borrowings - 7,045.50 3,000.00 - 15,454.50 16,178.65 4,500.00 7,259.10 53,437.75
ECB loans 1,507.46 - 503.57 2,011.03 4,022.05 16,088.21 9,798.20 2,794.28 36,724.80
Total 21,507.46 27,045.50 39,343.42 60,276.12 209,962.51 215,872.69 219,293.67 298,981.81 1,092,283.18
Assets
Receivables under financing activity (net)
2,531.31 1,528.10 3,508.12 14,828.49 82,390.69 152,735.37 175,861.06 858,579.02 1,291,962.16
Investment (net) - - - - - - - 9,586.99 9,586.99
Total 2,531.31 1,528.10 3,508.12 14,828.49 82,390.69 152,735.37 175,861.06 868,166.01 1,301,549.15

134
X. Exposure to real estate sector, both direct and indirect
The Company does not have any direct or indirect exposure to the real estate sector as at March 31,2019 as well as in the previous year ended March 31, 2018.
XI. Exposure to Capital Market
Particulars As at March 31, 2019
As at March 31, 2018
(i) Direct investment in equity shares, convertible bonds, convertible debentures and units of equity-orient-ed mutual funds the corpus of which is not exclusively invested in corporate debt;
- -
(ii) Advances against shares / bonds / debentures or other securities or on clean basis to individuals for investment in shares (including IPOs / ESOPs), convertible bonds, convertible debentures, and units of equity-oriented mutual funds;
- -
(iii) Advances for any other purposes where shares or convertible bonds or convertible debentures or units of equity oriented mutual funds are taken as primary security;
- -
(iv) Advances for any other purposes to the extent secured by the collateral security of shares or convertible bonds or convertible debentures or units of equity oriented mutual funds i.e. where the primary security other than shares / convertible bonds / convertible debentures / units of equity oriented mutual funds ‘does not fully cover the advances;
18,668.00 28,500.00
(v) Secured and unsecured advances to stockbrokers and guarantees issued on behalf of stockbrokers and market makers;
- -
(vi) Loans sanctioned to corporates against the security of shares / bonds / debentures or other securities or on clean basis for meeting promoter’s contribution to the equity of new companies in anticipation of raising resources;
- -
(vii) Bridge loans to companies against expected equity flows / issues; - -
(viii) All exposures to Venture Capital Funds (both registered and unregistered) - -
Total Exposure to Capital Market 18,668.00 28,500.00
XII. Miscellaneous
(a) Reserve Bank of India - Registration Number : N-14.03116
(b) Credit Rating
Non Convertible Debentures/Bonds BWR AA (Stable), CRISIL A+ (Stable), ICRA A+ (Stable), CARE A+ (Stable)
Bank limits (rated on long term/short term scale) CRISIL A+ (Stable), ICRA A1+ (Stable), CARE A+ (Stable), CARE A1+, ICRA A1+
Commercial Paper Programme CRISIL A1+, ICRA A1+
Tier II Bonds CRISIL A+ (Stable)
(c) No penalties have been levied by any regulator during the year as well as in the previous year ended March 31, 2018.
XIII. Additional Disclosures
(a) Provisions and Contingencies
Break up of ‘Provisions and Contingencies’ shown under the head Expenditure in Profit and Loss Account
Particulars As at March 31, 2019
As at March 31, 2018
Provisions for depreciation on Investment 3,793.08 12,052.93
Provision towards NPA 7,631.65 14,414.01
Provision made towards Income tax - 13,068.38
Loss on loans & advances written off 38,577.91 294.29
Provision for Standard Assets 14,173.64 9,585.06
Provision for Contingencies (Net) - (134.72)
XIV. Concentration of Deposits, Advances, Exposures and NPAs
(a) Concentration of Advances
Particulars As at March 31, 2019
Total Advances to twenty largest borrowers 581,661.35
Percentage of Advances to twenty largest borrowers to Total Advances of the NBFC 43.67%
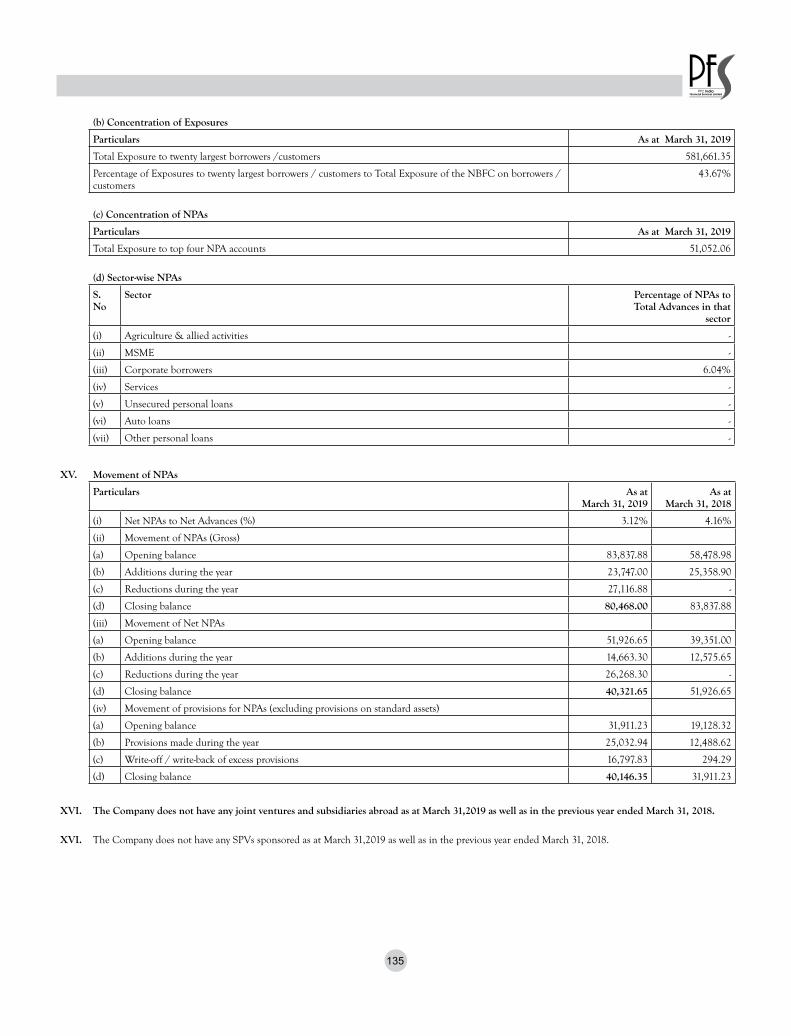
135
(b) Concentration of Exposures
Particulars As at March 31, 2019
Total Exposure to twenty largest borrowers /customers 581,661.35
Percentage of Exposures to twenty largest borrowers / customers to Total Exposure of the NBFC on borrowers / customers
43.67%
(c) Concentration of NPAs
Particulars As at March 31, 2019
Total Exposure to top four NPA accounts 51,052.06
(d) Sector-wise NPAs
S. No
Sector Percentage of NPAs to Total Advances in that
sector
(i) Agriculture & allied activities -
(ii) MSME -
(iii) Corporate borrowers 6.04%
(iv) Services -
(v) Unsecured personal loans -
(vi) Auto loans -
(vii) Other personal loans -
XV. Movement of NPAs
Particulars As at March 31, 2019
As at March 31, 2018
(i) Net NPAs to Net Advances (%) 3.12% 4.16%
(ii) Movement of NPAs (Gross)
(a) Opening balance 83,837.88 58,478.98
(b) Additions during the year 23,747.00 25,358.90
(c) Reductions during the year 27,116.88 -
(d) Closing balance 80,468.00 83,837.88
(iii) Movement of Net NPAs
(a) Opening balance 51,926.65 39,351.00
(b) Additions during the year 14,663.30 12,575.65
(c) Reductions during the year 26,268.30 -
(d) Closing balance 40,321.65 51,926.65
(iv) Movement of provisions for NPAs (excluding provisions on standard assets)
(a) Opening balance 31,911.23 19,128.32
(b) Provisions made during the year 25,032.94 12,488.62
(c) Write-off / write-back of excess provisions 16,797.83 294.29
(d) Closing balance 40,146.35 31,911.23
XVI. The Company does not have any joint ventures and subsidiaries abroad as at March 31,2019 as well as in the previous year ended March 31, 2018.
XVI. The Company does not have any SPVs sponsored as at March 31,2019 as well as in the previous year ended March 31, 2018.

136
XVII. Disclosure of Complaints
(a) Customer Complaints*
Particulars As at March 31, 2019
(a) No. of complaints pending at the beginning of the year Nil
(b) No. of complaints received during the year 717
(c) No. of complaints redressed during the year 717
(d) No. of complaints pending at the end of the year Nil
*Representing complaints of infrastructure retail bondholders.Note -Due to absence of guidance from RBI and in line with other regulatory reporting to RBI made by the Company during the financial year ended
March 31, 2019. Amounts reported in note 53 (RBI disclosures) represent the financial information prepared by the Company in accordance with the Accounting Standards prescribed under section 133 of Companies Act 2013 read with the Company (Accounting Standards) rules, 2006 as amended (“Accounting Standards”)
53.3 (as required in terms of RBI circular RBI/2016-17/122 DBR.No.BP.PC.34/21.04.132/2016-07 dated November 10, 2017)
1 Disclosures on flexible structuring of existing loans
Period No. of borrowers taken up for flexibly
structuring
Amount of loans taken up for flexible structur-ing
Exposure weighted average duration of loans taken up for flexible structuring
Classified as Standard Classified as NPA Before applying flex-ible structuring
After applying flexible structuring
FY2017-18 36,793.80 36,793.80 -
FY2018-19 - - -
2 Disclosures on Strategic Debt Restructuring Scheme (accounts which are currently under standstill period)
No. of accounts where SDR has been invoked
Amount outstanding as on reporting date
Amount outstanding as on report date with respect to accounts where conver-
sion of debt to equity is pending
Amount outstanding as on report date with respect to accounts where conver-sion of debt to equity has taken place
Classified as Standard
Classified as NPA Classified as Standard
Classified as NPA Classified as Standard
Classified as NPA
FY2017-18 18,785.40 - - - 18,785.40 -
FY2018-19 - - - - -
3 Disclosures on Change in ownership Outside Strategic Debt Restructuring Scheme (accounts which are currently under standstill period)
No. of accounts where banks have decided to effect change in ownership
Amount outstanding as on the reporting date
Amount outstanding as on reporting date with respect to the accounts where conver-sion of debt/invocation of pledge of equity shares is pending
Amount outstanding as on reporting date with respect to the accounts where conver-sion of debt/invocation of pledge of equity shares has taken place
Amount outstanding as on reporting date with respect to accounts where change in ownership is envisaged by is-suance of fresh shares or sale of promoters equity
Classified as Standard
Classified as NPA
Classified as Standard
Classified as NPA
Classified as Standard
Classified as NPA
Classified as Standard
Classified as NPA
FY2017-18 66,658.50 - 33,788.50 - 32,870.00 - - -
FY2018-19 32,870.00 - - - 32,870.00 - - -
For and on behalf of the Board of Directors
Sd/- Sd/- Dr. Pawan Singh Naveen Kumar Managing Director and CEO Whole-time Director DIN: 00044987 DIN: 00279627
Sd/- Sd/- Vishal Goyal Sanjay Rustagi Company Secretary Chief Financial Officer
Place: New Delhi Date : May 4, 2019

137
Report on the Audit of the Consolidated Financial Statements
Opinion
We have audited the accompanying consolidated financial statements of PTC India Financial Services Limited (hereinafter referred to as ”the Company”) and its associates, which comprise the Consolidated Balance Sheet as at March 31, 2019, the Consolidated Statement of Profit and Loss (including Other Comprehensive Income), the Consolidated Cash Flow Statement and the Consolidated Statement of Changes in Equity for the year then ended, and a summary of significant accounting policies and other explanatory information (herein referred to as “the consolidated financial statements”).
In our opinion and to the best of our information and according to the explanations given to us, the aforesaid consolidated financial statements give the information required by the Companies Act, 2013 (“the Act”) in the manner so required and give a true and fair view in conformity with the Indian Accounting Standards prescribed under section 133 of the Act read with the Companies (Indian Accounting Standards) Rules, 2015, as amended (‘Ind AS’), and other accounting principles generally accepted in India, of the consolidated state of affairs of the Company as at March 31, 2019, and their consolidated profit, consolidated total comprehensive income, their consolidated cash flows and consolidated statement of changes in equity for the year ended on that date.
Basis for Opinion
We conducted our audit of the consolidated financial statements in accordance with the Standards on Auditing specified under section 143 (10) of the Act (SAs). Our responsibilities under those Standards are further described in the Auditor’s Responsibility for the Audit of the consolidated financial statements section of our report. We are independent of the Company in accordance with the Code of Ethics issued by the Institute of Chartered Accountants of India (ICAI) together with the ethical requirements that are relevant to our audit of the consolidated financial statements under the provisions of the Act and the Rules made thereunder, and we have fulfilled our other ethical responsibilities in accordance with these requirements and the ICAI’s Code of Ethics. We believe that the audit evidence obtained by us is sufficient and appropriate to provide a basis for our audit opinion on the consolidated financial statements.
Key Audit Matters
Key audit matters are those matters that, in our professional judgment, were of most significance in our audit of the consolidated financial statements of the current period. These matters were addressed in the context of our audit of the consolidated financial statements as a whole, and in forming our opinion thereon, and we do not provide a separate opinion on these matters.
We have determined the matters described below to be the key audit matters to be communicated in our report.
INDEPENDENT AUDITOR’S REPORTTo The Members of
PTC India Financial Services Limited
Sr. No. Key Audit Matter Auditor’s Response
1. Impairment of loans to customers
Allowance for impairment losses on loans to customers involves significant judgement by management to determine the timing and amount of the asset to be impaired.
Refer Notes 1B (k), 2 (i) and 7 to the consolidated financial statements.
Principal Audit Procedures
We assessed the appropriateness of the Company’s impairment review and provisioning policy by comparing with the RBI prudential norms and applicable accounting standards ;
Our audit approach consisted testing of the design and operating effectiveness of the internal controls and substantive testing:
• We evaluated and tested the design and operating effectiveness of the relevant controls over the impairment assessments and impairment allowance computations for loans and advances to customers.
• We tested the management assumptions, estimates and judgements, which could give rise to material misstatement:
a. The completeness and timing of recognition of loss events;
b. The measurement of provisions for individual instances of loans which is dependent on the valuation of security provided and the collaterals against each loan, the timing of cash flows and realisations;
c. We discussed with management and scrutinised the appropriateness of those key assumptions applied in management’s impairment assessment, and compared them with available external evidence where necessary.
d. The measurement of modelled provisions, which is dependent upon key assumptions relating to probability of default, loss given default and expected future recoveries;
e. Performed procedures to obtain comfort on the accuracy of the impairment calculation process through recalculation of the provision charge based on inputs;
f. Assessed accuracy and completeness of disclosures made as required by relevant accounting standards.

138
Sr. No. Key Audit Matter Auditor’s Response
2. Expected Credit Losses (ECL) model
As described in the notes to the consolidated financial statements, the impairment losses have been determined in accordance with Ind AS 109 Financial Instruments requiring considerable judgment and interpretation in its implementation, which also involved significant judgement by management in measuring the expected credit losses. Key areas of judgment included:
a. Determining the criteria for a significant increase in credit risk (`SICR’)
b. Techniques used to determine the Probability of Default (TD’) and Loss Given Default (`LGD’)
c. Assumptions used in the expected credit loss model such as the financial condition of the counterparty, expected future cash flows etc.
Refer Notes 1B (k), 2 (ii), 7 and 45A.2 to the consolidated financial statements.
Principal Audit Procedures
We assessed the appropriateness of the Company’s policy on Expected Credit Loss recognition on financial instruments with reference to the applicable accounting standards and prudential norms laid down by RBI.
Our audit approach consisted testing of the design and operating effectiveness of the internal controls and substantive testing:
• We evaluated and tested the design and tested the operating effectiveness of Company’s controls over the data used to determine the impairment reserve, internal credit quality assessments, external credit ratings and methodology followed for computation of ECL.
• For Expected Credit Losses computed by the management, we performed the following procedures:
a. Assessed the reasonableness of assumptions and judgement made by management on model adoption and parameters selection;
b. Examined the key data inputs (valuation of collateral, the timing of cash flows and realisations) to the ECL model on a sample basis to assess their accuracy and completeness;
c. Evaluated and tested on sample basis the appropriateness of staging including determination of significant increase in credit risk.
d. Assessed the Company’s methodology for ECL provisioning, Classification and Measurement with the assistance of our internal experts;
e. Assessed accuracy and completeness of disclosures made as required by relevant accounting standards.
3. Revenue Recognition
Revenue recognition- Interest income on stressed loans involves significant management estimates and assumptions in determining both timing and expected realisation from them.
Refer Notes 1B (a), 2 (iv) and 23 to the consolidated financial statements.
Principal Audit Procedures
Assessed the appropriateness of the Company’s revenue recognition policy by comparing with applicable accounting standards and prudential norms laid down by RBI.
Our audit approach consisted testing of the design and operating effectiveness of the internal controls and substantive testing:
• Evaluated and tested the design of internal controls relating to revenue recognition on stressed loans and advances.
• Tested the operating effectiveness of the Company’s controls through combination of procedures involving enquiry and observation, reperformance and inspection of evidence in respect of operations of these controls.
• Evaluated and tested the management estimates and assumption used while accruing the income on stressed loans and advances.
• Performed recalculation of interest accrual and tested input data, such as principal amounts, contractual interest rates etc. through substantive testing and tracing to source documents. We also took cognizance of the events arose subsequent to the end of the financial year from them.
• Ensured compliance with RBI regulation on revenue recognition for each case.
4. Evaluation of uncertain tax positions for Income taxes
The Company has material uncertain tax positions relating to matters under litigation for Income taxes. These matters involve significant management judgement to determine the possible outcome of disputes.
Refer Notes 1B (p), 2 (iii) and 34 to the consolidated financial statements.
Principal Audit Procedures
We obtained details of completed income tax assessments during the year ended March 31, 2019 from the management. We involved our internal experts to challenge the management’s underlying assumptions in estimating the tax provisions and the possible outcome of the disputes. Our internal experts also considered legal precedence and other rulings in evaluating management’s position on these uncertain tax positions relating to Income taxes.
Additionally we considered the effect of new information in respect of uncertain tax positions to evaluate whether any change was required to management’s position on these uncertainties.

139
Information Other than the Consolidated Financial Statements and Auditor’s Report Thereon
The Company’s Board of Directors is responsible for the preparation of the other information. The other information comprises the information included in the Directors report, Report on Corporate Governance and Management discussion and analysis report of the Company, but does not include the consolidated financial statements and our auditor’s report thereon. The Directors report, Report on Corporate Governance and Management discussion and analysis report of the Company is expected to be made available to us after the date of this auditor’s report.
Our opinion on the consolidated financial statements does not cover the other information and we will not express any form of assurance conclusion thereon.
In connection with our audit of the consolidated financial statements, our responsibility is to read the other information and, in doing so, consider whether the other information is materially inconsistent with the consolidated financial statements or our knowledge obtained during the course of our audit or otherwise appears to be materially misstated.
If, based on the work we have performed, we conclude that there is a material misstatement of this other information, we are required to report that fact.
When we read the Directors report, Report on Corporate Governance and Management discussion and analysis report, if we conclude that there is a material misstatement therein, we are required to communicate the matter to those charged with governance as required under SA 720 ‘The Auditor’s responsibilities Relating to Other Information’.
Management’s Responsibility for the Consolidated Financial Statements
The Company’s Board of Directors is responsible for the matters stated in section 134(5) of the Act with respect to the preparation of these consolidated financial statements that give a true and fair view of the consolidated financial position, consolidated financial performance including consolidated total comprehensive income, consolidated cash flows and consolidated changes in equity of the Company and its associates in accordance with the Ind AS and other accounting principles generally accepted in India. The respective Board of Directors of the Company and its associates are responsible for maintenance of adequate accounting records in accordance with the provisions of the Act for safeguarding the assets of the Company and its associates for preventing and detecting frauds and other irregularities; selection and application of appropriate accounting policies; making judgments and estimates that are reasonable and prudent; and design, implementation and maintenance of adequate internal financial controls, that were operating effectively for ensuring the accuracy and completeness of the accounting records, relevant to the preparation and presentation of the consolidated financial statements that give a true and fair view and are free from material misstatement, whether due to fraud or error, which have been used for the purpose of preparation of the consolidated financial statements by the Directors of the Company, as aforesaid.
In preparing the consolidated financial statements, the respective Board of Directors of the Company and its associates are responsible for assessing their ability to continue as a going concern, disclosing, as applicable, matters related to going concern and using the going concern basis of accounting unless the management either intends to liquidate the Company and its associates or cease operations, or has no realistic alternative but to do so.
The respective Board of Directors of the Company and its associates are also responsible for overseeing the financial reporting process of the Company and its associates.
Auditor’s Responsibility for the Audit of the Consolidated Financial Statements
Our objectives are to obtain reasonable assurance about whether the consolidated financial statements as a whole are free from material misstatement, whether due to fraud or error, and to issue an auditor’s report that includes our opinion. Reasonable assurance is a high level of assurance, but is not a guarantee that an audit conducted in accordance with SAs will always detect
a material misstatement when it exists. Misstatements can arise from fraud or error and are considered material if, individually or in the aggregate, they could reasonably be expected to influence the economic decisions of users taken on the basis of these consolidated financial statements.
As part of an audit in accordance with SAs, we exercise professional judgment and maintain professional skepticism throughout the audit. We also:
• Identify and assess the risks of material misstatement of the consolidated financial statements, whether due to fraud or error, design and perform audit procedures responsive to those risks, and obtain audit evidence that is sufficient and appropriate to provide a basis for our opinion. The risk of not detecting a material misstatement resulting from fraud is higher than for one resulting from error, as fraud may involve collusion, forgery, intentional omissions, misrepresentations, or the override of internal control.
• Obtain an understanding of internal financial controls relevant to the audit in order to design audit procedures that are appropriate in the circumstances. Under section 143(3)(i) of the Act, we are also responsible for expressing our opinion on whether the Company and its associate Companies which are Companies incorporated in India, has adequate internal financial controls system in place and the operating effectiveness of such controls.
• Evaluate the appropriateness of accounting policies used and the reasonableness of accounting estimates and related disclosures made by the management.
• Conclude on the appropriateness of management’s use of the going concern basis of accounting and, based on the audit evidence obtained, whether a material uncertainty exists related to events or conditions that may cast significant doubt on the ability of the Company and its associates to continue as a going concern. If we conclude that a material uncertainty exists, we are required to draw attention in our auditor’s report to the related disclosures in the consolidated financial statements or, if such disclosures are inadequate, to modify our opinion. Our conclusions are based on the audit evidence obtained up to the date of our auditor’s report. However, future events or conditions may cause the Company and its associates to continue as a going concern.
• Evaluate the overall presentation, structure and content of the consolidated financial statements, including the disclosures, and whether the consolidated financial statements represent the underlying transactions and events in a manner that achieves fair presentation.
• Obtain sufficient appropriate audit evidence regarding the financial information of the entities or business activities within the Company and its associates to express an opinion on the consolidated financial statements. We are responsible for the direction, supervision and performance of the audit of the financial statements of such entities included in the consolidated financial statements.
Materiality is the magnitude of misstatements in the consolidated financial statements that, individually or in aggregate, makes it probable that the economic decisions of a reasonably knowledgeable user of the financial statements may be influenced. We consider quantitative materiality and qualitative factors in (i) planning the scope of our audit work and in evaluating the results of our work; and (ii) to evaluate the effect of any identified misstatements in the financial statements.
We communicate with those charged with governance of the Company regarding, among other matters, the planned scope and timing of the audit and significant audit findings, including any significant deficiencies in internal control that we identify during our audit.
We also provide those charged with governance with a statement that we have complied with relevant ethical requirements regarding independence, and to communicate with them all relationships and other matters that may reasonably be thought to bear on our independence, and where applicable, related safeguards.

140
From the matters communicated with those charged with governance, we determine those matters that were of most significance in the audit of the consolidated financial statements of the current period and are therefore the key audit matters. We describe these matters in our auditor’s report unless law or regulation precludes public disclosure about the matter or when, in extremely rare circumstances, we determine that a matter should not be communicated in our report because the adverse consequences of doing so would reasonably be expected to outweigh the public interest benefits of such communication.
Other Matters
The comparative financial information of the Company and its associates for the year ended March 31, 2018, included in these consolidated financial statements, have been prepared after adjusting the previously issued consolidated financial statements prepared in accordance with the Companies (Accounting Standards) Rules, 2006 to comply with Ind AS. Adjustments made to the previously issued consolidated financial statements to comply with Ind AS have been audited by us.
Attention is invited to Note 52 of the consolidated financial statements, which sets out the position regarding two Associates of the Company for which neither audited nor management accounts for the financial year ended March 31, 2019 were available with the Company for the consolidation purposes. However, since the Company has fully provided for diminution in investment held in these two associates and the Company does not have any further obligation over and above the cost of the investments, in view of the management there is no impact thereof on these consolidated financial statements.
Our opinion on the consolidated financial statements is not modified in respect of the matters stated above.
Report on Other Legal and Regulatory Requirements
1. As required by Section 143(3) of the Act, based on our audit of the Company (in the absence of availability of audit reports of the 2 associates referred to in ‘Other Matters’ paragraph above) we report that:
a) We have sought and obtained all the information and explanations which to the best of our knowledge and belief were necessary for the purposes of our audit of the aforesaid consolidated financial statements.
b) In our opinion, proper books of account as required by law relating to preparation of the aforesaid consolidated financial statements have been kept so far as it appears from our examination of those books.
c) The Consolidated Balance Sheet, the Consolidated Statement of Profit and Loss (including Other Comprehensive Income), the Consolidated Cash Flow Statement and the Consolidated Statement of Changes in Equity dealt with by this Report are in agreement with the relevant books of account maintained for the purpose of preparation of the consolidated financial statements.
d) In our opinion, the aforesaid consolidated financial statements comply with the Ind AS specified under Section 133 of the Act.
e) On the basis of the written representations received from the directors of the Company as on March 31, 2019 taken on record by the Board of Directors of the Company, none of the directors of the Company is disqualified as on March 31, 2019 from being appointed as a director in terms of Section 164 (2) of the Act.
f) With respect to the adequacy of the internal financial controls over financial reporting and the operating effectiveness of such controls, refer to our separate Report in “Annexure A” which is based on the auditors’ reports of the Company. Our report expresses an unmodified opinion on the adequacy and operating effectiveness of internal financial controls over financial reporting of the Company’s internal financial controls over financial reporting.
g) With respect to the other matters to be included in the Auditor’s Report in accordance with the requirements of section 197(16) of the Act, as amended:
In our opinion and to the best of our information and according to the explanations given to us, the remuneration paid by the Company to its directors during the year is in accordance with the provisions of section 197 of the Act.
h) With respect to the other matters to be included in the Auditor’s Report in accordance with Rule 11 of the Companies (Audit and Auditors) Rules, 2014, as amended in our opinion and to the best of our information and according to the explanations given to us:
i) The consolidated financial statements disclose the impact of pending litigations on the consolidated financial position of the Company- Refer to Note 34 of the consolidated financial statements.
ii) Provision has been made in the consolidated financial statements, as required under the applicable law or accounting standards, for material foreseeable losses, if any, on long-term contracts including derivative contracts- Refer to Note 49 of the consolidated financial statements.
iii) There has been no delay in transferring amounts, required to be transferred, to the Investor Education and Protection Fund by the Company- Refer to Note 50 of the consolidated financial statements.
For Deloitte Haskins & SellsChartered Accountants
(Firm’s Registration No. 015125N)
Jitendra Agarwal Gurugram, (Partner) May 4, 2019 (Membership No. 087104)

141
Report on the Internal Financial Controls Over Financial Reporting under Clause (i) of Sub-section 3 of Section 143 of the Companies Act, 2013 (“the Act”)
We have audited the internal financial controls over financial reporting of PTC INDIA FINANCIAL SERVICES LIMITED (“the Company”) as of March 31, 2019 in conjunction with our audit of the consolidated financial statements of the Company and its associates as of and for the year ended on that date. Since the auditors’ reports of associates are not available, we are unable to comment on the adequacy and operating effectiveness of Internal Financial Controls over Financial Reporting under section 143(3)(i) of the Act in respect of these associates.
Management’s Responsibility for Internal Financial Controls
The Company’s management is responsible for establishing and maintaining internal financial controls based on “the internal control over financial reporting criteria established by the Company considering the essential components of internal control stated in the Guidance Note on Audit of Internal Financial Controls over Financial Reporting issued by the Institute of Chartered Accountants of India”. These responsibilities include the design, implementation and maintenance of adequate internal financial controls that were operating effectively for ensuring the orderly and efficient conduct of its business, including adherence to Company’s policies, the safeguarding of its assets, the prevention and detection of frauds and errors, the accuracy and completeness of the accounting records, and the timely preparation of reliable financial information, as required under the Companies Act, 2013.
Auditor’s Responsibility
Our responsibility is to express an opinion on the Company’s internal financial controls over financial reporting based on our audit. We conducted our audit in accordance with the Guidance Note on Audit of Internal Financial Controls Over Financial Reporting (the “Guidance Note”) issued by the Institute of Chartered Accountants of India and the Standards on Auditing prescribed under Section 143(10) of the Companies Act, 2013, to the extent applicable to an audit of internal financial controls. Those Standards and the Guidance Note require that we comply with ethical requirements and plan and perform the audit to obtain reasonable assurance about whether adequate internal financial controls over financial reporting was established and maintained and if such controls operated effectively in all material respects.
Our audit involves performing procedures to obtain audit evidence about the adequacy of the internal financial controls system over financial reporting and their operating effectiveness. Our audit of internal financial controls over financial reporting included obtaining an understanding of internal financial controls over financial reporting, assessing the risk that a material weakness exists, and testing and evaluating the design and operating effectiveness of internal control based on the assessed risk. The procedures selected depend on the auditor’s judgement, including the assessment of the risks of material misstatement of the consolidated financial statements, whether due to fraud or error.
We believe that the audit evidence we have obtained is sufficient and appropriate to provide a basis for our audit opinion on the Company’s internal financial controls system over financial reporting.
Meaning of Internal Financial Controls over Financial Reporting
A company’s internal financial control over financial reporting is a process designed to provide reasonable assurance regarding the reliability of financial reporting and the preparation of consolidated financial statements for external purposes in accordance with generally accepted accounting principles. A company’s internal financial control over financial reporting includes those policies and procedures that (1) pertain to the maintenance of records that, in reasonable detail, accurately and fairly reflect the transactions and dispositions of the assets of the company; (2) provide reasonable assurance that transactions are recorded as necessary to permit preparation of consolidated financial statements in accordance with generally accepted accounting principles, and that receipts and expenditures of the company are being made only in accordance with authorisations of management and directors of the company; and (3) provide reasonable assurance regarding prevention or timely detection of unauthorised acquisition, use, or disposition of the company’s assets that could have a material effect on the consolidated financial statements.
Inherent Limitations of Internal Financial Controls over Financial Reporting
Because of the inherent limitations of internal financial controls over financial reporting, including the possibility of collusion or improper management override of controls, material misstatements due to error or fraud may occur and not be detected. Also, projections of any evaluation of the internal financial controls over financial reporting to future periods are subject to the risk that the internal financial control over financial reporting may become inadequate because of changes in conditions, or that the degree of compliance with the policies or procedures may deteriorate.
Opinion
In our opinion, to the best of our information and according to the explanations given to us, the Company has, in all material respects, an adequate internal financial controls system over financial reporting and such internal financial controls over financial reporting were operating effectively as at March 31, 2019, based on “the internal control over financial reporting criteria established by the Company considering the essential components of internal control stated in the Guidance Note on Audit of Internal Financial Controls Over Financial Reporting issued by the Institute of Chartered Accountants of India”.
For Deloitte Haskins & SellsChartered Accountants
(Firm’s Registration No. 015125N)
Jitendra Agarwal Gurugram, (Partner)
May 4, 2019 (Membership No. 087104)
ANNEXURE “A” TO THE INDEPENDENT AUDITOR’S REPORT (Referred to in paragraph 1 (f) under ‘Report on Other Legal and Regulatory Requirements’ section of our report of even date)
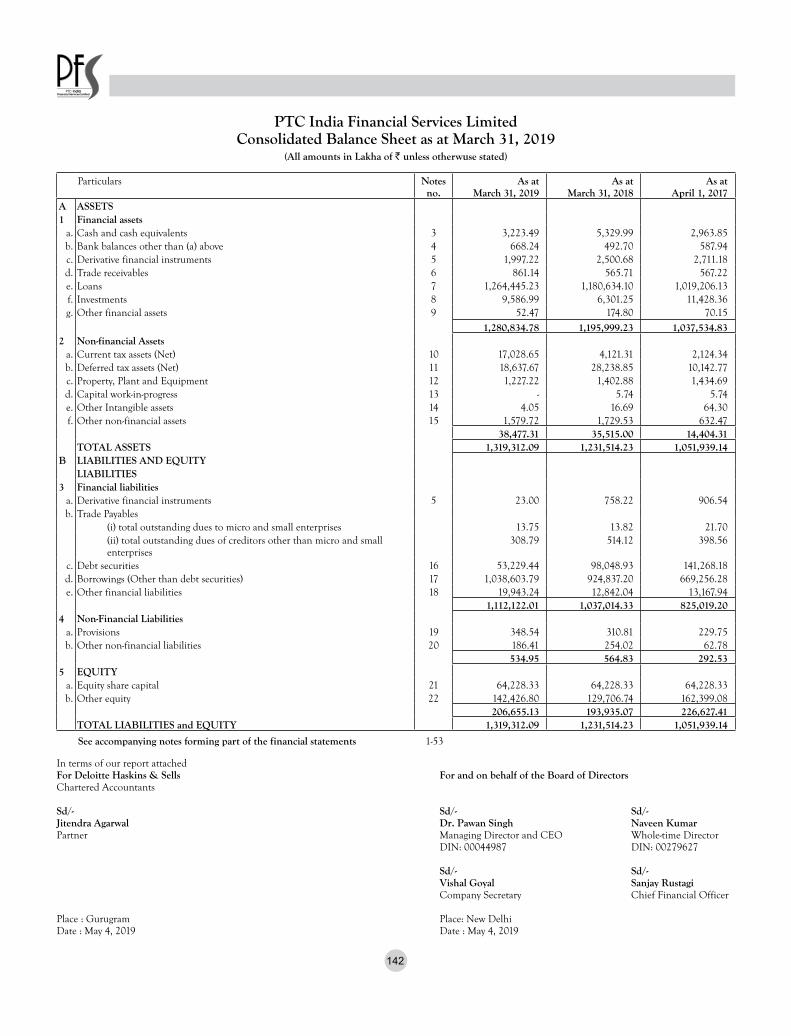
142
PTC India Financial Services LimitedConsolidated Balance Sheet as at March 31, 2019
(All amounts in Lakha of r unless otherwuse stated)
Particulars Notesno.
As at March 31, 2019
As at March 31, 2018
As at April 1, 2017
A ASSETS1 Financial assets
a. Cash and cash equivalents 3 3,223.49 5,329.99 2,963.85 b. Bank balances other than (a) above 4 668.24 492.70 587.94 c. Derivative financial instruments 5 1,997.22 2,500.68 2,711.18 d. Trade receivables 6 861.14 565.71 567.22 e. Loans 7 1,264,445.23 1,180,634.10 1,019,206.13 f. Investments 8 9,586.99 6,301.25 11,428.36 g. Other financial assets 9 52.47 174.80 70.15
1,280,834.78 1,195,999.23 1,037,534.83 2 Non-financial Assets
a. Current tax assets (Net) 10 17,028.65 4,121.31 2,124.34 b. Deferred tax assets (Net) 11 18,637.67 28,238.85 10,142.77 c. Property, Plant and Equipment 12 1,227.22 1,402.88 1,434.69 d. Capital work-in-progress 13 - 5.74 5.74 e. Other Intangible assets 14 4.05 16.69 64.30 f. Other non-financial assets 15 1,579.72 1,729.53 632.47
38,477.31 35,515.00 14,404.31 TOTAL ASSETS 1,319,312.09 1,231,514.23 1,051,939.14
B LIABILITIES AND EQUITYLIABILITIES
3 Financial liabilitiesa. Derivative financial instruments 5 23.00 758.22 906.54 b. Trade Payables
(i) total outstanding dues to micro and small enterprises 13.75 13.82 21.70 (ii) total outstanding dues of creditors other than micro and small enterprises
308.79 514.12 398.56
c. Debt securities 16 53,229.44 98,048.93 141,268.18 d. Borrowings (Other than debt securities) 17 1,038,603.79 924,837.20 669,256.28 e. Other financial liabilities 18 19,943.24 12,842.04 13,167.94
1,112,122.01 1,037,014.33 825,019.20 4 Non-Financial Liabilities
a. Provisions 19 348.54 310.81 229.75 b. Other non-financial liabilities 20 186.41 254.02 62.78
534.95 564.83 292.53 5 EQUITY
a. Equity share capital 21 64,228.33 64,228.33 64,228.33 b. Other equity 22 142,426.80 129,706.74 162,399.08
206,655.13 193,935.07 226,627.41 TOTAL LIABILITIES and EQUITY 1,319,312.09 1,231,514.23 1,051,939.14
See accompanying notes forming part of the financial statements 1-53
In terms of our report attachedFor Deloitte Haskins & Sells For and on behalf of the Board of DirectorsChartered Accountants
Sd/- Sd/- Sd/-Jitendra Agarwal Dr. Pawan Singh Naveen KumarPartner Managing Director and CEO Whole-time Director DIN: 00044987 DIN: 00279627
Sd/- Sd/- Vishal Goyal Sanjay Rustagi Company Secretary Chief Financial Officer
Place : Gurugram Place: New DelhiDate : May 4, 2019 Date : May 4, 2019

143
In terms of our report attachedFor Deloitte Haskins & Sells For and on behalf of the Board of DirectorsChartered Accountants
Sd/- Sd/- Sd/-Jitendra Agarwal Dr. Pawan Singh Naveen KumarPartner Managing Director and CEO Whole-time Director DIN: 00044987 DIN: 00279627
Sd/- Sd/- Vishal Goyal Sanjay Rustagi Company Secretary Chief Financial Officer
Place : Gurugram Place: New DelhiDate : May 4, 2019 Date : May 4, 2019
PTC India Financial Services LimitedConsolidated Statement of Profit and Loss for the year ended March 31, 2019
(All amounts in Lakha of r unless otherwuse stated)
Note For the year ended March 31, 2019
For the year ended March 31, 2018
1 Revenue
a. Revenue from operations
(i) Interest income 23 128,517.08 112,545.12 (ii) Fee and commission income 24 3,474.71 5,150.59
(iii) Net gain on fair value changes 25 1,042.59 346.88 (iv) Sale of power 407.19 412.09
b. Other income 26 209.65 60.88 Total revenue (a+b) 133,651.22 118,515.56
2 Expensesa. Finance costs 27 94,431.06 68,500.08 b. Fees and commission expense 28 116.47 51.93 c. Impairment on financial instruments 29 6,058.25 60,971.48 d. Employees benefit expenses 30 1,404.39 1,473.73 e. Depreciation and amortisation expense 31 272.65 325.87 f. Other expenses 32 3,268.44 2,235.16 Total expenses (a+b+c+d+e+f) 105,551.26 133,558.25
3 Profit before tax, share of net profits of investments accounted for using equity method (1-2) 28,099.96 (15,042.69)4 Share of net profit of associated accounted for using equity method 52 - - 5 Profit before tax (3+4) 28,099.96 (15,042.69)6 Tax expense
a. Current tax 33 - 13,068.38 b. Deferred tax charge/(benefits) 33 9,685.70 (18,087.62)Total tax expense 9,685.70 (5,019.24)
7 Profit for the year (5-6) 18,414.26 (10,023.45)8 Other comprehensive income, net of tax
Items that will not be reclassified to profit or lossa. Remeasurement loss on defined benefit plans (3.97) (24.46) Income tax relating to remeasurement loss on defined benefit plans 1.39 8.46 b. Equity instruments through other comprehensive income (3,203.87) (12,052.93) Income tax relating to FVTOCI to equity investments - -
(3,206.45) (12,068.93)Items that will be reclassified to profit or lossa. Change in cash flow hedge reserve (237.90) - Income tax relating to cash flow hedge reserve 83.13 -
(154.77) - Other comprehensive profit for the year (3,361.22) (12,068.93)
9 Total comprehensive profit for the year (7+8) 15,053.04 (22,092.38)Earnings per equity share:Basic and diluted 46 2.87 (1.56)See accompanying notes forming part of the consolidated financial statements 1-53

144
Particulars For the year ended 31 March 2019
For the year ended 31 March 2018
A CASH FLOWS FROM OPERATING ACTIVITIESProfit after tax 18,414.26 (10,023.45)Adjustments for:Depreciation and amortisation expense 272.65 325.87 Impairment on financial instruments 6,058.25 60,971.48 Gain on sale of property, plant and equipment (4.93) (0.03)Finance costs 94,431.06 68,500.08 Net gain on fair value changes (1,042.59) (346.88)Tax expense 9,685.70 (5,019.24)Operating profit before working capital changes 127,814.40 114,407.83 Changes in working capitalAdjustments for (increase) / decrease in operating assets:Loan financing (96,307.35) (229,325.72)Other loans (22.82) 0.44 Other financial assets 122.33 (104.65)Other non- financial assets 149.90 (67.75)Trade receivables (373.11) 1.51 Adjustments for increase / (decrease) in operating liabilities:Other financial liabilities 5,410.20 (373.25)Provisions 33.76 56.60 Trade payables (205.40) 107.68 Other non- financial liabilities (67.61) 191.24 Cash flow from operating activities post working capital changes 36,554.30 (115,106.07)Income- tax paid (12,907.34) (15,065.35)Net cash flow from operating activities (A) 23,646.96 (130,171.42)
B CASH FLOWS FROM INVESTING ACTIVITIESCapital expenditure on property, plant and equipment, including capital advances (81.79) (1,277.62)Proceeds from sale of property, plant and equipment 9.46 6.19 Purchase of intangible assets (1.44) (4.30)Proceeds from sale of investments/ redemption of security receipts 48.86 - Net cash used in investing activities (B) (24.91) (1,275.73)
C CASH FLOWS FROM FINANCING ACTIVITIESProceeds from borrowings 407,434.65 268,199.76 Repayment of borrowings (293,963.81) (11,694.13)Repayment of debt securities (45,456.36) (43,543.04)Finance costs (92,194.41) (67,553.73)Dividend paid (1,284.57) (9,634.25)Tax on dividend (264.05) (1,961.32)Net cash flow from financing activities (C) (25,728.55) 133,813.29 Increase in cash and cash equivalents (A+B+C) (2,106.50) 2,366.14 Cash and cash equivalents at the beginning of the year 5,329.99 2,963.85 Cash and cash equivalents at the end of the year 3,223.49 5,329.99
See accompanying notes forming part of the financial statements 1-53
PTC India Financial Services LimitedConsolidated Statement of Cash Flow as at March 31, 2019
(All amounts in Lakha of r unless otherwuse stated)
In terms of our report attachedFor Deloitte Haskins & Sells For and on behalf of the Board of DirectorsChartered Accountants
Sd/- Sd/- Sd/-Jitendra Agarwal Dr. Pawan Singh Naveen KumarPartner Managing Director and CEO Whole-time Director DIN: 00044987 DIN: 00279627
Sd/- Sd/- Vishal Goyal Sanjay Rustagi Company Secretary Chief Financial Officer
Place : Gurugram Place: New DelhiDate : May 4, 2019 Date : May 4, 2019

145
PTC India Financial Services LimitedConsolidated Statement of changes in equity as at March 31, 2019
(All amounts in Lakha of r unless otherwuse stated)
B Other Equity:Reserves and Surplus Total
Securities Premium Reserve
Statutory Reserve
Special Reserve
Equity instruments
through other comprehensive
income
Cash flow hedge reserve
Foreign currency monetary items
translation difference
account
Retained Earnings
As at April 1, 2017 61,280.57 28,685.59 23,337.48 (2,884.17) - (2,744.82) 54,724.43 162,399.08 Add: Profit for the year - - - - - - (10,023.45) (10,023.45)Add [Less]: Other Comprehensive income - - - (12,052.93) - - (16.00) (12,068.93)Total Comprehensive Income - - - (12,052.93) - - (10,039.45) (22,092.38)Transfer from [to] Reserve - 494.09 6,362.30 - - - (6,856.39) - Transactions with owners in their capacity as owners:
Dividends - - - - - - (9,634.25) (9,634.25)Corporate dividend tax on dividend - - - - - - (1,961.32) (1,961.32)
Effect of foreign exchange rate variations during the year
- - - - - 191.10 - 191.10
Amortisation for the year - - - - - 804.51 - 804.51 As at March 31, 2018 61,280.57 29,179.68 29,699.78 (14,937.10) - (1,749.21) 26,233.02 129,706.74 As at April 1, 2018 61,280.57 29,179.68 29,699.78 (14,937.10) - (1,749.21) 26,233.02 129,706.74 Add: Profit for the year - - - - - - 18,414.26 18,414.26 Add [Less]: Other Comprehensive income
- - - (3,203.87) (154.77) - (2.58) (3,361.22)
Total Comprehensive Income - - - (3,203.87) (154.77) - 18,411.68 15,053.04 Transfer from [to] Reserve - 3,682.85 - - - - (3,682.85) - Transactions with owners in their capacity as owners:
Dividends - - - - - - (1,284.57) (1,284.57)Corporate dividend tax on dividend - - - - - - (264.05) (264.05)
Effect of foreign exchange rate variations during the year
- - - - - (2,451.19) - (2,451.19)
Amortisation for the year - - - - - 1,666.83 - 1,666.83 As at March 31, 2019 61,280.57 32,862.53 29,699.78 (18,140.97) (154.77) (2,533.57) 39,413.23 142,426.80
See accompanying notes forming part of the financial statements 1-53
A Equity Share Capital:
No. of Shares Amount
Equity Shares of Rs. 10 each, Issued, Subscribed and Fully Paid-up:
As at April 1, 2017 642,283,335 64,228.33
Issued during the year - -
As at March 31, 2018 642,283,335 64,228.33
Issued during the year - -
As at March 31, 2019 642,283,335 64,228.33
In terms of our report attachedFor Deloitte Haskins & Sells For and on behalf of the Board of DirectorsChartered Accountants
Sd/- Sd/- Sd/-Jitendra Agarwal Dr. Pawan Singh Naveen KumarPartner Managing Director and CEO Whole-time Director DIN: 00044987 DIN: 00279627
Sd/- Sd/- Vishal Goyal Sanjay Rustagi Company Secretary Chief Financial Officer
Place : Gurugram Place: New DelhiDate : May 4, 2019 Date : May 4, 2019
146
PTC India Financial Services LimitedNotes to the consolidated financial statements for the year ended March 31, 2019
1. General information
PTC India Financial Services Limited (“PFS”) (“the Company”) is a registered Non-banking finance company (NBFC) with Reserve Bank of India (RBI) and has been awarded the Infrastructure Finance Company (IFC) status by RBI. PFS is set up with an objective to provide total financing solutions to the energy value chain which includes investing in equity or extending debt to Road infrastructure projects, power projects in generation, transmission, distribution, fuel resources and fuel related infrastructure.
The Company’s registered office and principal place of business is situated at 7th Floor, Telephone Exchange Building, 8 Bhikaji Cama Place, New Delhi - 110066. The shares of the Company are listed on the National Stock Exchange of India Limited and the Bombay Stock Exchange.
The financial statements for the year ended March 31, 2019 are approved by the Board of Directors on May 04, 2019.
1A. Basis of preparation and presentation
i. Statement of compliance
These financial statements (“the Financial Statements”) are prepared in accordance with the Indian Accounting Standards (‘Ind AS’) as notified by Ministry of Corporate Affairs (‘MCA’) under Section 133 of the Companies Act, 2013 (‘Act’) read with the Companies (Indian Accounting Standards) Rules, 2015, as amended and other relevant provisions of the Act. The Company has uniformly applied the accounting policies for the periods presented in this financial statements.
ii. Accounting convention
The financial statements have been prepared on the historical cost basis except for certain financial instruments that are measured at fair values at the end of each reporting period, as explained in the accounting policies below. Historical cost is generally based on the fair value of the consideration given in exchange for goods and services.
iii. Going concern
The board of directors have considered the financial position of the Company as at March 31, 2019 and the projected cash flows and financial performance of the Company for at least twelve months from the date of approval of these financial statements as well as planned cost and cash improvement actions, and believe that the plan for sustained profitability remains on course.
The board of directors have taken actions to ensure that appropriate long-term cash resources are in place at the date of signing the accounts to fund the Company’s operations.
iv. Use of estimates and judgements
The preparation of financial statements in conformity with Ind AS requires management to make judgements, estimates and assumptions that affect the application of accounting policies and the reported amount of assets, liabilities, income, expenses and disclosures of contingent liabilities at the date of these financial statements and the reported amount of revenues and expenses for the years presented. Actual results may differ from the estimates.
Estimates and underlying assumptions are reviewed at each balance sheet date. Revisions to accounting estimates are recognised in the period in which the estimates are revised and future periods affected.
In particular, information about significant areas of estimation uncertainty and critical judgements in applying accounting policies that have the most significant effect on the amounts recognised in the financial statements are included in the note 2 of the financial statements.
1B. Significant Accounting Policies
The financial statements have been prepared using the significant accounting policies and measurement bases summarised as below. These policies are applied consistently for all the periods presented in the financial statements, except where the Company has applied certain accounting policies and exemptions upon transition to Ind AS.
a) Revenue recognition
Interest and processing fee income on loans
Interest and processing fee income is recorded on accrual basis using the effective interest rate (EIR) method in accordance with Ind AS 109. Additional interest/overdue interest/penal charges, if any, are recognised only when it is reasonable certain that the ultimate collection will be made.
Commission income
Income from business correspondent services is recognised as and when the services are rendered as per agreed terms and conditions of the contract.
Dividend income
Dividend income is recognised at the time when the right to receive is established by the reporting date.
Sale of power
Revenue from power supply is accounted on accrual basis.
Miscellaneous income
All other income is recognized on an accrual basis, when there is no uncertainty in the ultimate realization/collection.

147
b) Leasing
The Company as a lessee
At the inception of each lease, the lease arrangement is classified as either a finance lease or an operating lease, based on the substance of the lease arrangement.
Finance leases
Assets leased by the Company in its capacity as lessee where substantially all the risks and rewards of ownership vest in the Company are classified as finance leases. A finance lease is recognized as an asset and a liability at the commencement of the lease, at the lower of the fair value of the asset and the present value of the minimum lease payments.
Minimum lease payments made under finance leases are apportioned between finance charges and reduction of the lease liability. The Finance expense is allocated to each period during the lease term so as to produce a constant periodic rate of interest on the remaining balance of the liability.
A leased asset is depreciated over the useful life of the asset. However, if there is no reasonable certainty that the Company will obtain ownership by the end of the lease term, the asset is depreciated over the shorter of the estimated useful life of the asset and the lease term.
Operating leases
Leases in which the lessor does not transfer substantially all the risks and rewards of ownership of an asset to the lessee are classified as operating leases. Lease rental are charged to statement of profit and loss.
c) Foreign currencies
Functional and presentation currency
Items included in the financial statement of the Company are measured using the currency of the primary economic environment in which the entity operates (‘the functional currency’). The financial statements have been prepared and presented in Indian Rupees (INR), which is the Company’s functional and presentation currency.
Transactions and balances
Foreign currency transactions are translated into the functional currency, by applying the exchange rates on the foreign currency amounts at the date of the transaction. Foreign currency monetary items outstanding at the balance sheet date are converted to functional currency using the closing rate. Non-monetary items denominated in a foreign currency which are carried at historical cost are reported using the exchange rate at the date of the transaction.
Exchange differences arising on monetary items on settlement, or restatement as at reporting date, at rates different from those at which they were initially recorded, are recognized in the Statement of Profit and Loss in the year in which they arise.
Transition to Ind AS
The Company has elected to exercise the option for accounting for exchange differences arising from translation of long-term foreign currency monetary items recognised in the financial statements for the period ending immediately before the beginning of the first Ind AS financial reporting period as per the previous GAAP.
d) Borrowing costs
Borrowing costs directly attributable to the’ acquisition, construction or production of qualifying assets, which are assets that necessarily take a substantial period of time to get ready for their intended use or sale, are added to the cost of those assets, until such time as the assets are substantially ready for their intended use or sale.
All other borrowing costs are recognised in profit or loss in the period in which they are incurred.
e) Employee benefits
Short-term employee benefits
Short-term employee benefits including salaries, short term compensated absences (such as a paid annual leave) where the absences are expected to occur within twelve months after the end of the period in which the employees render the related service, profit sharing and bonuses payable within twelve months after the end of the period in which the employees render the related services and non-monetary benefits for current employees are estimated and measured on an undiscounted basis.
Other long-term employee benefit obligations
Liabilities for leave encashment and compensated absences which are not expected to be settled wholly within the operating cycle after the end of the period in which the employees render the related service are measured at the present value of the estimated future cash outflows which is expected to be paid using the projected unit credit method. The benefits are discounted using the market yields at the end of the reporting period on Government bonds that have terms approximating to the terms of the related obligation. Re-measurements as a result of experience adjustments and changes in actuarial assumptions are recognised in profit or loss.
Post-employment benefit plans are classified into defined contribution plans and defined benefits plans as under:
Defined contribution plans
The Company has a defined contribution plans namely provident fund, pension fund and employees state insurance scheme. The contribution made by the Company in respect of these plans are charged to the Statement of Profit and Loss.

148
Defined benefit plans
The Company has an obligation towards gratuity and post medical retirement benefit, a defined benefit retirement plan covering eligible employees. Where in the employee will receive on retirement is defined by reference to employee’s length of service and last drawn salary. Under the defined benefit plans, the amount that an employee will receive on retirement is defined by reference to the employee’s length of service and final salary. The legal obligation for any benefits remains with the Company, even if plan assets for funding the defined benefit plan have been set aside. The liability recognised in the statement of financial position for defined benefit plans is the present value of the Defined Benefit Obligation (DBO) at the reporting date less the fair value of plan assets, if any. Management estimates the DBO annually with the assistance of independent actuaries. Actuarial gains/losses resulting from re-measurements of the liability/asset are included in other comprehensive income.
Other long-term employee benefits
The Company also provides the benefit of compensated absences to its employees which are in the nature of long-term employee benefit plan. Liability in respect of compensated absences becoming due and expected to availed after one year from the Balance Sheet date is estimated in the basis of an actuarial valuation performed by an independent actuary using the projected unit credit method as on the reporting date. Actuarial gains and losses arising from past experience and changes in actuarial assumptions are charged to Statement of Profit and Loss in the year in which such gains or losses are determined.
f) Taxation
Tax expense recognized in Statement of Profit and Loss comprises the sum of deferred tax and current tax except to the extent it recognized in other comprehensive income or directly in equity.
Current tax comprises the tax payable or receivable on taxable income or loss for the year and any adjustment to the tax payable or receivable in respect of previous years. Current tax is computed in accordance with relevant tax regulations. The amount of current tax payable or receivable is the best estimate of the tax amount expected to be paid or received after considering uncertainty related to income taxes, if any. Current income tax relating to items recognised outside profit or loss is recognised outside profit or loss (either in other comprehensive income or in equity).
Current tax assets and liabilities are offset only if there is a legally enforceable right to set off the recognised amounts, and it is intended to realise the asset and settle the liability on a net basis or simultaneously.
Minimum alternate tax (‘MAT’) credit entitlement is recognised as an asset only when and to the extent there is convincing evidence that normal income tax will be paid during the specified period. In the year in which MAT credit becomes eligible to be recognised as an asset, the said asset is created by way of a credit to the Statement of Profit and Loss and shown as MAT credit entitlement. This is reviewed at each balance sheet date and the carrying amount of MAT credit entitlement is written down to the extent it is not reasonably certain that normal income tax will be paid during the specified period.
Deferred tax is recognised in respect of temporary differences between carrying amount of assets and liabilities for financial reporting purposes and corresponding amount used for taxation purposes. Deferred tax assets are recognised on unused tax loss, unused tax credits and deductible temporary differences to the extent it is probable that the future taxable profits will be available against which they can be used. This is assessed based on the Company’s forecast of future operating results, adjusted for significant non-taxable income and expenses and specific limits on the use of any unused tax loss. Unrecognised deferred tax assets are re-assessed at each reporting date and are recognised to the extent that it has become probable that future taxable profits will allow the deferred tax asset to be recovered.
Deferred tax assets and liabilities are measured at the tax rates that are expected to apply in the year when the asset is realised or the liability is settled, based on tax rates (and tax laws) that have been enacted or substantively enacted at the reporting date. The measurement of deferred tax reflects the tax consequences that would follow from the manner in which the Company expects, at the reporting date to recover or settle the carrying amount of its assets and liabilities. Deferred tax assets and liabilities are offset only if there is a legally enforceable right to set off the recognised amounts, and it is intended to realise the asset and settle the liability on a net basis or simultaneously. Deferred tax relating to items recognised outside statement of profit and loss is recognised outside statement of profit or loss (either in other comprehensive income or in equity).
Current and deferred tax for the year
Current and deferred tax are recognised in profit or loss, except when they relate to items that are recognised in other comprehensive income or directly in equity, in which case, the current and deferred tax are also recognised in other comprehensive income or directly in equity respectively
g) Property, plant and equipment
Recognition and initial measurement
Property, plant and equipment are stated at their cost of acquisition. The cost comprises purchase price, borrowing cost if capitalization criteria are met and directly attributable cost of bringing the asset to its working condition for the intended use. Any trade discount and rebates are deducted in arriving at the purchase price. Subsequent costs are included in the asset’s carrying amount or recognised as a separate asset, as appropriate, only when it is probable that future economic benefits associated with the item will flow to the Company. All other repair and maintenance costs are recognised in statement of profit or loss as incurred.
Subsequent costs are included in the asset’s carrying amount or recognised as a separate asset, as appropriate, only when it is probable that future economic benefits associated with the item will flow to the Company and the cost of the item can be measured reliably. All other repair and maintenance costs are recognised in statement of profit or loss as incurred.
Subsequent measurement (depreciation method, useful lives and residual value)
Property, plant and equipment are subsequently measured at cost less accumulated depreciation and impairment losses. Depreciation on property, plant and equipment is provided on the written-down method over the useful life of the assets as prescribed under Part ‘C’ of Schedule II of the Companies Act, 2013.

149
Depreciation is calculated on pro rata basis from the date on which the asset is ready for use or till the date the asset is sold or disposed. Asset costing less than Rs. 5,000 each are fully depreciated in the year of capitalisation.
The residual values, useful lives and method of depreciation are reviewed at the end of each financial year.
De-recognition
An item of property, plant and equipment and any significant part initially recognised is derecognised upon disposal or when no future economic benefits are expected from its use or disposal. Any gain or loss arising on de-recognition of the asset (calculated as the difference between the net disposal proceeds and the carrying amount of the asset) is recognized in the statement of profit and loss, when the asset is derecognised.
h) Intangible assets
Recognition and initial measurement
Intangible assets are stated at their cost of acquisition. The cost comprises purchase price including any import duties and other taxes (other than those subsequently recoverable from taxation authorities), borrowing cost if capitalization criteria are met and directly attributable cost of bringing the asset to its working condition for the intended use.
Subsequent measurement (amortisation method, useful lives and residual value)
Intangible assets are amortised over a period of 3 years from the date when the assets are available for use. The estimated useful life (amortisation period) of the intangible assets is arrived basis the expected pattern of consumption of economic benefits and is reviewed at the end of each financial year and the amortisation period is revised to reflect the changed pattern, if any.
i) Impairment of tangible and intangible assets
At each reporting date, the Company assesses whether there is any indication that an asset may be impaired. If any such indication exists, the Company estimates the recoverable amount of the asset. Recoverable amount is higher of an asset’s net selling price and its value in use. If such recoverable amount of the asset or the recoverable amount of the cash generating unit to which the asset belongs is less than its carrying amount, the carrying amount is reduced to its recoverable amount. The reduction is treated as an impairment loss and is recognised in the Statement of Profit and Loss. If at the reporting date there is an indication that if a previously assessed impairment loss no longer exists, the recoverable amount is reassessed and the asset is reflected at the recoverable amount.
Financial instruments
A Financial instrument is any contract that gives rise to a financial asset of one entity and a financial liability or equity instrument of another entity.
Initial recognition and measurement
Financial assets and financial liabilities are recognised when the Company becomes a party to the contractual provisions of the financial instrument and are measured initially at fair value adjusted for transaction costs.
j) Non-derivative financial assets
Classification of financial assets
Classification of financial assets depends on the nature and purpose of the financial assets and is determined at the time of initial recognition
The Company classifies its financial assets in the following measurement categories:
• those to be measured subsequently at fair value (either through other comprehensive income, or through profit or loss), and
• those measured at amortised cost
The classification depends on the entity’s business model for managing the financial assets and the contractual terms of the cash flows.
A financial asset that meets the following two conditions is measured at amortised cost unless the asset is designated at fair value through profit or loss under the fair value option:
• Business model test : the objective of the Company’s business model is to hold the financial asset to collect the contractual cash flows.
• Cash flow characteristic test : the contractual term of the financial asset give rise on specified dates to cash flows that are solely payments of principal and interest (SPPI) on the principal amount outstanding.
A financial asset that meets the following two conditions is measured at fair value through other comprehensive income unless the asset is designated at fair value through profit or loss under the fair value option:
• business model test : the financial asset is held within a business model whose objective is achieved by both collecting cash flows and selling financial assets.
• cash flow characteristic test : the contractual term of the financial asset gives rise on specified dates to cash flows that are solely payments of principal and interest (SPPI) on the principal amount outstanding.
All other financial assets are measured at fair value through profit or loss.
Subsequent measurement
i. Financial assets carried at amortised cost – a financial asset is measured at the amortised cost if both the following conditions are met:

150
• The asset is held within a business model whose objective is to hold assets for collecting contractual cash flows, and
• Contractual terms of the asset give rise on specified dates to cash flows that are solely payments of principal and interest (SPPI) on the principal amount outstanding.
After initial measurement, such financial assets are subsequently measured at amortised cost using the effective interest rate (EIR) method. Amortised cost is calculated by taking into account any discount or premium on acquisition and fees or costs that are an integral part of the EIR. The EIR amortisation is included in interest income in the Statement of Profit and Loss.
ii. Investments in equity instruments – Investments in equity instruments are measured at fair value through other comprehensive income (FVOCI). Dividends on such investments are recognised in profit or loss unless the dividend clearly represents a recovery of part of the cost of the investment.
iii. Investments security receipts – Investments in security receipts are measured at fair value through profit and loss (FVTPL).
iv. Equity investment in associates- Investments representing equity interest in associates are carried at cost less any provision for impairment. Investments are reviewed for impairment if events or changes in circumstances indicate that the carrying amount may not be recoverable
v. Trade receivables- Trade receivables are recognised initially at fair value and subsequently measured at amortised cost less provision for impairment.
vi. Cash and cash equivalents- In the cash flow statement, cash and cash equivalents includes cash in hand, cheques and drafts in hand, balances with bank and deposits held at call with financial institutions, short-term highly liquid investments with original maturities of three months or less that are readily convertible to known amounts of cash and which are subject to an insignificant risk of changes in value.
All other financial assets are measured at fair value through profit or loss.
k) Impairment of financial assets
Loan assets
The Company follows a ‘three-stage’ model for impairment based on changes in credit quality since initial recognition as summarised below:
• Stage 1 includes loan assets that have not had a significant increase in credit risk since initial recognition or that have low credit risk at the reporting date.
• Stage 2 includes loan assets that have had a significant increase in credit risk since initial recognition but that do not have objective evidence of impairment.
• Stage 3 includes loan assets that have objective evidence of impairment at the reporting date.
The Expected Credit Loss (ECL) is measured at 12-month ECL for Stage 1 loan assets and at lifetime ECL for Stage 2 and Stage 3 loan assets. ECL is the product of the Probability of Default, Exposure at Default and Loss Given Default, defined as follows:
Probability of Default (PD) - The PD represents the likelihood of a borrower defaulting on its financial obligation (as per “Definition of default and credit-impaired” above), either over the next 12 months (12 months PD), or over the remaining lifetime (Lifetime PD) of the obligation.
Loss Given Default (LGD) – LGD represents the Company’s expectation of the extent of loss on a defaulted exposure. LGD varies by type of counterparty, type and preference of claim and availability of collateral or other credit support.
Exposure at Default (EAD) – EAD is based on the amounts the Company expects to be owed at the time of default. For a revolving commitment, the Company includes the current drawn balance plus any further amount that is expected to be drawn up to the current contractual limit by the time of default, should it occur.
Forward-looking economic information (including management overlay) is included in determining the 12-month and lifetime PD, EAD and LGD. The assumptions underlying the expected credit loss are monitored and reviewed on an ongoing basis.
The Company considers various factors while considering the recoverability of credit impaired advances. These include nature and value of assets, different resolution channels, interest of potential buyers etc. Considering the typical nature of advances given by the Company, there is significant uncertainty and variability in timing of resolution of these advances. In reference to RBI’s prudential norms, the Company does not recognize interest income on these advances on a conservative basis, and the provisioning is considered using current estimate of realization which are based on valuation of security/ collateral as at current date.
Trade receivables
In respect of trade receivables, the Company applies the simplified approach of Ind AS 109, which requires measurement of loss allowance at an amount equal to lifetime expected credit losses. Lifetime expected credit losses are the expected credit losses that result from all possible default events over the expected life of trade receivables.
Other financial assets
In respect of its other financial assets, the Company assesses if the credit risk on those financial assets has increased significantly since initial recognition. If the credit risk has not increased significantly since initial recognition, the Company measures the loss allowance at an amount equal to 12-month expected credit losses, else at an amount equal to the lifetime expected credit losses.
When making this assessment, the Company uses the change in the risk of a default occurring over the expected life of the financial asset. To make that assessment, the Company compares the risk of a default occurring on the financial asset as at the balance sheet date with the risk of a default occurring on the financial asset as at the date of initial recognition and considers reasonable and supportable information, that is available without
151
undue cost or effort, that is indicative of significant increases in credit risk since initial recognition. The Company assumes that the credit risk on a financial asset has not increased significantly since initial recognition if the financial asset is determined to have low credit risk at the balance sheet date.
Write-offs
Financial assets are written off either partially or in their entirety to the extent that there is no realistic prospect of recovery. Any subsequent recoveries are credited to impairment on financial instrument on statement of profit and loss.
De-recognition of financial assets
Financial assets (or where applicable, a part of financial asset or part of a group of similar financial assets) are derecognised (i.e. removed from the Company’s balance sheet) when the contractual rights to receive the cash flows from the financial asset have expired, or when the financial asset and substantially all the risks and rewards are transferred. Further, if the Company has not retained control, it shall also derecognise the financial asset and recognise separately as assets or liabilities any rights and obligations created or retained in the transfer.
l) Non-derivative financial liabilities and equity instruments
Equity instruments
An equity instrument is any contract that evidences a residual interest in the assets of an entity after deducting all of its liabilities.
Financial liabilities
Subsequent measurement
Financial liabilities that are not held-for-trading and are not designated as at FVTPL are measured at amortised cost at the end of subsequent accounting periods. The carrying amounts of financial liabilities that are subsequently measured at amortised cost are determined based on the effective interest method. Interest expense that is not capitalised as part of costs of an asset is included in the ‘Finance costs’ Line item.
The effective interest method is a method of calculating the amortised cost of a financial liability and of allocating interest expense over the relevant period. The effective interest rate is the rate that exactly discounts estimated future cash payments (including all fees and points paid or received that form an integral part of the effective interest rate, transaction costs and other premiums or discounts) through the expected life of the financial liability.
All financial liabilities are subsequently measured at amortised cost using the effective interest method or at FVTPL.
De-recognition of financial liabilities
A financial liability is de-recognised when the obligation under the liability is discharged or cancelled or expires. When an existing financial liability is replaced by another from the same lender on substantially different terms, or the terms of an existing liability are substantially modified, such an exchange or modification is treated as the de-recognition of the original liability and the recognition of a new liability. The difference in the respective carrying amounts is recognised in the Statement of Profit and Loss.
m) Derivative financial instruments
The Company enters into foreign exchange forward contracts and certain other derivative financial instruments to manage its exposure to foreign exchange risks. Further details of derivative financial instruments are disclosed in note 5.
Derivatives are initially recognised at fair value at the date the derivative contracts are entered into and are subsequently re-measured to their fair value at the end of each reporting period. Derivatives are carried as financial assets when the fair value is positive and as financial liabilities when the fair value is negative. The resulting gain or loss is recognised in profit or loss immediately unless the derivative is designated and effective as a hedging instrument which is recognised in other comprehensive income (net of tax) and presented as a separate component of equity which is later reclassified to profit or loss when the hedge item affects profit or loss.
n) Hedge Accounting
Initial and subsequent measurement
The Company uses derivative financial instruments to hedge its foreign currency risks and interest rate risks respectively. Such derivative financial instruments are initially recognised at fair value on the date on which a derivative contract is entered into and are subsequently re-measured at fair value. Derivatives are carried as financial assets when the fair value is positive and as financial liabilities when the fair value is negative.
Any gains or losses arising from changes in the fair value of derivatives are taken directly to profit or loss, except for the effective portion of cash flow hedges, which is recognised in OCI and later reclassified to profit or loss when the hedge item affects profit or loss. For the purpose of hedge accounting, hedges are classified as cash flow hedges where Company hedges its exposure to variability in cash flows that is attributable to foreign currency risk and interest rate risk associated with recognised liabilities in the financial statements.
At the inception of a hedge relationship, the Company formally designates and documents the hedge relationship to which the Company wishes to apply hedge accounting and the risk management objective and strategy for undertaking the hedge. The documentation includes the Company’s risk management objective and strategy for undertaking hedge, the hedging/ economic relationship, the hedged item or transaction, the nature of the risk being hedged, hedge ratio and how the entity will assess the effectiveness of changes in the hedging instrument’s fair value in offsetting the exposure to changes in the hedged item’s cash flows attributable to the hedged risk. Such hedges are expected to be highly effective in achieving offsetting changes in cash flows and are assessed on an ongoing basis to determine that they continue to be highly effective throughout the financial reporting periods for which they are designated.
152
Accounting for cash flow hedges
The effective portion of the gain or loss on the hedging instrument is recognised in OCI in the cash flow hedge reserve, while any ineffective portion is recognised immediately in the statement of profit and loss.
The Company uses swaps as to hedge its exposure to foreign currency risk and interest rate risk in respect of certain financial liabilities. The ineffective portion relating to such hedging instruments is recognised in other income or expenses. Amounts recognised as OCI are transferred to profit or loss when the hedged transaction affects profit or loss, such as when the hedged financial income or financial expense is recognised. If the hedging instrument expires or is sold, terminated or exercised, or if its designation as a hedge is revoked, or when the hedge no longer meets the criteria for hedge accounting, any cumulative gain or loss previously recognised in OCI remains separately in equity until the expected future cash flows occur.
o) Offsetting of financial instruments
Financial assets and financial liabilities are offset and the net amount is reported in the balance sheet if there is a currently enforceable legal right to offset the recognised amounts and there is an intention to settle on a net basis, to realise the assets and settle the liabilities simultaneously.
p) Provisions, contingent assets and contingent liabilities
Provisions are recognized only when there is a present obligation, as a result of past events, and when a reliable estimate of the amount of obligation can be made at the reporting date. These estimates are reviewed at each reporting date and adjusted to reflect the current best estimates. Provisions are discounted to their present values, where the time value of money is material.
Contingent liability is disclosed for:
• Possible obligations which will be confirmed only by future events not wholly within the control of the Company or
• Present obligations arising from past events where it is not probable that an outflow of resources will be required to settle the obligation or a reliable estimate of the amount of the obligation cannot be made.
Contingent assets are neither recognised nor disclosed except when realisation of income is virtually certain, related asset is disclosed.
q) Earnings per share
Basic earnings per share is computed by dividing the profit after tax by the weighted average number of equity shares outstanding during the year/period.
Diluted earnings per share is computed by dividing the profit after tax as adjusted for dividend, interest and other charges to expense or income relating to the dilutive potential equity shares, by the weighted average number of equity shares considered for deriving basic earnings per share and the weighted average number of equity shares which could have been issued on the conversion of all dilutive potential equity shares.
r) Segment reporting
The Company identifies segment basis the internal organization and management structure. The operating segments are the segments for which separate financial information is available and for which operating profit/loss amounts are regularly reviewed by the CODM (‘chief operating decision maker’) in deciding how to allocate resources and in assessing performance. The accounting policies adopted for segment reporting are in line with the accounting policies of the Company. Segment revenue, segment expenses, segment assets and segment liabilities have been identified to segments on the basis of their relationship with the operating activities of the segment.
2. Significant management judgement in applying accounting policies and estimation uncertainty
The preparation of the Company’s financial statements requires management to make judgements, estimates and assumptions that affect the reported amounts of revenues, expenses, assets and liabilities, and the related disclosures. Actual results may differ from these estimates.
Significant management judgements
i. Evaluation of indicators for impairment of loans – The evaluation of applicability of indicators of impairment of assets requires management assessment of several external and internal factors which could result in deterioration of recoverable amount of the assets.
ii. Expected credit loss model (‘ECL’) – The measurement of expected credit loss allowance for financial assets measured at amortised cost requires use of complex models and significant assumptions about future economic conditions and credit behaviour (e.g. likelihood of customers defaulting and resulting losses). The Company makes significant judgements with regard to the following while assessing expected credit loss:
• Determining criteria for significant increase in credit risk;
• Establishing the number and relative weightings of forward-looking scenarios for each type of product/market and the associated ECL; and
• Establishing groups of similar financial assets for the purposes of measuring ECL.
iii. Contingent liabilities – At each balance sheet date basis the management judgment, changes in facts and legal aspects, the Company assesses the requirement of provisions against the outstanding contingent liabilities. However, the actual future outcome may be different from this judgement.
iv. Revenue recognition- Interest income on stressed loans involves management estimates and assumptions in determining both timing and expected realisation from them.
v. Recognition of deferred tax assets – The extent to which deferred tax assets can be recognized is based on an assessment of the probability of the future taxable income against which the deferred tax assets can be utilized.
vi. Fair value measurements – Management applies valuation techniques to determine the fair value of financial instruments (where active market quotes are not available). This involves developing estimates and assumptions consistent with how market participants would price the instrument.

153
vii. Business model assessment - The Company determines the business model at a level that reflects how groups of financial assets are managed together to achieve a particular business objective. This assessment includes judgement reflecting all relevant evidence including how the performance of the assets is evaluated and their performance measured, the risks that affect the performance of the assets and how these are managed and how the managers of the assets are compensated. The Company monitors financial assets measured at amortised cost that are derecognised prior to their maturity to understand the reason for their disposal and whether the reasons are consistent with the objective of the business for which the asset was held. Monitoring is part of the Company’s continuous assessment of whether the business model for which the remaining financial assets are held continues to be appropriate and if it is not appropriate whether there has been a change in business model and so a prospective change to the classification of those assets.
2A. Standards issued but not yet effective
Ind AS 116 ‘Leases’
On March 30, 2019, Ministry of Corporate Affairs (‘MCA’) has clarified that Ind AS 116 is effective for annual periods beginning on or after April 1, 2019 and it replaces Ind AS 17 Leases, including appendices thereto. Ind AS 116 sets out the principles for the recognition, measurement, presentation and disclosure of leases and requires lessees to account for all leases under a single on-balance sheet model similar to the accounting for finance leases under Ind AS 17. The standard includes two recognition exemptions for lessees - leases of ‘low-value’ assets and short-term leases (i.e., leases with a lease term of 12 months or less). At the commencement date of a lease, a lessee will recognise a liability to make lease payments (i.e., the lease liability) and an asset representing the right to use the underlying asset during the lease term (i.e., the right-of-use asset). Lessees will be required to separately recognise the interest expense on the lease liability and the depreciation expense on the right-of-use asset. The Company is evaluating the requirements of the amendment and the effect on the financial statements is being evaluated.
Amendment to Ind AS 12, Income taxes
On March 30, 2019, Ministry of Corporate Affairs (“MCA”) has notified Appendix C to Ind-AS 12 Income taxes – “Uncertainty over Income Tax Treatments”. The amendment to Ind AS 12 requires the entities to consider recognition and measurement requirements when there is uncertainty over income tax treatments. In such a circumstance, an entity shall recognise and measure its current or deferred tax asset or liability accordingly. The effective date of amendment is April 1, 2019. Further, there has been amendments in relevant paragraphs in Ind-AS 12 “Income Taxes” which clarifies that an entity shall recognize the income tax consequences of dividends in profit or loss, other comprehensive income or equity according to where the entity originally recognized those past transactions or events in accordance with Ind-AS 109. The Company is evaluating the requirements of the amendments and their impact on the financial statements.
Amendment to Ind AS 19, Employee benefits
On March 30, 2019, Ministry of Corporate Affairs (“MCA”) has issued an amendment to Ind AS 19 which requires the entities to determine current service cost using actuarial assumptions and net interest using discount rate determined at the start of the annual reporting period. However, if an entity re-measures the net defined benefit liability (asset) as per the requirement of the standard, it shall determine current service cost and net interest for the remainder of the annual reporting period after the plan amendment, curtailment or settlement using the actuarial assumptions used to re-measure the net defined benefit liability (asset). The effective date of amendment is April 1, 2019. The Company is evaluating the requirements of the amendments and their impact on the financial statements.
Amendment to Ind AS 109, Financial instruments
On March 30, 2019, Ministry of Corporate Affairs (“MCA”) issued an amendment to Ind-AS 109 in respect of prepayment features with negative compensation, which amends the existing requirements in Ind-AS 109 regarding termination rights in order to allow measurement at amortized cost (or, depending on the business model, at fair value through other comprehensive income) even in the case of negative compensation payments. This amendment is effective for annual periods beginning on or after April 1, 2019. The Company is evaluating the requirements of the amendments and their impact on the financial statements.
Amendment to Ind AS 23, Borrowing costs
On March 30, 2019, Ministry of Corporate Affairs (“MCA”) issued an amendment to Ind-AS 23 “Borrowing Costs” clarifies that if any specific borrowing remains outstanding after the related asset is ready for its intended use or sale, that borrowing becomes part of the funds that an entity borrows generally when calculating the capitalization rate on general borrowings. This amendment is effective for annual periods beginning on or after April 1, 2019. The Company is evaluating the requirements of the amendments and their impact on the financial statements.
154
3 Cash and cash equivalents As at March 31, 2019
As at March 31, 2018
As at April 1,2017
Cash on hand 0.03 - 0.06 Balances with banks: - in current accounts 2,608.97 4,703.68 2,256.07 - in deposit accounts 614.49 626.31 588.32 Cheques or drafts on hand - - 119.40
3,223.49 5,329.99 2,963.85
4 Other Bank balance As at March 31, 2019
As at March 31, 2018
As at April 1,2017
Balances with banks- - in earmarked accounts i. Unclaimed share application money lying in escrow account - 1.77 1.82 ii. Unclaimed interest on debentures 621.36 456.34 567.81 iii. Unclaimed dividend 46.88 34.59 18.31
668.24 492.70 587.94
5 Derivative financial instruments
The Company enters into derivatives for risk management purposes. The Company has various derivative (i.e. cross currency interest rate swaps, call spread and cap spread options) contract which are entered into as an economic hedge of the for foreign currency and interest rate risks of the Company. The Com-pany has designated cross currency swap contracts under cash flow hedge relationship. The table below shows the fair values of derivative financial instruments recorded as assets or liabilities together with their notional amounts. The notional amounts indicate the value of transactions outstanding at the year end and are not indicative of either the market risk or credit risk.
As at March 31, 2019 As at March 31, 2018 As at April 1, 2017
Notional amounts
Fair Value - Assets
Fair Value - Liabilities
Notional amounts
Fair Value - Assets
Fair Value - Liabilities
Notional amounts
Fair Value - Assets
Fair Value - Liabilities
Currency derivatives
- Currency and interest rate swaps
11,706.18 - 23.00 12,688.69 - 758.22 13,114.00 - 906.54
- Call spread option 25,440.49 1,782.20 - 29,773.54 2,103.13 - 35,756.87 2,432.08 -
- Cap spread option 215.02 - 397.55 - 279.10 -
Total derivatives 1,997.22 23.00 2,500.68 758.22 2,711.18 906.54
Included in above are derivatives held for hedging and risk management purposes as follows:
Cash flow hedging:
- Currency and interest rate swaps
11,706.18 - 23.00 12,688.69 - 758.22 13,114.00 - 906.54
Undesignated derivatives - 1,997.22 - - 2,500.68 - - 2,711.18 -
Total derivative financial instruments
1,997.22 23.00 2,500.68 758.22 2,711.18 906.54
PTC India Financial Services LimitedNotes to the consolidated financial statements for the year ended March 31, 2019
(All amounts in Lakha of r unless otherwuse stated)

155
5.1 Hedging activities and derivatives
The Company is exposed to foreign currency risks relating to its ongoing business operations. The primary risks managed using derivative instruments are foreign currency risk and interest rate risk. Currency and interest rate swap contract meets the hedge accounting criteria as per Ind AS 109 and has been ac-counted as cash flow hedge. The Company has designated this contract in cash flow hedge relationship from January 1, 2019.
(a) Disclosure of effects of hedge accounting on financial performance For the year ended March 31, 2019
Type of hedge and risks Change in the value of hedging instrument gain/ (loss)
Hedge ineffectiveness recognised in statement of profit or loss
Amount reclassified from cash flow hedging reserve to profit or loss
Line item affected in state-ment of profit and loss because of reclassification and hedge ineffectiveness
Cash flow hedgeForeign currency and interest rate risk(i) Currency and interest rate swap (401.50) 77.89 (163.60) Gain/ (loss) on fair value
changes and loss/ amortisa-tion of foreign currency transaction/ translation
Hedge effectiveness is determined at the inception of the hedge relationship, and through periodic prospective effectiveness assessment to ensure that an economic relationship exists between the hedged item and hedging instrument.
For derivative contracts, hedge effectiveness is measured using hypothetical derivative method. Ineffectiveness is measured by comparing the change in the fair value of the actual derivative i.e. currency and interest rate swap contracts designated as the hedging instrument and the change in the fair value of a hypothetical derivative representing the hedged item i.e. foreign currency loan. Hypothetical derivative matches the critical terms i.e. maturity date, currency and amount of foreign currency loan.
(b) Movements in cash flow hedging reserveParticulars Amount As at March 31, 2018 - Add: Changes in fair value of derivative contracts- gain/ (loss) (401.50)Less: Amount reclassified to profit or loss (163.60)Less: Deferred tax relating to above (net) (83.13)As at March 31, 2019 (154.77)
5.2 Derivatives not designated as hedging instruments
The Company uses currency and interest rate swaps and Call and Cap spread options to manage its interest rate risk and currency risk arising from USD denominated borrowings. The currency and interest rate call and cap spread options are not designated in a hedging relationship.
6 Trade receivables As at March 31, 2019
As at March 31, 2018
As at April 1,2017
Trade receivables Unsecured, considered good 447.81 565.71 567.22 Which have significant increase in credit risk 491.01 - -
938.82 565.71 567.22 Less: Allowance for impairment loss allowance 77.68 - -
861.14 565.71 567.22
(i) All amounts are short-term. The net carrying amount of trade receivables is considered a reasonable approximation of their fair value.
(ii) Age of receivables :
Particulars As at March 31, 2019
As at March 31, 2018
As at April 1,2017
Within the credit period - - - Up to 180 days past due 305.87 565.71 567.22 More than 180 days 555.27 - -
861.14 565.71 567.22

156
7 Loans As at March 31, 2019
As at March 31, 2018
As at April 1,2017
At amortised cost
(i) Term loans* 1,337,429.41 1,286,827.65 1,066,353.15
(ii) Loans to employees 39.92 17.10 17.54
Total - Gross 1,337,469.33 1,286,844.75 1,066,370.69
Less: Impairment loss allowance 73,024.10 106,210.65 47,164.56
Total - Net 1,264,445.23 1,180,634.10 1,019,206.13
(i) Secured by tangible assets (property, plant and equipment including land and building)** 1,277,449.89 1,244,340.48 1,066,369.53
(ii) Covered by bank and government guarantee 60,015.00 42,500.00 -
(iii) Unsecured 4.44 4.27 0.16
Total - Gross 1,337,469.33 1,286,844.75 1,066,369.69
Less: Impairment loss allowance 73,024.10 106,210.65 47,164.56
Total - Net 1,264,445.23 1,180,634.10 1,019,205.13
Loans in India***
(i) Public sector 199,623.01 143,194.32 93,915.71
(ii) Others 1,137,846.32 1,143,650.43 972,454.98
Total - Gross 1,337,469.33 1,286,844.75 1,066,370.69
Less: Impairment loss allowance 73,024.10 106,210.65 47,164.56
Total - Net 1,264,445.23 1,180,634.10 1,019,206.13
* Includes interest accrued ** Based on the net book value of the tangible assets provided as security. *** The Company does not hold any loans outside India The net carrying amount of loans is considered a reasonable approximation of their fair value. Refer note 45 A on credit risk
8 Investments As at March 31, 2019 As at March 31, 2018 As at April 1, 2017Fair value through
statement of profit and loss
At fair value
through other com-prehensive
income
At cost Total Fair value through
statement of profit and loss
At fair value
through other com-prehensive
income
At cost Total Fair value
through state-
ment of profit
and loss
At fair value
through other com-prehensive
income
At cost Total
Investments in India
Investment in associates(a) Investment in equity instruments
61,121,415 (March 31, 2018: 61,121,415; April 1, 2017: 61,121,415) equity shares of Rs. 10 held in R.S. India Wind Energy Private Limited
- - 4,737.33 4,737.33 - - 4,737.33 4,737.33 - - 4,737.33 4,737.33
4,390,000 (March 31, 2018:4,390,000; April 1, 2017: 4,390,000) equity shares of Rs.10 held in Varam Bio Energy Private Limited
- - - - - - - - - - - -
(b) Investment in optionally convertible debentures
90 (March 31, 2018: 90; April 1, 2017: 90) optionally convertible debentures of Rs. 10 held in Varam Bio Energy Private Limited
- - 428.58 428.58 - - 428.58 428.58 - - 428.58 428.58
Total Investment in associ-ates (A)
5,165.91 5,165.91 5,165.91 5,165.91 5,165.91 5,165.91
Less: Allowance for Impair-ment Loss (B)
5,165.91 5,165.91 5,165.91 5,165.91 5,165.91 5,165.91
Total Net C= (A)-(B) - - - - - - - - - - - -

157
Other investments
Investments As at March 31, 2019 As at March 31, 2018 As at April 1, 2017
Fair value
through state-
ment of profit
and loss
At fair value
through other
compre-hensive income
At cost Total Fair value
through state-
ment of profit
and loss
At fair value
through other
compre-hensive income
At cost Total Fair value
through state-
ment of profit
and loss
At fair value
through other
compre-hensive income
At cost Total
Investment in equity instruments
(a) Investment in other companies (Refer Note (i) below)
133,385,343 (March 31, 2018: 133,385,343; April 1, 2017: 133,385,343) equity shares of Rs. 10 held in East Coast Energy Private Limited
- - - - - 3,241.26 - 3,241.26 - 11,311.07 - 11,311.07
8,180,000 (31 March 2018: 9,740,000; 1 April 2017: 9,740,000) equity shares of Rs. 10 held in Adhunik Power and Natural Resources Limited
- - - - - 117.29 - 117.29 - 117.29 - 117.29
39,831,212 (March 31, 2018: 39,831,212; April 1, 2017: Nil) equity shares of Rs. 10 held in Athena Chattisgarh Power Limited
- - - - - - - - - - - -
Investment in security receipts
307,470 (March 31, 2018: 294,270; April 1, 2017: Nil) security receipts Rs.1000 each held in Edelweiss As-sets Reconstruction Co Ltd - Adhunik Power and Natural Resources Limited
3,043.68 - - 3,043.68 2,942.70 - - 2,942.70 - - - -
233,750 (March 31, 2018: Nil; April 1, 2017: Nil) security re-ceipts of Rs. 1000 each held in Phoenix ARC Pvt Ltd-Raigarh Cham-pa Rail Infrastructure Private Limited
1,753.13 - - 1,753.13 - - - - - - - -
552,500 (March 31, 2018: Nil; April 1, 2017: Nil) security receipts of Rs. 1000 each held in Phoenix ARC Pvt Ltd-Sispara Renewable Pvt Ltd
4,790.18 - - 4,790.18 - - - - - - - -
Total other Investments (A) 9,586.99 - - 9,586.99 2,942.70 3,358.55 - 6,301.25 - 11,428.36 - 11,428.36
Less: Allowance for Impairment Loss (B)
- - - - - - - - - - - -
Total Net C= (A)-(B) 9,586.99 - - 9,586.99 2,942.70 3,358.55 - 6,301.25 - 11,428.36 - 11,428.36
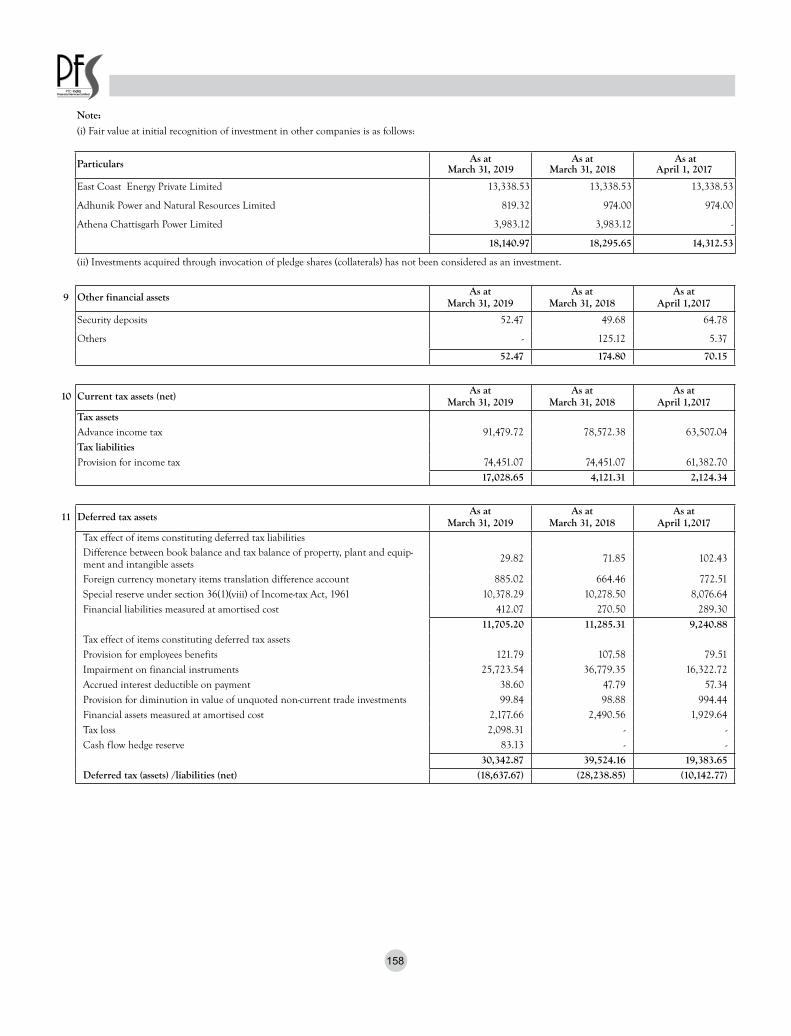
158
Note:
(i) Fair value at initial recognition of investment in other companies is as follows:
Particulars As at March 31, 2019
As at March 31, 2018
As at April 1, 2017
East Coast Energy Private Limited 13,338.53 13,338.53 13,338.53
Adhunik Power and Natural Resources Limited 819.32 974.00 974.00
Athena Chattisgarh Power Limited 3,983.12 3,983.12 -
18,140.97 18,295.65 14,312.53
(ii) Investments acquired through invocation of pledge shares (collaterals) has not been considered as an investment.
9 Other financial assets As at March 31, 2019
As at March 31, 2018
As at April 1,2017
Security deposits 52.47 49.68 64.78
Others - 125.12 5.37
52.47 174.80 70.15
10 Current tax assets (net) As at March 31, 2019
As at March 31, 2018
As at April 1,2017
Tax assetsAdvance income tax 91,479.72 78,572.38 63,507.04 Tax liabilitiesProvision for income tax 74,451.07 74,451.07 61,382.70
17,028.65 4,121.31 2,124.34
11 Deferred tax assets As at March 31, 2019
As at March 31, 2018
As at April 1,2017
Tax effect of items constituting deferred tax liabilitiesDifference between book balance and tax balance of property, plant and equip-ment and intangible assets 29.82 71.85 102.43
Foreign currency monetary items translation difference account 885.02 664.46 772.51 Special reserve under section 36(1)(viii) of Income-tax Act, 1961 10,378.29 10,278.50 8,076.64 Financial liabilities measured at amortised cost 412.07 270.50 289.30
11,705.20 11,285.31 9,240.88 Tax effect of items constituting deferred tax assetsProvision for employees benefits 121.79 107.58 79.51 Impairment on financial instruments 25,723.54 36,779.35 16,322.72 Accrued interest deductible on payment 38.60 47.79 57.34 Provision for diminution in value of unquoted non-current trade investments 99.84 98.88 994.44 Financial assets measured at amortised cost 2,177.66 2,490.56 1,929.64 Tax loss 2,098.31 - - Cash flow hedge reserve 83.13 - -
30,342.87 39,524.16 19,383.65 Deferred tax (assets) /liabilities (net) (18,637.67) (28,238.85) (10,142.77)

159
Deferred taxes arising from temporary differences for the year ended 31 March 2019 are summarized as follows:
Deferred tax assets/(liabilities) As at April 1, 2018
Recognized in profit or loss
Recognized in other comprehensive
income
As at March 31, 2019
Tax effect of items constituting deferred tax liabilities
Difference between book balance and tax balance of prop-erty, plant and equipment and intangible assets
71.85 (42.03) - 29.82
Foreign currency monetary items translation difference account
664.46 220.56 - 885.02
Special reserve under section 36(1)(viii) of Income-tax Act, 1961
10,278.50 99.79 - 10,378.29
Financial liabilities measured at amortised cost 270.50 141.57 - 412.07
11,285.31 419.89 - 11,705.20
Tax effect of items constituting deferred tax assets
Provision for employees benefits 107.58 12.82 1.39 121.79
Impairment on financial instruments 36,779.35 (11,055.81) - 25,723.54
Accrued interest deductible on payment 47.79 (9.19) - 38.60
Losses/ diminution in associates 98.88 0.96 - 99.84
Financial assets measured at amortised cost 2,490.56 (312.90) - 2,177.66
Tax loss - 2,098.31 - 2,098.31
Cash flow hedge reserve - - 83.13 83.13
39,524.16 (9,265.81) 84.52 30,342.87
Deferred tax (assets) /liabilities (net) (28,238.85) 9,685.70 (84.52) (18,637.67)
Deferred taxes arising from temporary differences for the year ended 31 March 2018 are summarized as follows:
Deferred tax assets/(liabilities) As at April 1, 2017
Recognized in profit or loss
Recognized in other comprehensive
income
As at March 31, 2018
Tax effect of items constituting deferred tax liabilities
Difference between book balance and tax balance of prop-erty, plant and equipment and intangible assets
102.43 (30.58) - 71.85
Foreign currency monetary items translation difference account
772.51 (108.05) - 664.46
Special reserve under section 36(1)(viii) of Income-tax Act, 1961
8,076.64 2,201.86 - 10,278.50
Financial liabilities measured at amortised cost 289.30 (18.80) - 270.50
9,240.88 2,044.43 - 11,285.31
Tax effect of items constituting deferred tax assets
Provision for employees benefits 79.51 19.61 8.46 107.58
Impairment on financial instruments 16,322.72 20,456.63 - 36,779.35
Accrued interest deductible on payment 57.34 (9.55) - 47.79
Losses/ diminution in associates 994.44 (895.56) - 98.88
Financial assets measured at amortised cost 1,929.64 560.92 - 2,490.56
19,383.65 20,132.05 8.46 39,524.16
Deferred tax (assets) /liabilities (net) (10,142.77) (18,087.62) (8.46) (28,238.85)

160
12 Property, plant and equipmentDetails of the Company’s property, plant and equipment and their carrying amounts are as follows:
Leasehold improve-
ments
Buildings Plant and equipment
Furniture and fixtures
Computers Vehicles Office equip-ment
Total
Gross carrying amount (at cost)As at April 1, 2017 330.06 11.94 3,522.75 80.35 134.61 37.63 146.17 4,263.51 Additions 126.18 - - 19.87 33.51 - 68.75 248.31 Disposals - - - - 8.29 - 2.15 10.44 As at March 31, 2018 456.24 11.94 3,522.75 100.22 159.83 37.63 212.77 4,501.38 Additions - - - 0.76 34.88 48.00 3.80 87.44 Disposals - - - 0.93 20.30 19.34 6.57 47.14 As at March 31, 2019 456.24 11.94 3,522.75 100.05 174.41 66.29 210.00 4,541.68
Accumulated depreciationAs at April 1, 2017 241.98 3.57 2,286.35 49.36 95.93 28.71 122.92 2,828.82 Charge for the year 59.56 0.41 157.40 9.58 25.36 2.78 18.87 273.96 Adjustments - - - - 2.61 - 1.67 4.28 As at March 31, 2018 301.54 3.98 2,443.75 58.94 118.68 31.49 140.12 3,098.50 Charge for the year 41.90 0.39 137.36 10.68 33.49 2.44 32.31 258.57 Adjustments - - - 0.82 19.08 17.80 4.91 42.61 As at March 31, 2019 343.44 4.37 2,581.11 68.80 133.09 16.13 167.52 3,314.46
Carrying amountAs at April 1, 2017 88.08 8.37 1,236.40 30.99 38.68 8.92 23.25 1,434.69 As at March 31, 2018 154.70 7.96 1,079.00 41.28 41.15 6.14 72.65 1,402.88 As at March 31, 2019 112.80 7.57 941.64 31.25 41.32 50.16 42.48 1,227.22 (i) Refer note 41 for information on property, plant and equipment pledged as security by the Company.
13 Capital work-in-progress As at March 31, 2019
As at March 31, 2018
As at April 1,2017
Capital work in progress - 5.74 5.74
- 5.74 5.74
14 Intangible asset Computer software Total
Gross carrying amount (at cost)
As at April 1, 2017 259.43 259.43 Additions 4.30 4.30
Disposals - -
As at March 31, 2018 263.73 263.73 Additions 1.44 1.44
Disposals - - As at March 31, 2019 265.17 265.17
Accumulated depreciation
As at April 1, 2017 195.13 195.13 Charge for the year 51.91 51.91
Adjustments - -
As at March 31, 2018 247.04 247.04 Charge for the year 14.08 14.08
Adjustments - -
As at March 31, 2019 261.12 261.12
Carrying amount
As at April 1, 2017 64.30 64.30 As at March 31, 2018 16.69 16.69 As at March 31, 2019 4.05 4.05

161
15 Other non-financial assets As at 31 March 2019
As at 31 March 2018
As at 1 April 2017
Capital advances 1,538.84 1538.75 509.44 Prepaid expenses 37.80 87.13 71.74 Balances with government authorities 3.08 94.91 5.42 Advance to employees - 8.74 5.70 Other receivables - - 40.17
1,579.72 1,729.53 632.47
16 Debt securities As at March 31, 2019
As at March 31, 2018
As at April 1,2017
At amortised cost
Unsecured
Commercial paper - 39,527.48 79,376.30
Secured
Infrastructure bonds (i) 14,085.66 14,960.53 16,914.19
Debentures (ii) 39,143.78 43,560.92 44,977.69
Total 53,229.44 98,048.93 141,268.18
Debt securities in India 20,081.72 61,982.22 105,282.57
Debt securities outside India 33,147.72 36,066.71 35,985.61
53,229.44 98,048.93 141,268.18
(i) Infrastructure bonds52,295 (March 31, 2018: 55,197) privately placed 8.25%/8.30% secured redeemable non-convertible long-term infrastructure bonds of Rs 5,000 each (Infra Series 1) amounting to Rs 2,614.75 lakhs (March 31, 2018: Rs. 2,759.85 lakhs) allotted on March 31, 2011 redeemable at par in 5 to 10 years commenced from March 31, 2016 are secured by way of first charge on the receivables of the assets created from the proceeds of infrastructure bonds and other un-encumbered receivables of the Company to provide 100% security coverage. During the year, the company has repaid Rs 145.10 lakhs (March 31, 2018: Rs. 248.50 lakhs) under buyback scheme exercised by eligible holders of infrastructure bonds in financial year 2018-19 as per terms of Infra Series 1. 229,460 (March 31, 2018: 245,685) privately placed 8.93%/9.15% secured redeemable non-convertible long-term infrastructure bonds of Rs 5,000 each (Infra Series 2) amounting to Rs 11,473.00 lakhs (March 31, 2018: Rs. 12,284.25 lakhs) allotted on March 30, 2012 redeemable at par in 5 to 15 years commencing from March 30, 2017 are secured by way of first charge on the receivables of the assets created from the proceeds of infrastructure bonds and other receivables of the Company to provide the 100% security coverage. During the year, the company has repaid Rs. 811.25 lakhs (March 31, 2018: Rs. 1,794.55 lakhs) under buyback scheme exercised by eligible holders of infrastructure bonds in FY2018-19 as per terms of Infra Series 2.
(ii) Debentures
900 (March 31, 2018: 900) privately placed 10.50% secured redeemable non-convertible debentures of Rs. 666,667 (March 31, 2018: Rs. 833,333 each) (Series 3) amounting to Rs.6,000.00 lakhs (March 31, 2018: Rs.7,500.00 lakhs) were allotted on January 27, 2011 redeemable at par in six equal annual instalments commencing from January 26, 2018.
Series 3 debentures are secured by way of mortgage of immovable building and first charge by way of hypothecation of the receivables of the loan assets cre-ated from the proceeds of respective debentures. Further, the same have also been secured by pari-passu charge by way of hypothecation of the receivables of loan assets created by the Company out of its own sources which are not charged to any other lender of the Company to the extent of 125% of debentures.
2,135 (March 31, 2018: 2,135) privately placed 9.62% secured redeemable non-convertible debentures of Rs.1,000,000 each (Series 4) amounting to Rs.21,350.00 lakhs were allotted on June 03, 2015 redeemable at par in 3 tranches divided in 33% of face value on 28th May 2019, 33% of face value on 28th May 2021 and balance 34% of face value on 28th May 2025.
Series 4 debentures are secured by way of first charge by way of hypothecation of the specified receivables of the Company comprising asset cover of at least 110% of the amount of the Debentures
1,500 (March 31, 2018: 1,500) privately placed 9.80% secured redeemable non-convertible debentures of Rs.1,000,000 each (Series 5) amounting to Rs. 12,000.00 lakhs (March 31, 2018: Rs 15,000.00 lakhs)were allotted on June 16, 2015 redeemable at par in five equal annual instalments commencing from June 12, 2018
Series 5 debentures are secured by way of first ranking exclusive charge by way of hypothecation of the identified receivables of the Company comprising asset cover of at least 100% of the amount of the Debentures

162
17 Borrowings (other than debt securities) As at March 31, 2019
As at March 31, 2018
As at April 1,2017
At amortised cost
Secured
Term loans
- from banks (i) 936,120.63 748,671.26 512,776.00
- from financial institutions (ii) 1,02,483.16 176,165.94 156,480.28
Total 1038,603.79 924,837.20 669,256.28
Borrowings in India 1002,120.63 882,687.26 620,776.00
Borrowings outside India 36,483.16 42,149.94 48,480.28
Total 1,038,603.79 924,837.20 669,256.28
(i) Term loans
Term loans from banks carry interest ranging from 8.50% to 9.75% p.a. The loans carry various repayment schedules according to their respective sanctions and thus are repayable in 12 to 48 quarterly instalments. The loans are secured by first pari-passu charge on receivables of loan assets by way of hypothecation (other than assets created/ to be created in favour of specific lenders) so that lenders should have at least 100%/ 111% security coverage on its outstanding loan at all times during the currency of the loan.
(ii) External commercial borrowings
External Commercial Borrowings (“ECB”) carry interest ranging from 3 months LIBOR+1.90% to LIBOR+3.10% p.a. The loans are repayable in 32/36 equal quarterly instalments as per the due dates specified in the respective loan agreements. The borrowings are secured by way of first ranking exclusive charge on all present and future receivables of the eligible loan assets created by the proceeds of ECB. Repayment of 4 ECB loans of which 4 quarterly instalment amount-ing to USD 28,88,888 (Rs. 2,027.64 lakhs) on first ECB loan, 4 quarterly instalment amounting to USD 62,50,000 (Rs. 4,358.19 lakhs) on two of the ECB loans and 4 quarterly instalment amounting to USD 25,00,000 (Rs.1,671.75 lakhs) on another ECB loan was made during the year ended March 31, 2019.
18 Other financial liabilities As at March 31, 2019
As at March 31, 2018
As at April 1,2017
Interest accrued but not due on borrowings
- Term loan 1,581.73 1,019.95 1,547.85
- Debentures 1,162.63 1,278.85 1,305.72
- Infrastructure bonds 8,810.08 7,740.18 7,042.82
Unclaimed dividend 46.88 34.59 18.31
Unclaimed interest on debentures 621.36 456.34 567.81
Unclaimed equity share application money - 1.77 1.82
Deferred processing/upfront fees 1,727.23 2,139.85 2,541.93
Income received in advance 220.33 170.51 141.68
Security deposit from borrowers 5,773.00 - -
19,943.24 12,842.04 13,167.94
19 Provisions As at March 31, 2019
As at March 31, 2018
As at April 1,2017
Gratuity 140.61 130.22 91.86
Compensated absences 178.01 156.47 120.78
Other employees benefits 29.92 24.12 17.11
348.54 310.81 229.75
20 Other non-financial liabilities As at March 31, 2019
As at March 31, 2018
As at April 1,2017
Statutory remittances 186.41 254.02 62.78
186.41 254.02 62.78

163
21 Equity share capital As at March 31, 2019
As at March 31, 2018
As at April 1,2017
Authorised Equity share capital
1,250,000,000 (March 31, 2018: 1,250,000,000) equity shares of Rs.10 each 125,000.00 125,000.00 125,000.00
Authorised Preference share capital
750,000,000 (March 31, 2018: 750,000,000) preference shares of Rs.10 each 75,000.00 75,000.00 75,000.00
Total 200,000.00 200,000.00 200,000.00
Issued, subscribed and paid up Equity share capital
642,283,335 (March 31, 2018: 642,283,335) equity shares of Rs. 10 each fully paid up 64,228.33 64,228.33 64,228.33
64,228.33 64,228.33 64,228.33
Each holder of equity shares is entitled to one vote per share and ranks pari passu. In the event of liquidation of the Company, the holders of equity shares will be entitled to receive any of the remaining assets of the Company after distribution of all preferential amounts. The distribution will be in proportion to the number of equity shares held by the shareholders.
(i) Movement in issued, subscribed and paid up Equity Share Capital
Particulars Equity Share Capital
Number of shares Amount
As at April 1, 2017 6,422,83,335 6,4228.33
Add: Equity shares issued during the year - -
As at March 31, 2018 6,422,83,335 6,4228.33
Add: Equity shares issued during the year - -
As at March 31, 2019 6,422,83,335 6,4228.33
(ii) Shareholders holding more than 5% shares are set out below:
As at March 31, 2019
As at March 31, 2018
As at April 1, 2017
Particulars Number of shares
% Number of shares
% Number of shares
%
PTC India Limited# 417,450,001 64.99 417,450,001 64.99 417,450,001 64.99
New Horizon Opportunities Master Fund - - 37,300,000 5.81
#Holding company by virtue of holding more than one-half of equity share capital.
(iii) The Company has neither issued equity shares pursuant to contract without payment being received in cash nor any bonus shares in the current year and five years immediately preceding the balance sheet date.
22 Other equity
Particulars As at March 31, 2019
As at March 31, 2018
As at April 1,2017
Securities premium account 61,280.57 61,280.57 61,280.57
Statutory reserve (in terms of Section 45-IC of the Reserve Bank of India Act, 1961) 32,862.53 29,179.68 28,685.59
Special reserve (in terms of Section 36(1)(viii) of the Income tax Act, 1961) 29,699.78 29,699.78 23,337.48
Equity instruments through other comprehensive income (18,140.97) (14,937.10) (2,884.17)
Cash flow hedge reserve (154.77) - -
Foreign currency monetary items translation difference account (2,533.57) (1,749.21) (2,744.82)
Retained earnings 39,413.23 26,233.02 54,724.43
Total 142,426.80 129,706.74 162,399.08

164
(i) Securities premium account
Particulars For the year endedMarch 31, 2019
For the year endedMarch 31, 2018
Opening balance 61,280.57 61,280.57
Add: Amount received pursuant to issue of equity shares - -
Closing balance 61,280.57 61,280.57
Securities premium account is used to record the premium on issue of shares. The reserve is utilised in accordance with the provisions of the relevant statutes.
(ii) Statutory reserve (in terms of Section 45-IC of the Reserve Bank of India Act, 1961)
Particulars For the year endedMarch 31, 2019
For the year endedMarch 31, 2018
Opening balance 29,179.68 28,685.59
Add: Transferred from Retained earnings 3,682.85 494.09
Closing balance 32,862.53 29,179.68
This reserve is maintained in accordance with the provisions of Section 45-IC of the Reserve Bank of India Act, 1961.
(iii) Special reserve (in terms of Section 36(1)(viii) of the Income tax Act, 1961)
Particulars For the year endedMarch 31, 2019
For the year endedMarch 31, 2018
Opening balance 29,699.78 23,337.48
Add: Transferred from Retained Earnings - 6,362.30
Closing balance 29,699.78 29,699.78
This reserve is maintained in accordance with the provisions of Section 36(1)(viii) of the Income tax Act, 1961.
(iv) Equity instruments through other comprehensive income
Particulars For the year endedMarch 31, 2019
For the year endedMarch 31, 2018
Opening balance (14,937.10) (2,884.17)
Add: Change in fair value of FVOCI equity investments (3,203.87) (12,052.93)
Add/less: Tax impact - -
Closing balance (18,140.97) (14,937.10)
The Company has elected to recognise changes in fair value of equity investments in other comprehensive income. These changes are accumulated within the “Reserve for equity instruments through other comprehensive income”. The Company transfers amounts from this reserve to retained earnings when the relevant equity securities are derecognised.
(v) Cash flow hedge reserve
Particulars For the year endedMarch 31, 2019
For the year endedMarch 31, 2018
Opening balance - -
Add/(less): MTM of derivatives instruments (237.90) -
Add/less: Tax impact 83.13 -
Closing balance (154.77) -
The Company uses hedging instruments as part of its management of foreign currency risk and interest rate risk associated with its foreign currency borrowings. To the extent these hedges are effective; the change in fair value of the hedging instrument is recognised in the cash flow hedge reserve. Amounts recognised in the cash flow hedge reserve is reclassified to profit or loss when hedged item affects profit or loss.
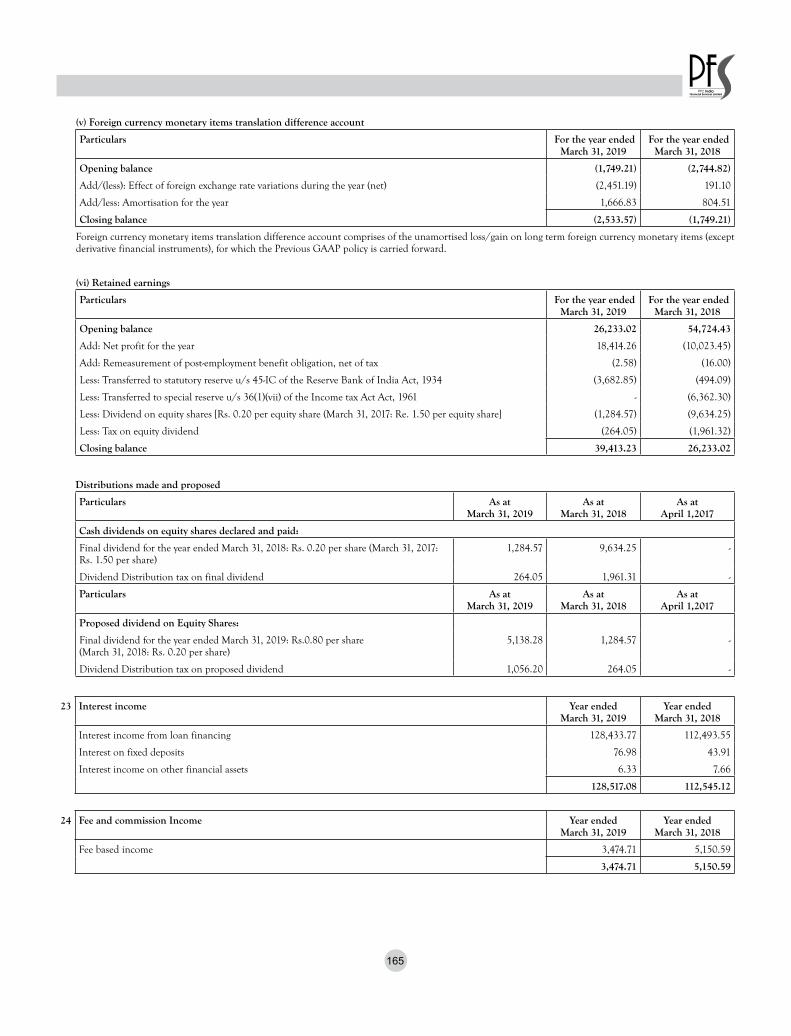
165
(v) Foreign currency monetary items translation difference account
Particulars For the year endedMarch 31, 2019
For the year endedMarch 31, 2018
Opening balance (1,749.21) (2,744.82)
Add/(less): Effect of foreign exchange rate variations during the year (net) (2,451.19) 191.10
Add/less: Amortisation for the year 1,666.83 804.51
Closing balance (2,533.57) (1,749.21)
Foreign currency monetary items translation difference account comprises of the unamortised loss/gain on long term foreign currency monetary items (except derivative financial instruments), for which the Previous GAAP policy is carried forward.
(vi) Retained earnings
Particulars For the year endedMarch 31, 2019
For the year endedMarch 31, 2018
Opening balance 26,233.02 54,724.43
Add: Net profit for the year 18,414.26 (10,023.45)
Add: Remeasurement of post-employment benefit obligation, net of tax (2.58) (16.00)
Less: Transferred to statutory reserve u/s 45-IC of the Reserve Bank of India Act, 1934 (3,682.85) (494.09)
Less: Transferred to special reserve u/s 36(1)(vii) of the Income tax Act Act, 1961 - (6,362.30)
Less: Dividend on equity shares [Rs. 0.20 per equity share (March 31, 2017: Re. 1.50 per equity share] (1,284.57) (9,634.25)
Less: Tax on equity dividend (264.05) (1,961.32)
Closing balance 39,413.23 26,233.02
Distributions made and proposed
Particulars As at March 31, 2019
As at March 31, 2018
As at April 1,2017
Cash dividends on equity shares declared and paid:
Final dividend for the year ended March 31, 2018: Rs. 0.20 per share (March 31, 2017: Rs. 1.50 per share)
1,284.57 9,634.25 -
Dividend Distribution tax on final dividend 264.05 1,961.31 -
Particulars As at March 31, 2019
As at March 31, 2018
As at April 1,2017
Proposed dividend on Equity Shares:
Final dividend for the year ended March 31, 2019: Rs.0.80 per share (March 31, 2018: Rs. 0.20 per share)
5,138.28 1,284.57 -
Dividend Distribution tax on proposed dividend 1,056.20 264.05 -
23 Interest income Year ended March 31, 2019
Year ended March 31, 2018
Interest income from loan financing 128,433.77 112,493.55
Interest on fixed deposits 76.98 43.91
Interest income on other financial assets 6.33 7.66
128,517.08 112,545.12
24 Fee and commission Income Year ended March 31, 2019
Year ended March 31, 2018
Fee based income 3,474.71 5,150.59
3,474.71 5,150.59
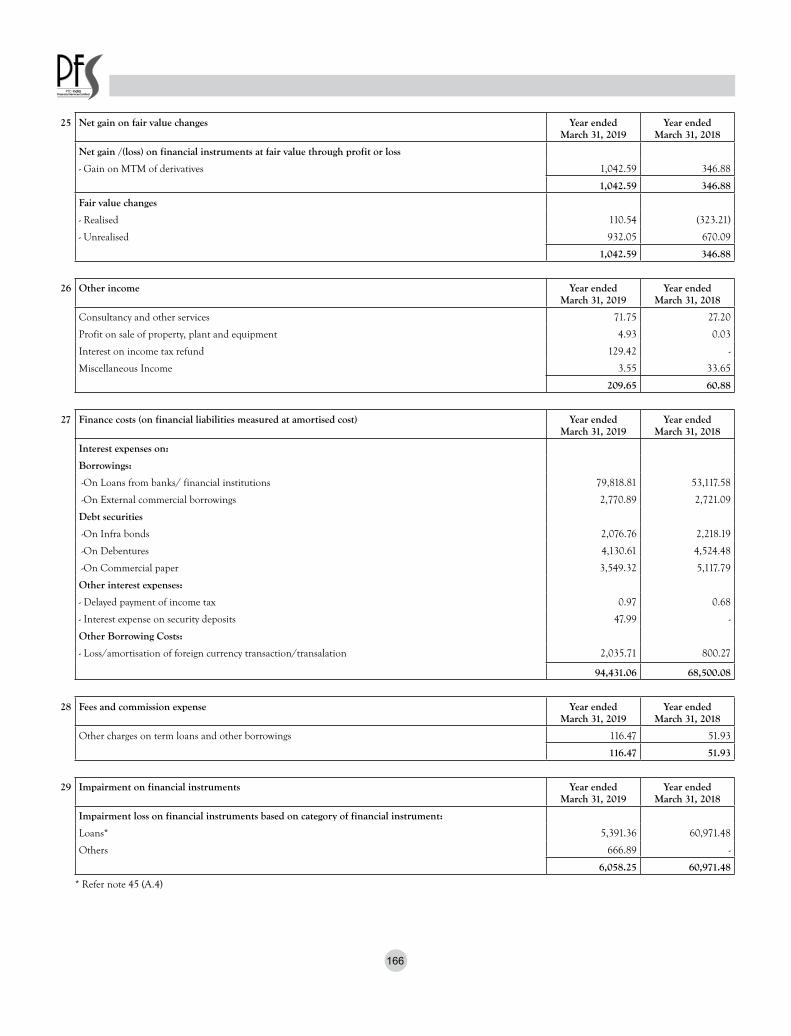
166
25 Net gain on fair value changes Year ended March 31, 2019
Year ended March 31, 2018
Net gain /(loss) on financial instruments at fair value through profit or loss
- Gain on MTM of derivatives 1,042.59 346.88
1,042.59 346.88
Fair value changes
- Realised 110.54 (323.21)
- Unrealised 932.05 670.09
1,042.59 346.88
26 Other income Year ended March 31, 2019
Year ended March 31, 2018
Consultancy and other services 71.75 27.20
Profit on sale of property, plant and equipment 4.93 0.03
Interest on income tax refund 129.42 -
Miscellaneous Income 3.55 33.65
209.65 60.88
27 Finance costs (on financial liabilities measured at amortised cost) Year ended March 31, 2019
Year ended March 31, 2018
Interest expenses on:
Borrowings:
-On Loans from banks/ financial institutions 79,818.81 53,117.58
-On External commercial borrowings 2,770.89 2,721.09
Debt securities
-On Infra bonds 2,076.76 2,218.19
-On Debentures 4,130.61 4,524.48
-On Commercial paper 3,549.32 5,117.79
Other interest expenses:
- Delayed payment of income tax 0.97 0.68
- Interest expense on security deposits 47.99 -
Other Borrowing Costs:
- Loss/amortisation of foreign currency transaction/transalation 2,035.71 800.27
94,431.06 68,500.08
28 Fees and commission expense Year ended March 31, 2019
Year ended March 31, 2018
Other charges on term loans and other borrowings 116.47 51.93
116.47 51.93
29 Impairment on financial instruments Year ended March 31, 2019
Year ended March 31, 2018
Impairment loss on financial instruments based on category of financial instrument:
Loans* 5,391.36 60,971.48
Others 666.89 -
6,058.25 60,971.48
* Refer note 45 (A.4)

167
30 Employees benefit expense Year ended March 31, 2019
Year ended March 31, 2018
Salaries and other allowances 1,241.33 1,306.89
Contribution to provident fund 55.41 54.60
Staff welfare expense 107.65 112.24
1,404.39 1,473.73
31 Depreciation and amortisation expense Year ended March 31, 2019
Year ended March 31, 2018
Depreciation on tangible assets 258.57 273.96
Amortisation on intangible assets 14.08 51.91
272.65 325.87
32 Other expenses Year ended March 31, 2019
Year ended March 31, 2018
Rent 495.43 476.83
Repairs and maintenance
- Plant and equipment 104.52 89.43
- others 106.58 120.24
Insurance 36.96 10.58
Rates and taxes 68.07 68.73
Communication 25.90 23.96
Travelling and conveyance 90.13 63.00
Advertising and business development 57.56 67.71
Donation 0.45 0.25
Corporate Social Responsibility Expenses 916.41 80.90
Legal and professional 1,003.89 887.22
Auditor remuneration:* -
- For statutory audit 22.25 18.00
- For quarterly audit/limited review 18.00 13.50
- For tax audit 2.75 2.50
- For other certification and reporting 17.15 23.15
- For out of pocket expenses 0.49 0.95
Bank charges 1.62 1.34
Directors’ sitting fees 82.84 85.13
Miscellaneous expenses 217.44 201.74
3,268.44 2,235.16
* Includes Rs. 4.00 lakhs (March 31, 2018: Rs. 8.50 lakhs) relating to previous year.

168
33 Income tax expenseIncome tax expense recognised in Statement of profit and loss
Particulars Year ended March 31, 2019
Year ended March 31, 2019
Current tax
In respect of the current year - 13,068.38
- 13,068.38
Deferred tax charge/ (benefits)
In respect of the current year 9,685.70 (18,087.62)
9,685.70 (18,087.62)
The major components of tax expense and the reconciliation of the expected tax expense based on the domestic effective tax rate and the reported tax expense in statement of profit and loss, is as follows:-
Particulars Year ended March 31, 2019
Year ended March 31, 2018
Profit before tax 28,099.96 (15,042.69)
Domestic tax rate 34.944% 34.608%
Expected tax expense [A] 9,819.25 (5,205.97)
Adjustment for tax-exempt income/ non-deductible expenses 121.35 (849.17)
Reversal of deferred tax asset on diminution in value of investment - 895.56
Reversal during tax holiday period (12.99) 171.77
Adjustment for change in tax rate during the year (179.81) -
Others (62.10) (31.43)
Total adjustments [B] (133.55) 186.73
Actual tax expense [C=A+B] 9,685.70 (5,019.24)
Tax expense comprises:
Current tax expense - 13,068.38
Deferred tax credit 9,685.70 (18,087.62)
Tax expense recognized in profit or loss [D] 9,685.70 (5,019.24)
Income tax expense recognized in other comprehensive income
Particulars Year ended March 31, 2019
Year ended March 31, 2018
Income tax relating to cash flow hedge reserve 83.13 -
Income tax relating to remeasurement gains/(losses) on defined benefit plans 1.39 8.46
84.52 8.46
Bifurcation of the income tax recognised in other comprehensive income into:-
Items that will not be reclassified to profit or loss 1.39 8.46
Items that will be reclassified to profit or loss 83.13 -
84.52 8.46
34 Contingent liabilities and commitments
Particulars As at March 31, 2019
As at March 31, 2018
As at April 1,2017
a) In respect of following:
- Income tax matters 3,042.72 3,356.39 3,193.62
b) Commitments
- Loan financing 91,557.44 149,592.00 173,236.00
- Capital commitments 5,150.00 5,150.00 5,150.00
c) Guarantees furnished to bank - 2,500.00 2,500.00
The above matters are subject to legal proceedings in the ordinary course of business. The legal proceeding when ultimately concluded will not, in the opinion of the management, have a material effect on financial position of the Company. Amount above does not include the contingencies the likelihood of which is remote.

169
35 Disclosures required under Section 22 of the Micro, Small and Medium Enterprises Development Act, 2006*
Particulars As at March 31, 2019
As at March 31, 2018
As at April 1,2017
Principal amount remaining unpaid to any supplier as at the end of the accounting year/period.
13.75 13.82 21.70
Interest due thereon remaining unpaid to any supplier as at the end of the accounting year/period.
- - -
The amount of interest paid along with the amounts of the payment made to the sup-plier beyond the appointed day.
- - -
The amount of interest due and payable for the year/period. - - -
The amount of interest accrued and remaining unpaid at the end of the accounting year/period.
- - -
The amount of further interest due and payable even in the succeeding year, until such date when the interest dues as above are actually paid.
- - -
* No interest is payable on outstanding amount.
36 Change in liabilities arising from financing activities
Debt securities Borrowings (Other than debt securities)
Total
As at April 1, 2017 141,268.18 669,256.28 810,524.46
Cash flows:
Proceeds from debt securities/borrowings - 268,199.76 268,199.76
Repayment of debt securities/borrowings (43,543.04) (11,694.13) (55,237.17)
Non-cash:
Foreign currency fluctuation impact - (999.86) (999.86)
Impact of borrowings measured at amortised cost 323.79 75.15 398.94
As at March 31, 2018 98,048.93 924,837.20 1,022,886.13
Cash flows:
Proceeds from debt securities/borrowings - 407,434.65 407,434.65
Repayment of debt securities/borrowings (45,456.36) (293,963.81) (339,420.17)
Non-cash:
Foreign currency fluctuation impact - 743.86 743.86
Impact of borrowings measured at amortised cost 636.87 (448.11) 188.76
As at March 31, 2019 53,229.44 1,038,603.79 1,091,833.23
37 Disclosures under Ind AS 19 (Employee benefits)The details of various employee benefits provided to employees are as under:
Defined contribution plans
Particulars Year ended March 31, 2019
Year ended March 31, 2018
Provident fund 55.41 54.60
Defined benefit plans:The Company has following defined benefit plans for its employees
- Gratuity: The Company has a defined benefit gratuity plan. Every employee is entitled to gratuity as per the provisions of the Payment of Gratuity Act, 1972. The liability of Gratuity is recognized on the basis of actuarial valuation.
- Post-Retirement Medical Benefit: The Company operates post-employment medical benefits scheme. The liability is recognised on the basis of actuarial valuation.

170
These plans typically expose the Company to actuarial risks such as: investment risk, interest rate risk , longevity risk and salary risk
Investment Risk The present value of the defined benefit plan liability (denominated in Indian Rupee) is calculated using a discount rate which is determined by reference to market yields at the end of the reporting period on government bonds.
Interest Risk A decrease in the bond interest rate will increase the plan liability.
Longevity Risk The present value of the defined benefit plan liability is calculated by reference to the best estimate of the mortality of plan participants both during and after their employment. An increase in the life expectancy of the plan participants will increase the plan’s liability.
Salary Risk The present value of the defined benefit plan liability is calculated by reference to the future salaries of plan participants. As such, an increase in the salary of the plan participants will increase the plan’s liability. The estimates of future salary increases, considered in the actuarial valuation, take into account inflation, seniority, promotion and other relevant factors such as supply and demand in the employment market.
The most recent actuarial valuation of the plan assets and the present value of the defined benefit obligation were carried out as at March 31, 2019 by Mr. K.K. Dharni (FIAI M.No. 00051) , Fellow of the Institute of Actuaries of India. The present value of the defined benefit obligation, and the related current service cost, were measured using the projected unit credit method.
Principal assumptions: Gratuity/Post Medical retirement benefit
As at March 31, 2019
As at March 31, 2018
As at April 1,2017
Discount rate 7.65% 7.71% 7.54%
Future salary increase 9.00% 8.25% 6.50%
Retirement age 60/62 60/62 60/62
Withdrawal rate 1-3% 1-3% 1-3%
In service mortality IALM (2006-08) IALM (2006-08) IALM (2006-08)
Amounts recognised in statement of profit and loss in respect of these defined benefit plans are as follows :-
ParticularsGratuity Post Medical retirement benefit
Year ended March 31, 2019
Year ended March 31, 2018
Year ended March 31, 2019
Year ended March 31, 2018
Service cost
Current service cost 23.93 20.48 3.69 3.33
Past service cost and (gain)/Loss from settlements - 2.90 - -
Net interest expense 10.04 6.93 1.86 1.29
Component of defined benefit cost recognised in profit or loss 33.97 30.31 5.55 4.62
Remeasurement on the net defined benefit liability:
Actuarial (gains)/ losses arising from changes in demographic assump-tions
- - - -
Actuarial (gains)/ losses arising from changes in financial assumptions 14.29 22.02 2.80 4.69
Actuarial (gains)/ losses arising from experience adjustments (10.56) 0.05 (2.56) (2.30)
Component of defined benefit cost recognised in Other compre-hensive Income
3.73 22.07 0.24 2.39
The Current Service Cost and the net interest expense for the year are included in the Employee benefits expenses line items in the statement of profit and loss. The remeasurement of the net defined benefit liability is included in other comprehensive income.
Movements in the present value of the defined benefit obligation are as follows :-
Gratuity Post Medical retirement benefit
Particulars Year ended March 31, 2019
Year ended March 31, 2018
Year ended March 31, 2019
Year ended March 31, 2018
Present value of obligation as at the beginning 130.22 91.86 24.12 17.11
Current service cost 23.93 20.48 3.69 3.33
Interest cost 10.04 6.93 1.86 1.29
Past service cost including curtailment gains/ losses - 2.90 - -
Benefits paid (27.31) (14.02) - -
Net actuarial (gain) / loss recognised 3.73 22.07 0.24 2.39
Present value of obligation as at the end 140.61 130.22 29.91 24.12

171
The reconciliation of the Company’s defined benefit obligations (DBO) and plan assets in respect of defined benefit plans to the amounts presented in the statement of balance sheet is presented below:
Gratuity
As at March 31, 2019
As at March 31, 2018
As at April 1,2017
Present Value of funded defined benefit obligation 140.61 130.22 91.86
Fair value of plan assets - - -
Net liability arising from defined benefit obligation 140.61 130.22 91.86
Post Medical retirement benefit
As at March 31, 2019
As at March 31, 2018
As at April 1,2017
Present Value of funded defined benefit obligation 29.91 24.12 17.11
Fair value of plan assets - - -
Net liability arising from defined benefit obligation 29.91 24.12 17.11
Significant actuarial assumptions for the determination of the defined obligation are discount rate, expected salary increase, mortality, etc. The sensitivity analysis below have been determined based on reasonable possible changes of the respective assumptions occurring at the end of the reporting period, while holding all other assumptions constant.
- If the discount rate is 0.5 basis points higher (lower), the defined benefit obligation would decrease by Rs. 15.84 lakhs (increase by Rs. 16.89 lakhs) [March 31, 2018: 12.82 lakhs (increase by Rs. 13.87 lakhs)].- If the expected salary growth increases (decreases) by 0.5 basis points, the defined benefit obligation would increase by Rs. 9.96 lakhs (decrease by Rs. 9.14 lakhs) [March 31, 2018: increase by Rs. 8.40 lakhs (decrease by Rs. 7.70 lakhs)].Sensitivities due to change in mortality rate and change in withdrawal rate are not material and hence impact of such change is not calculated.
Sensitivity Analysis
The sensitivity analysis presented above may not be representative of the actual change in the defined benefit obligation as it is unlikely that the change in assumptions would occur in isolation of one another as some of the assumptions may be correlated.Furthermore, in presenting the above sensitivity analysis, the present value of the defined benefit obligation has been calculated using the projected unit cred-it method at the end of reporting period, which is same as that applied in calculating the defined benefit obligation liability recognised in the balance sheet.There was no change in the methods and assumptions used in preparing the sensitivity analysis from prior years.
Other disclosures
Maturity profile of defined benefit obligation
Particulars As at March 31, 2019
As at March 31, 2018
As at April 1,2017
Average duration of the defined benefit obligation (in years)
Less than 1 year 2.01 16.02 1.98
Between 1-2 years 2.36 3.22 2.62
Between 2-5 years 44.01 35.65 5.15
Over 5 years 122.14 99.46 99.22
Total 170.52 154.35 108.97

172
38 Maturity analysis of assets and liabilities
The table below shows an analysis of assets and liabilities analysed according to when they are expected to be recovered or settled.
Particulars March 31, 2019 March 31, 2018 April 1, 2017
Within 12 months
After 12 months
Total Within 12 months
After 12 months
Total Within 12 months
After 12 months
Total
ASSETS
Financial assets
Cash and cash equivalents 3,223.49 - 3,223.49 5329.99 - 5,329.99 2,963.85 - 2,963.85
Bank balances other than (a) above
668.24 - 668.24 492.7 - 492.70 587.94 - 587.94
Derivative financial instru-ments
- 1,997.22 1,997.22 - 2,500.68 2,500.68 - 2,711.18 2,711.18
Trade receivables 861.14 - 861.14 565.71 - 565.71 567.22 - 567.22
Loans 114,638.00 1,149,807.23 1,264,445.23 82,297.51 1,098,336.59 1,180,634.10 69,757.73 949,448.40 1,019,206.13
Investments - 9,586.99 9,586.99 - 6,301.25 6,301.25 - 11,428.36 11,428.36
Other financial assets - 52.47 52.47 125.12 49.68 174.80 5.37 64.78 70.15
Non-financial assets
Current tax assets (Net) - 17,028.65 17,028.65 - 4,121.31 4,121.31 - 2,124.34 2,124.34
Deferred tax assets (Net) - 18,637.67 18,637.67 - 28,238.85 28,238.85 - 10,142.77 10,142.77
Property, Plant and Equip-ment
- 1,227.22 1,227.22 - 1,402.88 1,402.88 - 1,434.69 1,434.69
Capital work-in-progress - - - - 5.74 5.74 - 5.74 5.74
Other Intangible assets - 4.05 4.05 - 16.69 16.69 - 64.30 64.30
Other non-financial assets 8.29 1,571.43 1,579.72 133.60 1,595.93 1,729.53 60.43 572.04 632.47
Total Assets 119,399.16 1,199,912.93 1,319,312.09 88,944.63 1,142,569.60 1,231,514.23 73,942.54 977,996.60 1,051,939.14
LIABILITIES
Financial liabilities
Derivative financial instru-ments
- 23.00 23.00 - 758.22 758.22 - 906.54 906.54
Payables
Trade Payables
(i) total outstanding dues to micro and small enterprises
13.75 - 13.75 13.82 - 13.82 21.70 - 21.70
(ii) total outstanding dues of creditors other than micro and small enterprises
308.79 - 308.79 514.12 - 514.12 398.56 - 398.56
Debt securities 25,500.00 27,729.44 53,229.44 59,411.00 38,637.93 98,048.93 97,352.00 43,916.18 141,268.18
Borrowings (Other than debt securities)
332,635.00 705,968.79 1,038,603.79 394,099.00 530,738.20 924,837.20 243,371.00 425,885.28 669,256.28
Other financial liabilities 12,443.01 7,500.23 19,943.24 10,702.19 2,139.85 12,842.04 10,626.01 2,541.93 13,167.94
Non-Financial Liabilities
Provisions 6.42 342.12 348.54 43.63 267.18 310.81 6.00 223.75 229.75
Other non-financial liabilities 186.41 - 186.41 254.02 - 254.02 62.78 - 62.78
Total Liabilities 371,093.38 741,563.58 1,112,656.96 465,037.78 572,541.38 1,037,579.16 351,838.05 473,473.68 825,311.73
Net equity (251,694.22) 458,349.35 206,655.13 (376,093.15) 570,028.22 193,935.07 (277,895.51) 504,522.92 226,627.41
39 Segment reporting
The Company’s main business is to provide finance for energy value chain through investment and lending into such projects. All other activities revolve around the main business. The Company does not have any geographic segments. As such, there are no separate reportable segments as per IND AS 108 on “Segment Reporting” as per section 133 of the Companies Act, 2013.
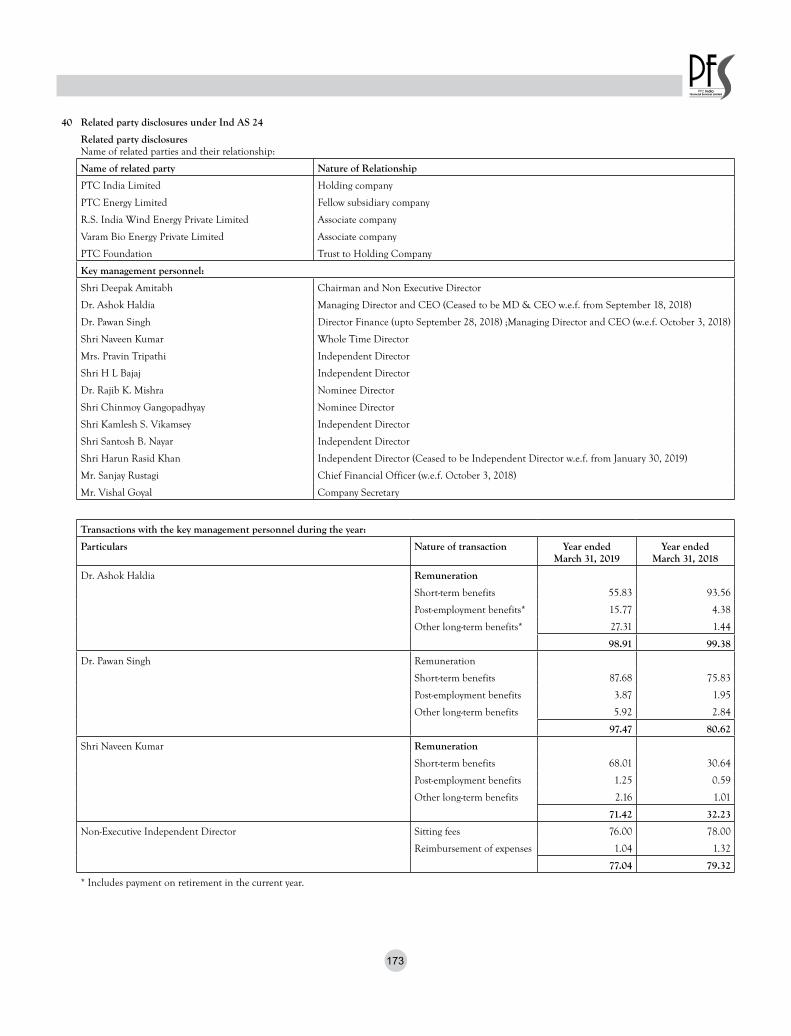
173
40 Related party disclosures under Ind AS 24
Related party disclosuresName of related parties and their relationship:
Name of related party Nature of Relationship
PTC India Limited Holding company
PTC Energy Limited Fellow subsidiary company
R.S. India Wind Energy Private Limited Associate company
Varam Bio Energy Private Limited Associate company
PTC Foundation Trust to Holding Company
Key management personnel:
Shri Deepak Amitabh Chairman and Non Executive Director
Dr. Ashok Haldia Managing Director and CEO (Ceased to be MD & CEO w.e.f. from September 18, 2018)
Dr. Pawan Singh Director Finance (upto September 28, 2018) ;Managing Director and CEO (w.e.f. October 3, 2018)
Shri Naveen Kumar Whole Time Director
Mrs. Pravin Tripathi Independent Director
Shri H L Bajaj Independent Director
Dr. Rajib K. Mishra Nominee Director
Shri Chinmoy Gangopadhyay Nominee Director
Shri Kamlesh S. Vikamsey Independent Director
Shri Santosh B. Nayar Independent Director
Shri Harun Rasid Khan Independent Director (Ceased to be Independent Director w.e.f. from January 30, 2019)
Mr. Sanjay Rustagi Chief Financial Officer (w.e.f. October 3, 2018)
Mr. Vishal Goyal Company Secretary
Transactions with the key management personnel during the year:
Particulars Nature of transaction Year endedMarch 31, 2019
Year endedMarch 31, 2018
Dr. Ashok Haldia Remuneration
Short-term benefits 55.83 93.56
Post-employment benefits* 15.77 4.38
Other long-term benefits* 27.31 1.44
98.91 99.38
Dr. Pawan Singh Remuneration
Short-term benefits 87.68 75.83
Post-employment benefits 3.87 1.95
Other long-term benefits 5.92 2.84
97.47 80.62
Shri Naveen Kumar Remuneration
Short-term benefits 68.01 30.64
Post-employment benefits 1.25 0.59
Other long-term benefits 2.16 1.01
71.42 32.23
Non-Executive Independent Director Sitting fees 76.00 78.00
Reimbursement of expenses 1.04 1.32
77.04 79.32
* Includes payment on retirement in the current year.

174
Transactions with the related parties
Particulars Year endedMarch 31, 2019
Year endedMarch 31, 2018
With Holding company
Expenses reimbursed 60.91 46.19
Expenses paid 29.36 0.47
Director sitting fees 16.80 30.00
Dividend paid 834.90 6,261.75
With fellow subsidiary company
Interest income 647.31 716.62
Expenses paid 6.29 -
Expenses reimbursed 33.58 -
Loan repayment - 523.04
With Trust to Holding Company
Amount paid for CSR spend 689.60 71.54
Loans to fellow subsidiary company
PTC Energy Limited
Particulars Year endedMarch 31, 2019
Year endedMarch 31, 2018
Beginning of the year 6,668.69 7,192.13
Loan repayments received (523.03) (523.04)
Interest charged 647.31 716.62
Interest received (647.31) (717.02)
End of the year 6,145.66 6,668.69
Balance outstanding at the year end
Name of related party Nature As at March 31, 2019
As at March 31, 2018
As at April 1,2017
PTC India Limited Payables - - -
PTC Energy Limited Payables 32.51 - -
PTC Energy Limited Receivables- loan given 6,145.66 6,668.69 7,192.13
41 Details of assets pledged/ hypothecated as security:
The carrying amounts of assets pledged/ hypothecated as security for current and non-current borrowings are:
Particulars As at March 31, 2019
As at March 31, 2018
As at April 1,2017
Non-current assets
Property, plant and equipment 7.57 7.96 8.37
Loans 1,337,464.89 1,286,840.48 1,066,369.53
Trade receivables 861.14 565.71 567.22
42 Capital
The Company maintains an actively managed capital base to cover risks inherent in the business and is meeting the capital adequacy requirements of the Reserve Bank of India (RBI). The adequacy of the Company’s capital is monitored using, among other measures, the regulations issued by RBI.
The Company has complied in full with all its externally imposed capital requirements over the reported period.
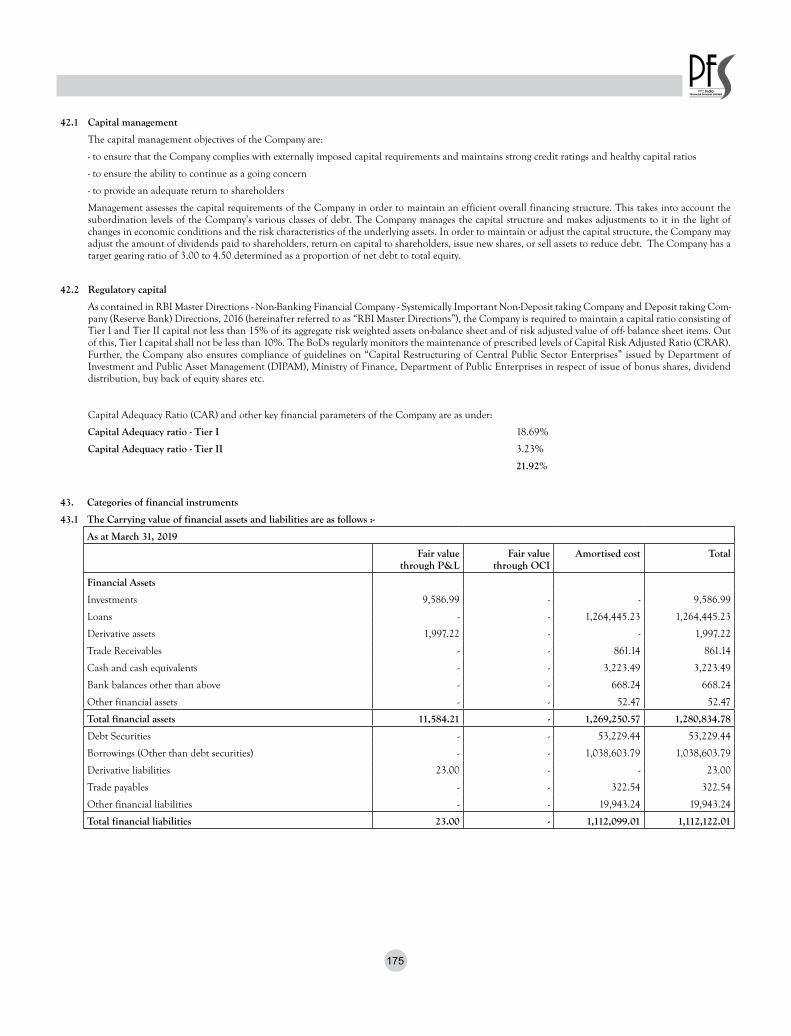
175
42.1 Capital management
The capital management objectives of the Company are:
- to ensure that the Company complies with externally imposed capital requirements and maintains strong credit ratings and healthy capital ratios
- to ensure the ability to continue as a going concern
- to provide an adequate return to shareholders
Management assesses the capital requirements of the Company in order to maintain an efficient overall financing structure. This takes into account the subordination levels of the Company’s various classes of debt. The Company manages the capital structure and makes adjustments to it in the light of changes in economic conditions and the risk characteristics of the underlying assets. In order to maintain or adjust the capital structure, the Company may adjust the amount of dividends paid to shareholders, return on capital to shareholders, issue new shares, or sell assets to reduce debt. The Company has a target gearing ratio of 3.00 to 4.50 determined as a proportion of net debt to total equity.
42.2 Regulatory capital
As contained in RBI Master Directions - Non-Banking Financial Company - Systemically Important Non-Deposit taking Company and Deposit taking Com-pany (Reserve Bank) Directions, 2016 (hereinafter referred to as “RBI Master Directions”), the Company is required to maintain a capital ratio consisting of Tier I and Tier II capital not less than 15% of its aggregate risk weighted assets on-balance sheet and of risk adjusted value of off- balance sheet items. Out of this, Tier I capital shall not be less than 10%. The BoDs regularly monitors the maintenance of prescribed levels of Capital Risk Adjusted Ratio (CRAR). Further, the Company also ensures compliance of guidelines on “Capital Restructuring of Central Public Sector Enterprises” issued by Department of Investment and Public Asset Management (DIPAM), Ministry of Finance, Department of Public Enterprises in respect of issue of bonus shares, dividend distribution, buy back of equity shares etc.
Capital Adequacy Ratio (CAR) and other key financial parameters of the Company are as under:
Capital Adequacy ratio - Tier I 18.69%
Capital Adequacy ratio - Tier II 3.23%
21.92%
43. Categories of financial instruments
43.1 The Carrying value of financial assets and liabilities are as follows :-
As at March 31, 2019
Fair value through P&L
Fair value through OCI
Amortised cost Total
Financial Assets
Investments 9,586.99 - - 9,586.99
Loans - - 1,264,445.23 1,264,445.23
Derivative assets 1,997.22 - - 1,997.22
Trade Receivables - - 861.14 861.14
Cash and cash equivalents - - 3,223.49 3,223.49
Bank balances other than above - - 668.24 668.24
Other financial assets - - 52.47 52.47
Total financial assets 11,584.21 - 1,269,250.57 1,280,834.78
Debt Securities - - 53,229.44 53,229.44
Borrowings (Other than debt securities) - - 1,038,603.79 1,038,603.79
Derivative liabilities 23.00 - - 23.00
Trade payables - - 322.54 322.54
Other financial liabilities - - 19,943.24 19,943.24
Total financial liabilities 23.00 - 1,112,099.01 1,112,122.01

176
As at March 31, 2018
Fair value through P&L
Fair value through OCI
Amortised cost Total
Financial Assets
Investments 2,942.70 3,358.55 6,301.25
Loans - - 1,180,634.10 1,180,634.10
Derivative assets 2,500.68 - - 2,500.68
Trade Receivables - - 565.71 565.71
Cash and cash equivalents - - 5,329.99 5,329.99
Bank balances other than above - - 492.70 492.70
Other financial assets - - 174.80 174.80
Total financial assets 5,443.38 3,358.55 1,187,197.30 1,195,999.23
Debt Securities - - 98,048.93 98,048.93
Borrowings (Other than debt securities) - - 924,837.20 924,837.20
Derivative liabilities 758.22 - - 758.22
Trade payables - - 527.94 527.94
Other financial liabilities - - 12,842.04 12,842.04
Total financial liabilities 758.22 - 1,036,256.11 1,037,014.33
As at April 1, 2017
Fair value through P&L
Fair value through OCI
Amortised cost Total
Financial Assets
Investments in equity instruments - 11,428.36 - 11,428.36
Loans - - 1,019,206.13 1,019,206.13
Derivative assets 2,711.18 - - 2,711.18
Trade Receivables - - 567.22 567.22
Cash and bank balances - - 2,963.85 2,963.85
Bank balances other than above 587.94 587.94
Other financial assets - - 70.15 70.15
Total financial assets 2,711.18 11,428.36 1,023,395.29 1,037,534.83
Debt Securities - - 141,268.18 141,268.18
Borrowings (Other than debt securities) - - 669,256.28 669,256.28
Derivative liabilities 906.54 - - 906.54
Trade payables - - 420.26 420.26
Other financial liabilities - - 13,167.94 13,167.94
Total financial liabilities 906.54 - 824,112.66 825,019.20
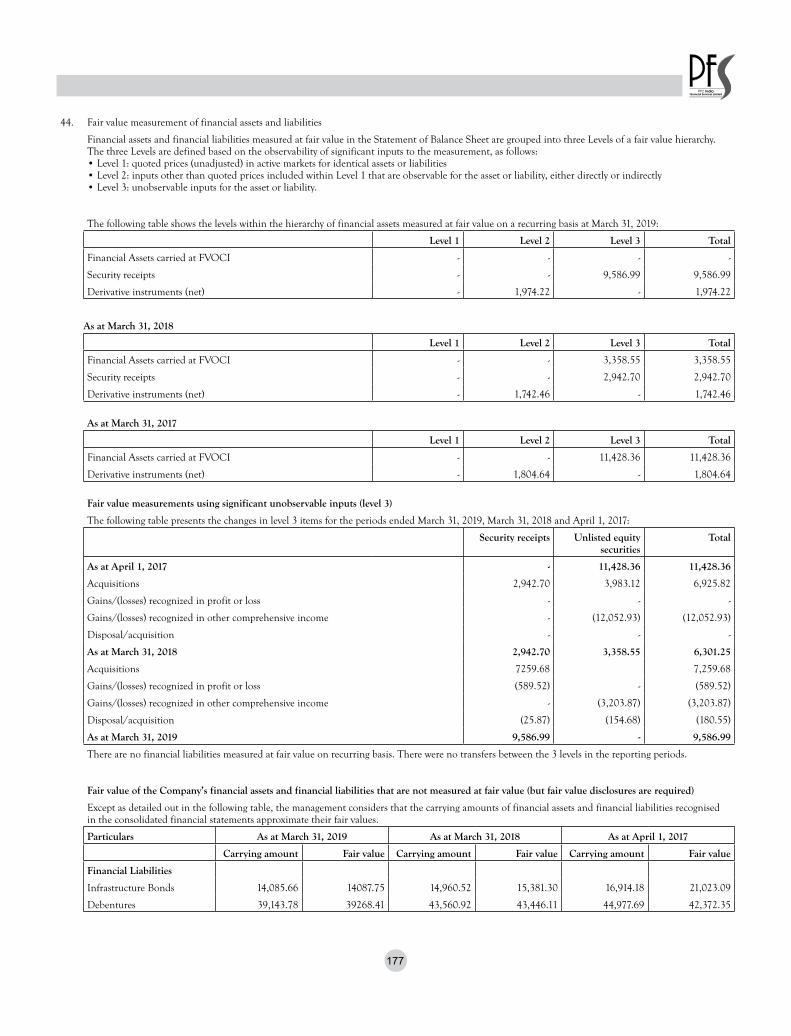
177
44. Fair value measurement of financial assets and liabilities
Financial assets and financial liabilities measured at fair value in the Statement of Balance Sheet are grouped into three Levels of a fair value hierarchy. The three Levels are defined based on the observability of significant inputs to the measurement, as follows: • Level 1: quoted prices (unadjusted) in active markets for identical assets or liabilities • Level 2: inputs other than quoted prices included within Level 1 that are observable for the asset or liability, either directly or indirectly • Level 3: unobservable inputs for the asset or liability.
The following table shows the levels within the hierarchy of financial assets measured at fair value on a recurring basis at March 31, 2019:
Level 1 Level 2 Level 3 Total
Financial Assets carried at FVOCI - - - -
Security receipts - - 9,586.99 9,586.99
Derivative instruments (net) - 1,974.22 - 1,974.22
As at March 31, 2018
Level 1 Level 2 Level 3 Total
Financial Assets carried at FVOCI - - 3,358.55 3,358.55
Security receipts - - 2,942.70 2,942.70
Derivative instruments (net) - 1,742.46 - 1,742.46
As at March 31, 2017
Level 1 Level 2 Level 3 Total
Financial Assets carried at FVOCI - - 11,428.36 11,428.36
Derivative instruments (net) - 1,804.64 - 1,804.64
Fair value measurements using significant unobservable inputs (level 3)
The following table presents the changes in level 3 items for the periods ended March 31, 2019, March 31, 2018 and April 1, 2017:
Security receipts Unlisted equity securities
Total
As at April 1, 2017 - 11,428.36 11,428.36
Acquisitions 2,942.70 3,983.12 6,925.82
Gains/(losses) recognized in profit or loss - - -
Gains/(losses) recognized in other comprehensive income - (12,052.93) (12,052.93)
Disposal/acquisition - - -
As at March 31, 2018 2,942.70 3,358.55 6,301.25
Acquisitions 7259.68 7,259.68
Gains/(losses) recognized in profit or loss (589.52) - (589.52)
Gains/(losses) recognized in other comprehensive income - (3,203.87) (3,203.87)
Disposal/acquisition (25.87) (154.68) (180.55)
As at March 31, 2019 9,586.99 - 9,586.99
There are no financial liabilities measured at fair value on recurring basis. There were no transfers between the 3 levels in the reporting periods.
Fair value of the Company’s financial assets and financial liabilities that are not measured at fair value (but fair value disclosures are required)
Except as detailed out in the following table, the management considers that the carrying amounts of financial assets and financial liabilities recognised in the consolidated financial statements approximate their fair values.
Particulars As at March 31, 2019 As at March 31, 2018 As at April 1, 2017
Carrying amount Fair value Carrying amount Fair value Carrying amount Fair value
Financial Liabilities
Infrastructure Bonds 14,085.66 14087.75 14,960.52 15,381.30 16,914.18 21,023.09
Debentures 39,143.78 39268.41 43,560.92 43,446.11 44,977.69 42,372.35

178
Fair value hierarchy As at March 31, 2019
Level 1 Level 2 Level 3 Total
Financial Liabilities at amortised cost
Infrastructure Bonds - - 14,087.75 14,087.75
Debentures - - 39,268.41 39,268.41
Fair value hierarchy As at March 31, 2018
Level 1 Level 2 Level 3 Total
Financial Liabilities at amortised cost
Infrastructure Bonds - - 15,381.30 15,381.30
Debentures - - 43,446.11 43,446.11
Fair value hierarchy As at March 31, 2017
Level 1 Level 2 Level 3 Total
Financial Liabilities at amortised cost
Infrastructure Bonds - - 21,023.09 21,023.09
Debentures - - 42,372.35 42,372.35
The fair value of the financial assets and liabilities are included at the amount that would be received to sell an asset and paid to transfer a liability in an orderly transaction between market participants. The following methods and assumptions were used to estimate the fair values:-
-Valuation technique used to determine fair value
Specific valuation techniques used to value financial instruments, as described below:
a) Discounted cash flow method is used to fair value investments in unquoted equity instruments
b) Certain investments are valued with reference to sale price observable in the market.
c) The Company’s foreign currency and interest rate derivative contracts are not traded in active markets. Fair valuation of such instruments are provided by the dealer who are recognised banks and use widely acceptable techniques. The effects of non-observable inputs are not significant for foreign cur-rency forward contracts.
The Company performs valuations in consultation with third party valuation specialists for complex valuations. Valuation techniques are selected based on the characteristics of each instrument, with the overall objective of maximising the use of market-based information.
-Trade receivables, cash and cash equivalents, other bank balances, loans, other current financial assets, current borrowings, trade payables and other current financial liabilities: Approximate their carrying amounts largely due to the short-term maturities of these instruments.
-Management uses its best judgment in estimating the fair value of its financial instruments. However, there are inherent limitations in any estimation technique. Therefore, for substantially all financial instruments, the fair value estimates presented above are not necessarily indicative of all the amounts that the Company could have realized or paid in sale transactions as of respective dates. as such, the fair value of the financial instruments subsequent to the respective reporting dates may be different from the amounts reported at each year end.
45 Financial risk management
i) Risk Management
The Company’s activities expose it to market risk, liquidity risk and credit risk. This note explains the sources of risk which the entity is exposed to and how the entity manages the risk and the related impact in the financial statements.
Risk Exposure arising from Measurement Management
Credit risk Loan receivables, Cash and bank balances, trade receivables, derivative financial instruments, financial assets measured at amortised cost
Expected loss analysis Credit risk analysis, diversification of customers/asset base, credit limits and collateral.
Liquidity risk Borrowings and other liabilities Rolling cash flow forecasts
Availability of committed credit lines and borrowing facilities
Market risk - foreign exchange Recognised financial assets and liabilities not denominated in Indian rupee (INR)
Cash flow forecasting Derivative contracts/hedging
Market risk - interest rate Non-current borrowings at variable rates Sensitivity analysis Interest rate swaps
Market risk - security price Investments in equity securities Sensitivity analysis Portfolio diversification, exposure limits
The Board has the overall responsibility of risk management - there are two committees of the Board which take care of managing overall risk in the organiza-tion. In accordance with the RBI guidelines to enable NBFCs to adopt best practices and greater transparency in their operations, the Board of Directors of the Company has constituted a Risk Management Committee to review risk management in relation to various risks, namely, market risk, credit risk, and operational risk, and an Asset Liability Management Committee (ALCO).
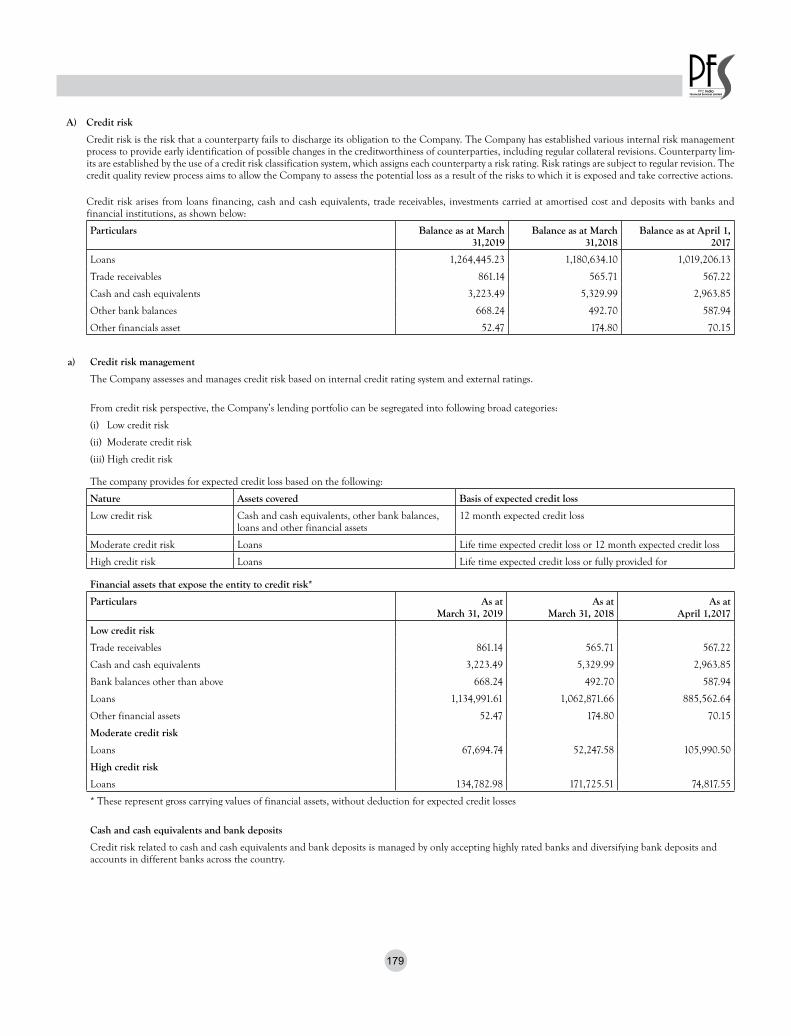
179
A) Credit risk
Credit risk is the risk that a counterparty fails to discharge its obligation to the Company. The Company has established various internal risk management process to provide early identification of possible changes in the creditworthiness of counterparties, including regular collateral revisions. Counterparty lim-its are established by the use of a credit risk classification system, which assigns each counterparty a risk rating. Risk ratings are subject to regular revision. The credit quality review process aims to allow the Company to assess the potential loss as a result of the risks to which it is exposed and take corrective actions.
Credit risk arises from loans financing, cash and cash equivalents, trade receivables, investments carried at amortised cost and deposits with banks and financial institutions, as shown below:
Particulars Balance as at March 31,2019
Balance as at March 31,2018
Balance as at April 1, 2017
Loans 1,264,445.23 1,180,634.10 1,019,206.13
Trade receivables 861.14 565.71 567.22
Cash and cash equivalents 3,223.49 5,329.99 2,963.85
Other bank balances 668.24 492.70 587.94
Other financials asset 52.47 174.80 70.15
a) Credit risk management
The Company assesses and manages credit risk based on internal credit rating system and external ratings.
From credit risk perspective, the Company’s lending portfolio can be segregated into following broad categories:
(i) Low credit risk
(ii) Moderate credit risk
(iii) High credit risk
The company provides for expected credit loss based on the following:
Nature Assets covered Basis of expected credit loss
Low credit risk Cash and cash equivalents, other bank balances, loans and other financial assets
12 month expected credit loss
Moderate credit risk Loans Life time expected credit loss or 12 month expected credit loss
High credit risk Loans Life time expected credit loss or fully provided for
Financial assets that expose the entity to credit risk*
Particulars As at March 31, 2019
As at March 31, 2018
As at April 1,2017
Low credit risk
Trade receivables 861.14 565.71 567.22
Cash and cash equivalents 3,223.49 5,329.99 2,963.85
Bank balances other than above 668.24 492.70 587.94
Loans 1,134,991.61 1,062,871.66 885,562.64
Other financial assets 52.47 174.80 70.15
Moderate credit risk
Loans 67,694.74 52,247.58 105,990.50
High credit risk
Loans 134,782.98 171,725.51 74,817.55
* These represent gross carrying values of financial assets, without deduction for expected credit losses
Cash and cash equivalents and bank deposits
Credit risk related to cash and cash equivalents and bank deposits is managed by only accepting highly rated banks and diversifying bank deposits and accounts in different banks across the country.

180
Trade receivables
Trade receivables measured at amortized cost and credit risk related to these are managed by monitoring the recoverability of such amounts continuously.
Loans
Credit risk related to borrower’s are mitigated by considering collateral’s from borrower’s. The Company closely monitors the credit-worthiness of the borrower’s through internal systems and project appraisal process to assess the credit risk and define credit limits of borrower, thereby, limiting the credit risk to pre-calculated amounts. These processes include a detailed appraisal methodology, identification of risks and suitable structuring and credit risk mitigation measures. The Company assesses increase in credit risk on an ongoing basis for amounts loan receivables that become past due and default is considered to have occurred when amounts receivable become one year past due.
Other financial assets measured at amortized cost
Other financial assets measured at amortized cost includes security deposits and others. Credit risk related to these other financial assets is managed by monitoring the recoverability of such amounts.
b) ii) Expected credit loss for loans
A.1 Credit risk measurement
The Company measures credit risk of its exposure using:
(a) Internal Rating: Internal ratings are based on board approved policy that guides credit analysis to place borrowers in watch list based on specific risk factors such as project progress schedule, promoter’s contribution, PPA status etc.
(b) External rating: PFS also captures external rating of their borrowers done by RBI approved rating agencies like ICRA, Care etc.
These two together helps the Company in better monitoring of its borrowers. The staging criteria for ECL computation is also driven by these two criteria. Staging of an account gets impacted by taking into consideration both internal rating and external rating.
A.2 Expected credit loss measurement
A.2.1 Significant increase in credit risk and credit impaired financial assets
The Company considers a financial instrument to have experienced a significant increase based on the staging crtieria, which is aligned with EWS frame-work.
As per EWS framework, loan accounts with rating OR1-OR6 may be classified as stage 1 and assets with rating OR7-OR10 may be classified as stage 2 accounts. However, if the loan account was rated OR7-OR10 during the sanction process then the loan account may be classified as stage 1 account as the risk prescription/credit quality has not changed since initial risk assessment.
A.2.2 Definition of default
The Company defines a financial instrument as in default, any borrower whose contractual payments are due for more than 90 days is termed as default, which is in line with RBI guidelines
A.2.3 Explanation of inputs, assumptions and estimation techniques
Probability of default (PD) computation model
Probability of Default is the likelihood that the borrower will not be able to meets its obligations as and when it falls due.
Transition Matrix Approach was used for estimation of PD. ICRA’s one-year transition matrix was used as the base probability of default matrix.
Stage 1: 12-month PDs were taken directly from one-year transition matrix and so, PIT conversion was not done, as it is already giving PIT PDs.
Stage 2: PD for second year onwards was estimated using Matrix Multiplication Approach. As a matter of following a best practice, it was decided to keep the PDs constant after 5th year.
Stage 3: As the accounts classified into stage 3 are non-performing assets so probability of default was assumed to be 100%.
Loss given default (LGD) computation model
Loss Given Default is the percentage of total exposure which the borrower would not be able to recover in case of default.
Workout LGD approach has been used for LGD estimation.
LGD= (Economic loss + Cost of Recovery)/EAD
Basis of calculating loss rates
First step involved in ECL computation is staging of the assets into three categories. Staging of the financial assets depend on the deterioration of the credit quality of the assets over its lifetime. Performing assets fall under Stage I, Underperforming assets fall under Stage II and Impaired assets(non-performing) fall under Stage III.

181
The following points were considered for stage wise classification of credit exposures:
1. Stage III exposures were exposures where actual default events have occurred i.e. all credit exposures classified as Doubtful or Sub-Standard, or where significant deterioration in credit quality was envisaged.
2. Stage II exposure were exposures which were not considered impaired asset but were classified as ‘Stressed Accounts’ or were flagged as High-Risk Category.
3. All other accounts not meeting the first two criteria were classified as Stage 1 accounts.
Quantitative and qualitative factors considered along with quantification i.r.t loss rates
Impact of specific risk factors was taken into account while staging of accounts and computation of PD. External credit rating was also used for staging criteria. The industry of the borrower was also considered for classification of the borrower. If a borrower belonged to an industry under stress, then the borrower was classified as stage 2 or 3 account.
For computation of loss given default, haircuts on collateral, based on subjective parameters were used.
- Sector/Sub-sector
- Source of Power Generation
- PPA Status
- COD Status
A.2.4 Forward looking information incorporated in ECL models
The PDs derived from the transition matrix were adjusted using Index for Industrial Production (IIP) for electricity segment prepared by Government of India and published by Reserve Bank of India. A scenario analysis methodology was used to shock the Point-in-Time PDs using IIP data. These shocked PDs were used to compute lifetime ECL for stage 2 accounts.
A.3 Credit risk exposure and impairment loss allowance
As at March 31, 2019 As at March 31, 2018 As at March 31, 2017
Exposure Impairment allowance
Exposure Impairment allowance
Exposure Impairment allowance
Credit impaired loan assets (Default event trig-gered) (Stage III)
134,782.98 66,475.76 171,725.51 91,363.97 74,817.55 30,426.15
Loan assets having significant increase in credit risk (Stage II)
67,694.74 1,793.27 52,247.58 9,768.03 105,990.50 11,600.15
Other loan assets (Stage I) 1,134,951.69 4,755.07 1,062,854.56 5,078.65 885,545.10 5,138.26
Total 1,337,429.41 73,024.10 1,286,827.65 106,210.65 1,066,353.15 47,164.56
A.3.1 Collateral and other credit enhancements
Loans are secured by :
i. Hypothecation of assets and/or
ii. Mortgage of property and /or
iii. Trust and retention account and /or
iv. Bank guarantee, Company guarantee or personal guarantee and / or
v. Assignment of receivables or rights and / or
vi. Pledge of shares and / or
vii. Undertaking to create a security
A.4 Loss allowance
The loss allowance recognized in the period is impacted by a variety of factors, as described below:
- Transfers between Stage 1 and Stages 2 or 3 due to financial instruments experiencing significant increases (or decreases) of credit risk or becoming credit-impaired in the period, and the consequent “step up” (or “step down”) between 12-month and Lifetime ECL.
- Additional allowances for new financial instruments recognised during the period, as well as releases for financial instruments de-recognised in the period
- Impact on the measurement of ECL due to changes in PDs, EADs and LGDs in the period, arising from regular refreshing of inputs to models
- Financial assets derecognised during the period and write-offs of allowances related to assets that were written off during the period

182
The following tables explain the changes in the loss allowance between the beginning and the end of the annual period due to these factors:
Loss allowance Stage 1 Stage 2 Stage 3 Total
12 months ECL Lifetime ECL Lifetime ECL
Loans and advances to customers at amortised Cost
Balance as at April 1, 2017 5,138.26 11,600.15 30,426.15 47,164.56
Transfer to 12 months ECL - - - -
Transfer to life time ECL not credit impaired (525.60) 525.60 - -
Transfer to Lifetime ECL credit impaired (769.40) (51,044.98) 51,814.38 -
Movement of loss allowance during the year 1,235.39 48,687.26 10,754.44 60,677.09
Write offs - - (1,631.00) (1,631.00)
Balance as at March 31, 2018 5,078.65 9,768.03 91,363.97 106,210.65
Loans and advances to customers at amortised Cost
Balance as at April 1, 2018 5,078.65 9,768.03 91,363.97 106,210.65
Transfer to 12 months ECL - - - -
Transfer to life time ECL not credit impaired (116.07) 116.07 -
Transfer to Lifetime ECL credit impaired (9,083.71) 9,083.71 -
Net remeasurement of loss allowance (207.51) 992.88 4,605.99 5,391.36
Write offs - - (38,577.91) (38,577.91)
Balance as at March 31, 2019 4,755.07 1,793.27 66,475.76 73,024.10
The following table further explains changes in the gross carrying amount of the Loan portfolio to help explain their significance to the changes in the loss allowance for the same portfolio as discussed above:
Gross Exposure Stage 1 Stage 2 Stage 3 Total
12 months ECL Lifetime ECL Lifetime ECL
Loans and advances to customers at amortised Cost
Balance as at April 1, 2017 885,545.10 105,990.50 74,817.55 1,066,353.15
Transfer to/from 12 months ECL - - - -
Transfer to/from life time ECL not credit impaired (26,502.87) 26,502.87 - -
Transfer to/from Lifetime ECL credit impaired (15,388.00) (80,342.51) 95,730.51 -
New Financial assets originated or purchased 502,801.00 3,684.00 3,833.00 510,318.00
Financial Assets that have been derecognised (283,600.67) (3,587.28) (1,159.27) (288,347.22)
Write offs - - (1,496.28) (1,496.28)
Balance as at March 31, 2018 1,062,854.56 52,247.58 171,725.51 1,286,827.65
Loans and advances to customers at amortised Cost
Balance as at 1 April, 2018 1,062,854.56 52,247.58 171,725.51 1,286,827.65
Transfer to/from 12 months ECL - - - -
Transfer to/from life time ECL not credit impaired (37,622.31) 37,622.31 - -
Transfer to/from Lifetime ECL credit impaired - (23,747.00) 23,747.00 -
New Financial assets originated or purchased 403,143.00 5,210.00 166.00 408,519.00
Financial Assets that have been derecognised (293,423.56) (3,638.15) (22,277.62) (319,339.33)
Write offs - - (38,577.91) (38,577.91)
Balance as at March 31, 2019 1,134,951.69 67,694.74 134,782.98 1,337,429.41

183
A.5 Concentration of credit risk
The Company monitors concentration of credit risk by type of industry in which the borrower operates, further bifurcated into type of borrower, whether state or private.
Industry As atMarch 31, 2019
As atMarch 31, 2018
As atApril 1, 2017
Gross carrying amount of loans
Concentration by industry
Thermal 187,493.47 222,574.81 243,729.05
Renewable energy 780,200.58 747,624.40 559,262.14
Hydro 23,215.81 29,569.71 29,049.85
Others 346,519.55 287,058.73 234,312.11
1,337,429.41 1,286,827.65 1,066,353.15
A.6 Write off policy
Financial assets are written off either partially or in their entirety to the extent that there is no realistic prospect of recovery. Any subsequent recoveries are credited to impairment on financial instrument on statement of profit and loss.
ii) Expected credit losses for financial assets other than loans and derivative financial instruments
Company provides for expected credit losses on financial assets other than loans by assessing individual financial instruments for expectation of any credit losses:
- For cash and cash equivalents and other bank balances - Since the Company deals with only high-rated banks and financial institutions, credit risk in respect of cash and cash equivalents, other bank balances and bank deposits is evaluated as very low.
- For loans comprising security deposits paid - Credit risk is considered low because the Company is in possession of the underlying asset.
- For other financial assets - Credit risk is evaluated based on Company’s knowledge of the credit worthiness of those parties and loss allowance is measured for 12 month expected credit losses upon initial recognition and provide for lifetime expected credit losses upon significant increase in credit risk. The Company does not have any expected loss based impairment recognised on such assets considering their low credit risk nature, though the reconciliation of expected credit loss for all sub categories of financial assets (other than loans) are disclosed below:
As at March 31, 2019 Estimated gross carrying amount at
default
Expected probability of default
Expected credit losses
Carrying amount net of impairment provision
Cash and cash equivalents 3,223.49 0% - 3,223.49
Other bank balance 668.24 0% - 668.24
Investments - 0% - -
Trade receivables 938.82 8% 77.68 861.14
Other financial assets 52.47 0% - 52.47
As at March 31, 2018 Estimated gross carrying amount at
default
Expected probability of default
Expected credit losses
Carrying amount net of impairment provision
Cash and cash equivalents 5,329.99 0% - 5,329.99
Other bank balance 492.70 0% - 492.70
Investments - 0% - -
Trade receivables 565.71 0% - 565.71
Other financial assets 174.80 0% - 174.80
As at April 1, 2017 Estimated gross carrying amount at
default
Expected probability of default
Expected credit losses
Carrying amount net of impairment provision
Cash and cash equivalents 2,963.85 0% - 2,963.85
Other bank balance 587.94 0% - 587.94
Investments - 0% - -
Trade receivables 567.22 0% - 567.22
Other financial assets 70.15 0% - 70.15
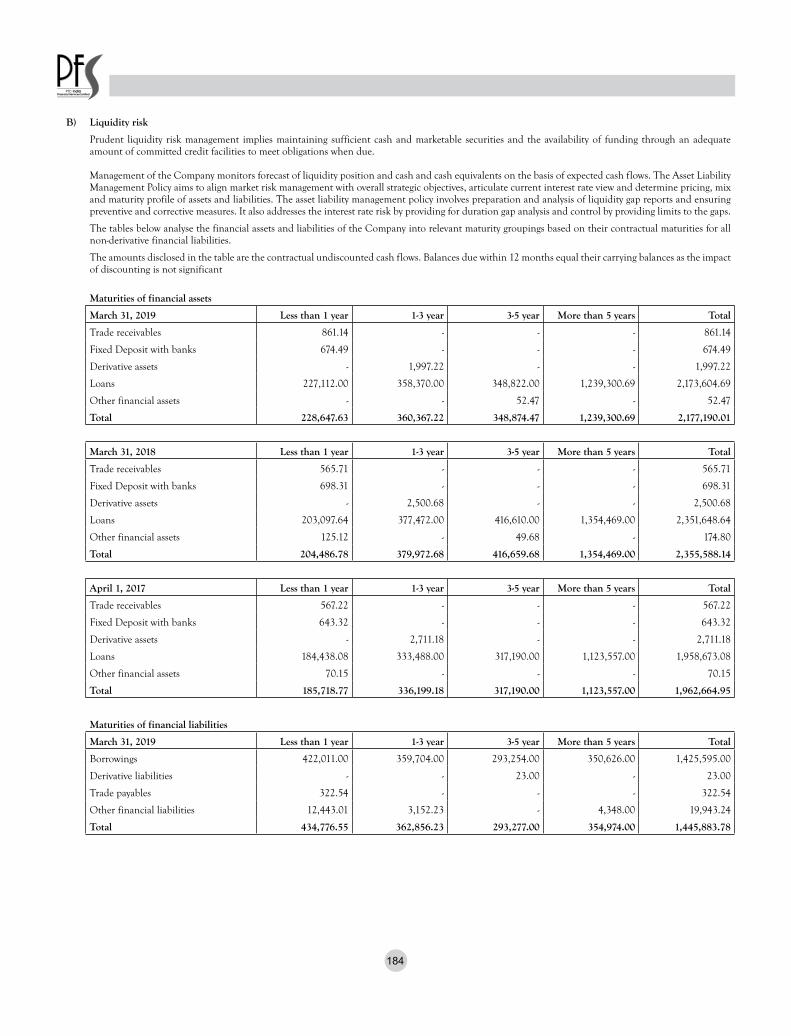
184
B) Liquidity risk
Prudent liquidity risk management implies maintaining sufficient cash and marketable securities and the availability of funding through an adequate amount of committed credit facilities to meet obligations when due. Management of the Company monitors forecast of liquidity position and cash and cash equivalents on the basis of expected cash flows. The Asset Liability Management Policy aims to align market risk management with overall strategic objectives, articulate current interest rate view and determine pricing, mix and maturity profile of assets and liabilities. The asset liability management policy involves preparation and analysis of liquidity gap reports and ensuring preventive and corrective measures. It also addresses the interest rate risk by providing for duration gap analysis and control by providing limits to the gaps.
The tables below analyse the financial assets and liabilities of the Company into relevant maturity groupings based on their contractual maturities for all non-derivative financial liabilities.
The amounts disclosed in the table are the contractual undiscounted cash flows. Balances due within 12 months equal their carrying balances as the impact of discounting is not significant
Maturities of financial assets
March 31, 2019 Less than 1 year 1-3 year 3-5 year More than 5 years Total
Trade receivables 861.14 - - - 861.14
Fixed Deposit with banks 674.49 - - - 674.49
Derivative assets - 1,997.22 - - 1,997.22
Loans 227,112.00 358,370.00 348,822.00 1,239,300.69 2,173,604.69
Other financial assets - - 52.47 - 52.47
Total 228,647.63 360,367.22 348,874.47 1,239,300.69 2,177,190.01
March 31, 2018 Less than 1 year 1-3 year 3-5 year More than 5 years Total
Trade receivables 565.71 - - - 565.71
Fixed Deposit with banks 698.31 - - - 698.31
Derivative assets - 2,500.68 - - 2,500.68
Loans 203,097.64 377,472.00 416,610.00 1,354,469.00 2,351,648.64
Other financial assets 125.12 - 49.68 - 174.80
Total 204,486.78 379,972.68 416,659.68 1,354,469.00 2,355,588.14
April 1, 2017 Less than 1 year 1-3 year 3-5 year More than 5 years Total
Trade receivables 567.22 - - - 567.22
Fixed Deposit with banks 643.32 - - - 643.32
Derivative assets - 2,711.18 - - 2,711.18
Loans 184,438.08 333,488.00 317,190.00 1,123,557.00 1,958,673.08
Other financial assets 70.15 - - - 70.15
Total 185,718.77 336,199.18 317,190.00 1,123,557.00 1,962,664.95
Maturities of financial liabilities
March 31, 2019 Less than 1 year 1-3 year 3-5 year More than 5 years Total
Borrowings 422,011.00 359,704.00 293,254.00 350,626.00 1,425,595.00
Derivative liabilities - - 23.00 - 23.00
Trade payables 322.54 - - - 322.54
Other financial liabilities 12,443.01 3,152.23 - 4,348.00 19,943.24
Total 434,776.55 362,856.23 293,277.00 354,974.00 1,445,883.78

185
March 31, 2018 Less than 1 year 1-3 year 3-5 year More than 5 years Total
Borrowings 524,113.73 252,050.82 224,234.81 268,277.84 1,268,677.20
Derivative liabilities - 758.22 - 758.22
Trade payables 527.94 - - - 527.94
Other financial liabilities 10,702.19 2,139.85 - - 12,842.04
Total 535,343.86 254,190.67 224,993.03 268,277.84 1,282,805.40
April 1, 2017 Less than 1 year 1-3 year 3-5 year More than 5 years Total
Borrowings 396,641.37 220,504.28 172,696.64 227,429.87 1,017,272.16
Derivative liabilities - - 906.54 - 906.54
Trade payables 420.26 - - - 420.26
Other financial liabilities 10,626.01 2,541.93 - - 13,167.94
Total 407,687.64 223,046.21 173,603.18 227,429.87 1,031,766.90
C) Market Risk
a) Foreign currency risk
The Company is exposed to foreign exchange risk arising from foreign currency transactions. The policy on foreign exchange risk management covers the management of foreign exchange risk related to existing and future foreign currency loans or any other foreign exchange risks derived from borrowing and lending. The objective of the policy is to serve as a guideline for transactions to be undertaken for hedging of foreign exchange related risks. It also provides guiding parameters within which the Asset Liability Management Committee can take decisions for managing the above mentioned risks. Foreign exchange risk arises from recognised assets and liabilities denominated in a currency that is not the functional currency of the Company. The Company as per its overall strategy uses derivative contracts to mitigate its risks associated with fluctuations in foreign currency and interest rates on borrowings. The Company does not use derivative contracts for speculative purposes.
Foreign currency risk exposure:The exposure to foreign currency risk at the end of the reporting period, translated to INR at closing rate, is as follows
Particulars As at March 31, 2019
As at March 31, 2018
As at April 1,2017
Financial liabilities (USD)
Foreign currency loan 37,146.67 42,462.23 48,870.87
Net exposure to foreign currency risk (liabilities) 37,146.67 42,462.23 48,870.87
SensitivityThe sensitivity to changes in the exchange rates arises mainly from foreign currency denominated financial instruments.
Particulars As at March 31, 2019
As at March 31, 2018
As at April 1,2017
USD sensitivity*
INR/USD- increase by 680 bp (March 31, 2018: 424 bp; April 1, 2017: 400 bp) 1,729.95 1,190.94 1,430.27
INR/USD- decrease by 680 bp (March 31, 2018: 424 bp; April 1, 2017: 400 bp) (1,729.95) (1,190.94) (1,430.27)
* Holding all other variables constant
b) Interest rate risk
i) Liabilities
The policy of the Company is to minimise interest rate cash flow risk exposures on long-term loans and borrowings. As at March 31, 2019, the Company is exposed to changes in market interest rates through loans and bank borrowings at variable interest rates.
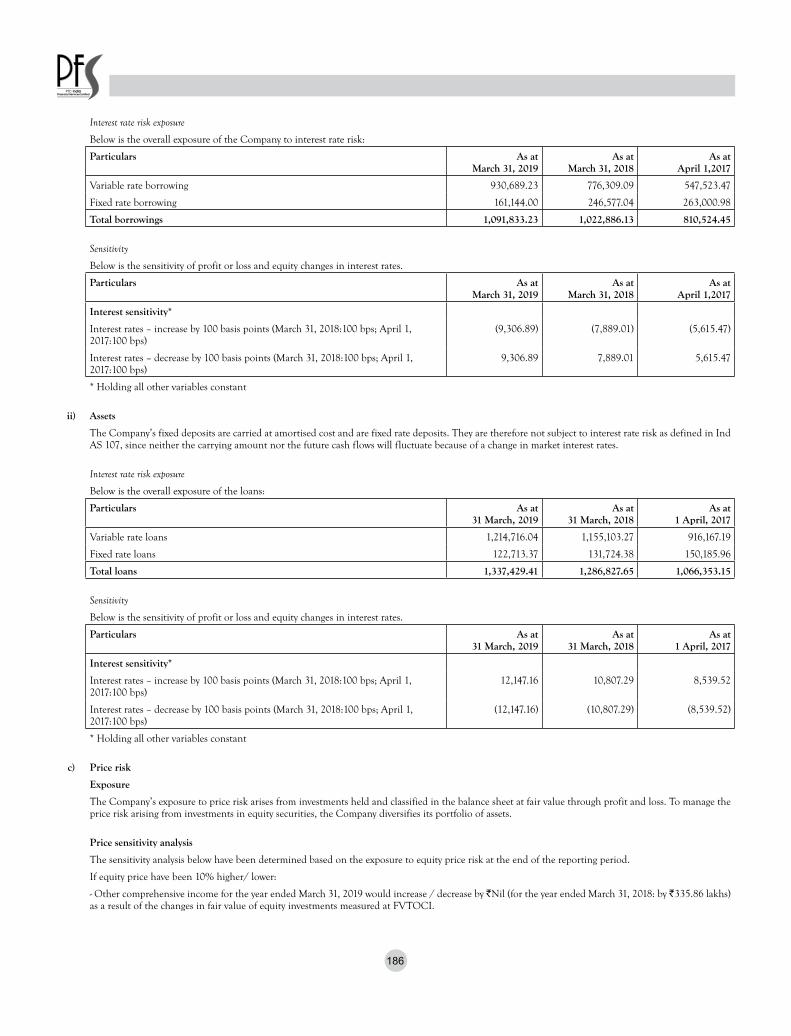
186
Interest rate risk exposure
Below is the overall exposure of the Company to interest rate risk:
Particulars As at March 31, 2019
As at March 31, 2018
As at April 1,2017
Variable rate borrowing 930,689.23 776,309.09 547,523.47
Fixed rate borrowing 161,144.00 246,577.04 263,000.98
Total borrowings 1,091,833.23 1,022,886.13 810,524.45
Sensitivity
Below is the sensitivity of profit or loss and equity changes in interest rates.
Particulars As at March 31, 2019
As at March 31, 2018
As at April 1,2017
Interest sensitivity*
Interest rates – increase by 100 basis points (March 31, 2018:100 bps; April 1, 2017:100 bps)
(9,306.89) (7,889.01) (5,615.47)
Interest rates – decrease by 100 basis points (March 31, 2018:100 bps; April 1, 2017:100 bps)
9,306.89 7,889.01 5,615.47
* Holding all other variables constant
ii) Assets
The Company’s fixed deposits are carried at amortised cost and are fixed rate deposits. They are therefore not subject to interest rate risk as defined in Ind AS 107, since neither the carrying amount nor the future cash flows will fluctuate because of a change in market interest rates.
Interest rate risk exposure
Below is the overall exposure of the loans:
Particulars As at 31 March, 2019
As at 31 March, 2018
As at 1 April, 2017
Variable rate loans 1,214,716.04 1,155,103.27 916,167.19
Fixed rate loans 122,713.37 131,724.38 150,185.96
Total loans 1,337,429.41 1,286,827.65 1,066,353.15
Sensitivity
Below is the sensitivity of profit or loss and equity changes in interest rates.
Particulars As at 31 March, 2019
As at 31 March, 2018
As at 1 April, 2017
Interest sensitivity*
Interest rates – increase by 100 basis points (March 31, 2018:100 bps; April 1, 2017:100 bps)
12,147.16 10,807.29 8,539.52
Interest rates – decrease by 100 basis points (March 31, 2018:100 bps; April 1, 2017:100 bps)
(12,147.16) (10,807.29) (8,539.52)
* Holding all other variables constant
c) Price risk
Exposure
The Company’s exposure to price risk arises from investments held and classified in the balance sheet at fair value through profit and loss. To manage the price risk arising from investments in equity securities, the Company diversifies its portfolio of assets.
Price sensitivity analysis
The sensitivity analysis below have been determined based on the exposure to equity price risk at the end of the reporting period.
If equity price have been 10% higher/ lower:
- Other comprehensive income for the year ended March 31, 2019 would increase / decrease by ₹Nil (for the year ended March 31, 2018: by ₹335.86 lakhs) as a result of the changes in fair value of equity investments measured at FVTOCI.

187
46 Earnings per share
Particulars Year ended March 31, 2019
Year ended March 31, 2018
a) Basic earnings per share 2.87 (1.56)
b) Diluted earnings per share 2.87 (1.56)
c) Reconciliations of earnings used in calculating earnings per share
Particulars Year ended March 31, 2019
Year ended March 31, 2018
Basic earnings per share
Profits attributable to the equity holders of the company used in calculating basic earnings per share 18,414.26 (10,023.45)
Diluted earnings per share
Profit attributable to the equity holders of the company:
Used in calculating basic earnings per share 18,414.26 (10,023.45)
Add interest saving on convertible bonds -
Profit attributable to the equity holders of the company used in calculating diluted earnings per share 18,414.26 (10,023.45)
d) Weighted average number of shares used as the denominator
Particulars Year ended March 31, 2019
Year ended March 31, 2018
Number of shares Number of shares
Weighted average number of equity shares used as the denominator in calculating basic earnings per share 642,283,335 642,283,335
Adjustments for calculation of diluted earnings per share: -
Weighted average number of equity shares and potential equity shares used as the denominator in calculating diluted earnings per share
642,283,335 642,283,335
47 Disclosure in respect of Leases
The Company has entered into operating lease arrangement for office premise. The lease is non-cancellable and is for a period of 5 years. The committed lease rentals in the future are:
Particulars As at 31 March, 2019
As at 31 March, 2018
As at 1 April, 2017
Future minimum lease payments
Not later than one year 536.55 450.68 -
Later than one year and not later than five years 1,615.01 1,879.91 -
Lease payments recognised in the Statement of Profit and Loss during the year 495.43 476.83 349.05
48 Expenditure on Corporate Social Responsibility
Particulars As at 31 March, 2019
As at 31 March, 2018
As at 1 April, 2017
(a) Gross amount required to be spent (including unspent amount of Rs. 2,247.11 lakhs till March 31, 2018)
3,198.11 2,328.26 1,448.80
(b) Amount spent:
(i) Construction/acquisition of any asset - - -
(ii) On purpose other than (i) above 916.41 81.15 -
49 The Company has made provision, as required under the applicable law or accounting standards, for material foreseeable losses, if any, on long-term con-tracts including derivative contracts.
50 There has been no delay in transferring amounts, required to be transferred, to the Investor Education and Protection Fund by the Company.
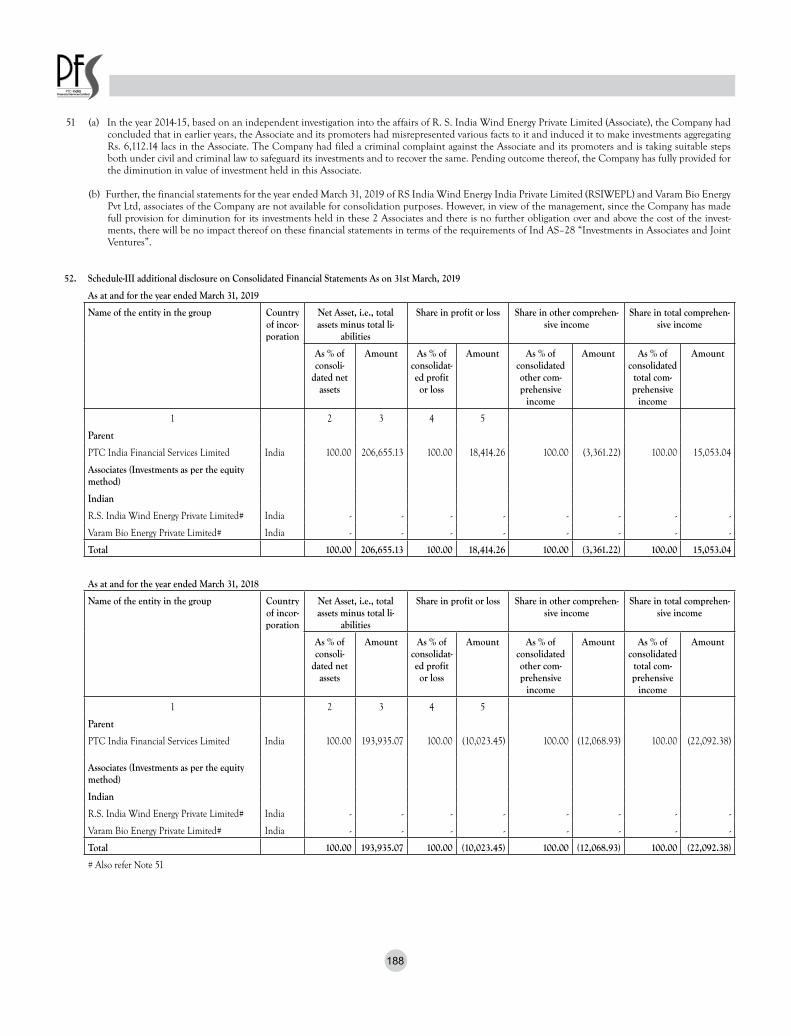
188
51 (a) In the year 2014-15, based on an independent investigation into the affairs of R. S. India Wind Energy Private Limited (Associate), the Company had concluded that in earlier years, the Associate and its promoters had misrepresented various facts to it and induced it to make investments aggregating Rs. 6,112.14 lacs in the Associate. The Company had filed a criminal complaint against the Associate and its promoters and is taking suitable steps both under civil and criminal law to safeguard its investments and to recover the same. Pending outcome thereof, the Company has fully provided for the diminution in value of investment held in this Associate.
(b) Further, the financial statements for the year ended March 31, 2019 of RS India Wind Energy India Private Limited (RSIWEPL) and Varam Bio Energy Pvt Ltd, associates of the Company are not available for consolidation purposes. However, in view of the management, since the Company has made full provision for diminution for its investments held in these 2 Associates and there is no further obligation over and above the cost of the invest-ments, there will be no impact thereof on these financial statements in terms of the requirements of Ind AS–28 “Investments in Associates and Joint Ventures”.
52. Schedule-III additional disclosure on Consolidated Financial Statements As on 31st March, 2019
As at and for the year ended March 31, 2019
Name of the entity in the group Country of incor-poration
Net Asset, i.e., total assets minus total li-
abilities
Share in profit or loss Share in other comprehen-sive income
Share in total comprehen-sive income
As % of consoli-
dated net assets
Amount As % of consolidat-ed profit or loss
Amount As % of consolidated other com-prehensive
income
Amount As % of consolidated
total com-prehensive
income
Amount
1 2 3 4 5
Parent
PTC India Financial Services Limited India 100.00 206,655.13 100.00 18,414.26 100.00 (3,361.22) 100.00 15,053.04
Associates (Investments as per the equity method)
Indian
R.S. India Wind Energy Private Limited# India - - - - - - - -
Varam Bio Energy Private Limited# India - - - - - - - -
Total 100.00 206,655.13 100.00 18,414.26 100.00 (3,361.22) 100.00 15,053.04
As at and for the year ended March 31, 2018
Name of the entity in the group Country of incor-poration
Net Asset, i.e., total assets minus total li-
abilities
Share in profit or loss Share in other comprehen-sive income
Share in total comprehen-sive income
As % of consoli-
dated net assets
Amount As % of consolidat-ed profit or loss
Amount As % of consolidated other com-prehensive
income
Amount As % of consolidated
total com-prehensive
income
Amount
1 2 3 4 5
Parent
PTC India Financial Services Limited India 100.00 193,935.07 100.00 (10,023.45) 100.00 (12,068.93) 100.00 (22,092.38)
Associates (Investments as per the equity method)
Indian
R.S. India Wind Energy Private Limited# India - - - - - - - -
Varam Bio Energy Private Limited# India - - - - - - - -
Total 100.00 193,935.07 100.00 (10,023.45) 100.00 (12,068.93) 100.00 (22,092.38)
# Also refer Note 51

189
53 FIRST TIME ADOPTION OF IND AS
These financial statements, for the year ended 31 March 2019, are the first financial statements the Company has prepared in accordance with Ind AS. For periods up to and including the year ended 31 March 2018, the Company prepared its financial statements in accordance with accounting standards notified under section 133 of the Companies Act 2013, read together with paragraph 7 of the Companies (Accounts) Rules, 2014 (Indian GAAP or previous GAAP).
Accordingly, the Company has prepared financial statements which comply with Ind AS applicable for periods ending on 31 March 2019, together with the comparative period data as at and for the year ended 31 March 2018, as described in the summary of significant accounting policies. In preparing these financial statements, the Company’s opening balance sheet was prepared as at 1 April 2017, the Company’s date of transition to Ind AS. This note explains the principal adjustments made by the Company in restating its Indian GAAP financial statements, including the balance sheet as at 1 April 2017 and the financial statements as at and for the year ended 31 March 2018.
A. Optional exemptions availed
Ind AS 101 allows first-time adopters certain exemptions from the retrospective application of certain requirements under Ind AS. The Company has applied the following exemptions:
(i) Deemed cost
Ind AS 101 permits a first-time adopter to elect to continue with the carrying value for all of its property, plant and equipment as recognised in the financial statements as at the date of transition to Ind AS, measured as per the previous GAAP and use that as its deemed cost as at the date of transition. This exemption can also be used for intangible assets covered by Ind AS 38 Intangible Assets.
Accordingly, the Company has elected to measure all of its property, plant and equipment and intangible assets at their previous GAAP carrying value.
(ii) Long-term foreign currency monetary items
Under previous GAAP, paragraph 46/46A of AS 11 "The Effects of Changes in Foreign Exchange Rates", provided an alternative accounting treatment to companies with respect to exchange differences arising on restatement of long term foreign currency monetary items. Exchange difference on account of long term foreign currency liabilities could be accumulated in a foreign currency monetary item translation difference account, and amortised over the balance period of such long term liability. Ind AS 101 includes an optional exemption that allows a first-time adopter to continue the above accounting treatment in respect of the long-term foreign currency monetary items recognised in the financial statements for the period ending immediately before the beginning of the first Ind AS financial reporting period. The exemption under Ind AS 101 will not be available for long-term foreign currency monetary items recognised after transition date.
Accordingly, the Company has elected to carry forward its policy to capitalise exchange differences on foreign currency monetary items that existed on transition date.
(iii) Designation of previously recognised financial instruments
Ind AS 101 allows an entity to designate investments in equity instruments at FVOCI on the basis of the facts and circumstances at the date of transition to Ind AS.
The Company has elected to apply this exemption for its investment in equity investments.
B. Mandatory exceptions
(i) Estimates
An entity’s estimates in accordance with Ind ASs at the date of transition to Ind AS shall be consistent with estimates made for the same date in accordance with previous GAAP (after adjustments to reflect any difference in accounting policies), unless there is objective evidence that those estimates were in error.
Ind AS estimates as at transition date are consistent with the estimates as at the same date made in conformity with previous GAAP.
(ii) Classification and measurement of financial assets
Ind AS 101 requires an entity to assess classification and measurement of financial assets on the basis of the facts and circumstances that exist at the date of transition to Ind AS.
C. Reconciliations between previous GAAP and Ind AS
Ind AS 101 requires an entity to reconcile equity, total comprehensive income and cash flows for prior periods. The following tables represent the reconciliations from previous GAAP to Ind AS.

190
53.1 Reconciliation of total equity as at March 31, 2018 and April 1, 2017
Note March 31, 2018 April 1, 2017
Total equity (shareholder's funds) as per Previous GAAP 233,954.88 241,927.93
Adjustments:
Incremental provision on application of expected credit loss model (h) (54,991.84) (18,179.00)
Increase in borrowing cost pursuant to application of effective interest rate method (e) 588.07 835.84
Amortisation of processing fees on loans based on effective interest rate (b) (6,437.55) (5,574.89)
Incremental impact of fair valuation of derivatives (d) (393.97) (546.54)
Others (0.28) (0.50)
Tax effect on adjustments (i) 21,215.76 8,164.57
Total adjustments (40,019.81) (15,300.52)
Total equity as per Ind AS 193,935.07 226,627.41
53.2 Reconciliation of total comprehensive income for the year ended March 31, 2018
Note March 31, 2018
Profit after tax as per Previous GAAP 2,470.46
Adjustments:
Incremental provision on application of expected credit loss model (h) (36,812.84)
(Increase)/ Decrease in borrowing cost pursuant to application of effective interest rate method (e) (247.77)
Amortisation of processing fees on loans based on effective interest rate (b) (862.66)
Incremental impact of fair valuation of derivatives (d) 309.02
Investments measured at fair value through other comprehensive income (a) 12,052.93
Remeasurements of post-employment benefit obligations (g) 24.46
Others 0.22
Tax effect of above adjustments (i) 13,042.73
Total adjustments (12,493.91)
Profit after tax as per Ind AS (10,023.45)
Other comprehensive income (a), (g) (12,068.93)
Total comprehensive income as per Ind AS (22,092.38)
53.3 Reconciliation of cash flow statement for the year ended March 31, 2018
There were no significant reconciliation items between cash flows prepared under Indian GAAP and those prepared under Ind AS.

191
53.4 Effect of IND AS adoption on the balance sheet as at March 31, 2018 and April 1, 2017
Particulars Notes Previous GAAP as at
March 31, 2018*
Adjustments Ind AS as atMarch 31, 2018
Previous GAAP as at
April 1, 2017*
Adjustments Ind AS as at April 1, 2017
ASSETS
Financial assets
Cash and cash equivalents 5,329.99 - 5,329.99 2,963.85 - 2,963.85
Bank balances other than above 492.70 - 492.70 587.94 - 587.94
Derivative financial instruments 2,500.68 - 2,500.68 2,711.18 - 2,711.18
Trade receivables 565.71 - 565.71 567.22 - 567.22
Loans (b), (h) 1,239,923.65 (59,289.55) 1,180,634.10 1,040,418.07 (21,211.94) 1,019,206.13
Investments 6,301.25 - 6,301.25 11,428.36 - 11,428.36
Other financial assets (c) 199.82 (25.02) 174.80 75.24 (5.09) 70.15
1,255,313.80 (59,314.57) 1,195,999.23 1,058,751.86 (21,217.03) 1,037,534.83
Non-financial Assets
Current tax assets (Net) 4,121.31 - 4,121.31 2,124.34 - 2,124.34
Deferred tax assets (Net) (i) 7,023.09 21,215.76 28,238.85 1,978.20 8,164.57 10,142.77
Property, Plant and Equipment 1,402.88 - 1,402.88 1,434.69 - 1,434.69
Capital work-in-progress 5.74 - 5.74 5.74 - 5.74
Other Intangible assets 16.69 - 16.69 64.30 - 64.30
Other non-financial assets (c) 1,704.78 24.75 1,729.53 627.90 4.57 632.47
14,274.49 21,240.51 35,515.00 6,235.17 8,169.14 14,404.31
TOTAL ASSETS 1,269,588.29 (38,074.06) 1,231,514.23 1,064,987.03 (13,047.89) 1,051,939.14
LIABILITIES AND EQUITY
LIABILITIES
Financial liabilities
Derivative financial instruments (d) - 758.22 758.22 - 906.54 906.54
Trade Payables
(i) total outstanding dues to micro and small enterprises
13.82 - 13.82 21.70 - 21.70
(ii) total outstanding dues of creditors other than micro and small enterprises
514.12 - 514.12 398.56 - 398.56
Debt securities (e) 98,421.59 (372.66) 98,048.93 141,813.45 (545.27) 141,268.18
Borrowings (Other than debt securities)
(e) 925,416.86 (579.66) 924,837.20 669,906.84 (650.56) 669,256.28
Other financial liabilities (b) 10,702.19 2,139.85 12,842.04 10,626.02 2,541.92 13,167.94
1,035,068.58 1,945.75 1,037,014.33 822,766.57 2,252.63 825,019.20
Non-Financial Liabilities
Provisions 310.81 - 310.81 229.75 - 229.75
Other non-financial liabilities 254.02 - 254.02 62.78 - 62.78
564.83 - 564.83 292.53 - 292.53
EQUITY
Equity share capital 64,228.33 - 64,228.33 64,228.33 - 64,228.33
Other equity 53.1 169,726.55 (40,019.81) 129,706.74 177,699.60 (15,300.52) 162,399.08
233,954.88 (40,019.81) 193,935.07 241,927.93 (15,300.52) 226,627.41
Total Liabilities and Equity 1,269,588.29 (38,074.06) 1,231,514.23 1,064,987.03 (13,047.89) 1,051,939.14
* The previous GAAP figures have been reclassified to confirm to Ind AS presentation requirements for the purpose of this note.
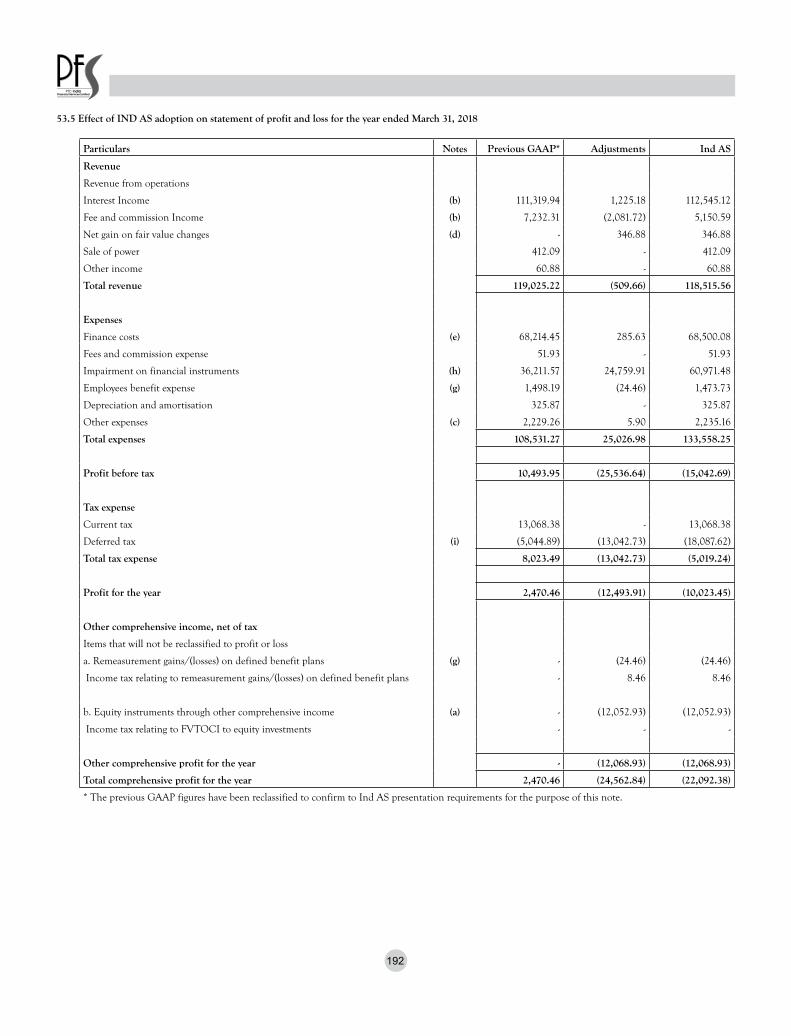
192
53.5 Effect of IND AS adoption on statement of profit and loss for the year ended March 31, 2018
Particulars Notes Previous GAAP* Adjustments Ind AS
Revenue
Revenue from operations
Interest Income (b) 111,319.94 1,225.18 112,545.12
Fee and commission Income (b) 7,232.31 (2,081.72) 5,150.59
Net gain on fair value changes (d) - 346.88 346.88
Sale of power 412.09 - 412.09
Other income 60.88 - 60.88
Total revenue 119,025.22 (509.66) 118,515.56
Expenses
Finance costs (e) 68,214.45 285.63 68,500.08
Fees and commission expense 51.93 - 51.93
Impairment on financial instruments (h) 36,211.57 24,759.91 60,971.48
Employees benefit expense (g) 1,498.19 (24.46) 1,473.73
Depreciation and amortisation 325.87 - 325.87
Other expenses (c) 2,229.26 5.90 2,235.16
Total expenses 108,531.27 25,026.98 133,558.25
Profit before tax 10,493.95 (25,536.64) (15,042.69)
Tax expense
Current tax 13,068.38 - 13,068.38
Deferred tax (i) (5,044.89) (13,042.73) (18,087.62)
Total tax expense 8,023.49 (13,042.73) (5,019.24)
Profit for the year 2,470.46 (12,493.91) (10,023.45)
Other comprehensive income, net of tax
Items that will not be reclassified to profit or loss
a. Remeasurement gains/(losses) on defined benefit plans (g) - (24.46) (24.46)
Income tax relating to remeasurement gains/(losses) on defined benefit plans - 8.46 8.46
b. Equity instruments through other comprehensive income (a) - (12,052.93) (12,052.93)
Income tax relating to FVTOCI to equity investments - - -
Other comprehensive profit for the year - (12,068.93) (12,068.93)
Total comprehensive profit for the year 2,470.46 (24,562.84) (22,092.38)
* The previous GAAP figures have been reclassified to confirm to Ind AS presentation requirements for the purpose of this note.

193
53.6 Notes to the reconciliations
(a) Under Indian GAAP, the Company accounted for long term investments in unquoted equity shares as investment measured at cost less provision for other than temporary diminution in the value of investments. Under Ind AS, the Company has designated such investments as FVOCI investments. Ind AS requires FVOCI investments to be measured at fair value. At the date of transition to Ind AS, difference between the instruments fair value and Indian GAAP carrying amount has been recognised as a separate component of equity, in the FVOCI reserve, net of related deferred taxes.
(b) Under Indian GAAP, transaction costs charged to customers was recognised upfront while under Ind AS, such costs are included in the initial recognition amount of financial asset and recognised as interest income using the effective interest method. Consequently loan to customers on date of transition date have decreased, professing fees for the year ended March 31, 2019 has decreased and interest income for the year ended March 31, 2018 has increased.
(c) Recognition of financial instruments comprising of security deposits at their fair value as opposed to transaction values as considered under IGAAP.
(d) Under Ind AS, the Company has opted exemption for continuing the policy adopted under the previous GAAP for accounting for exchange differences arising from translation of long-term foreign currency monetary items. Although, this exemption shall not be applied on foreign currency derivatives.
(e) Under Indian GAAP, transaction costs incurred on borrowings was charged to statement of profit and loss upfront while under Ind AS, such costs are included in the initial recognition amount of financial liabilities and recognised as interest expense using the effective interest method. Consequently borrowings on date of transition date have decreased and interest expense for the year ended 31 March 18 has increased.
(f) Under the previous GAAP, dividends proposed by the board of directors after the balance sheet date but before the approval of the financial statements were considered as adjusting events. Accordingly, provision for proposed dividend was recognised as a liability. Under Ind AS, such dividends are recognised when the same is approved by the shareholders in the general meeting.
(g) Under Ind AS, premeasurements i.e. actuarial gains and losses and the return on plan assets, excluding amounts included in the net interest expense on the net defined benefit liability are recognised in other comprehensive income instead of profit or loss. Under the previous GAAP, these remeasurements were forming part of the profit or loss for the year.
(h) Under Indian GAAP, the Company has created provision for impairment of loans to customer consists only in respect of specific amount for incurred losses and in accordance with regualtions of the Reserve Bank of India (RBI). Under Ind AS, impairment allowance has been determined based on Expected Credit Loss model (ECL). Impairment allowance for loan assets has been considered higher of provision in accordannce with RBI regualtions and expected credit loss model.
Also, under Indian GAAP provision for NPA and standard asset were presented under provisions. However, under Ind AS financial assets measured at amortised cost (majorly loans) are presented net of provision for expected credit losses. Consequently, the Company has reclassified the Indian GAAP provisions for standard assets / NPA’s.
(i) The various transitional adjustments lead to temporary differences. According to the accounting policies, the Company has to account for such differences. Deferred tax adjustments are recognised in correlation to the underlying transaction either in retained earnings or a separate component of equity.
For and on behalf of the Board of Directors
Sd/- Sd/- Dr. Pawan Singh Naveen Kumar Managing Director and CEO Whole-time Director DIN: 00044987 DIN: 00279627
Sd/- Sd/- Vishal Goyal Sanjay Rustagi Company Secretary Chief Financial Officer
Place: New Delhi Date : May 4, 2019

194

195
PTC India Financial Services Limited(A subsidiary of PTC India Limited)
CIN: L65999DL2006PLC153373(A subsidiary of PTC India Limited)
Registered Office: 7th Floor, Telephone Exchange Building, 8 Bhikaji Cama Place, New Delhi – 110 066, IndiaTel: +91 11 26737300 / 26737400 Fax: 011–26737373
Website: www.ptcfinancial.com E–mail: [email protected]
PROXY FORMFORM NO. MGT–11
[Pursuant to section 105(6) of the Companies Act, 2013 and rule 19(3) of the Companies (Management and Administration) Rules, 2014)]
13th Annual General Meeting– 30th September, 2019
Name of the Member(s):
Registered address:
E–mail id:
Folio No./Client Id:
DP ID:
I/We, being the member(s) of………………...............................................................................................……………shares of the above named company, hereby appoint
Name: Address
Email–Id: Signature:
or failing him/her
Name: Address
Email–Id: Signature:
or failing him/her
Name: Address
Email–Id: Signature:
or failing him/her
as my/our proxy to attend and vote (on a poll) for me/us and on my/ our behalf at the 13th Annual General Meeting of the Company, to be held on Monday, 30th September, 2019 at 10:30 A.M. at Dr. SRKVS Auditorium (Dr. Sarvepalli Radhakrishnan Auditorium), Kendriya Vidyalaya No. 2, APS Colony, Gurgaon Road Delhi Cantt, New Delhi– 110010 and at any adjournment thereof in respect of such resolutions as are indicated below:
Vote (Optional see Note no. 2)
S. No. RESOLUTIONS For Against
Ordinary Businesses:
1 To consider and adopt the (a) Audited Standalone Financial Statements of the Company for the financial year ended 31st March, 2019, together with Board’s Report, and report of Auditor’s thereon and (b) Audited Consolidated Financial Statements of the Company for the financial year ended 31st March, 2019 and report of Auditor’s thereon.
2 To recommend dividend for the Financial Year 2018–19
3 To re–appoint Shri Naveen Kumar (DIN : 00279627) who retires by rotation at this Annual General Meeting and being eligible has offered himself for re–appointment.
4 To appoint M/s. MSKA & Associates, Chartered Accountants as Statutory Auditors and to fix their remuneration
Special Businesses:
5 To appoint Dr. Pawan Singh (DIN : 00044987) as Managing Director & CEO of the Company
6 To re–appoint Mrs. Pravin Tripathi (DIN: 06913463) as an Independent Director of the Company
7 To appoint Dr. Nagesh Singh (08550944) as an Independent Director of the Company
Signed this.................................................................................. day of...............................................................2019
Signature of Shareholder :................................................................... Signature of proxy holder(s) : ...........................................................................
AffixRe. 1/–Revenue Stamp

196
Note:
1. This form of proxy in order to be effective should be duly completed and deposited at the Registered Office of the Company, not less than 48 hours before the commencement of the Annual General Meeting.
2. It is optional to indicate your preference. If you leave the ‘for’ or ‘against’ column blank against any or all of the resolutions, your proxy will be entitled to vote in the manner as he/she may deem appropriate.
3. For the resolutions, Explanatory Statement and Notes, please refer to the Notice of the 13th Annual General Meeting.

197
PTC India Financial Services Limited(A subsidiary of PTC India Limited)
CIN: L65999DL2006PLC153373
Registered Office: 7th Floor, Telephone Exchange Building, 8 Bhikaji Cama Place, New Delhi – 110 066, IndiaTel: +91 11 26737300, Fax: +91 11 26737373
Website: www.ptcfinancial.com E–mail: [email protected]
ATTENDANCE SLIP13TH ANNUAL GENERAL MEETING– 30TH SEPTEMBER, 2019
PLEASE COMPLETE THE ATTENDENCE SLIP AND HAND IT OVER AT THE ENTRANCE OF THE MEETING HALL. PLEASE ALSO BRING YOUR COPY OF THE ANNUAL REPORT.JOINT HOLDRS MAY OBTAIN ATTENDANCE SLIP ON RQUEST.
I hereby record my presence at the 13th Annual General Meeting to be held on Monday, the 30th September, 2019 at 10:30 A.M. at “Dr. SRKVS Auditorium (Dr. Sarvepalli Radhakrishnan Auditorium), Kendriya Vidyalaya No. 2, APS Colony, Gurgaon Road Delhi Cantt, New Delhi– 110010”
DP ID No.* Folio No.
Client ID No.* No. of shares
Name of the shareholder
Address of the shareholder
* Applicable for investors holding shares in electronic form
.............................................................................. .............................................................................. Name of member / proxy Signature of member / proxy (in BLOCK Letters)

198

199
PTC India Financial Services Limited(A subsidiary of PTC India Limited)
CIN: L65999DL2006PLC153373
Registered Office: 7th Floor, Telephone Exchange Building, 8 Bhikaji Cama Place, New Delhi – 110 066, IndiaTel: +91 11 26737300, Fax: +91 11 26737373
Website: www.ptcfinancial.com E–mail: [email protected]
Form No. MGT–12 Polling paper
[Pursuant to Section 109(5) of the Companies Act, 2013 and rule 21 (1) (c) of the Companies (Management and Administration) Rules, 2014]
BALLOT PAPERS. No. Particulars Details
1. Name of the First Shareholder
2. Postal Address
3. Registered folio No. / *Client ID No. (*Applicable to investors holding shares in dematerialized form)
4. Class of Share
I hereby exercise my vote in respect of Ordinary / Special resolution enumerated below by recording my assent or dissent to the said resolution in the following manner:
S. No. Item No. No. of shares held by me
I assent to the resolution
I dissent from the resolution
Ordinary Businesses:
1. To consider and adopt the (a) Audited Standalone Financial Statements of the Company for the financial year ended 31st March, 2019, together with Board’s Report, and report of Auditor’s thereon and (b) Audited Consolidated Financial Statements of the Company for the financial year ended 31st March, 2019 and report of Auditor’s thereon.
2. To recommend dividend for the Financial Year 2018–19
3. To re–appoint Shri Naveen Kumar (DIN : 00279627) who retires by rotation at this Annual General Meeting and being eligible has offered himself for re–appointment.
4. To appoint MSKA & Associates, Chartered Accountants as Statutory Auditors and to fix their remuneration
Special Businesses:
5. To appoint Dr. Pawan Singh (DIN : 00044987) as Managing Director & CEO of the Company
6. To re–appoint Mrs. Pravin Tripathi (DIN: 06913463) as an Independent Director of the Company
7. To appoint Dr. Nagesh Singh (08550944) as an Independent Director of the Company
Place:
Date: (Signature of the Shareholder)

200
INSTRUCTIONS:
1. Members may fill up the ballot form printed and submit the same to the scrutinizer, M/s. Ashish Kapoor & Associates, Practicing Company Secretary.
2. Unsigned, incomplete or incorrectly ticked forms are liable to be rejected and the decision of the scrutinizer on the validity of the forms will be final.
3. In case the member casts his votes through both the processes i.e., e–voting and physical ballot form, the votes in the electronic system would be considered and the ballot form would be ignored.
4. The right of voting by ballot form shall not be exercised by a proxy.
5. To avoid fraudulent transactions, the identity/signature of the members holding shares in electronic/ demat form is verified with the specimen signatures furnished by National Securities Depository Ltd. (NSDL)/ Central Depository Services Ltd. (CDSL) and that of members holding shares in physical form is verified as per the records of the share transfer agent of the Company i.e. Karvy Fintech Pvt. Ltd.. Members are requested to keep the same updated.
6. The votes should be cast either in favour or against by putting the tick (/) mark in the column provided for asset or dissent. Postal Ballot Form bearing tick marks in both the columns will render the Postal Ballot Form invalid.
7. Voting rights shall be reckoned on the paid up value of the shares registered in the name(s) of the Member(s) / Beneficial Owner(s) on the date of dispatch of the Notice.
8. There will be only one Ballot Form for every Folio/ DP ID & Client ID irrespective of the number of joint members
9. In case of joint holders, the Ballot Form should be signed by the first named shareholder and in his/her absence by the next named shareholders. Ballot form signed by a joint shareholder shall be treated valid if signed as per records available with the Company and the Company shall not entertain any objection on such Ballot Form signed by other joint holders.
10. Where the Ballot Form has been signed by an authorized representative of the Body Corporate/ Trust/ Society etc., a certified copy of the relevant authorization/ Board Resolution to vote should accompany the ballot Form.
11. Instructions for e–voting procedure are available in the Notice of the AGM. Please follow the steps for e–voting procedure as given in the Notice of AGM or as available on www.evoting.nsdl.com
12. The Date of declaration of the results of postal ballot shall be taken to be the date of Passing of the resolution.

201
PTC India Financial Services Limited(A subsidiary of PTC India Limited)
CIN: L65999DL2006PLC153373
Registered Office: 7th Floor, Telephone Exchange Building, 8 Bhikaji Cama Place, New Delhi – 110 066, IndiaTel: +91 11 26737300, Fax: +91 11 26737373
Website: www.ptcfinancial.com E–mail: [email protected]
FORM FOR ECS MANDATE/BANK MANDATEUNIT: PTC India Financial Services Limited
I/We do hereby authorize the Company:–
1) Credit my dividend amount directly to my Bank Account as per details furnished below by Electronic Clearing Service (ECS)
2) Print the details of my Bank Account as furnished below, on my dividend warrant which will be mailed to me
Folio No:
Name of the 1st Shareholder:
Name of the Bank:
Branch:
Bank Address with Pin code:
Bank Account Number:
Account Type (Savings/Current/Others):
9 Digit MICR Code number:
(Please provide a cancelled / Photo copy cheque)
Registered Address:
Signature of 1st holder Signature of 2nd holder Signature of 3rd holder
(Please provide an attested copy of PAN Card of the 1st holder along with this request)

Route Map of the location of Annual General Meeting

NOTES

NOTES


Des
ign
& P
rinte
d at
MP
Prin
ters
, Noi
da
“Growing Responsibily for Customer Delight”
PTC India Financial Services Ltd.(A Subsidiary of PTC India Limited)
CIN: L65999DL2006PLC153373
Registered Office:7th Floor Telephone Exchange Building, 8 Bhikaji Cama Place, New Delhi 110066 INDIA
Tel: +91 11 26737300/ 26737400, Fax: +91 11 26737373/ 26737374Website: www.ptcfinancial.com