![[XLS] · Web view6117 4 4.3 6120 4 4.3 6125 13 13.3 6130 13 13.3 6135 13 13.3 6140 13 13.3 6145 13 13.3 6150 13 13.3 6160 13 13.3 6210 4 4.3 6220 13 13.3 6230 4 4.3 6240 4 4.3 6250](https://static.fdocuments.in/doc/165x107/5b2a094f7f8b9a251e8b792d/xls-web-view6117-4-43-6120-4-43-6125-13-133-6130-13-133-6135-13-133-6140.jpg)
13.3 2.3 Graphing Proportional Relationships · 2015-03-27 · Section 13.3 Graphing Proportional...
6
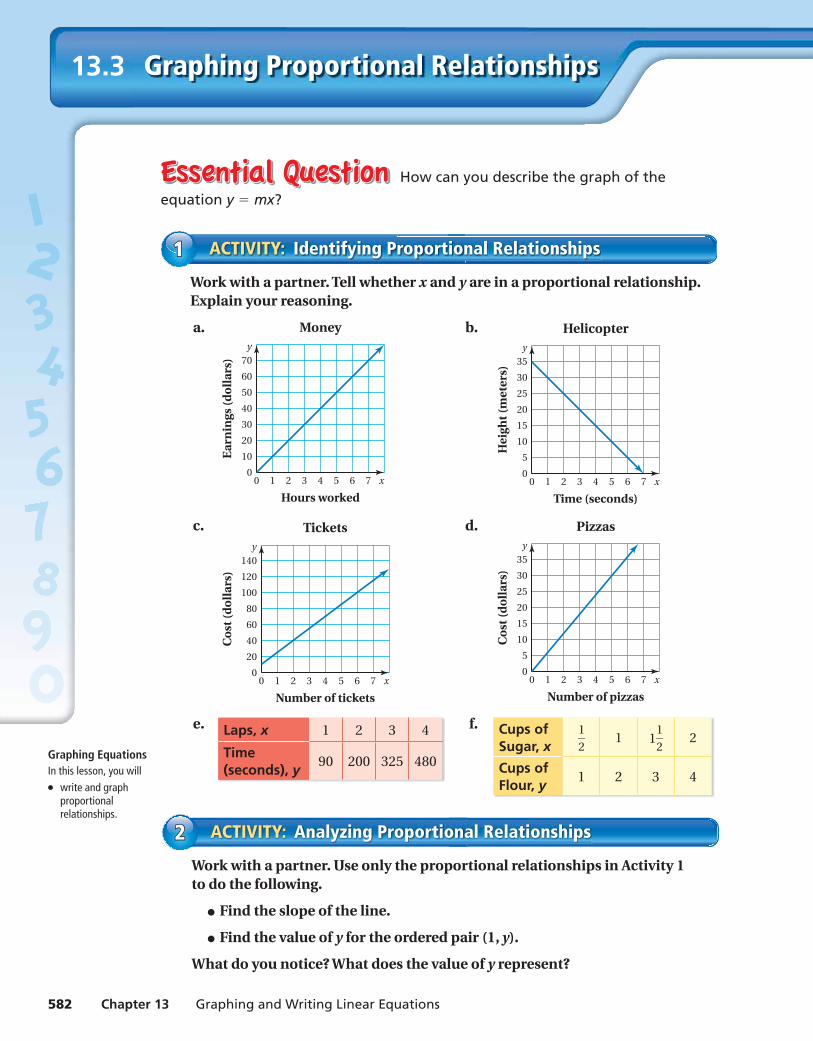
582 Chapter 13 Graphing and Writing Linear Equations 2.3 How can you describe the graph of the equation y = mx? Work with a partner. Tell whether x and y are in a proportional relationship. Explain your reasoning. a. 0 0 20 40 60 30 10 50 70 2 4 Hours worked Money Earnings (dollars) 6 1 3 5 7 x y b. 0 0 10 20 30 15 5 25 35 2 4 Time (seconds) Helicopter Height (meters) 6 1 3 5 7 x y c. 0 0 40 80 120 60 20 100 140 2 4 Number of tickets Tickets Cost (dollars) 6 1 3 5 7 x y d. 0 0 10 20 30 15 5 25 35 2 4 Number of pizzas Pizzas Cost (dollars) 6 1 3 5 7 x y e. Laps, x 1 2 3 4 Time (seconds), y 90 200 325 480 f. Cups of Sugar, x 1 — 2 1 1 1 — 2 2 Cups of Flour, y 1 2 3 4 ACTIVITY: Identifying Proportional Relationships 1 1 Graphing Equations In this lesson, you will ● write and graph proportional relationships. Graphing Proportional Relationships 13.3 Work with a partner. Use only the proportional relationships in Activity 1 to do the following. ● Find the slope of the line. ● Find the value of y for the ordered pair (1, y). What do you notice? What does the value of y represent? ACTIVITY: Analyzing Proportional Relationships 2 2
Transcript of 13.3 2.3 Graphing Proportional Relationships · 2015-03-27 · Section 13.3 Graphing Proportional...
582 Chapter 13 Graphing and Writing Linear Equations
2.3
How can you describe the graph of the
equation y = mx?
Work with a partner. Tell whether x and y are in a proportional relationship. Explain your reasoning.
a.
00
20
40
60
30
10
50
70
2 4
Hours worked
Money
Ear
nin
gs (d
oll
ars)
61 3 5 7 x
y
b.
00
10
20
30
15
5
25
35
2 4
Time (seconds)
Helicopter
Hei
ght (
met
ers)
61 3 5 7 x
y
c.
00
40
80
120
60
20
100
140
2 4
Number of tickets
Tickets
Co
st (d
oll
ars)
61 3 5 7 x
y
d.
00
10
20
30
15
5
25
35
2 4
Number of pizzas
Pizzas
Co
st (d
oll
ars)
61 3 5 7 x
y
e. Laps, x 1 2 3 4
Time (seconds), y
90 200 325 480
f. Cups of Sugar, x
1 — 2 1 1
1 — 2 2
Cups of Flour, y
1 2 3 4
ACTIVITY: Identifying Proportional Relationships11
Graphing EquationsIn this lesson, you will● write and graph
proportional relationships.
Graphing Proportional Relationships13.3
Work with a partner. Use only the proportional relationships in Activity 1 to do the following.
● Find the slope of the line.
● Find the value of y for the ordered pair (1, y).
What do you notice? What does the value of y represent?
ACTIVITY: Analyzing Proportional Relationships22
ms_accel_pe_1303.indd 582ms_accel_pe_1303.indd 582 2/24/15 8:38:09 AM2/24/15 8:38:09 AM
Section 13.3 Graphing Proportional Relationships 583
Use what you learned about proportional relationships to complete Exercises 3 – 6 on page 586.
4. IN YOUR OWN WORDS How can you describe the graph of the equation y = mx ? How does the value of m affect the graph of the equation?
5. Give a real-life example of two quantities that are in a proportional relationship. Write an equation that represents the relationship and sketch its graph.
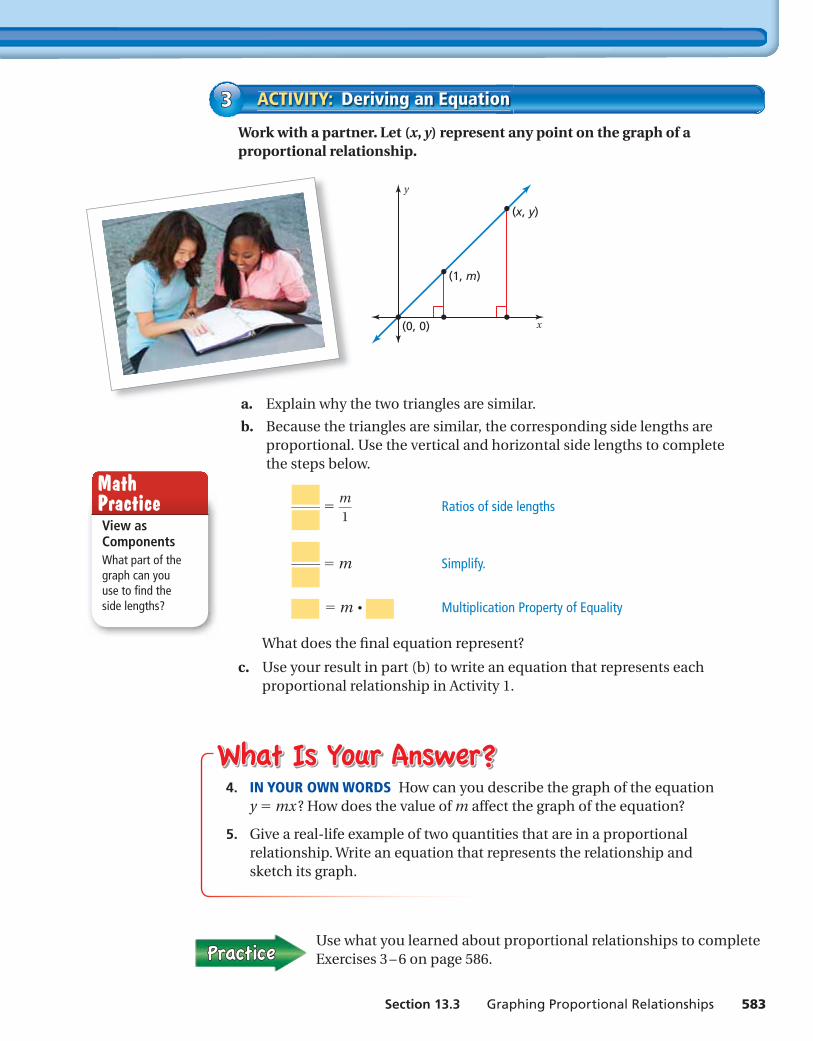
Work with a partner. Let (x, y) represent any point on the graph of a proportional relationship.
y
x(0, 0)
(1, m)
(x, y)
a. Explain why the two triangles are similar.
b. Because the triangles are similar, the corresponding side lengths are proportional. Use the vertical and horizontal side lengths to complete the steps below.
— = m
— 1
Ratios of side lengths
— = m Simplify.
= m ⋅ Multiplication Property of Equality
What does the fi nal equation represent?
c. Use your result in part (b) to write an equation that represents each proportional relationship in Activity 1.
ACTIVITY: Deriving an Equation33
View as ComponentsWhat part of the graph can you use to fi nd the side lengths?
Math Practice
ms_accel_pe_1303.indd 583ms_accel_pe_1303.indd 583 2/24/15 8:38:21 AM2/24/15 8:38:21 AM
584 Chapter 13 Graphing and Writing Linear Equations
Lesson13.3Lesson Tutorials
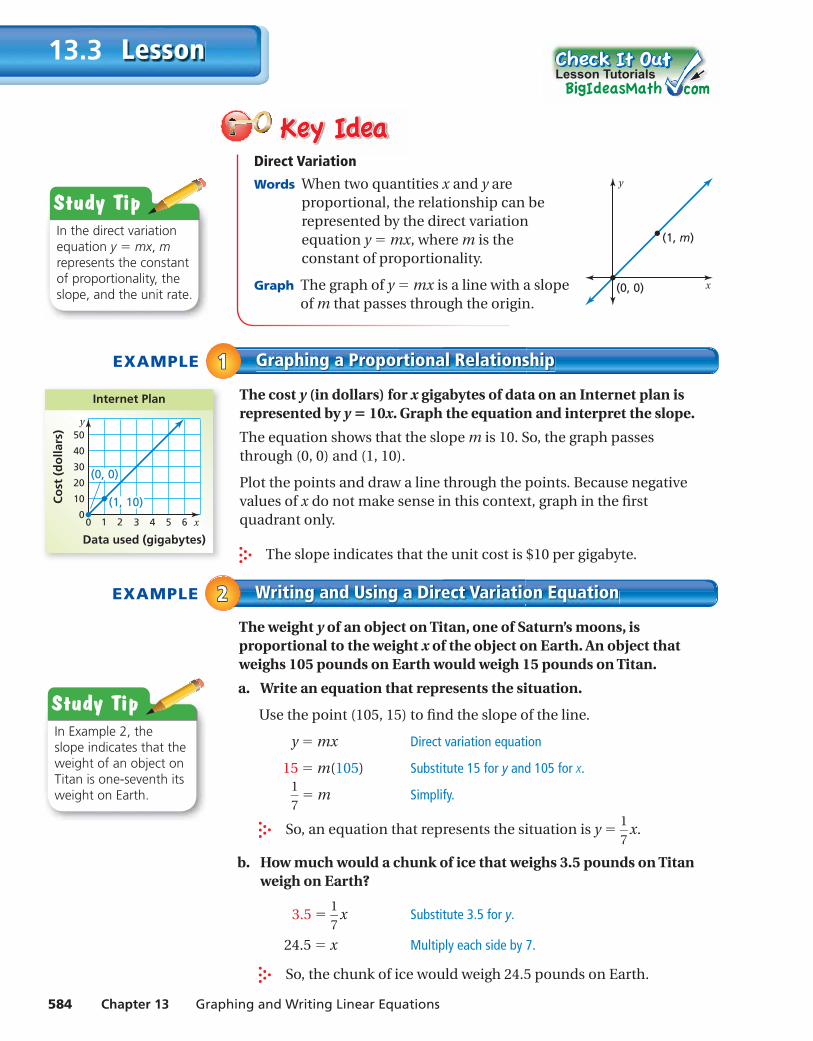
Direct Variation
Words When two quantities x and y are proportional, the relationship can be represented by the direct variation equation y = mx, where m is the constant of proportionality.
Graph The graph of y = mx is a line with a slope of m that passes through the origin.
EXAMPLE Graphing a Proportional Relationship11The cost y (in dollars) for x gigabytes of data on an Internet plan is represented by y = 10x. Graph the equation and interpret the slope.
The equation shows that the slope m is 10. So, the graph passes through (0, 0) and (1, 10).
Plot the points and draw a line through the points. Because negative values of x do not make sense in this context, graph in the fi rst quadrant only.
The slope indicates that the unit cost is $10 per gigabyte.
Study TipIn the direct variation equation y = mx, m represents the constant of proportionality, the slope, and the unit rate.
Study TipIn Example 2, the slope indicates that the weight of an object on Titan is one-seventh its weight on Earth.
EXAMPLE Writing and Using a Direct Variation Equation22The weight y of an object on Titan, one of Saturn’s moons, is proportional to the weight x of the object on Earth. An object that weighs 105 pounds on Earth would weigh 15 pounds on Titan.
a. Write an equation that represents the situation.
Use the point (105, 15) to fi nd the slope of the line.
y = mx Direct variation equation
15 = m(105) Substitute 15 for y and 105 for x.
1
— 7
= m Simplify.
So, an equation that represents the situation is y = 1
— 7
x.
b. How much would a chunk of ice that weighs 3.5 pounds on Titan weigh on Earth?
3.5 = 1
— 7
x Substitute 3.5 for y.
24.5 = x Multiply each side by 7.
So, the chunk of ice would weigh 24.5 pounds on Earth.
y
x(0, 0)
(1, m)
x
y
30
40
20
10
642 531
50
Data used (gigabytes)
Co
st (
do
llars
)
Internet Plan
00
(1, 10)
(0, 0)
ms_accel_pe_1303.indd 584ms_accel_pe_1303.indd 584 2/24/15 8:38:30 AM2/24/15 8:38:30 AM
Section 13.3 Graphing Proportional Relationships 585
1. WHAT IF? In Example 1, the cost is represented by y = 12x. Graph the equation and interpret the slope.
2. In Example 2, how much would a spacecraft that weighs 3500 kilograms on Earth weigh on Titan?
Exercises 7–8
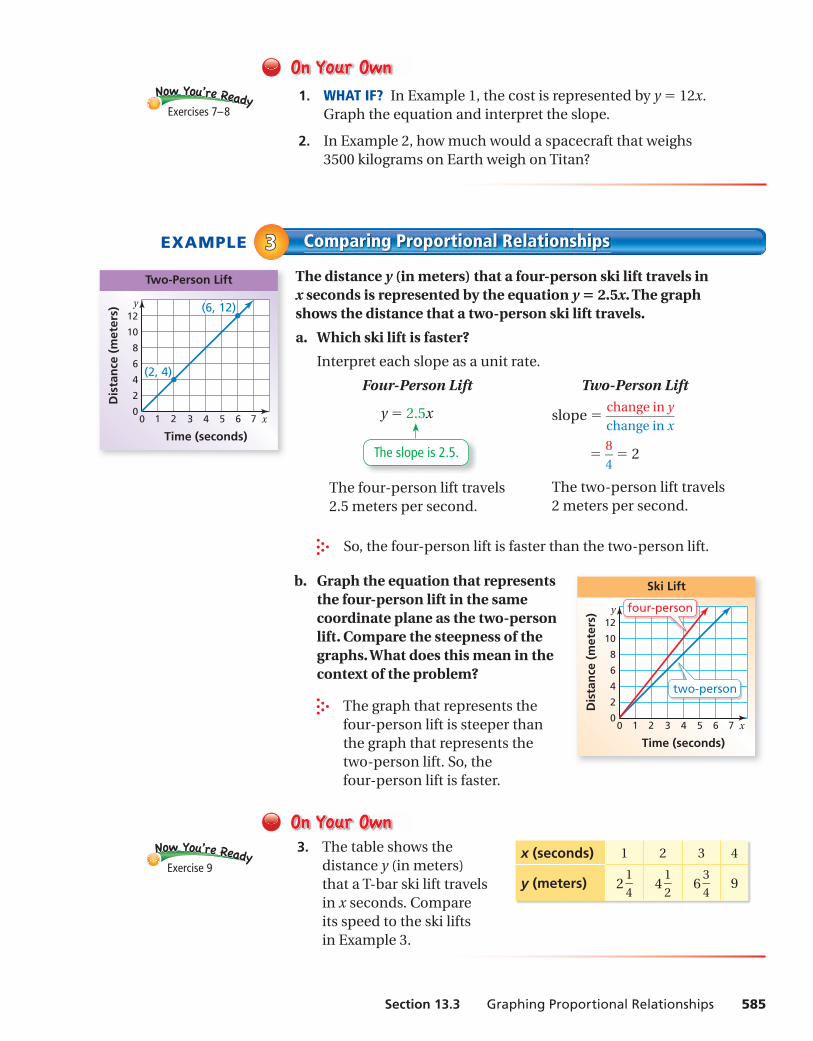
The distance y (in meters) that a four-person ski lift travels in x seconds is represented by the equation y = 2.5x. The graph shows the distance that a two-person ski lift travels.
a. Which ski lift is faster?
Interpret each slope as a unit rate.
Four-Person Lift Two-Person Lift
y = 2.5x
So, the four-person lift is faster than the two-person lift.
b. Graph the equation that represents the four-person lift in the same coordinate plane as the two-person lift. Compare the steepness of the graphs. What does this mean in the context of the problem?
The graph that represents the four-person lift is steeper than the graph that represents the two-person lift. So, the four-person lift is faster.
3. The table shows the distance y (in meters) that a T-bar ski lift travels in x seconds. Compare its speed to the ski lifts in Example 3.
EXAMPLE Comparing Proportional Relationships33
slope = change in y
— change in x
= 8
— 4
= 2
The two-person lift travels 2 meters per second.
The four-person lift travels 2.5 meters per second.
The slope is 2.5.
x
y
6
8
4
2
642 7531
10
12
Time (seconds)
Dis
tan
ce (
met
ers)
Two-Person Lift
(6, 12)
00
(2, 4)
x
y
6
8
4
2
642 7531
10
12
Time (seconds)
Dis
tan
ce (
met
ers)
Ski Lift
00
four-person
two-person
Exercise 9x (seconds) 1 2 3 4
y (meters) 2 1
— 4 4 1
— 2 6 3
— 4 9
ms_accel_pe_1303.indd 585ms_accel_pe_1303.indd 585 2/24/15 8:38:33 AM2/24/15 8:38:33 AM
586 Chapter 13 Graphing and Writing Linear Equations
Exercises13.3
9+(-6)=3
3+(-3)=
4+(-9)=
9+(-1)=
1. VOCABULARY What point is on the graph of every direct variation equation?
2. REASONING Does the equation y = 2x + 3 represent a proportional relationship? Explain.
Tell whether x and y are in a proportional relationship. Explain your reasoning. If so, write an equation that represents the relationship.
3.
00
10
20
30
15
5
25
35
2 4 61 3 5 7 x
y 4.
00
8
16
24
12
4
20
28
2 4 61 3 5 7 x
y
5. x 3 6 9 12
y 1 2 3 4
6. x 2 5 8 10
y 4 8 13 23
7. TICKETS The amount y (in dollars) that you raise by selling x fundraiser tickets is represented by the equation y = 5x. Graph the equation and interpret the slope.
8. KAYAK The cost y (in dollars) to rent a kayak is proportional to the number x of hours that you rent the kayak. It costs $27 to rent the kayak for 3 hours.
a. Write an equation that represents the situation.
b. Interpret the slope.
c. How much does it cost to rent the kayak for 5 hours?
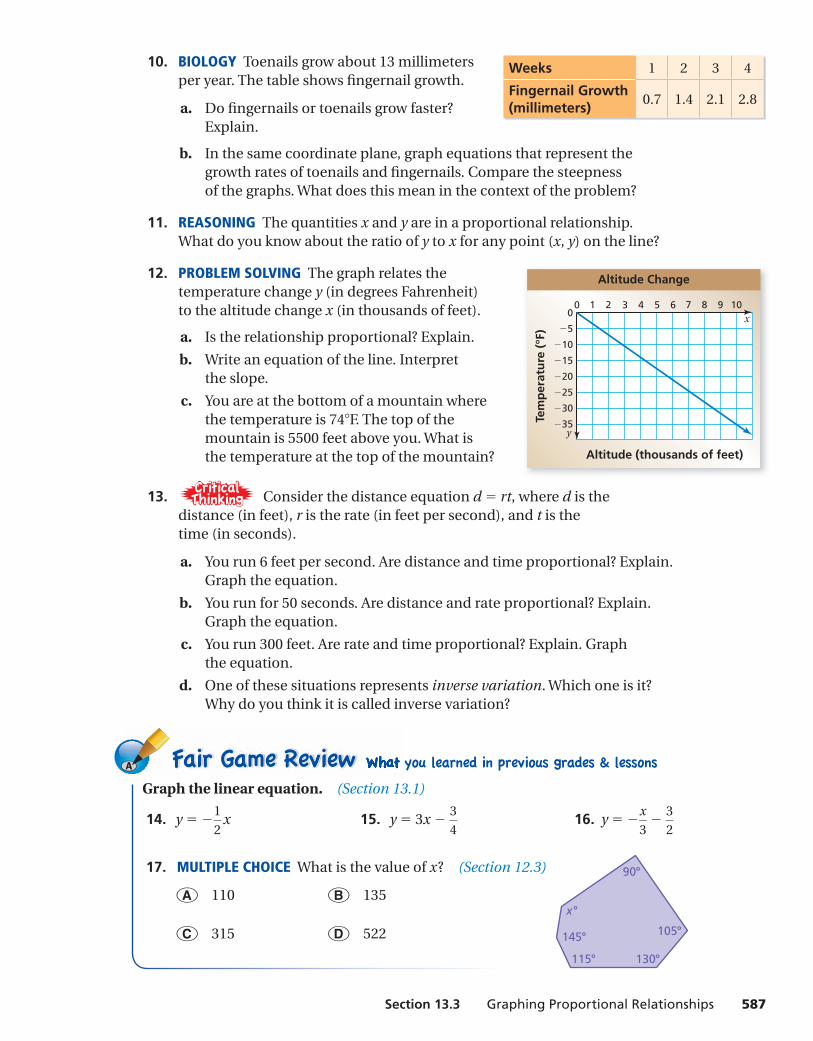
9. MILEAGE The distance y (in miles) that a truck travels on x gallons of gasoline is represented by the equation y = 18x. The graph shows the distance that a car travels.
a. Which vehicle gets better gas mileage? Explain how you found your answer.
b. How much farther can the vehicle you chose in part (a) travel than the other vehicle on 8 gallons of gasoline?
Help with Homework
11
22
33
x
y
75
100
50
25
42 531
125
Gasoline (gallons)
Dis
tan
ce (
mile
s)
Car
00
ms_accel_pe_1303.indd 586ms_accel_pe_1303.indd 586 2/24/15 8:38:34 AM2/24/15 8:38:34 AM
Section 13.3 Graphing Proportional Relationships 587
Graph the linear equation. (Section 13.1)
14. y = − 1
— 2
x 15. y = 3x − 3
— 4
16. y = − x
— 3
− 3
— 2
17. MULTIPLE CHOICE What is the value of x? (Section 12.3)
○A 110 ○B 135
○C 315 ○D 522
10. BIOLOGY Toenails grow about 13 millimeters per year. The table shows fi ngernail growth.
a. Do fi ngernails or toenails grow faster?Explain.
b. In the same coordinate plane, graph equations that represent the growth rates of toenails and fi ngernails. Compare the steepness of the graphs. What does this mean in the context of the problem?
11. REASONING The quantities x and y are in a proportional relationship. What do you know about the ratio of y to x for any point (x, y) on the line?
12. PROBLEM SOLVING The graph relates the temperature change y (in degrees Fahrenheit) to the altitude change x (in thousands of feet).
a. Is the relationship proportional? Explain.
b. Write an equation of the line. Interpret the slope.
c. You are at the bottom of a mountain where the temperature is 74°F. The top of the mountain is 5500 feet above you. What is the temperature at the top of the mountain?
13. Consider the distance equation d = rt, where d is the distance (in feet), r is the rate (in feet per second), and t is the time (in seconds).
a. You run 6 feet per second. Are distance and time proportional? Explain. Graph the equation.
b. You run for 50 seconds. Are distance and rate proportional? Explain. Graph the equation.
c. You run 300 feet. Are rate and time proportional? Explain. Graph the equation.
d. One of these situations represents inverse variation. Which one is it? Why do you think it is called inverse variation?
Weeks 1 2 3 4
Fingernail Growth(millimeters)
0.7 1.4 2.1 2.8
x
y
25
20
30
35
642 7 8 9 10531
15
10
5
Altitude (thousands of feet)
Tem
per
atu
re (
°F)
Altitude Change
00
90
105
130115
145
x
ms_accel_pe_1303.indd 587ms_accel_pe_1303.indd 587 2/24/15 8:38:38 AM2/24/15 8:38:38 AM