Interpreting Inner Mongolia’s Cultural Heritage: A Study ...
Upload
the-business-council-of-mongoliaCategory
view
174download
1
3rd Annual Mongolia – Trade and Commodity Finance Conference
Mongolia’s promise of mineral wealth

2
Contents
1. Global Mining – Macro
2. Near Term Outlook for Mongolia
3. Medium Term Outlook for Met Coal and Copper
4. Capital Markets
5. Attracting more investment
6. What ING can offer

Global Mining – MacroWeakening as demand remains sluggish and supply catches up

4
China’s growth has slowed...
Source: EMED data service, ING Bank
0
500
1,000
1,500
2,000
2,500
3,000
3,500
1992
CN
Y bi
llion
s
Actual
1Q94-4Q01 Trend (8.7% growth)
1Q02-3Q08 Trend (11.5% growth)
1Q11-1Q14 Trend (7.7% growth)
China – Real GDP – Seasonally Adjusted
8
16
32
64
128
256
512
1024
2048
Post-WWII tofirst oil shock(9.2% growth)
Source: Bloomberg, ING Bank
Global Trade, US$ billions, 3 mma, log scale
Oil Shocks
Volc
ker
Rec
essi
on
Reagan Boom to Asian Crisis (9.5% growth)
China joins WTO(17%)
GFC and QE
911
SARS
Tech boom bust
SARS

5
0% 20% 40% 60% 80%
Iron Ore(seaborne)
Iron Ore(total)
Met Coal(seaborne)
Met Coal(total)
Lead
Aluminium
Copper
Nickel
Crude Oil
LNG
2006
2009
2012
2015
but expansion plans seem to have overshot
Source: UBS
China drives demand for commodities Supply has finally caught up (global supply growth since 2006)
-0.1 0.1 0.3 0.5 0.7 0.9 1.1
Iron Ore (seaborne)
Iron Ore (total)
Met Coal (seaborne)
Met Coal (total)
Lead
Aluminium
Copper
Nickel
Crude Oil
LNG
'06-'09
'06-'12
'06-'15
Source: IEA, CRU, UBS

Near term outlookExports and FDI remain under pressure

7
with prices are falling into the cost curve
Source: Bloomberg, GS, UBS
Copper Price relative to cost curve in USD / ton Seaborne Metallurgical Coal Price relative to cost curve in USD / ton
0
2,000
4,000
6,000
8,000
10,000
12,000
2006 2008 2009 2010 2012 2013 2014
C1 Cash Cost 75th percentile
C1 Cash Cost 90th percentile
90th percentile Sustaining Costs
0
50
100
150
200
250
300
350
2006 2008 2009 2010 2012 2013 2014
C1 Cash Cost 75th percentile
C1 Cash Cost 90th percentile
Sustaining Cash Costs
Source: WoodMackenzie, Bloomberg

8
-30
-20
-10
0
10
20
30
40
2010 2011 2012 2013
ConsumptionInvestmentNet Exports
Weaker prices and exports, and lower FDI
Source: EMED data service, ING Bank
Mongolia – Sources of GDP Growth – in %
0
500
1,000
1,500
2,000
2,500
3,000
3,500
4,000
4,500
2008 2009 2010 2011 2012 2013 20140%
10%
20%
30%
40%
50%
60%
70%
80%
2008 2009 2010 2011 2012 2013
Mongolia - Reserve Money Growth - in % Mongolia – International Reserves – in USDm

OutlookCopper and Metallurgical Coal – medium term

10
Met Coal – limited structural upside
0
50
100
150
200
250
300
350
-5
0
5
10
15
20
2011 2012 2013 2014 2015 2016 2017
Surplus/Deficit Benchmark Forecast
0
1
2
3
4
5
6
7
8
9
2007 2008 2009 2010 2011 2012 2013 2014 2015 2016 2017
0%
10%
20%
30%
40%
50%
60%
70%
Jan/11 Jun/12 Oct/13 Mar/15 Jul/16
Chinese Imports - in million tons per month Will this further displace Mongolian Metallurgical Coal?
Market Position Seaborne Coking Coal– million tons per annum
Source: Chinese Customs
Source: AME, Analyst Concensus Source: Anglo American Mongolia, Analyst Concensus

11
Copper – ST downside, structural support
-
1,000
2,000
3,000
4,000
5,000
6,000
7,000
8,000
9,000
10,000
-
5
10
15
20
25
30
2008 2009 2010 2011 2012 2013 2014
CCFD SHFE Comex
LME Copper Price
Copper Inventories – high but reducing – in days of production
0.00%
1.00%
2.00%
3.00%
4.00%
5.00%
6.00%
7.00%
8.00%
0
5
10
15
20
25
30
2008 2009 2010 2011 2012 2013 2014F 2015F 2016F
Capex Spend
Supply Growth
Copper Production – Significant Expansion Growth
0 5,000 10,000 15,000
-5,000
-3,000
-1,000
1,000
3,000
5,000
7,000
9,000
But Supported by the cash cost curve

Capital MarketsStrong Bank Liquidity – weak equity markets

13
Drop in prices is hurting valuations
Source: ING, Bloomberg
Equity Valuations by Commodity Class - in % from 2010 peak
-80%
-60%
-40%
-20%
0%
20%
40%
60%
2010 2011 2012 2012 2013 2013 2014 2014
BBG World Coal Equity Index
Gold Equities
Copper Equities
Iron Ore Equities
2007 2008 2008 2009 2009 2010 2010

14
0
200
400
600
800
1,000
1,200
1,400
4/1/
2008
7/1/
2008
10/1
/200
8
1/1/
2009
4/1/
2009
7/1/
2009
10/1
/200
9
1/1/
2010
4/1/
2010
7/1/
2010
10/1
/201
0
1/1/
2011
4/1/
2011
7/1/
2011
10/1
/201
1
1/1/
2012
4/1/
2012
7/1/
2012
10/1
/201
2
1/1/
2013
4/1/
2013
7/1/
2013
10/1
/201
3
1/1/
2014
putting the exploration sector on life support
Source: SNL Metal Strategies 2014
Total Equity Raised for the mining sector – in USD million (TSX, ASX) Global Exploration Spending - in USD billion
0.0
5.0
10.0
15.0
20.0
25.0
Source: SNL Metal Strategies
Equity market effectively closed

15
-500
-300
-100
100
300
500
700
900
1,100
1,300
1,500Mines Closed Pre-Feasibility on Hold Feasibility Cancelled New Mines Pre Feasibility Feasibility Studies
and halting new mine development studies
Source: SNL Metal Strategies 2014
Newly added in situ resources by value - in USD million
Hardly any feasibility work

16
but Bank market liquidity remains strong
Source: Dealogic
Total Metals & Mining Bank Debt Volumes, USD million
0
20
40
60
80
100
120
140
160
180
200
0
10000
20000
30000
40000
50000
60000
70000
80000
90000
100000
2009Q1
2009Q2
2009Q3
2009Q4
2010Q1
2010Q2
2010Q3
2010Q4
2011Q1
2011Q2
2011Q3
2011Q4
2012Q1
2012Q2
2012Q3
2012Q4
2013Q1
2013Q2
2013Q3
2013Q4
2014Q1
EMEA Asia Americas Deals

Preparing for the next cycleMarket perception and sentiment will be key

18
Mongolia – lost the hype?

19
Obvious potential for mineral wealth...Plenty of Potential – Geological Potential
Mongolia
Source: 2012/2013 Fraser Institute Ranking of Potential
Mongolia
Held back by regulatory environment – Policy Perception

20
...but realising that requires a reliable partnerMine development nowadays takes in excess of 10 years from discovery
81st37th 49th36th52nd
Purported Erdenet Default on SB loan
SEFIL / Southgobi
Chalco Dispute On TT prepay
New Mining Law
Suspension of exploration licenses
Desire to renegotiate the OT investment agreement
Khan / ARMZ sage – in arbitration
OT Investment Agreement
AwardedTT IPO Process, partner search
2009 2010 2011 2012 2013 2014
??
OT Financing Agreed OT Financing Delayed
Suspended

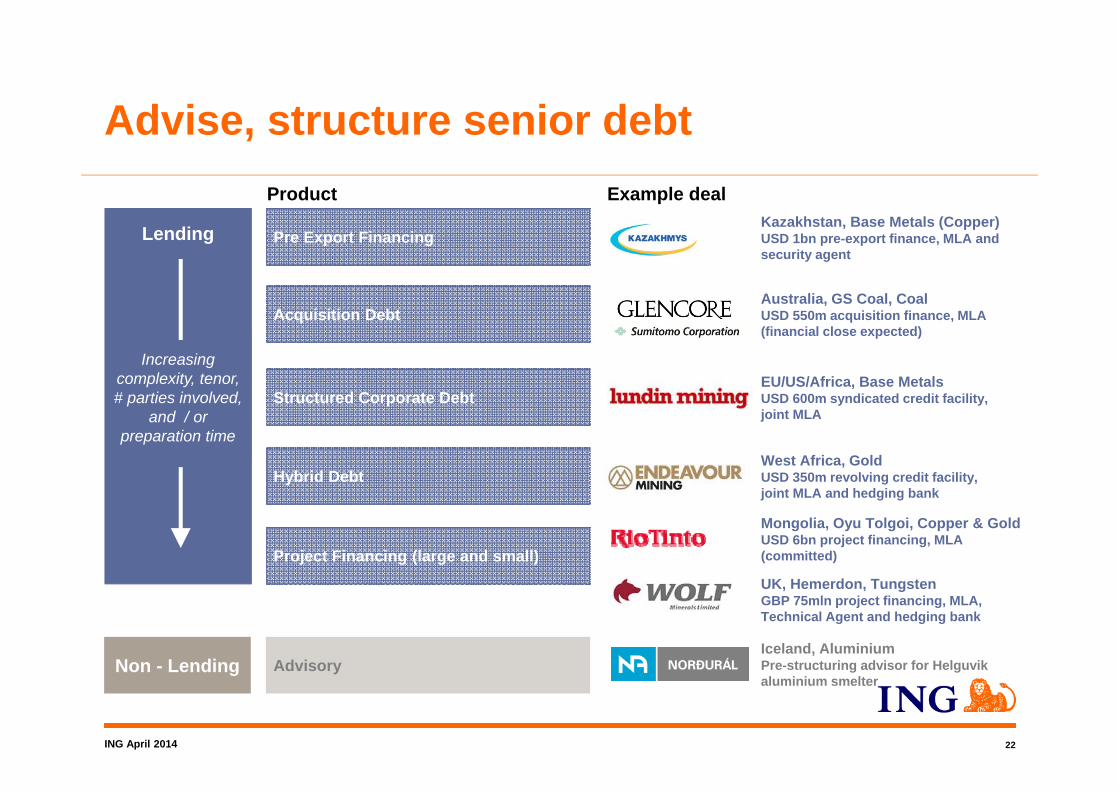
What ING can do and can provide Senior Debt across the spectrum for mining companies
ING April 2014 22
Lending
Advise, structure senior debt
Non - Lending AdvisoryIceland, Aluminium Pre-structuring advisor for Helguvikaluminium smelter
Project Financing (large and small)UK, Hemerdon, TungstenGBP 75mln project financing, MLA, Technical Agent and hedging bank
Hybrid DebtWest Africa, Gold USD 350m revolving credit facility, joint MLA and hedging bank
Pre Export Financing
EU/US/Africa, Base MetalsUSD 600m syndicated credit facility, joint MLA
Acquisition DebtAustralia, GS Coal, CoalUSD 550m acquisition finance, MLA (financial close expected)
Kazakhstan, Base Metals (Copper)USD 1bn pre-export finance, MLA and security agent
Example dealProduct
Increasing complexity, tenor, # parties involved,
and / or preparation time
Structured Corporate Debt
Mongolia, Oyu Tolgoi, Copper & GoldUSD 6bn project financing, MLA (committed)

ING April 2014 23
Advise, structure senior debt
Development FundingMine in Production
Technical Due Diligence Mine Plan, operating costs, sustaining capex
Environmental Plans, reviewed by ESR consultantEnvironmental Due Diligence Equator Principles, ESIA, and Action Plans
Class I Feasibility Study, capital costing, equipment strategy
Offtake Agreements Clear Volume and Pricing Basis
Repayment Offshore, withheld from exports Offshore flowing into a controlled waterfall,
Clear Volume / Pricing Basis, tenor exceeding loan
Tenor Up to 3 years Up to 12 years, depending on ECA cover eligibility
Debt Sizing Full payout, Leverage not to exceed 2.0x EBITDA Full payout, Leverage not to exceed 2.0x EBITDA
Price Assumptions Low minus 10% Base Case – based on Market DD
Providers Banks and Traders Banks, ECAs, Multilaterals

Questions?