13 Spatial variation of fish communities among terra firme forest streams of the Colombian Amazonia
33
Spatial variation of fish communities among terra firme forest streams of the Colombian Amazonia Thesis Report MSc. in Tropical Ecology (60 ECTS) Universiteit van Amsterdam 14-08-2006 Supervisors: Fernando Arbeláez Dr. Joost F. Duivenvoorden UvA student number: 0312924 Institute for Biodiversity and Ecosystem Dynamics [email protected] Faculty of Science Calle 95 # 16 – 23 A.601 Universiteit van Amsterdam +57 1 6107335 Javier A. Maldonado-Ocampo Inventories program Ichthyology collection coordinator Instituto Alexander von Humboldt
-
Upload
juan-jose-camues-l -
Category
Documents
-
view
222 -
download
1
description
UvA student number: 0312924 Institute for Biodiversity and Ecosystem Dynamics [email protected] Faculty of Science Calle 95 # 16 – 23 A.601 Universiteit van Amsterdam +57 1 6107335 Javier A. Maldonado-Ocampo Universiteit van Amsterdam Thesis Report MSc. in Tropical Ecology (60 ECTS) 14-08-2006 Supervisors: Inventories program Ichthyology collection coordinator Instituto Alexander von Humboldt
Transcript of 13 Spatial variation of fish communities among terra firme forest streams of the Colombian Amazonia
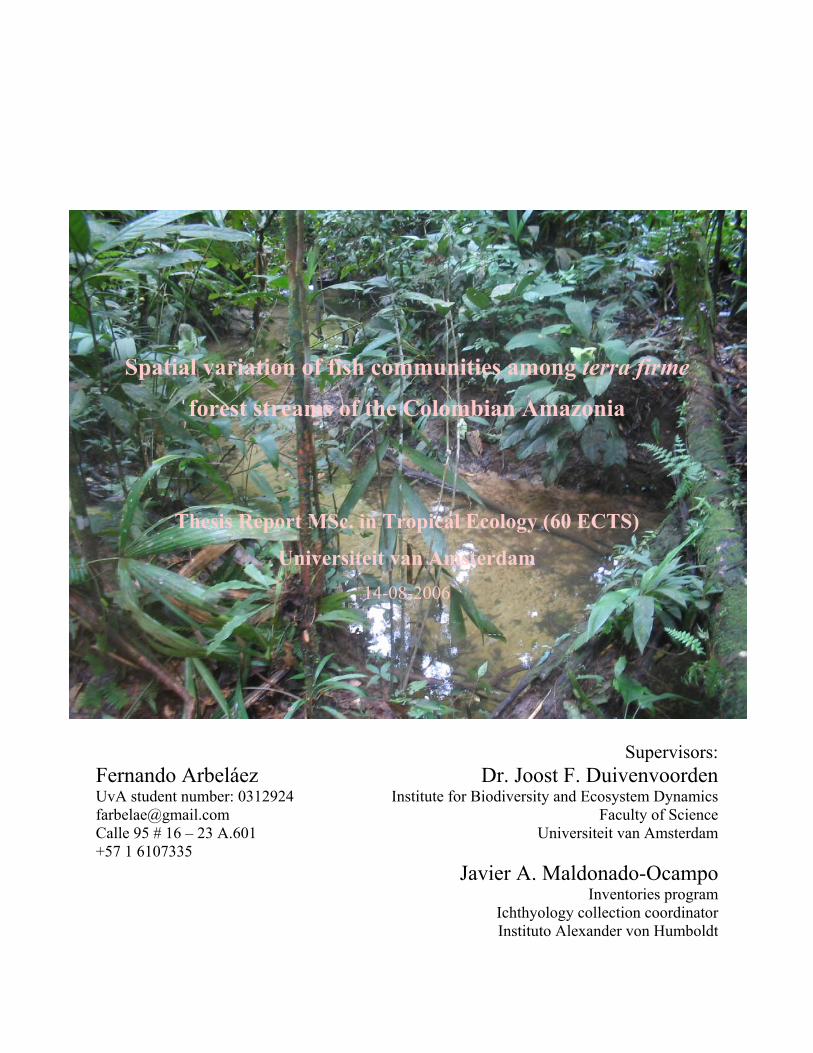
Spatial variation of fish communities among terra firme
forest streams of the Colombian Amazonia
Thesis Report MSc. in Tropical Ecology (60 ECTS)
Universiteit van Amsterdam 14-08-2006
Supervisors: Fernando Arbeláez Dr. Joost F. Duivenvoorden UvA student number: 0312924 Institute for Biodiversity and Ecosystem Dynamics [email protected] Faculty of Science Calle 95 # 16 – 23 A.601 Universiteit van Amsterdam +57 1 6107335 Javier A. Maldonado-Ocampo Inventories program Ichthyology collection coordinator Instituto Alexander von Humboldt

Arbeláez, F., Duivenvoorden, J.F. and J.A.Maldonado-Ocampo. 2006. Spatial variation of fish communities among terra firme forest streams of the Colombian Amazonia
2
––ACKNOWLEDGEMENTS––––––––––––––––––––––––––––––––––––––––––––––––––––
This work was possible thanks to the financial and logistical support of the following
institutions: Tropenbos-Colombia, Universiteit van Amsterdam – IBED, WWF-Education for
Nature- Russell E. Train Fellowship programme, Idea Wild, Instituto de Investigaciones
Alexander von Humboldt, El Zafire Research Station, Parque Natural Nacional Amacayacu and
Fundación Biodiversa Colombia.
I wish to thank my advisors, Joost Duivenvoorden and Javier Maldonado, for their constant help
and support during every phase of this project. Many thanks to María Cristina Peñuela, for her
great interest and her logistical support, to Iván Arce for his contribution to this project, to Juan
David Sánchez for his numerous advises in the field, to Juan David Bogotá for his help in Villa
de Leyva and to Dr. Donald Taphorn, for his help with the identification of Characiformes. To
my field guides Lizardo, Navilio, Richard, Ángel, Julio César, Leonel, Juan Carlos, Hernando,
José, Javier and Gerardo. For their hospitality, I am very grateful with the staff from El Zafire
and from Amacayacu National Park, to the communities of Santa Sofía, Mocagua and San
Martín, and with Isabella, Diana, Aquiles and Ana María.
…A la Tita Fanny
Arbeláez, F., Duivenvoorden, J.F. and J.A.Maldonado-Ocampo. 2006. Spatial variation of fish communities among terra firme forest streams of the Colombian Amazonia
3
––INTRODUCTION–––––––––––––––––
In Amazonian terra firme (uplands that are
not seasonally flooded), soils tend to be
heavily leached and nutrient poor. Terra
firme forest streams (igarapés) are
characteristically acidic, due to the presence
of humic and fulvic acids, and poor in
nutrients and dissolved solids. As a result of
the lack of nutrients and the low light
penetration due to the forest canopy, the
primary productivity and the presence of
aquatic plants in these environments is
almost inexistent (Lowe-McConnell 1987,
Walker 1995, Mendonça et al. 2005).
However, they receive abundant and varied
contributions proceeding from the
surrounding forest (arthropods, leafs,
flowers, fruits and litter). These allow the
development of well-structured and very
complex fish communities (Knöppel 1970,
Lowe-McConnell 1987, Goulding et al.
1988). In a single small stream, more that
one hundred fish species can often be
collected, for what these systems might be
among the freshwater environments with the
highest number of fish species per area in
the world (Arbeláez et al. 2004).
A principal source for heterogeneity in
Amazonian upland soils is related to the
Tertiary and Pleistocene environmental
history and the influence of the Andes
Cordillera and the Guyana Shield. In this
regard, two main systems have been
recognized (Duivenvoorden and Lips 1993,
Hoorn 1994b, 1994a, Duivenvoorden and
Lips 1995). Shield-origin systems have
received sediments from ancient and
weathered soils, and are characterized by
very low soil elemental reserves. Andean-
origin upland systems are developed in
parent materials derived from relatively
young and less weathered sediments,
resulting in soils comparatively richer in
nutrients (though still poor for agricultural
production due to intensive leaching). Forest
plant composition (Duivenvoorden and Lips
1995), as well as terrain morphology (PAT
1997) clearly differs between these two
systems. Satellite imagery and surveys along
the border of Colombia and Peru suggest
that these two landscape units coincide in
the southern part of the so-called Trapecio
amazónico (PAT 1997), the Andes-origin
soils corresponding to the Pebas formation,
and the Shield-origin soils to the Terciario
Superior Amazónico formation. As proposed
in Hoorn (1994a), the latter formation will
be here referred, informally, as Mariñame
Sand Unit, because its original
chronostratigraphic name generates
confusion.
Arbeláez, F., Duivenvoorden, J.F. and J.A.Maldonado-Ocampo. 2006. Spatial variation of fish communities among terra firme forest streams of the Colombian Amazonia
4
Landscape ecology studies improve the
understanding of landscape dynamics and
factors that affect fishery resources
(Schlosser 1991). Assessing the patterns of
diversity allows not only to have a deeper
understanding of the factors that govern the
species distribution and the maintenance of
diversity in the landscape, but is also an
important parameter in conservation
planning of protected areas (Crist et al.
2003). Partitioning of diversity components,
following the additive model, is an
important tool to assess these patterns of
diversity (Veech et al. 2002, Crist et al.
2003). According to the additive partitioning
model, γ diversity, or the total diversity in a
region, results of the addition of β (between-
habitat) and α (within-habitat) diversity.
Further subdivisions in different levels can
be made to assess the importance of
different sources and scales of spatial
heterogeneity in the total diversity.
Most of the ichthyological studies carried
out in the Amazon basin have focused on the
main rivers and their floodplains, as these
yield most of the commercial fisheries.
However, slight scientific attention has been
drawn to terra firme forest streams
(Mendonça et al. 2005), although unique and
highly interesting. Very little is known about
their composition and ecology, and about
the patterns that influence the distribution of
communities in a regional scale.
This study addressed two main hypotheses:
(1) The characteristics of soils and waters
are significantly different between Pebas
and Mariñame, which suggest that
Mariñame soils are significantly poorer than
Pebas, and thus, that they differ in origin (2)
Fish communities characteristics
(composition, richness, abundance and
biomass) differ significantly between
streams from Pebas and Mariñame
landscape units, which is related to their
difference in soil and water properties.
Unveiling β diversity patterns is of great
relevance for aquatic and terrestrial
management plans of the Amacayacu
National Natural Park, one of the areas of
study. Furthermore, some of the species
inhabiting these streams are often used as
ornamental fishes. Locating them and
assessing their populations are initial steps
for evaluating potential for sustainable
fisheries by local inhabitants.
This study was presented as Thesis project
to acquire the grade of MSc. in Tropical
Ecology at the University of Amsterdam.
Arbeláez, F., Duivenvoorden, J.F. and J.A.Maldonado-Ocampo. 2006. Spatial variation of fish communities among terra firme forest streams of the Colombian Amazonia
5
––MATERIALS AND METHODS––––––
Study area
The fieldwork took place between
November 2005 and March 2006 in the
Western Amazonia, specifically, in the
southern Trapecio Amazónico, which is
located in the South-end of Colombia, in the
Amazonas Department, where it borders
Peru along the Amazon River (Fig. 1) .
The area is characterised by a humid, hot
equatorial climate and a southern
unimodal/bi-seasonal precipitation regime.
The annual precipitation in Leticia, the
Department capital, averages 3.400 mm
(between 1973 and 2004), with the rainiest
period from November to May, and the less
rainy season between June and October.
Temperature is relatively moderate and
constant along the year, averaging 25.7°C,
and humidity is high, with a 86% annual
mean (Rudas-Lleras and Prieto-Cruz 2005,
Galvis et al. 2006).
amplings were carried out in terra firme
forest streams belonging to the Mariñame
Sand Unit or the Pebas formations. The
original materials of Mariñame correspond
to Early to Middle Miocene, composed
mainly by medium to very coarse quartz
sands with low reserves of cations, P and N,
and have been suggested to have originated
in the Guyana Shield (Hoorn 1994a, 1994b,
Duivenvoorden 1995, Lips and
Duivenvoorden 1996, Duivenvoorden and
Lips 1998). As for the Pebas formation, its
original materials have been estimated from
the lower Miocene; they have predominantly
clay and silty/sandy clay textures, with fine
grain sand and higher nutrient reserves;
these are presumably of Andean origin
(Hoorn 1994a, Lips and Duivenvoorden
1996, Vonhof et al. 1998). In the study area,
Pebas formation is characterised by a
relatively undulated and uniform terrain,
while the surface in Mariñame formation is
dissected by deeper valleys (Rudas-Lleras
and Prieto-Cruz 2005).
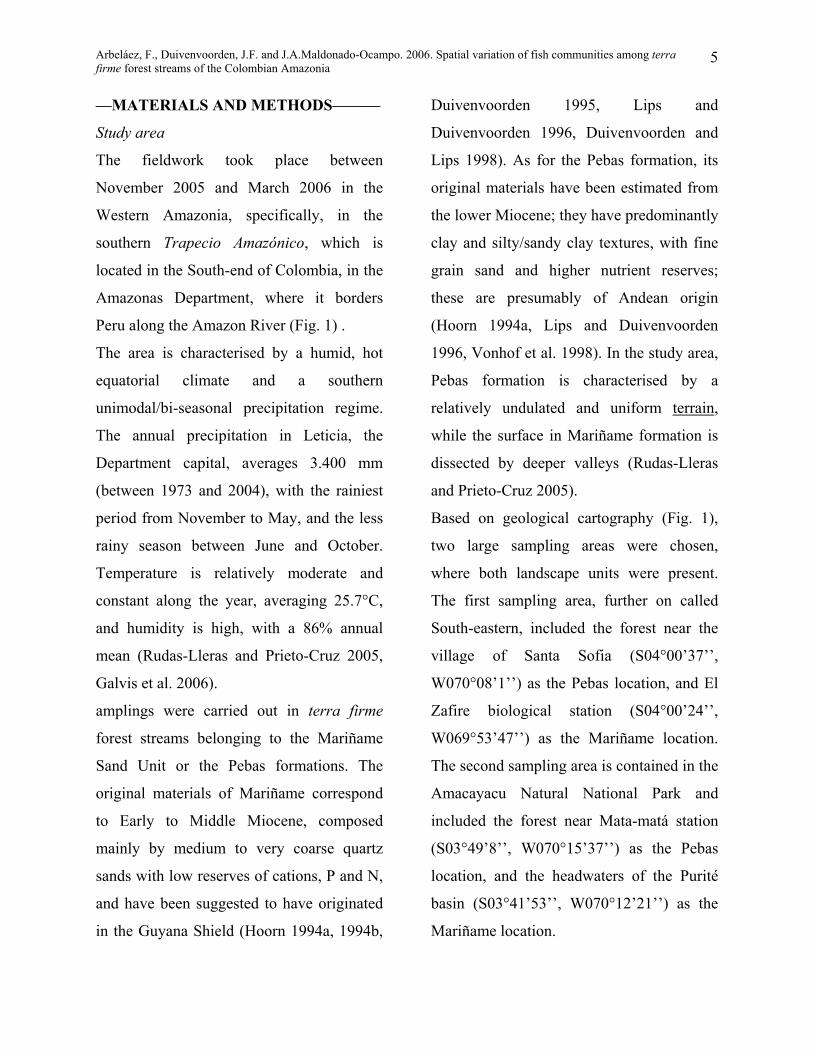
Based on geological cartography (Fig. 1),
two large sampling areas were chosen,
where both landscape units were present.
The first sampling area, further on called
South-eastern, included the forest near the
village of Santa Sofia (S04°00’37’’,
W070°08’1’’) as the Pebas location, and El
Zafire biological station (S04°00’24’’,
W069°53’47’’) as the Mariñame location.
The second sampling area is contained in the
Amacayacu Natural National Park and
included the forest near Mata-matá station
(S03°49’8’’, W070°15’37’’) as the Pebas
location, and the headwaters of the Purité
basin (S03°41’53’’, W070°12’21’’) as the
Mariñame location.
Arbeláez, F., Duivenvoorden, J.F. and J.A.Maldonado-Ocampo. 2006. Spatial variation of fish communities among terra firme forest streams of the Colombian Amazonia
6
Fig.1.. Location of the study area, large sampling areas, landscape units and sampling locations. Tsp=Pebas formation.
Tsa=Mariñame formation. Maps sources: Google Earth ® and PAT 1997 Zonificación ambiental para el plan modelo Colombo-
Brasilero (Eje Apaporis-Tabatinga: PAT). IGAC, Bogotá.
Table 1. Sampling design, and name and specific location of the sampled streams.
Formation Large sampling area Pebas Mariñame
Santa Sofía El Zafire
South-eastern SSQ1. Q. Clímaco. S03°58’58’’, W070°07’38’’ SSQ2. Q. Tucuchira. S03°59’8’’, W070°06’50’’
ZAQ1. Q. Sufragio. (S04°00’26’’, W069°53’47’’) ZAQ2: Eufra (S03°59’5’’, W069°53’24’’)
Mata-matá Purité
Amacayacu Natural National Park
MAQ1. Q. Arriera. S03°48’23’’, W070°15’58’’ MAQ2. Q. Zanguijuela S03°47’53’’, W070°15’58’’
PUQ1. Q. Paujil S03°41’54’’, W070°12’24’’ PUQ2. Camarón S03°41’38’’, W070°12’27’’
In each sampling location, two terra firme
streams were chosen on the basis of local
informants’ knowledge. The most important
criteria for the stream selection were: (1) it
should spring inside a well-developed forest
(with a dense canopy cover) which lacked
signs of recent and severe human
disturbance; (2) the hydric pulse of the main
Arbeláez, F., Duivenvoorden, J.F. and J.A.Maldonado-Ocampo. 2006. Spatial variation of fish communities among terra firme forest streams of the Colombian Amazonia
7
rivers should not affect its water levels near
to the sampling site; (3) it should not fall dry
in dry spells; and (4) its size should not be
too large (max. width 6m aprox.) to make
the sampling techniques ineffective. A total
of eight streams were sampled in four
locations, belonging to two large sampling
areas and to two landscape units (Table 1).
Soil and water sampling
In each stream, between three and five
700cm3 superficial soil samples (A horizon,
0-5 cm depth) were collected in the forest
surrounding the streams, at 5 to 10m
distance from the streambed and 10 to 15 m
apart from each other. Three 500ml water
samples from the middle part of the stream
were taken on sampling days 0, 2 and 4. The
samples were preserved as fresh as possible,
in a refrigerator, when available, or kept
inside running water. Furthermore, pH,
conductivity, dissolved oxygen and
temperature were measured in-field on
sampling days 0, 2 and 4, using a portable
multiparameter SensionTM156 HACH. The
soil and water samples were analysed at the
IGAC (Instituto Geográfico Agustín
Codazzi) soil laboratory in Bogotá. The
studied physical-chemical parameters are
listed in Table 2. The detailed results of
these analyses and general lab methods are
described in Appendix 2.
Table 2. Soil and water variables used in the PCA analyses.
Soil variables Water variables
Granulometry % of sand % of loam % of clay
pH Interchangeable acidity (I.A., meq/100g) % A.I. saturation (A.I.S., meq/100g) % Organic carbon (O.C.) Exchange complex (meq/100g)
Cationic Exchange Capacity (C.E.C.) Calcium (ln transformed) Magnesium Potassium Sodium Total bases (T.B.)
% bases saturation (B.S.) Phosphorous (ppm)
pH Electric conductivity (E.C., dS/cm) Sodium Adsorption Rate (S.A.R.) Cation content (meq/L)
Calcium Magnesium Potassium Sodium
Anion content (meq/L) Sulphates* Chlorides* Carbonates* Bicarbonates
Dissolved oxygen (D.O mg/l)** Temperature (°C)**
*Variables removed from the PCA for having too many undetected values. **Field measurements.
Arbeláez, F., Duivenvoorden, J.F. and J.A.Maldonado-Ocampo. 2006. Spatial variation of fish communities among terra firme forest streams of the Colombian Amazonia
8
Fish assemblages sampling
In each stream, four daily sampling events
took place. Each sampling day consisted in a
standard routine from 14:30 to 19:30,
covering afternoon, dusk and night hours,
during which three fishing methods were
used: one cast net (multifilament, 1.8 m
radius, 1.5 cm2 mesh) for the five hours, two
dip nets (50 cm diameter, 0.5 mm mesh) for
two hours (14:30 to 16:30) and one seine net
(2 m x 3.5 m, 0.5 mm mesh) for three hours
(16:30 to 19:30). The samplings started from
a fixed station, alternating each day between
upstream and downstream one hundred
meters transects, and attempting to cover
every microhabitat for fish within the
transect. All captured individuals were fixed
in formalin (10%). In the Ichthiology
collection lab of the Humboldt Institute in
Villa de Leyva, Colombia, the fish were
preserved in ethanol (70%), identified,
counted, and finally deposited in the fish
collection of the Institute. The total catch of
each species per sampling day was weighted
using an electronic balance, after removing
the excess of alcohol. The weights were
approximated to the nearest integer in grams
and only the measurements higher than 10g
were recorded. A uniform weight of 5g was
assigned to measurements lower than that
value.
Data analyses
Soil and water data
In order to identify distribution patterns and
groups formed by streams, locations,
sampling areas and landscape units regarding
their soil and water physical-chemical
properties, two Principal Component
Analyses (PCA) were used to visualise these
multidimentional data. Non-detected values
were changed for 1/10 of the smallest value
for that variable. Constant variables and
those with high amount of non-detected
values were removed from the analyses
(Table 2). Averages of the variables for each
stream were used as inputs for the PCA. For
the water PCA, the variables used as inputs
were the data from lab analyses plus the
dissolved oxygen and the temperature from
the field measurements. Field pH and
conductivity were used as a reference to
identify and remove outliers from the lab
results.
All variables were tested for normality using
a Kolmogorov-Smirnov test with Lilliefors
significance correction. When necessary,
variables were transformed to achieve
normality, following Zar (1996).
For each main PCA axis (loading >20%), the
difference among sampling locations was
tested with a one-way ANOVA, verifying
the normality of the residuals. When this
Arbeláez, F., Duivenvoorden, J.F. and J.A.Maldonado-Ocampo. 2006. Spatial variation of fish communities among terra firme forest streams of the Colombian Amazonia
9
difference was significant, a Tukey’s honest
significant difference post hoc test was
computed between the sampling locations. In
the same manner, the difference among
landscape units, sampling areas and their
interaction in each main axis was tested
using a two-ways ANOVA. These analyses
were performed in SPSS 11.0.1 statistical
software.
Fish assemblages
In order to evaluate representativeness of the
sampling in the whole area, species
accumulation curves and richness estimators
were computed for all the sampling days
using EstimateS (Version 7.5; Colwell 2005)
with 1000 randomisations without
replacement and shuffling of individuals
among samples within species. The mean
and confidence values of the Chao1 richness
estimator with bias correction was compared
to the number of observed species (Sobs
Mao Tau) and their confidence intervals
(95%), as computed by the software. The
abundance- based Chao1 estimator calculates
estimated richness based on the amount of
singletons (species with only one individual)
and doubletons (species with two
individuals) in each step of the sample
accumulation procedure (Colwell 2005).
As standardised fishing procedures and
capture effort were applied during all
samplings, the number of species per
sampling day was used as the index for
comparing diversity in different scales. The
difference in species richness, abundance and
total weight per sampling day was tested
among sampling locations, as well as among
landscape units, sampling areas and the
interaction between these. Consecutive
samplings from one stream are probably not
independent and, therefore, can not be
accounted as repetitions, since the catchment
from one day is likely to affect the results of
the following days. Therefore, one- and two-
ways ANOVAs with repeated measures were
performed, using the streams as repetitions
and the four sampling days as four levels of
variation of the within-streams “sampling”
factor.
In order to compare the variation of fish
assemblages among sampling days, streams,
locations, landscape units and sampling
areas, a Detrended Correspondence Analysis
(DCA) ordination technique was performed.
The species composition for each sampling
day, with rare species down-weighting, was
used as the input for the DCA, using
CANOCO for windows (Version 4.02)
ecological software. The differences among
locations, landscape units, sampling areas
and their interaction in the scores of each
DCA axis were tested using one- and two-
Arbeláez, F., Duivenvoorden, J.F. and J.A.Maldonado-Ocampo. 2006. Spatial variation of fish communities among terra firme forest streams of the Colombian Amazonia
10
ways ANOVAS with repeated measures. The
DCA scores were also used for a hierarchical
cluster classification with the nearest
neighbour method, measuring the squared
Euclidian distance between sampling days.
As the distance between sampling days
shows how fish assemblages vary due to
environmental factors, daily fluctuations and
randomness, the minimum difference for
clustering was determined when at least all
samples of the same stream were grouped in
the same cluster. Clustering analysis and
ANOVAs were performed in SPSS.
In order to evaluate the α and β diversities
contribution in different grouping levels,
PARTITION ecological software was used.
The program first assesses the contribution
percentage of α and β diversities to the γ at
diversity at different levels, and then
generates expected values of beta diversity
according to a null model, under the
hypothesis that the observed partition of
diversity could be produced by random
allocation. The P values generated by the
software values are the proportion of null
values that are greater than the observed
values of α and β diversities (Crist et al.
2003). With a two-tailed probability of 0.05,
the observed diversity is significantly
different from the random distribution model
if P < 0.025 (when the observed value is
greater than expected) or if P > 0.975 (when
the observed value is smaller than the
expected value). The software then calculates
α and β diversity for each level, following
the additive model. For each organisation
level, α diversity is calculated as the mean
diversity index of all samples, while β
diversity is calculated as the total diversity (γ
diversity) minus the average α diversity
(Veech et al. 2002). The diversity indicators
used for these analyses were species richness
and the Simpson’s diversity index. The latter
expresses the probability that two individuals
randomly selected from any sample belong
to different species (Magurran 1988, Crist et
al. 2003).
The diversity contributions were analysed in
two different highest grouping levels: first,
streams and sampling locations were
grouped by landscape units (Pebas and
Mariñame) and second, by large sampling
areas (South-eastern and Amacayacu N.P.
areas). In both cases, four levels were used,
with the same first three levels: “among
samples”, “among streams” and “among
sampling locations”. The fourth level was
“among landscape units”, for the first
analysis, and “among large sampling areas”,
for the second. Finally, the samples from
each landscape unit, Pebas and Mariñame,
were analysed separately and considering
Arbeláez, F., Duivenvoorden, J.F. and J.A.Maldonado-Ocampo. 2006. Spatial variation of fish communities among terra firme forest streams of the Colombian Amazonia
11
only the first three levels of organisation, to
assess possible differences in diversity
partitioning between sampling locations.
––RESULTS–––––––––––––––––––––––––
Soil analyses
The physicochemical soil and water data for
each stream is presented in Appendix 2.
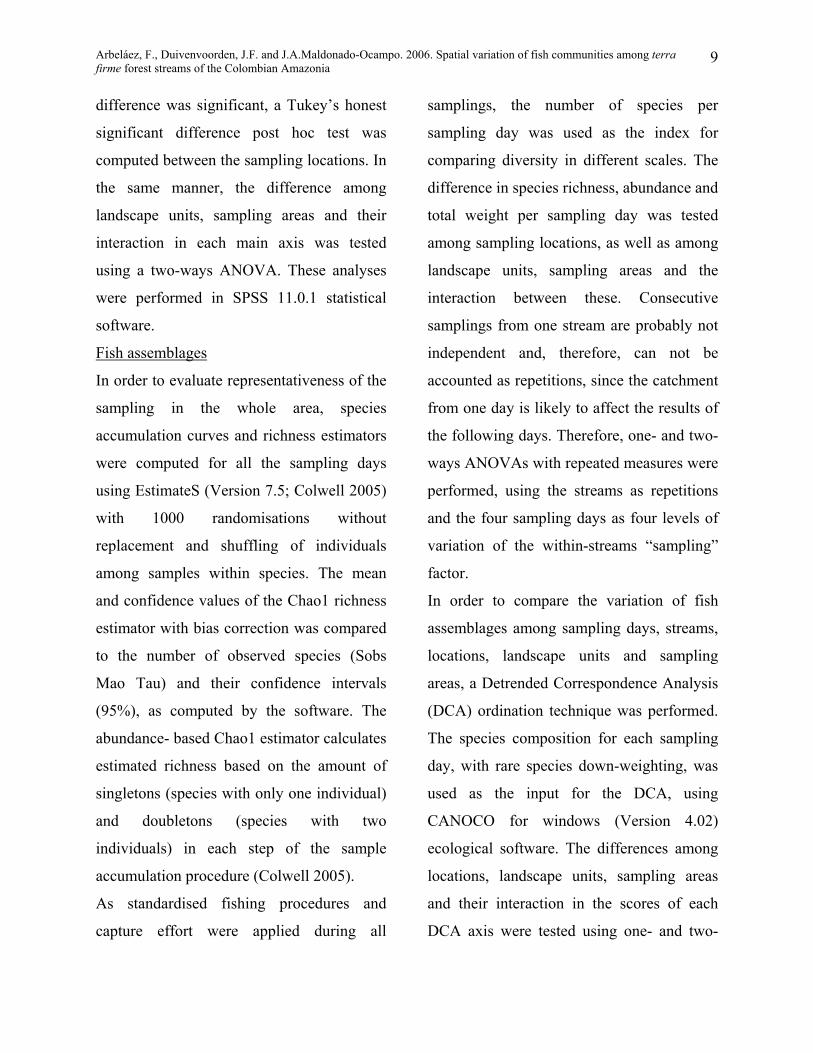
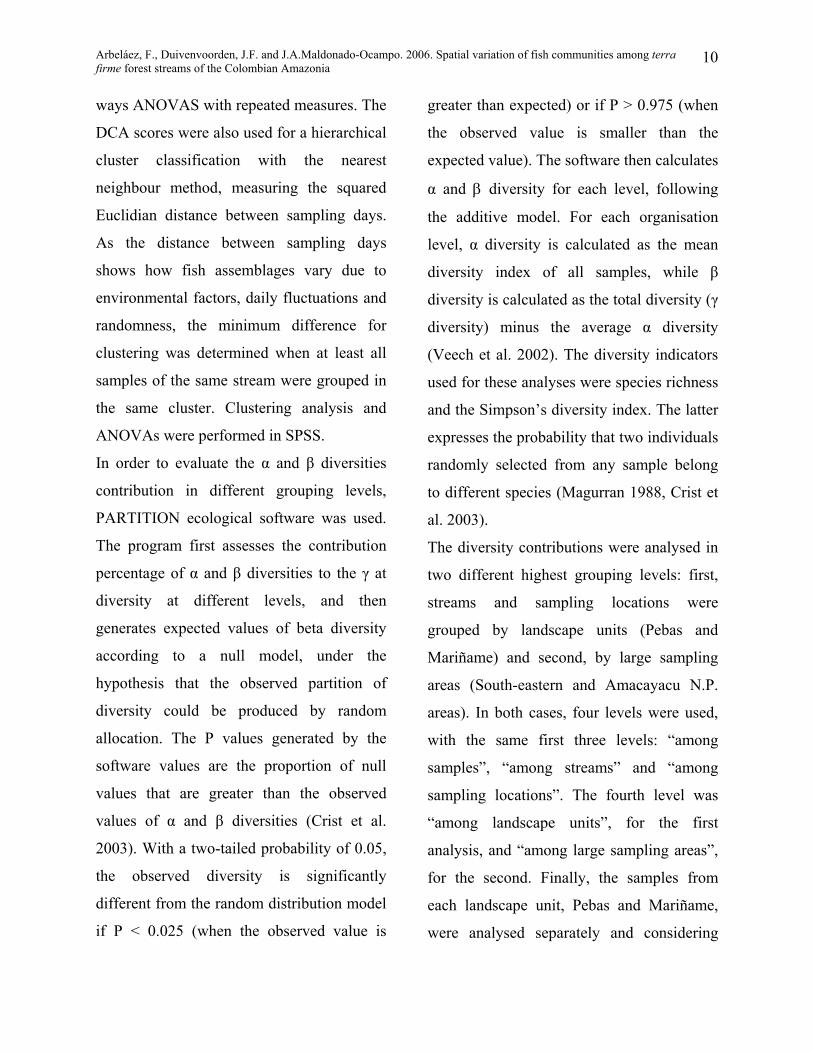
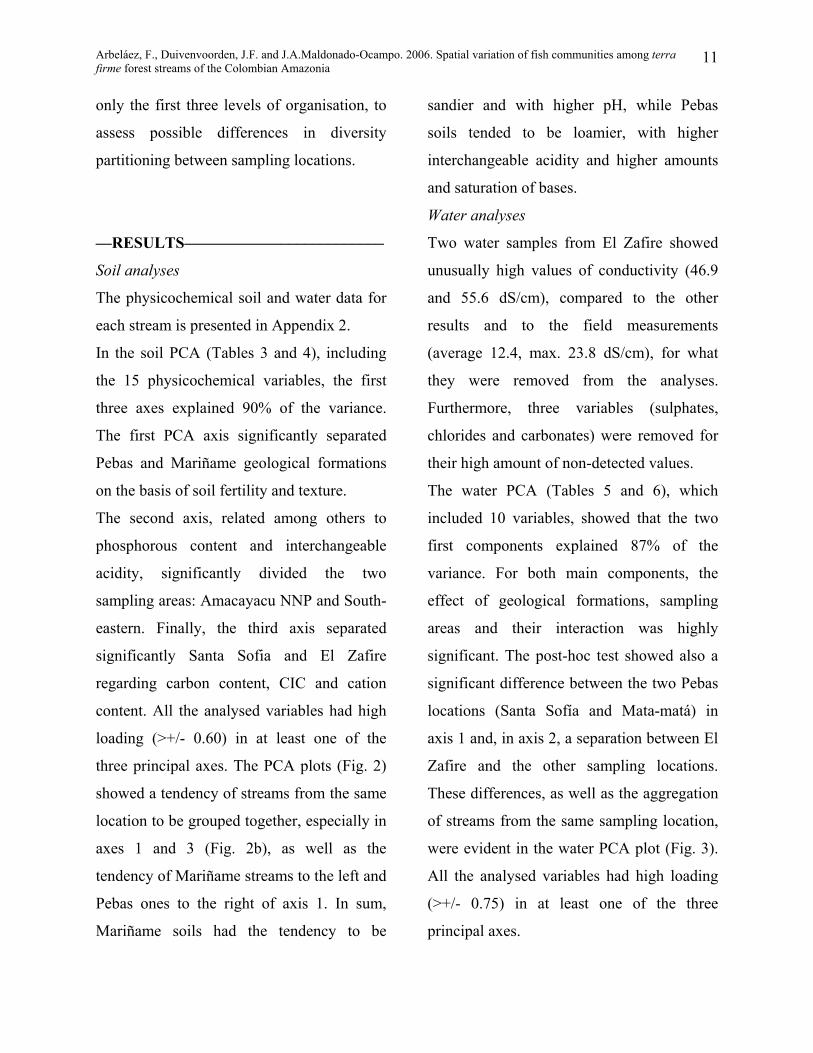
In the soil PCA (Tables 3 and 4), including
the 15 physicochemical variables, the first
three axes explained 90% of the variance.
The first PCA axis significantly separated
Pebas and Mariñame geological formations
on the basis of soil fertility and texture.
The second axis, related among others to
phosphorous content and interchangeable
acidity, significantly divided the two
sampling areas: Amacayacu NNP and South-
eastern. Finally, the third axis separated
significantly Santa Sofia and El Zafire
regarding carbon content, CIC and cation
content. All the analysed variables had high
loading (>+/- 0.60) in at least one of the
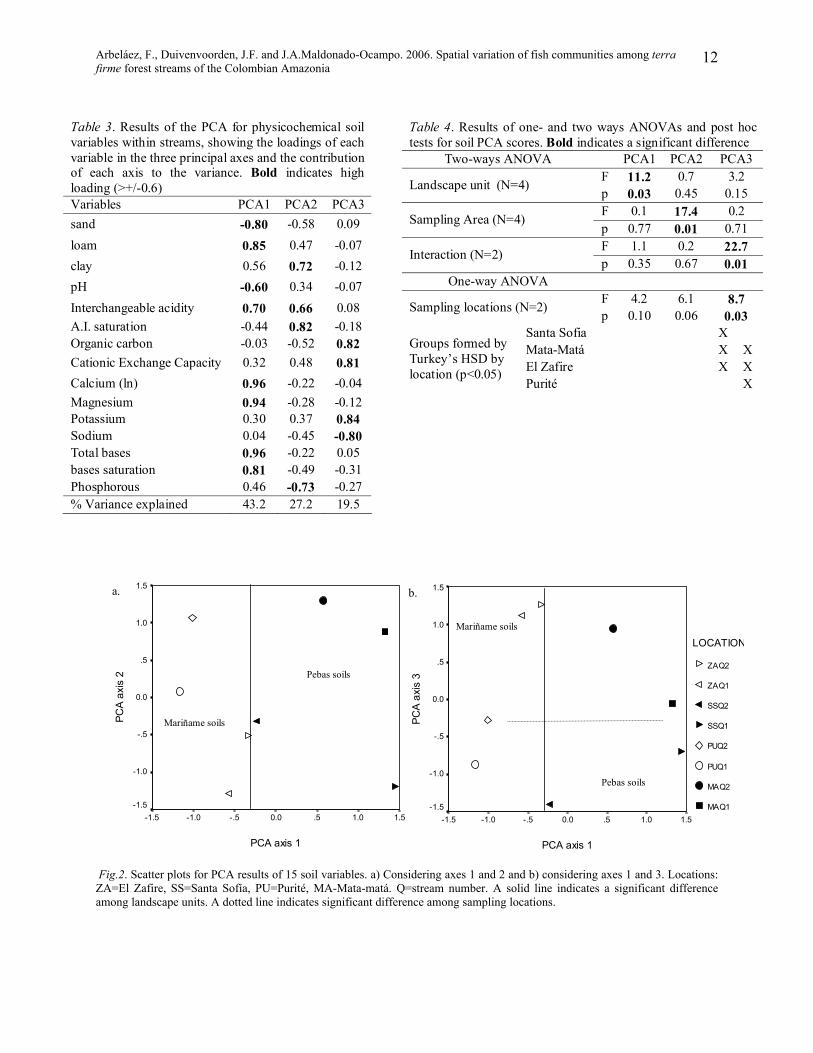
three principal axes. The PCA plots (Fig. 2)
showed a tendency of streams from the same
location to be grouped together, especially in
axes 1 and 3 (Fig. 2b), as well as the
tendency of Mariñame streams to the left and
Pebas ones to the right of axis 1. In sum,
Mariñame soils had the tendency to be
sandier and with higher pH, while Pebas
soils tended to be loamier, with higher
interchangeable acidity and higher amounts
and saturation of bases.
Water analyses
Two water samples from El Zafire showed
unusually high values of conductivity (46.9
and 55.6 dS/cm), compared to the other
results and to the field measurements
(average 12.4, max. 23.8 dS/cm), for what
they were removed from the analyses.
Furthermore, three variables (sulphates,
chlorides and carbonates) were removed for
their high amount of non-detected values.
The water PCA (Tables 5 and 6), which
included 10 variables, showed that the two
first components explained 87% of the
variance. For both main components, the
effect of geological formations, sampling
areas and their interaction was highly
significant. The post-hoc test showed also a
significant difference between the two Pebas
locations (Santa Sofía and Mata-matá) in
axis 1 and, in axis 2, a separation between El
Zafire and the other sampling locations.
These differences, as well as the aggregation
of streams from the same sampling location,
were evident in the water PCA plot (Fig. 3).
All the analysed variables had high loading
(>+/- 0.75) in at least one of the three
principal axes.
Arbeláez, F., Duivenvoorden, J.F. and J.A.Maldonado-Ocampo. 2006. Spatial variation of fish communities among terra firme forest streams of the Colombian Amazonia
12
Table 4. Results of one- and two ways ANOVAs and post hoc tests for soil PCA scores. Bold indicates a significant difference
Two-ways ANOVA PCA1 PCA2 PCA3 F 11.2 0.7 3.2 Landscape unit (N=4) p 0.03 0.45 0.15 F 0.1 17.4 0.2 Sampling Area (N=4) p 0.77 0.01 0.71 F 1.1 0.2 22.7 Interaction (N=2) p 0.35 0.67 0.01
One-way ANOVA F 4.2 6.1 8.7 Sampling locations (N=2) p 0.10 0.06 0.03
Santa Sofia X Mata-Matá X X El Zafire X X
Groups formed by Turkey’s HSD by location (p<0.05)
Purité
Table 3. Results of the PCA for physicochemical soil variables within streams, showing the loadings of each variable in the three principal axes and the contribution of each axis to the variance. Bold indicates high loading (>+/-0.6) Variables PCA1 PCA2 PCA3sand -0.80 -0.58 0.09 loam 0.85 0.47 -0.07 clay 0.56 0.72 -0.12 pH -0.60 0.34 -0.07 Interchangeable acidity 0.70 0.66 0.08 A.I. saturation -0.44 0.82 -0.18 Organic carbon -0.03 -0.52 0.82 Cationic Exchange Capacity 0.32 0.48 0.81 Calcium (ln) 0.96 -0.22 -0.04 Magnesium 0.94 -0.28 -0.12 Potassium 0.30 0.37 0.84 Sodium 0.04 -0.45 -0.80 Total bases 0.96 -0.22 0.05 bases saturation 0.81 -0.49 -0.31 Phosphorous 0.46 -0.73 -0.27 % Variance explained 43.2 27.2 19.5
X
Fig.2. Scatter plots for PCA results of 15 soil variables. a) Considering axes 1 and 2 and b) considering axes 1 and 3. Locations: ZA=El Zafire, SS=Santa Sofía, PU=Purité, MA-Mata-matá. Q=stream number. A solid line indicates a significant difference among landscape units. A dotted line indicates significant difference among sampling locations.
PCA axis 1
1.51.0.50.0-.5-1.0-1.5
PCA
axis
2
1.5
1.0
.5
0.0
-.5
-1.0
-1.5
Location
ZAQ2
ZAQ1
SSQ2
SSQ1
PUQ2
PUQ1
MAQ2
MAQ1
Pebas soils
Mariñame soils
a.
PCA axis 1
1.51.0.50.0-.5-1.0-1.5
PCA
axis
3
1.5
1.0
.5
0.0
-.5
-1.0
-1.5
LOCATION
ZAQ2
ZAQ1
SSQ2
SSQ1
PUQ2
PUQ1
MAQ2
MAQ1
Pebas soils
Mariñame soils
b.
Arbeláez, F., Duivenvoorden, J.F. and J.A.Maldonado-Ocampo. 2006. Spatial variation of fish communities among terra firme forest streams of the Colombian Amazonia
13
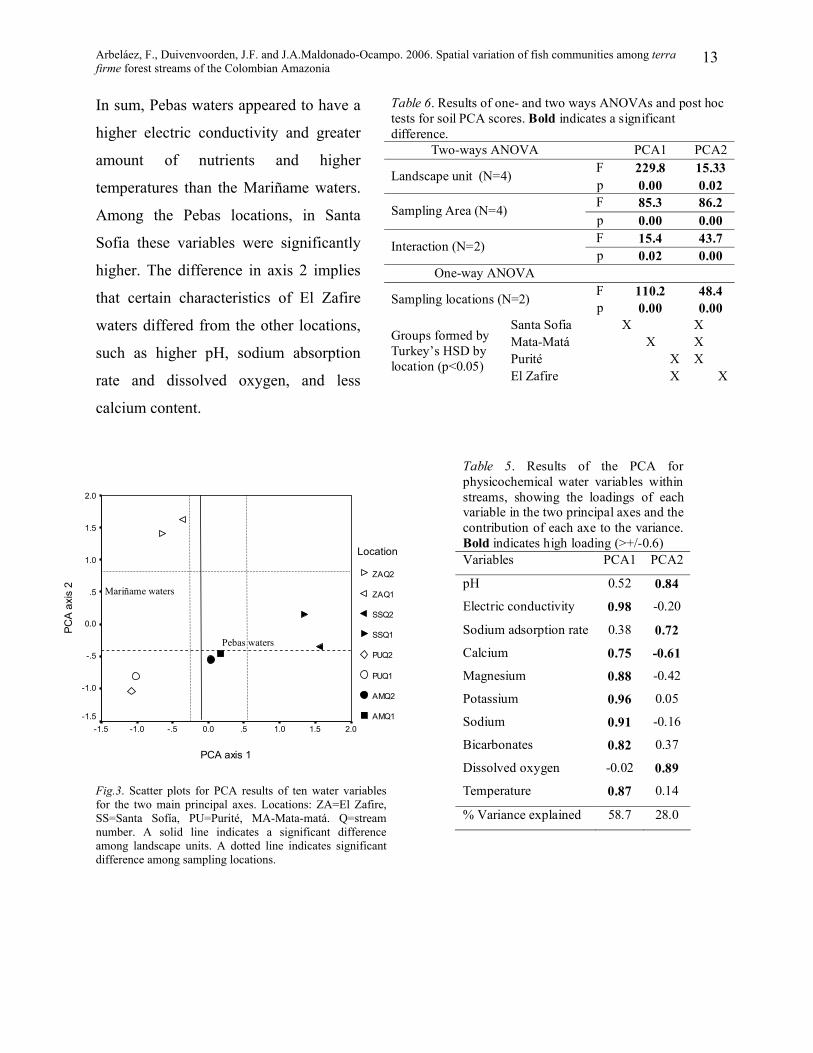
In sum, Pebas waters appeared to have a
higher electric conductivity and greater
amount of nutrients and higher
temperatures than the Mariñame waters.
Among the Pebas locations, in Santa
Sofia these variables were significantly
higher. The difference in axis 2 implies
that certain characteristics of El Zafire
waters differed from the other locations,
such as higher pH, sodium absorption
rate and dissolved oxygen, and less
calcium content.
Table 6. Results of one- and two ways ANOVAs and post hoc tests for soil PCA scores. Bold indicates a significant difference.
Two-ways ANOVA PCA1 PCA2 F 229.8 15.33Landscape unit (N=4) p 0.00 0.02 F 85.3 86.2 Sampling Area (N=4) p 0.00 0.00 F 15.4 43.7 Interaction (N=2) p 0.02 0.00
One-way ANOVA F 110.2 48.4 Sampling locations (N=2) p 0.00 0.00
Santa Sofia X X Mata-Matá X X Purité X X
Groups formed by Turkey’s HSD by location (p<0.05)
El Zafire X X
Table 5. Results of the PCA for
physicochemical water variables within streams, showing the loadings of each variable in the two principal axes and the contribution of each axe to the variance. Bold indicates high loading (>+/-0.6) Variables PCA1 PCA2
pH 0.52 0.84
Electric conductivity 0.98 -0.20
Sodium adsorption rate 0.38 0.72
Calcium 0.75 -0.61
Magnesium 0.88 -0.42
Potassium 0.96 0.05
Sodium 0.91 -0.16
Bicarbonates 0.82 0.37
Dissolved oxygen -0.02 0.89
Temperature 0.87 0.14
% Variance explained 58.7 28.0
PCA axis 1
2.01.51.0.50.0-.5-1.0-1.5
PCA
axis
2
2.0
1.5
1.0
.5
0.0
-.5
-1.0
-1.5
Location
ZAQ2
ZAQ1
SSQ2
SSQ1
PUQ2
PUQ1
AMQ2
AMQ1
Pebas waters
Mariñame waters
Fig.3. Scatter plots for PCA results of ten water variables for the two main principal axes. Locations: ZA=El Zafire, SS=Santa Sofía, PU=Purité, MA-Mata-matá. Q=stream number. A solid line indicates a significant difference among landscape units. A dotted line indicates significant difference among sampling locations.
Arbeláez, F., Duivenvoorden, J.F. and J.A.Maldonado-Ocampo. 2006. Spatial variation of fish communities among terra firme forest streams of the Colombian Amazonia
14
Icthyofauna thus, the observed richness accounted for
81% of the estimated species in the whole
area.
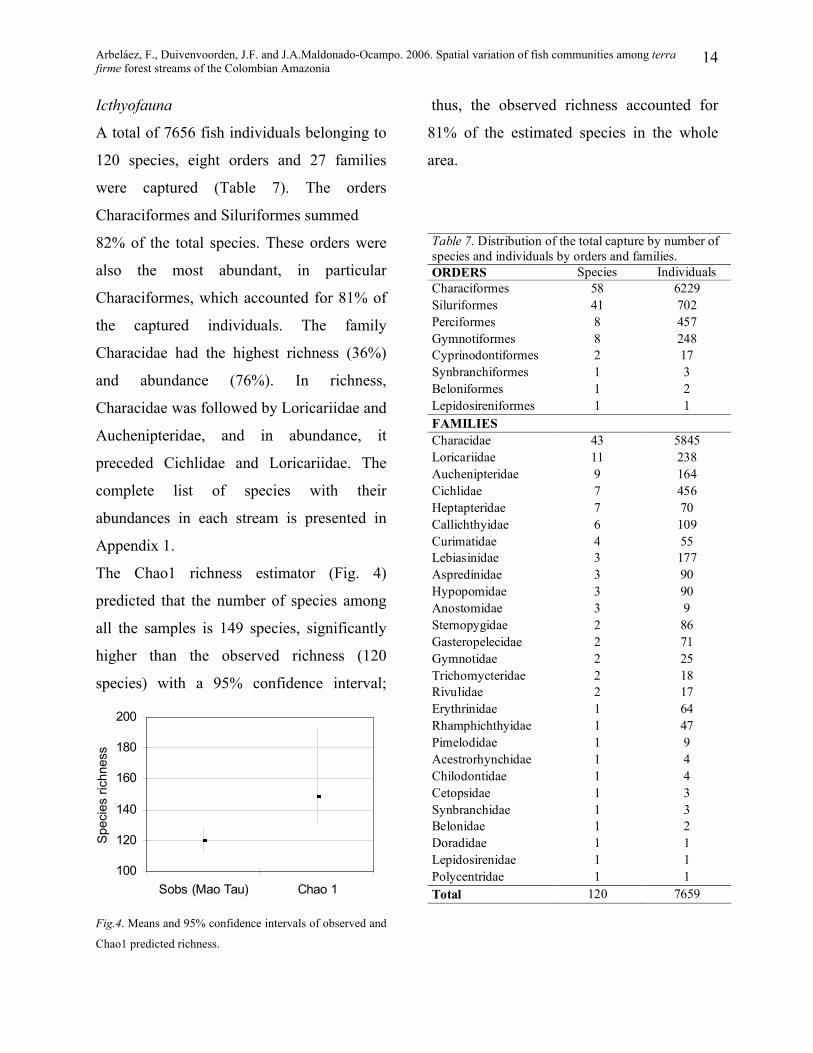
A total of 7656 fish individuals belonging to
120 species, eight orders and 27 families
were captured (Table 7). The orders
Characiformes and Siluriformes summed
Table 7. Distribution of the total capture by number of species and individuals by orders and families. ORDERS Species Individuals Characiformes 58 6229 Siluriformes 41 70Perciformes 8 45Gymnotiformes 8 248 Cyprinodontiformes 2 17 Synbranchiformes 1 3 Beloniformes 1 2 Lepidosireniformes 1 1 FAMILIES
2 7
Characidae 43 5845 Loricariidae 11 23Auchenipteridae 9 164 Cichlidae 7 45Heptapteridae 7 70Callichthyidae 6 109Curimatidae 4 55Lebiasinidae 3 177Aspredinidae 3 90Hypopomidae 3 90 Anostomidae 3 9 Sternopygidae 2 86 Gasteropelecidae 2 71 Gymnotidae 2 25 Trichomycteridae 2 18 Rivulidae 2 Erythrinidae 1 64Rhamphichthyidae 1 47 Pimelodidae 1 9Acestrorhynchidae 1 4 Chilodontidae 1 4 Cetopsidae 1 Synbranchidae 1 3 Belonidae 1 2Doradidae 1 1Lepidosirenidae 1 1 Polycentridae 1 1 Total 120 7659
8
6
17
3
82% of the total species. These orders were
also the most abundant, in particular
Characiformes, which accounted for 81% of
the captured individuals. The family
Characidae had the highest richness (36%)
and abundance (76%). In richness,
Characidae was followed by Loricariidae and
Auchenipteridae, and in abundance, it
preceded Cichlidae and Loricariidae. The
complete list of species with their
abundances in each stream is presented in
Appendix 1.
The Chao1 richness estimator (Fig. 4)
predicted that the number of species among
all the samples is 149 species, significantly
higher than the observed richness (120
species) with a 95% confidence interval;
100
120
140
160
180
200
Sobs (Mao Tau) Chao 1
Spec
ies
richn
ess
Fig.4. Means and 95% confidence intervals of observed and
Chao1 predicted richness.
Arbeláez, F., Duivenvoorden, J.F. and J.A.Maldonado-Ocampo. 2006. Spatial variation of fish communities among terra firme forest streams of the Colombian Amazonia
15
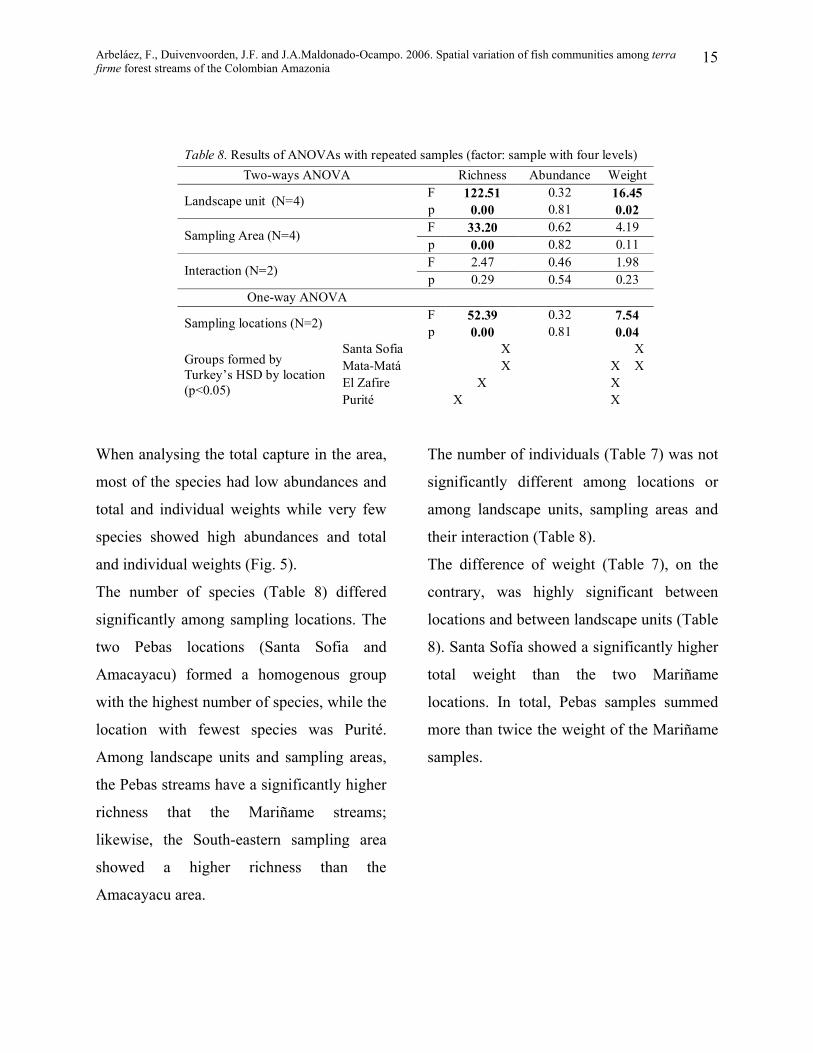
Table 8. Results of ANOVAs with repeated samples (factor: sample with four levels) Two-ways ANOVA Richness Abundance Weight
F 122.51 0.32 16.45 Landscape unit (N=4) p 0.00 0.81 0.02 F 33.20 0.62 4.19 Sampling Area (N=4) p 0.00 0.82 0.11 F 2.47 0.46 1.98 Interaction (N=2) p 0.29 0.54 0.23
One-way ANOVA F 52.39 0.32 7.54 Sampling locations (N=2) p 0.00 0.81 0.04
Santa Sofia X X Mata-Matá X X X El Zafire X X
Groups formed by Turkey’s HSD by location (p<0.05)
Purité X X
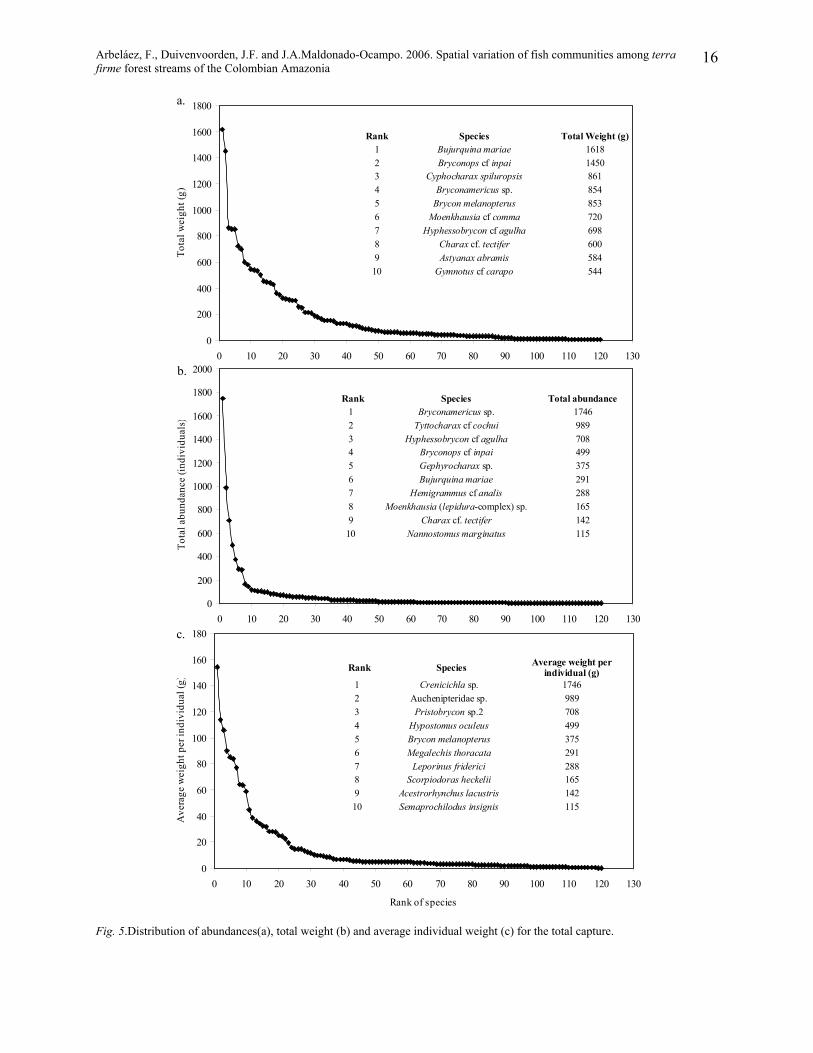
When analysing the total capture in the area,
most of the species had low abundances and
total and individual weights while very few
species showed high abundances and total
and individual weights (Fig. 5).
The number of individuals (Table 7) was not
significantly different among locations or
among landscape units, sampling areas and
their interaction (Table 8).
The difference of weight (Table 7), on the
contrary, was highly significant between
locations and between landscape units (Table
8). Santa Sofía showed a significantly higher
total weight than the two Mariñame
locations. In total, Pebas samples summed
more than twice the weight of the Mariñame
samples.
The number of species (Table 8) differed
significantly among sampling locations. The
two Pebas locations (Santa Sofia and
Amacayacu) formed a homogenous group
with the highest number of species, while the
location with fewest species was Purité.
Among landscape units and sampling areas,
the Pebas streams have a significantly higher
richness that the Mariñame streams;
likewise, the South-eastern sampling area
showed a higher richness than the
Amacayacu area.
Arbeláez, F., Duivenvoorden, J.F. and J.A.Maldonado-Ocampo. 2006. Spatial variation of fish communities among terra firme forest streams of the Colombian Amazonia
16
0
200
400
600
800
1000
1200
1400
1600
1800
0 10 20 30 40 50 60 70 80 90 100 110 120 13
Tota
l wei
ght (
g)
0
Rank Species Total Weight (g) 1 Bujurquina mariae 1618 2 Bryconops cf inpai 1450 3 Cyphocharax spiluropsis 861 4 Bryconamericus sp. 854 5 Brycon melanopterus 853 6 Moenkhausia cf comma 720 7 Hyphessobrycon cf agulha 698 8 Charax cf. tectifer 600 9 Astyanax abramis 584
10 Gymnotus cf carapo 544
a.
0
200
400
600
800
1000
1200
1400
1600
1800
2000
0 10 20 30 40 50 60 70 80 90 100 110 120 1
Tota
l abu
ndan
ce (i
ndiv
idua
ls
30
)
Rank Species Total abundance1 Bryconamericus sp. 1746 2 Tyttocharax cf cochui 989 3 Hyphessobrycon cf agulha 708 4 Bryconops cf inpai 499 5 Gephyrocharax sp. 375 6 Bujurquina mariae 291 7 Hemigrammus cf analis 288 8 Moenkhausia (lepidura-complex) sp. 165 9 Charax cf. tectifer 142
10 Nannostomus marginatus 115
b.
0
20
40
60
80
100
120
140
160
180
0 10 20 30 40 50 60 70 80 90 100 110 120 130
Rank of species
Ave
rage
wei
ght p
er in
divi
dual
(g)
Rank Species Average weight per individual (g)
1 Crenicichla sp. 1746 2 Auchenipteridae sp. 989 3 Pristobrycon sp.2 708 4 Hypostomus oculeus 499 5 Brycon melanopterus 375 6 Megalechis thoracata 291 7 Leporinus friderici 288 8 Scorpiodoras heckelii 165 9 Acestrorhynchus lacustris 142 10 Semaprochilodus insignis 115
c.
Fig. 5.Distribution of abundances(a), total weight (b) and average individual weight (c) for the total capture.
Arbeláez, F., Duivenvoorden, J.F. and J.A.Maldonado-Ocampo. 2006. Spatial variation of fish communities among terra firme forest streams of the Colombian Amazonia
17
T
s
a
2
r
g
a
l
s
a
i
f
P
w
s
d
c
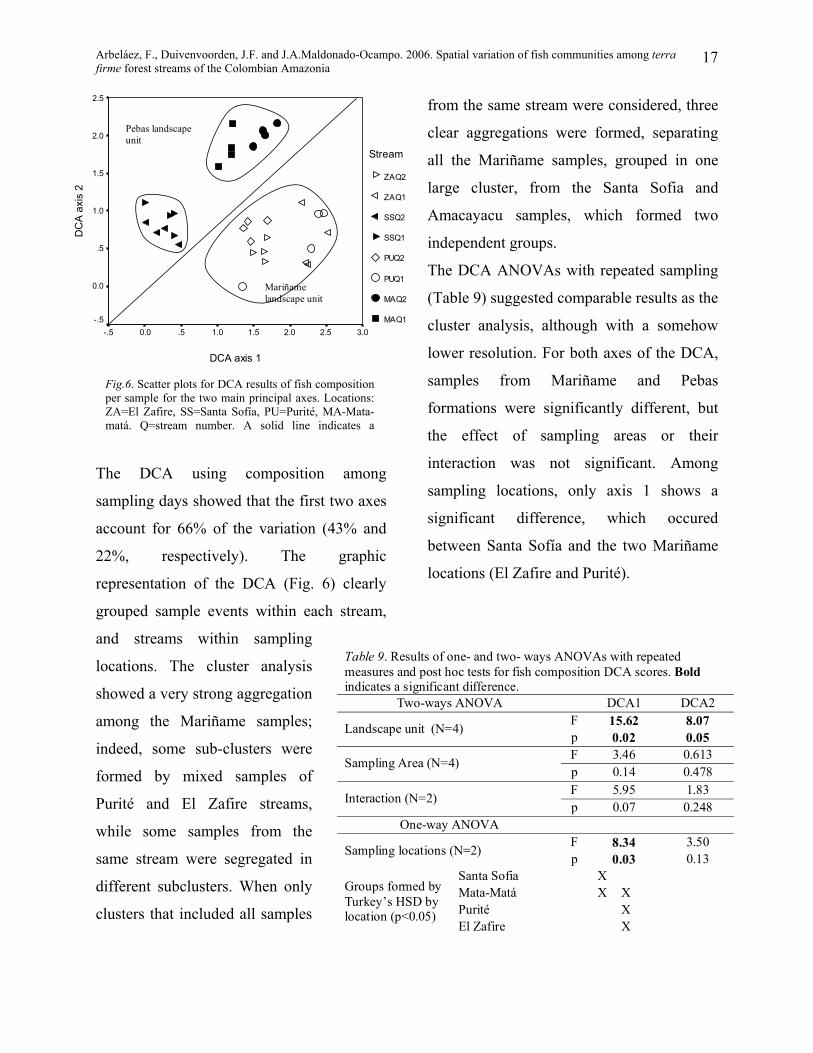
from the same stream were considered, three
clear aggregations were formed, separating
all the Mariñame samples, grouped in one
large cluster, from the Santa Sofia and
Amacayacu samples, which formed two
independent groups.
DCA axis 1
3.02.52.01.51.0.50.0-.5
DC
A ax
is 2
2.5
2.0
1.5
1.0
.5
0.0
-.5
Stream
ZAQ2
ZAQ1
SSQ2
SSQ1
PUQ2
PUQ1
MAQ2
MAQ1
Pebas landscape unit
Mariñame landscape unit
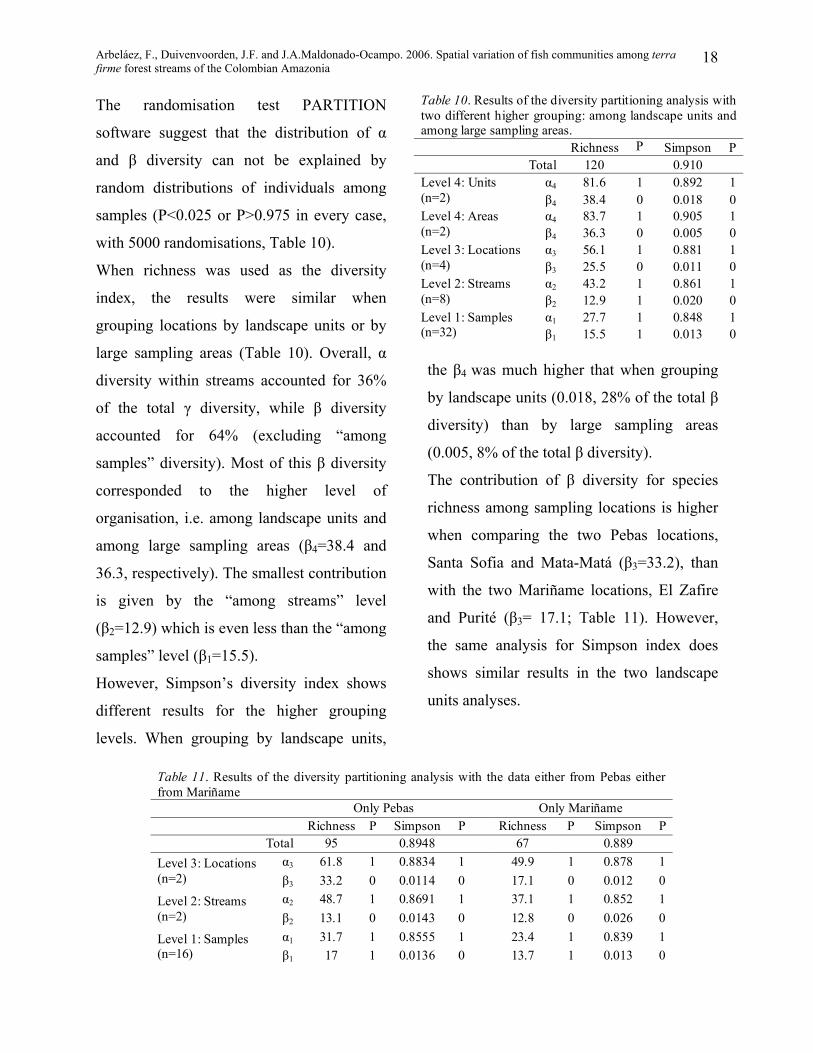
The DCA ANOVAs with repeated sampling
(Table 9) suggested comparable results as the
cluster analysis, although with a somehow
lower resolution. For both axes of the DCA,
samples from Mariñame and Pebas
formations were significantly different, but
Fig.6. Scatter plots for DCA results of fish composition per sample for the two main principal axes. Locations: ZA=El Zafire, SS=Santa Sofía, PU=Purité, MA-Mata-matá. Q=stream number. A solid line indicates ahe DCA using composition among
ampling days showed that the first two axes
ccount for 66% of the variation (43% and
2%, respectively). The graphic
epresentation of the DCA (Fig. 6) clearly
rouped sample events within each stream,
nd streams within sampling
ocations. The cluster analysis
howed a very strong aggregation
mong the Mariñame samples;
ndeed, some sub-clusters were
ormed by mixed samples of
urité and El Zafire streams,
hile some samples from the
ame stream were segregated in
ifferent subclusters. When only
lusters that included all samples
the effect of sampling areas or their
interaction was not significant. Among
sampling locations, only axis 1 shows a
significant difference, which occured
between Santa Sofía and the two Mariñame
locations (El Zafire and Purité).
Table 9. Results of one- and two- ways ANOVAs with repeated measures and post hoc tests for fish composition DCA scores. Bold indicates a significant difference.
Two-ways ANOVA DCA1 DCA2 F 15.62 8.07 Landscape unit (N=4) p 0.02 0.05 F 3.46 0.613 Sampling Area (N=4) p 0.14 0.478 F 5.95 1.83 Interaction (N=2) p 0.07 0.248
One-way ANOVA F 8.34 3.50 Sampling locations (N=2) p 0.03 0.13
Santa Sofia X Mata-Matá X X Purité X
Groups formed by Turkey’s HSD by location (p<0.05)
El Zafire X
Arbeláez, F., Duivenvoorden, J.F. and J.A.Maldonado-Ocampo. 2006. Spatial variation of fish communities among terra firme forest streams of the Colombian Amazonia
18
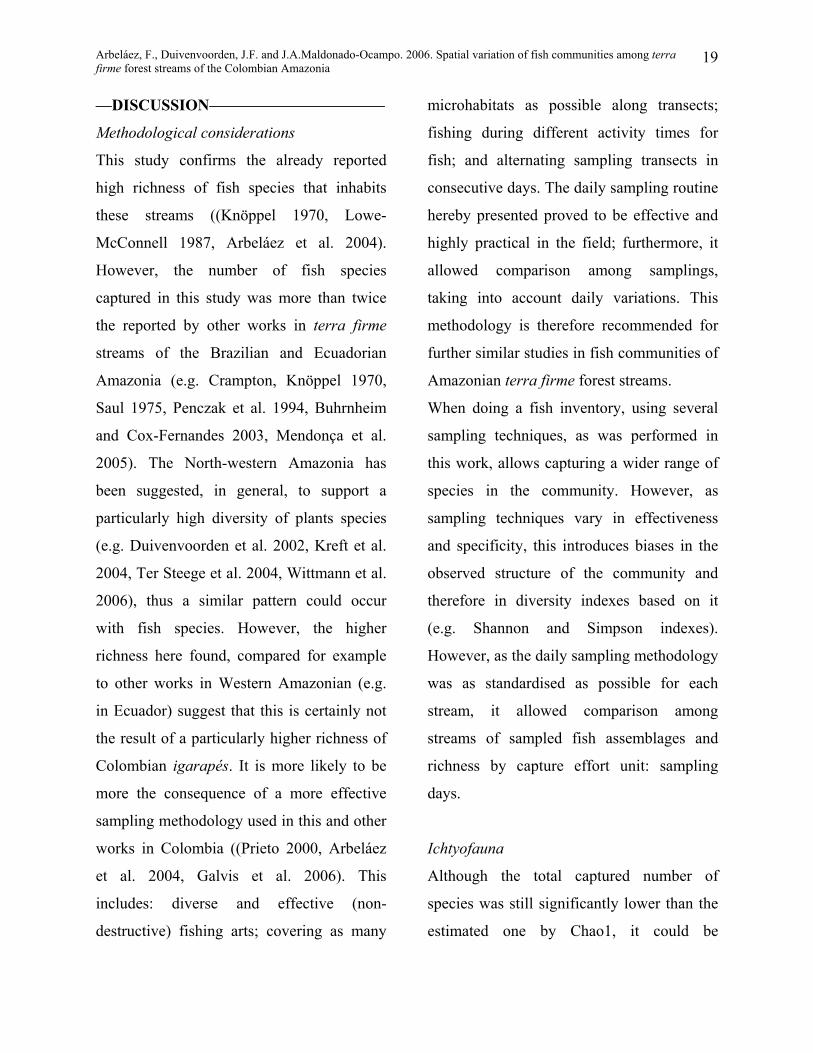
Table 10. Results of the diversity partitioning analysis with two different higher grouping: among landscape units and among large sampling areas.
Richness P Simpson P Total 120 0.910
α4 81.6 1 0.892 1 Level 4: Units (n=2) β4 38.4 0 0.018 0
α4 83.7 1 0.905 1 Level 4: Areas (n=2) β4 36.3 0 0.005 0
α3 56.1 1 0.881 1 Level 3: Locations (n=4) β3 25.5 0 0.011 0
α2 43.2 1 0.861 1 Level 2: Streams (n=8) β2 12.9 1 0.020 0
α1 27.7 1 0.848 1 Level 1: Samples (n=32) β1 15.5 1 0.013 0
The randomisation test PARTITION
software suggest that the distribution of α
and β diversity can not be explained by
random distributions of individuals among
samples (P<0.025 or P>0.975 in every case,
with 5000 randomisations, Table 10).
When richness was used as the diversity
index, the results were similar when
grouping locations by landscape units or by
large sampling areas (Table 10). Overall, α
diversity within streams accounted for 36%
of the total γ diversity, while β diversity
accounted for 64% (excluding “among
samples” diversity). Most of this β diversity
corresponded to the higher level of
organisation, i.e. among landscape units and
among large sampling areas (β4=38.4 and
36.3, respectively). The smallest contribution
is given by the “among streams” level
(β2=12.9) which is even less than the “among
samples” level (β1=15.5).
However, Simpson’s diversity index shows
different results for the higher grouping
levels. When grouping by landscape units,
the β4 was much higher that when grouping
by landscape units (0.018, 28% of the total β
diversity) than by large sampling areas
(0.005, 8% of the total β diversity).
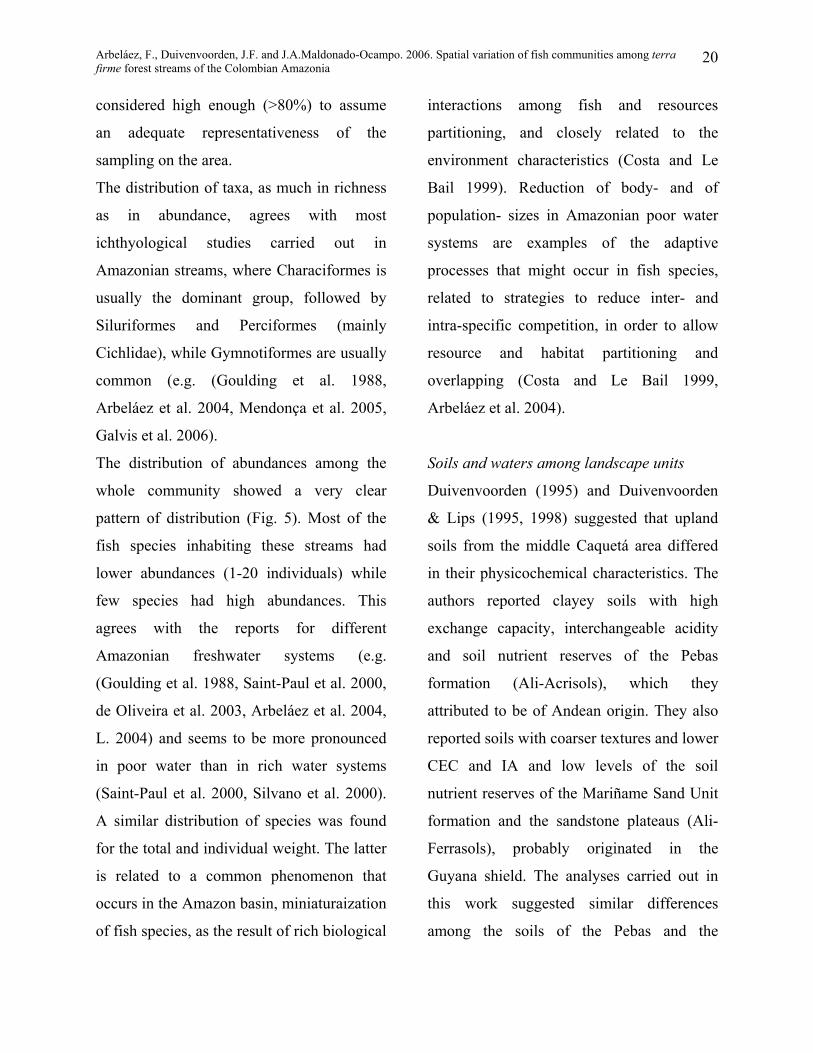
The contribution of β diversity for species
richness among sampling locations is higher
when comparing the two Pebas locations,
Santa Sofia and Mata-Matá (β3=33.2), than
with the two Mariñame locations, El Zafire
and Purité (β3= 17.1; Table 11). However,
the same analysis for Simpson index does
shows similar results in the two landscape
units analyses.
Table 11. Results of the diversity partitioning analysis with the data either from Pebas either from Mariñame Only Pebas Only Mariñame
Richness P Simpson P Richness P Simpson P Total 95 0.8948 67 0.889
α3 61.8 1 0.8834 1 49.9 1 0.878 1 Level 3: Locations (n=2) β3 33.2 0 0.0114 0 17.1 0 0.012 0
α2 48.7 1 0.8691 1 37.1 1 0.852 1 Level 2: Streams (n=2) β2 13.1 0 0.0143 0 12.8 0 0.026 0
α1 31.7 1 0.8555 1 23.4 1 0.839 1 Level 1: Samples (n=16) β1 17 1 0.0136 0 13.7 1 0.013 0
Arbeláez, F., Duivenvoorden, J.F. and J.A.Maldonado-Ocampo. 2006. Spatial variation of fish communities among terra firme forest streams of the Colombian Amazonia
19
––DISCUSSION––––––––––––––––––––––
Methodological considerations
This study confirms the already reported
high richness of fish species that inhabits
these streams ((Knöppel 1970, Lowe-
McConnell 1987, Arbeláez et al. 2004).
However, the number of fish species
captured in this study was more than twice
the reported by other works in terra firme
streams of the Brazilian and Ecuadorian
Amazonia (e.g. Crampton, Knöppel 1970,
Saul 1975, Penczak et al. 1994, Buhrnheim
and Cox-Fernandes 2003, Mendonça et al.
2005). The North-western Amazonia has
been suggested, in general, to support a
particularly high diversity of plants species
(e.g. Duivenvoorden et al. 2002, Kreft et al.
2004, Ter Steege et al. 2004, Wittmann et al.
2006), thus a similar pattern could occur
with fish species. However, the higher
richness here found, compared for example
to other works in Western Amazonian (e.g.
in Ecuador) suggest that this is certainly not
the result of a particularly higher richness of
Colombian igarapés. It is more likely to be
more the consequence of a more effective
sampling methodology used in this and other
works in Colombia ((Prieto 2000, Arbeláez
et al. 2004, Galvis et al. 2006). This
includes: diverse and effective (non-
destructive) fishing arts; covering as many
microhabitats as possible along transects;
fishing during different activity times for
fish; and alternating sampling transects in
consecutive days. The daily sampling routine
hereby presented proved to be effective and
highly practical in the field; furthermore, it
allowed comparison among samplings,
taking into account daily variations. This
methodology is therefore recommended for
further similar studies in fish communities of
Amazonian terra firme forest streams.
When doing a fish inventory, using several
sampling techniques, as was performed in
this work, allows capturing a wider range of
species in the community. However, as
sampling techniques vary in effectiveness
and specificity, this introduces biases in the
observed structure of the community and
therefore in diversity indexes based on it
(e.g. Shannon and Simpson indexes).
However, as the daily sampling methodology
was as standardised as possible for each
stream, it allowed comparison among
streams of sampled fish assemblages and
richness by capture effort unit: sampling
days.
Ichtyofauna
Although the total captured number of
species was still significantly lower than the
estimated one by Chao1, it could be
Arbeláez, F., Duivenvoorden, J.F. and J.A.Maldonado-Ocampo. 2006. Spatial variation of fish communities among terra firme forest streams of the Colombian Amazonia
20
considered high enough (>80%) to assume
an adequate representativeness of the
sampling on the area.
The distribution of taxa, as much in richness
as in abundance, agrees with most
ichthyological studies carried out in
Amazonian streams, where Characiformes is
usually the dominant group, followed by
Siluriformes and Perciformes (mainly
Cichlidae), while Gymnotiformes are usually
common (e.g. (Goulding et al. 1988,
Arbeláez et al. 2004, Mendonça et al. 2005,
Galvis et al. 2006).
The distribution of abundances among the
whole community showed a very clear
pattern of distribution (Fig. 5). Most of the
fish species inhabiting these streams had
lower abundances (1-20 individuals) while
few species had high abundances. This
agrees with the reports for different
Amazonian freshwater systems (e.g.
(Goulding et al. 1988, Saint-Paul et al. 2000,
de Oliveira et al. 2003, Arbeláez et al. 2004,
L. 2004) and seems to be more pronounced
in poor water than in rich water systems
(Saint-Paul et al. 2000, Silvano et al. 2000).
A similar distribution of species was found
for the total and individual weight. The latter
is related to a common phenomenon that
occurs in the Amazon basin, miniaturaization
of fish species, as the result of rich biological
interactions among fish and resources
partitioning, and closely related to the
environment characteristics (Costa and Le
Bail 1999). Reduction of body- and of
population- sizes in Amazonian poor water
systems are examples of the adaptive
processes that might occur in fish species,
related to strategies to reduce inter- and
intra-specific competition, in order to allow
resource and habitat partitioning and
overlapping (Costa and Le Bail 1999,
Arbeláez et al. 2004).
Soils and waters among landscape units
Duivenvoorden (1995) and Duivenvoorden
& Lips (1995, 1998) suggested that upland
soils from the middle Caquetá area differed
in their physicochemical characteristics. The
authors reported clayey soils with high
exchange capacity, interchangeable acidity
and soil nutrient reserves of the Pebas
formation (Ali-Acrisols), which they
attributed to be of Andean origin. They also
reported soils with coarser textures and lower
CEC and IA and low levels of the soil
nutrient reserves of the Mariñame Sand Unit
formation and the sandstone plateaus (Ali-
Ferrasols), probably originated in the
Guyana shield. The analyses carried out in
this work suggested similar differences
among the soils of the Pebas and the
Arbeláez, F., Duivenvoorden, J.F. and J.A.Maldonado-Ocampo. 2006. Spatial variation of fish communities among terra firme forest streams of the Colombian Amazonia
21
Mariñame formations in the southern
Trapecio Amazónico. The soils of Mariñame
appear to be sandier and with lower amount
of nutrients than the ones of Pebas. This was
also evidenced in the water characteristics
that drain these soils, as the electric
conductivity and the loads of dissolved
nutrients in the water were significantly
higher in Pebas streams. These results
support the hypothesis that Amazonian
upland soils differ in physicochemical
characteristics, and that it could be related to
the origin of their sediments, in this case,
Pebas formation from richer and younger
sediments of the Andes, and Mariñame
formation from older and poorer sediments
of the Guyana shield.
It is common that the poorer Amazonian
soils, such as the ones that drain the Rio
Negro basin, have a tendency to be acidic,
which results also in waters with very low
pH (Goulding et al. 1988). However, this
was not the case when comparing Mariñame
and Pebas formations. The water pH was not
an important variable in the water PCA to
difference the two landscape units, and the
relation was even inversed in the soil pH,
with Mariñame showing higher pH. In
Duivenvoorden & Lips (1998), pH was also
not an important variable to account for the
difference in soils between these two
formations. Nevertheless, other important
variables in the soil analysis, related to base
content and base saturation, with much
higher loading than the pH, suggest that
there is indeed a difference in the bases
content.
A significant difference was found between
Santa Sofia and El Zafire soils in the third
axis of the soils PCA (Fig. 2). Although
there are no clearly defined groups for this
axis, as there is for the first axis or for the
axes of the waters PCA, there seems to be a
range that goes from the Santa Sofia soils
with high organic content and CEC, to El
Zafire soils were these values are very low,
together with a trade-off between sodium and
potassium. It was also found that the waters
seemed to differ in nutrient content between
the two Pebas locations, being Santa Sofia
streams significantly richer than Mata-matá
streams. These results suggest that there
might be other processes and trade-offs
involved in the regional differentiation of
soils and waters than just the separation
between geological formations. For example,
the higher human intervention of the forest
close to the large village of Santa Sofia,
compared to the other locations, might be
playing an important role.
It is interesting to notice that the results on
water analyses appeared to be more clearly
Arbeláez, F., Duivenvoorden, J.F. and J.A.Maldonado-Ocampo. 2006. Spatial variation of fish communities among terra firme forest streams of the Colombian Amazonia
22
interpretable (streams from same locations
close to each other, clear separation between
landscape units) than the soil results. This
could occur because localised differences in
soil composition were perhaps amplified due
to the small size and number of soil samples.
These localised differences are “averaged” in
the stream water that has drained them, for
what the water physicochemical
characteristics appeared to give a better
image of the general soil characteristics in
the area area.
Fish community characteristics among
landscape units
Physicochemical factors and habitat
differences have been suggested to influence
the distribution of fish species (Angermeier
and Karr 1982, Henderson and Crampton
1997, Mendonça et al. 2005). This study also
evidenced that differences in soil properties
and in water chemistry were reflected in the
fish communities; fish communities
appeared to be very particularly sensitive to
water chemistry. In this case, the differences
in the fish communities accounted for
species richness, carrying capacity and
composition.
Species richness
(Duivenvoorden et al. 2005) did not find
significant differences in tree diversity
among poorer and richer upland forests in
the middle Caquetá. This works suggest,
however, that Pebas formation streams
support higher fish species richness than the
Mariñame formation streams (Table 8). As
the number of individuals captured was not
significantly different (Fig. 6b), this result is
not likely to be the consequence of
undersampling in the latter. Conditions of
extreme acidity and of low conductivity can
directly affect fishes, since such
environments influence their ionic and acid-
basic regulation (Gonzalez 1996, cited in
Mendoça 2005). The extremely low
conductivity (<6 dS/cm in average) in poorer
upland soils may require more specialised
species that can tolerate them, which might
be a limiting factor for species richness
(Towsend et al. 2003).
Carrying capacity
The fish carrying capacity in aquatic systems
has often been related to the load of nutrients
in their waters, for example when comparing
Amazonian white-water and black-water
systems, in relation to size (Galvis et al.
2006) and biomass (Henderson and
Crampton 1997, Saint-Paul et al. 2000). In
this study, a similar pattern was observed
comparing similar systems that differed in
concentration of elements in the water: Pebas
streams, richer in elements, showed a much
Arbeláez, F., Duivenvoorden, J.F. and J.A.Maldonado-Ocampo. 2006. Spatial variation of fish communities among terra firme forest streams of the Colombian Amazonia
23
higher carrying capacity than Mariñame
streams, reflected in the total weight of the
catchments (nearly twice as much).
Fish composition
The DCA analyses on fish composition
showed a strong relation between differences
in soil and water characteristics and the fish
assemblages. First, the streams from
Mariñame, which had similar soil and water
characteristics seemed to have equally
undifferentiated fish communities. Second,
the streams from Pebas appeared to be
segregated in relation to the sampling
locations, Santa Sofia and Mata-matá, both
in water properties and in fish assemblages.
These differences and similarities in fish
composition could already be evidenced
from the field with the resemblance between
the two Mariñame locations, Purité and El
Zafire, separated nearly by 50 km. Some
species (i.e. Bunocephalus sp., Moenkhausia
tridentata and Otocinclus sp.; see Appendix
1) were collected in those two locations but
in neither of the Pebas locations. Even
closely related species, such as Heptaterus
sp.1 and Heptaterus sp.2, were segregated in
the same area between the two landscape
units, in locations 25 km away from each
other (Santa Sofia and El Zafire). This
general distribution pattern might suggest
that the difference in composition could be
more a reflection of ecological preferences of
the fish species than biogeographical
segregation, though further data is required
to assert this statement (further sampling and
genetic analyses).
Duivenvoorden and Lips (1995) reported
differences in the forest composition
between Ali-Acrisols from Pebas and Ali-
Ferrasols from Mariñame upland soils.
Likewise, the hereby-presented results
suggest that the general properties of the
soils are an important component for fish
species differentiation. As these forest stream
ecosystems are completely dependent on the
inputs form the surrounding forest, a very
strong correspondence between forest
composition and fish assemblages would be
expected. To unveil these patterns, forest
inventories along the streams, together with
the fish samplings, should be carried out.
The results of the diversity partitioning
analysis were not as clear as the
correspondence analysis. Some differences
and similarities of the fish composition were
very evident in the DCA and corresponded to
soils and water analyses, but were not
reflected in a different contribution of the β
diversity; in particular, this occurred with the
difference between large sampling areas and
among the two Pebas locations. The fact that
the software does not estimates statistical
Arbeláez, F., Duivenvoorden, J.F. and J.A.Maldonado-Ocampo. 2006. Spatial variation of fish communities among terra firme forest streams of the Colombian Amazonia
24
significance of the diversities contributions
makes them unreliable for comparison.
Furthermore, the two analysed indexes,
species richness and Simpson index led to
different conclusions. Perhaps the approach
of getting an idea of the β diversity as the
difference between γ diversity and the
average α diversity is too simplistic and does
not really reflect the spatial turnover of
species in a regional scale, at least at the
temporal and spatial scale used in this study.
It is possible that the differentiation of
landscape units is reflected also in other
characteristics of the fish community, such
as trophic levels structure, reproductive
strategies and behaviour, as well as
physiological and morphological
adaptations. Further and more specific
studies in these areas are required to gain a
deeper understanding on these aspects.
Importance for conservation
Regional and landscape ecology studies are
of high relevance for environmental
management and planning of natural areas
(Groves 2003, Groom et al. 2006), and
improve the understanding of land-use
disturbances on fishery resources (Schlosser
1991). This is especially important protected
areas, such as the Amacayacu Natural
National Park. Some results of the present
work reflect that relation:
1) The identification of a clear fish β
diversity pattern in the region, conforming
two landscape units with different soil and
water characteristics allows wiser planning
and management of land and aquatic
resources in the Park.
2) The results show a significantly lower
carrying capacity for one of these units, the
Mariñame formation, which might indicate
that it may be less suitable for exploitation,
and particularly sensitive to destructive
fishing methods, such as ichtyocides, which
are still commonly used in certain areas
(Peñuela pers. com.).
3) The whole fish community shows a very
high frequency of rare species. Since rare
species are particularly vulnerable to habitat
changes, rarity patterns in the biota reflect
the degree of integrity of the environment
(de Oliveira et al. 2003). For one side, this
reinforces the importance of preserving these
environments, and for the other, changes in
these distribution patterns could be used as
indicators of habitat change and human
influence at different ecological scales.
4) The high sensitivity to water
characteristics observed in these fish
communities could indicate that the might be
very vulnerable to small habitat changes that
Arbeláez, F., Duivenvoorden, J.F. and J.A.Maldonado-Ocampo. 2006. Spatial variation of fish communities among terra firme forest streams of the Colombian Amazonia
25
could alter those characteristics, such as
contamination, deforestation and change of
land use, among others.
The results of this study also suggested that
other non-identified factors seemed to be
involved in the differentiation of the soil and
water characteristics and in the fish
assemblages. One clear case of this was the
separation of between the two locations of
Pebas landscape unit: Santa Sofia and Mata-
matá. More sampling should be carried out
in other areas where the two landscape units
coincide, in this and other areas of the
Amazonia, e.g. Caquetá, and using the
hereby-proposed methodology. However,
further studies, involving other techniques,
such as molecular biology, and other groups
of organisms, will help us improve the
knowledge of these patterns of regional
diversity.
––REFERENCES ––––––––––––––––––––
Angermeier, P. L., and J. R. Karr. 1982. Fish communities along environmental gradients in a system of tropical streams. Environmental biology of fishes 9:117-135.
Arbeláez, F., G. Gálvis, J. I. Mojica, and S. R. Duque. 2004. Composition and richness of the ichthyofauna in a terra firme forest stream of the Colombian Amazonia. Amazoniana 18:109-123.
Buhrnheim, C. M., and C. Cox-Fernandes. 2003. Seasonal variation of fish
communities in Amazonian rain forest streams. Ichthyological Exploration of Freshwaters 12:65-78.
Colwell, R. K. 2005. EstimateS: Statistical estimation of species richness and shared species from samples. User guide.
Costa, W. J., and P. Y. Le Bail. 1999. Fluviphylax palikur: A New Poeciliid from the Rio Oiapoque Basin, Northern Brazil (Cyprinodontiformes: Cyprinodontoidei), with Comments on Miniaturization in Fluviphylax and Other Neotropical Freshwater Fishes. American soc. ichthyologist & herpetologist:1027-1034.
Crampton, W. G. R. Os peixes da Reserva Mamirauá: diversidade e história natural na planície alagável da Amazônia. Pages 10–36 in H. L. Queiroz and W. G. R. e. Crampton, editors. Estratégias para manejo de recursos pesqueiros em Mamirauá. Sociedade Civil Mamirauá/CNPq, Brasília.
Crist, T. O., J. A. Veech, J. C. Gering, and K. S. Summerville. 2003. Partitioning Species Diversity across Landscapes and Regions: A Hierarchical Analysis of alpha, beta, and gamma Diversity. The American Naturalist 162:734-743.
de Oliveira, E. F., E. Goulart, and C. V. Minte-Vera. 2003. Patterns of dominance and rarity of fish assemblage along spatial gradients in the Itaipu Reservoir, Paraná, Brazil. Acta Scientiarum 25:71-78.
Duivenvoorden, J. F. 1995. Tree species composition and rain forest–environment relationships in the middle Caqueta area, Colombia, NW Amazonia. Vegetatio 120:91–113.
Duivenvoorden, J. F., A. J. Duque, J. Cavelier, A. García, C. Grández, M. J. Macía, H. Romero-Saltos, M.
Arbeláez, F., Duivenvoorden, J.F. and J.A.Maldonado-Ocampo. 2006. Spatial variation of fish communities among terra firme forest streams of the Colombian Amazonia
26
Sánchez, and V. R. 2005. Density and diversity of plants in relation to soil nutrient reserves in well-drained upland forests in the north-western Amazon Basin. in I. Friis and B. H. (eds.), editors. Symposium on plant diversity and complexity patterns: local, regional and global dimensions. The Royal Danish Academy of Sciences and Letters, Denmark.
Duivenvoorden, J. F., and J. M. Lips. 1993. Landscape ecology of the Middle Caquetá Basin. Explanatory notes to the maps. Pages 301 in Estudios en la Amazonia Colombiana. Tropenbos-Colombia, Bogotá.
Duivenvoorden, J. F., and J. M. Lips. 1995. A Land Ecological Study of Soils, Vegetation and Plant Diversity in Colombian Amazonia. The Tropenbos Foundation, Wageningen.
Duivenvoorden, J. F., and J. M. Lips. 1998. Mesoscale Patterns of tree spcecies diversity in Colombian Amazonia. in D. Dallmeier and J. A. Comiskey, editors. Forest biodiversity in North, Central and South America, and the Caribbean. Research and Monitoring. UNESCO/ The Partenon Publishing Group, Paris.
Duivenvoorden, J. F., J. C. Svenning, and S. J. Wright. 2002. Beta Diversity in Tropical Forests. Science 295:636-637.
Galvis, G., J. I. Mojica, J. Lobón-Cerviá, C. Granado-Lorencio, S. R. Duque, C. Castellanos, P. Sánchez-Duarte, M. Arce, Á. Gutiérrez, L. F. Jiménez, M. Santos, S. Vejarano, F. Arbeláez, E. Prieto, and M. Leiva, editors. 2006. Peces del Alto Amazonas - Región de leticia. Conservación Internacional, Bogotá.
Goulding, M., M. Leal-Carvalho, and F. E.G. 1988. Rio Negro, rich life in poor water. Amazonian diversity and
foodchain ecology as seen through fish communities. SPB Academic Publishing, The Hague.
Groom, M. J., G. K. Meffe, and C. R. Carroll. 2006. Principles of Conservation Biology (3rd ed.). Sinauer Associates, Sunderland, MA.
Groves, C. R. 2003. Drafting a conservation blueprint. A practitioner’s guide to planning for biodiversity. Island Press, Washington, D. C.
Henderson, P. A., and W. G. R. Crampton. 1997. A comparison of fish diversity and density from nutrient rich and poor waters lakes in the Upper Amazon. J. Trop. Ecol. 13:175-198.
Hoorn, C. 1994a. An environmental reconstruction of the paleo-Amazon River system (Middle-Late Miocene, NW Amazonia). Palaeogeography, Palaeoclimatology, Paleoecology 112:187-238.
Hoorn, C. 1994b. Fluvial palaeo-environments in the intracratonic Amazonas Basin (Early Miocene - early Middle Miocene, Colombia). Palaeogeography, Palaeoclimatology, Paleoecology 109:1-54.
Knöppel, H. A. 1970. Food of Central Amazonian fishes. Contribution to the nutrient-ecology of Amazonian rainforest-streams. Amazoniana 2:257-352.
Kreft, H., N. Koster, W. Kuper, J. Nieder, and W. Barthlott. 2004. Diversity and biogeography of vascular epiphytes in Western Amazonia, Yasuni, Ecuador. Journal of Biogeography 31:1463-1476.
L., C. 2004. Fish assemblage structure in a first order stream, Southeastern Bra-zil: Longitudinal distribution, seasonality, and microhabitat diversity. Biota Neotropica 5:75-83.
Lips, J. M., and J. F. Duivenvoorden. 1996. Fine litter input to terrestrial humus
Arbeláez, F., Duivenvoorden, J.F. and J.A.Maldonado-Ocampo. 2006. Spatial variation of fish communities among terra firme forest streams of the Colombian Amazonia
27
forms in Colombian Amazonia. Oecologia 108:138-150.
Lowe-McConnell, R. H. 1987. Ecological Studies in Tropical Fish Communities.
Magurran, A. E. 1988. Ecological diversity and its measurement. Princeton University Press, Princeton, N.J.
Mendonça, F. P., W. E. Magnusson, and Z. J. 2005. Relationships between habitat characteristics and fish assemblages in small streams of Central Amazonia. Copeia:751-764.
PAT. 1997. Zonificación ambiental para el plan modelo Colombo-Brasilero (Eje Apaporis-Tabatinga: PAT). IGAC, Bogotá.
Penczak, T., A. A. Agostinho, and E. K. Okada. 1994. Fish diversity and community structure in two small tributaries of the Paraná River, Paraná State, Brazil. Hydrobiologia 294:243-251.
Prieto, E. 2000. Estudio ictiológico de un caño de aguas negras de la Amazonia Colombiana, Leticia. Universidad Nacional de Colombia, Bogotá.
Rudas-Lleras, A., and A. Prieto-Cruz. 2005. Flórula Del Parque Nacional Natural Amacayacu, Amazonas, Colombia. Missouri Botanical Garden, Saint Louis, MO.
Saint-Paul, U., J. Zuanon, M. A. Correa, M. Garcia, N. N. Fabre, U. Berger, and W. J. Junk. 2000. Fish communities in central Amazonian white-and blackwater floodplains. Environmental biology of fishes 57:235-250.
Saul, W. G. 1975. An ecological study of fishes at a site in upper Amazonian Ecuador. Proc. Acad. Nat. Sci. Philad. 127:93-134.
Schlosser, I. J. 1991. Stream Fish Ecology: A Landscape Perspective. BioScience 41:704-712.
Silvano, R. A., B. D. do Amaral, and O. T. Oyakawa. 2000. Spatial and temporal patterns of diversity and distribution of the Upper Jurua River fish community (Brazilian Amazon). Environmental biology of fishes 57:25-35.
Ter Steege, H., N. Pitman, D. Sabatier, H. Castellanos, P. Van Der Hout, D. C. Daly, M. Silveira, O. Phillips, R. Vasquez, and T. Van Andel. 2004. A spatial model of tree α-diversity and tree density for the Amazon. Biodiversity and Conservation 12:2255-2277.
Towsend, C., M. Begon, and J. Harper. 2003. Essentials of ecology. Second Edition. Blackwell, Malden.
Veech, J. A., K. S. Summerville, T. O. Crist, and J. Gering. 2002. The additive partitioning of species diversity: recent revival of an old idea. Oikos 99:3-9.
Vonhof, H. B., F. P. Wesselingh, and G. M. Ganssen. 1998. Reconstruction of the Miocene western Amazonian aquatic system using molluscan isotopic signatures. Palaeogeography, Palaeoclimatology, Palaeoecology 141:85-93.
Walker, I. 1995. Amazonian streams and small rivers. in J. G. Tundisi, C. E. M. Bicudo & T. Matsumura-Tundisi (eds.), editor. Limnology in Brazil. Sociedade Brasileira de Limnologia/Academia Brasileira de Ciencias, Brazil.
Wittmann, F., J. Schongart, J. C. Montero, T. Motzer, W. J. Junk, M. T. F. Piedade, H. L. Queiroz, and M. Worbes. 2006. Tree species composition and diversity gradients in white-water forests across the Amazon Basin. Journal of Biogeography 33:1334-1347.
Arbeláez, F., Duivenvoorden, J.F. and J.A.Maldonado-Ocampo. 2006. Spatial variation of fish communities among terra firme forest streams of the Colombian Amazonia
28
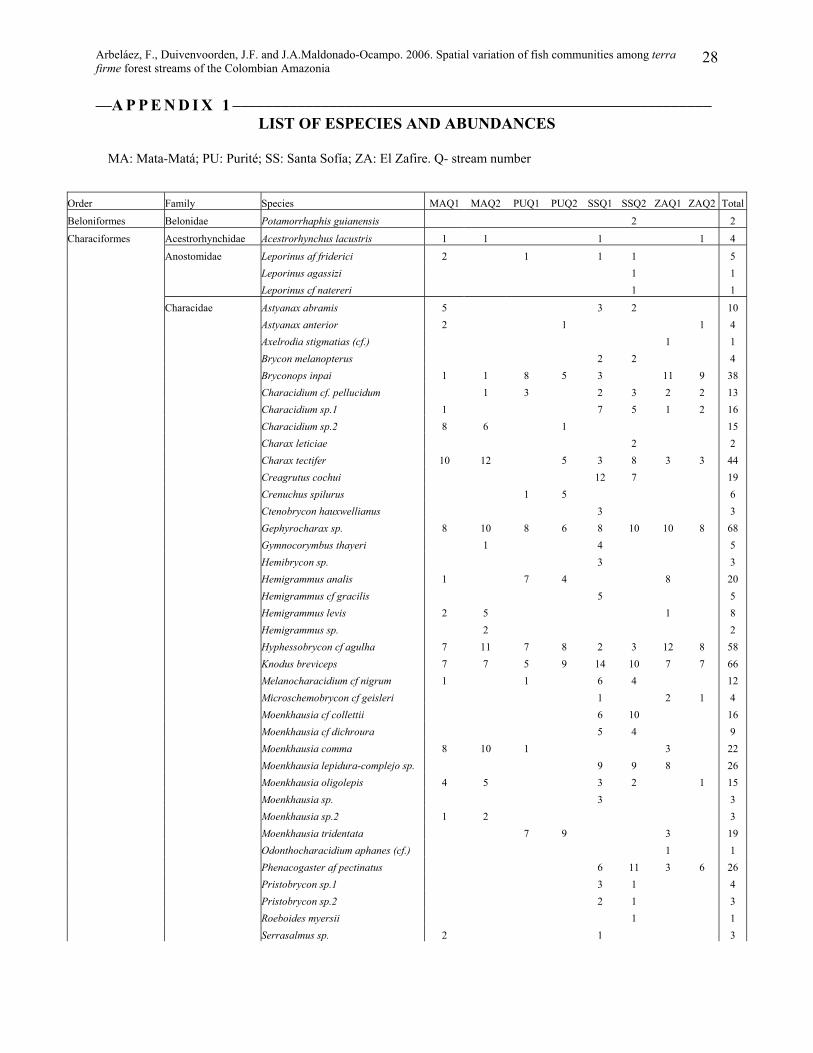
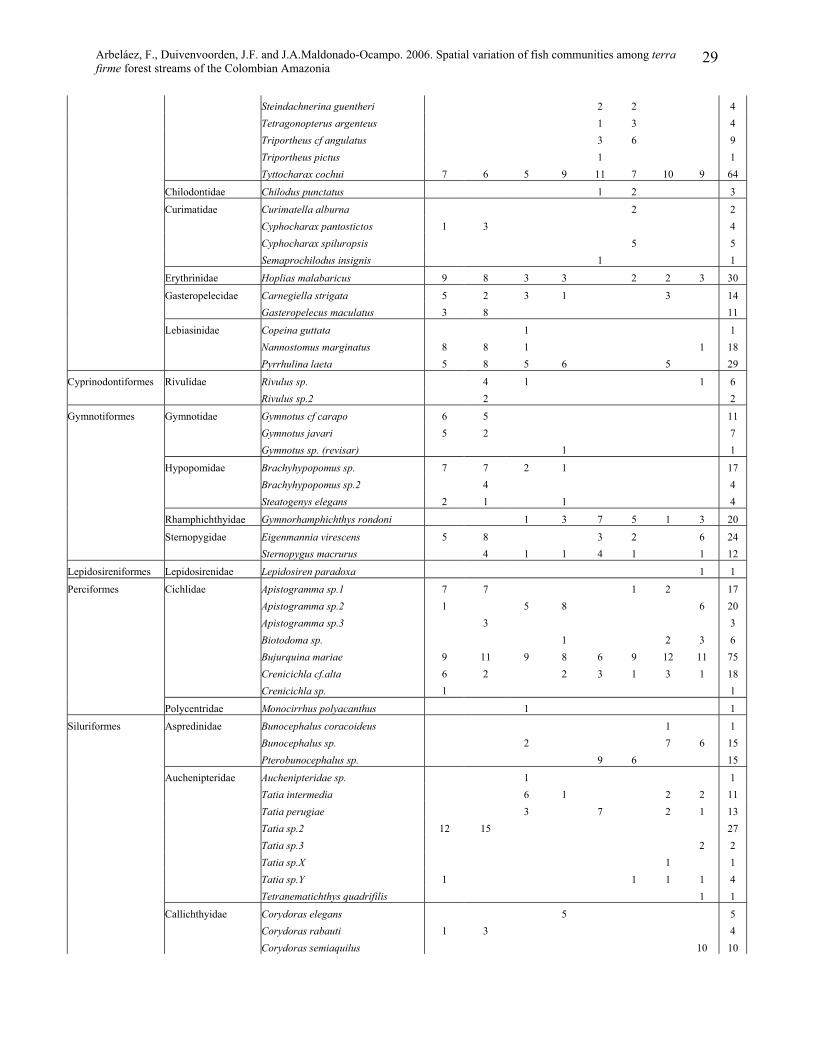
––A P P E N D I X 1 –––––––––––––––––––––––––––––––––––––––––––––––––––––––––––– LIST OF ESPECIES AND ABUNDANCES
MA: Mata-Matá; PU: Purité; SS: Santa Sofía; ZA: El Zafire. Q- stream number
Order Family Species MAQ1 MAQ2 PUQ1 PUQ2 SSQ1 SSQ2 ZAQ1 ZAQ2 Total
Beloniformes Belonidae Potamorrhaphis guianensis 2 2
Characiformes Acestrorhynchidae Acestrorhynchus lacustris 1 1 1 1 4
Anostomidae Leporinus af friderici 2 1 1 1 5 Leporinus agassizi 1 1 Leporinus cf natereri 1 1
Characidae Astyanax abramis 5 3 2 10 Astyanax anterior 2 1 1 4 Axelrodia stigmatias (cf.) 1 1 Brycon melanopterus 2 2 4 Bryconops inpai 1 1 8 5 3 11 9 38 Characidium cf. pellucidum 1 3 2 3 2 2 13 Characidium sp.1 1 7 5 1 2 16 Characidium sp.2 8 6 1 15 Charax leticiae 2 2 Charax tectifer 10 12 5 3 8 3 3 44 Creagrutus cochui 12 7 19 Crenuchus spilurus 1 5 6 Ctenobrycon hauxwellianus 3 3 Gephyrocharax sp. 8 10 8 6 8 10 10 8 68 Gymnocorymbus thayeri 1 4 5 Hemibrycon sp. 3 3 Hemigrammus analis 1 7 4 8 20 Hemigrammus cf gracilis 5 5 Hemigrammus levis 2 5 1 8 Hemigrammus sp. 2 2 Hyphessobrycon cf agulha 7 11 7 8 2 3 12 8 58 Knodus breviceps 7 7 5 9 14 10 7 7 66 Melanocharacidium cf nigrum 1 1 6 4 12 Microschemobrycon cf geisleri 1 2 1 4 Moenkhausia cf collettii 6 10 16 Moenkhausia cf dichroura 5 4 9 Moenkhausia comma 8 10 1 3 22 Moenkhausia lepidura-complejo sp. 9 9 8 26 Moenkhausia oligolepis 4 5 3 2 1 15 Moenkhausia sp. 3 3 Moenkhausia sp.2 1 2 3 Moenkhausia tridentata 7 9 3 19 Odonthocharacidium aphanes (cf.) 1 1 Phenacogaster af pectinatus 6 11 3 6 26 Pristobrycon sp.1 3 1 4 Pristobrycon sp.2 2 1 3 Roeboides myersii 1 1 Serrasalmus sp. 2 1 3
Arbeláez, F., Duivenvoorden, J.F. and J.A.Maldonado-Ocampo. 2006. Spatial variation of fish communities among terra firme forest streams of the Colombian Amazonia
29
Steindachnerina guentheri 2 2 4 Tetragonopterus argenteus 1 3 4 Triportheus cf angulatus 3 6 9 Triportheus pictus 1 1 Tyttocharax cochui 7 6 5 9 11 7 10 9 64
Chilodontidae Chilodus punctatus 1 2 3
Curimatidae Curimatella alburna 2 2 Cyphocharax pantostictos 1 3 4 Cyphocharax spiluropsis 5 5 Semaprochilodus insignis 1 1
Erythrinidae Hoplias malabaricus 9 8 3 3 2 2 3 30
Gasteropelecidae Carnegiella strigata 5 2 3 1 3 14 Gasteropelecus maculatus 3 8 11
Lebiasinidae Copeina guttata 1 1 Nannostomus marginatus 8 8 1 1 18 Pyrrhulina laeta 5 8 5 6 5 29
Cyprinodontiformes Rivulidae Rivulus sp. 4 1 1 6 Rivulus sp.2 2 2
Gymnotiformes Gymnotidae Gymnotus cf carapo 6 5 11 Gymnotus javari 5 2 7 Gymnotus sp. (revisar) 1 1
Hypopomidae Brachyhypopomus sp. 7 7 2 1 17 Brachyhypopomus sp.2 4 4 Steatogenys elegans 2 1 1 4
Rhamphichthyidae Gymnorhamphichthys rondoni 1 3 7 5 1 3 20
Sternopygidae Eigenmannia virescens 5 8 3 2 6 24 Sternopygus macrurus 4 1 1 4 1 1 12
Lepidosireniformes Lepidosirenidae Lepidosiren paradoxa 1 1
Perciformes Cichlidae Apistogramma sp.1 7 7 1 2 17 Apistogramma sp.2 1 5 8 6 20 Apistogramma sp.3 3 3 Biotodoma sp. 1 2 3 6 Bujurquina mariae 9 11 9 8 6 9 12 11 75 Crenicichla cf.alta 6 2 2 3 1 3 1 18 Crenicichla sp. 1 1
Polycentridae Monocirrhus polyacanthus 1 1
Siluriformes Aspredinidae Bunocephalus coracoideus 1 1 Bunocephalus sp. 2 7 6 15 Pterobunocephalus sp. 9 6 15
Auchenipteridae Auchenipteridae sp. 1 1 Tatia intermedia 6 1 2 2 11 Tatia perugiae 3 7 2 1 13 Tatia sp.2 12 15 27 Tatia sp.3 2 2 Tatia sp.X 1 1 Tatia sp.Y 1 1 1 1 4 Tetranematichthys quadrifilis 1 1
Callichthyidae Corydoras elegans 5 5 Corydoras rabauti 1 3 4 Corydoras semiaquilus 10 10
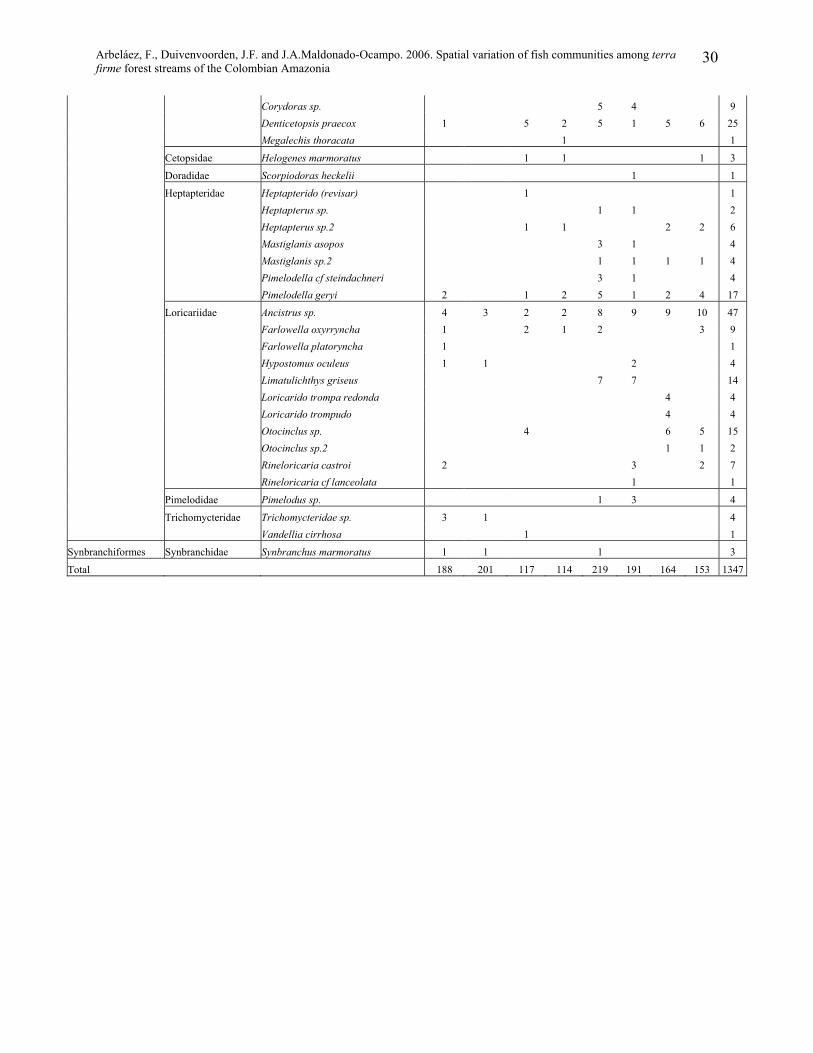
Arbeláez, F., Duivenvoorden, J.F. and J.A.Maldonado-Ocampo. 2006. Spatial variation of fish communities among terra firme forest streams of the Colombian Amazonia
30
Corydoras sp. 5 4 9 Denticetopsis praecox 1 5 2 5 1 5 6 25 Megalechis thoracata 1 1
Cetopsidae Helogenes marmoratus 1 1 1 3
Doradidae Scorpiodoras heckelii 1 1
Heptapteridae Heptapterido (revisar) 1 1 Heptapterus sp. 1 1 2 Heptapterus sp.2 1 1 2 2 6 Mastiglanis asopos 3 1 4 Mastiglanis sp.2 1 1 1 1 4 Pimelodella cf steindachneri 3 1 4 Pimelodella geryi 2 1 2 5 1 2 4 17
Loricariidae Ancistrus sp. 4 3 2 2 8 9 9 10 47 Farlowella oxyrryncha 1 2 1 2 3 9 Farlowella platoryncha 1 1 Hypostomus oculeus 1 1 2 4 Limatulichthys griseus 7 7 14 Loricarido trompa redonda 4 4 Loricarido trompudo 4 4 Otocinclus sp. 4 6 5 15 Otocinclus sp.2 1 1 2 Rineloricaria castroi 2 3 2 7 Rineloricaria cf lanceolata 1 1
Pimelodidae Pimelodus sp. 1 3 4
Trichomycteridae Trichomycteridae sp. 3 1 4 Vandellia cirrhosa 1 1
Synbranchiformes Synbranchidae Synbranchus marmoratus 1 1 1 3
Total 188 201 117 114 219 191 164 153 1347
Arbeláez, F., Duivenvoorden, J.F. and J.A.Maldonado-Ocampo. 2006. Spatial variation of fish communities among terra firme forest streams of the Colombian Amazonia
31
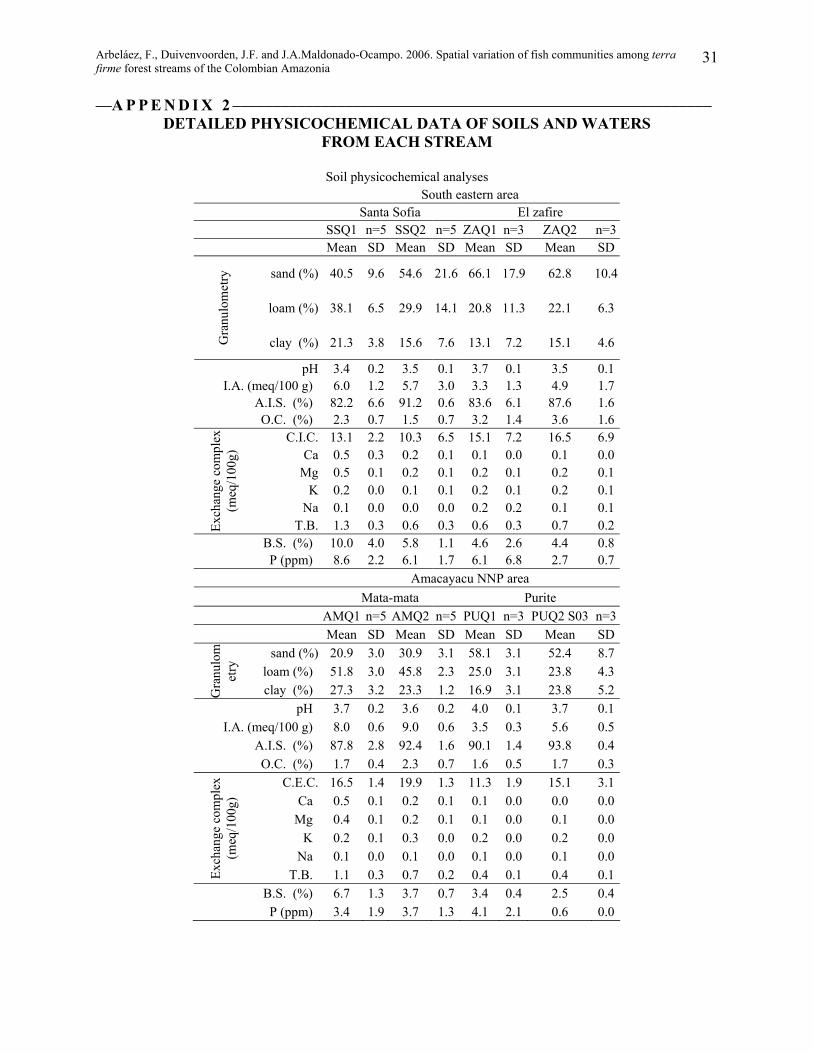
––A P P E N D I X 2 –––––––––––––––––––––––––––––––––––––––––––––––––––––––––––– DETAILED PHYSICOCHEMICAL DATA OF SOILS AND WATERS
FROM EACH STREAM
Soil physicochemical analyses South eastern area Santa Sofia El zafire SSQ1 n=5 SSQ2 n=5 ZAQ1 n=3 ZAQ2 n=3 Mean SD Mean SD Mean SD Mean SD
sand (%) 40.5 9.6 54.6 21.6 66.1 17.9 62.8 10.4
loam (%) 38.1 6.5 29.9 14.1 20.8 11.3 22.1 6.3
Gra
nulo
met
ry
clay (%) 21.3 3.8 15.6 7.6 13.1 7.2 15.1 4.6
pH 3.4 0.2 3.5 0.1 3.7 0.1 3.5 0.1 I.A. (meq/100 g) 6.0 1.2 5.7 3.0 3.3 1.3 4.9 1.7
A.I.S. (%) 82.2 6.6 91.2 0.6 83.6 6.1 87.6 1.6 O.C. (%) 2.3 0.7 1.5 0.7 3.2 1.4 3.6 1.6
C.I.C. 13.1 2.2 10.3 6.5 15.1 7.2 16.5 6.9 Ca 0.5 0.3 0.2 0.1 0.1 0.0 0.1 0.0
Mg 0.5 0.1 0.2 0.1 0.2 0.1 0.2 0.1 K 0.2 0.0 0.1 0.1 0.2 0.1 0.2 0.1
Na 0.1 0.0 0.0 0.0 0.2 0.2 0.1 0.1
Exch
ange
com
plex
(m
eq/1
00g)
T.B. 1.3 0.3 0.6 0.3 0.6 0.3 0.7 0.2 B.S. (%) 10.0 4.0 5.8 1.1 4.6 2.6 4.4 0.8 P (ppm) 8.6 2.2 6.1 1.7 6.1 6.8 2.7 0.7
Amacayacu NNP area Mata-mata Purite AMQ1 n=5 AMQ2 n=5 PUQ1 n=3 PUQ2 S03 n=3 Mean SD Mean SD Mean SD Mean SD
sand (%) 20.9 3.0 30.9 3.1 58.1 3.1 52.4 8.7 loam (%) 51.8 3.0 45.8 2.3 25.0 3.1 23.8 4.3
Gra
nulo
met
ry
clay (%) 27.3 3.2 23.3 1.2 16.9 3.1 23.8 5.2 pH 3.7 0.2 3.6 0.2 4.0 0.1 3.7 0.1 I.A. (meq/100 g) 8.0 0.6 9.0 0.6 3.5 0.3 5.6 0.5
A.I.S. (%) 87.8 2.8 92.4 1.6 90.1 1.4 93.8 0.4 O.C. (%) 1.7 0.4 2.3 0.7 1.6 0.5 1.7 0.3
C.E.C. 16.5 1.4 19.9 1.3 11.3 1.9 15.1 3.1 Ca 0.5 0.1 0.2 0.1 0.1 0.0 0.0 0.0
Mg 0.4 0.1 0.2 0.1 0.1 0.0 0.1 0.0 K 0.2 0.1 0.3 0.0 0.2 0.0 0.2 0.0
Na 0.1 0.0 0.1 0.0 0.1 0.0 0.1 0.0
Exch
ange
com
plex
(m
eq/1
00g)
T.B. 1.1 0.3 0.7 0.2 0.4 0.1 0.4 0.1 B.S. (%) 6.7 1.3 3.7 0.7 3.4 0.4 2.5 0.4 P (ppm) 3.4 1.9 3.7 1.3 4.1 2.1 0.6 0.0
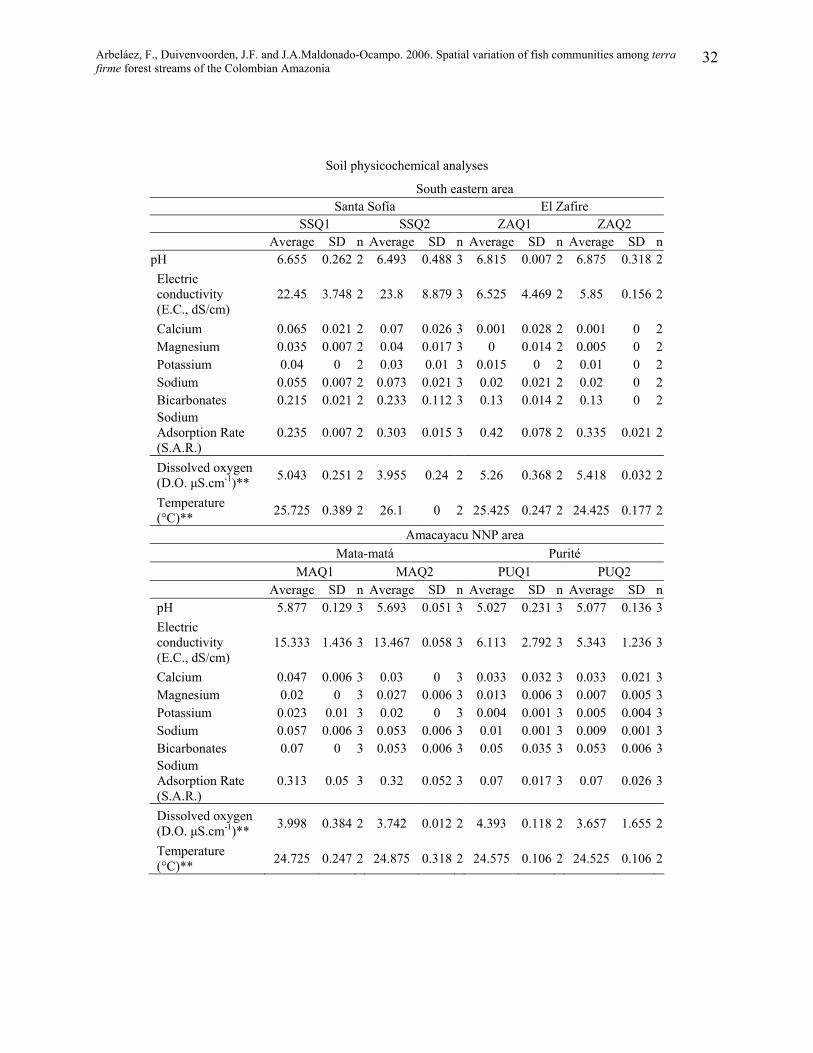
Arbeláez, F., Duivenvoorden, J.F. and J.A.Maldonado-Ocampo. 2006. Spatial variation of fish communities among terra firme forest streams of the Colombian Amazonia
32
Soil physicochemical analyses
South eastern area Santa Sofía El Zafire SSQ1 SSQ2 ZAQ1 ZAQ2 Average SD n Average SD n Average SD n Average SD npH 6.655 0.262 2 6.493 0.488 3 6.815 0.007 2 6.875 0.318 2Electric conductivity (E.C., dS/cm)
22.45 3.748 2 23.8 8.879 3 6.525 4.469 2 5.85 0.156 2
Calcium 0.065 0.021 2 0.07 0.026 3 0.001 0.028 2 0.001 0 2Magnesium 0.035 0.007 2 0.04 0.017 3 0 0.014 2 0.005 0 2Potassium 0.04 0 2 0.03 0.01 3 0.015 0 2 0.01 0 2Sodium 0.055 0.007 2 0.073 0.021 3 0.02 0.021 2 0.02 0 2Bicarbonates 0.215 0.021 2 0.233 0.112 3 0.13 0.014 2 0.13 0 2Sodium Adsorption Rate (S.A.R.)
0.235 0.007 2 0.303 0.015 3 0.42 0.078 2 0.335 0.021 2
Dissolved oxygen (D.O. µS.cm-1)** 5.043 0.251 2 3.955 0.24 2 5.26 0.368 2 5.418 0.032 2
Temperature (°C)** 25.725 0.389 2 26.1 0 2 25.425 0.247 2 24.425 0.177 2
Amacayacu NNP area Mata-matá Purité MAQ1 MAQ2 PUQ1 PUQ2 Average SD n Average SD n Average SD n Average SD npH 5.877 0.129 3 5.693 0.051 3 5.027 0.231 3 5.077 0.136 3Electric conductivity (E.C., dS/cm)
15.333 1.436 3 13.467 0.058 3 6.113 2.792 3 5.343 1.236 3
Calcium 0.047 0.006 3 0.03 0 3 0.033 0.032 3 0.033 0.021 3Magnesium 0.02 0 3 0.027 0.006 3 0.013 0.006 3 0.007 0.005 3Potassium 0.023 0.01 3 0.02 0 3 0.004 0.001 3 0.005 0.004 3Sodium 0.057 0.006 3 0.053 0.006 3 0.01 0.001 3 0.009 0.001 3Bicarbonates 0.07 0 3 0.053 0.006 3 0.05 0.035 3 0.053 0.006 3Sodium Adsorption Rate (S.A.R.)
0.313 0.05 3 0.32 0.052 3 0.07 0.017 3 0.07 0.026 3
Dissolved oxygen (D.O. µS.cm-1)** 3.998 0.384 2 3.742 0.012 2 4.393 0.118 2 3.657 1.655 2
Temperature (°C)** 24.725 0.247 2 24.875 0.318 2 24.575 0.106 2 24.525 0.106 2
Arbeláez, F., Duivenvoorden, J.F. and J.A.Maldonado-Ocampo. 2006. Spatial variation of fish communities among terra firme forest streams of the Colombian Amazonia
33
Methods: Soils Granulometry: Bouyoucos pH Interchangeable acidity (I.A., meq/100g): with KCl; % A.I. saturation (A.I.S.) % Organic carbon (O.C.): Walkley - Black; Cationic Interchange Capacity (C.I.C.) and bases: Ammonium acetate 1 normal and neutral meq Calcium/100g x 200 = ppm. meq Magnesium/100g x 120 = ppm. meq Potassium/100g x 391 = ppm meq Sodium/100g x 230 = ppm Percentage (%) = ppm / 10.000 Phosphorous (ppm) : Bray II; Methods: waters pH: Potentiometric Electric conductivity (E.C., dS/cm) Sodium Adsorption Rate (S.A.R.) Calcium, Magnesium (meq/L): Atomic absorption Potassium, Sodium: atomic emission Anion content (meq/L) Sulphates: turbidimetric Chlorides, Carbonates, Bicarbonates: Potentiometric titulation Dissolved oxygen (D.O. µS.cm-1): field measurements Temperature (°C): field measurements