13 - Research Data Management - Universitas...
37
Data Management: Collec/ng, Presen/ng and Analyzing Research Data By: Ania) Murni & Zainal A. Hasibuan ania/(zhasibua)@cs.ui.ac.id Faculty of Computer Science University of Indonesia 2008
Transcript of 13 - Research Data Management - Universitas...
Data Management: Collec/ng, Presen/ng and Analyzing Research
Data
By: Ania) Murni & Zainal A. Hasibuan ania/(zhasibua)@cs.ui.ac.id
Faculty of Computer Science University of Indonesia
2008

Mo/va/on
• Can research without data? • How can you resolve the problem without suppor/ng data?
• How do you convince other, that your data are sufficient to support the solu/on?
• Where do you go to find data? • Can you have imaginary data in research? • Can you have data simula/on for research?

Session Objec/ves
• To understand source of data and type of data • To understand how to collect and present data • To understand how to analyze and interpret data
Source of Data
• Quan/ta/ve data are values on a numerical scale
• Qualita/ve data are observa/on measured on a numerical scale
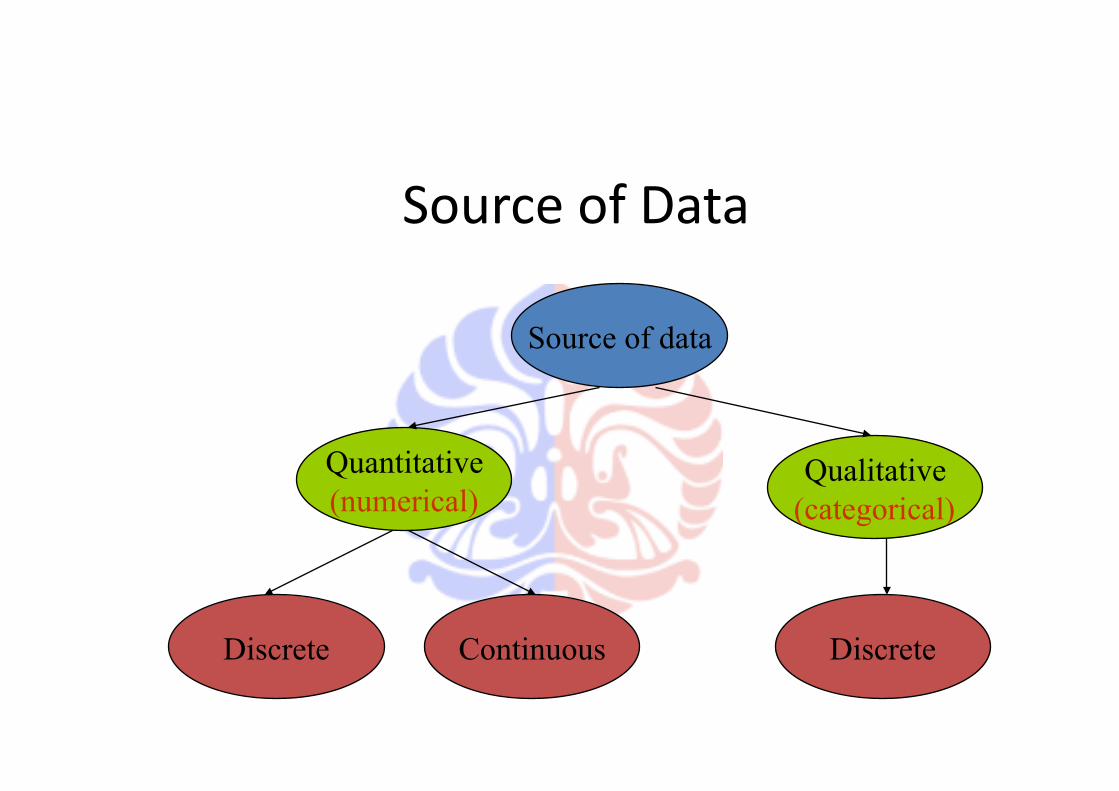
Source of Data
Source of data
Continuous Discrete
Qualitative (categorical)
Quantitative (numerical)
Discrete
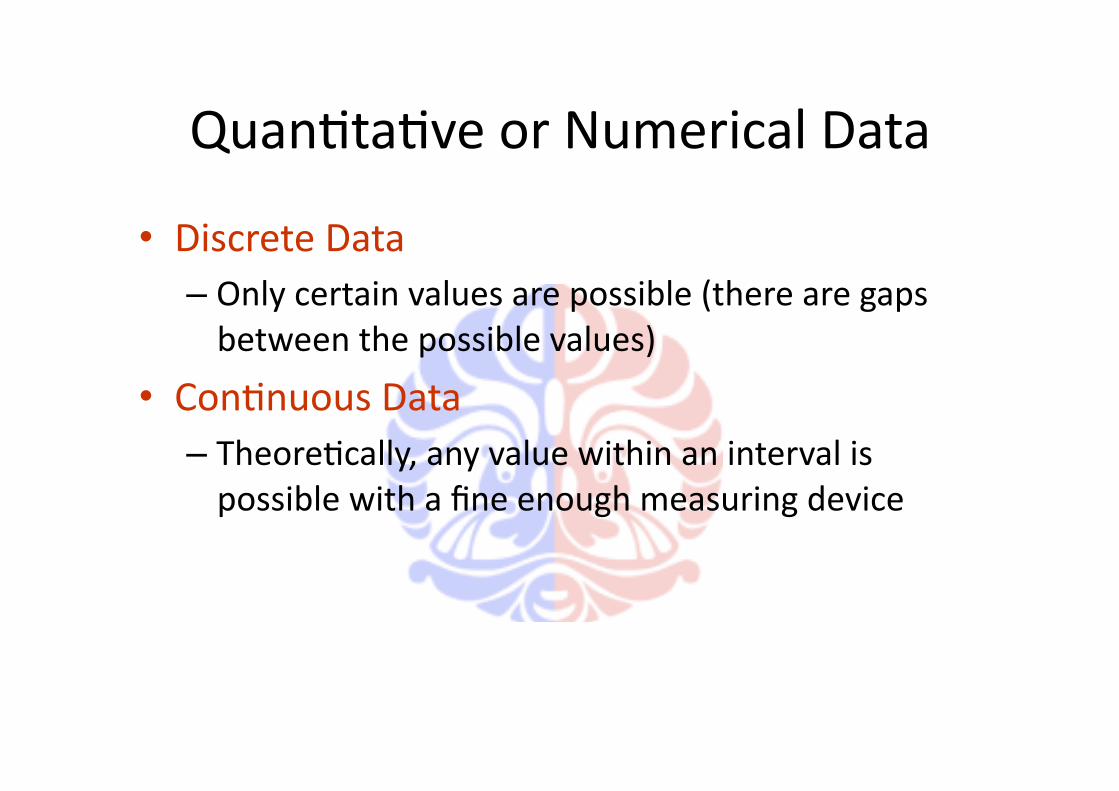
Quan/ta/ve or Numerical Data
• Discrete Data – Only certain values are possible (there are gaps between the possible values)
• Con/nuous Data – Theore/cally, any value within an interval is possible with a fine enough measuring device

Types of Data
• Primary data: data observed and recorded or collected directly from respondents
• Secondary data: data complied both inside and outside the organiza/on for some purpose other than the current inves/ga/on

Types of Data
Secondary Data
Compilation
Observation
Experimentation
Print or Electronic
Survey
Primary Data Collection
Basic Business Statistics 10e, 2006 Prentice Hall
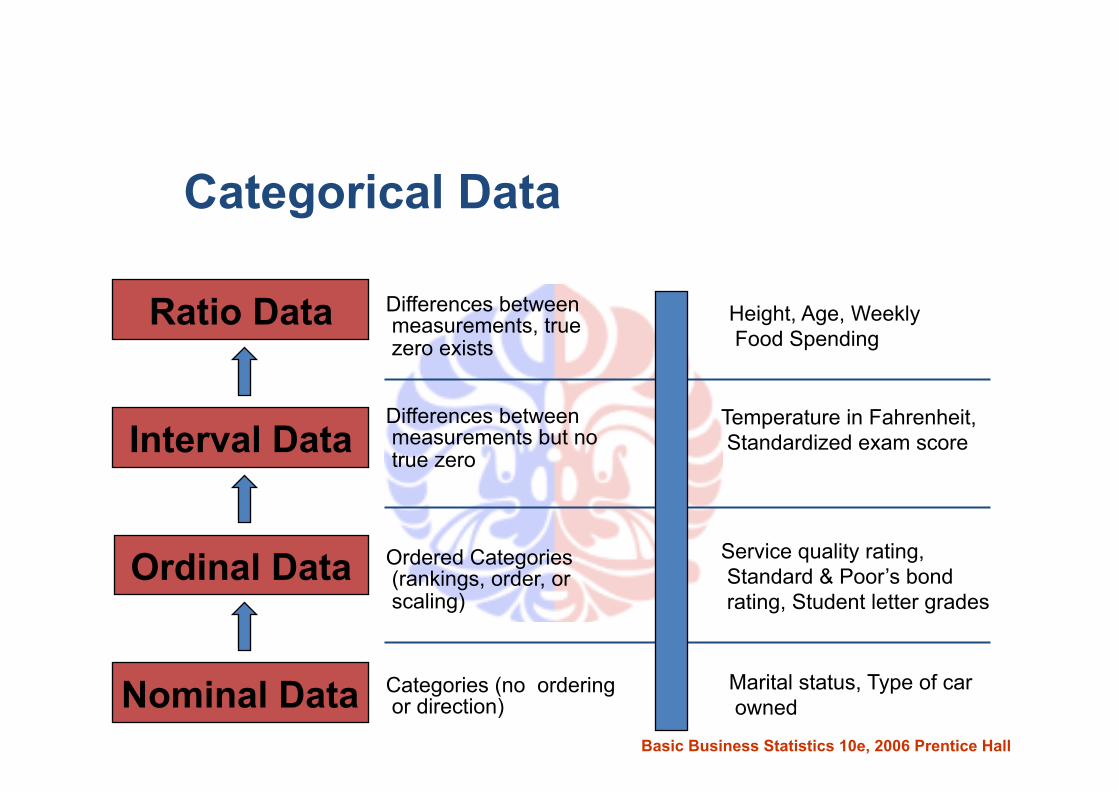
Categorical Data
Ratio Data
Interval Data
Ordinal Data
Nominal Data
Differences between measurements, true zero exists
Differences between measurements but no true zero
Ordered Categories (rankings, order, or scaling)
Categories (no ordering or direction)
Height, Age, Weekly Food Spending
Temperature in Fahrenheit, Standardized exam score
Service quality rating, Standard & Poor’s bond rating, Student letter grades
Marital status, Type of car owned
Basic Business Statistics 10e, 2006 Prentice Hall
Collec/ng Data

Collec/ng Quan/ta/ve Data
• Iden/fy your unit analysis – Who can supply the informa/on that you will use to answer your
quan/ta/ve research ques/ons or hypotheses?
• Specify the popula/on and sample • Informa/on to collect
– Specify variable from research ques/ons and hypotheses
– Opera/onally define each variable – Choose types of data and measures

Criteria For Choosing Instrument To Collect Quan/ta/ve Data
• Have authors develop the instrument recently, and can you obtain the most recent version?
• Is the instrument widely cited by other authors? • Are reviews available for the instrument? • Is there informa/on about the reliability and validity of scores
from past uses of the instrument? • Does the procedure for recording data fit the research
ques/ons/hypotheses in your study? • Does the instrument contain accepted scales of
measurement?

Collec/ng Qualita/ve Data
• What data/informa/on you want to collect? • How do collect the data/informa/on
– Observa/ons – Interviews and ques/onnaires – Documents – Audiovisual materials

Presen/ng Data
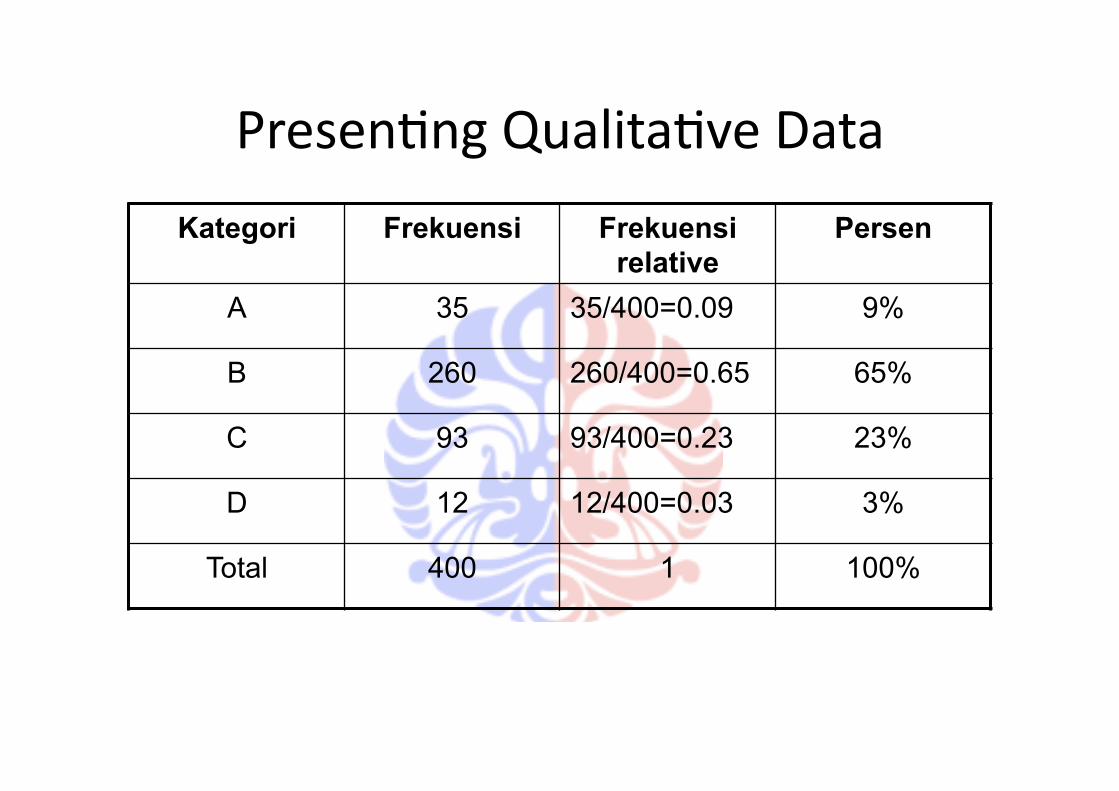
Presen/ng Qualita/ve Data
Kategori Frekuensi Frekuensi relative
Persen
A 35 35/400=0.09 9%
B 260 260/400=0.65 65%
C 93 93/400=0.23 23%
D 12 12/400=0.03 3%
Total 400 1 100%
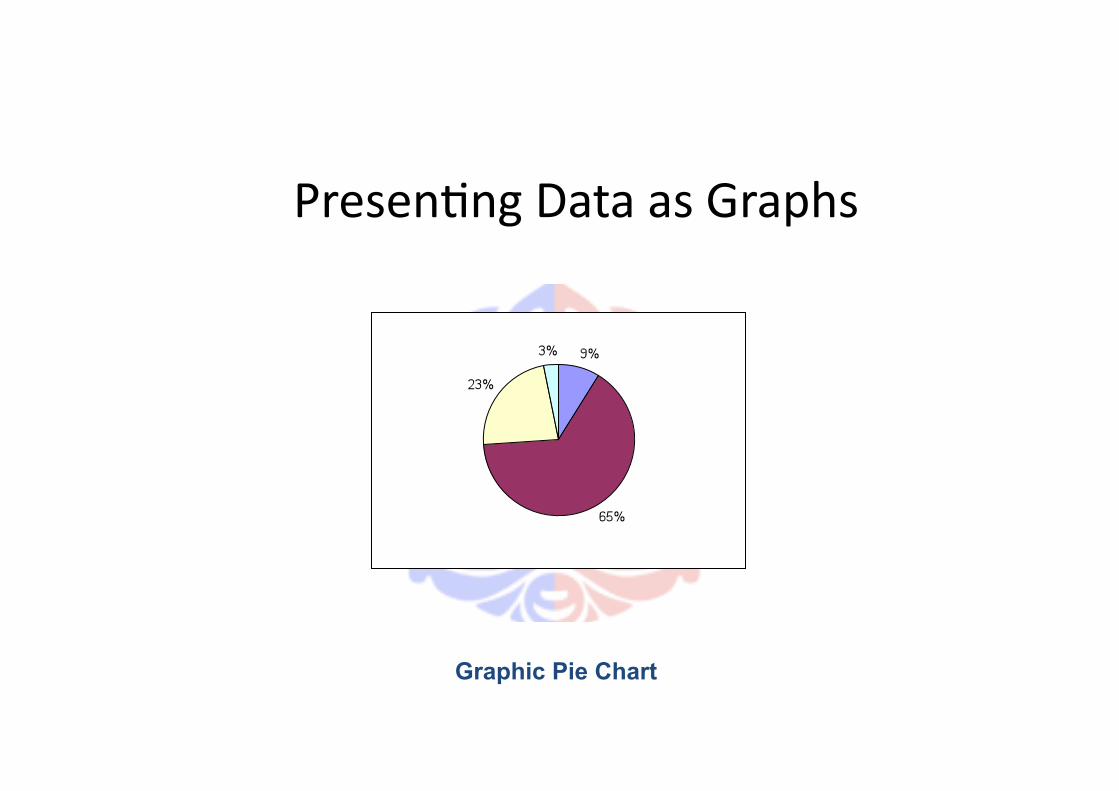
Presen/ng Data as Graphs
Graphic Pie Chart
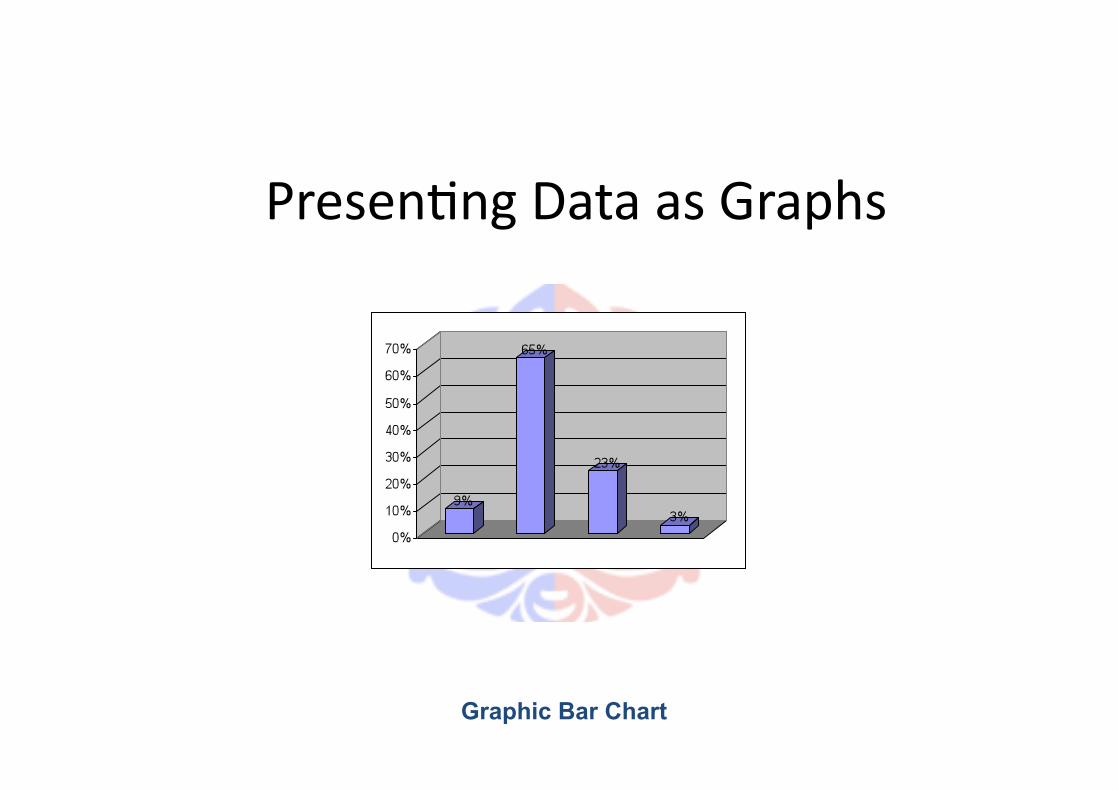
Presen/ng Data as Graphs
Graphic Bar Chart
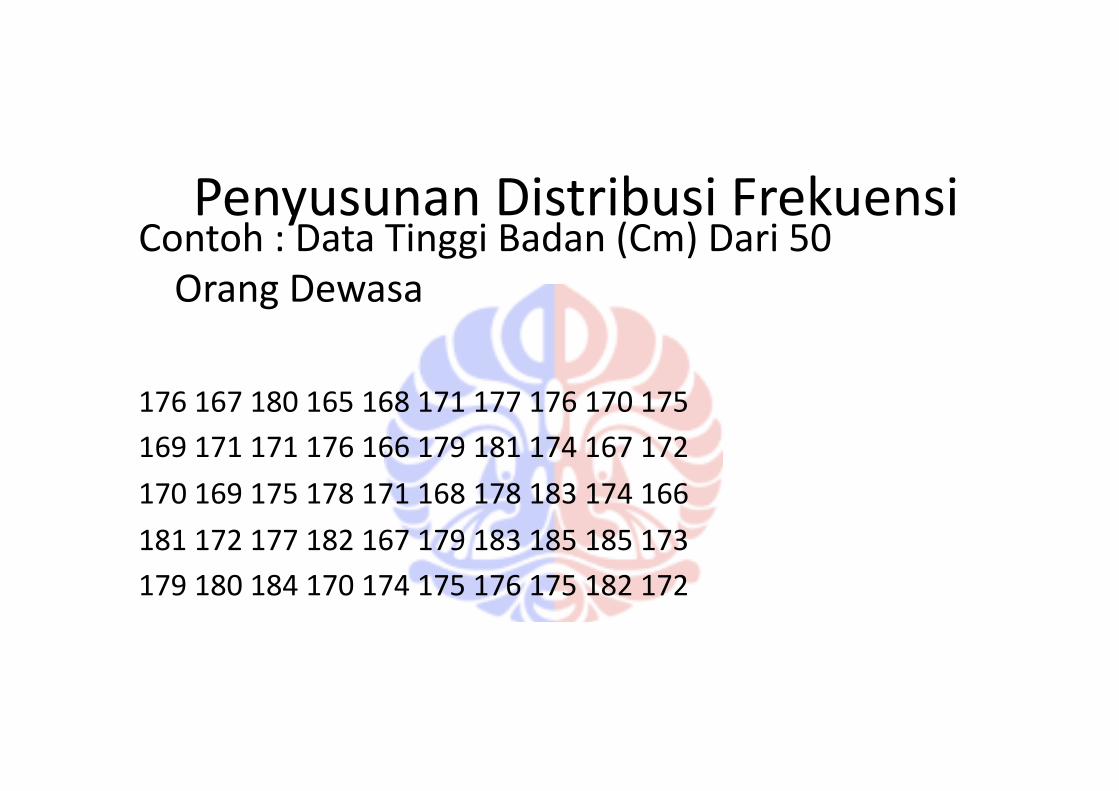
Penyusunan Distribusi Frekuensi Contoh : Data Tinggi Badan (Cm) Dari 50 Orang Dewasa
176 167 180 165 168 171 177 176 170 175 169 171 171 176 166 179 181 174 167 172
170 169 175 178 171 168 178 183 174 166
181 172 177 182 167 179 183 185 185 173 179 180 184 170 174 175 176 175 182 172
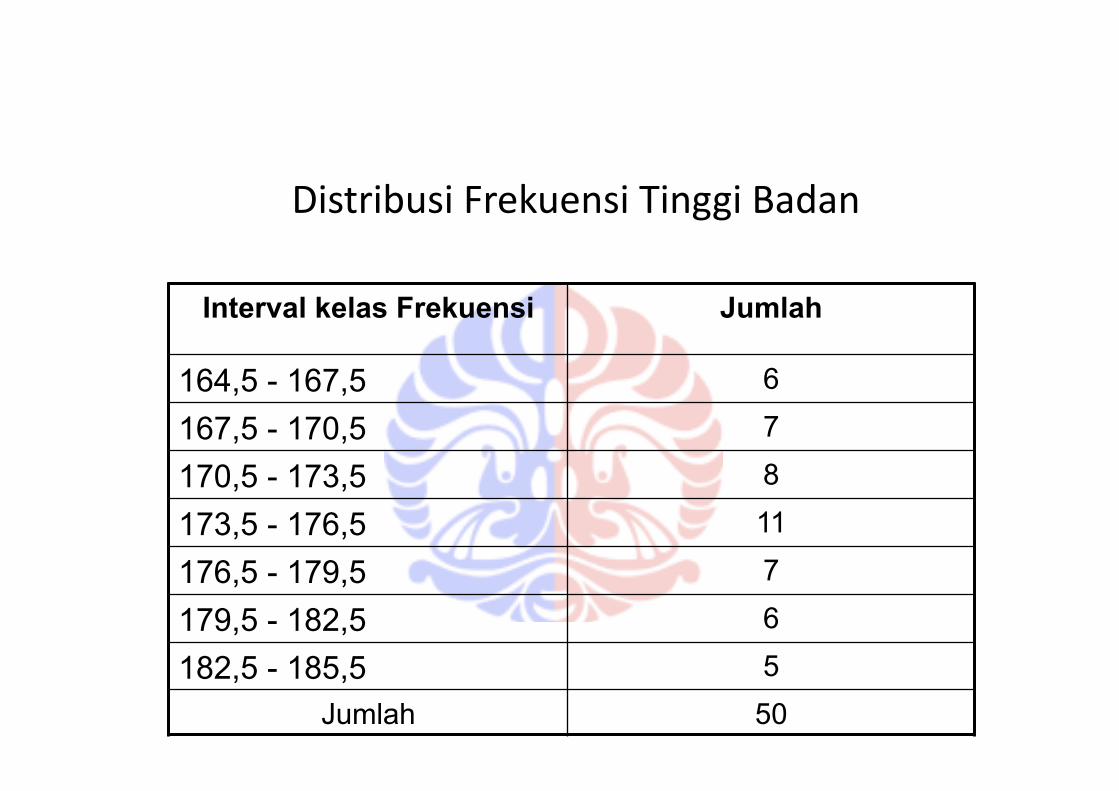
Distribusi Frekuensi Tinggi Badan
Interval kelas Frekuensi Jumlah
164,5 - 167,5 6
167,5 - 170,5 7
170,5 - 173,5 8
173,5 - 176,5 11
176,5 - 179,5 7
179,5 - 182,5 6
182,5 - 185,5 5 Jumlah 50
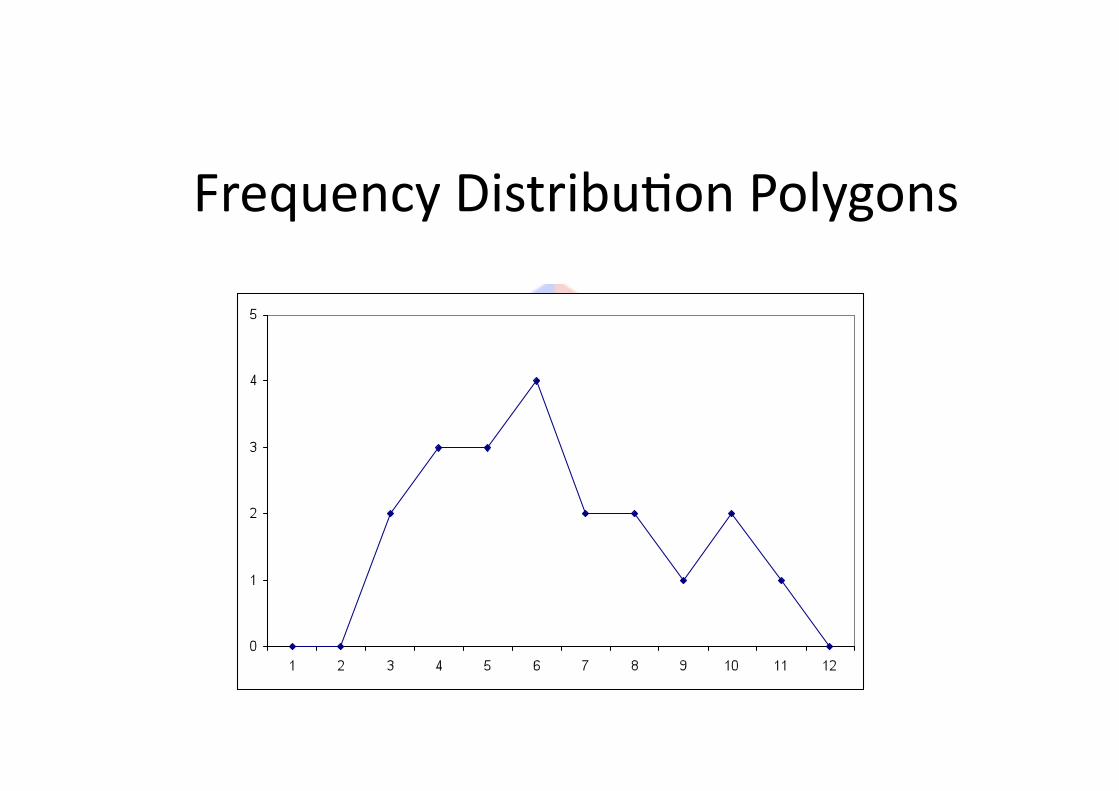
Frequency Distribu/on Polygons
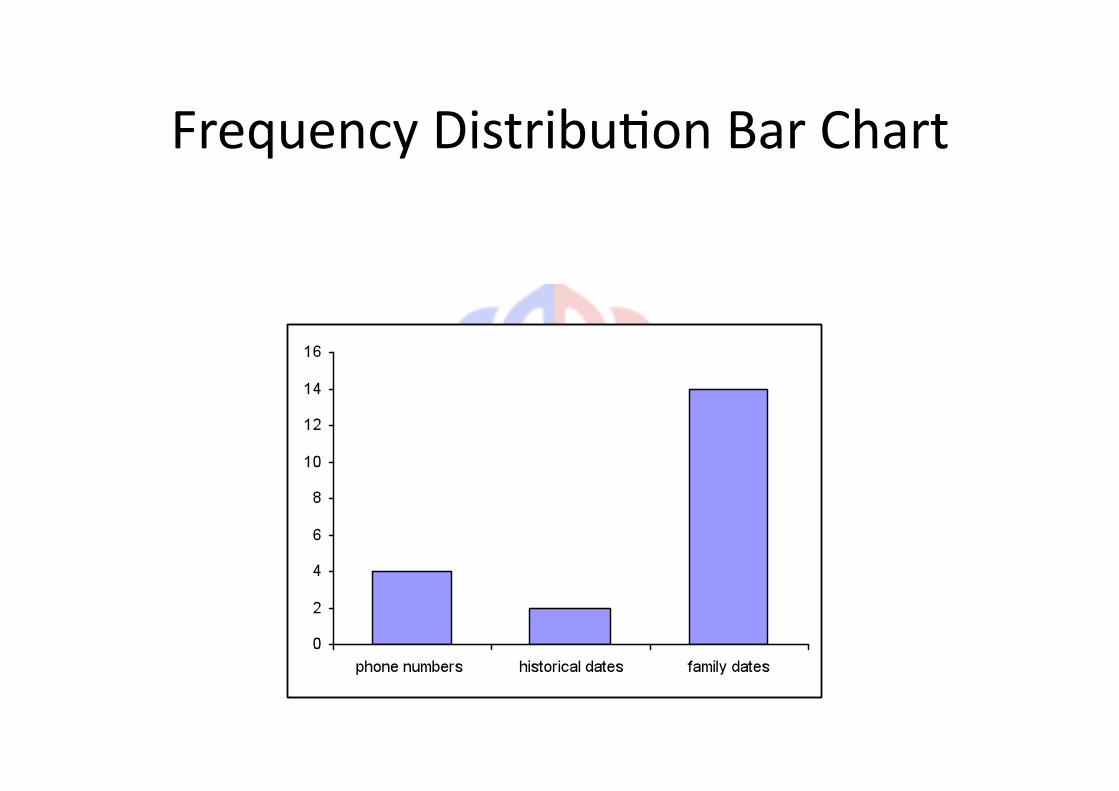
Frequency Distribu/on Bar Chart
Measures of Loca/on • Mean • Median
• Mode

Mean • Another name for average.
• If describing a popula/on, denoted as µ, the greek leber “mu”.
• If describing a sample, denoted as , called “x‐bar”.
• Appropriate for describing measurement data. • Seriously affected by unusual values called “outliers”.
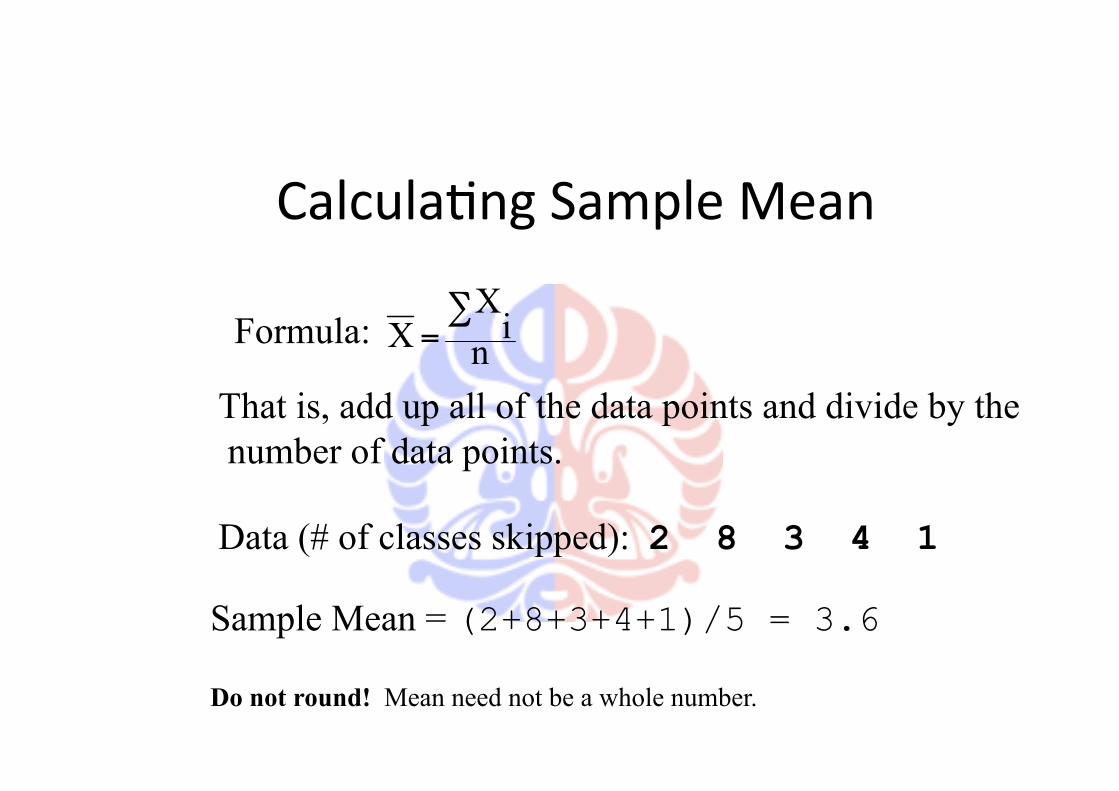
Calcula/ng Sample Mean
Formula:
That is, add up all of the data points and divide by the number of data points.
Data (# of classes skipped): 2 8 3 4 1
Sample Mean = (2+8+3+4+1)/5 = 3.6
Do not round! Mean need not be a whole number.

Median • Another name for 50th percen/le. • Appropriate for describing measurement data.
• “Robust to outliers,” that is, not affected much by unusual values.

Calcula/ng Sample Median
Order data from smallest to largest. If odd number of data points, the median is the middle value.
Data (# of classes skipped): 2 8 3 4 1
Ordered Data: 1 2 3 4 8
Median
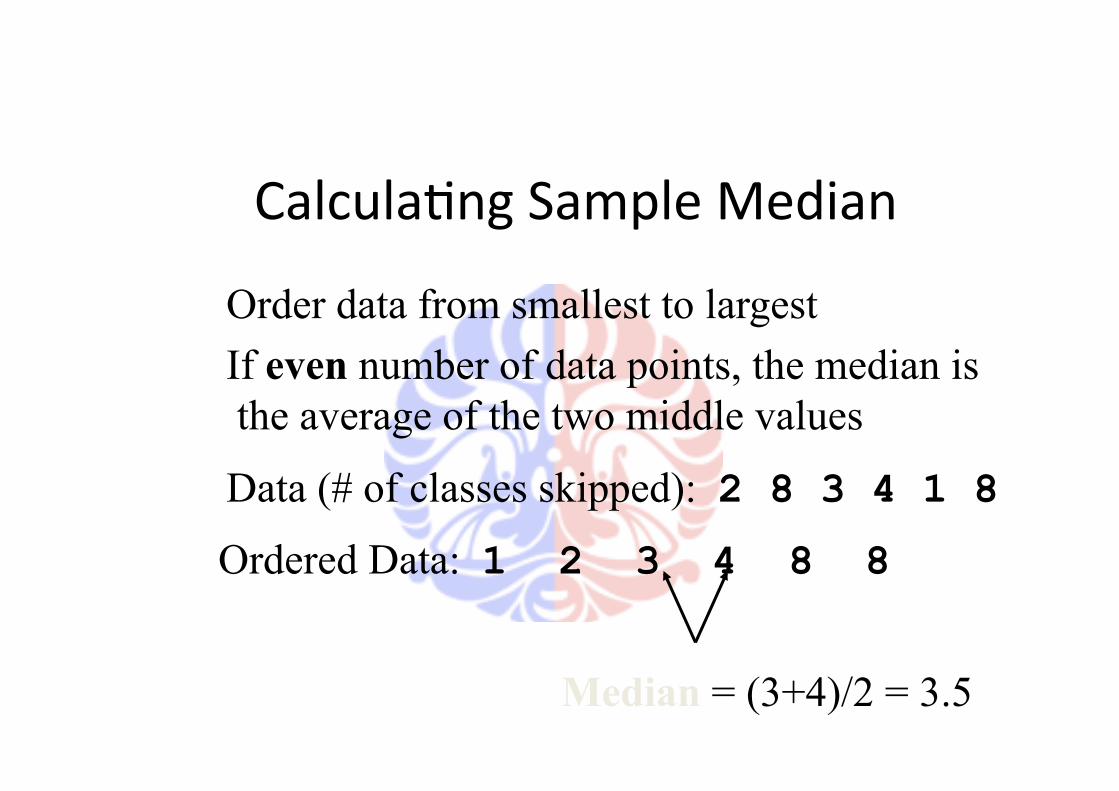
Calcula/ng Sample Median
Order data from smallest to largest If even number of data points, the median is the average of the two middle values
Data (# of classes skipped): 2 8 3 4 1 8
Ordered Data: 1 2 3 4 8 8
Median = (3+4)/2 = 3.5

Mode
• Mode is the most common number • Put the numbers in order
• Choose the number that appears the most frequently.
• Some/mes there may be more than one mode.
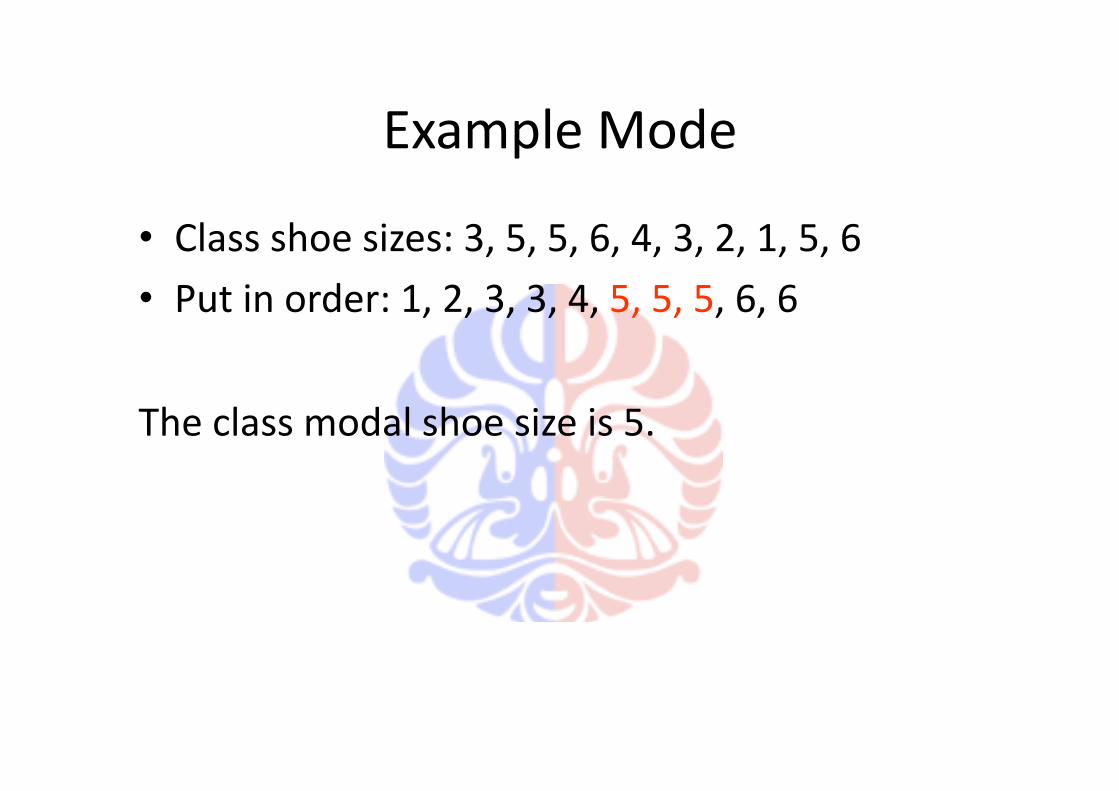
Example Mode
• Class shoe sizes: 3, 5, 5, 6, 4, 3, 2, 1, 5, 6 • Put in order: 1, 2, 3, 3, 4, 5, 5, 5, 6, 6
The class modal shoe size is 5.
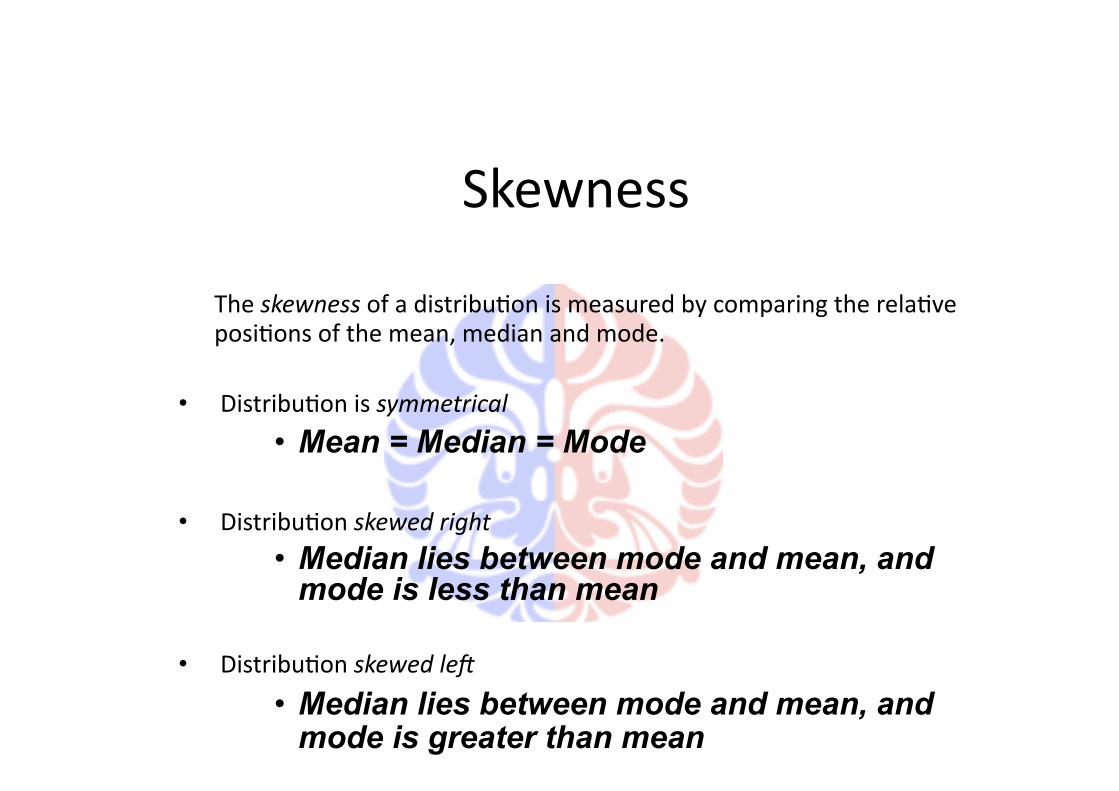
Skewness
The skewness of a distribu/on is measured by comparing the rela/ve posi/ons of the mean, median and mode.
• Distribu/on is symmetrical
• Mean = Median = Mode
• Distribu/on skewed right
• Median lies between mode and mean, and mode is less than mean
• Distribu/on skewed le2
• Median lies between mode and mean, and mode is greater than mean

Negatively Skewed
Positively Skewed
Symmetric (Not Skewed)
S < 0 S = 0 S > 0
Graphical Display Of Numerical Variables (Box Plot)

Analyzing Data
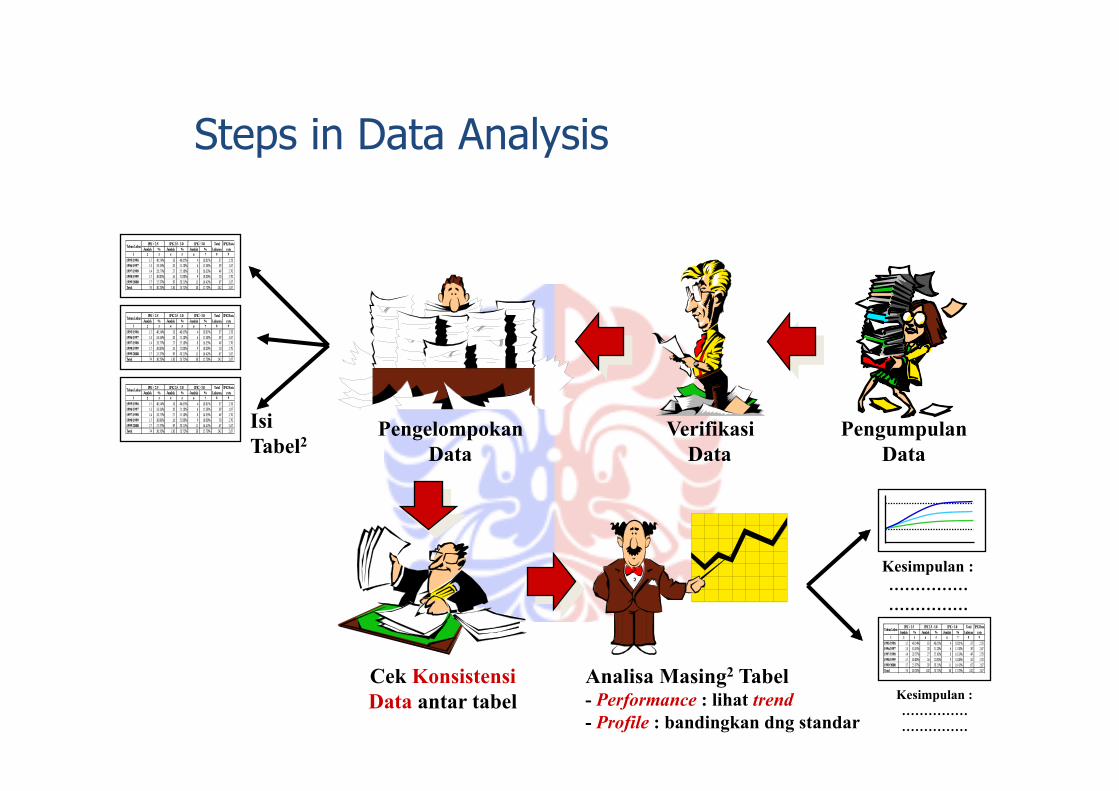
Steps in Data Analysis
Pengumpulan Data
Verifikasi Data
Pengelompokan Data
Isi Tabel2
Cek Konsistensi Data antar tabel
Analisa Masing2 Tabel - Performance : lihat trend - Profile : bandingkan dng standar
Kesimpulan : …………… ……………
Kesimpulan : …………… ……………

Analyze Quan/ta/ve Data
• Describe trends in the data to a single variable or ques/on on your instrument. – e.g., What is the self esteem of middle school students? – We need Descrip/ve Sta/s/cs that indicate general tendencies in the
data (mean, median, mode), the spread of scores (variance, standard devia/on, and rang), or a comparison of how one score relates to all others (z‐scores, percen/le rank). We might seek to describe any of our variables: independent, dependent, control or media/ng.
Analyze Quan/ta/ve Data
• Compare two or more groups on the independent variable in terms of the dependent variable. – e.g., How do boys and girls compare in their self esteem? – We need inferen/al sta/s/cs in which we analyze data from a sample
to draw conclusions about an unknown popula/on.
– We assess whether the differences of groups (their means) or the rela/onships among variables is much greater or less than what we would expect for the total popula/on, if we could study the en/re popula/on.

Analyze Quan/ta/ve Data
• Relate two or more variable. – e.g., Does self esteem relate to an op/mis/c ajtude?
– To answer the ques/on, we need inferen/al sta/s/cs. • Test hypotheses about the differences in the groups or the
rela/onships of variables. – e.g., Boys have higher self esteem than girls or self esteem predicts an
op/mis/c ajtude among middle school children.
– To answer the ques/on, we need inferen/al sta/s/cs.

Start Wri/ng Your Research Proposal and Good Luck