13 June 2014 Annual Report Update | Sector: Consumer...
14
Gautam Duggad ([email protected]); +91 22 3982 5404 Manish Poddar ([email protected]); +91 22 3027 8029 13 June 2014 Annual Report Update | Sector: Consumer Hindustan Unilever CMP: INR634 TP: INR600 Sell Soft volume growth, cautious outlook Improved profitability and return ratios Key takeaways from HUVR’s FY14 annual report are: Volume growth remains soft; discretionary categories impacted more. Personal Products growth at a decade low. Product portfolio innovation and distribution expansion were the key focus areas. Expensive valuation (31.6x FY16E and 28.4x FY17E EPS) coupled with subdued demand environment underscores our Sell rating. Domestic volume growth at multi-year low; broad-based slowdown HUVR’s sales growth moderated to 8.6% in FY14 (INR280b), with continued slowdown across categories, channels and geographies. Volume growth of 4% was the lowest since FY09. Soaps & Detergent and Personal Products segments posted sales growth of 7.7% and 8.7% respectively, while Beverages registered double digit revenue growth. Soaps and Detergents contributed 45% of incremental value growth, while PP contributed 30%. Gross and EBITDA margins expand 110bp and 50bp respectively Gross margin expanded 110bp at 48.8% in FY14 led by price hikes, cost containment and curtailment of promotions, in our view. EBITDA margin expanded by 50bp as better gross margin was offset by higher ad spends (up 40bp). Soaps and Detergents EBIT margin expanded 40bp YoY despite increased competitive activity due to robust cost saving programmes and judicious pricing initiatives. PP EBIT margin contracted 60bp YoY primarily driven by a slowdown in discretionary consumption and increased competitive intensity. Recurring PAT grew 14.1% to INR36.4b. Balance sheet: working capital cycle improves, RoE expands HUL’s working capital improved marginally by five days led by higher payables and lower receivables. RoE also improved from 103% to 122% YoY led by better asset turnover. Dividend payout ratio, excluding taxes, stood at 77.3%. Product innovation and distribution expansion: key focus area of FY14 During FY14, company added 1m stores to its existing network (total reach stands - 3m stores) with increased reach across urban and rural markets and also extended its “Perfect Stores” initiative to 1m stores. Innovation was a key focus with nearly 2/3rd of its product offerings being re-launched/re-staged. Valuation and view Volume growth in low single digit seems competitive, but it does not justify the premium valuations the stock commands, in our view. Continued softening in PP margins has long term profitability implications, in our view. Going forward, recovery in F&L holds the key for margins. Valuation (31.6x FY16E and 28.4x FY17E) still remains expensive. Maintain Sell with a target price of INR600 (30x FY16E EPS). BSE Sensex S&P CNX 25,228 7,542 Stock Info Bloomberg HUVR IN Equity Shares (m) 2,163.1 52-Week Range (INR) 725/536 1, 6, 12 Rel. Per (%) 4/-9/-27 M.Cap. (INR b) 1,371.5 M.Cap. (USD b) 23.0 Financial Snapshot (INR Billion) Y/E March 2015E 2016E 2017E Net Sales 307.6 347.1 399.0 EBITDA 51.2 58.4 66.9 Adj PAT 39.1 43.4 48.2 EPS (INR) 18.1 20.1 22.3 Growth (%) 7.5 10.9 11.2 BV/Sh. (INR) 16.9 18.2 19.4 RoE (%) 113.0 114.5 118.5 RoCE (%) 146.8 153.3 163.7 P/E (x) 35.0 31.6 28.4 P/BV (x) 37.6 34.8 32.6 Shareholding pattern (%) As on Mar-14 Dec-13 Mar-13 Promoter 67.3 67.3 52.5 Dom. Inst 4.1 3.4 8.1 Foreign 14.4 15.2 22.5 Others 14.2 14.2 17.0 Stock Performance (1-year) Investors are advised to refer through disclosures made at the end of the Research Report.
Transcript of 13 June 2014 Annual Report Update | Sector: Consumer...
Gautam Duggad ([email protected]); +91 22 3982 5404
Manish Poddar ([email protected]); +91 22 3027 8029
13 June 2014
Annual Report Update | Sector: Consumer
Hindustan Unilever CMP: INR634 TP: INR600 Sell
Soft volume growth, cautious outlook Improved profitability and return ratios
Key takeaways from HUVR’s FY14 annual report are: Volume growth remains soft; discretionary categories impacted more. Personal Products growth at a decade low. Product portfolio innovation and distribution expansion were the key focus areas. Expensive valuation (31.6x FY16E and 28.4x FY17E EPS) coupled with subdued
demand environment underscores our Sell rating.
Domestic volume growth at multi-year low; broad-based slowdown HUVR’s sales growth moderated to 8.6% in FY14 (INR280b), with continued slowdown across categories, channels and geographies. Volume growth of 4% was the lowest since FY09. Soaps & Detergent and Personal Products segments posted sales growth of 7.7% and 8.7% respectively, while Beverages registered double digit revenue growth. Soaps and Detergents contributed 45% of incremental value growth, while PP contributed 30%.
Gross and EBITDA margins expand 110bp and 50bp respectively Gross margin expanded 110bp at 48.8% in FY14 led by price hikes, cost containment and curtailment of promotions, in our view. EBITDA margin expanded by 50bp as better gross margin was offset by higher ad spends (up 40bp). Soaps and Detergents EBIT margin expanded 40bp YoY despite increased competitive activity due to robust cost saving programmes and judicious pricing initiatives. PP EBIT margin contracted 60bp YoY primarily driven by a slowdown in discretionary consumption and increased competitive intensity. Recurring PAT grew 14.1% to INR36.4b.
Balance sheet: working capital cycle improves, RoE expands HUL’s working capital improved marginally by five days led by higher payables and lower receivables. RoE also improved from 103% to 122% YoY led by better asset turnover. Dividend payout ratio, excluding taxes, stood at 77.3%.
Product innovation and distribution expansion: key focus area of FY14 During FY14, company added 1m stores to its existing network (total reach stands - 3m stores) with increased reach across urban and rural markets and also extended its “Perfect Stores” initiative to 1m stores. Innovation was a key focus with nearly 2/3rd of its product offerings being re-launched/re-staged.
Valuation and view Volume growth in low single digit seems competitive, but it does not justify the premium valuations the stock commands, in our view. Continued softening in PP margins has long term profitability implications, in our view. Going forward, recovery in F&L holds the key for margins. Valuation (31.6x FY16E and 28.4x FY17E) still remains expensive. Maintain Sell with a target price of INR600 (30x FY16E EPS).
BSE Sensex S&P CNX 25,228 7,542
Stock Info Bloomberg HUVR IN
Equity Shares (m) 2,163.1
52-Week Range (INR) 725/536
1, 6, 12 Rel. Per (%) 4/-9/-27
M.Cap. (INR b) 1,371.5
M.Cap. (USD b) 23.0
Financial Snapshot (INR Billion) Y/E March 2015E 2016E 2017E Net Sales 307.6 347.1 399.0
EBITDA 51.2 58.4 66.9
Adj PAT 39.1 43.4 48.2
EPS (INR) 18.1 20.1 22.3
Growth (%) 7.5 10.9 11.2
BV/Sh. (INR) 16.9 18.2 19.4
RoE (%) 113.0 114.5 118.5
RoCE (%) 146.8 153.3 163.7
P/E (x) 35.0 31.6 28.4
P/BV (x) 37.6 34.8 32.6
Shareholding pattern (%)
As on Mar-14 Dec-13 Mar-13
Promoter 67.3 67.3 52.5
Dom. Inst 4.1 3.4 8.1
Foreign 14.4 15.2 22.5 Others 14.2 14.2 17.0
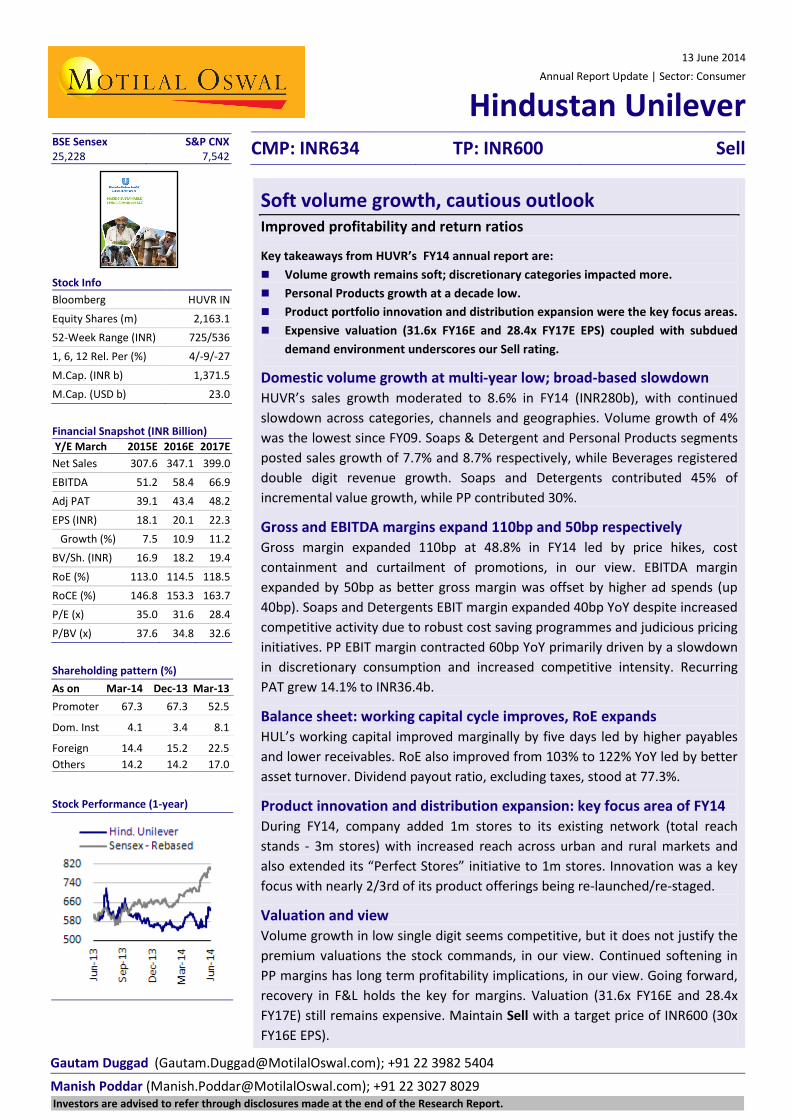
Stock Performance (1-year)
Investors are advised to refer through disclosures made at the end of the Research Report.
Hindustan Unilever
13 June 2014 2
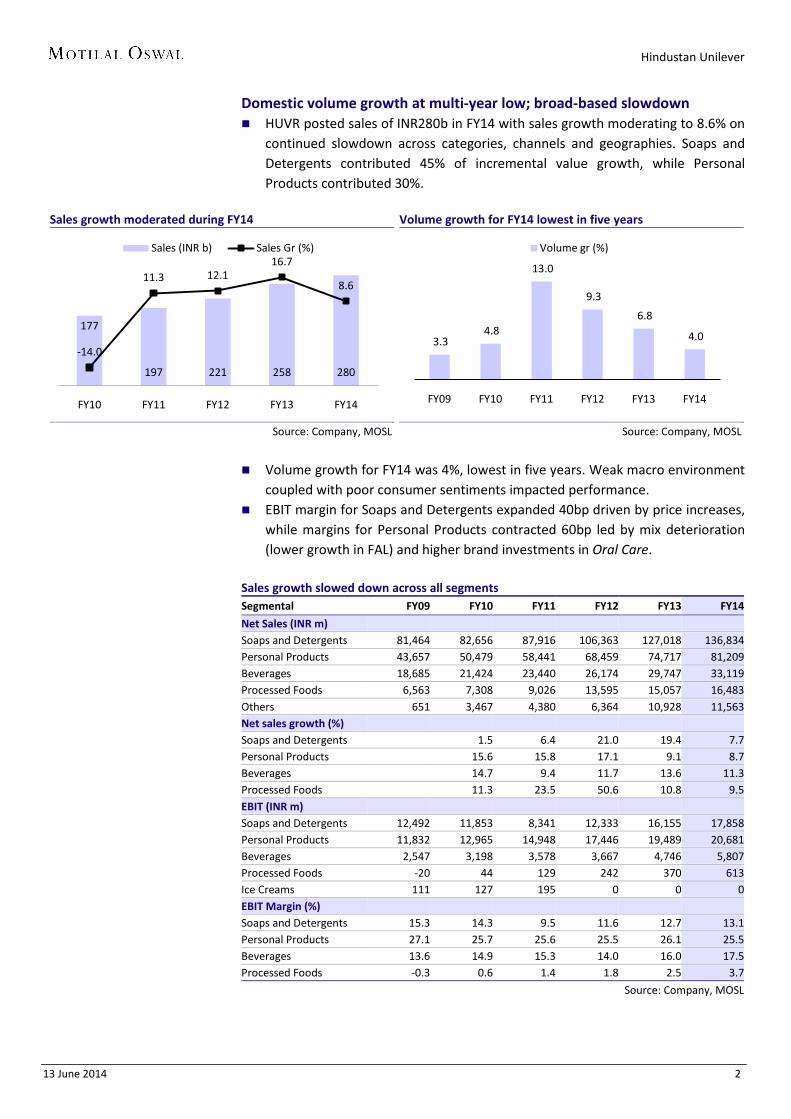
Domestic volume growth at multi-year low; broad-based slowdown HUVR posted sales of INR280b in FY14 with sales growth moderating to 8.6% on
continued slowdown across categories, channels and geographies. Soaps and Detergents contributed 45% of incremental value growth, while Personal Products contributed 30%.
Sales growth moderated during FY14
Source: Company, MOSL
Volume growth for FY14 lowest in five years
Source: Company, MOSL
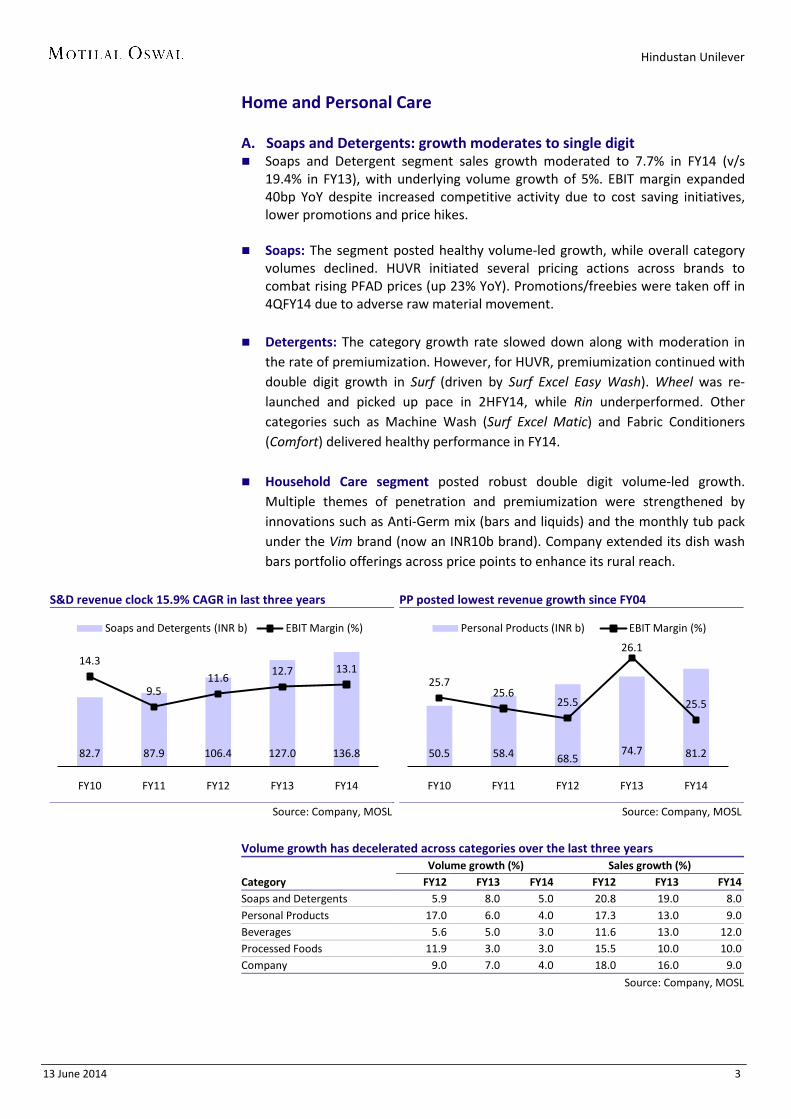
Volume growth for FY14 was 4%, lowest in five years. Weak macro environment
coupled with poor consumer sentiments impacted performance. EBIT margin for Soaps and Detergents expanded 40bp driven by price increases,
while margins for Personal Products contracted 60bp led by mix deterioration (lower growth in FAL) and higher brand investments in Oral Care.
Sales growth slowed down across all segments Segmental FY09 FY10 FY11 FY12 FY13 FY14
Net Sales (INR m) Soaps and Detergents 81,464 82,656 87,916 106,363 127,018 136,834 Personal Products 43,657 50,479 58,441 68,459 74,717 81,209 Beverages 18,685 21,424 23,440 26,174 29,747 33,119 Processed Foods 6,563 7,308 9,026 13,595 15,057 16,483 Others 651 3,467 4,380 6,364 10,928 11,563 Net sales growth (%) Soaps and Detergents 1.5 6.4 21.0 19.4 7.7 Personal Products 15.6 15.8 17.1 9.1 8.7 Beverages 14.7 9.4 11.7 13.6 11.3 Processed Foods 11.3 23.5 50.6 10.8 9.5 EBIT (INR m) Soaps and Detergents 12,492 11,853 8,341 12,333 16,155 17,858 Personal Products 11,832 12,965 14,948 17,446 19,489 20,681 Beverages 2,547 3,198 3,578 3,667 4,746 5,807 Processed Foods -20 44 129 242 370 613 Ice Creams 111 127 195 0 0 0 EBIT Margin (%) Soaps and Detergents 15.3 14.3 9.5 11.6 12.7 13.1 Personal Products 27.1 25.7 25.6 25.5 26.1 25.5 Beverages 13.6 14.9 15.3 14.0 16.0 17.5 Processed Foods -0.3 0.6 1.4 1.8 2.5 3.7
Source: Company, MOSL
177
197 221 258 280
-14.0
11.3 12.116.7
8.6
FY10 FY11 FY12 FY13 FY14
Sales (INR b) Sales Gr (%)
3.3 4.8
13.0
9.3
6.8
4.0
FY09 FY10 FY11 FY12 FY13 FY14
Volume gr (%)
Hindustan Unilever
13 June 2014 3
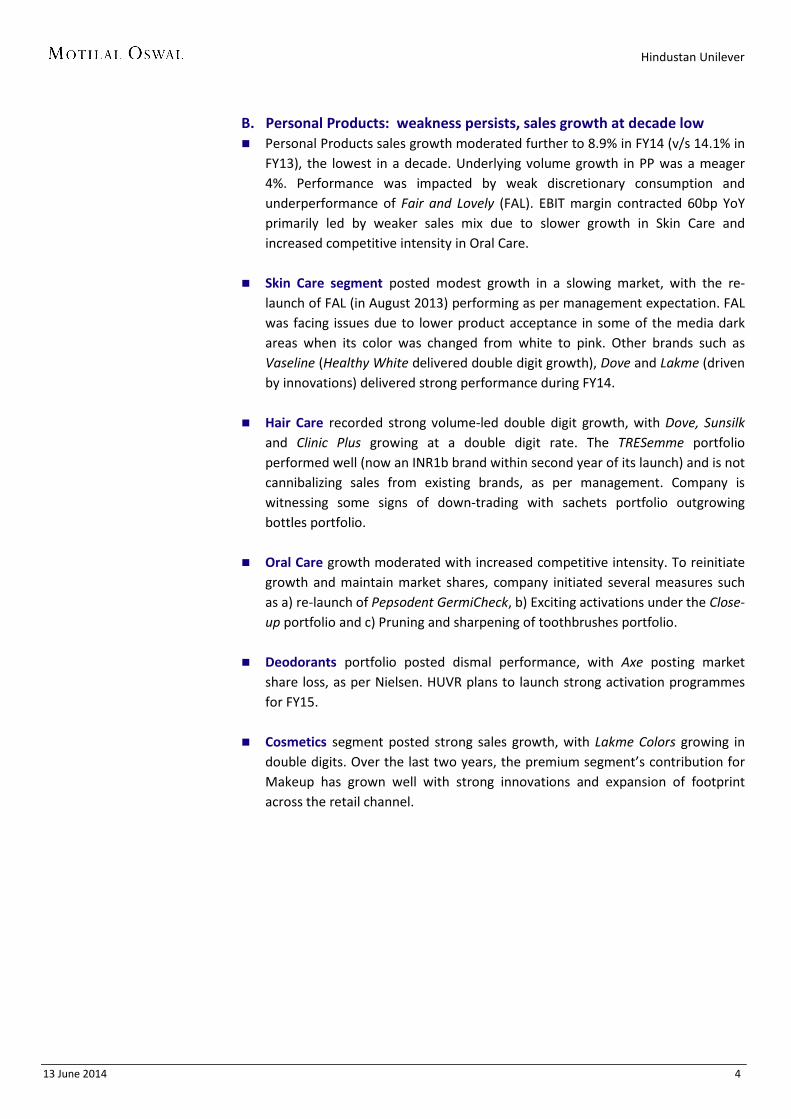
Home and Personal Care A. Soaps and Detergents: growth moderates to single digit Soaps and Detergent segment sales growth moderated to 7.7% in FY14 (v/s
19.4% in FY13), with underlying volume growth of 5%. EBIT margin expanded 40bp YoY despite increased competitive activity due to cost saving initiatives, lower promotions and price hikes.
Soaps: The segment posted healthy volume-led growth, while overall category volumes declined. HUVR initiated several pricing actions across brands to combat rising PFAD prices (up 23% YoY). Promotions/freebies were taken off in 4QFY14 due to adverse raw material movement.
Detergents: The category growth rate slowed down along with moderation in
the rate of premiumization. However, for HUVR, premiumization continued with double digit growth in Surf (driven by Surf Excel Easy Wash). Wheel was re-launched and picked up pace in 2HFY14, while Rin underperformed. Other categories such as Machine Wash (Surf Excel Matic) and Fabric Conditioners (Comfort) delivered healthy performance in FY14.
Household Care segment posted robust double digit volume-led growth.
Multiple themes of penetration and premiumization were strengthened by innovations such as Anti-Germ mix (bars and liquids) and the monthly tub pack under the Vim brand (now an INR10b brand). Company extended its dish wash bars portfolio offerings across price points to enhance its rural reach.
S&D revenue clock 15.9% CAGR in last three years
Source: Company, MOSL
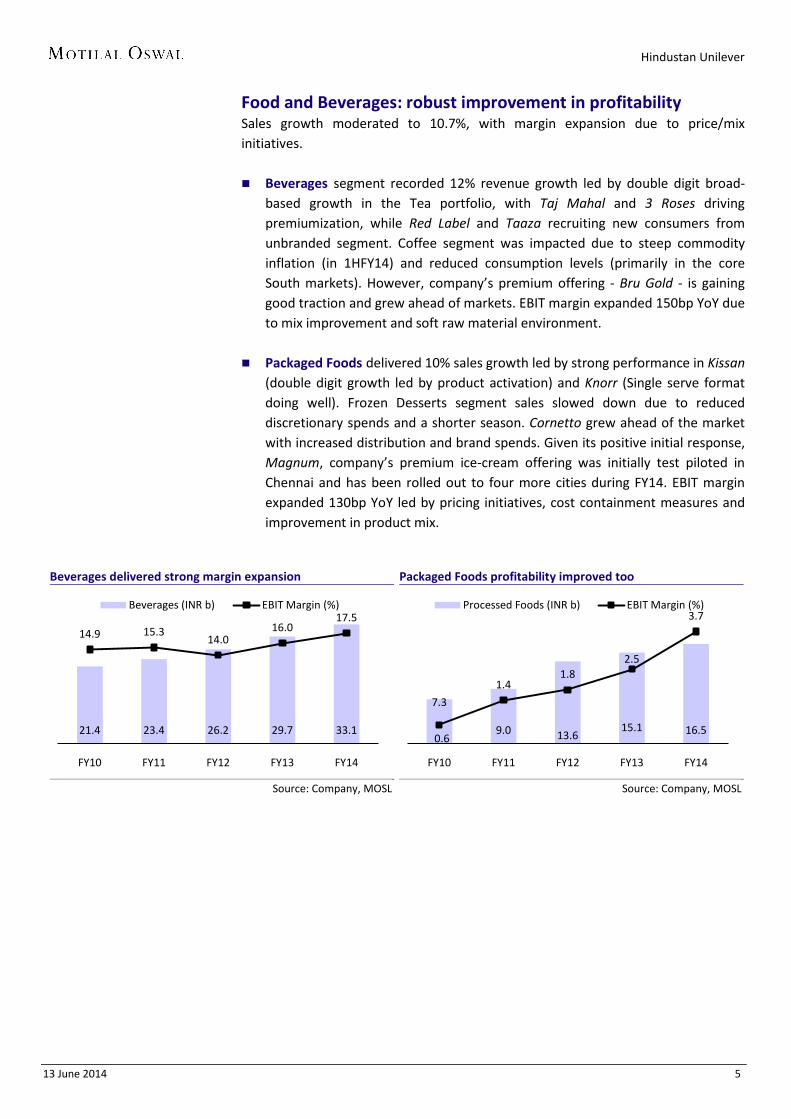
PP posted lowest revenue growth since FY04
Source: Company, MOSL
Volume growth has decelerated across categories over the last three years
Volume growth (%) Sales growth (%)
Category FY12 FY13 FY14 FY12 FY13 FY14 Soaps and Detergents 5.9 8.0 5.0 20.8 19.0 8.0 Personal Products 17.0 6.0 4.0 17.3 13.0 9.0 Beverages 5.6 5.0 3.0 11.6 13.0 12.0 Processed Foods 11.9 3.0 3.0 15.5 10.0 10.0 Company 9.0 7.0 4.0 18.0 16.0 9.0
Source: Company, MOSL
82.7 87.9 106.4 127.0 136.8
14.3
9.511.6
12.7 13.1
FY10 FY11 FY12 FY13 FY14
Soaps and Detergents (INR b) EBIT Margin (%)
50.5 58.4 68.574.7 81.2
25.725.6
25.5
26.1
25.5
FY10 FY11 FY12 FY13 FY14
Personal Products (INR b) EBIT Margin (%)
Hindustan Unilever
13 June 2014 4
B. Personal Products: weakness persists, sales growth at decade low Personal Products sales growth moderated further to 8.9% in FY14 (v/s 14.1% in
FY13), the lowest in a decade. Underlying volume growth in PP was a meager 4%. Performance was impacted by weak discretionary consumption and underperformance of Fair and Lovely (FAL). EBIT margin contracted 60bp YoY primarily led by weaker sales mix due to slower growth in Skin Care and increased competitive intensity in Oral Care.
Skin Care segment posted modest growth in a slowing market, with the re-launch of FAL (in August 2013) performing as per management expectation. FAL was facing issues due to lower product acceptance in some of the media dark areas when its color was changed from white to pink. Other brands such as Vaseline (Healthy White delivered double digit growth), Dove and Lakme (driven by innovations) delivered strong performance during FY14.
Hair Care recorded strong volume-led double digit growth, with Dove, Sunsilk
and Clinic Plus growing at a double digit rate. The TRESemme portfolio performed well (now an INR1b brand within second year of its launch) and is not cannibalizing sales from existing brands, as per management. Company is witnessing some signs of down-trading with sachets portfolio outgrowing bottles portfolio.
Oral Care growth moderated with increased competitive intensity. To reinitiate
growth and maintain market shares, company initiated several measures such as a) re-launch of Pepsodent GermiCheck, b) Exciting activations under the Close-up portfolio and c) Pruning and sharpening of toothbrushes portfolio.
Deodorants portfolio posted dismal performance, with Axe posting market
share loss, as per Nielsen. HUVR plans to launch strong activation programmes for FY15.
Cosmetics segment posted strong sales growth, with Lakme Colors growing in
double digits. Over the last two years, the premium segment’s contribution for Makeup has grown well with strong innovations and expansion of footprint across the retail channel.
Hindustan Unilever
13 June 2014 5
Food and Beverages: robust improvement in profitability Sales growth moderated to 10.7%, with margin expansion due to price/mix initiatives. Beverages segment recorded 12% revenue growth led by double digit broad-
based growth in the Tea portfolio, with Taj Mahal and 3 Roses driving premiumization, while Red Label and Taaza recruiting new consumers from unbranded segment. Coffee segment was impacted due to steep commodity inflation (in 1HFY14) and reduced consumption levels (primarily in the core South markets). However, company’s premium offering - Bru Gold - is gaining good traction and grew ahead of markets. EBIT margin expanded 150bp YoY due to mix improvement and soft raw material environment.
Packaged Foods delivered 10% sales growth led by strong performance in Kissan (double digit growth led by product activation) and Knorr (Single serve format doing well). Frozen Desserts segment sales slowed down due to reduced discretionary spends and a shorter season. Cornetto grew ahead of the market with increased distribution and brand spends. Given its positive initial response, Magnum, company’s premium ice-cream offering was initially test piloted in Chennai and has been rolled out to four more cities during FY14. EBIT margin expanded 130bp YoY led by pricing initiatives, cost containment measures and improvement in product mix.
Beverages delivered strong margin expansion
Source: Company, MOSL
Packaged Foods profitability improved too
Source: Company, MOSL
21.4 23.4 26.2 29.7 33.1
14.9 15.314.0
16.017.5
FY10 FY11 FY12 FY13 FY14
Beverages (INR b) EBIT Margin (%)
7.3
9.0 13.615.1 16.5
0.6
1.41.8
2.5
3.7
FY10 FY11 FY12 FY13 FY14
Processed Foods (INR b) EBIT Margin (%)
Hindustan Unilever
13 June 2014 6
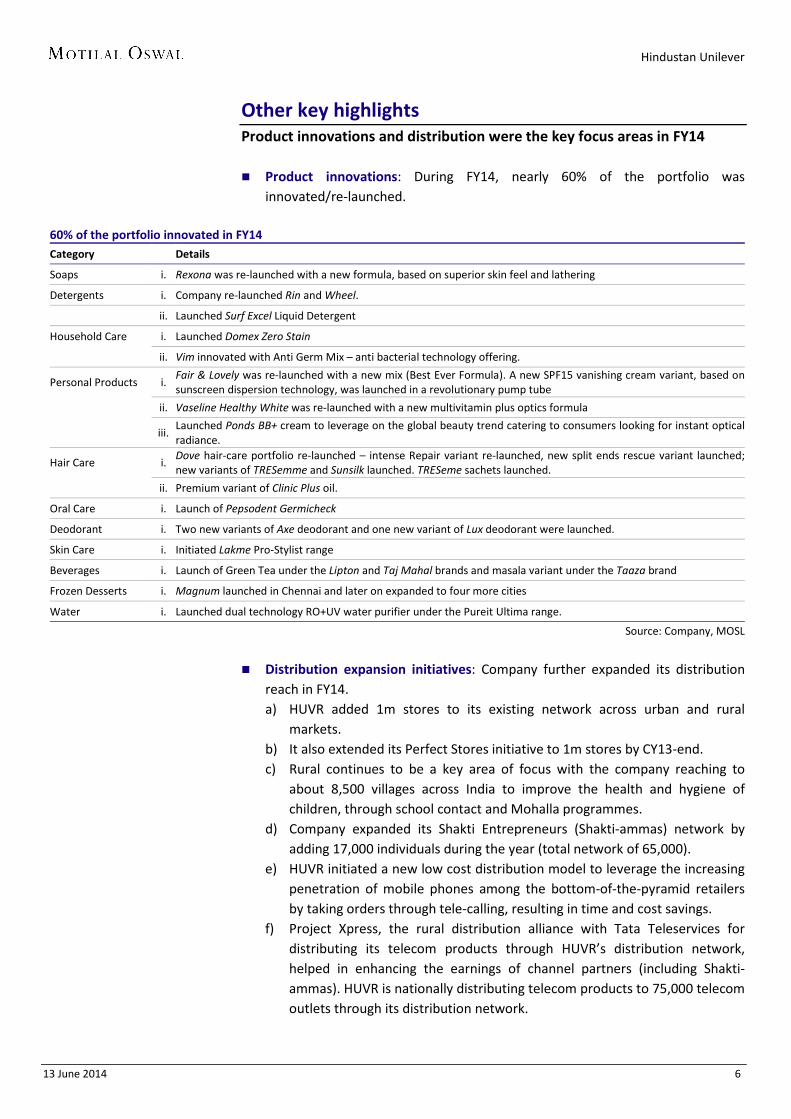
Other key highlights Product innovations and distribution were the key focus areas in FY14 Product innovations: During FY14, nearly 60% of the portfolio was
innovated/re-launched.
60% of the portfolio innovated in FY14 Category Details
Soaps i. Rexona was re-launched with a new formula, based on superior skin feel and lathering
Detergents i. Company re-launched Rin and Wheel.
ii. Launched Surf Excel Liquid Detergent
Household Care i. Launched Domex Zero Stain
ii. Vim innovated with Anti Germ Mix – anti bacterial technology offering.
Personal Products i. Fair & Lovely was re-launched with a new mix (Best Ever Formula). A new SPF15 vanishing cream variant, based on sunscreen dispersion technology, was launched in a revolutionary pump tube
ii. Vaseline Healthy White was re-launched with a new multivitamin plus optics formula
iii.
Launched Ponds BB+ cream to leverage on the global beauty trend catering to consumers looking for instant optical radiance.
Hair Care i. Dove hair-care portfolio re-launched – intense Repair variant re-launched, new split ends rescue variant launched; new variants of TRESemme and Sunsilk launched. TRESeme sachets launched.
ii. Premium variant of Clinic Plus oil.
Oral Care i. Launch of Pepsodent Germicheck
Deodorant i. Two new variants of Axe deodorant and one new variant of Lux deodorant were launched.
Skin Care i. Initiated Lakme Pro-Stylist range
Beverages i. Launch of Green Tea under the Lipton and Taj Mahal brands and masala variant under the Taaza brand
Frozen Desserts i. Magnum launched in Chennai and later on expanded to four more cities
Water i. Launched dual technology RO+UV water purifier under the Pureit Ultima range.
Source: Company, MOSL
Distribution expansion initiatives: Company further expanded its distribution
reach in FY14. a) HUVR added 1m stores to its existing network across urban and rural
markets. b) It also extended its Perfect Stores initiative to 1m stores by CY13-end. c) Rural continues to be a key area of focus with the company reaching to
about 8,500 villages across India to improve the health and hygiene of children, through school contact and Mohalla programmes.
d) Company expanded its Shakti Entrepreneurs (Shakti-ammas) network by adding 17,000 individuals during the year (total network of 65,000).
e) HUVR initiated a new low cost distribution model to leverage the increasing penetration of mobile phones among the bottom-of-the-pyramid retailers by taking orders through tele-calling, resulting in time and cost savings.
f) Project Xpress, the rural distribution alliance with Tata Teleservices for distributing its telecom products through HUVR’s distribution network, helped in enhancing the earnings of channel partners (including Shakti-ammas). HUVR is nationally distributing telecom products to 75,000 telecom outlets through its distribution network.
Hindustan Unilever
13 June 2014 7
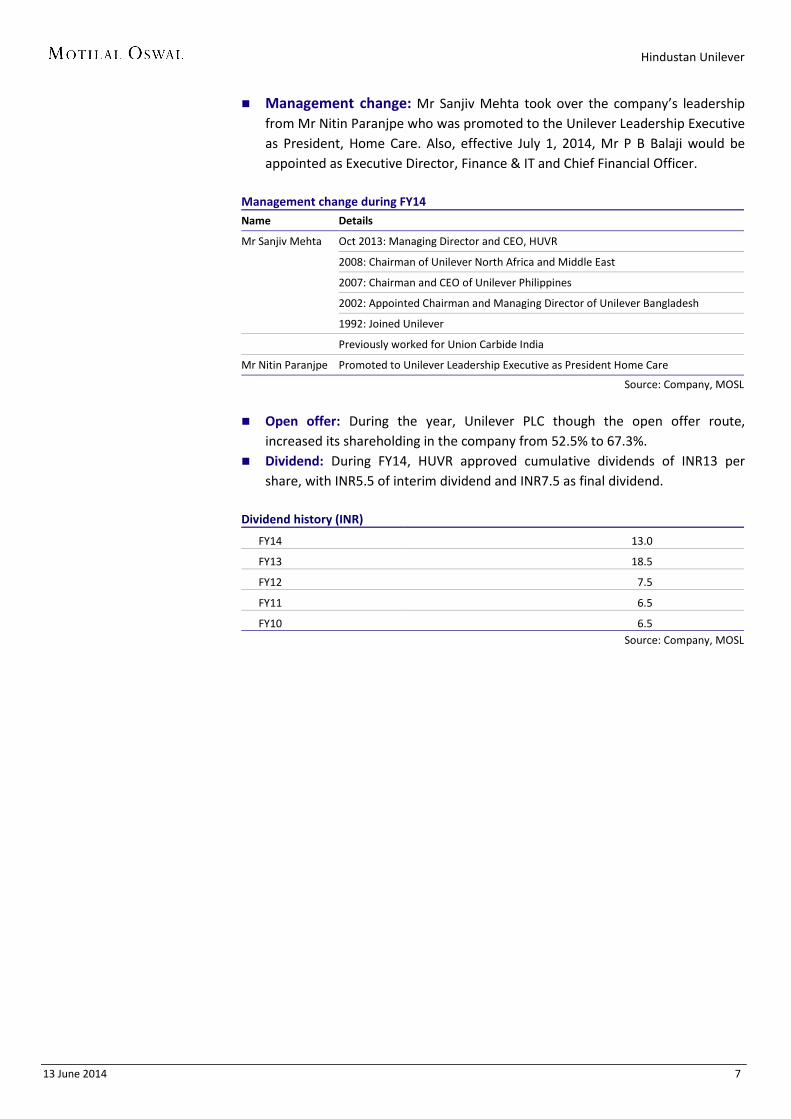
Management change: Mr Sanjiv Mehta took over the company’s leadership from Mr Nitin Paranjpe who was promoted to the Unilever Leadership Executive as President, Home Care. Also, effective July 1, 2014, Mr P B Balaji would be appointed as Executive Director, Finance & IT and Chief Financial Officer.
Management change during FY14 Name Details
Mr Sanjiv Mehta Oct 2013: Managing Director and CEO, HUVR
2008: Chairman of Unilever North Africa and Middle East
2007: Chairman and CEO of Unilever Philippines
2002: Appointed Chairman and Managing Director of Unilever Bangladesh
1992: Joined Unilever
Previously worked for Union Carbide India
Mr Nitin Paranjpe Promoted to Unilever Leadership Executive as President Home Care
Source: Company, MOSL
Open offer: During the year, Unilever PLC though the open offer route,
increased its shareholding in the company from 52.5% to 67.3%. Dividend: During FY14, HUVR approved cumulative dividends of INR13 per
share, with INR5.5 of interim dividend and INR7.5 as final dividend.
Dividend history (INR)
FY14 13.0
FY13 18.5
FY12 7.5
FY11 6.5
FY10 6.5
Source: Company, MOSL
Hindustan Unilever
13 June 2014 8
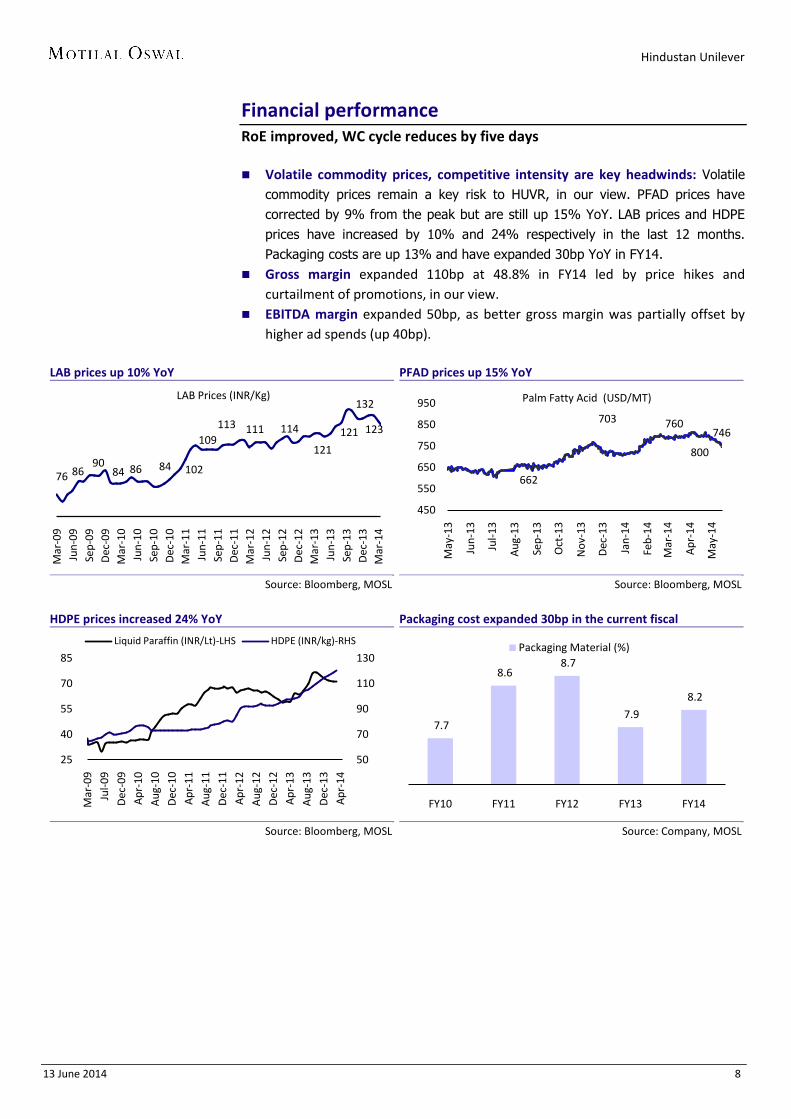
Financial performance RoE improved, WC cycle reduces by five days Volatile commodity prices, competitive intensity are key headwinds: Volatile
commodity prices remain a key risk to HUVR, in our view. PFAD prices have corrected by 9% from the peak but are still up 15% YoY. LAB prices and HDPE prices have increased by 10% and 24% respectively in the last 12 months. Packaging costs are up 13% and have expanded 30bp YoY in FY14.
Gross margin expanded 110bp at 48.8% in FY14 led by price hikes and curtailment of promotions, in our view.
EBITDA margin expanded 50bp, as better gross margin was partially offset by higher ad spends (up 40bp).
LAB prices up 10% YoY
Source: Bloomberg, MOSL
PFAD prices up 15% YoY
Source: Bloomberg, MOSL
HDPE prices increased 24% YoY
Source: Bloomberg, MOSL
Packaging cost expanded 30bp in the current fiscal
Source: Company, MOSL
76 8690
84 86 84 102
109113 111 114
121
121
132
123
Mar
-09
Jun-
09Se
p-09
Dec
-09
Mar
-10
Jun-
10Se
p-10
Dec
-10
Mar
-11
Jun-
11Se
p-11
Dec
-11
Mar
-12
Jun-
12Se
p-12
Dec
-12
Mar
-13
Jun-
13Se
p-13
Dec
-13
Mar
-14
LAB Prices (INR/Kg)
662
703 760
800
746
450
550
650
750
850
950
May
-13
Jun-
13
Jul-1
3
Aug-
13
Sep-
13
Oct
-13
Nov
-13
Dec
-13
Jan-
14
Feb-
14
Mar
-14
Apr-
14
May
-14
Palm Fatty Acid (USD/MT)
50
70
90
110
130
25
40
55
70
85
Mar
-09
Jul-0
9D
ec-0
9Ap
r-10
Aug-
10D
ec-1
0Ap
r-11
Aug-
11D
ec-1
1A
pr-1
2Au
g-12
Dec
-12
Apr-
13A
ug-1
3D
ec-1
3Ap
r-14
Liquid Paraffin (INR/Lt)-LHS HDPE (INR/kg)-RHS
7.7
8.6 8.7
7.9
8.2
FY10 FY11 FY12 FY13 FY14
Packaging Material (%)
Hindustan Unilever
13 June 2014 9
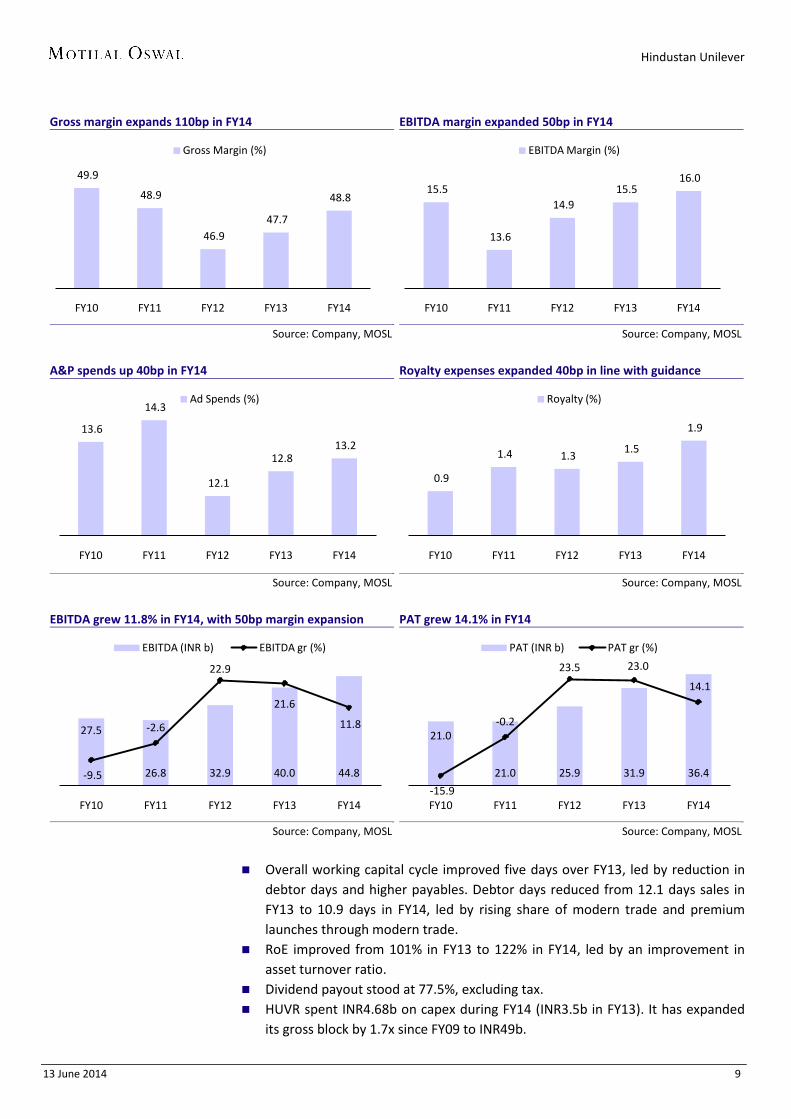
Gross margin expands 110bp in FY14
Source: Company, MOSL
EBITDA margin expanded 50bp in FY14
Source: Company, MOSL
A&P spends up 40bp in FY14
Source: Company, MOSL
Royalty expenses expanded 40bp in line with guidance
Source: Company, MOSL
EBITDA grew 11.8% in FY14, with 50bp margin expansion
Source: Company, MOSL
PAT grew 14.1% in FY14
Source: Company, MOSL
Overall working capital cycle improved five days over FY13, led by reduction in
debtor days and higher payables. Debtor days reduced from 12.1 days sales in FY13 to 10.9 days in FY14, led by rising share of modern trade and premium launches through modern trade.
RoE improved from 101% in FY13 to 122% in FY14, led by an improvement in asset turnover ratio.
Dividend payout stood at 77.5%, excluding tax. HUVR spent INR4.68b on capex during FY14 (INR3.5b in FY13). It has expanded
its gross block by 1.7x since FY09 to INR49b.
49.9
48.9
46.9 47.7
48.8
FY10 FY11 FY12 FY13 FY14
Gross Margin (%)
15.5
13.6
14.9 15.5
16.0
FY10 FY11 FY12 FY13 FY14
EBITDA Margin (%)
13.6
14.3
12.1
12.8 13.2
FY10 FY11 FY12 FY13 FY14
Ad Spends (%)
0.9
1.4 1.3 1.5
1.9
FY10 FY11 FY12 FY13 FY14
Royalty (%)
27.5
26.8 32.9 40.0 44.8-9.5
-2.6
22.9
21.6
11.8
FY10 FY11 FY12 FY13 FY14
EBITDA (INR b) EBITDA gr (%)
21.0
21.0 25.9 31.9 36.4
-15.9
-0.2
23.5 23.0
14.1
FY10 FY11 FY12 FY13 FY14
PAT (INR b) PAT gr (%)
Hindustan Unilever
13 June 2014 10
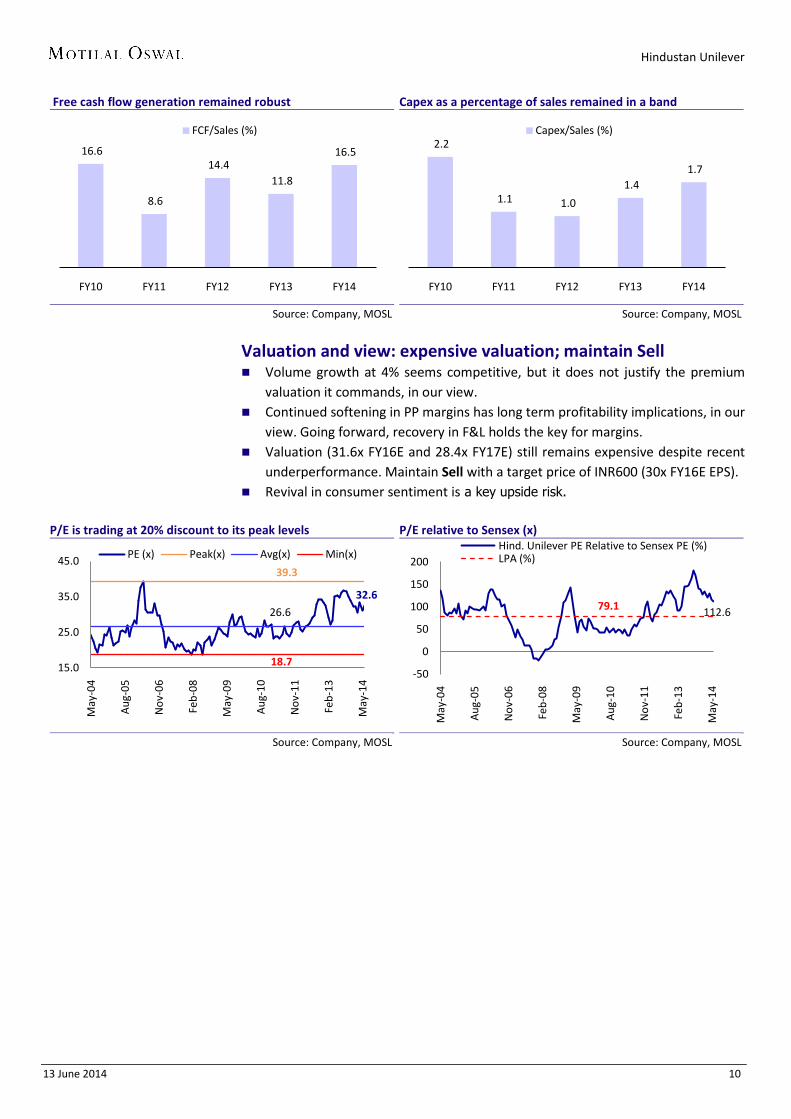
Free cash flow generation remained robust
Source: Company, MOSL
Capex as a percentage of sales remained in a band
Source: Company, MOSL
Valuation and view: expensive valuation; maintain Sell Volume growth at 4% seems competitive, but it does not justify the premium
valuation it commands, in our view. Continued softening in PP margins has long term profitability implications, in our
view. Going forward, recovery in F&L holds the key for margins. Valuation (31.6x FY16E and 28.4x FY17E) still remains expensive despite recent
underperformance. Maintain Sell with a target price of INR600 (30x FY16E EPS). Revival in consumer sentiment is a key upside risk.
P/E is trading at 20% discount to its peak levels
Source: Company, MOSL
P/E relative to Sensex (x)
Source: Company, MOSL
16.6
8.6
14.4 11.8
16.5
FY10 FY11 FY12 FY13 FY14
FCF/Sales (%)2.2
1.1 1.0
1.4 1.7
FY10 FY11 FY12 FY13 FY14
Capex/Sales (%)
32.6
39.3
26.6
18.715.0
25.0
35.0
45.0
May
-04
Aug-
05
Nov
-06
Feb-
08
May
-09
Aug-
10
Nov
-11
Feb-
13
May
-14
PE (x) Peak(x) Avg(x) Min(x)
112.679.1
-50
0
50
100
150
200
May
-04
Aug-
05
Nov
-06
Feb-
08
May
-09
Aug-
10
Nov
-11
Feb-
13
May
-14
Hind. Unilever PE Relative to Sensex PE (%)LPA (%)
Hindustan Unilever
13 June 2014 11
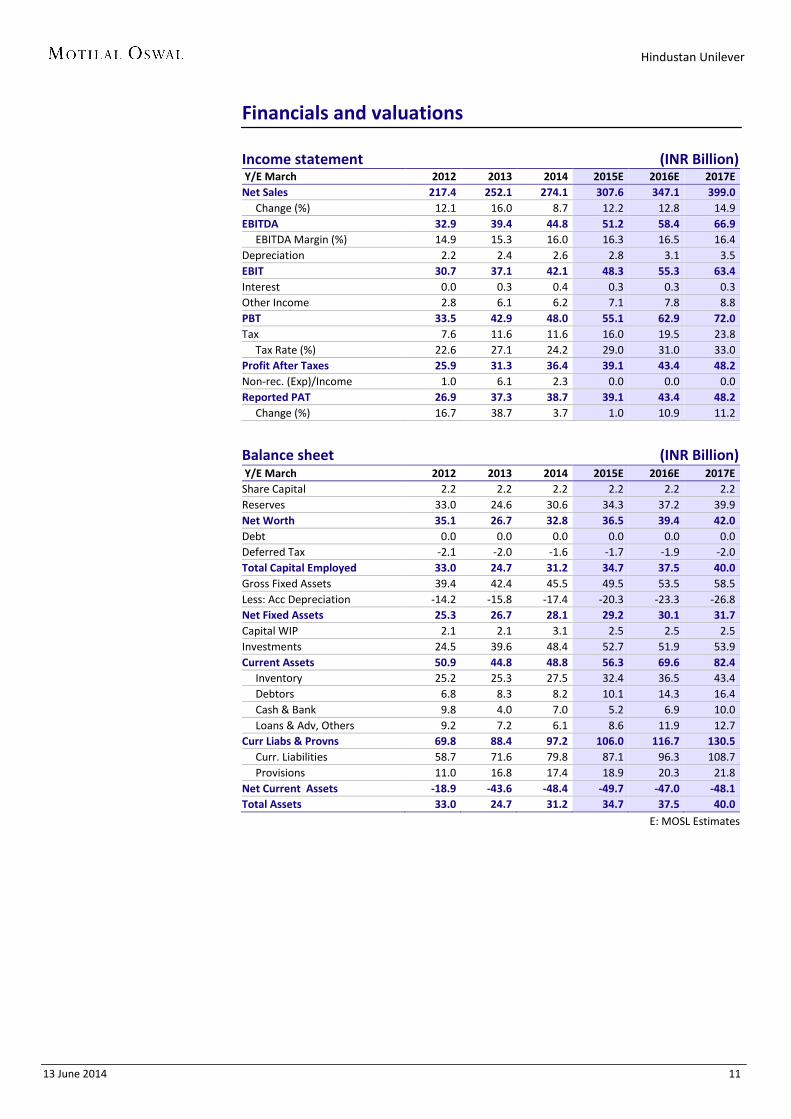
Financials and valuations Income statement (INR Billion) Y/E March 2012 2013 2014 2015E 2016E 2017E Net Sales 217.4 252.1 274.1 307.6 347.1 399.0 Change (%) 12.1 16.0 8.7 12.2 12.8 14.9 EBITDA 32.9 39.4 44.8 51.2 58.4 66.9 EBITDA Margin (%) 14.9 15.3 16.0 16.3 16.5 16.4 Depreciation 2.2 2.4 2.6 2.8 3.1 3.5 EBIT 30.7 37.1 42.1 48.3 55.3 63.4 Interest 0.0 0.3 0.4 0.3 0.3 0.3 Other Income 2.8 6.1 6.2 7.1 7.8 8.8 PBT 33.5 42.9 48.0 55.1 62.9 72.0 Tax 7.6 11.6 11.6 16.0 19.5 23.8 Tax Rate (%) 22.6 27.1 24.2 29.0 31.0 33.0 Profit After Taxes 25.9 31.3 36.4 39.1 43.4 48.2 Non-rec. (Exp)/Income 1.0 6.1 2.3 0.0 0.0 0.0 Reported PAT 26.9 37.3 38.7 39.1 43.4 48.2 Change (%) 16.7 38.7 3.7 1.0 10.9 11.2
Balance sheet (INR Billion) Y/E March 2012 2013 2014 2015E 2016E 2017E Share Capital 2.2 2.2 2.2 2.2 2.2 2.2 Reserves 33.0 24.6 30.6 34.3 37.2 39.9 Net Worth 35.1 26.7 32.8 36.5 39.4 42.0 Debt 0.0 0.0 0.0 0.0 0.0 0.0 Deferred Tax -2.1 -2.0 -1.6 -1.7 -1.9 -2.0 Total Capital Employed 33.0 24.7 31.2 34.7 37.5 40.0 Gross Fixed Assets 39.4 42.4 45.5 49.5 53.5 58.5 Less: Acc Depreciation -14.2 -15.8 -17.4 -20.3 -23.3 -26.8 Net Fixed Assets 25.3 26.7 28.1 29.2 30.1 31.7 Capital WIP 2.1 2.1 3.1 2.5 2.5 2.5 Investments 24.5 39.6 48.4 52.7 51.9 53.9 Current Assets 50.9 44.8 48.8 56.3 69.6 82.4 Inventory 25.2 25.3 27.5 32.4 36.5 43.4 Debtors 6.8 8.3 8.2 10.1 14.3 16.4 Cash & Bank 9.8 4.0 7.0 5.2 6.9 10.0 Loans & Adv, Others 9.2 7.2 6.1 8.6 11.9 12.7 Curr Liabs & Provns 69.8 88.4 97.2 106.0 116.7 130.5 Curr. Liabilities 58.7 71.6 79.8 87.1 96.3 108.7 Provisions 11.0 16.8 17.4 18.9 20.3 21.8 Net Current Assets -18.9 -43.6 -48.4 -49.7 -47.0 -48.1 Total Assets 33.0 24.7 31.2 34.7 37.5 40.0
E: MOSL Estimates
Hindustan Unilever
13 June 2014 12
Financials and valuations
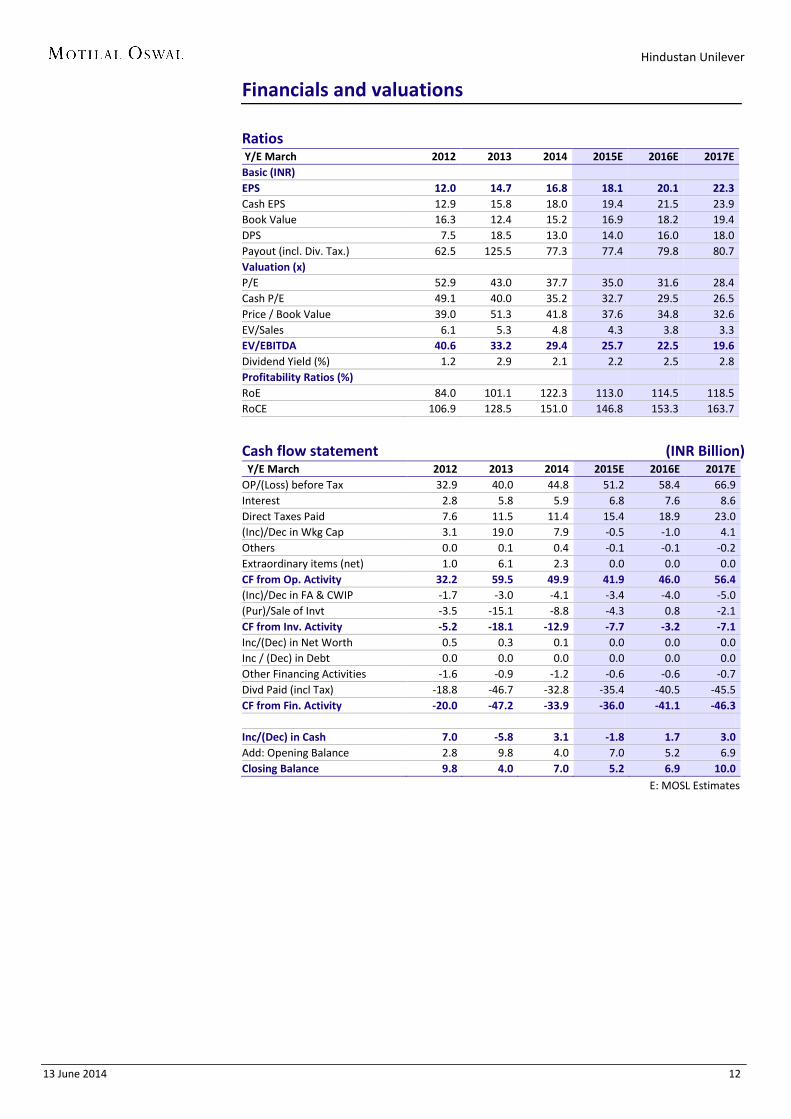
Ratios Y/E March 2012 2013 2014 2015E 2016E 2017E Basic (INR)
EPS 12.0 14.7 16.8 18.1 20.1 22.3 Cash EPS 12.9 15.8 18.0 19.4 21.5 23.9 Book Value 16.3 12.4 15.2 16.9 18.2 19.4 DPS 7.5 18.5 13.0 14.0 16.0 18.0 Payout (incl. Div. Tax.) 62.5 125.5 77.3 77.4 79.8 80.7 Valuation (x)
P/E 52.9 43.0 37.7 35.0 31.6 28.4 Cash P/E 49.1 40.0 35.2 32.7 29.5 26.5 Price / Book Value 39.0 51.3 41.8 37.6 34.8 32.6 EV/Sales 6.1 5.3 4.8 4.3 3.8 3.3 EV/EBITDA 40.6 33.2 29.4 25.7 22.5 19.6 Dividend Yield (%) 1.2 2.9 2.1 2.2 2.5 2.8 Profitability Ratios (%) RoE 84.0 101.1 122.3 113.0 114.5 118.5 RoCE 106.9 128.5 151.0 146.8 153.3 163.7
Cash flow statement (INR Billion) Y/E March 2012 2013 2014 2015E 2016E 2017E OP/(Loss) before Tax 32.9 40.0 44.8 51.2 58.4 66.9 Interest 2.8 5.8 5.9 6.8 7.6 8.6 Direct Taxes Paid 7.6 11.5 11.4 15.4 18.9 23.0 (Inc)/Dec in Wkg Cap 3.1 19.0 7.9 -0.5 -1.0 4.1 Others 0.0 0.1 0.4 -0.1 -0.1 -0.2 Extraordinary items (net) 1.0 6.1 2.3 0.0 0.0 0.0 CF from Op. Activity 32.2 59.5 49.9 41.9 46.0 56.4 (Inc)/Dec in FA & CWIP -1.7 -3.0 -4.1 -3.4 -4.0 -5.0 (Pur)/Sale of Invt -3.5 -15.1 -8.8 -4.3 0.8 -2.1 CF from Inv. Activity -5.2 -18.1 -12.9 -7.7 -3.2 -7.1 Inc/(Dec) in Net Worth 0.5 0.3 0.1 0.0 0.0 0.0 Inc / (Dec) in Debt 0.0 0.0 0.0 0.0 0.0 0.0 Other Financing Activities -1.6 -0.9 -1.2 -0.6 -0.6 -0.7 Divd Paid (incl Tax) -18.8 -46.7 -32.8 -35.4 -40.5 -45.5 CF from Fin. Activity -20.0 -47.2 -33.9 -36.0 -41.1 -46.3 Inc/(Dec) in Cash 7.0 -5.8 3.1 -1.8 1.7 3.0 Add: Opening Balance 2.8 9.8 4.0 7.0 5.2 6.9 Closing Balance 9.8 4.0 7.0 5.2 6.9 10.0
E: MOSL Estimates
Hindustan Unilever
13 June 2014 13
N O T E S
Hindustan Unilever
13 June 2014 14
Disclosures This report is for personal information of the authorized recipient and does not construe to be any investment, legal or taxation advice to you. This research report does not constitute an offer, invitation or inducement to invest in securities or other investments and Motilal Oswal Securities Limited (hereinafter referred as MOSt) is not soliciting any action based upon it. This report is not for public distribution and has been furnished to you solely for your information and should not be reproduced or redistributed to any other person in any form. Unauthorized disclosure, use, dissemination or copying (either whole or partial) of this information, is prohibited. The person accessing this information specifically agrees to exempt MOSt or any of its affiliates or employees from, any and all responsibility/liability arising from such misuse and agrees not to hold MOSt or any of its affiliates or employees responsible for any such misuse and further agrees to hold MOSt or any of its affiliates or employees free and harmless from all losses, costs, damages, expenses that may be suffered by the person accessing this information due to any errors and delays. The information contained herein is based on publicly available data or other sources believed to be reliable. While we would endeavour to update the information herein on reasonable basis, MOSt and/or its affiliates are under no obligation to update the information. Also there may be regulatory, compliance, or other reasons that may prevent MOSt and/or its affiliates from doing so. MOSt or any of its affiliates or employees shall not be in any way responsible and liable for any loss or damage that may arise to any person from any inadvertent error in the information contained in this report. MOSt or any of its affiliates or employees do not provide, at any time, any express or implied warranty of any kind, regarding any matter pertaining to this report, including without limitation the implied warranties of merchantability, fitness for a particular purpose, and non-infringement. The recipients of this report should rely on their own investigations. This report is intended for distribution to institutional investors. Recipients who are not institutional investors should seek advice of their independent financial advisor prior to taking any investment decision based on this report or for any necessary explanation of its contents. MOSt and/or its affiliates and/or employees may have interests/positions, financial or otherwise in the securities mentioned in this report. To enhance transparency, MOSt has incorporated a Disclosure of Interest Statement in this document. This should, however, not be treated as endorsement of the views expressed in the report.
Disclosure of Interest Statement HINDUSTAN UNILEVER LTD 1. Analyst ownership of the stock No 2. Group/Directors ownership of the stock No 3. Broking relationship with company covered No 4. Investment Banking relationship with company covered No
Analyst Certification The views expressed in this research report accurately reflect the personal views of the analyst(s) about the subject securities or issues, and no part of the compensation of the research analyst(s) was, is, or will be directly or indirectly related to the specific recommendations and views expressed by research analyst(s) in this report. The research analysts, strategists, or research associates principally responsible for preparation of MOSt research receive compensation based upon various factors, including quality of research, investor client feedback, stock picking, competitive factors and firm revenues. Regional Disclosures (outside India) This report is not directed or intended for distribution to or use by any person or entity resident in a state, country or any jurisdiction, where such distribution, publication, availability or use would be contrary to law, regulation or which would subject MOSt & its group companies to registration or licensing requirements within such jurisdictions. For U.K. This report is intended for distribution only to persons having professional experience in matters relating to investments as described in Article 19 of the Financial Services and Markets Act 2000 (Financial Promotion) Order 2005 (referred to as "investment professionals"). This document must not be acted on or relied on by persons who are not investment professionals. Any investment or investment activity to which this document relates is only available to investment professionals and will be engaged in only with such persons. For U.S. Motilal Oswal Securities Limited (MOSL) is not a registered broker - dealer under the U.S. Securities Exchange Act of 1934, as amended (the"1934 act") and under applicable state laws in the United States. In addition MOSL is not a registered investment adviser under the U.S. Investment Advisers Act of 1940, as amended (the "Advisers Act" and together with the 1934 Act, the "Acts), and under applicable state laws in the United States. Accordingly, in the absence of specific exemption under the Acts, any brokerage and investment services provided by MOSL, including the products and services described herein are not available to or intended for U.S. persons. This report is intended for distribution only to "Major Institutional Investors" as defined by Rule 15a-6(b)(4) of the Exchange Act and interpretations thereof by SEC (henceforth referred to as "major institutional investors"). This document must not be acted on or relied on by persons who are not major institutional investors. Any investment or investment activity to which this document relates is only available to major institutional investors and will be engaged in only with major institutional investors. In reliance on the exemption from registration provided by Rule 15a-6 of the U.S. Securities Exchange Act of 1934, as amended (the "Exchange Act") and interpretations thereof by the U.S. Securities and Exchange Commission ("SEC") in order to conduct business with Institutional Investors based in the U.S., MOSL has entered into a chaperoning agreement with a U.S. registered broker-dealer, Motilal Oswal Securities International Private Limited. ("MOSIPL"). Any business interaction pursuant to this report will have to be executed within the provisions of this chaperoning agreement. The Research Analysts contributing to the report may not be registered /qualified as research analyst with FINRA. Such research analyst may not be associated persons of the U.S. registered broker-dealer, MOSIPL, and therefore, may not be subject to NASD rule 2711 and NYSE Rule 472 restrictions on communication with a subject company, public appearances and trading securities held by a research analyst account. For Singapore Motilal Oswal Capital Markets Singapore Pte Limited is acting as an exempt financial advisor under section 23(1)(f) of the Financial Advisers Act(FAA) read with regulation 17(1)(d) of the Financial Advisors Regulations and is a subsidiary of Motilal Oswal Securities Limited in India. This research is distributed in Singapore by Motilal Oswal Capital Markets Singapore Pte Limited and it is only directed in Singapore to accredited investors, as defined in the Financial Advisers Regulations and the Securities and Futures Act (Chapter 289), as amended from time to time. In respect of any matter arising from or in connection with the research you could contact the following representatives of Motilal Oswal Capital Markets Singapore Pte Limited: Anosh Koppikar Kadambari Balachandran Email:[email protected] Email : [email protected] Contact(+65)68189232 Contact: (+65) 68189233 / 65249115 Office Address:21 (Suite 31),16 Collyer Quay,Singapore 04931
Motilal Oswal Securities Ltd
Motilal Oswal Tower, Level 9, Sayani Road, Prabhadevi, Mumbai 400 025 Phone: +91 22 3982 5500 E-mail: [email protected]