
13 April 2021 Initiating Coverage IndiaMART InterMESH Ltd ...
36
13 April 2021 Initiating Coverage IndiaMART InterMESH Ltd HSIE Research is also available on Bloomberg ERH HDF <GO> & Thomson Reuters B2B leadership IndiaMART InterMESH (IndiaMART) has emerged as a winner in the B2B classified space with a 60% market share and 27% revenue CAGR over FY16- 20. The quality of the franchise is established by (1) 100% organic traffic, (2) buyers and business enquiries’ 5-year CAGR of +33/40%, (3) lowest advertisement spend among peers, (4) pricing power, (5) higher ROI for sellers (~2x), (6) and embedded non-linearity. IndiaMART is well placed to ride the digitisation wave in MSMEs (accelerated by the pandemic), enabled by strong network effect, robust technology platform, and excellent execution capabilities. There lies a multi-year growth opportunity as only ~1% of the addressable MSMEs pay for listing services vs. ~4% in China (1688.com Alibaba B2B). We expect a revenue/EPS CAGR of +22/15% over FY21-23E, following a strong operating performance in FY21E (profit doubled). We initiate coverage on IndiaMART with a BUY rating and target price of INR 9,400, based on 58x EV/EBITDA (DCF implied) at 1.4x the average multiple, supported by top quartile growth/margin performance, high-quality franchise, asset-light business model, negative working capital, robust cash generation (154% OCF/EBITDA) and RoE of 58% (FY21E adjusted for QIP). Growth in paying suppliers is the key: IndiaMART has 6.4mn registered sellers and only 0.148mn pay for listing on the platform, resulting in a conversion factor of 2.3% (1688.com is at 9.2%). Assuming a similar conversion, there is a ~4x growth opportunity in paid suppliers. Digitisation push, network effect, and higher ROI for a seller is expected to drive the conversion factor. We expect paying suppliers’ CAGR of 16% over FY21-23E with conversion factor of 2.7%. The sensitivity of conversion factor to EPS is high; 1% improvement in conversion factor results in a 30% increase in EPS. Value proposition for a seller is attractive: IndiaMART’s robust two-way discovery platform benefits both the buyer and seller, building a strong network effect. The value proposition for a buyer is diversified product listings (71mn products across 56 industries) and a seller benefits from higher business enquiries, resulting in higher ROI (lower cost per enquiry). The shift to a higher package and lower churn drive ARPU growth (expect CAGR of 5.5%). As per our estimate, the ROI for a silver/platinum seller is 0.8/2.4x, assuming an RFQ conversion ratio of 8%. Stellar operating leverage: IndiaMART has exhibited consistent revenue growth without an increase in cost and advertisement expenses. Higher component of variable cost (~83% of the employees are sales), increasing sales efficiency and organic traffic have kept the cost under check. The margin expanded from 11.4% in FY18 to 26.4% in FY20 and doubled in FY21E to 48.5%. We expect an EBITDA margin of ~45% for FY22/23E, assuming +25% cost CAGR for FY21-23E. Financial summary YE March (Rs bn) FY18 FY19 FY20 FY21E FY22E FY23E FY24E Net Sales 4.11 5.07 6.39 6.68 8.16 9.91 11.97 EBITDA 0.47 0.82 1.69 3.24 3.68 4.51 5.44 APAT 1.78 0.85 1.47 2.93 3.27 3.89 4.42 Diluted EPS (Rs) 58.5 28.1 48.5 96.6 107.8 128.3 145.4 P/E (x) 134.8 280.7 162.4 81.7 73.1 61.5 54.2 EV / Revenue (x) 57.5 45.8 36.1 32.5 26.1 20.9 16.9 EV / EBITDA (x) 505.8 282.4 136.5 67.0 57.8 46.1 37.1 RoE (%) ^ NM 53.4 67.8 57.5 51.1 42.0 35.1 Source: Company, HSIE Research, Consolidated Financials, ^FY21-24E RoE ex QIP BUY CMP (as on 12 Apr 2021) Rs 7,885 Target Price Rs 9,400 NIFTY 14,311 KEY STOCK DATA Bloomberg code INMART IN No. of Shares (mn) 30 MCap (Rs bn) / ($ mn) 229/3,293 6m avg traded value (Rs mn) 1,032 52 Week high / low Rs 9,952/2,035 STOCK PERFORMANCE (%) 3M 6M 12M Absolute (%) (4.0) 57.5 251.1 Relative (%) (0.7) 39.6 197.4 SHAREHOLDING PATTERN (%) Dec-20 Feb-21* Promoter 51.98 49.85 FIs & Local MFs 5.04 4.77 FPIs 24.61 27.65 Public & Others 18.48 17.72 Pledged Shares 0.00 0.00 Source : BSE * Post QIP Amit Chandra [email protected] +91-22-6171-7345 Apurva Prasad [email protected] +91-22-6171-7327 Mohit Motwani [email protected] +91-22-6171-7332
Transcript of 13 April 2021 Initiating Coverage IndiaMART InterMESH Ltd ...

13 April 2021 Initiating Coverage
IndiaMART InterMESH
Ltd
HSIE Research is also available on Bloomberg ERH HDF <GO> & Thomson Reuters
B2B leadership IndiaMART InterMESH (IndiaMART) has emerged as a winner in the B2B
classified space with a 60% market share and 27% revenue CAGR over FY16-
20. The quality of the franchise is established by (1) 100% organic traffic, (2)
buyers and business enquiries’ 5-year CAGR of +33/40%, (3) lowest
advertisement spend among peers, (4) pricing power, (5) higher ROI for
sellers (~2x), (6) and embedded non-linearity. IndiaMART is well placed to
ride the digitisation wave in MSMEs (accelerated by the pandemic), enabled
by strong network effect, robust technology platform, and excellent execution
capabilities. There lies a multi-year growth opportunity as only ~1% of the
addressable MSMEs pay for listing services vs. ~4% in China (1688.com
Alibaba B2B).
We expect a revenue/EPS CAGR of +22/15% over FY21-23E, following a strong
operating performance in FY21E (profit doubled). We initiate coverage on
IndiaMART with a BUY rating and target price of INR 9,400, based on 58x
EV/EBITDA (DCF implied) at 1.4x the average multiple, supported by top
quartile growth/margin performance, high-quality franchise, asset-light
business model, negative working capital, robust cash generation (154%
OCF/EBITDA) and RoE of 58% (FY21E adjusted for QIP).
Growth in paying suppliers is the key: IndiaMART has 6.4mn registered
sellers and only 0.148mn pay for listing on the platform, resulting in a
conversion factor of 2.3% (1688.com is at 9.2%). Assuming a similar
conversion, there is a ~4x growth opportunity in paid suppliers. Digitisation
push, network effect, and higher ROI for a seller is expected to drive the
conversion factor. We expect paying suppliers’ CAGR of 16% over FY21-23E
with conversion factor of 2.7%. The sensitivity of conversion factor to EPS is
high; 1% improvement in conversion factor results in a 30% increase in EPS.
Value proposition for a seller is attractive: IndiaMART’s robust two-way
discovery platform benefits both the buyer and seller, building a strong
network effect. The value proposition for a buyer is diversified product
listings (71mn products across 56 industries) and a seller benefits from
higher business enquiries, resulting in higher ROI (lower cost per enquiry).
The shift to a higher package and lower churn drive ARPU growth (expect
CAGR of 5.5%). As per our estimate, the ROI for a silver/platinum seller is
0.8/2.4x, assuming an RFQ conversion ratio of 8%.
Stellar operating leverage: IndiaMART has exhibited consistent revenue
growth without an increase in cost and advertisement expenses. Higher
component of variable cost (~83% of the employees are sales), increasing
sales efficiency and organic traffic have kept the cost under check. The
margin expanded from 11.4% in FY18 to 26.4% in FY20 and doubled in
FY21E to 48.5%. We expect an EBITDA margin of ~45% for FY22/23E,
assuming +25% cost CAGR for FY21-23E.
Financial summary YE March (Rs bn) FY18 FY19 FY20 FY21E FY22E FY23E FY24E
Net Sales 4.11 5.07 6.39 6.68 8.16 9.91 11.97
EBITDA 0.47 0.82 1.69 3.24 3.68 4.51 5.44
APAT 1.78 0.85 1.47 2.93 3.27 3.89 4.42
Diluted EPS (Rs) 58.5 28.1 48.5 96.6 107.8 128.3 145.4
P/E (x) 134.8 280.7 162.4 81.7 73.1 61.5 54.2
EV / Revenue (x) 57.5 45.8 36.1 32.5 26.1 20.9 16.9
EV / EBITDA (x) 505.8 282.4 136.5 67.0 57.8 46.1 37.1
RoE (%) ^ NM 53.4 67.8 57.5 51.1 42.0 35.1
Source: Company, HSIE Research, Consolidated Financials, ^FY21-24E RoE ex QIP
BUY
CMP (as on 12 Apr 2021) Rs 7,885
Target Price Rs 9,400
NIFTY 14,311
KEY STOCK DATA
Bloomberg code INMART IN
No. of Shares (mn) 30
MCap (Rs bn) / ($ mn) 229/3,293
6m avg traded value (Rs mn) 1,032
52 Week high / low Rs 9,952/2,035
STOCK PERFORMANCE (%)
3M 6M 12M
Absolute (%) (4.0) 57.5 251.1
Relative (%) (0.7) 39.6 197.4
SHAREHOLDING PATTERN (%)
Dec-20 Feb-21*
Promoter 51.98 49.85
FIs & Local MFs 5.04 4.77
FPIs 24.61 27.65
Public & Others 18.48 17.72
Pledged Shares 0.00 0.00
Source : BSE
* Post QIP
Amit Chandra
+91-22-6171-7345
Apurva Prasad
+91-22-6171-7327
Mohit Motwani
+91-22-6171-7332

Page | 2
IndiaMART InterMESH Ltd : Initiating Coverage
Focus Charts 5 year CAGR: Consistent improvement in buyer and
seller traffic creating strong Network effect
IndiaMART spends the lowest on advertisement as a %
of revenue, 100% traffic is organic
Source: Company, HSIE Research
Source: Company, HSIE Research, FY20 numbers for peers
ROI for sellers - Attractive EPS Sensitivity to Conversion Factor - High
Value proposition as per package Silver Gold Platinum
Weekly RFQ (One Week Validity) No's 7 - 10 20 - 30 50 - 100
Daily Unique RFQ (Day Validity) No's 1 2 4
No of weekly RFQs received in a month
(No's) 28 80 200
No of daily RFQs received in a month
(No's) 30 60 120
Monthly Rate (INR) 3,000 NA NA
Annual Rate (INR) 28,500 55,000 80,000
Package cost/month + GST@18% (INR) 3,540 5,408 7,867
Cost/RFQ (INR) ^ 126 68 39
RFQ conversion % 8% 8% 8%
ROI (x) 0.8 1.4 2.4
Breakeven days for a supplier 40 21 12
FY23 EPS (Rs)
ARPU YoY Growth %
2.0% 3.0% 4.0% 5.0% 6.0% 7.0% 8.0%
Conversion
Factor %
2.1% 102 103 104 105 106 106 107
2.3% 110 111 112 112 113 114 115
2.5% 117 118 119 120 121 122 123
2.7% 125 126 127 128 129 130 131
2.9% 133 134 135 136 137 138 139
3.1% 140 141 142 143 145 146 147
3.3% 148 149 150 151 152 154 155
Source: Company, HSIE Research, Conversion Factor is paid to free
supplier ratio
Source: Company, HSIE Research, ^ as per weekly RFQ
IndiaMART vs. 1688.com IndiaMART vs. Competition
Comparison IndiaMART 1688.com
(Alibaba)
Revenue TTM (USD mn) 89 1,974
4Y CAGR (FY16-20) % 27% 29%
Active Buyers as per latest filing (mn) 119 41
Registered Suppliers as per latest filing (mn) 6.4 10.0
Paid Suppliers as per latest filing (mn) 0.15 0.92
Conversion Factor % 2.3% 9.2%
Revenue/Registered supplier (USD) 14 197
Revenue/Paying supplier (USD) 603 2,145
Revenue/Buyer (USD) 0.7 48
Total Product listings as per latest filing (mn) 71 550
Source: Company, Alibaba, 1688.com, HSIE Research, USD-INR 74
Parameters IndiaMART TradeIndia Udaan
No of Registered Buyers FY20 (mn) 102.0 5.60 3.0
Industry Category FY20 (No’s) 56 40 NA
Market Share % 55% 35% NA
Daily RFQs/ Paying Seller (Nos) 9 4 NA
No of Suppliers (mn)* 6.4 4.0 0.03
Paying Sellers (mn)* 0.148 0.05 NA
Conversion % 2.3% 1.3% NA
Value/Buyer (USD) 32 NA 1,033
Revenue (FY20) INR mn 6,389 1,270 9,780
ARPU (INR/Year) 43,166 25,400 NA
Revenue/Buyer (INR) 63 227 3,260
Source: Company, HSIE Research, Media reports, * as per latest filing,
Udaan Valuation USD 3.1bn, USD-INR 74
0.2% 1.2%
7.0%
16.1%
29.1%
0.0%
5.0%
10.0%
15.0%
20.0%
25.0%
30.0%
35.0%
IndiaMart Affle Just Dial Info Edge Matrimony
23% 23%
29%
34%35% 40%
10%
15%
20%
25%
30%
35%
40%
45%
Reg
iste
red
Su
pp
lier
s
Liv
e P
rod
uct
s
Lis
tin
g
To
tal T
raff
ic
Da
ily
Un
iqu
e
Bu
sin
ess
En
qu
irie
s
No
of
Reg
iste
red
Bu
yer
s
To
tal b
usi
nes
s
enq
uir
ies
del
iver
ed

Page | 3
IndiaMART InterMESH Ltd : Initiating Coverage
Contents
Company at a Glance .............................................................................................. 4
B2B E-Commerce – Riding the Digitisation Wave ............................................. 5
Market Leadership in B2B ..................................................................................... 7
Paid Suppliers: ~4x Growth Opportunity ......................................................... 13
Value proposition attractive for sellers ............................................................... 15
Prowess in Financial performance ...................................................................... 19
Company Background .......................................................................................... 27
Valuation and recommendation .......................................................................... 29
Peer Valuation ........................................................................................................ 31
Financials................................................................................................................. 33

Page | 4
IndiaMART InterMESH Ltd : Initiating Coverage
Company at a Glance
IndiaMART revenue trend EBITDA margin expansion led by non-linearity
Source: Company, HSIE Research
Source: Company, HSIE Research
Paid Suppliers has grown at a CAGR of 16% Blended ARPU has grown at a CAGR of 7%
Source: Company, HSIE Research Source: Company, HSIE Research
Cost breakup % (9MFY21) Net profit CAGR of 15% over FY21-23E
Source: Company, HSIE Research Source: Company, HSIE Research
30.3%
7.7%
1.4%
2.7%
2.3%
2.9%
0.3%0.1% 2.9% Employee Expenses
Outsourced Employee
CostContent development
expensesBuyer Engagement
ExpensesCustomer Support
ExpensesInternet and other online
expensesRent
Advertisement
Others
72,000
96000
108000
130000
147000 148000
0%
5%
10%
15%
20%
25%
30%
35%
40,000
60,000
80,000
1,00,000
1,20,000
1,40,000
1,60,000
FY16 FY17 FY18 FY19 FY20 3QFY21
Paid Suppliers (Nos) Growth YoY%
32,800 32,140
37,24638,373
42,272
45,989
-4%
-2%
0%
2%
4%
6%
8%
10%
12%
14%
16%
18%
25,000
30,000
35,000
40,000
45,000
50,000
FY16 FY17 FY18 FY19 FY20 9MFY21
ARPU (INR) Growth YoY%
2,4583,178
4,105
5,074
6,389 6,679
8,161
9,914
0%
5%
10%
15%
20%
25%
30%
35%
1,000
2,000
3,000
4,000
5,000
6,000
7,000
8,000
9,000
10,000
11,000
FY
16
FY
17
FY
18
FY
19
FY
20
FY
21
E
FY
22
E
FY
23
E
Total Revenue (INR mn) Growth YoY%
-51.1%
-17.1%
11.4%16.2%
26.4%
48.5% 45.1% 45.5%
-60.0%
-40.0%
-20.0%
0.0%
20.0%
40.0%
60.0%
FY
16
FY
17
FY
18
FY
19
FY
20
FY
21
E
FY
22
E
FY
23
E
-1,245
-451
1,776
8531,474
2,9323,273
3,894
-60%
-40%
-20%
0%
20%
40%
60%
80%
100%
120%
-2,000
-1,000
0
1,000
2,000
3,000
4,000
5,000
FY
16
FY
17
FY
18
FY
19
FY
20
FY
21
E
FY
22
E
FY
23
E
PAT (INR mn) Growth YoY %
Page | 5
IndiaMART InterMESH Ltd : Initiating Coverage
B2B E-commerce – Riding the Digitisation
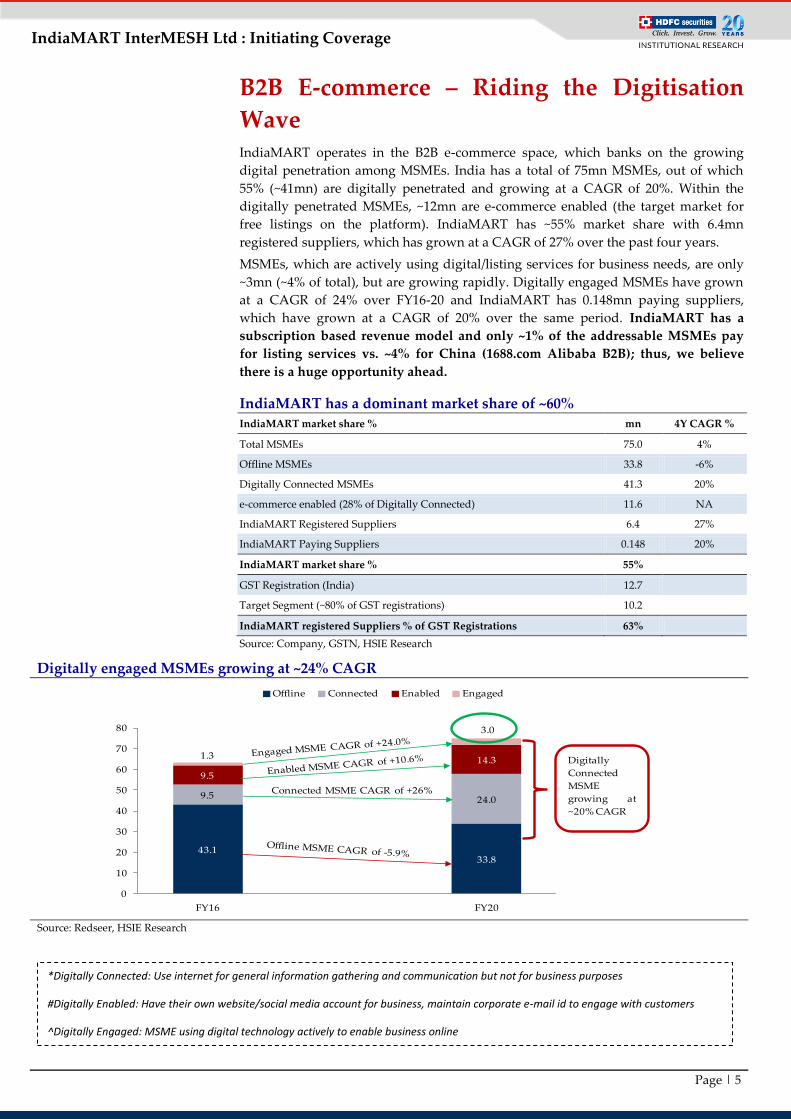
Wave IndiaMART operates in the B2B e-commerce space, which banks on the growing
digital penetration among MSMEs. India has a total of 75mn MSMEs, out of which
55% (~41mn) are digitally penetrated and growing at a CAGR of 20%. Within the
digitally penetrated MSMEs, ~12mn are e-commerce enabled (the target market for
free listings on the platform). IndiaMART has ~55% market share with 6.4mn
registered suppliers, which has grown at a CAGR of 27% over the past four years.
MSMEs, which are actively using digital/listing services for business needs, are only
~3mn (~4% of total), but are growing rapidly. Digitally engaged MSMEs have grown
at a CAGR of 24% over FY16-20 and IndiaMART has 0.148mn paying suppliers,
which have grown at a CAGR of 20% over the same period. IndiaMART has a
subscription based revenue model and only ~1% of the addressable MSMEs pay
for listing services vs. ~4% for China (1688.com Alibaba B2B); thus, we believe
there is a huge opportunity ahead.
IndiaMART has a dominant market share of ~60%
IndiaMART market share % mn 4Y CAGR %
Total MSMEs 75.0 4%
Offline MSMEs 33.8 -6%
Digitally Connected MSMEs 41.3 20%
e-commerce enabled (28% of Digitally Connected) 11.6 NA
IndiaMART Registered Suppliers 6.4 27%
IndiaMART Paying Suppliers 0.148 20%
IndiaMART market share % 55%
GST Registration (India) 12.7
Target Segment (~80% of GST registrations) 10.2
IndiaMART registered Suppliers % of GST Registrations 63%
Source: Company, GSTN, HSIE Research
Digitally engaged MSMEs growing at ~24% CAGR
Source: Redseer, HSIE Research
*Digitally Connected: Use internet for general information gathering and communication but not for business purposes
#Digitally Enabled: Have their own website/social media account for business, maintain corporate e-mail id to engage with customers
^Digitally Engaged: MSME using digital technology actively to enable business online
43.133.8
9.5 24.0
9.5
14.31.3
3.0
0
10
20
30
40
50
60
70
80
FY16 FY20
Offline Connected Enabled Engaged
Connected MSME CAGR of +26%
Digitally
Connected
MSME
growing at
~20% CAGR

Page | 6
IndiaMART InterMESH Ltd : Initiating Coverage
Digital engagement of MSMEs has improved, ~55% Digitally penetrated vs. ~90% for China
Source: Company, HSIE Research, Digitally penetrated is Connected+Enabled+Engaged
The overall B2B market size in India can be viewed in multiple ways and depends
upon the model considered. The two prime models are the subscription model and
the online marketplace model (commission revenue based on GMV). IndiaMART has
a subscription based model and has proved its leadership with a 60% market share in
the free listing category and ~70-75% share (KPMG estimate) in paid listings.
As per the Redseer report, there are around 3mn MSMEs using B2B digital services.
They spend ~USD 500 annually (~INR 37K) and the total market size is USD 1.5bn.
The majority of the 3mn MSMEs are of medium size (INR 2-5mn turnover) and are
based out of Tier-1 cities. Out of the total size of USD 1.5bn, ~80% is commission
revenue, earned from the online marketplace, while the rest is from
listing/subscription and other digital services. With the higher drive for digitisation,
the number of digitally engaged MSMEs is expected to rise to ~14mn (~36% CAGR)
in the next five years, taking the total addressable market to USD 9bn (~45% CAGR).
IndiaMART earns the majority of its revenue from the subscription model; thus, the
opportunity for it is USD 2bn (~20% of total).
B2B Digital services : (Subscription + Online Marketplace)
Source: Redseer, HSIE Research
Offline,
68%
Connected,
15%
Enabled,
15%
Engaged,
2%
FY16
Offline,
45%
Connected,
32%
Enabled,
19%
Engaged,
4%
FY20
6%
20%
0%
5%
10%
15%
20%
25%
CY18 CY23F
% of MSME using Digital Services
~14mn~3mn
500
650
400
450
500
550
600
650
700
CY18 CY23F
Annual spend by MSME on
Digital ServicesUSD
1.5
9.1
0
1
2
3
4
5
6
7
8
9
10
CY18 CY23F
Market size of B2B Digital
ServicesUSD bn
Page | 7
IndiaMART InterMESH Ltd : Initiating Coverage
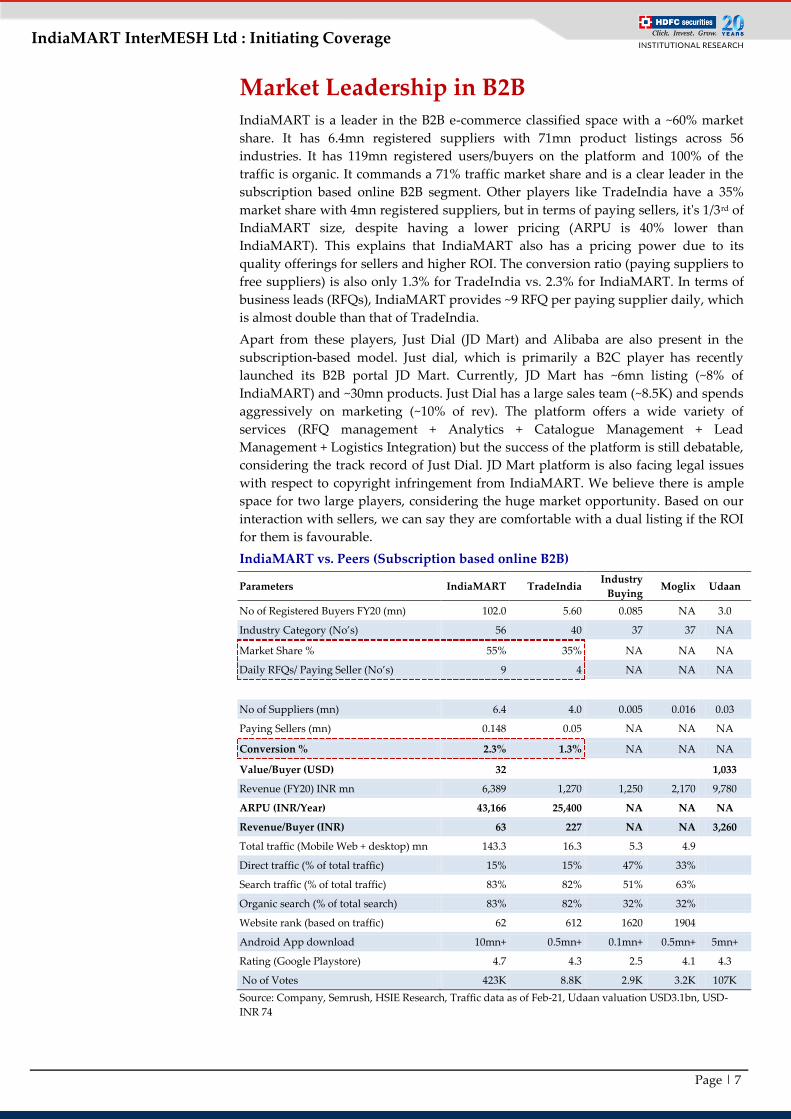
Market Leadership in B2B IndiaMART is a leader in the B2B e-commerce classified space with a ~60% market
share. It has 6.4mn registered suppliers with 71mn product listings across 56
industries. It has 119mn registered users/buyers on the platform and 100% of the
traffic is organic. It commands a 71% traffic market share and is a clear leader in the
subscription based online B2B segment. Other players like TradeIndia have a 35%
market share with 4mn registered suppliers, but in terms of paying sellers, it's 1/3rd of
IndiaMART size, despite having a lower pricing (ARPU is 40% lower than
IndiaMART). This explains that IndiaMART also has a pricing power due to its
quality offerings for sellers and higher ROI. The conversion ratio (paying suppliers to
free suppliers) is also only 1.3% for TradeIndia vs. 2.3% for IndiaMART. In terms of
business leads (RFQs), IndiaMART provides ~9 RFQ per paying supplier daily, which
is almost double than that of TradeIndia.
Apart from these players, Just Dial (JD Mart) and Alibaba are also present in the
subscription-based model. Just dial, which is primarily a B2C player has recently
launched its B2B portal JD Mart. Currently, JD Mart has ~6mn listing (~8% of
IndiaMART) and ~30mn products. Just Dial has a large sales team (~8.5K) and spends
aggressively on marketing (~10% of rev). The platform offers a wide variety of
services (RFQ management + Analytics + Catalogue Management + Lead
Management + Logistics Integration) but the success of the platform is still debatable,
considering the track record of Just Dial. JD Mart platform is also facing legal issues
with respect to copyright infringement from IndiaMART. We believe there is ample
space for two large players, considering the huge market opportunity. Based on our
interaction with sellers, we can say they are comfortable with a dual listing if the ROI
for them is favourable.
IndiaMART vs. Peers (Subscription based online B2B)
Parameters IndiaMART TradeIndia Industry
Buying Moglix Udaan
No of Registered Buyers FY20 (mn) 102.0 5.60 0.085 NA 3.0
Industry Category (No’s) 56 40 37 37 NA
Market Share % 55% 35% NA NA NA
Daily RFQs/ Paying Seller (No’s) 9 4 NA NA NA
No of Suppliers (mn) 6.4 4.0 0.005 0.016 0.03
Paying Sellers (mn) 0.148 0.05 NA NA NA
Conversion % 2.3% 1.3% NA NA NA
Value/Buyer (USD) 32 1,033
Revenue (FY20) INR mn 6,389 1,270 1,250 2,170 9,780
ARPU (INR/Year) 43,166 25,400 NA NA NA
Revenue/Buyer (INR) 63 227 NA NA 3,260
Total traffic (Mobile Web + desktop) mn 143.3 16.3 5.3 4.9
Direct traffic (% of total traffic) 15% 15% 47% 33%
Search traffic (% of total traffic) 83% 82% 51% 63%
Organic search (% of total search) 83% 82% 32% 32%
Website rank (based on traffic) 62 612 1620 1904
Android App download 10mn+ 0.5mn+ 0.1mn+ 0.5mn+ 5mn+
Rating (Google Playstore) 4.7 4.3 2.5 4.1 4.3
No of Votes 423K 8.8K 2.9K 3.2K 107K
Source: Company, Semrush, HSIE Research, Traffic data as of Feb-21, Udaan valuation USD3.1bn, USD-
INR 74

Page | 8
IndiaMART InterMESH Ltd : Initiating Coverage
In the transaction based B2B model, there are players like Amazon Business, Udaan,
Ali Express and Power2SME. Udaan has shown exponential growth during the
pandemic, with revenue up 21x in FY20 to INR 9.7bn and loss up 3x to INR 25bn.
Udaan provides end-to-end services such as logistics, warehousing, and trade
financing for buyers apart from matching services. This model requires huge
investments. As per the latest funding round, Udaan is valued at ~USD 3bn (23x P/S).
Based on value/buyer, Udaan is valued 32x more than IndiaMART. Revenue/Buyer
for Udaan is ~$44, comparable to Alibaba B2B, ~ $48) and ~50x of IndiaMART (~$1).
Udaan (INR mn) FY19 FY20 YoY % X
Revenue 463 9,780 2012% 21
Expenses 8,500 34,880 310% 4
EBITDA -8,037 -25,100 NM 3
EBITDA % -1736% -257%
PAT -7,796 -25,187 NM 3
OCF -8,317 -27,029 NM
Source: Media Reports, HSIE Research
Network effect: the driving force behind building strong brands
A network effect is a mechanism where every new user makes the
product/service/experience more valuable to every other user. Network effect fuels
growth and increases defensibility. In the case of IndiaMART, the network effect
coupled with a significant value proposition for both buyers and sellers has led to a
significant rise in registered buyers, registered sellers, and traffic on the platform.
IndiaMART’s registered suppliers / paying subscription suppliers / registered buyers
have clocked a CAGR of +23/+16/+33% over FY16-21.
Network Effect: IndiaMART
Source: Company, HSIE Research
The success of IndiaMART’s business model stems from a circular web of a large pool
of suppliers and buyers it has managed to create over the last few years. The presence
of a large number of buyers results in increased business enquiries, attracting more
suppliers to register and create storefronts on the platform, thereby attracting more
buyers. 59% of the registered buyers are repeat buyers while 37% of the suppliers are
also buyers. With continuous increase in buyers and suppliers, the network effect
119 mn Registered Buyers
59% of Buyers are repeat buyers
1.7mn Daily Enquiries
100% of traffic is organic
6.4 mn Suppliers
37% of suppliers are buyers
Product Discovery
71 mn Product listings across 99K
Categories

Page | 9
IndiaMART InterMESH Ltd : Initiating Coverage
essentially increases the value of the matchmaking service provided by IndiaMART
and leads to an increase in “willingness to pay” by a supplier.
IndiaMART has a dominant traffic market of ~71% in March-21 and traffic increased
155% YoY to reach 67mn visits as per the Semrush data. The prime reasons for
volume surge and market share gain were higher value proposition for a seller,
robust platform, efficient matching algorithm, and network effect.
With the rise in competition, sellers are compelled to try multiple B2B platforms but
IndiaMART’s ability to attract 100% organic traffic, efficient search engine
optimisation (SEO) tools and a high proportion of repeat buyers increase the
stickiness on the platform. IndiaMART has a churn rate of ~20%, which is healthy.
IndiaMART traffic has increased 155% YoY led by
COVID, Network effect and high ROI for suppliers
IndiaMART traffic market share is at 71% vs 56%
YoY and 100% of the traffic is organic
Source: Semrush, HSIE Research Source: Semrush, HSIE Research
IndiaMART is way ahead than peers in terms of organic traffic
Source: Semrush, HSIE Research
IndiaMart
Justdial
TradeIndia
UdaanIndusty Buying
Moglix
0
5
10
15
20
25
0 10 20 30 40 50 60 70 80 90
Org
anic
Key
wo
rd (
mn
)
Organic Traffic (mn)
20
30
40
50
60
70
80
Ap
r-1
9M
ay
-19
Jun
-19
Jul-
19
Au
g-1
9S
ep-1
9O
ct-1
9N
ov
-19
Dec
-19
Jan
-20
Feb
-20
Ma
r-2
0A
pr-
20
Ma
y-2
0Ju
n-2
0Ju
l-2
0A
ug
-20
Sep
-20
Oct
-20
No
v-2
0D
ec-2
0Ja
n-2
1F
eb-2
1M
ar-
21
Indiamart Just Dialmn
56%
71%
26%
0%
10%
20%
30%
40%
50%
60%
70%
80%
Ap
r-1
9M
ay
-19
Jun
-19
Jul-
19
Au
g-1
9S
ep-1
9O
ct-1
9N
ov
-19
Dec
-19
Jan
-20
Feb
-20
Ma
r-2
0A
pr-
20
Ma
y-2
0Ju
n-2
0Ju
l-2
0A
ug
-20
Sep
-20
Oct
-20
No
v-2
0D
ec-2
0Ja
n-2
1F
eb-2
1M
ar-
21
Indiamart Just Dial TradeIndia.com
Page | 10
IndiaMART InterMESH Ltd : Initiating Coverage
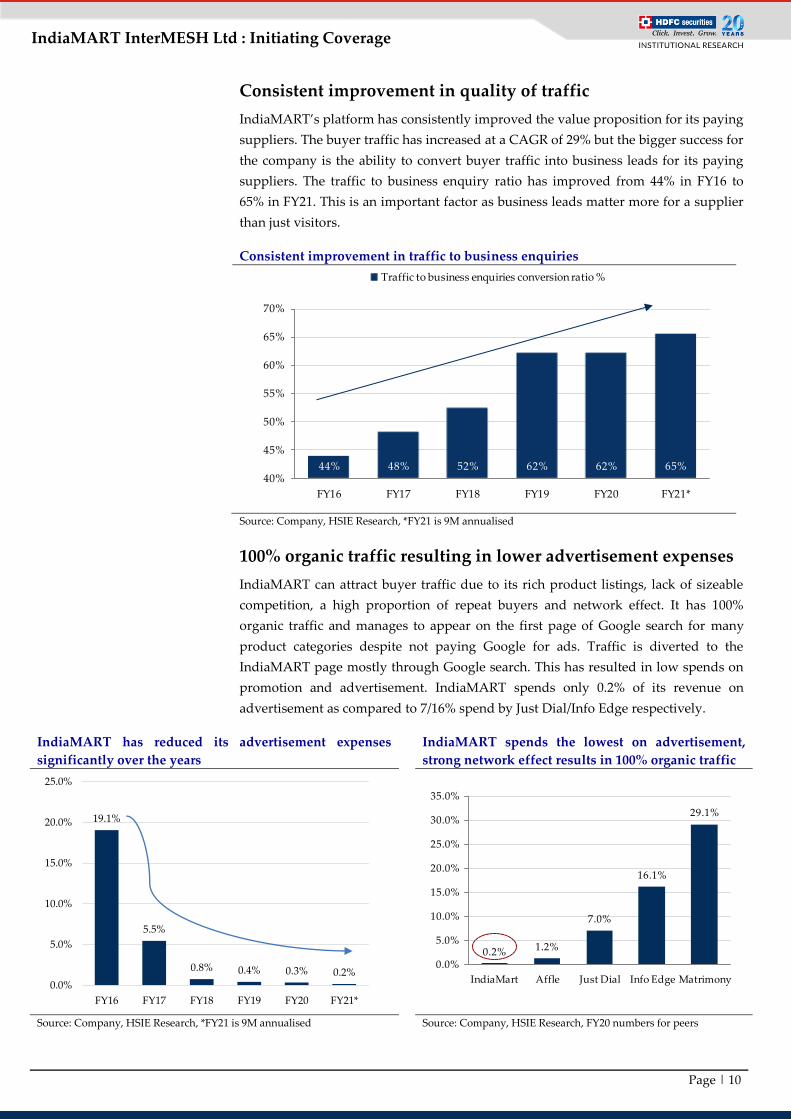
Consistent improvement in quality of traffic
IndiaMART’s platform has consistently improved the value proposition for its paying
suppliers. The buyer traffic has increased at a CAGR of 29% but the bigger success for
the company is the ability to convert buyer traffic into business leads for its paying
suppliers. The traffic to business enquiry ratio has improved from 44% in FY16 to
65% in FY21. This is an important factor as business leads matter more for a supplier
than just visitors.
Consistent improvement in traffic to business enquiries
Source: Company, HSIE Research, *FY21 is 9M annualised
100% organic traffic resulting in lower advertisement expenses
IndiaMART can attract buyer traffic due to its rich product listings, lack of sizeable
competition, a high proportion of repeat buyers and network effect. It has 100%
organic traffic and manages to appear on the first page of Google search for many
product categories despite not paying Google for ads. Traffic is diverted to the
IndiaMART page mostly through Google search. This has resulted in low spends on
promotion and advertisement. IndiaMART spends only 0.2% of its revenue on
advertisement as compared to 7/16% spend by Just Dial/Info Edge respectively.
IndiaMART has reduced its advertisement expenses
significantly over the years
IndiaMART spends the lowest on advertisement,
strong network effect results in 100% organic traffic
Source: Company, HSIE Research, *FY21 is 9M annualised Source: Company, HSIE Research, FY20 numbers for peers
19.1%
5.5%
0.8% 0.4% 0.3% 0.2%0.0%
5.0%
10.0%
15.0%
20.0%
25.0%
FY16 FY17 FY18 FY19 FY20 FY21*
44% 48% 52% 62% 62% 65%40%
45%
50%
55%
60%
65%
70%
FY16 FY17 FY18 FY19 FY20 FY21*
Traffic to business enquiries conversion ratio %
0.2% 1.2%
7.0%
16.1%
29.1%
0.0%
5.0%
10.0%
15.0%
20.0%
25.0%
30.0%
35.0%
IndiaMart Affle Just Dial Info Edge Matrimony
Page | 11
IndiaMART InterMESH Ltd : Initiating Coverage
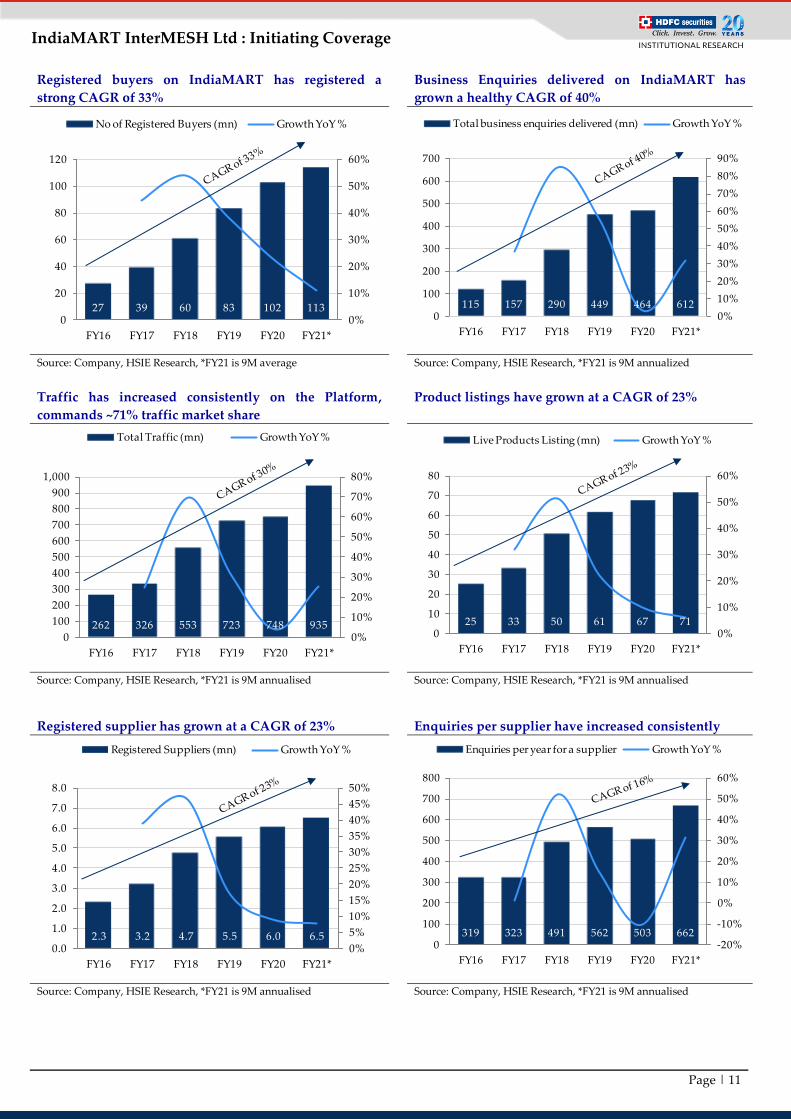
Registered buyers on IndiaMART has registered a
strong CAGR of 33%
Business Enquiries delivered on IndiaMART has
grown a healthy CAGR of 40%
Source: Company, HSIE Research, *FY21 is 9M average Source: Company, HSIE Research, *FY21 is 9M annualized
Traffic has increased consistently on the Platform,
commands ~71% traffic market share
Product listings have grown at a CAGR of 23%
Source: Company, HSIE Research, *FY21 is 9M annualised Source: Company, HSIE Research, *FY21 is 9M annualised
Registered supplier has grown at a CAGR of 23% Enquiries per supplier have increased consistently
Source: Company, HSIE Research, *FY21 is 9M annualised Source: Company, HSIE Research, *FY21 is 9M annualised
27 39 60 83 102 1130%
10%
20%
30%
40%
50%
60%
0
20
40
60
80
100
120
FY16 FY17 FY18 FY19 FY20 FY21*
No of Registered Buyers (mn) Growth YoY %
115 157 290 449 464 6120%
10%
20%
30%
40%
50%
60%
70%
80%
90%
0
100
200
300
400
500
600
700
FY16 FY17 FY18 FY19 FY20 FY21*
Total business enquiries delivered (mn) Growth YoY %
262 326 553 723 748 9350%
10%
20%
30%
40%
50%
60%
70%
80%
0
100
200
300
400
500
600
700
800
900
1,000
FY16 FY17 FY18 FY19 FY20 FY21*
Total Traffic (mn) Growth YoY %
25 33 50 61 67 710%
10%
20%
30%
40%
50%
60%
0
10
20
30
40
50
60
70
80
FY16 FY17 FY18 FY19 FY20 FY21*
Live Products Listing (mn) Growth YoY %
2.3 3.2 4.7 5.5 6.0 6.50%
5%
10%
15%
20%
25%
30%
35%
40%
45%
50%
0.0
1.0
2.0
3.0
4.0
5.0
6.0
7.0
8.0
FY16 FY17 FY18 FY19 FY20 FY21*
Registered Suppliers (mn) Growth YoY %
319 323 491 562 503 662-20%
-10%
0%
10%
20%
30%
40%
50%
60%
0
100
200
300
400
500
600
700
800
FY16 FY17 FY18 FY19 FY20 FY21*
Enquiries per year for a supplier Growth YoY %

Page | 12
IndiaMART InterMESH Ltd : Initiating Coverage
Well diversified across product categories and markets
IndiaMART’s products and services are well-diversified across categories and
geographies. The paying suppliers are well distributed across 50+ categories and the
Top-10 industry categories account for 54% of suppliers. Only eight industry
categories account for more than 5% of paid suppliers. The buyer traffic is fairly
distributed across India, but the sellers are mostly concentrated in the metros (58% of
paying suppliers are from metro cities). There is huge untapped potential in Tier-II
and the Rest of India (~1,000 cities), which will unfold with the shift to digital,
accelerated by the pandemic.
IndiaMART paying suppliers distribution across categories
Buyers evenly spread across India
Paying Suppliers dominant in Metro cities
Source: Company, HSIE Research, Metro - Delhi NCR, Mumbai,
Bangalore, Hyderabad, Kolkata, Ahmedabad, Pune and Chennai, Tier-II
cities - population more than 0.5mn excluding Metros, Rest of India -
1,000+ cities with population less than 0.5mn
Source: Company, HSIE Research
S. No Industry Category % of Paid Suppliers
1 Industrial Plants, Machinery & Equipment 8%
2 Construction & Building Raw Material 7%
3 Apparel, Clothing & Garments 6%
4 Packaging Material, Supplies & Machines 6%
5 Consumer Electronics & Household Appliances 5%
6 Construction Machinery, Building Supplies & Services 5%
7 Industrial & Engineering Products, Spares and Supplies 5%
8 Electrical Equipment and Supplies 5%
9 Mechanical Components & Parts 4%
10 Vegetables, Fruits, Grains, Dairy & Other FMCG & Grocery Items 3%
11 Chemicals, Dyes & Allied Products 3%
12 Furniture, Furniture Supplies & Furniture Hardware 3%
13 Operation Theater, Medical Imaging & Pathology & Hospital Supplies 3%
14 Housewares, Home Appliances, Household Decorations & Consumables 3%
15 Kitchen Containers, Utensils, Stove, Cookware, Tableware & Food Choppers 2%
16 Pharmaceutical Drugs, Medicines, Vitamins & Other Healthcare Products 2%
17 Cosmetics, Toiletries & Personal Care Products 2%
18 Tools, Machine Tools, Power Tools & Hand Tools 2%
19 Fertilizers, Seeds, Agro Machines, Poultry & Animal Husbandry 2%
20 Scientific, Measuring, Laboratory Instruments & Supplies 2%
21 Electronics Components and Supplies 2%
22 Home Furnishings and Home Textiles 1%
23 Sports Goods, Games, Toys & Accessories 1%
24 Automobiles, Spare Parts and Accessories 1%
25 Others 16%
Metro
Cities, 33%
Tier-II
Cities, 26%
Rest of
India, 41%
Metro
Cities, 58%Tier-II
Cities, 27%
Rest of
India, 15%

Page | 13
IndiaMART InterMESH Ltd : Initiating Coverage
Paid Suppliers: ~4x Growth Opportunity IndiaMART has 6.4mn registered suppliers (free + paid) and has clocked a healthy
CAGR of 23%. Out of the total registered suppliers, ~0.15mn are paying suppliers,
resulting in a conversion factor of 2.3%. The conversion factor for IndiaMART is
higher than Just Dial (1.5%) but way lower when compared to 9.2% of 1688.com
(Alibaba B2B platform). With a higher value proposition for the sellers more and
more will be willing to pay for listing services. If we assume a similar conversion
factor (9.2%) for IndiaMART, then the paid suppliers can reach 0.60mn (~4x of
current base).
The factors which will drive conversion are (1) higher ROI for sellers, (2) increase in
business enquiries, (3) higher conversion of RFQs to business, (3) ancillary services
like logistics and inventory management and (4) enhanced customer satisfaction with
efficient matching engine and analytics.
We have compared IndiaMART with 1688.com (Alibaba B2B) on various parameters.
Alibaba B2B fared well on most of the parameters like registered suppliers (1.6x of
IndiaMART), paid suppliers (6.2x), the conversion factor (4x), revenue (22x) and
ARPU (3.6x). However, in terms of buyer traffic, renewal rate, mobile traffic and
penetration IndiaMART stand better than Alibaba B2B.
Alibaba B2B was a pure subscription-based matching platform until 2013. It launched
Cainiao in 2013, the logistics division of 1688.com. With this, Alibaba wanted better
control on logistics for faster delivery and inventory to stop the sale of counterfeit
products. This increased the popularity of the platform and led to growth in paying
suppliers (higher conversions) and higher ARPU (transaction-based model).
IndiaMART vs 1688.com (Alibaba): Increasing conversion factor is the key Comparison IndiaMART 1688.com (Alibaba)
Revenue TTM (USD mn) 89 1,974
4Y CAGR (FY16-20) % 27% 29%
Active Buyers (mn) 119 41
Registered Suppliers (mn) 6.40 10.00
Paid Suppliers (mn) 0.15 0.92
Conversion Factor % 2.3% 9.2%
Revenue/Registered supplier (USD) 14 197
Revenue/Paying supplier (USD) 603 2,145
Revenue/Buyer (USD) 0.7 48
Total Product listings (mn) 71 550
Listings/Supplier 5 3
Mobile Traffic % of Total Traffic 81% 76%
Registered/Active Buyers CAGR 4Y % 39% 22%
Renewal Rate % 80% 69%
Covid Push
Buyers Growth YoY% on the platform 39% 51%
Enquiries/Seller 169 300
MSME Penetration India China
Total Legal Enterprises (mn) 12.7* 25.3
Registered Suppliers on the Platform (Free + Paid) 6.4 10.0
Penetration % 50% 40%
Source: Company, NBS China, Alibaba, 1688.com, HSIE Research, * GST registrations, USD –INR 74

Page | 14
IndiaMART InterMESH Ltd : Initiating Coverage
No of legal enterprises in China has grown at a CAGR of
15.7% during FY12-17, 10Y CAGR of 12% Alibaba B2B revenue CAGR is 29%, IndiaMART has
also clocked a similar level of growth
Source: NBS China, HSIE Research Source: Alibaba, 1688.com, HSIE Research
High sensitivity to conversion factor: 1% increase in conversion
factor leads to 30% increase in EPS
The two most important factors in a subscription-based revenue model is the growth
in paying suppliers and ARPU. The growth in paying suppliers is linked to the
conversion factor, which is a percentage of the free suppliers who are willing to pay.
The RFQs generated on the platform is diverted to paying suppliers and the RFQ
conversion factor ranges from 6-10%.
The conversion factor (free to paid supplier) has a very high sensitivity on earnings;
for a ~100bps increase in conversion factor, the EPS increases by 30%. We have earlier
highlighted the paid suppliers can be 4x of the current size if the conversion factor is
similar to that of Alibaba B2B. However, if we assume that even if we reach 50% of
Alibaba B2B, then also there is a ~60% upside to the FY23E EPS estimate.
EPS sensitivity to ARPU and Conversion Factor (free to paid)
FY23 EPS (Rs)
ARPU YoY Growth %
2.0% 3.0% 4.0% 5.0% 6.0% 7.0% 8.0%
Conversion
Factor %
2.1% 102 103 104 105 106 106 107
2.3% 110 111 112 112 113 114 115
2.5% 117 118 119 120 121 122 123
2.7% 125 126 127 128 129 130 131
2.9% 133 134 135 136 137 138 139
3.1% 140 141 142 143 145 146 147
3.3% 148 149 150 151 152 154 155
Source: HSIE Research
0
5
10
15
20
25
30
20
01
20
02
20
03
20
04
20
05
20
06
20
07
20
08
20
09
20
10
20
11
20
12
20
13
20
14
20
15
20
16
20
17
20
18
20
19
mn
357 373510
645840
1,081
1,445
1,8011974
0%
5%
10%
15%
20%
25%
30%
35%
40%
0
500
1,000
1,500
2,000
2,500
FY
13
FY
14
FY
15
FY
16
FY
17
FY
18
FY
19
FY
20
TT
M
1688.com Revenue Growth YoY%USD
Page | 15
IndiaMART InterMESH Ltd : Initiating Coverage
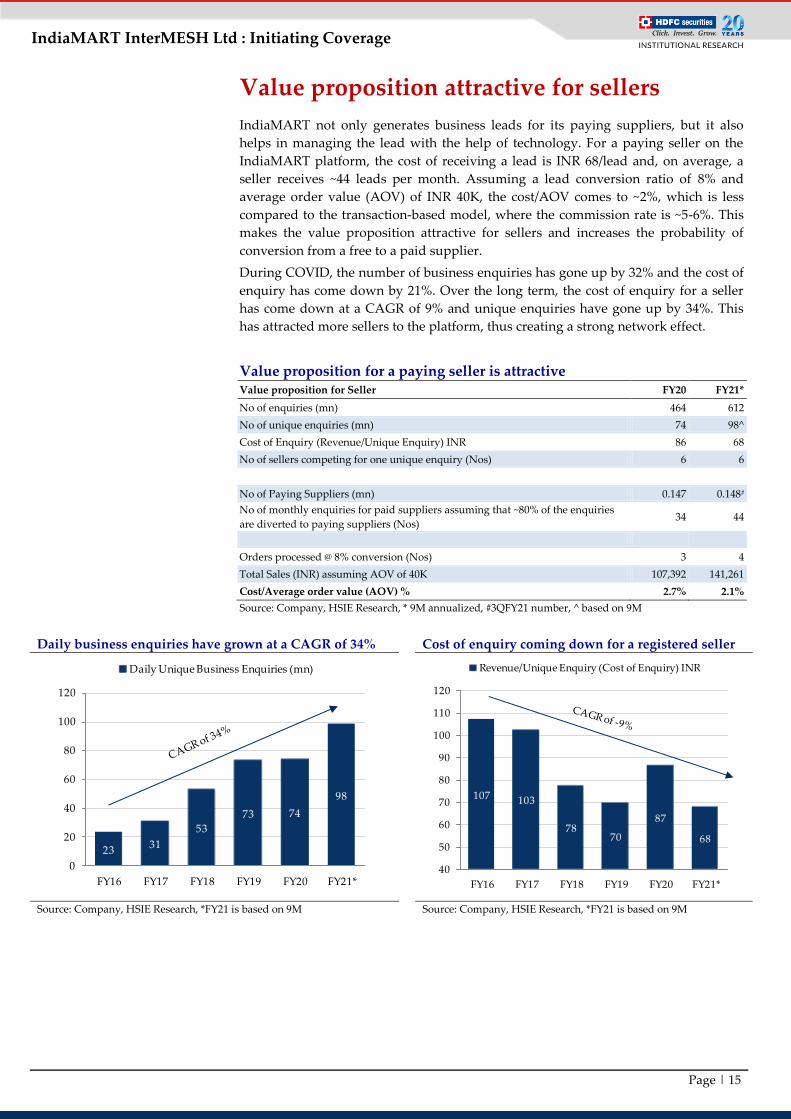
Value proposition attractive for sellers
IndiaMART not only generates business leads for its paying suppliers, but it also
helps in managing the lead with the help of technology. For a paying seller on the
IndiaMART platform, the cost of receiving a lead is INR 68/lead and, on average, a
seller receives ~44 leads per month. Assuming a lead conversion ratio of 8% and
average order value (AOV) of INR 40K, the cost/AOV comes to ~2%, which is less
compared to the transaction-based model, where the commission rate is ~5-6%. This
makes the value proposition attractive for sellers and increases the probability of
conversion from a free to a paid supplier.
During COVID, the number of business enquiries has gone up by 32% and the cost of
enquiry has come down by 21%. Over the long term, the cost of enquiry for a seller
has come down at a CAGR of 9% and unique enquiries have gone up by 34%. This
has attracted more sellers to the platform, thus creating a strong network effect.
Value proposition for a paying seller is attractive
Value proposition for Seller FY20 FY21*
No of enquiries (mn) 464 612
No of unique enquiries (mn) 74 98^
Cost of Enquiry (Revenue/Unique Enquiry) INR 86 68
No of sellers competing for one unique enquiry (Nos) 6 6
No of Paying Suppliers (mn) 0.147 0.148#
No of monthly enquiries for paid suppliers assuming that ~80% of the enquiries
are diverted to paying suppliers (Nos) 34 44
Orders processed @ 8% conversion (Nos) 3 4
Total Sales (INR) assuming AOV of 40K 107,392 141,261
Cost/Average order value (AOV) % 2.7% 2.1%
Source: Company, HSIE Research, * 9M annualized, #3QFY21 number, ^ based on 9M
Daily business enquiries have grown at a CAGR of 34% Cost of enquiry coming down for a registered seller
Source: Company, HSIE Research, *FY21 is based on 9M Source: Company, HSIE Research, *FY21 is based on 9M
107 103
7870
87
68
40
50
60
70
80
90
100
110
120
FY16 FY17 FY18 FY19 FY20 FY21*
Revenue/Unique Enquiry (Cost of Enquiry) INR
2331
53
73 74
98
0
20
40
60
80
100
120
FY16 FY17 FY18 FY19 FY20 FY21*
Daily Unique Business Enquiries (mn)

Page | 16
IndiaMART InterMESH Ltd : Initiating Coverage
Premiumisation: Increases in shift to higher subscription
packages are attractive for a seller and provide a boost to ARPU
The platform is free for buyers, and revenue is generated from suppliers through a
subscription model. There are three different kinds of subscription models -
Platinum, Gold, and Silver - offered on a monthly and annual basis. Out of the total
paying suppliers, ~67/33% of the suppliers are on annual/monthly subscriptions, and
~90% of new suppliers opt for the monthly (silver) package. The seller journey starts
from a silver package and, gradually, it move towards a platinum package. The
sellers’ confidence in the platform increases when they start getting valid business
enquiries (RFQs) and conversions. Finally, when they start generating returns on
their investment, the stickiness increases. This explains the low churn rate of 20% and
higher LTV/CAC ratio of ~10x. The churn in a platinum package is very low (high
single digits) but it gradually increases for the gold and silver packages.
Based on our analysis, the cost of RFQ is ~70% lower for a platinum package vs. a
silver package. The platinum package offers an ROI of 5x, which is ~3.2x better than a
silver package. In terms of breakeven days, the seller on a platinum package recovers
the investment in six days compared to 18 days for a seller on a silver package. This is
assuming that ~20% of the RFQs received are converted to final orders (AOV is INR
35K with a 3% margin). Based on the higher ROI, it makes sense for a seller to move
to an annual package, which drives ARPU growth and increases revenue visibility
(deferred revenue) for IndiaMART.
IndiaMART’s ARPU has grown at a CAGR of 7% and stands at INR 45.9K for
9MFY21. The Top-10 suppliers of IndiaMART, which are ~42% of revenue, generate
an ARPU of INR 178K (~5x of blended ARPU) and non-Top-10 ARPU is INR 25.5K
(~0.7x of blended ARPU). The Top-10 suppliers’ ARPU is growing at double the rate
of non-Top-10, driving blended ARPU growth.
Value proposition improves if a seller moves to a higher subscription package
Value proposition as per package Silver Gold Platinum
Weekly RFQ (One Week Validity) Nos 7 - 10 20 - 30 50 - 100
Daily Unique RFQ (Day Validity) Nos 1 2 4
No of weekly RFQs received in a month (Nos) 28 80 200
No of daily RFQs received in a month (Nos) 30 60 120
Monthly Rate (INR) 3,000 NA NA
Annual Rate (INR) 28,500 55,000 80,000
Package cost/month + GST@18% (INR) 3,540 5,408 7,867
Cost/RFQ (INR) ^ 126 68 39
RFQ conversion % 8% 8% 8%
No of orders processed (Nos) 2 6 16
AOV (INR) 40,000 40,000 40,000
Total order value (INR) 89,600 256,000 640,000
Seller Margin % 3% 3% 3%
Profit made by seller (INR) 2,688 7,680 19,200
ROI (x) 0.8 1.4 2.4
Breakeven days for a supplier (Nos) 40 21 12
Source: Company, HSIE Research, ^ as per weekly RFQ
Page | 17
IndiaMART InterMESH Ltd : Initiating Coverage
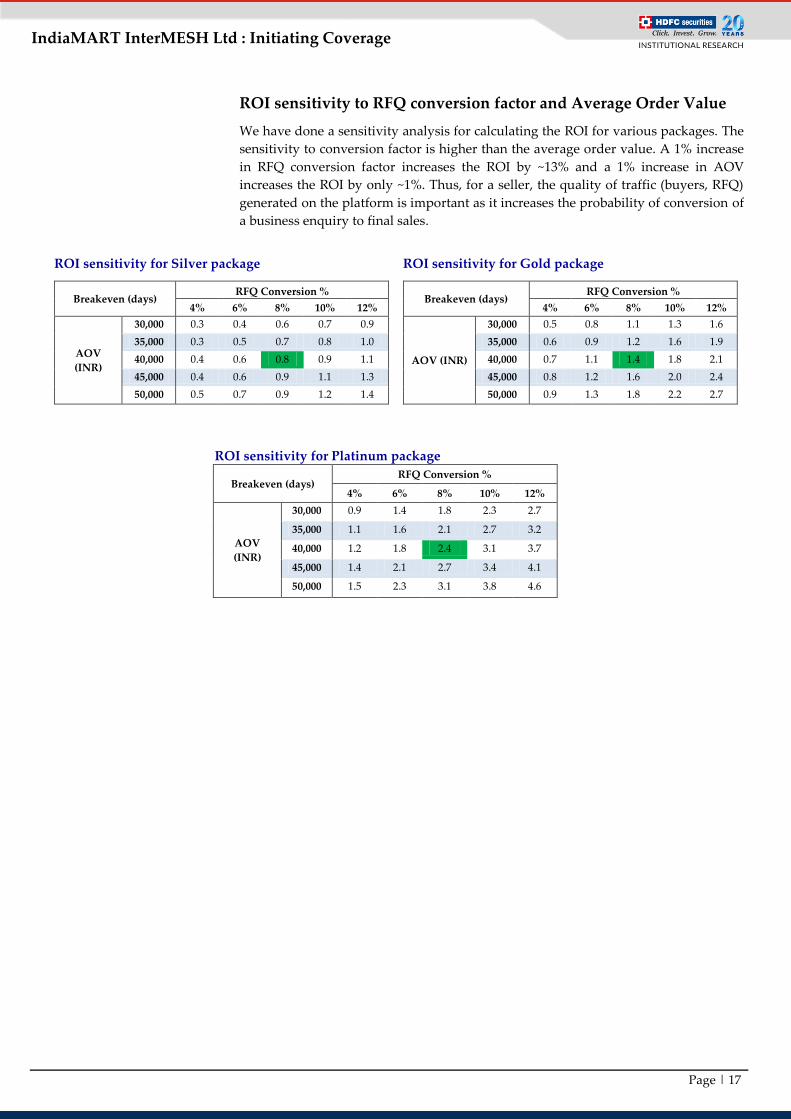
ROI sensitivity to RFQ conversion factor and Average Order Value
We have done a sensitivity analysis for calculating the ROI for various packages. The
sensitivity to conversion factor is higher than the average order value. A 1% increase
in RFQ conversion factor increases the ROI by ~13% and a 1% increase in AOV
increases the ROI by only ~1%. Thus, for a seller, the quality of traffic (buyers, RFQ)
generated on the platform is important as it increases the probability of conversion of
a business enquiry to final sales.
ROI sensitivity for Silver package ROI sensitivity for Gold package
Breakeven (days) RFQ Conversion %
4% 6% 8% 10% 12%
AOV
(INR)
30,000 0.3 0.4 0.6 0.7 0.9
35,000 0.3 0.5 0.7 0.8 1.0
40,000 0.4 0.6 0.8 0.9 1.1
45,000 0.4 0.6 0.9 1.1 1.3
50,000 0.5 0.7 0.9 1.2 1.4
Breakeven (days) RFQ Conversion %
4% 6% 8% 10% 12%
AOV (INR)
30,000 0.5 0.8 1.1 1.3 1.6
35,000 0.6 0.9 1.2 1.6 1.9
40,000 0.7 1.1 1.4 1.8 2.1
45,000 0.8 1.2 1.6 2.0 2.4
50,000 0.9 1.3 1.8 2.2 2.7
ROI sensitivity for Platinum package
Breakeven (days) RFQ Conversion %
4% 6% 8% 10% 12%
AOV
(INR)
30,000 0.9 1.4 1.8 2.3 2.7
35,000 1.1 1.6 2.1 2.7 3.2
40,000 1.2 1.8 2.4 3.1 3.7
45,000 1.4 2.1 2.7 3.4 4.1
50,000 1.5 2.3 3.1 3.8 4.6

Page | 18
IndiaMART InterMESH Ltd : Initiating Coverage
Blended ARPU has grown at a CAGR of 7% Paid Suppliers has grown at a CAGR of 16%
Source: Company, HSIE Research Source: Company, HSIE Research
Top-10 paid suppliers ARPU is 4.2x of Blended ARPU,
indicating a shift to higher subscription packages
Non Top-10 paid suppliers ARPU is 0.7x of Blended
ARPU, comprising of entry-level Silver package
Source: Company, HSIE Research Source: Company, HSIE Research
32,800 32,140
37,24638,373
42,272
45,989
-4%
-2%
0%
2%
4%
6%
8%
10%
12%
14%
16%
18%
25,000
30,000
35,000
40,000
45,000
50,000
FY16 FY17 FY18 FY19 FY20 9MFY21
ARPU (INR) Growth YoY%
72,000
96000
108000
130000
147000 148000
0%
5%
10%
15%
20%
25%
30%
35%
40,000
60,000
80,000
1,00,000
1,20,000
1,40,000
1,60,000
FY16 FY17 FY18 FY19 FY20 3QFY21
Paid Suppliers (Nos) Growth YoY%
1,48,239
1,56,128
1,78,184
3.9
3.9
4.0
4.0
4.1
4.1
4.2
4.2
4.3
1,30,000
1,40,000
1,50,000
1,60,000
1,70,000
1,80,000
1,90,000
FY18 FY19 FY20
ARPU Top 10 suppliers (INR)
Top-10/Blended ARPU (x)
25,762 26,021
28,490
0.67
0.67
0.68
0.68
0.69
0.69
0.70
24,000
25,000
26,000
27,000
28,000
29,000
FY18 FY19 FY20
ARPU Non top-10 Suppliers (INR)
Non Top-10/Blended ARPU (x)

Page | 19
IndiaMART InterMESH Ltd : Initiating Coverage
Prowess in Financial performance IndiaMART has demonstrated exceptional financial performance with consistent
revenue growth and strong expansion in margins. The robust financial performance
has been a result of (1) buyer-centric approach that resulted in an increase in traffic
on the platform, (2) strong value proposition for sellers which leads to pricing power
and growth in paying suppliers with higher conversion, (3) efficient and focused
sales engines leading to optimum cost management, and (4) sprawling network effect
leading to higher value for both buyers and sellers. The revenue has grown at a
CAGR of 27% over FY16-20 and EBITDA has grown from negative INR 1.26bn to
positive INR 1.69bn FY20. Over the past three years, EBITDA is up 7x (~2x in FY21
itself), which is a result of non-linearity and tight control over cost structure during
the pandemic.
Over FY21-23E, we expect the revenue CAGR of 22%, driven by 16/5% CAGR in
paying suppliers/ARPU. The paying supplier growth will be a function of growth in
free suppliers (CAGR of 8%) and increasing conversion factor (2.7% for FY23E).
Revenue growth is healthy, expect momentum to
continue
Growth in paying suppliers has been consistent,
expect conversions to increase to 2.7% in FY23E
Source: Company, HSIE Research Source: Company, HSIE Research
Growth in total suppliers has been healthy, commands
60% market share
ARPU has been consistent, further rise will be led by
a shift to higher duration packages
Source: Company, HSIE Research Source: Company, HSIE Research
2,4583,178
4,105
5,074
6,389 6,679
8,161
9,914
0%
5%
10%
15%
20%
25%
30%
35%
1,000
2,000
3,000
4,000
5,000
6,000
7,000
8,000
9,000
10,000
11,000
FY
16
FY
17
FY
18
FY
19
FY
20
FY
21
E
FY
22
E
FY
23
E
Total Revenue (INR mn) Growth YoY%
0.072
0.0960.108
0.1300.147 0.153
0.177
0.205
2.0%
2.2%
2.4%
2.6%
2.8%
3.0%
3.2%
0.000
0.050
0.100
0.150
0.200
0.250
FY
16
FY
17
FY
18
FY
19
FY
20
FY
21
E
FY
22
E
FY
23
E
Paying Suppliers (mn) Conversion %
2.30
3.20
4.70
5.506.00
6.467.00
7.57
2%
7%
12%
17%
22%
27%
32%
37%
42%
47%
52%
1.00
2.00
3.00
4.00
5.00
6.00
7.00
8.00
FY
16
FY
17
FY
18
FY
19
FY
20
FY
21
E
FY
22
E
FY
23
E
Total Suppliers (mn) Growth YoY%
32,80032,140
37,24638,373
42,272 43,34245,929
48,206
-4%
-2%
0%
2%
4%
6%
8%
10%
12%
14%
16%
18%
25,000
30,000
35,000
40,000
45,000
50,000
55,000
FY
16
FY
17
FY
18
FY
19
FY
20
FY
21
E
FY
22
E
FY
23
E
ARPU (INR) Growth YoY%

Page | 20
IndiaMART InterMESH Ltd : Initiating Coverage
EBITDA growth has been overwhelming, expect 18%
CAGR over FY21-23E
PAT almost doubled in FY21E, will post 15% CAGR
over FY21-23E
Source: Company, HSIE Research Source: Company, HSIE Research
Healthy margin expansion driven by non-linearity, slight
moderation in FY21-23E
The EBITDA margin for IndiaMART expanded by 1500bps from 11.4% in FY18 to
26.4% in FY20 due to a rise in organic traffic, lower spend on advertisement and
embedded non-linearity in the business. The non-linearity can be explained by the
fact that during the period FY18-20, the revenue increased by a CAGR of 25% while
the cost increased by only 14% CAGR.
The cost structure of IndiaMART is flexible due to dependence on outsourced sales
cost and high variable linked sales pay structure. Hence during the pandemic, the
company was able to cut overall cost by ~27% in FY21E led by a 24/29% cut in
employee cost and outsourced employee cost.
We expect the cost structure to increase as the growth returns and we have assumed
the cost to go up by +30/+21% in FY22/23E leading to an EBITDA margin of
45.1/45.5% in FY21/23E respectively.
EBITDA margin has improved significantly driven by non-linearity and cost-
cutting during the pandemic
Source: Company, HSIE Research
-1,256
-544
466823
1,689
3,2403,683
4,508
0%
20%
40%
60%
80%
100%
120%
-2,000
-1,000
0
1,000
2,000
3,000
4,000
5,000
FY
16
FY
17
FY
18
FY
19
FY
20
FY
21
E
FY
22
E
FY
23
E
EBITDA (INR mn) Growth YoY %
-1,245
-451
1,776
8531,474
2,9323,273
3,894
-60%
-40%
-20%
0%
20%
40%
60%
80%
100%
120%
-2,000
-1,000
0
1,000
2,000
3,000
4,000
5,000
FY
16
FY
17
FY
18
FY
19
FY
20
FY
21
E
FY
22
E
FY
23
E
PAT (INR mn) Growth YoY %
-51.1%
-17.1%
11.4%16.2%
26.4%
48.5% 45.1% 45.5%
-60.0%
-40.0%
-20.0%
0.0%
20.0%
40.0%
60.0%
FY16 FY17 FY18 FY19 FY20 FY21E FY22E FY23E
Page | 21
IndiaMART InterMESH Ltd : Initiating Coverage
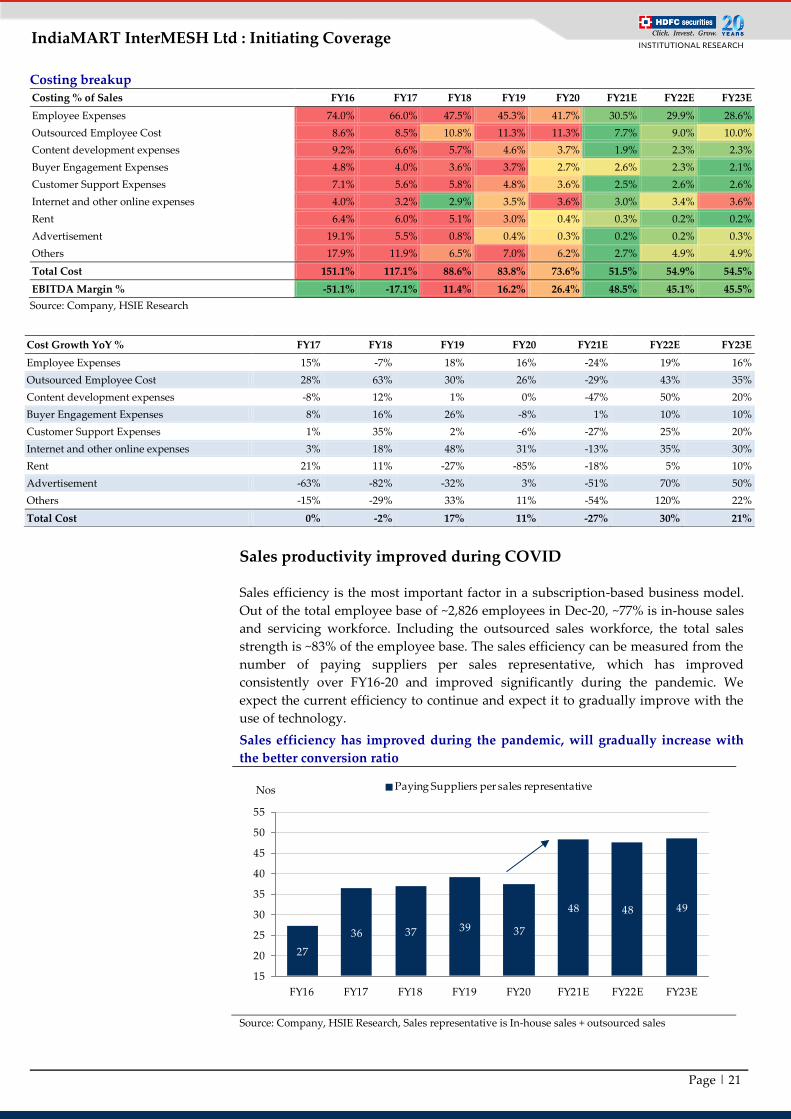
Costing breakup
Costing % of Sales FY16 FY17 FY18 FY19 FY20 FY21E FY22E FY23E
Employee Expenses 74.0% 66.0% 47.5% 45.3% 41.7% 30.5% 29.9% 28.6%
Outsourced Employee Cost 8.6% 8.5% 10.8% 11.3% 11.3% 7.7% 9.0% 10.0%
Content development expenses 9.2% 6.6% 5.7% 4.6% 3.7% 1.9% 2.3% 2.3%
Buyer Engagement Expenses 4.8% 4.0% 3.6% 3.7% 2.7% 2.6% 2.3% 2.1%
Customer Support Expenses 7.1% 5.6% 5.8% 4.8% 3.6% 2.5% 2.6% 2.6%
Internet and other online expenses 4.0% 3.2% 2.9% 3.5% 3.6% 3.0% 3.4% 3.6%
Rent 6.4% 6.0% 5.1% 3.0% 0.4% 0.3% 0.2% 0.2%
Advertisement 19.1% 5.5% 0.8% 0.4% 0.3% 0.2% 0.2% 0.3%
Others 17.9% 11.9% 6.5% 7.0% 6.2% 2.7% 4.9% 4.9%
Total Cost 151.1% 117.1% 88.6% 83.8% 73.6% 51.5% 54.9% 54.5%
EBITDA Margin % -51.1% -17.1% 11.4% 16.2% 26.4% 48.5% 45.1% 45.5%
Source: Company, HSIE Research
Sales productivity improved during COVID
Sales efficiency is the most important factor in a subscription-based business model.
Out of the total employee base of ~2,826 employees in Dec-20, ~77% is in-house sales
and servicing workforce. Including the outsourced sales workforce, the total sales
strength is ~83% of the employee base. The sales efficiency can be measured from the
number of paying suppliers per sales representative, which has improved
consistently over FY16-20 and improved significantly during the pandemic. We
expect the current efficiency to continue and expect it to gradually improve with the
use of technology.
Sales efficiency has improved during the pandemic, will gradually increase with
the better conversion ratio
Source: Company, HSIE Research, Sales representative is In-house sales + outsourced sales
Cost Growth YoY % FY17 FY18 FY19 FY20 FY21E FY22E FY23E
Employee Expenses 15% -7% 18% 16% -24% 19% 16%
Outsourced Employee Cost 28% 63% 30% 26% -29% 43% 35%
Content development expenses -8% 12% 1% 0% -47% 50% 20%
Buyer Engagement Expenses 8% 16% 26% -8% 1% 10% 10%
Customer Support Expenses 1% 35% 2% -6% -27% 25% 20%
Internet and other online expenses 3% 18% 48% 31% -13% 35% 30%
Rent 21% 11% -27% -85% -18% 5% 10%
Advertisement -63% -82% -32% 3% -51% 70% 50%
Others -15% -29% 33% 11% -54% 120% 22%
Total Cost 0% -2% 17% 11% -27% 30% 21%
27
36 37 39 37
48 48 49
15
20
25
30
35
40
45
50
55
FY16 FY17 FY18 FY19 FY20 FY21E FY22E FY23E
Paying Suppliers per sales representativeNos

Page | 22
IndiaMART InterMESH Ltd : Initiating Coverage
IndiaMART employee mix, outsourced sales strength came down sharply during
the pandemic
Source: Company, HSIE Research
Impressive performance during the pandemic The pandemic accelerated the adoption of technology by MSMEs and, as a result, the
traffic of the platform increased (+35% YoY), resulting in higher business enquiries
(+39% YoY) for sellers. The impact of the pandemic was felt in 1QFY21 (revenue
down 10% QoQ) and then the recovery post 1Q has been gradual (+6.6% CQGR). The
major highlight for the company was the expansion in margin achieved during the
9MFY21, which is way ahead of what peers have delivered. The revenue was up 4%
YoY but the EBITDA margin doubled (50% in 9MFY21) during 9MFY21. We expect
some of the cost to increase but, still, expect the EBITDA margin to be in the range of
45-46% for FY22/23E.
Revenue growth during the pandemic for Internet
companies (9MFY21 YoY %)
IndiaMART margin expansion has been significant,
way ahead of peers (9MFY21)
Source: Company, HSIE Research Source: Company, HSIE Research
Sales, 426,
9%
Servicing,
2098, 45%
Product & Tech,
466, 10%
Corporate
, 160, 3%
Others,
157, 3%
Outsourced
Sales, …
FY20
Sales, 371,
10%
Servicing,
1810, 49%Product &
Tech, 463, 12%
Corporate
, 138, 4%
Others,
44, 1%
Outsourced
Sales, 874, 24%Dec-20
2,106 1,942 2,249 2,524 2,231 2,431 2,631
532 9791,067
1,405
9241,274
1,574
668667
746
783
650
670
690
3,3063,588
4,062
4,712
3,805
4,375
4,895
0
500
1,000
1,500
2,000
2,500
3,000
3,500
4,000
4,500
5,000
FY17 FY18 FY19 FY20 FY21E FY22E FY23E
In-house Sales Outsourced Sales Corporate OthersNos
-450 -356-128
253 323
2,465
-1,000
-500
0
500
1,000
1,500
2,000
2,500
3,000
Info
edg
e
Just
dia
l
Aff
le
Ag
gre
ga
te
Ma
trim
on
y
Ind
iaM
art
-30%
-15%-8%
0%
4%
48%
-40%
-30%
-20%
-10%
0%
10%
20%
30%
40%
50%
60%
Just
dia
l
Info
edg
e
Ag
gre
ga
te
Ma
trim
on
y
Ind
iaM
art
Aff
le
bps

Page | 23
IndiaMART InterMESH Ltd : Initiating Coverage
EBITDA margin expansion during the pandemic largely driven by a cut in
employee cost and outsourced sales cost
Source: Company, HSIE Research
IndiaMART margin is almost double compared to peers The cost per employee is almost double of Justdial
Source: Company, HSIE Research Source: Company, HSIE Research
Cash collections have grown at a CAGR of 24% over
FY16-20, impacted in the near term due to pandemic
The current portion of deferred revenue is at 61%,
constant over the last three years
Source: Company, HSIE Research Source: Company, HSIE Research
26.4
48.511.23.6 1.8 0.1 1.1 0.6 0.1
0.23.4
0
10
20
30
40
50
60
FY
20
Em
plo
yee
Ex
pen
ses
Ou
tso
urc
ed
Em
plo
yee
Co
st
Co
nte
nt
dev
elo
pm
ent
Bu
yer
En
ga
gem
ent
Cu
sto
mer
Su
pp
ort
Inte
rnet
ex
pen
ses
Ren
t
Ad
ver
tise
men
t
Oth
ers
FY
21
(%)
2,87,5223,81,207
6,85,480
11,04,530
14,53,140
0
2,00,000
4,00,000
6,00,000
8,00,000
10,00,000
12,00,000
14,00,000
16,00,000
Ma
trim
on
y
Just
Dia
l
Ind
iam
art
Info
Ed
ge
Aff
le
INR
18%
24% 25% 28%
50%
0%
10%
20%
30%
40%
50%
60%
Ma
trim
on
y
Just
dia
l
Aff
le
Info
edg
e
Ind
iaM
art
3,150
3,862
5,095
6,720
7,378
6,453
-20%
-10%
0%
10%
20%
30%
40%
1,000
2,000
3,000
4,000
5,000
6,000
7,000
8,000
FY
16
FY
17
FY
18
FY
19
FY
20
TT
M
Cash collection from customers (INR mn)
Growth YoY %Non
Current %,
39%
Current %,
61%

Page | 24
IndiaMART InterMESH Ltd : Initiating Coverage
Robust balance sheet position and excellent cash generation
Capex is less than 1% of revenue vs. an average of ~3%
for Internet companies
OCF generation has improved significantly and
OCF/EBITDA will stand at ~100% over FY21-23E
Source: Company, HSIE Research Source: Company, HSIE Research
FCF generation is healthy, aided by lower Capex
requirements
RoE is healthy at 68% for FY20 but will decline over
FY21-23E due to lower payout
Source: Company, HSIE Research Source: Company, HSIE Research, RoE % for FY21-23E is calculated
ex of QIP money
53.4%
67.8%
57.5%
51.1%
42.0%
20.0%
30.0%
40.0%
50.0%
60.0%
70.0%
80.0%F
Y19
FY
20
FY
21E
FY
22E
FY
23E
3.0%
0.8%
0.5%
1.0%
0.7% 0.8%0.9% 0.9%
0.0%
0.5%
1.0%
1.5%
2.0%
2.5%
3.0%
3.5%
FY
16
FY
17
FY
18
FY
19
FY
20
FY
21
E
FY
22
E
FY
23
E-555
-6
1,791
2,551 2,606 2,526
4,103
4,933
0%
50%
100%
150%
200%
250%
300%
350%
400%
450%
-1,000
0
1,000
2,000
3,000
4,000
5,000
6,000
FY
16
FY
17
FY
18
FY
19
FY
20
FY
21
E
FY
22
E
FY
23
E
OCF (INR mn) OCF/EBITDA %
-629-33
1,769
2,500 2,561 2,476
4,030
4,844
0%
10%
20%
30%
40%
50%
60%
-1,000
0
1,000
2,000
3,000
4,000
5,000
6,000
FY
16
FY
17
FY
18
FY
19
FY
20
FY
21
E
FY
22
E
FY
23
E
FCF (INR mn) FCF/Sales %

Page | 25
IndiaMART InterMESH Ltd : Initiating Coverage
India Internet comparison across various parameters
Source: Company, HSIE Research, FY21 is 9MFY21 annualised for all except IndiaMART, Payout includes buyback and dividend, * 6MFY21 figure
for Justdial, Matrimony, Infoedge is 9M and Affle is FY20, IndiaMart as per our estimate
Parameters India Internet
IndiaMART Just Dial Info Edge Affle Matrimony
Revenue CAGR % 3Y (FY18-21) 17.6% -4.5% 9.4% 44.5% 4.3%
Revenue INR bn (FY21) 6.68 6.80 12.00 5.05 3.81
EBITDA Margin % (FY21) 48.5% 24.1% 24.5% 25.2% 18.4%
PAT INR bn (FY21) 2.93 2.29 2.72 1.00 0.44
PAT CAGR % 3Y (FY18-21) 75.0% 16.9% 14.3% 53.4% -16.0%
Advertising expenses % (FY20) 0.3% 7.0% 16.1% 1.2% 29.1%
Market Cap INR bn 240.02 53.13 611.70 134.11 21.74
P/S FY20 (x) 36 8 51 27 6
FY21 P/E (x) 78 24 198 132 49
Asset Turns FY20 (x) 7.5 5.6 9.9 71.4 2.9
Goodwill & Intangibles % of Total Assets 0.0% 0.1% 0.1% 40.7% 0.8%
Du Point Analysis (FY20)
Profit Margin % 23.1% 28.6% 16.2% 19.6% 7.9%
Asset Turnover (x) 0.6 0.5 0.4 0.8 0.9
Leveraging Factor (x) 5.2 1.6 1.3 2.7 1.9
RoE % 67.8% 23.8% 8.6% 43.5% 13.7%
OCF/EBITDA % 154% 56% 75% 83% 105%
FCF/PAT % 174% 55% 135% 64% 154%
Capex % of Revenue 0.7% 0.2% 1.9% 9.3% 3.1%
Total Payout INR 3Y average mn 227 1651 549 0 41
Total Payout/OCF 3Y average (%) 8.9% 102.1% 21.3% 0.0% 6.6%
Total Payout/FCF 3Y average (%) 9.0% 107.3% 23.0% 0.0% 8.7%
Total Payout/Net Profit 3Y average (%) 14.8% 69.9% 21.7% 0.0% 10.7%
Subscribers 3Y CAGR % (FY18-21) 12.3% 1.3% 7.0% 39.5% 3.1%
ARPU 3Y CAGR % (FY18-21) 5.2% -5.7% 3.6% 10.9% 1.4%
Traffic 3Y CAGR (FY18-21) 19.2% 4.5% NM NM NA
Deferred Revenue 3Y CAGR (FY18-21) 16.2% 7.0% 11.4% 32.9% 5.9%
Net Cash & Cash Eq (INR mn)* 22,443 14,281 33,204 627 2,527
Net Cash % of Net Worth (FY20) 140% 124% 88% 27% 103%
Net Cash % of Total Assets (FY20) 92% 87% 69% 16% 58%
Net Cash % of Market Cap 9% 27% 5% 0% 12%
Page | 26
IndiaMART InterMESH Ltd : Initiating Coverage
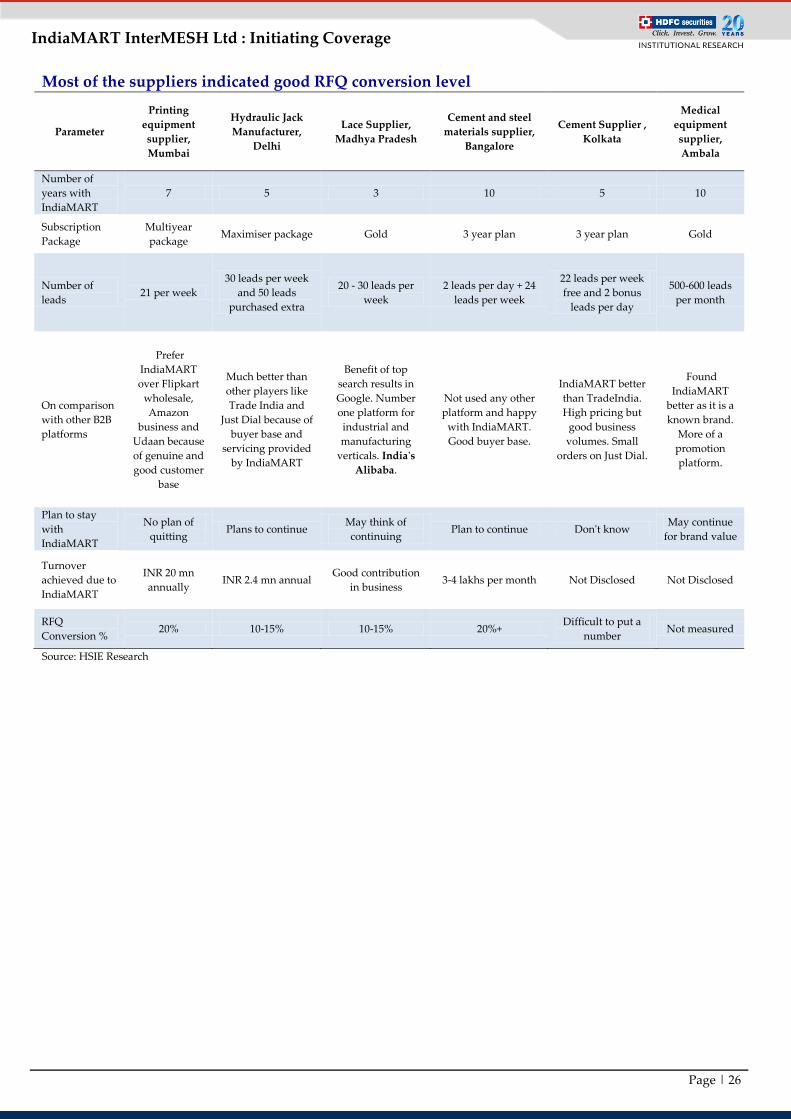
Most of the suppliers indicated good RFQ conversion level
Parameter
Printing
equipment
supplier,
Mumbai
Hydraulic Jack
Manufacturer,
Delhi
Lace Supplier,
Madhya Pradesh
Cement and steel
materials supplier,
Bangalore
Cement Supplier ,
Kolkata
Medical
equipment
supplier,
Ambala
Number of
years with
IndiaMART
7 5 3 10 5 10
Subscription
Package
Multiyear
package Maximiser package Gold 3 year plan 3 year plan Gold
Number of
leads 21 per week
30 leads per week
and 50 leads
purchased extra
20 - 30 leads per
week
2 leads per day + 24
leads per week
22 leads per week
free and 2 bonus
leads per day
500-600 leads
per month
On comparison
with other B2B
platforms
Prefer
IndiaMART
over Flipkart
wholesale,
Amazon
business and
Udaan because
of genuine and
good customer
base
Much better than
other players like
Trade India and
Just Dial because of
buyer base and
servicing provided
by IndiaMART
Benefit of top
search results in
Google. Number
one platform for
industrial and
manufacturing
verticals. India's
Alibaba.
Not used any other
platform and happy
with IndiaMART.
Good buyer base.
IndiaMART better
than TradeIndia.
High pricing but
good business
volumes. Small
orders on Just Dial.
Found
IndiaMART
better as it is a
known brand.
More of a
promotion
platform.
Plan to stay
with
IndiaMART
No plan of
quitting Plans to continue
May think of
continuing Plan to continue Don't know
May continue
for brand value
Turnover
achieved due to
IndiaMART
INR 20 mn
annually INR 2.4 mn annual
Good contribution
in business 3-4 lakhs per month Not Disclosed Not Disclosed
RFQ
Conversion % 20% 10-15% 10-15% 20%+
Difficult to put a
number Not measured
Source: HSIE Research

Page | 27
IndiaMART InterMESH Ltd : Initiating Coverage
Company Background IndiaMART InterMESH Ltd is India's largest online B2B marketplace with ~60%
market share. It provides a two-way discovery platform for buyers and sellers. It has
a diversified product catalogue (71mn products) across 99,000 categories in 56
industries. The traffic on the platform is 100% organic, with 81% of it flowing through
mobile, and with negligible spending on advertising (0.2% of revenue). IndiaMART
has a strong buyer base of 119mn registered buyers and 6.4mn registered suppliers,
with 59% repeat buyers, and 37% of the suppliers acting as buyers. The platform is
free for the buyers while the company generates revenue through a subscription-
based revenue model, offering monthly and yearly packages. The number of paying
suppliers/buyers has increased at a CAGR of 15%/33% over the past five years. The
company expects to add ~5,000 suppliers per quarter in the near to medium term. The
top-10 platinum customers contribute ~42% of the revenue.
IndiaMART’s platform serves as an ROI driven value proposition for the sellers,
thereby acting as a catalyst to leverage the benefits of a strong network effect. Steady
price increases and upselling the higher duration premium packages would be the
driving factors behind the growth in ARPU. IndiaMART plans to continue with a
subscription-based model with an asset-light balance sheet. The fresh QIP issue of
1,070 Cr made in February 2021 will be used to make strategic investments or
acquisitions to complement its existing service offerings. For instance, because of
providing an end-to-end value chain, IndiaMART, via strategic investments, intends
to be a logistics aggregator and, in partnerships with NBFCs or banks, intends to
provide transaction financing to buyers.
Board Composition and Key Management Personnel Board of
Directors Designation Qualification Previous Experience
Mr. Dinesh
Chandra Agarwal
Managing Director &
CEO
B.Tech (Computer Science &
Engineering)
Hindustan Management and Technical Services Private Limited, HCL
America, Inc., HCL Limited, HCL Hewlett-Packard Limited, Centre for
Development of Telematics (C-Dot) and CMC Limited
Mr. Brijesh
Kumar Agrawal Whole-Time Director PGD (Business Management) H N Miebach Logistics India Private Limited
Mr. Dhruv
Prakash
Non-Executive
Director
Master’s Degree - Science
(Chemistry)
PGD (Business Management)
Korn/Ferry International Private Limited, Helion Ventures Private
Limited, Hewitt Associates (India) Private Limited, Amar Dye-Chem
Limited, DCM Toyota Limited, Hindustan Reprographics Limited and
Escorts Limited
Ms. Elizabeth
Lucy Chapman
Non-Executive -
Independent Director
Bachelor’s Degree - Science,
CFA
DBS Bank Limited, Goldman Sachs International, The Welcome Trust
Limited and Nahar Credits Private Limited
Mr. Vivek
Narayan Gour
Non-Executive -
Independent Director
B.Com, MBA,
President Management
Programme – HBS
First Leasing Company of India Limited, Infrastructure Leasing &
Financial Services Limited, Tata Finance Limited, Genpact India and
GE Capital Services India
Managing Director - Air Works MRO Services Private Limited and Air
Works India (Engineering) Private Limited
Source: Company, HSIE Research
Key Managerial Personnel Designation Qualification Previous Experience
Mr. Dinesh Chandra Agarwal Managing Director & CEO B.Tech (Computer Science &
Engineering)
Hindustan Management and Technical Services
Private Limited, HCL America, Inc., HCL Limited,
HCL Hewlett-Packard Limited, Centre for
Development of Telematics (C-Dot) and CMC
Limited
Mr. Brijesh Kumar Agrawal Whole-Time Director PGD (Business Management) H N Miebach Logistics India Private Limited
Mr. Prateek Chandra CFO B.Com, Chartered Accountant exl Service.com (I) Private Limited, Bharat S Raut &
Co., Chartered Accountants and HT Media Limited
Mr. Manoj Bhargava SVP - Legal & Secretarial,
CS & Compliance Officer
B.Com, Law
CS, PGD- IP Law, PGD - Cyber
Laws
Capital Cars Private Limited, Integrated Databases
India Limited (India Today group), Barista Coffee
Company Limited, Varun Beverages Limited and HT
Media Limited
Source: Company, HSIE Research

Page | 28
IndiaMART InterMESH Ltd : Initiating Coverage
Technology Timeline
Year Technology / Features Added
2009 Request for Quotation – Buy Lead
2010 Cloud Telephony – PNS
2013 Price Discovery
2015 Behavioral Matchmaking
2017 Payment Program Protection
2018 CRM – Lead Manager
2019 Mobile Accounting & Tax Invoicing (Vyapar)
2019 Voice and MultiLanguage Search
2019 Order Management System (Pooraa)
2020 Distribution Management System & SFA (Bizom)
2020 Supplier Reviews & Ratings
Subsidiary / Associates
Subsidiary /
Associates
Holding/
Subsidiary/
Associate
% of
shares
Held
Description
Revenue
FY20
(mn)
PAT
FY20
(mn)
Tolexo Online
Private Limited
(TOPL)
Wholly owned
Subsidiary 100%
TOPL operates a business process software referred to as “Pooraa”.
Pooraa provides businesses with an easy-to-use software based system
for catalog management, pricing management, customer management,
inventory management, analytics and reporting, order management,
invoicing, payment reminders and tally integration. Revenue is
generated through the sale of subscription packages for availing such
services. As of December 31, 2020, Pooraa had 117 paying subscription
suppliers.
3.04 -68.76
Pay With
IndiaMART
Private Limited
(PWIPL)
Wholly owned
Subsidiary 100%
PWIPL is engaged in the business of electronic payment facilitation
mechanisms through internet based solutions and products, financial
intermediation and services in connection with electronic payments and
receipts, products, technologies, markets.
29.27 -2.56
Tradezeal
International
Private Limited
(TIPL)
Wholly owned
Subsidiary 100%
TIPL is currently not actively engaged in any business; however, it is
authorized to engage in the business of investment, acquire, hold and
deal in those shares, stocks, debentures, debenture stock, bonds,
obligation or securities of companies or partnership firms or body
corporates or any other entities whether in India or elsewhere
NA NA
Hello Trade
Online Private
Limited
(HTOPL)
Wholly owned
Subsidiary 100%
HTOPL is currently not actively engaged in any business; however, it is
authorized to engage in conducting domestic trade and international
business facilitation, including sales, marketing, operational,
technological, information processing and other trade and business
related services
NA NA
Ten Times
Online Private
Limited
(TTOPL)*
Associate 30%
TTOPL operates an online platform “Ten Times” (www.10times.com)
for business events discovery and networking. The Ten Times platform
also enables businesses to create, manage and host virtual events.
Organizers’ events, such as exhibitions and trade shows in India and
abroad. It earns revenue through marketing fees as well as subscription
fees for hosting events on its virtual platform.
128.28 8.81
Simply Vyapar
Apps Private
Limited (Vyapar)
Associate 26%
Vyapar is a mobile based accounting software that automates billing
and accounting processes. Vyapar helps businesses to handle their
business and operational processes. Vyapar generates revenue through
subscription packages. As of December 31, 2020, Vyapar had 74,912
paying subscription suppliers
56.05 -54.22
Mobisy
Technologies
Private Limited
(MTPL)
Investment 9%
MTPL owns Bizom, a sales force automation and distributor
management system software. Bizom facilitates businesses with
business and operational processes, such as order management,
distributor management, claims management, retail execution and
merchandising, asset management, task and lead management, service
representative management and attendance management
NA NA
Legistify Services
Private Limited
(LSPL)^
Investment 11%
LSPL, via its flagship product Legistrak, offers a SaaS based ERP tool,
which allows enterprises to manage their legal workflows. Some of the
key features of the Legistrak tool are - Litigation Tracking, Notices
Management, Legal Vendor Management, etc.
17.3 NA
Source: Company, HSIE Research

Page | 29
IndiaMART InterMESH Ltd : Initiating Coverage
Valuation and recommendation We initiate coverage on IndiaMART with a DCF derived base case fair value of INR
9,400, implying a P/E and EV/EBITDA multiple of 73x and 58x on FY23E estimates,
translating into 19% upside. Our long-term estimate assumes a revenue CAGR of
19% over FY21-30E vs. a historical average of 27%. The growth estimates are
reasonable, given the huge opportunity in paid suppliers’ growth (~4x of current
level) and scope for ARPU improvement (premiumisation). The EBITDA margin can
sustain at 45% over FY22-23E, post doubling in FY21E. We expect
revenue/EBITDA/EPS CAGR of +22/18/15 over FY21-23E.
The derived target EV/EBITDA multiple of 58x is ~1.4x the historical average and is
supported by (1) +21/+15% revenue/EPS CAGR over FY21-25E, following an
outperformance in FY21E (EPS doubled in FY21E), (2) industry leading margin
profile (double of Just Dial), (3) embedded non-linearity in the business, (4) 100%
organic traffic resulting in lowest spend on advertisement, (5) pricing power (~70%
higher than competition), (6) ~60% market share in B2B classified market, (7) low risk
of disruption from Big Tech, (7) asset-light business model (Capex is ~1% of revenue)
and (8) high cash generation (OCF/EBITDA of 154%).
There is no direct comparable for IndiaMART but we can compare it to Just Dial
(B2C) and Infoedge (Naukri) among listed peers in India. IndiaMART trades at a P/E
and EV/EBITDA of 61.5x and 46.1x FY23E, which is at a significant premium to its
peers. Infoedge trades at a standalone EV/EBITDA of ~56x FY23E, which is at a 20%
premium to IndiaMart. Based on reverse DCF, at CMP the company is factoring in a
growth of 17.8% over FY21-30E.
Valuation Scenarios
Bear Case Base Case Bull Case
Paid Suppliers CAGR (FY21-25E) 11% 15% 20%
ARPU CAGR (FY21-25E) 3% 5% 6%
Revenue CAGR (FY21-25E) 14% 21% 27%
EBIT CAGR (FY21-25E) 13% 20% 26%
APAT CAGR (FY21-25E) 10% 15% 21%
Revenue FY21-30E 15% 19% 22%
EBIT CAGR FY21-30E 16% 19% 22%
FCF CAGR FY21-30E 19% 23% 26%
FY23E EPS 115 128 140
TP (Rs) 7,025 9,400 11,500
Upside % -11% 19% 46%
Source: Company, HSIE Research
DCF Assumptions
DCF Assumptions
RFR 6%
Terminal growth rate (%) 4%
Market Premium 6%
PV (ex-Terminal) INR mn 91,615
Beta 0.7
PV (Terminal) INR mn 171,494
Cost of Debt (%) NA
Cash & Cash Eq INR mn* 22,443
Debt (mn) 0
Shares (mn) 30.4
WACC (%) 10%
TP (INR) 9,400
Source: Company, HSIE Research, * includes QIP of INR 10.7bn raised in Feb-21
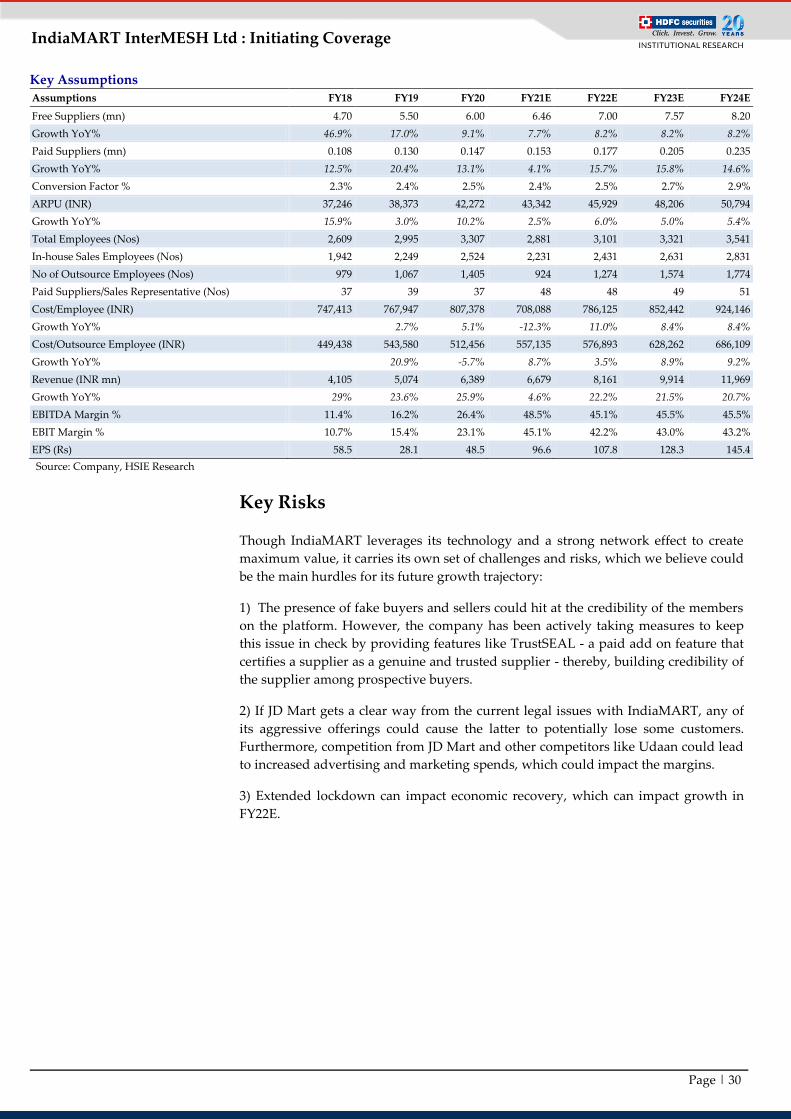
Page | 30
IndiaMART InterMESH Ltd : Initiating Coverage
Key Assumptions
Assumptions FY18 FY19 FY20 FY21E FY22E FY23E FY24E
Free Suppliers (mn) 4.70 5.50 6.00 6.46 7.00 7.57 8.20
Growth YoY% 46.9% 17.0% 9.1% 7.7% 8.2% 8.2% 8.2%
Paid Suppliers (mn) 0.108 0.130 0.147 0.153 0.177 0.205 0.235
Growth YoY% 12.5% 20.4% 13.1% 4.1% 15.7% 15.8% 14.6%
Conversion Factor % 2.3% 2.4% 2.5% 2.4% 2.5% 2.7% 2.9%
ARPU (INR) 37,246 38,373 42,272 43,342 45,929 48,206 50,794
Growth YoY% 15.9% 3.0% 10.2% 2.5% 6.0% 5.0% 5.4%
Total Employees (Nos) 2,609 2,995 3,307 2,881 3,101 3,321 3,541
In-house Sales Employees (Nos) 1,942 2,249 2,524 2,231 2,431 2,631 2,831
No of Outsource Employees (Nos) 979 1,067 1,405 924 1,274 1,574 1,774
Paid Suppliers/Sales Representative (Nos) 37 39 37 48 48 49 51
Cost/Employee (INR) 747,413 767,947 807,378 708,088 786,125 852,442 924,146
Growth YoY%
2.7% 5.1% -12.3% 11.0% 8.4% 8.4%
Cost/Outsource Employee (INR) 449,438 543,580 512,456 557,135 576,893 628,262 686,109
Growth YoY%
20.9% -5.7% 8.7% 3.5% 8.9% 9.2%
Revenue (INR mn) 4,105 5,074 6,389 6,679 8,161 9,914 11,969
Growth YoY% 29% 23.6% 25.9% 4.6% 22.2% 21.5% 20.7%
EBITDA Margin % 11.4% 16.2% 26.4% 48.5% 45.1% 45.5% 45.5%
EBIT Margin % 10.7% 15.4% 23.1% 45.1% 42.2% 43.0% 43.2%
EPS (Rs) 58.5 28.1 48.5 96.6 107.8 128.3 145.4
Source: Company, HSIE Research
Key Risks
Though IndiaMART leverages its technology and a strong network effect to create
maximum value, it carries its own set of challenges and risks, which we believe could
be the main hurdles for its future growth trajectory:
1) The presence of fake buyers and sellers could hit at the credibility of the members
on the platform. However, the company has been actively taking measures to keep
this issue in check by providing features like TrustSEAL - a paid add on feature that
certifies a supplier as a genuine and trusted supplier - thereby, building credibility of
the supplier among prospective buyers.
2) If JD Mart gets a clear way from the current legal issues with IndiaMART, any of
its aggressive offerings could cause the latter to potentially lose some customers.
Furthermore, competition from JD Mart and other competitors like Udaan could lead
to increased advertising and marketing spends, which could impact the margins.
3) Extended lockdown can impact economic recovery, which can impact growth in
FY22E.

Page | 31
IndiaMART InterMESH Ltd : Initiating Coverage
Peer Valuation
Company Country MCap
(Rs bn)
EV/EBITDA (x) P/E (x) P/S (x) ROE (%) Rev
CAGR%
FY21-23
EPS
CAGR%
FY21-23 FY20 FY21E FY22E FY23E FY20 FY21E FY22E FY23E FY20 FY21E FY22E FY23E FY20 FY21E FY22E FY23E
IndiaMART Intermesh India 240 136.5 67.0 57.8 46.1 162.4 81.7 73.1 61.5 37.5 35.8 29.3 24.1 67.8 57.5 51.1 42.0 21.8 15.2
Just Dial India 53 19.2 32 24.3 19.3 20.5 24.2 23.8 19.3 5.6 7.8 6.3 5.6 23.8 16.5 16.0 18.1 18.0 11.9
Affle India India 134 152.4 105.1 82.1 62.5 200.5 131.8 107 81.7 40.0 26.4 20.7 16.0 43.5 34.4 30.3 29.3 28.6 27.0
Matrimony.Com India 22 35.8 27.9 20.7 17 72.3 49.0 34.9 27.5 5.8 5.6 4.9 4.4 13.7 17.6 21.3 22.9 12.9 33.6
Info Edge India India 612 159.1 201.5 134.2 117 NM 198.3 151.1 138.1 46.6 51.0 41.0 35.5 NM 4.0 10.8 16.0 19.9 19.8
India Internet Median 136.5 67.0 57.8 46.1 117.4 81.7 73.1 61.5 37.5 26.4 20.7 16.0 23.8 17.6 21.3 22.9 19.9 19.8
Company Country MCap
(USD bn)
EV/EBITDA (x) P/E (x) P/S (x) ROE (%) Rev
CAGR%
FY21-23
EPS
CAGR%
FY21-23 FY20 FY21E FY22E FY23E FY20 FY21E FY22E FY23E FY20 FY21E FY22E FY23E FY20 FY21E FY22E FY23E
Yandex Russia 22 29.4 36.5 31.0 20.6 102.6 59.8 67.3 38.7 8.2 7.3 5.2 3.8 6.9 9.8 7.0 11.3 37.7 24.4
Ebay Inc USA 42 18.7 13.3 11.2 10.3 29.6 7.8 15.3 13.5 4.9 4.1 3.5 3.3 39.0 176.2 71.8 217.5 11.9 NM
Costar Group USA 35 68.0 73.2 49.6 39.5 101.6 147.6 80.2 61.6 24.8 20.9 17.9 15.4 9.8 5.2 7.9 9.5 16.5 54.8
Zillow Group USA 35 NM 198.1 64.8 50.1 NM NM 164.8 110.3 12.8 10.5 6.4 4.4 (9.1) (4.0) (2.7) (4.9) 55.2 NM
Jd.Com China 125 42.5 42.0 28.8 19.6 66.2 16.9 39.5 29.3 1.5 1.2 0.9 0.7 17.2 36.7 9.8 11.6 26.5 NM
Mercadolibre Argentina 79 NM 281.2 419.2 159.1 NM NM 1720.4 427.9 34.3 19.8 13.4 9.6 (14.2) (0.0) 3.8 12.3 43.9 NM
Ww Grainger USA 21 14.8 18.2 14.0 12.6 26.0 31.0 21.6 19.0 1.8 1.8 1.7 1.6 44.6 37.4 48.2 50.1 5.8 27.7
E-Commerce +
Classifieds Median 29.4 42.0 31.0 20.6 66.2 31.0 67.3 38.7 8.2 7.3 5.2 3.8 9.8 9.8 7.9 11.6 26.5 27.7
Company Country MCap
(USD bn)
EV/EBITDA (x) P/E (x) P/S (x) ROE (%) $ Rev
CAGR%
FY21-23
EPS
CAGR%
FY21-23 FY20 FY21E FY22E FY23E FY20 FY21E FY22E FY23E FY20 FY21E FY22E FY23E FY20 FY21E FY22E FY23E
Google USA 1,527 29.6 24.8 17.0 14.4 NM NM 28.6 24.6 9.4 8.4 8.2 7.0 18.1 19.0 20.4 20.4 9.4 NM
Facebook USA 886 27.1 20.4 15.5 12.9 48.0 30.5 25.5 21.8 12.5 10.3 8.2 6.9 20.0 25.4 22.9 21.5 22.3 18.2
Baidu China 76 16.1 19.2 14.1 11.6 254.3 22.5 21.7 17.7 4.9 4.9 3.9 3.4 1.3 13.0 10.2 11.1 19.3 12.7
Twitter USA 57 54.7 75.3 36.5 28.7 37.4 NM 77.8 59.6 16.4 15.3 11.8 9.7 18.9 (13.6) 7.6 10.0 25.4 NM
Amazon USA 1,691 42.7 32.1 24.1 19.5 143.1 78.8 56.1 42.5 6.0 4.4 3.6 3.0 21.9 27.4 24.1 24.8 20.1 36.1
Alibaba China 603 38.1 26.7 17.2 14.2 43.9 27.2 21.8 19.2 10.7 8.2 5.6 4.3 20.4 23.9 19.2 17.1 38.8 19.2
Big Tech Median 33.9 25.8 17.1 14.3 48.0 28.8 27.0 23.2 10.1 8.3 6.9 5.6 19.4 21.5 19.8 18.8 21.2 18.7
Source: Company, HSIE Research, Bloomberg estimates except for IndiaMART
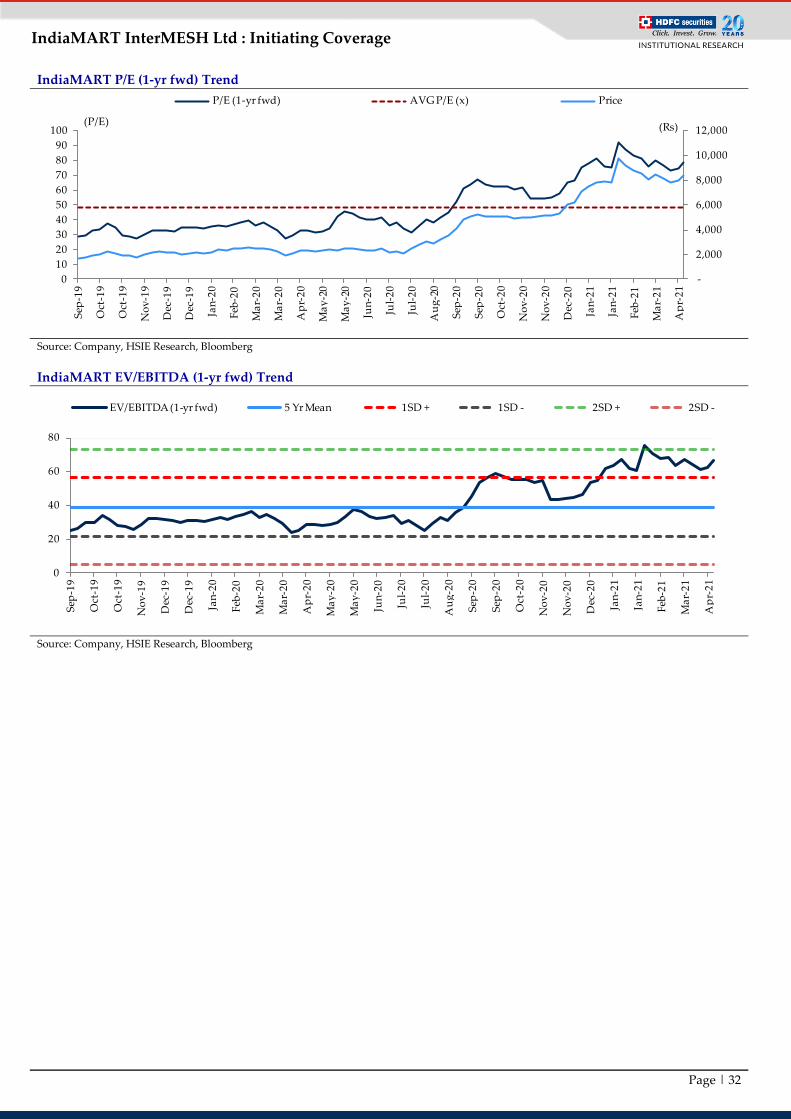
Page | 32
IndiaMART InterMESH Ltd : Initiating Coverage
IndiaMART P/E (1-yr fwd) Trend
Source: Company, HSIE Research, Bloomberg
IndiaMART EV/EBITDA (1-yr fwd) Trend
Source: Company, HSIE Research, Bloomberg
-
2,000
4,000
6,000
8,000
10,000
12,000
0
10
20
30
40
50
60
70
80
90
100
Sep
-19
Oct
-19
Oct
-19
No
v-1
9
Dec
-19
Dec
-19
Jan
-20
Feb
-20
Ma
r-2
0
Ma
r-2
0
Ap
r-2
0
Ma
y-2
0
Ma
y-2
0
Jun
-20
Jul-
20
Jul-
20
Au
g-2
0
Sep
-20
Sep
-20
Oct
-20
No
v-2
0
No
v-2
0
Dec
-20
Jan
-21
Jan
-21
Feb
-21
Ma
r-2
1
Ap
r-2
1
(Rs)(P/E)
P/E (1-yr fwd) AVG P/E (x) Price
0
20
40
60
80
Sep
-19
Oct
-19
Oct
-19
No
v-1
9
Dec
-19
Dec
-19
Jan
-20
Feb
-20
Ma
r-2
0
Ma
r-2
0
Ap
r-2
0
Ma
y-2
0
Ma
y-2
0
Jun
-20
Jul-
20
Jul-
20
Au
g-2
0
Sep
-20
Sep
-20
Oct
-20
No
v-2
0
No
v-2
0
Dec
-20
Jan
-21
Jan
-21
Feb
-21
Ma
r-2
1
Ap
r-2
1
EV/EBITDA (1-yr fwd) 5 Yr Mean 1SD + 1SD - 2SD + 2SD -

Page | 33
IndiaMART InterMESH Ltd : Initiating Coverage
Financials Consolidated Income Statement
Year ending March (INR mn) FY17 FY18 FY19 FY20 FY21E FY22E FY23E FY24E
Net Revenues 3,178 4,105 5,074 6,389 6,679 8,161 9,914 11,969
Growth (%) 29.3% 29.2% 23.6% 25.9% 4.6% 22.2% 21.5% 20.7%
Manpower Expense 2,097 1,949 2,300 2,667 2,040 2,438 2,831 3,272
Outsourced sales cost 271 442 576 724 515 735 989 1,217
Other Expense 1,354 1,249 1,375 1,308 885 1,306 1,586 2,035
EBITDA (544) 466 823 1,689 3,240 3,683 4,508 5,444
EBITDA Margin (%) -17.1% 11.4% 16.2% 26.4% 48.5% 45.1% 45.5% 45.5%
Depreciation 46 29 41 211 226 236 249 278
EBIT (590) 437 782 1,478 3,014 3,447 4,259 5,166
EBIT Margin (%) -18.6% 10.7% 15.4% 23.1% 45.1% 42.2% 43.0% 43.2%
EBIT Growth (%) NM NM 78.8% 88.9% 104.0% 14.4% 23.6% 21.3%
Other Income (Including EO Items) (51) (1,038) (243) 670 961 981 997 778
Interest - - - 33 68 64 64 64
PBT (641) (601) 539 2,114 3,907 4,364 5,192 5,880
Tax (Including Deferred) 2 (1,149) 339 640 975 1,091 1,298 1,464
Minority/Share of Associates 0 0 - - - - - -
RPAT (644) 547 200 1,474 2,932 3,273 3,894 4,415
EO (Loss) / Profit (Net Of Tax) (193) (1,229) (653) - - - - -
APAT (451) 1,776 853 1,474 2,932 3,273 3,894 4,415
APAT Growth (%) NM NM -52.0% 72.8% 98.9% 11.6% 19.0% 13.4%
Adjusted EPS (INR) (14.8) 58.5 28.1 48.5 96.6 107.8 128.3 145.4
EPS Growth (%) NM NM -52.0% 72.8% 98.9% 11.6% 19.0% 13.4%
Source: Company, HSIE Research
Consolidated Balance Sheet
YE March (INR mn) FY17 FY18 FY19 FY20 FY21E FY22E FY23E FY24E
SOURCES OF FUNDS
Share Capital - Equity 92 100 286 289 303 303 303 303
Reserves -3,992 -3,312 1,313 2,462 15,497 18,115 21,230 24,763
Total Shareholders Funds -3,900 -3,213 1,599 2,751 15,800 18,418 21,534 25,066
Minority Interest 0 0 0 0 0 0 0 0
Total Debt 0 0 0 0 0 0 0 0
Net Deferred Taxes 0 -1,156 -858 -246 117 117 117 117
Other Non-current Liabilities & Provns 2,484 3,791 99 878 875 948 1,034 1,135
TOTAL SOURCES OF FUNDS -1,417 -577 840 3,383 16,792 19,483 22,685 26,319
APPLICATION OF FUNDS
Net Block 87 81 91 856 824 825 863 931
CWIP 2 2 2 2 2 2 2 2
Goodwill 0 0 0 0 0 0 0 0
Investments 0 0 0 296 286 286 286 286
Other Non-current Assets 53 345 44 630 274 278 291 307
Total Non-current Assets 142 428 137 1,784 1,386 1,390 1,442 1,526
Cash & Equivalents 1,769 3,578 6,852 8,957 22,443 26,736 31,735 37,450
Debtors 5 7 6 17 18 21 26 32
Other Current Assets 292 259 355 225 185 208 236 269
Total Current Assets 2,067 3,844 7,213 9,200 22,646 26,966 31,997 37,751
Creditors 302 419 450 179 165 335 407 492
Other Current Liabilities & Provns* 3,323 4,429 6,060 7,421 7,075 8,537 10,346 12,466
Total Current Liabilities 3,626 4,848 6,510 7,601 7,240 8,873 10,754 12,958
Net Current Assets -1,559 -1,004 703 1,599 15,406 18,093 21,243 24,793
TOTAL APPLICATION OF FUNDS -1,417 -577 840 3,383 16,792 19,483 22,685 26,319
Source: Company, HSIE Research, * includes non-current part of contract liabilities

Page | 34
IndiaMART InterMESH Ltd : Initiating Coverage
Consolidated Cash Flow
YE March (INR mn) FY17 FY18 FY19 FY20 FY21E FY22E FY23E FY24E
Reported PBT (641) (601) 539 2,114 3,907 4,364 5,192 5,880
Non-operating & EO Items 79 1,080 342 (589) (961) (981) (997) (778)
Interest Expenses 0 0 0 33 68 64 64 64
Depreciation 43 24 38 211 226 236 249 278
Working Capital Change 526 1,297 1,684 1,023 261 1,511 1,723 2,012
Tax Paid (12) (10) (52) (186) (975) (1,091) (1,298) (1,464)
OPERATING CASH FLOW ( a ) (6) 1,791 2,551 2,606 2,526 4,103 4,933 5,993
Capex (27) (22) (51) (45) (50) (73) (89) (108)
Free Cash Flow (FCF) (33) 1,769 2,500 2,561 2,476 4,030 4,844 5,885
Non-operating Income (94) (44) (116) (276) 961 981 997 778
INVESTING CASH FLOW ( b ) (121) (66) (167) (321) 911 908 908 670
Debt Issuance/(Repaid) 0 0 (3) (166) 0 0 0 0
Interest Expenses 0 0 0 (33) (68) (64) (64) (64)
FCFE (33) 1,769 2,498 2,362 2,408 3,966 4,780 5,821
Share Capital Issuance\QIP 73 152 144 19 10,704* 0 0 0
Dividend 0 0 0 (333) (586) (655) (779) (883)
FINANCING CASH FLOW ( c ) 73 152 141 (513) 10,049 (719) (843) (947)
NET CASH FLOW (a+b+c) (54) 1,877 2,525 1,772 13,486 4,293 4,999 5,716
EO Items, Others (349) 68 (749) (334) 0 0 0 0
Closing Cash & Equivalents 1,769 3,578 6,852 8,957 22,443 26,736 31,735 37,450
Source: Company, HSIE Research, *QIP
Key Ratios FY17 FY18 FY19 FY20 FY21E FY22E FY23E FY24E
PROFITABILITY (%)
EBIT Margin -18.6 10.7 15.4 23.1 45.1 42.2 43.0 43.2
APAT Margin -14.2 43.3 16.8 23.1 43.9 40.1 39.3 36.9
RoE* NM NM 53.4 67.8 57.5 51.1 42.0 35.1
RoIC (or Core RoCE) NM NM NM NM NM NM NM NM
RoCE* 36.4 NM 101.6 70.9 49.0 44.7 38.0 32.3
EFFICIENCY
Tax Rate (%) -0.3 191.1 62.8 30.3 25.0 25.0 25.0 24.9
Fixed Asset Turnover (x) 36.5 50.9 56.0 7.5 8.1 9.9 11.5 12.9
Debtors (days) 1 1 0 1 1 1 1 1
Other Current Assets (days) 34 23 26 13 10 9 9 8
Payables (days) 35 37 32 10 9 15 15 15
Other Current Liab & Provns (days) 382 394 436 424 387 382 381 380
Cash Conversion Cycle (days) -382 -407 -442 -420 -385 -387 -386 -386
Debt/EBITDA (x) 0.0 0.0 0.0 0.0 0.0 0.0 0.0 0.0
Net D/E (x) 0.5 1.1 -4.3 -3.3 -1.4 -1.5 -1.5 -1.5
Interest Coverage (x) NA NA NA NA NA NA NA NA
PER SHARE DATA (INR)
EPS -14.8 58.5 28.1 48.5 96.6 107.8 128.3 145.4
CEPS -44.1 59.4 29.5 55.5 104.0 115.6 136.5 154.6
Dividend 0.0 0.0 0.0 10 19 22 26 29
Book Value -425 -106 53 91 520 607 709 826
VALUATION
P/E (x) NM 134.8 280.7 162.4 81.7 73.1 61.5 54.2
P/BV (x) NM NM 149.7 87.0 15.2 13.0 11.1 9.6
EV/EBITDA (x) NM 505.8 282.4 136.5 67.0 57.8 46.1 37.1
EV/Revenues (x) 74.8 57.5 45.8 36.1 32.5 26.1 20.9 16.9
OCF/EV (%) 0.0 0.8 1.1 1.1 1.2 1.9 2.4 3.0
FCF/EV (%) 0.0 0.7 1.1 1.1 1.1 1.9 2.3 2.9
FCFE/Mkt Cap (%) 0.0 0.7 1.0 1.0 1.0 1.7 2.0 2.4
Dividend Yield (%) 0.0 0.0 0.0 0.1 0.2 0.3 0.3 0.4
Source: Company, HSIE Research, * RoE and RoCE for FY21-24E excludes QIP money, RoIC NM due to negative capital employed ex cash

Page | 35
IndiaMART InterMESH Ltd : Initiating Coverage
Rating Criteria
BUY: >+15% return potential
ADD: +5% to +15% return potential
REDUCE: -10% to +5% return potential
SELL: > 10% Downside return potential
RECOMMENDATION HISTORY
1,400
3,400
5,400
7,400
9,400
Ap
r-2
0
Ma
y-2
0
Jun
-20
Jul-
20
Au
g-2
0
Sep
-20
Oct
-20
No
v-2
0
Dec
-20
Jan
-21
Feb
-21
Ma
r-2
1
Ap
r-2
1
Indiamart TPDate CMP Reco Target
13-Apr-21 7,885 BUY 9,400

Page | 36
IndiaMART InterMESH Ltd : Initiating Coverage
Disclosure:
We, Amit Chandra, MBA, Apurva Prasad, MBA, & Mohit Motwani, MBA authors and the names subscribed to this report, hereby certify that all of the views
expressed in this research report accurately reflect our views about the subject issuer(s) or securities. HSL has no material adverse disciplinary history as on the
date of publication of this report. We also certify that no part of our compensation was, is, or will be directly or indirectly related to the specific
recommendation(s) or view(s) in this report.
Research Analyst or his/her relative or HDFC Securities Ltd. does not have any financial interest in the subject company. Also Research Analyst or his relative
or HDFC Securities Ltd. or its Associate may have beneficial ownership of 1% or more in the subject company at the end of the month immediately preceding
the date of publication of the Research Report. Further Research Analyst or his relative or HDFC Securities Ltd. or its associate does not have any material
conflict of interest.
Any holding in stock –No
HDFC Securities Limited (HSL) is a SEBI Registered Research Analyst having registration no. INH000002475.
Disclaimer:
This report has been prepared by HDFC Securities Ltd and is solely for information of the recipient only. The report must not be used as a singular basis of any
investment decision. The views herein are of a general nature and do not consider the risk appetite or the particular circumstances of an individual investor;
readers are requested to take professional advice before investing. Nothing in this document should be construed as investment advice. Each recipient of this
document should make such investigations as they deem necessary to arrive at an independent evaluation of an investment in securities of the companies
referred to in this document (including merits and risks) and should consult their own advisors to determine merits and risks of such investment. The
information and opinions contained herein have been compiled or arrived at, based upon information obtained in good faith from sources believed to be
reliable. Such information has not been independently verified and no guaranty, representation of warranty, express or implied, is made as to its accuracy,
completeness or correctness. All such information and opinions are subject to change without notice. Descriptions of any company or companies or their
securities mentioned herein are not intended to be complete. HSL is not obliged to update this report for such changes. HSL has the right to make changes and
modifications at any time.
This report is not directed to, or intended for display, downloading, printing, reproducing or for distribution to or use by, any person or entity who is a citizen
or resident or located in any locality, state, country or other jurisdiction where such distribution, publication, reproduction, availability or use would be
contrary to law or regulation or what would subject HSL or its affiliates to any registration or licensing requirement within such jurisdiction.
If this report is inadvertently sent or has reached any person in such country, especially, United States of America, the same should be ignored and brought to
the attention of the sender. This document may not be reproduced, distributed or published in whole or in part, directly or indirectly, for any purposes or in
any manner.
Foreign currencies denominated securities, wherever mentioned, are subject to exchange rate fluctuations, which could have an adverse effect on their value or
price, or the income derived from them. In addition, investors in securities such as ADRs, the values of which are influenced by foreign currencies effectively
assume currency risk. It should not be considered to be taken as an offer to sell or a solicitation to buy any security.
This document is not, and should not, be construed as an offer or solicitation of an offer, to buy or sell any securities or other financial instruments. This report
should not be construed as an invitation or solicitation to do business with HSL. HSL may from time to time solicit from, or perform broking, or other services
for, any company mentioned in this mail and/or its attachments.
HSL and its affiliated company(ies), their directors and employees may; (a) from time to time, have a long or short position in, and buy or sell the securities of
the company(ies) mentioned herein or (b) be engaged in any other transaction involving such securities and earn brokerage or other compensation or act as a
market maker in the financial instruments of the company(ies) discussed herein or act as an advisor or lender/borrower to such company(ies) or may have any
other potential conflict of interests with respect to any recommendation and other related information and opinions.
HSL, its directors, analysts or employees do not take any responsibility, financial or otherwise, of the losses or the damages sustained due to the investments
made or any action taken on basis of this report, including but not restricted to, fluctuation in the prices of shares and bonds, changes in the currency rates,
diminution in the NAVs, reduction in the dividend or income, etc.
HSL and other group companies, its directors, associates, employees may have various positions in any of the stocks, securities and financial instruments dealt
in the report, or may make sell or purchase or other deals in these securities from time to time or may deal in other securities of the companies / organizations
described in this report.
HSL or its associates might have managed or co-managed public offering of securities for the subject company or might have been mandated by the subject
company for any other assignment in the past twelve months.
HSL or its associates might have received any compensation from the companies mentioned in the report during the period preceding twelve months from the
date of this report for services in respect of managing or co-managing public offerings, corporate finance, investment banking or merchant banking, brokerage
services or other advisory service in a merger or specific transaction in the normal course of business.
HSL or its analysts did not receive any compensation or other benefits from the companies mentioned in the report or third party in connection with
preparation of the research report. Accordingly, neither HSL nor Research Analysts have any material conflict of interest at the time of publication of this
report. Compensation of our Research Analysts is not based on any specific merchant banking, investment banking or brokerage service transactions. HSL may
have issued other reports that are inconsistent with and reach different conclusion from the information presented in this report.
Research entity has not been engaged in market making activity for the subject company. Research analyst has not served as an officer, director or employee of
the subject company. We have not received any compensation/benefits from the subject company or third party in connection with the Research Report.
HDFC securities Limited, I Think Techno Campus, Building - B, "Alpha", Office Floor 8, Near Kanjurmarg Station, Opp. Crompton Greaves, Kanjurmarg
(East), Mumbai 400 042 Phone: (022) 3075 3400 Fax: (022) 2496 5066 Compliance Officer: Binkle R. Oza Email: [email protected] Phone: (022)
3045 3600
HDFC Securities Limited, SEBI Reg. No.: NSE, BSE, MSEI, MCX: INZ000186937; AMFI Reg. No. ARN: 13549; PFRDA Reg. No. POP: 11092018; IRDA
Corporate Agent License No.: CA0062; SEBI Research Analyst Reg. No.: INH000002475; SEBI Investment Adviser Reg. No.: INA000011538; CIN -
U67120MH2000PLC152193
HDFC securities
Institutional Equities
Unit No. 1602, 16th Floor, Tower A, Peninsula Business Park,
Senapati Bapat Marg, Lower Parel, Mumbai - 400 013
Board: +91-22-6171-7330 www.hdfcsec.com